Embed Size (px)
Citation preview
Combustion in a Global Environmental Context
Part Two: Stabilization Wedges
Robert Socolow Princeton University
2012 Princeton-CEFRC Summer School on Combustion Princeton University
Princeton, New Jersey June 25, 2012
Part Two: Stabilization Wedges
The Wedge Model
The Abundance of Fossil Fuels
Specific Stabilization Wedges Decentralized energy conversion
Centralized energy conversion
Billions of tons of carbon
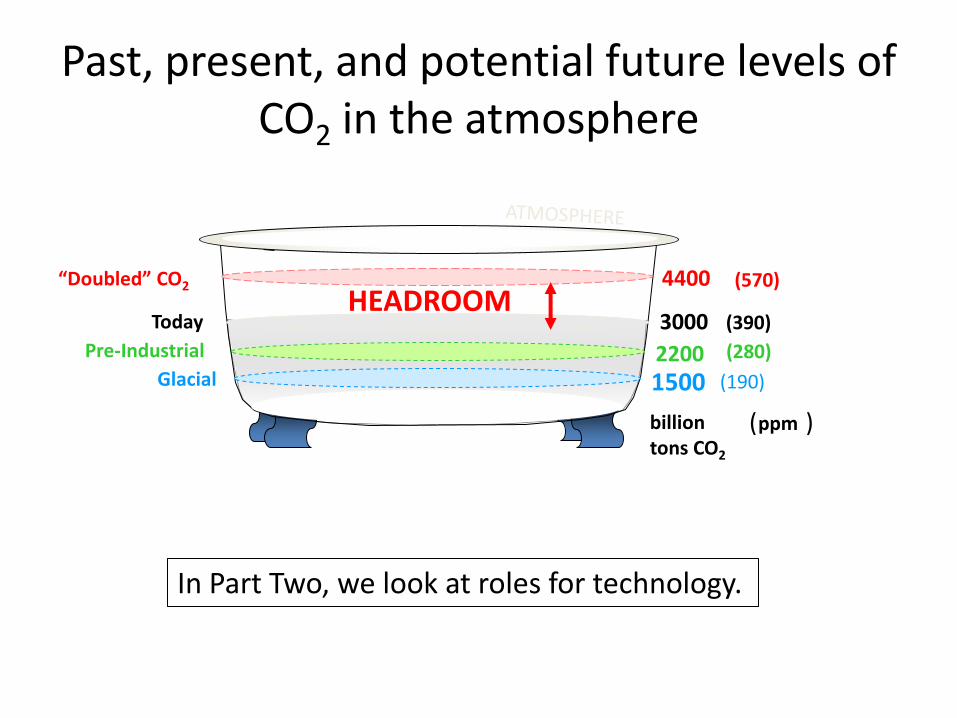
“Doubled” CO2
Today
Pre-Industrial
Glacial
3000
4400
2200 1500
billion tons CO2
( )
(570)
(390)
Past, present, and potential future levels of CO2 in the atmosphere
(280)
(190)
ppm
HEADROOM
In Part Two, we look at roles for technology.
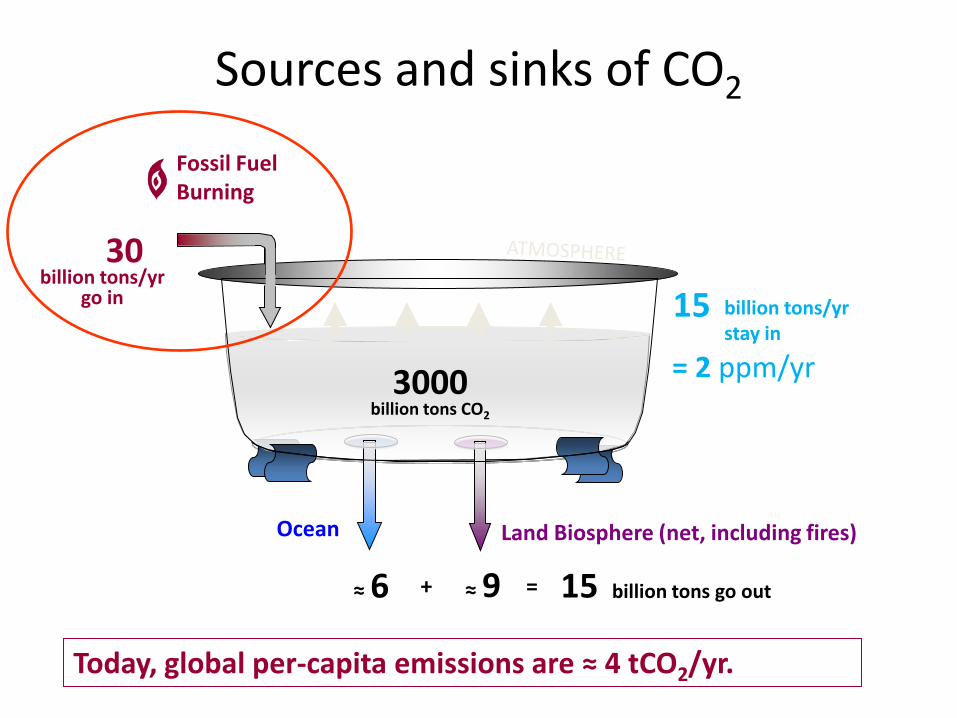
≈ 6 ≈ 9 = 15 billion tons go out
Ocean Land Biosphere (net, including fires)
Fossil Fuel Burning
+
30
3000 billion tons CO2
15 billion tons/yr
go in billion tons/yr stay in
Sources and sinks of CO2
Today, global per-capita emissions are ≈ 4 tCO2/yr.
= 2 ppm/yr
The Wedge Model
Co-author: Steve Pacala
Articles: Science (2004) Scientific American (2006)

Historical emissions
0
30
60
1950 2000 2050 2100
Historical Emissions
6
Billions of tons of CO2 emitted per year
6
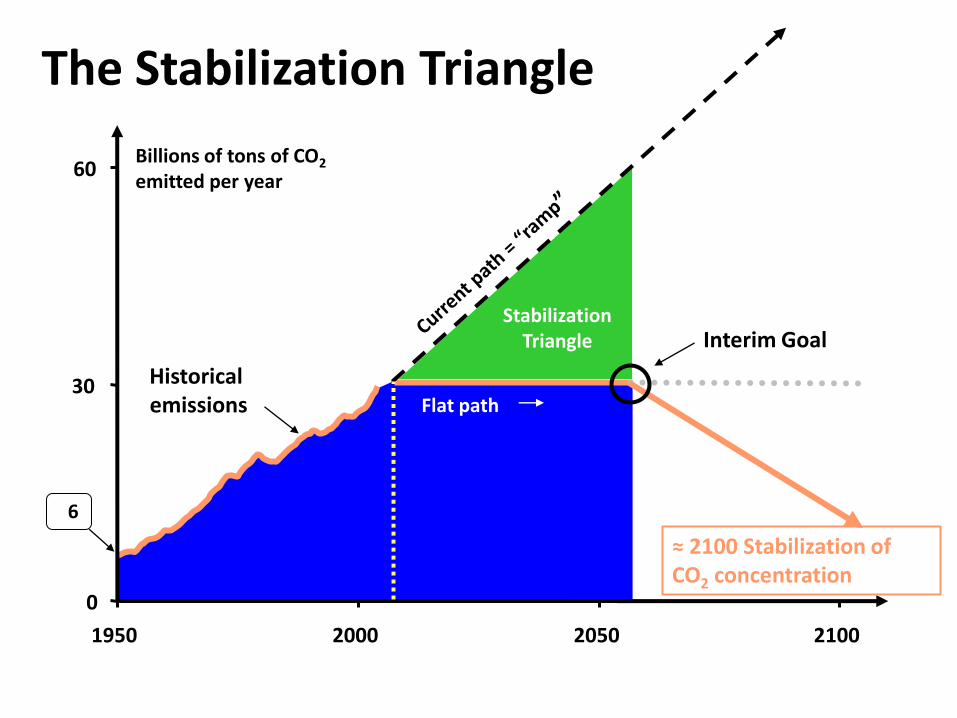
Interim Goal
Historical emissions Flat path
Stabilization Triangle
0
30
60
1950 2000 2050 2100
The Stabilization Triangle
Billions of tons of CO2 emitted per year
≈ 2100 Stabilization of CO2 concentration
6
Billions of tons of CO2 emitted per year
Flat path
0
30
60
1950 2000 2050 2100
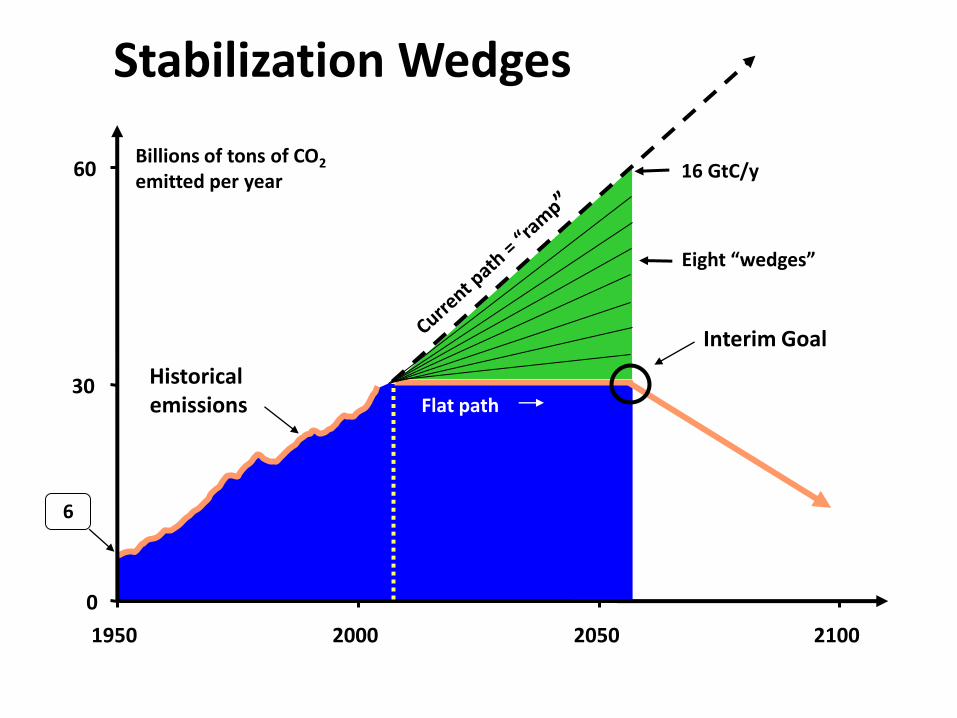
Stabilization Wedges
16 GtC/y
Eight “wedges”
Historical emissions
Interim Goal
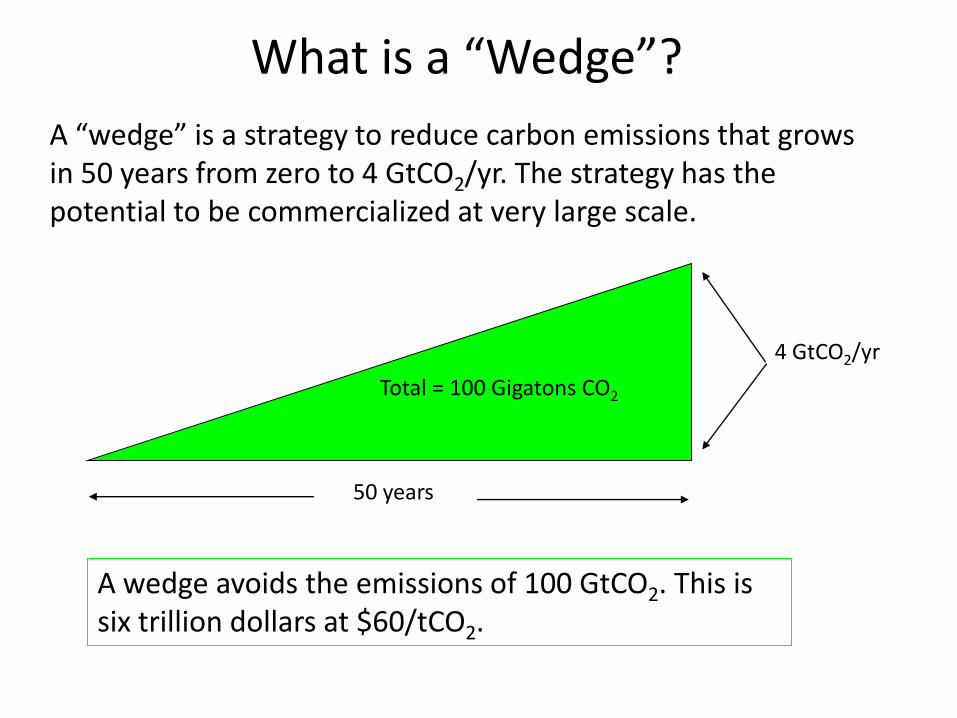
What is a “Wedge”?
A “wedge” is a strategy to reduce carbon emissions that grows in 50 years from zero to 4 GtCO2/yr. The strategy has the potential to be commercialized at very large scale.
4 GtCO2/yr
50 years
Total = 100 Gigatons CO2
A wedge avoids the emissions of 100 GtCO2. This is six trillion dollars at $60/tCO2.

Energy Efficiency
Decarbonized Electricity
Fuel Displacement by Low-Carbon Electricity
Extra Carbon in Forests, Soils, Oceans
Decarbonized Fuels
2007 2057
30 GtCO2/yr
60 GtCO2/yr
Methane Management
Triangle Stabilization
Fill the Stabilization Triangle with Wedges in six broad categories
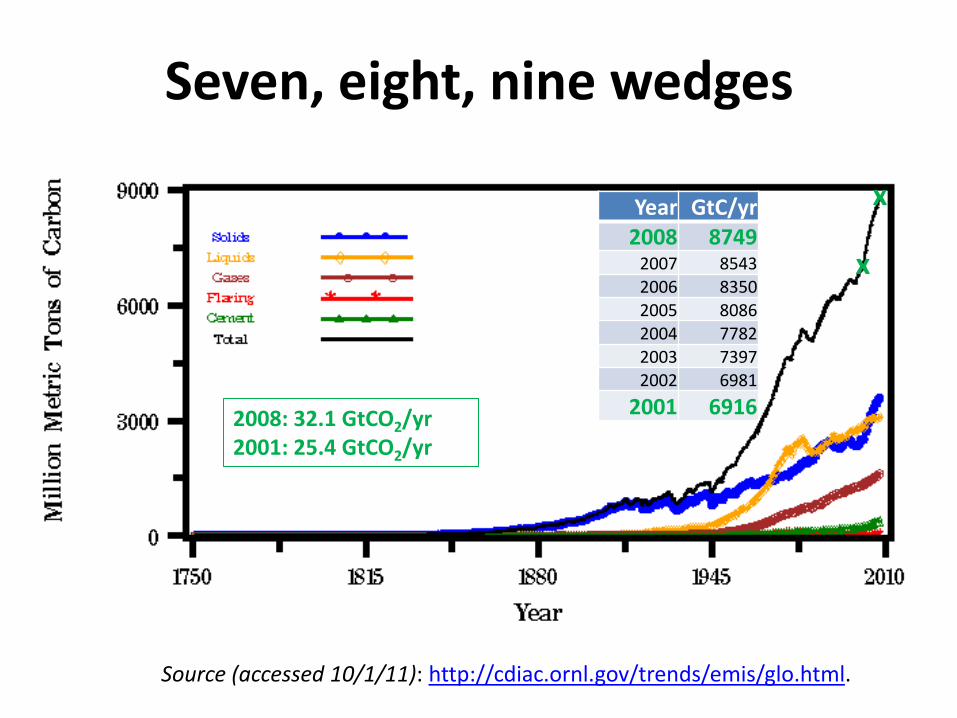
Seven, eight, nine wedges
Source (accessed 10/1/11): http://cdiac.ornl.gov/trends/emis/glo.html.
Year GtC/yr 2008 8749
2007 8543 2006 8350
2005 8086 2004 7782
2003 7397 2002 6981
2001 6916
x
x
2008: 32.1 GtCO2/yr 2001: 25.4 GtCO2/yr
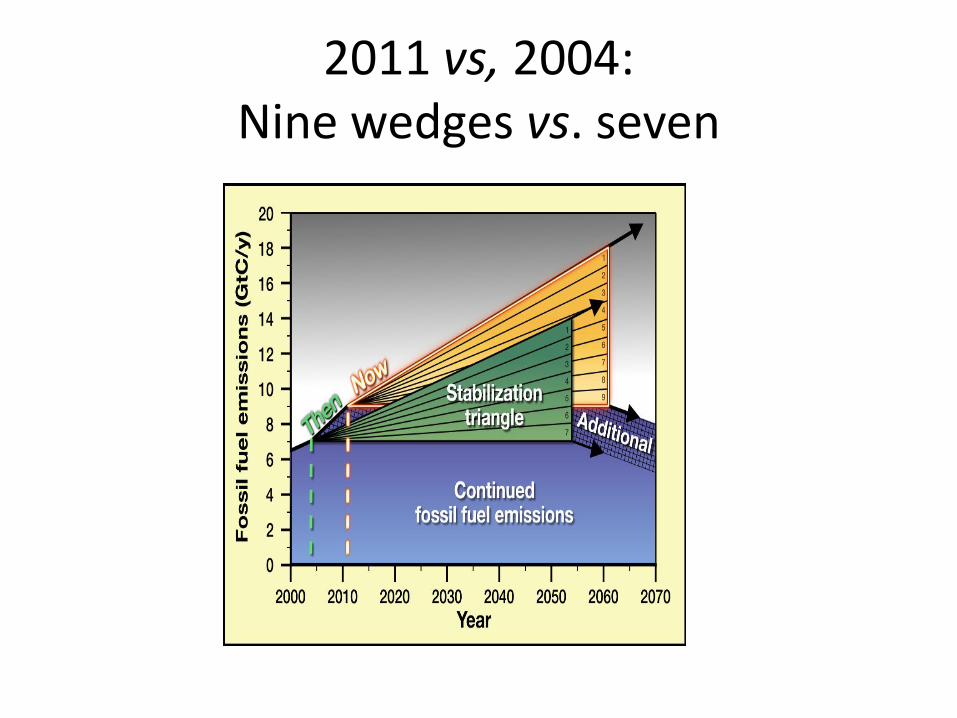
2011 vs, 2004: Nine wedges vs. seven
0
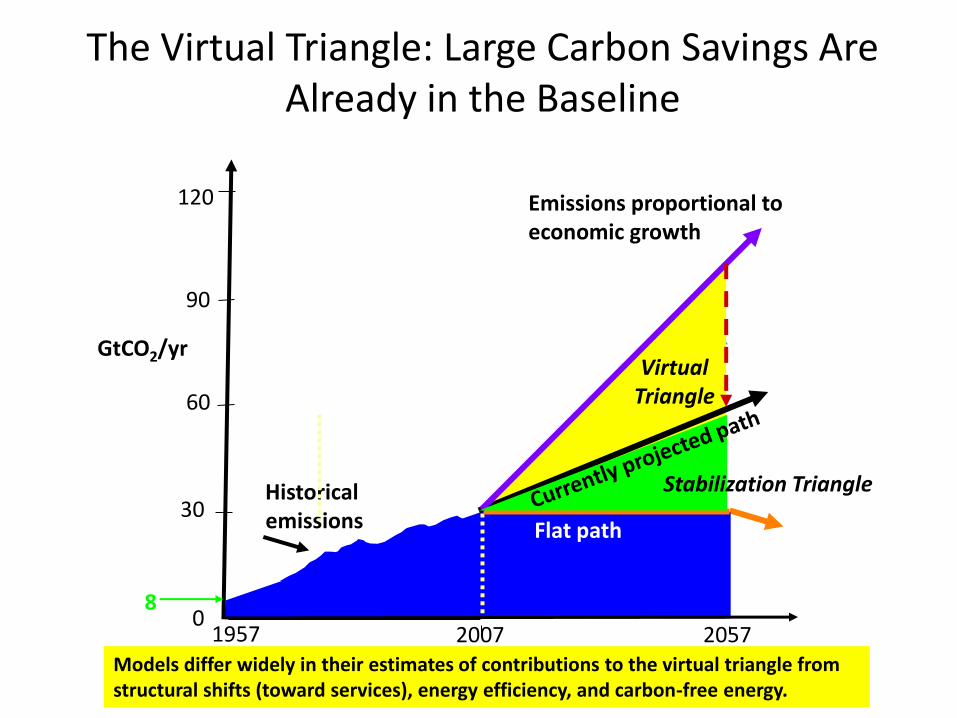
Historical emissions
Emissions proportional to economic growth
2057 2007 1957
60
30
8
120
90
Stabilization Triangle
Flat path
Virtual Triangle
GtCO2/yr
The Virtual Triangle: Large Carbon Savings Are Already in the Baseline
Models differ widely in their estimates of contributions to the virtual triangle from structural shifts (toward services), energy efficiency, and carbon-free energy.
6
Billions of tons of CO2 emitted per year
Flat path
0
30
60
1950 2000 2050 2100
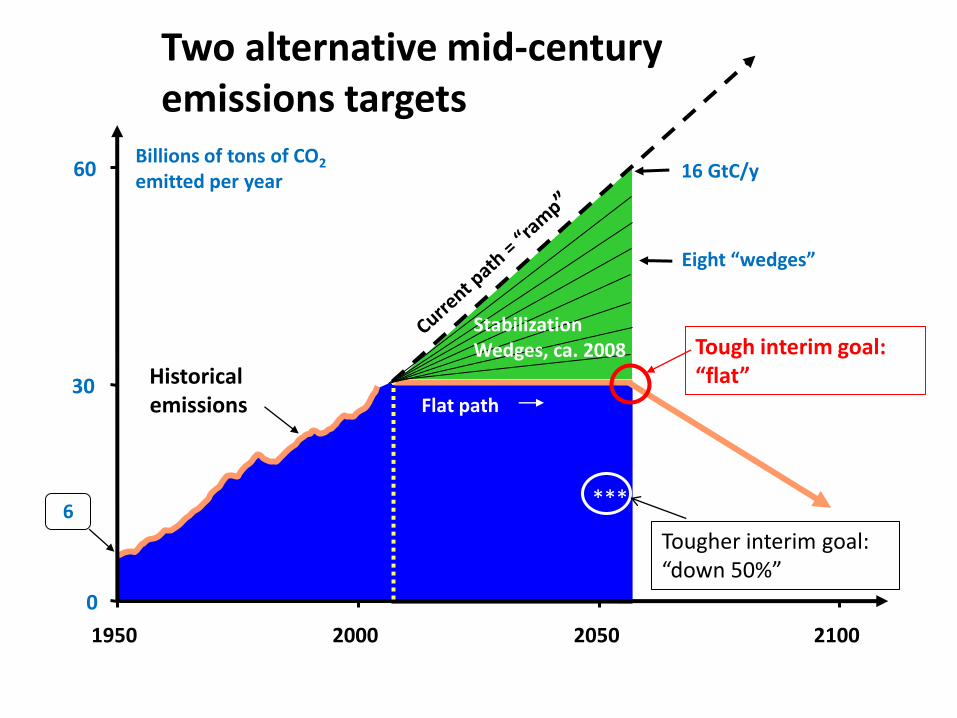
Two alternative mid-century emissions targets
16 GtC/y
Eight “wedges”
Historical emissions
Tough interim goal: “flat”
***
Tougher interim goal: “down 50%”
Stabilization Wedges, ca. 2008
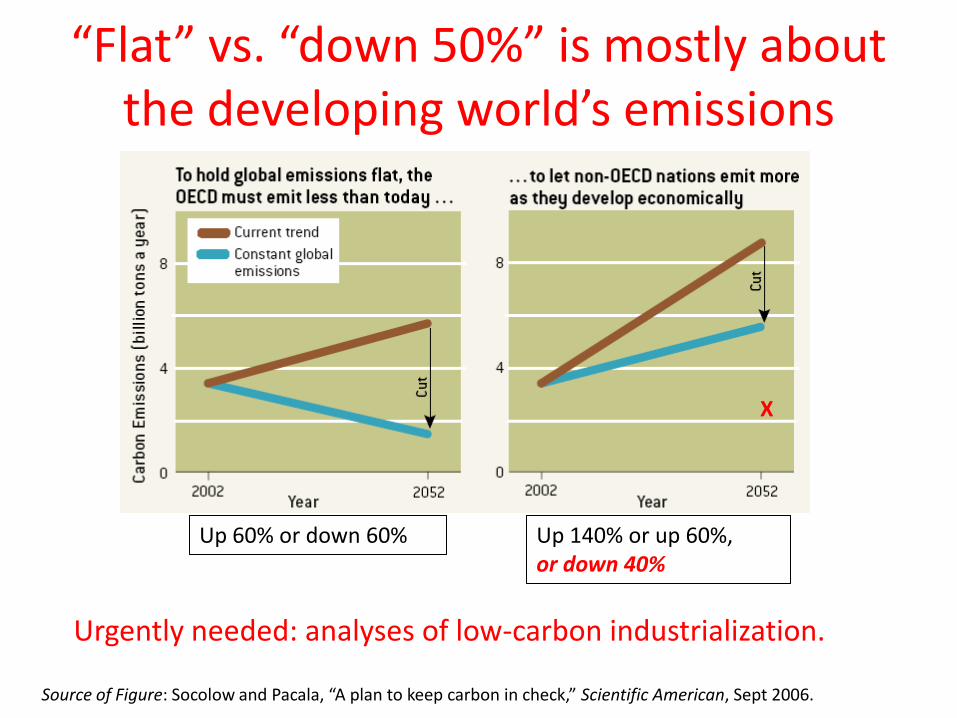
“Flat” vs. “down 50%” is mostly about the developing world’s emissions
Source of Figure: Socolow and Pacala, “A plan to keep carbon in check,” Scientific American, Sept 2006.
X
Up 60% or down 60% Up 140% or up 60%, or down 40%
Urgently needed: analyses of low-carbon industrialization.
The Abundance of Fossil Fuels
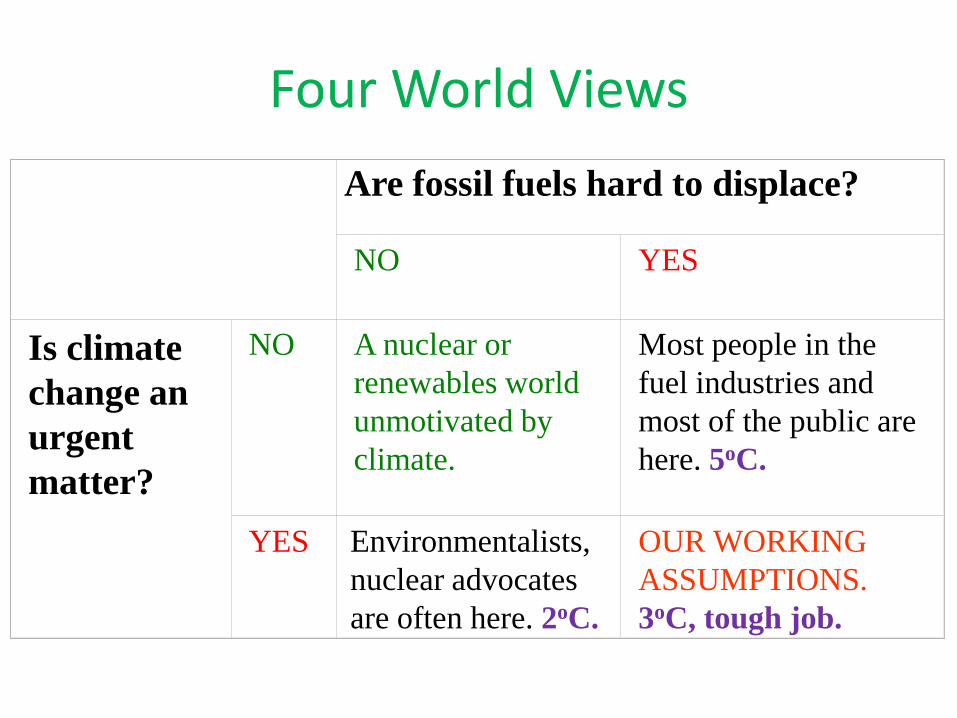
Four World Views
Are fossil fuels hard to displace?
NO
YES
Is climate
change an
urgent
matter?
NO
A nuclear or
renewables world
unmotivated by
climate.
Most people in the
fuel industries and
most of the public are
here. 5oC.
YES
Environmentalists,
nuclear advocates
are often here. 2oC.
OUR WORKING
ASSUMPTIONS.
3oC, tough job.
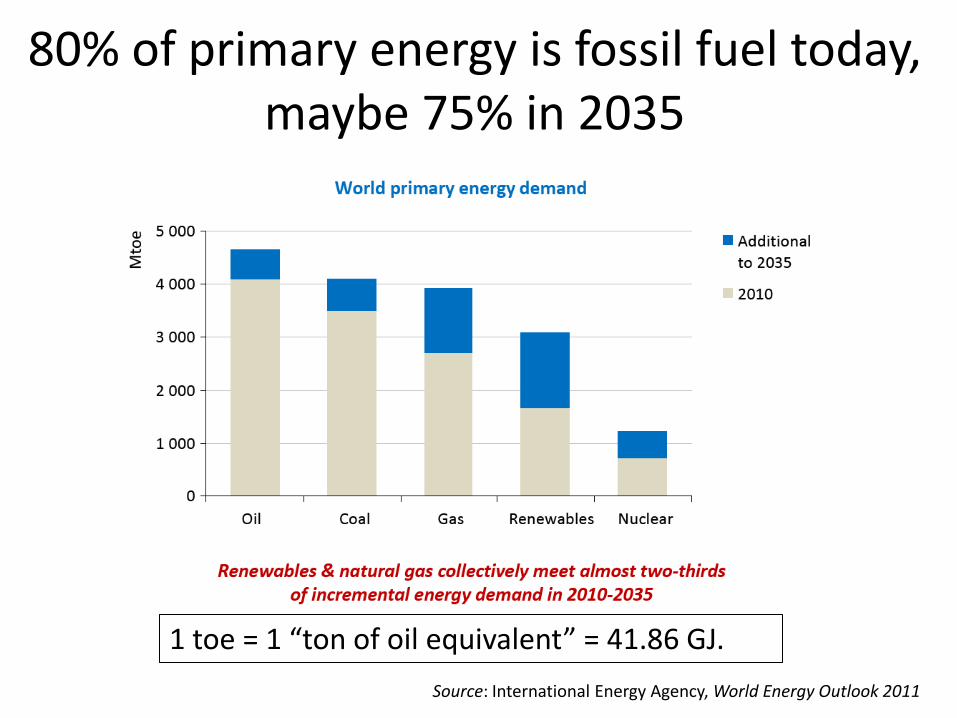
Source: International Energy Agency, World Energy Outlook 2011
1 toe = 1 “ton of oil equivalent” = 41.86 GJ.
80% of primary energy is fossil fuel today, maybe 75% in 2035
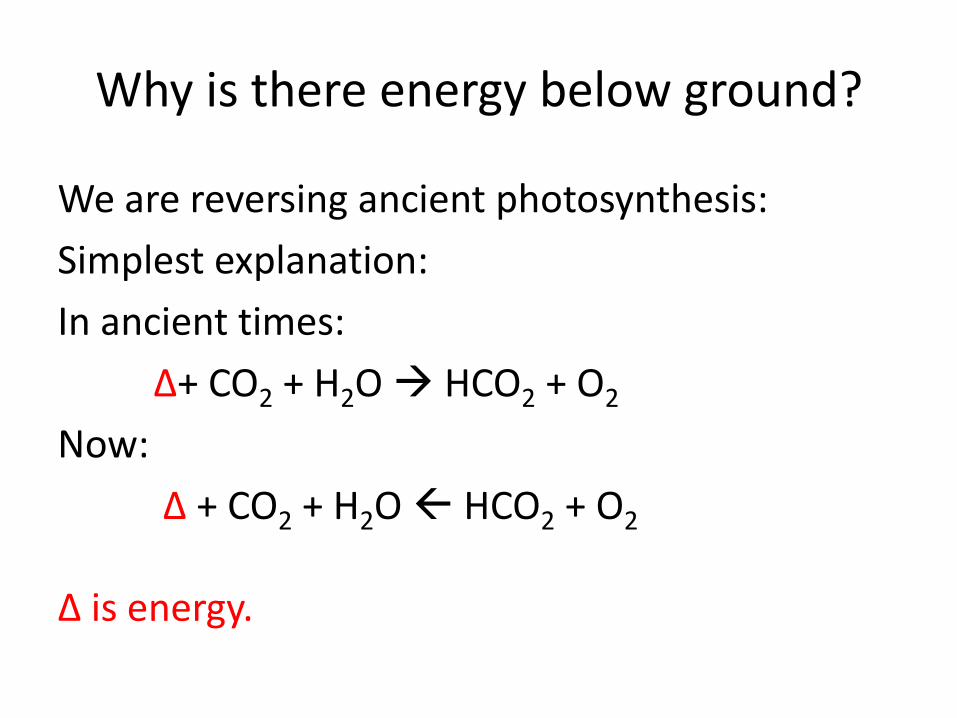
Why is there energy below ground?
We are reversing ancient photosynthesis:
Simplest explanation:
In ancient times:
Δ+ CO2 + H2O HCO2 + O2
Now:
Δ + CO2 + H2O HCO2 + O2
Δ is energy.
More accurately…
We mostly find hydrocarbons, so there were further changes:
CH2O CxHy.
Also, for liquids and gases, obstructed upward movement and concentration.
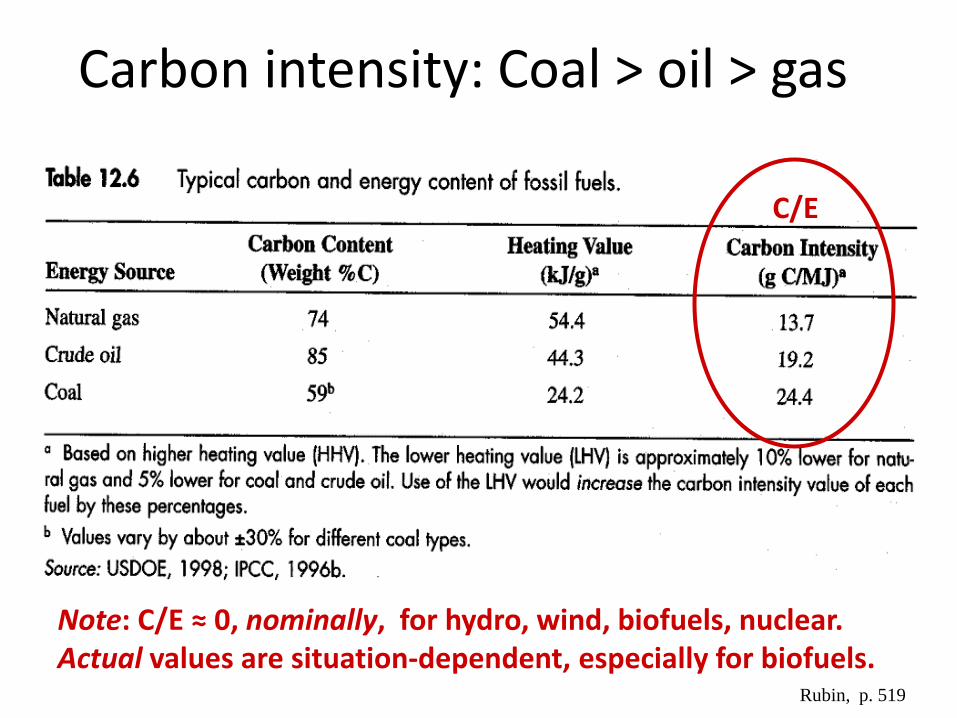
Carbon intensity: Coal > oil > gas
Rubin, p. 519
C/E
Note: C/E ≈ 0, nominally, for hydro, wind, biofuels, nuclear. Actual values are situation-dependent, especially for biofuels.

World oil production by source in the WEO 2008 Reference Scenario
Even if oil demand was to remain flat to 2030, 45 mb/d of gross capacity – roughly four times the capacity of Saudi Arabia – would be needed just to offset decline from existing oilfields
Source: International Energy Agency, World Energy Outlook 2008
0
20
40
60
80
100
120
1990 2000 2010 2020 2030
mb
/d
Natural gas liquids
Non-conventional oil
Crude oil - yet to be developed (inc. EOR) or found
Crude oil - currently producing fields
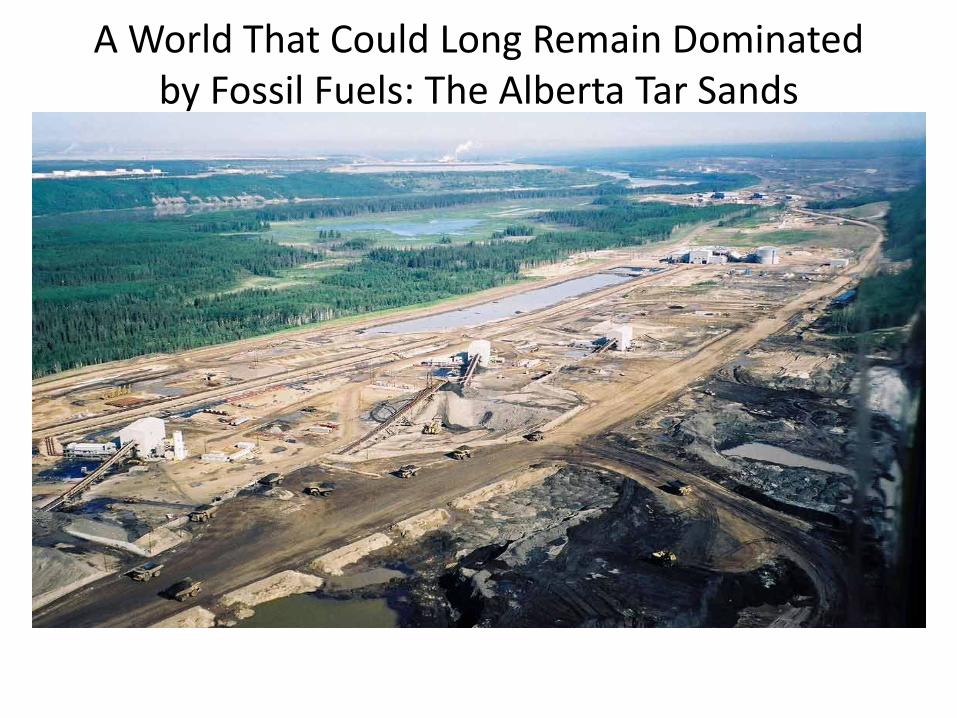
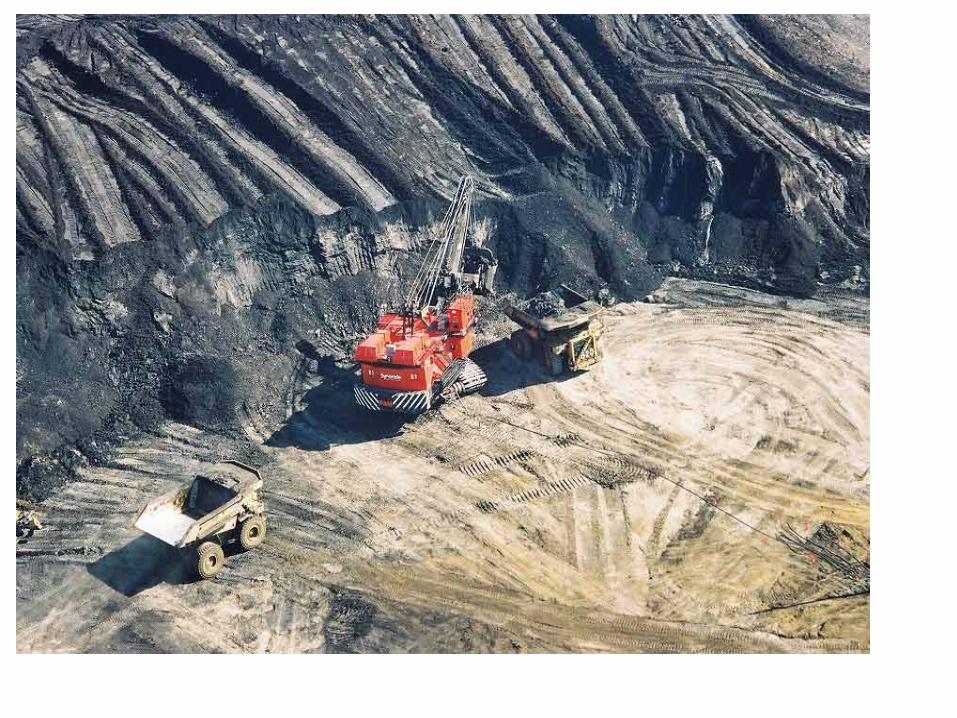
A World That Could Long Remain Dominated by Fossil Fuels: The Alberta Tar Sands
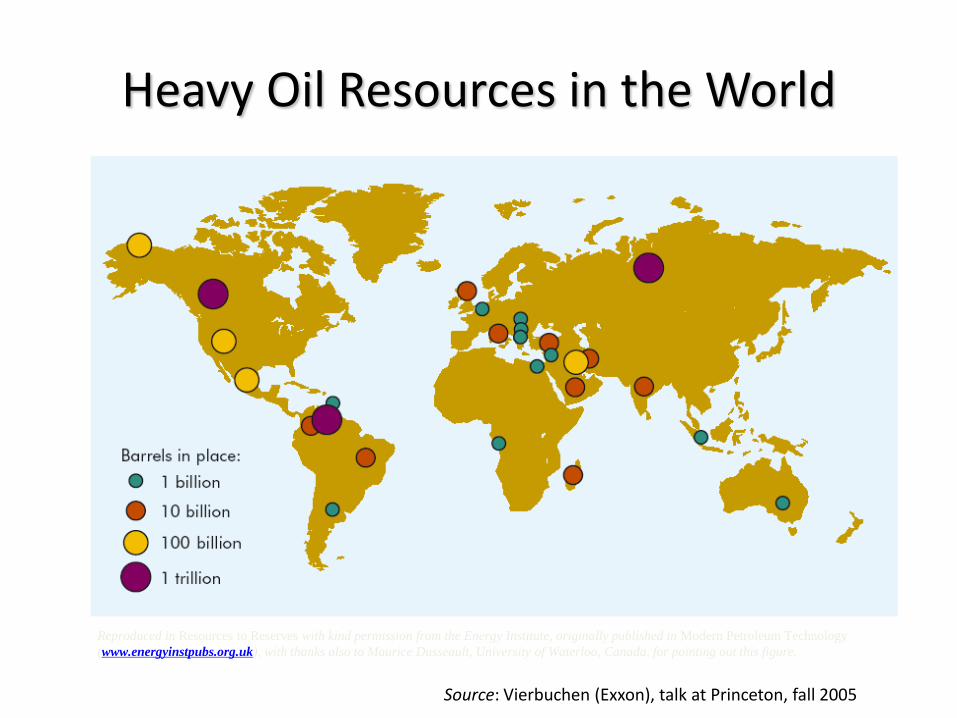
Heavy Oil Resources in the World
Reproduced in Resources to Reserves with kind permission from the Energy Institute, originally published in Modern Petroleum Technology
(www.energyinstpubs.org.uk), with thanks also to Maurice Dusseault, University of Waterloo, Canada, for pointing out this figure.
Source: Vierbuchen (Exxon), talk at Princeton, fall 2005
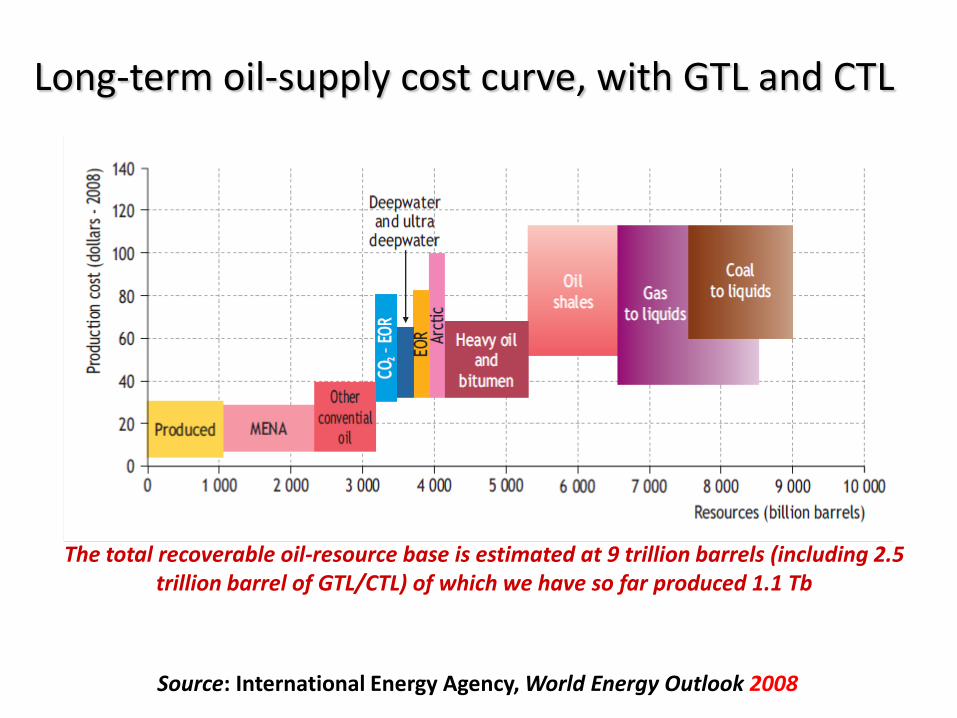
Long-term oil-supply cost curve, with GTL and CTL
The total recoverable oil-resource base is estimated at 9 trillion barrels (including 2.5 trillion barrel of GTL/CTL) of which we have so far produced 1.1 Tb
Source: International Energy Agency, World Energy Outlook 2008
Fossil Fuel Emissions
0
5
10
15
20
25
30
1750 1850 1950 2050 2150 2250 2350 2450 2550
Year
Em
iss
ion
s (
GtC
/yr)
"Data"
"Logistic Fit"
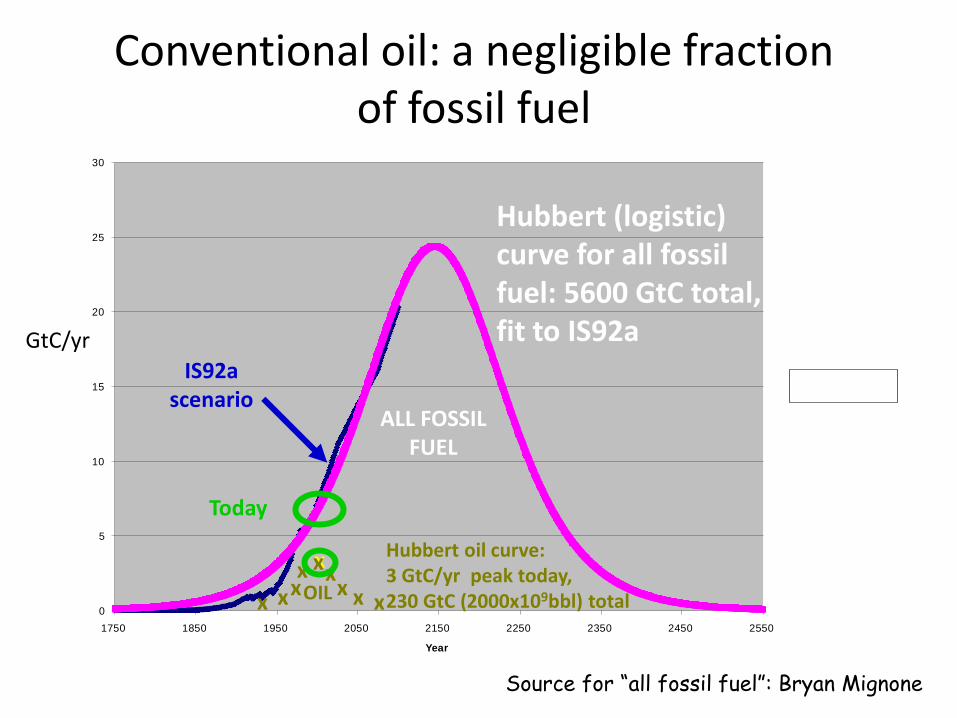
Conventional oil: a negligible fraction of fossil fuel
Source for “all fossil fuel”: Bryan Mignone
IS92a scenario
GtC/yr
Today
x x x
x x x x x x
Hubbert oil curve: 3 GtC/yr peak today, 230 GtC (2000x109bbl) total OIL
ALL FOSSIL FUEL
Hubbert (logistic) curve for all fossil fuel: 5600 GtC total, fit to IS92a
x
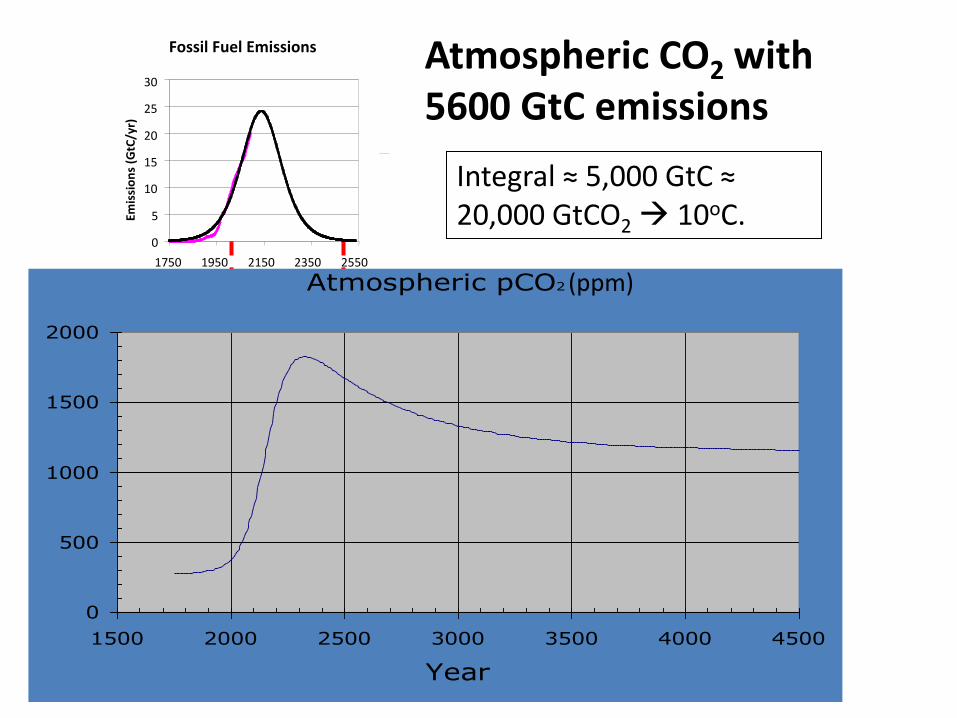
Atmospheric pCO2 vs Year
Atmospheric CO2 with 5600 GtC emissions
Fossil Fuel Emissions
0
5
10
15
20
25
30
1750 1950 2150 2350 2550
Emis
sio
ns
(GtC
/yr)
- 2
- 6
- 4
Multiple of pre-industrial
Integral ≈ 5,000 GtC ≈ 20,000 GtCO2 10oC.
Atmospheric pCO2
0
500
1000
1500
2000
1500 2000 2500 3000 3500 4000 4500
Year
(ppm)

Specific stabilization wedges
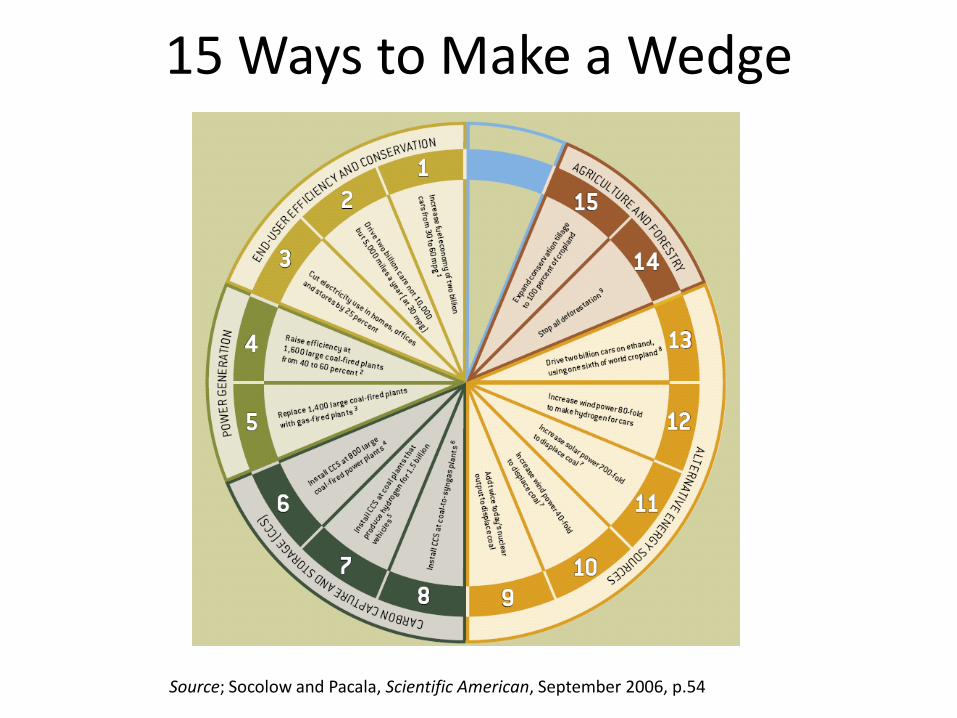
15 Ways to Make a Wedge
Source; Socolow and Pacala, Scientific American, September 2006, p.54
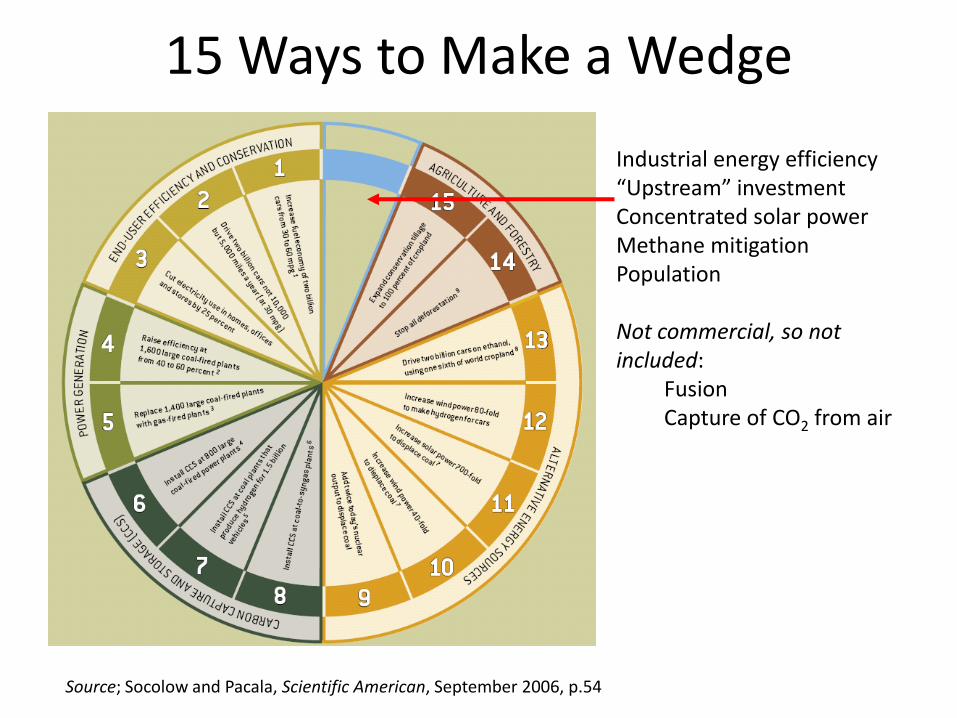
15 Ways to Make a Wedge
Source; Socolow and Pacala, Scientific American, September 2006, p.54
Industrial energy efficiency “Upstream” investment Concentrated solar power Methane mitigation Population Not commercial, so not included:
Fusion Capture of CO2 from air
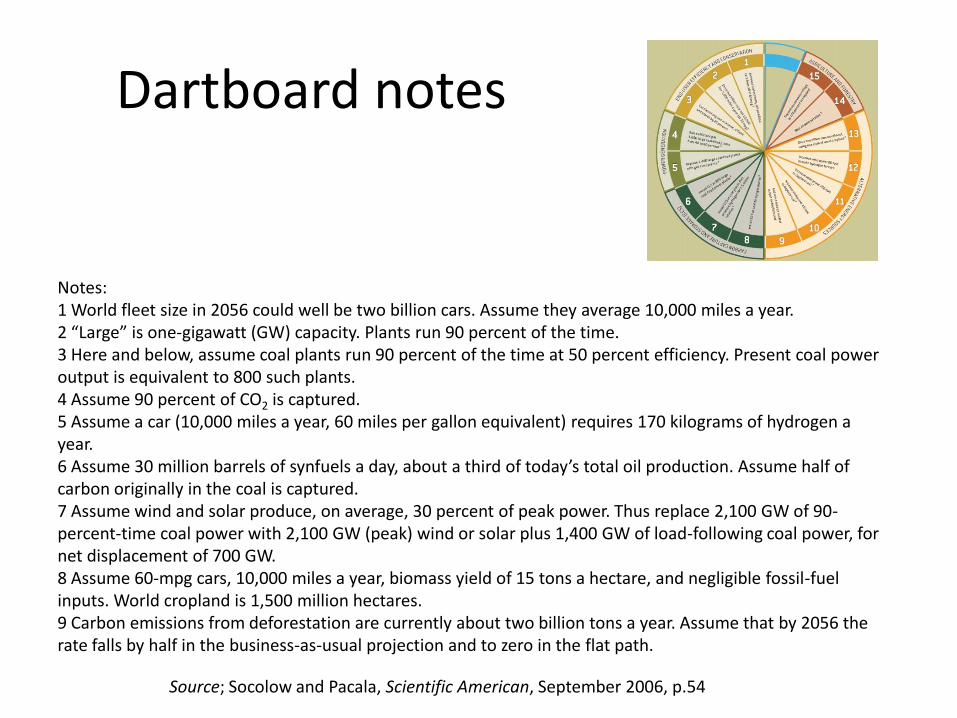
Dartboard notes
Notes: 1 World fleet size in 2056 could well be two billion cars. Assume they average 10,000 miles a year. 2 “Large” is one-gigawatt (GW) capacity. Plants run 90 percent of the time. 3 Here and below, assume coal plants run 90 percent of the time at 50 percent efficiency. Present coal power output is equivalent to 800 such plants. 4 Assume 90 percent of CO2 is captured. 5 Assume a car (10,000 miles a year, 60 miles per gallon equivalent) requires 170 kilograms of hydrogen a year. 6 Assume 30 million barrels of synfuels a day, about a third of today’s total oil production. Assume half of carbon originally in the coal is captured. 7 Assume wind and solar produce, on average, 30 percent of peak power. Thus replace 2,100 GW of 90-percent-time coal power with 2,100 GW (peak) wind or solar plus 1,400 GW of load-following coal power, for net displacement of 700 GW. 8 Assume 60-mpg cars, 10,000 miles a year, biomass yield of 15 tons a hectare, and negligible fossil-fuel inputs. World cropland is 1,500 million hectares. 9 Carbon emissions from deforestation are currently about two billion tons a year. Assume that by 2056 the rate falls by half in the business-as-usual projection and to zero in the flat path.
Source; Socolow and Pacala, Scientific American, September 2006, p.54
DECENTRALIZED ENERGY CONVERSION
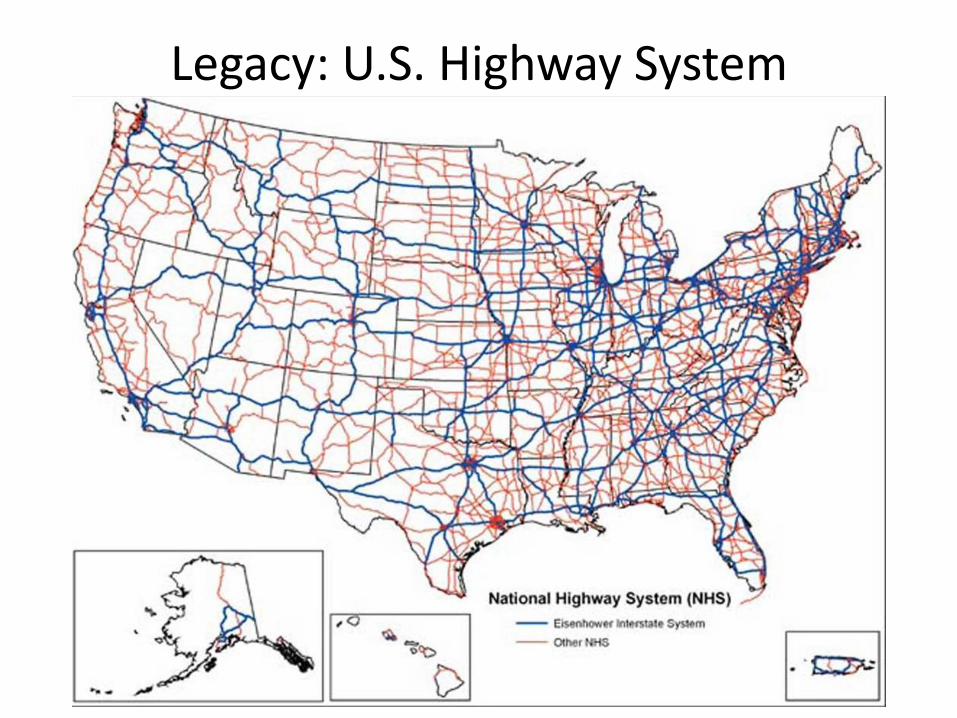
Legacy: U.S. Highway System
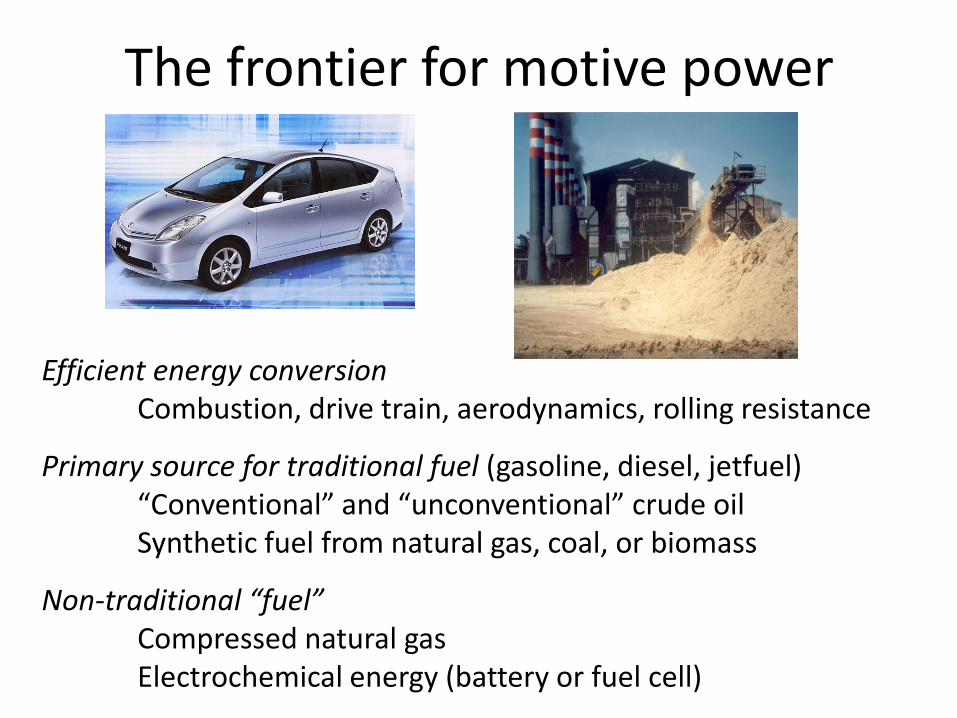
The frontier for motive power
Efficient energy conversion Combustion, drive train, aerodynamics, rolling resistance
Primary source for traditional fuel (gasoline, diesel, jetfuel) “Conventional” and “unconventional” crude oil Synthetic fuel from natural gas, coal, or biomass
Non-traditional “fuel” Compressed natural gas Electrochemical energy (battery or fuel cell)

System efficiency
Most cars have only one person in them most of the time.
Many trips can be replaced by information technology.
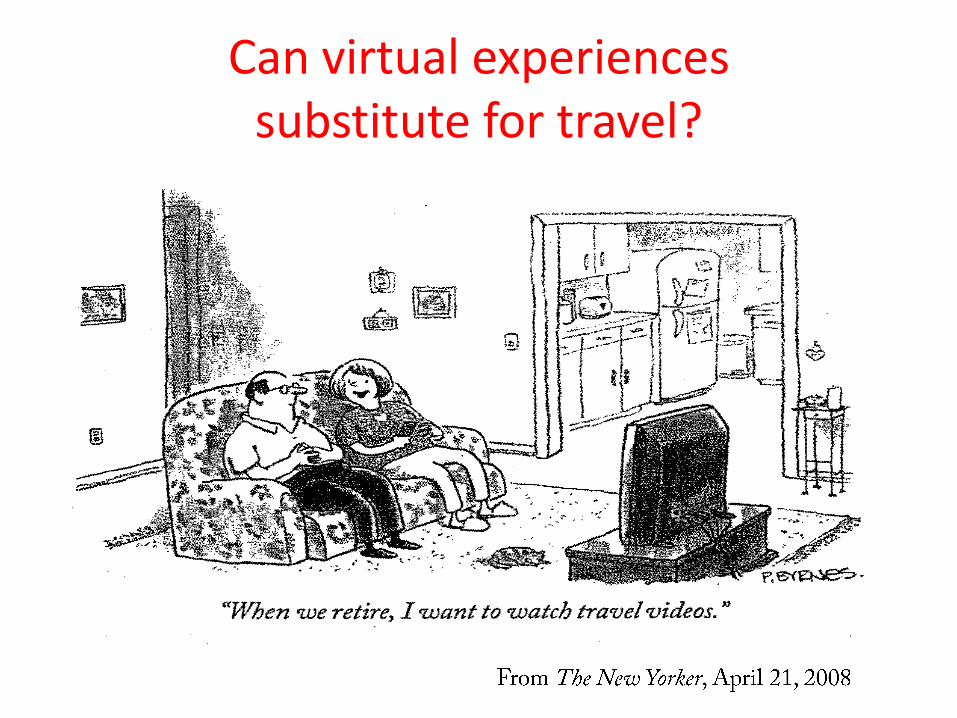
Can virtual experiences substitute for travel?
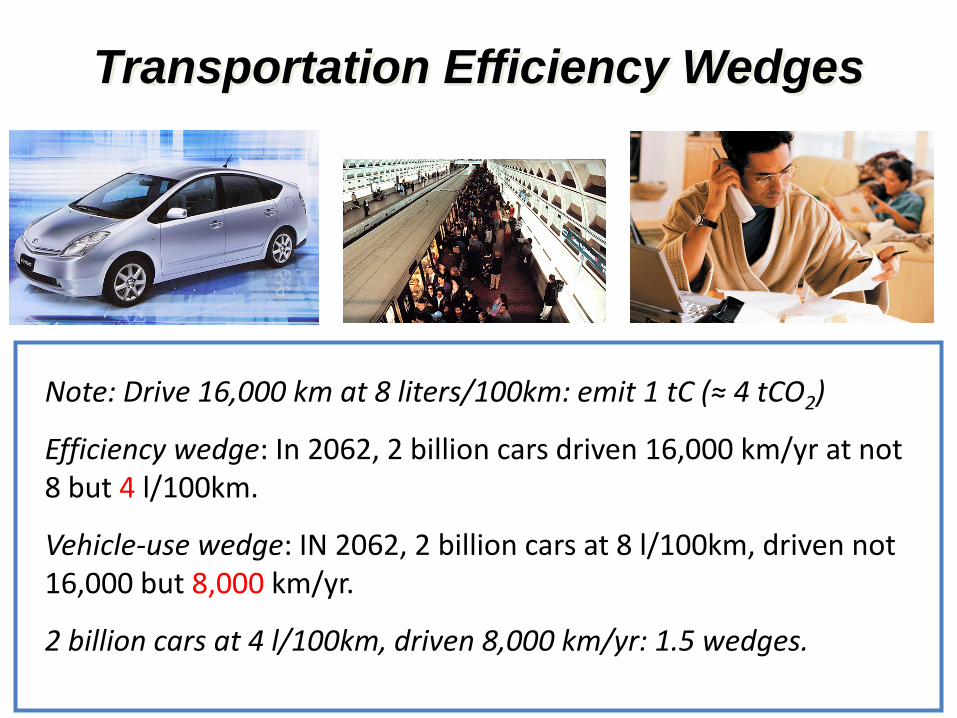
Transportation Efficiency Wedges
Note: Drive 16,000 km at 8 liters/100km: emit 1 tC (≈ 4 tCO2)
Efficiency wedge: In 2062, 2 billion cars driven 16,000 km/yr at not 8 but 4 l/100km.
Vehicle-use wedge: IN 2062, 2 billion cars at 8 l/100km, driven not 16,000 but 8,000 km/yr.
2 billion cars at 4 l/100km, driven 8,000 km/yr: 1.5 wedges.
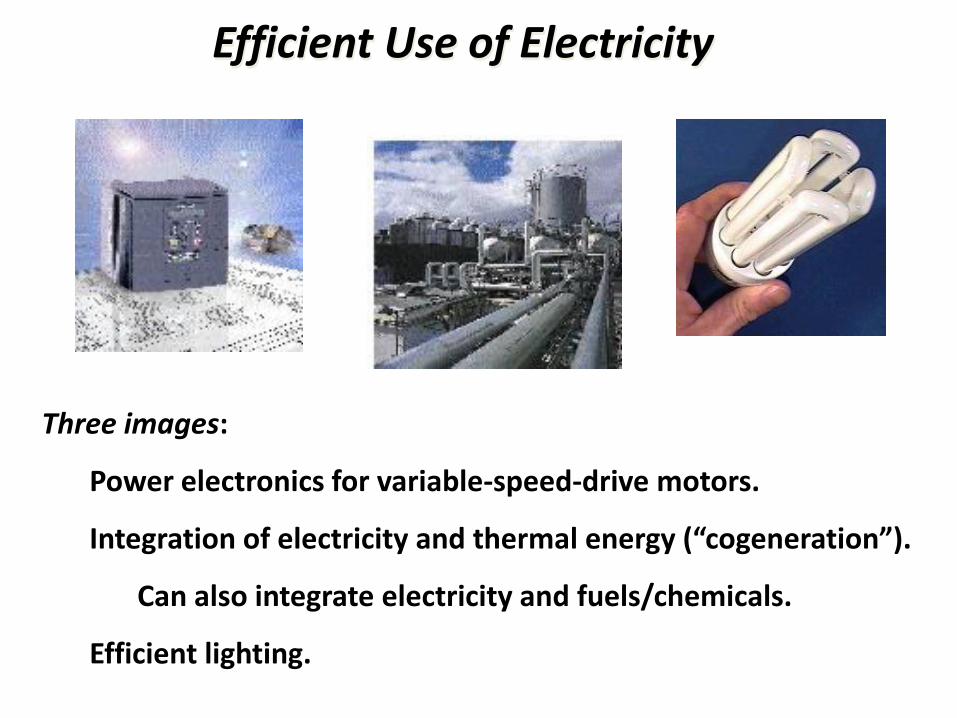
Efficient Use of Electricity
Three images:
Power electronics for variable-speed-drive motors.
Integration of electricity and thermal energy (“cogeneration”).
Can also integrate electricity and fuels/chemicals.
Efficient lighting.
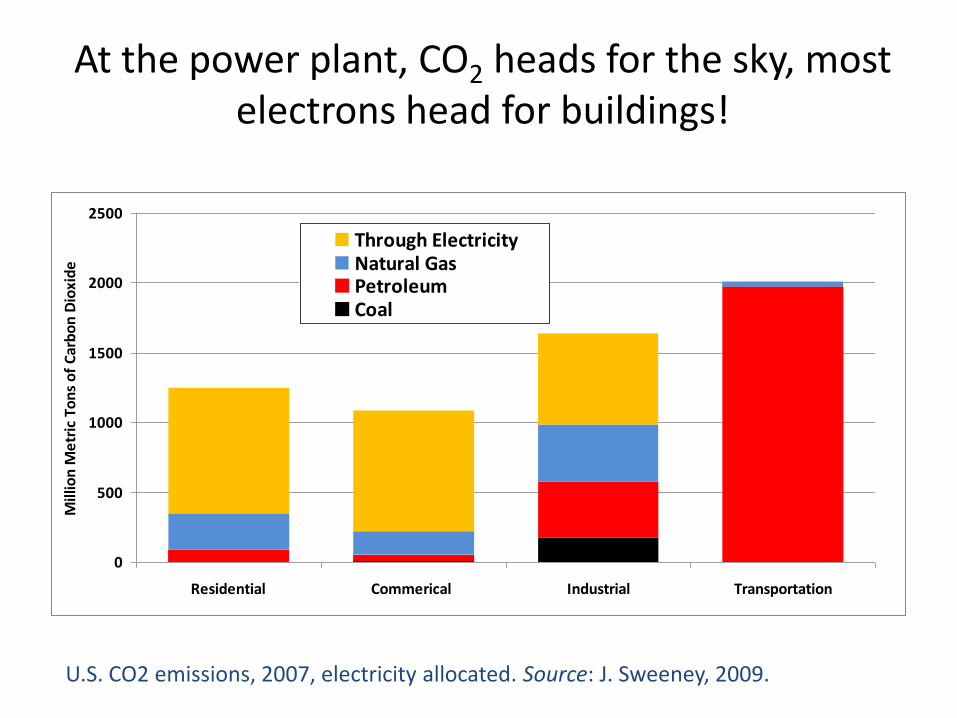
At the power plant, CO2 heads for the sky, most electrons head for buildings!
0
500
1000
1500
2000
2500
Residential Commerical Industrial Transportation
Mill
ion
Me
tric
To
ns
of
Car
bo
n D
ioxi
de
Through ElectricityNatural GasPetroleumCoal
U.S. CO2 emissions, 2007, electricity allocated. Source: J. Sweeney, 2009.
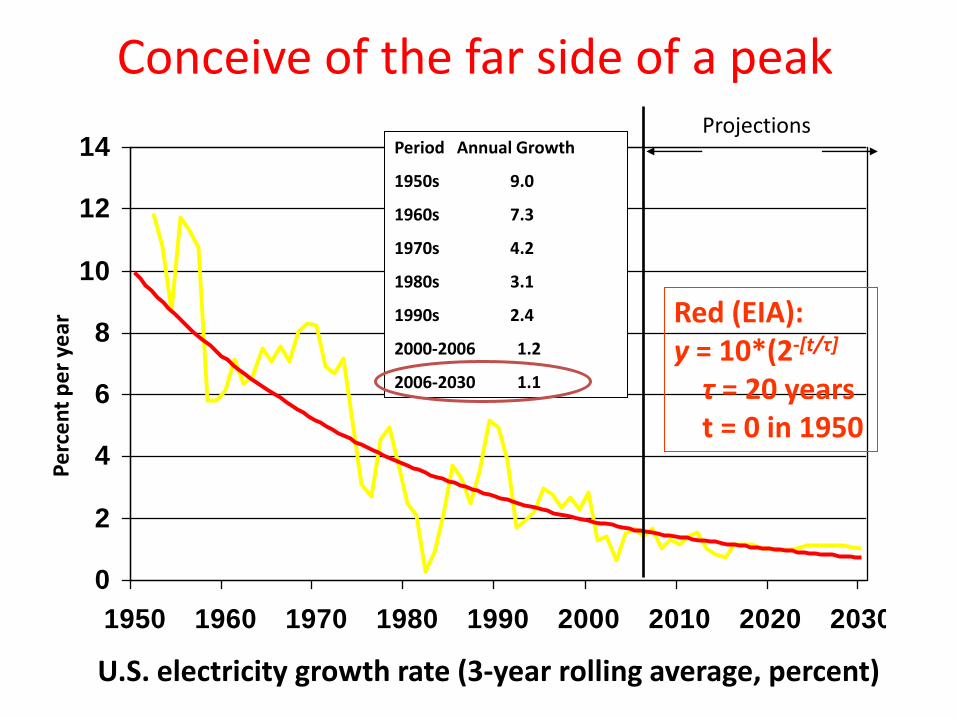
Conceive of the far side of a peak
0
2
4
6
8
10
12
14
1950 1960 1970 1980 1990 2000 2010 2020 2030
Projections Period Annual Growth
1950s 9.0
1960s 7.3
1970s 4.2
1980s 3.1
1990s 2.4
2000-2006 1.2
2006-2030 1.1
Red (EIA): y = 10*(2-[t/τ]
τ = 20 years t = 0 in 1950
Pe
rce
nt
pe
r ye
ar
U.S. electricity growth rate (3-year rolling average, percent)
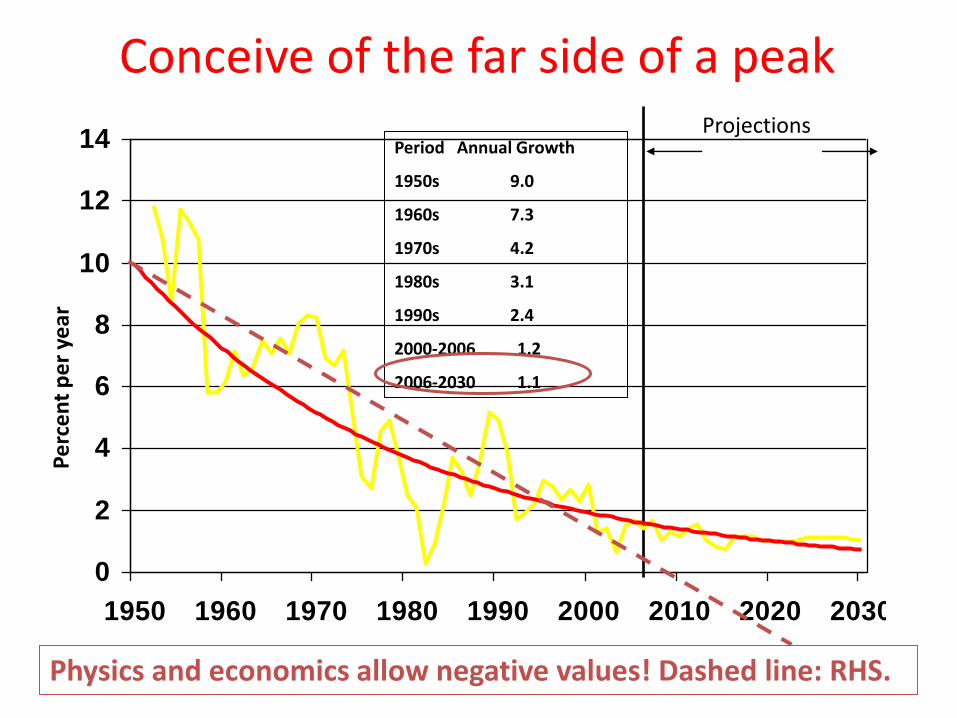
Projections Period Annual Growth
1950s 9.0
1960s 7.3
1970s 4.2
1980s 3.1
1990s 2.4
2000-2006 1.2
2006-2030 1.1
0
2
4
6
8
10
12
14
1950 1960 1970 1980 1990 2000 2010 2020 2030
Pe
rce
nt
pe
r ye
ar
Conceive of the far side of a peak
Physics and economics allow negative values! Dashed line: RHS.
Has energy demand peaked in industrialized countries?
If any industrialized country makes energy efficiency a priority, at least two of its peaks can be in its past:
•oil consumption
•electric power consumption
CENTRALIZED ENERGY CONVERSION
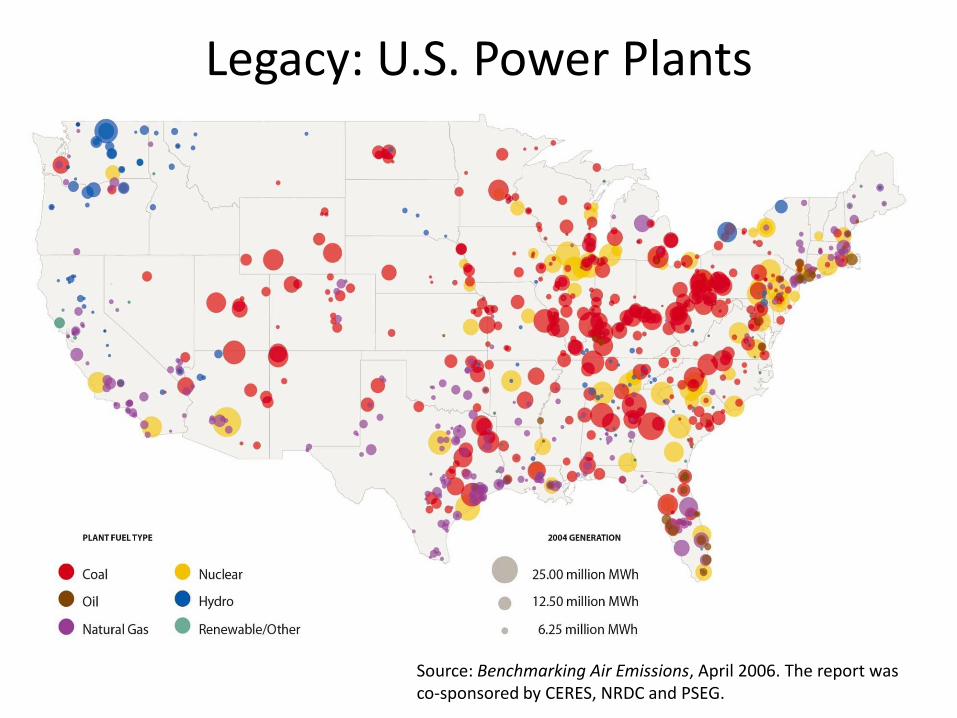
Legacy: U.S. Power Plants
Source: Benchmarking Air Emissions, April 2006. The report was co-sponsored by CERES, NRDC and PSEG.
C apacity, total by source
0
10000
20000
30000
40000
50000
60000
70000
80000
1950 1960 1970 1980 1990 2000
year of in itial operation
me
ga
wa
tt
O ther
R enew ables
W ater
N uclear
G as
O il
C oal
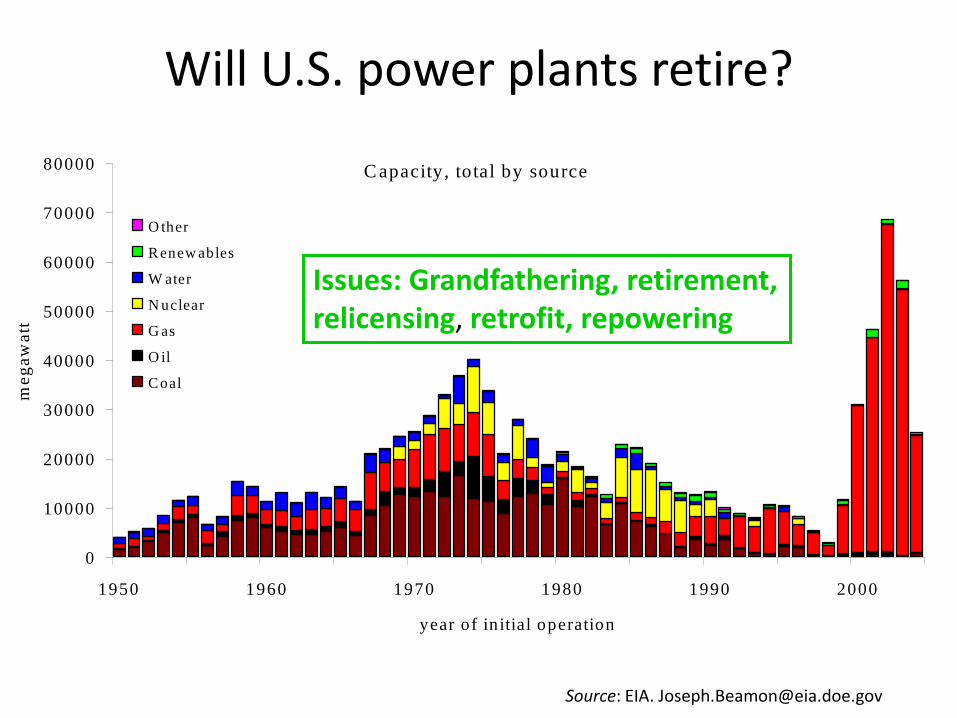
Will U.S. power plants retire?
Issues: Grandfathering, retirement, relicensing, retrofit, repowering
Source: EIA. [email protected]
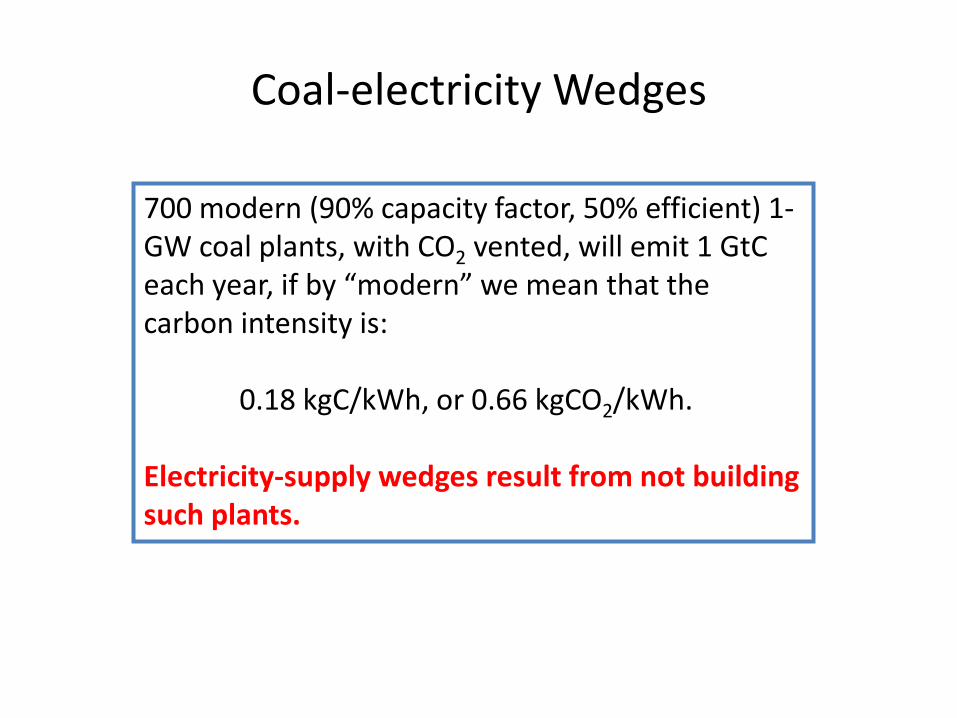
Coal-electricity Wedges
700 modern (90% capacity factor, 50% efficient) 1-GW coal plants, with CO2 vented, will emit 1 GtC each year, if by “modern” we mean that the carbon intensity is:
0.18 kgC/kWh, or 0.66 kgCO2/kWh. Electricity-supply wedges result from not building such plants.
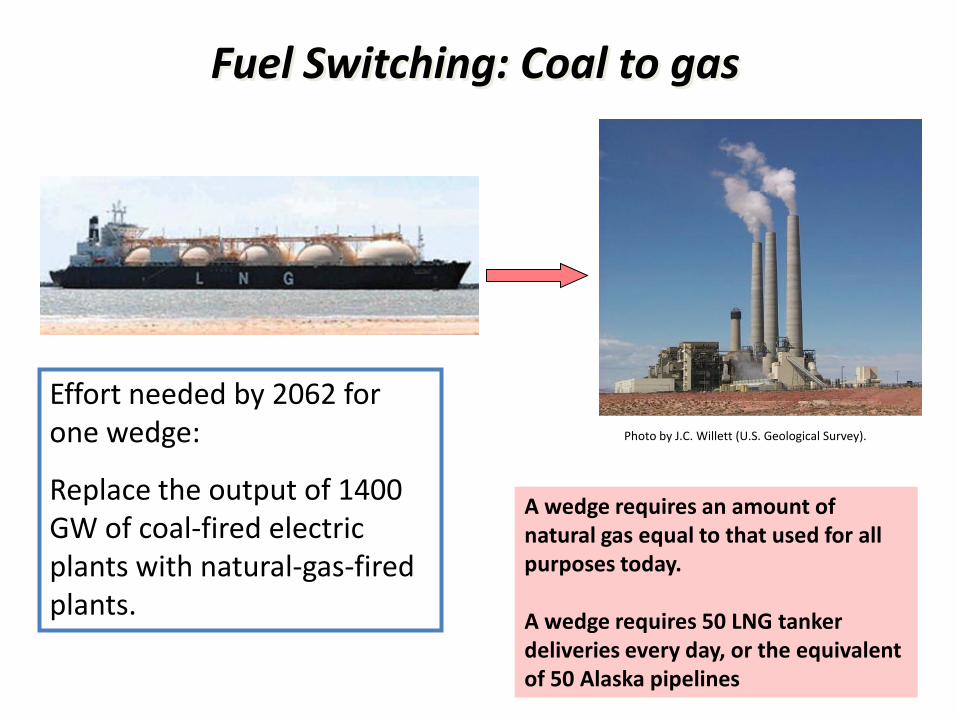
Effort needed by 2062 for one wedge:
Replace the output of 1400 GW of coal-fired electric plants with natural-gas-fired plants.
A wedge requires an amount of natural gas equal to that used for all purposes today. A wedge requires 50 LNG tanker deliveries every day, or the equivalent of 50 Alaska pipelines
Fuel Switching: Coal to gas
Photo by J.C. Willett (U.S. Geological Survey).
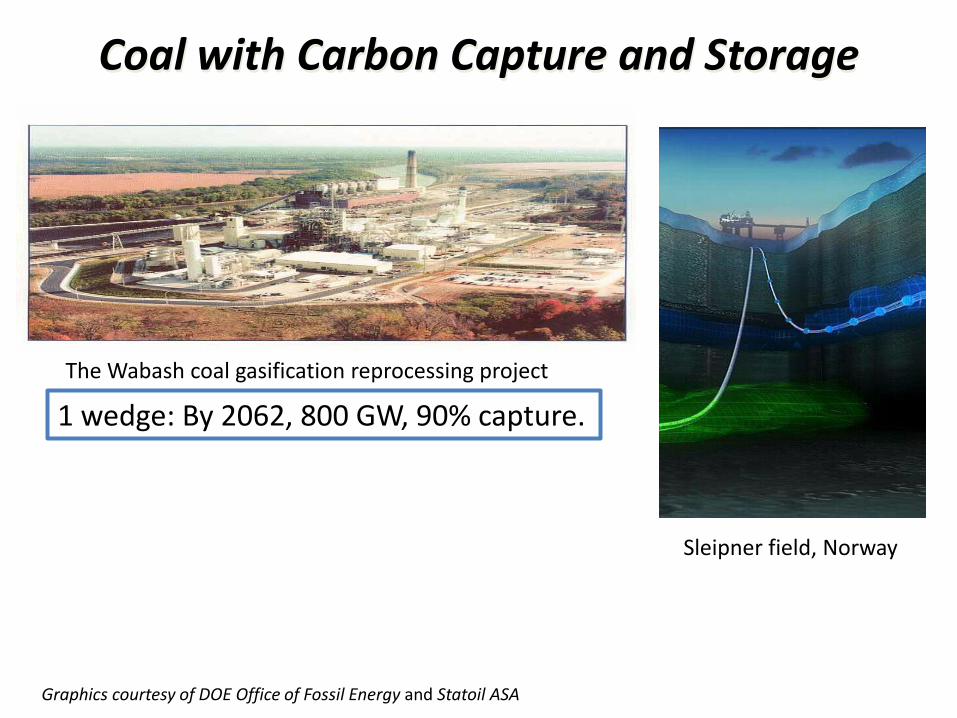
Coal with Carbon Capture and Storage
Graphics courtesy of DOE Office of Fossil Energy and Statoil ASA
The Wabash coal gasification reprocessing project
Sleipner field, Norway
1 wedge: By 2062, 800 GW, 90% capture.
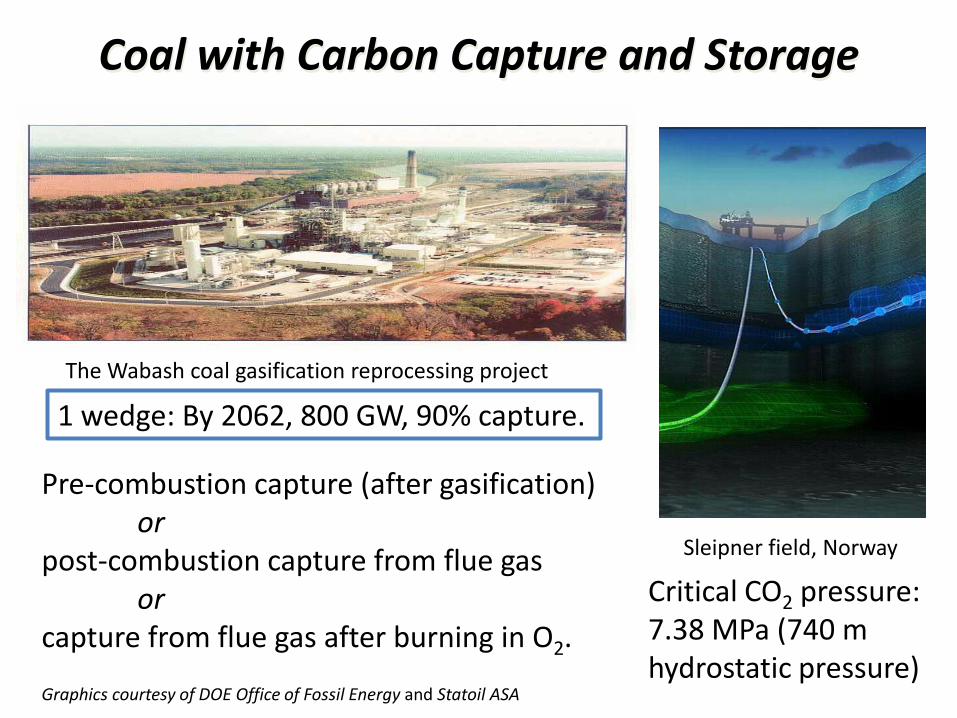
Coal with Carbon Capture and Storage
Graphics courtesy of DOE Office of Fossil Energy and Statoil ASA
The Wabash coal gasification reprocessing project
Sleipner field, Norway
Pre-combustion capture (after gasification) or post-combustion capture from flue gas or capture from flue gas after burning in O2.
Critical CO2 pressure: 7.38 MPa (740 m hydrostatic pressure)
1 wedge: By 2062, 800 GW, 90% capture.
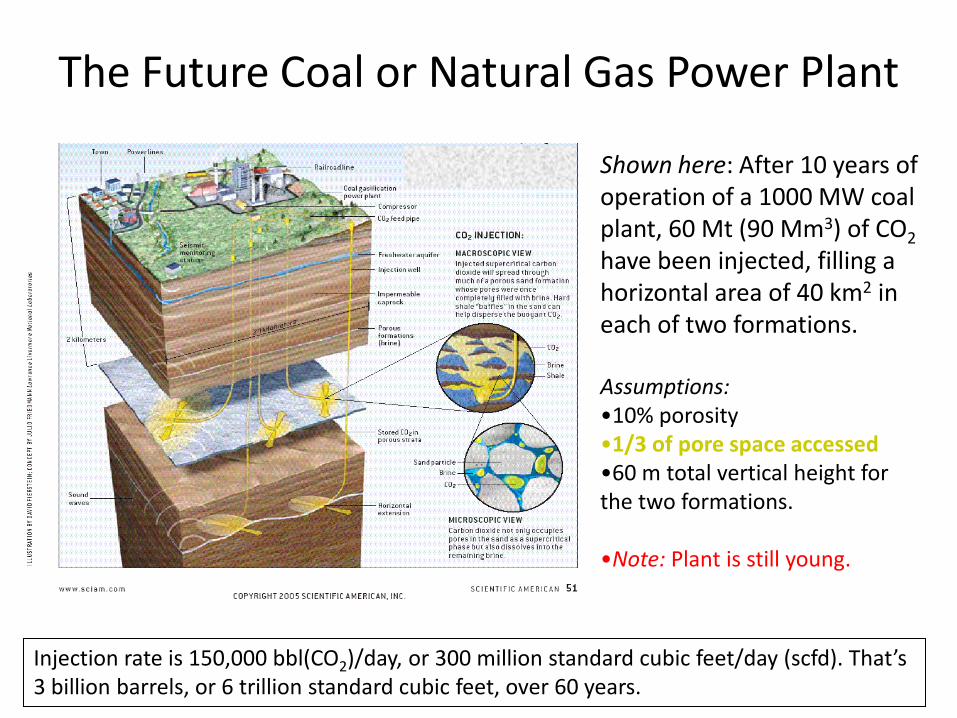
The Future Coal or Natural Gas Power Plant
Shown here: After 10 years of operation of a 1000 MW coal plant, 60 Mt (90 Mm3) of CO2 have been injected, filling a horizontal area of 40 km2 in each of two formations. Assumptions: •10% porosity •1/3 of pore space accessed •60 m total vertical height for the two formations.
•Note: Plant is still young.
Injection rate is 150,000 bbl(CO2)/day, or 300 million standard cubic feet/day (scfd). That’s 3 billion barrels, or 6 trillion standard cubic feet, over 60 years.
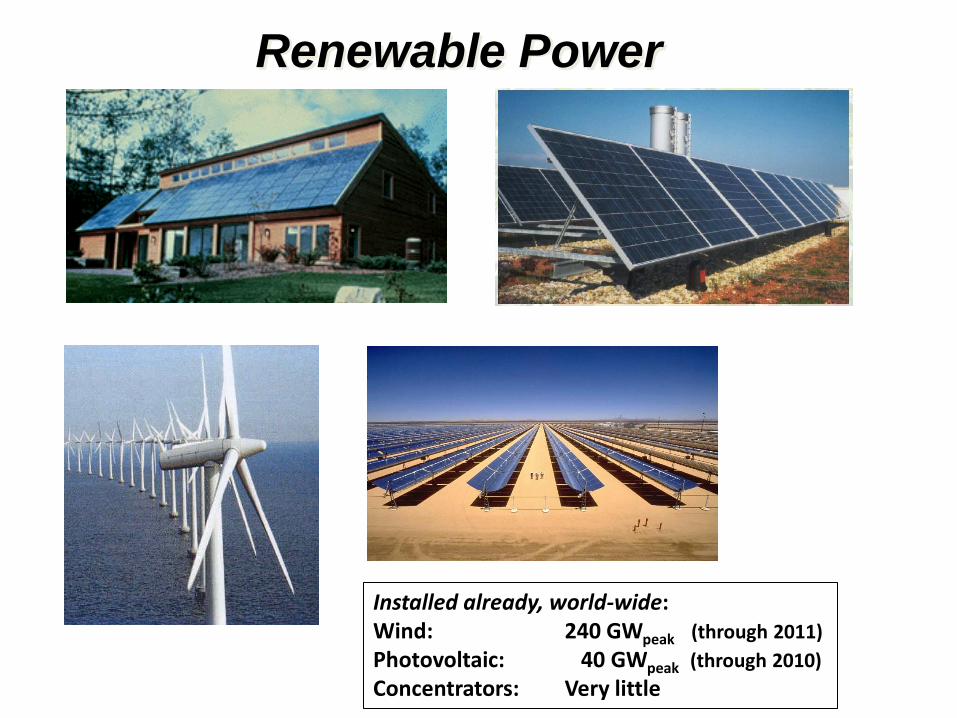
Renewable Power
Installed already, world-wide: Wind: 240 GWpeak (through 2011)
Photovoltaic: 40 GWpeak (through 2010)
Concentrators: Very little
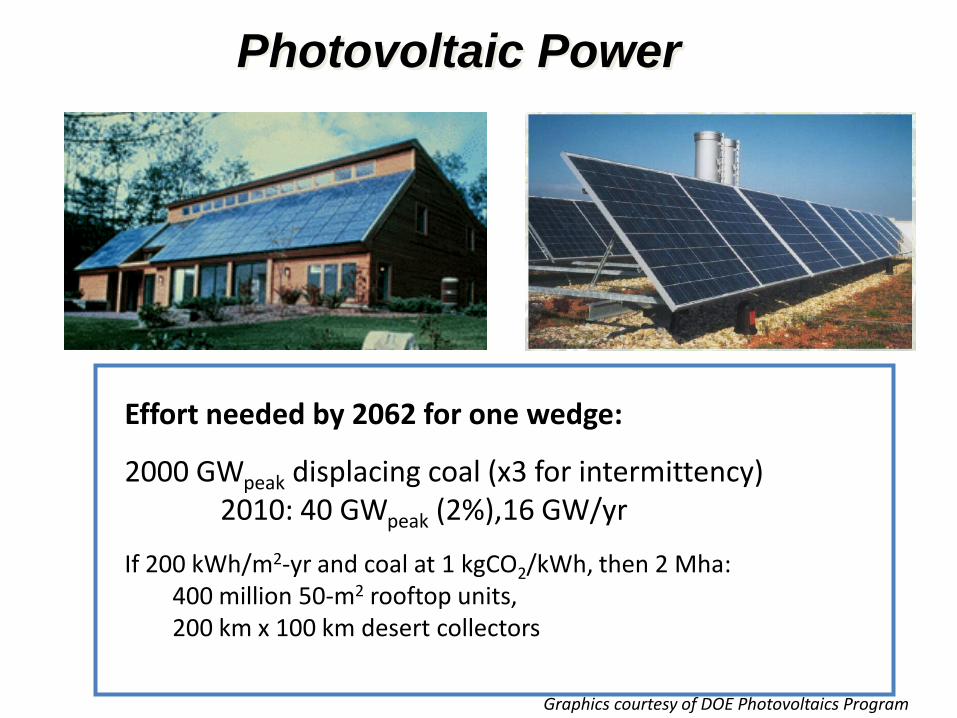
Photovoltaic Power
Effort needed by 2062 for one wedge:
2000 GWpeak displacing coal (x3 for intermittency) 2010: 40 GWpeak (2%),16 GW/yr
If 200 kWh/m2-yr and coal at 1 kgCO2/kWh, then 2 Mha:
400 million 50-m2 rooftop units, 200 km x 100 km desert collectors
Graphics courtesy of DOE Photovoltaics Program
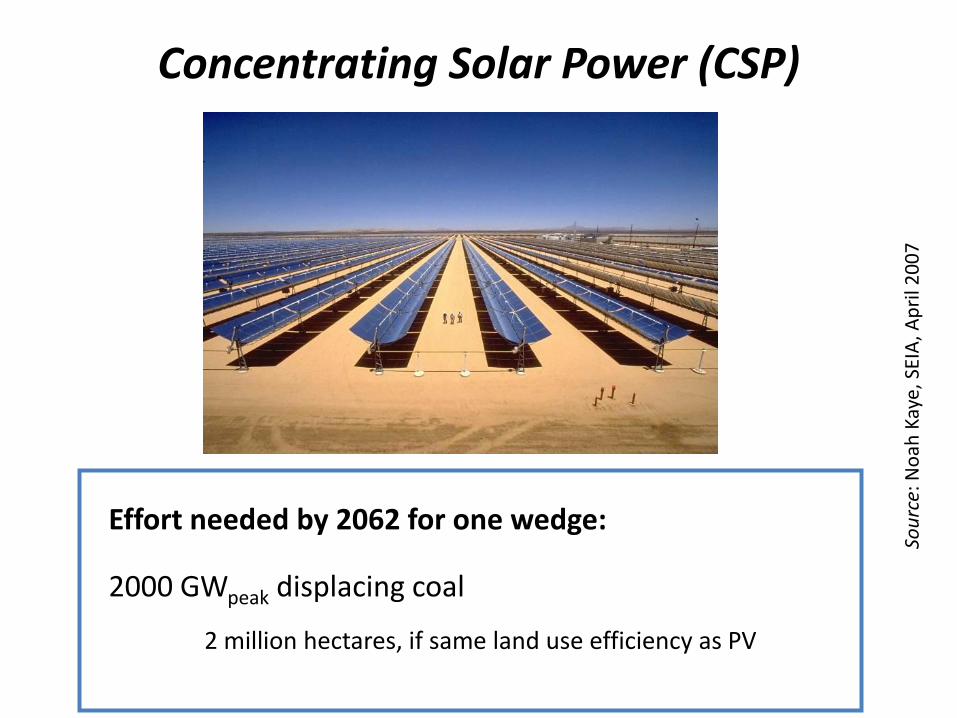
Concentrating Solar Power
Sou
rce:
No
ah K
aye,
SEI
A, A
pri
l 20
07
Concentrating Solar Power (CSP)
Effort needed by 2062 for one wedge:
2000 GWpeak displacing coal
2 million hectares, if same land use efficiency as PV
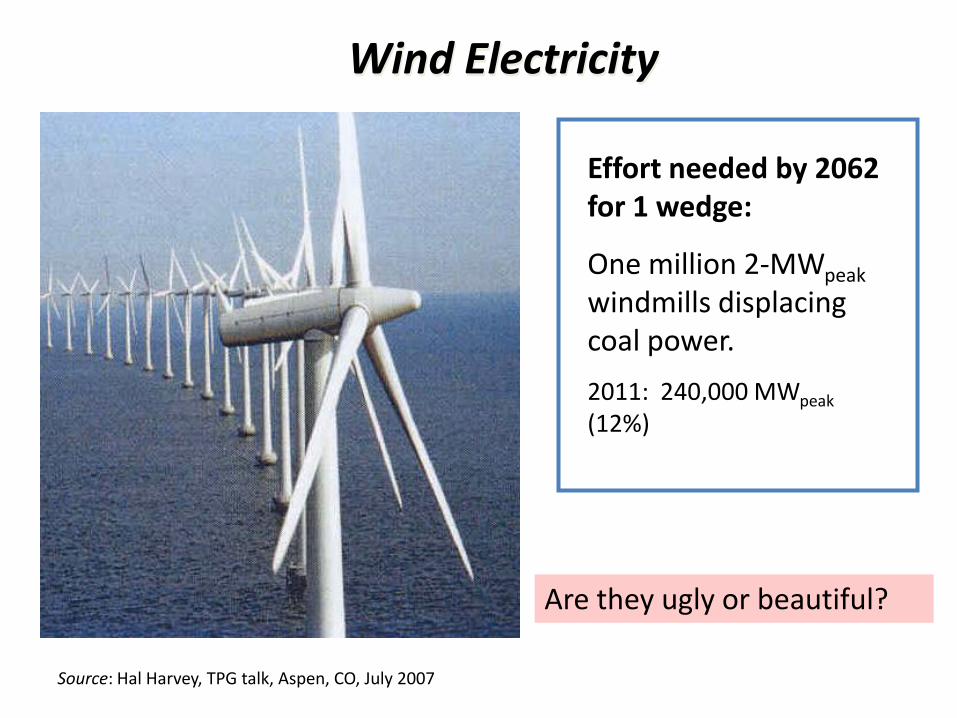
Wind Electricity
Effort needed by 2062 for 1 wedge:
One million 2-MWpeak windmills displacing coal power.
2011: 240,000 MWpeak (12%)
Source: Hal Harvey, TPG talk, Aspen, CO, July 2007
Are they ugly or beautiful?
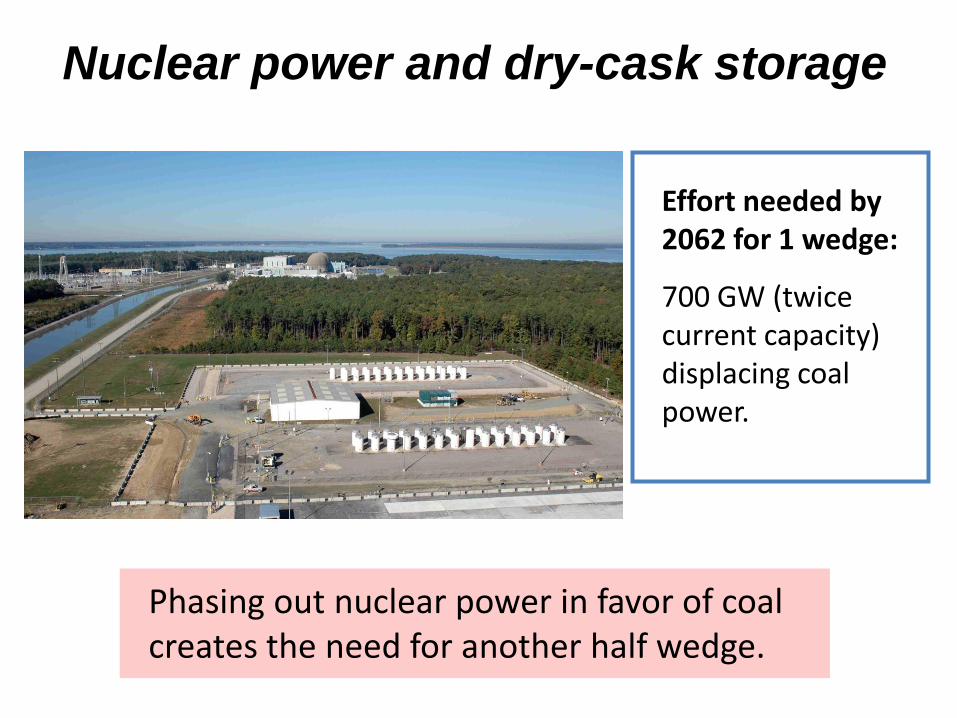
Effort needed by 2062 for 1 wedge:
700 GW (twice current capacity) displacing coal power.
Phasing out nuclear power in favor of coal creates the need for another half wedge.
Nuclear power and dry-cask storage
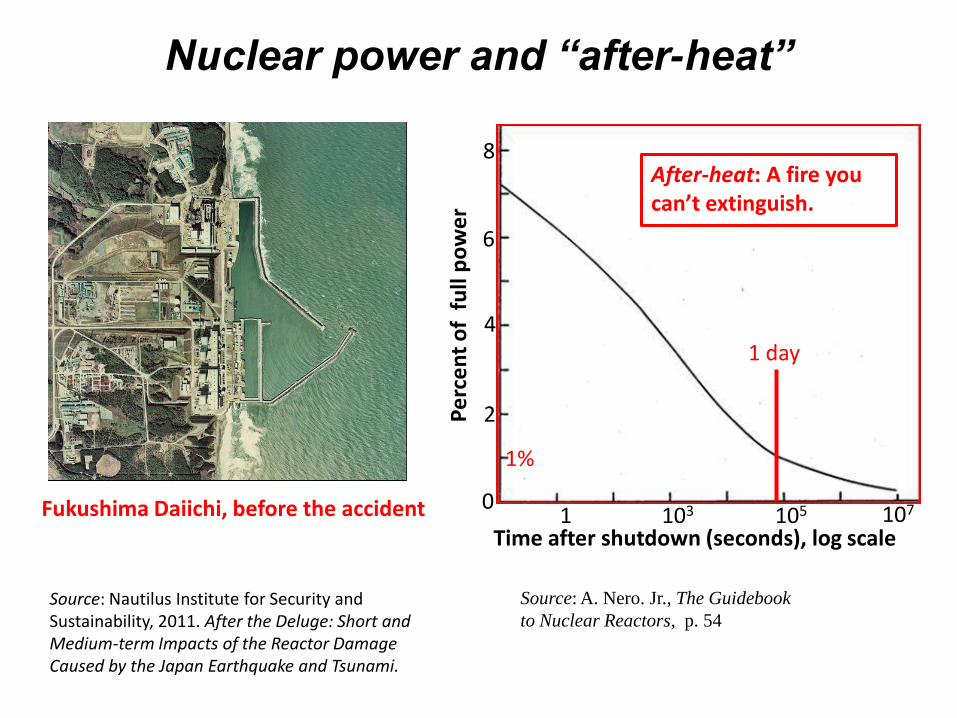
Nuclear power and “after-heat”
Source: Nautilus Institute for Security and Sustainability, 2011. After the Deluge: Short and Medium-term Impacts of the Reactor Damage Caused by the Japan Earthquake and Tsunami.
Fukushima Daiichi, before the accident Time after shutdown (seconds), log scale
1%
8
6
4
2
0 1 103 105 107
Pe
rce
nt
of
fu
ll p
ow
er
1 day
After-heat: A fire you can’t extinguish.
Source: A. Nero. Jr., The Guidebook
to Nuclear Reactors, p. 54
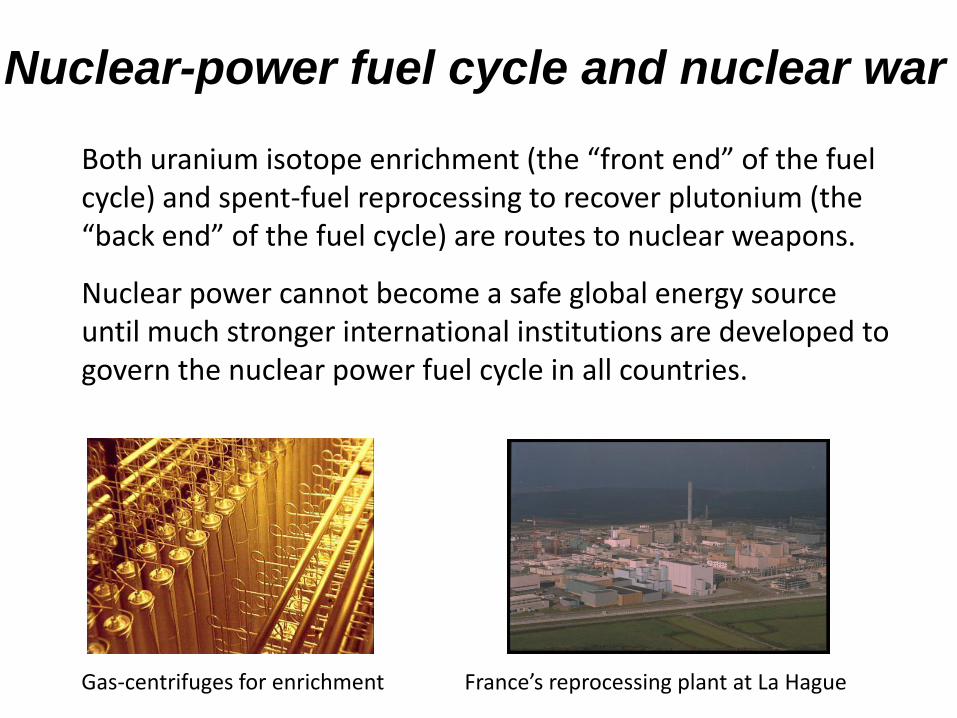
Nuclear-power fuel cycle and nuclear war
Both uranium isotope enrichment (the “front end” of the fuel cycle) and spent-fuel reprocessing to recover plutonium (the “back end” of the fuel cycle) are routes to nuclear weapons.
Nuclear power cannot become a safe global energy source until much stronger international institutions are developed to govern the nuclear power fuel cycle in all countries.
Gas-centrifuges for enrichment France’s reprocessing plant at La Hague
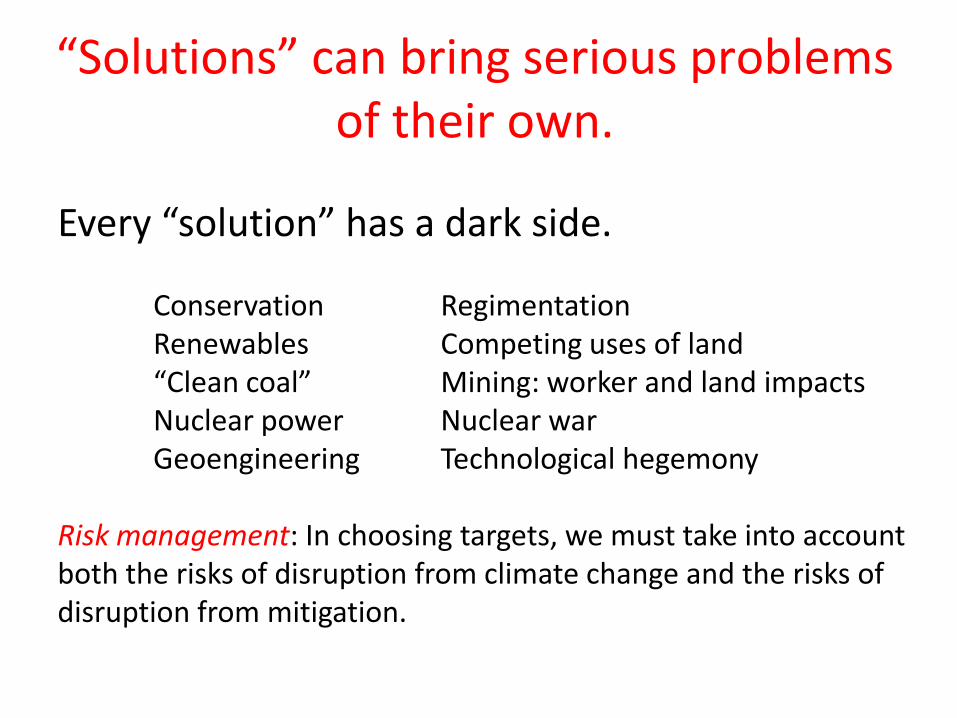
“Solutions” can bring serious problems of their own.
Every “solution” has a dark side. Conservation Regimentation Renewables Competing uses of land “Clean coal” Mining: worker and land impacts
Nuclear power Nuclear war Geoengineering Technological hegemony Risk management: In choosing targets, we must take into account both the risks of disruption from climate change and the risks of disruption from mitigation.

Can a target be too strict?
“I will apply, for the benefit of the sick, all measures that are required, avoiding those twin traps of overtreatment and therapeutic nihilism.”
Hippocrates
* Modern version of the Hippocratic oath, Louis Lasagna, 1964. http://www.pbs.org/wgbh/nova/doctors/oath_modern.html
“The Wedge Model is the iPod of climate change: You fill it with your favorite things.” David Hawkins, NRDC, 2007.
“The Wedge Model is the iPod of climate change: You fill it with your favorite things.” David Hawkins, NRDC, 2007. Therefore, prepare to negotiate with others, who have different favorite things.

Concluding Thoughts
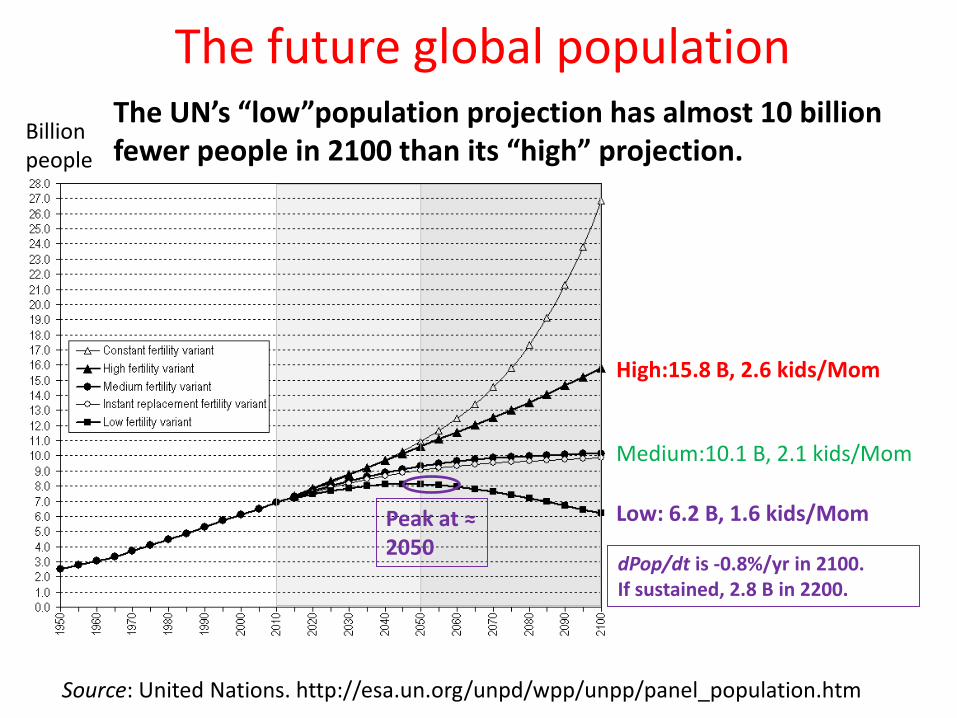
The future global population
Source: United Nations. http://esa.un.org/unpd/wpp/unpp/panel_population.htm
Billion people
High:15.8 B, 2.6 kids/Mom
Medium:10.1 B, 2.1 kids/Mom
Low: 6.2 B, 1.6 kids/Mom Peak at ≈ 2050
dPop/dt is -0.8%/yr in 2100. If sustained, 2.8 B in 2200.
The UN’s “low”population projection has almost 10 billion fewer people in 2100 than its “high” projection.

How many children will you have?
Imagining our collective future: “Prospicience”
Prospicience: “The art [and science] of looking ahead.”
In the past 50 years we have become aware of the history of our Universe, our Earth, and life.
Can we achieve a comparable understanding of human civilization at various future times: 50 years ahead – vs. 500 years and vs. 5000 years? Prospicience is needed to address planning horizons, infrastructure, waste management….
Imagine spending as much effort on our collective destiny on Earth as we spend on our personal destiny in the afterlife! We have scarcely begun to ask: What are we on Earth to do?
In order to know the truth, it is necessary to imagine a thousand falsehoods.
Sidney Coleman, ca. 1964, perhaps a quote from H.G. Wells
Grounds for optimism
1. The world today has a terribly inefficient energy system.
2. Carbon emissions have just begun to be priced.
3. Most of the 2062 physical plant is not yet built.
4. Many smart and committed young people now find energy problems exciting.
Fitting on the Earth
Our planet, Earth, is the only one we have. Fortunately:
Our science has discovered threats fairly early;
We can identify a myriad of helpful technologies;
We have a moral compass that tells us to care about everyone alive today and about the collective future of our species. What has seemed too hard becomes what simply must be done.

Co-authors, some recent papers Wedges
Steve Pacala Jeff Greenblatt (LBNL) Roberta Hotinski Harvey Lam
Nuclear power
Alex Glaser One-billion high emitters
Shoibal Chakravarty Massimo Tavoni (FEEM, Milan) Ananth Chikkatur (ICF, Washington DC) Heleen de Coninck (ECN, Netherlands) Steve Pacala