Embed Size (px)
Citation preview
Comcast
Steven Gluck
Bus 210 http://www.comcast.com/2012annualreview/d/CMCSA_AR12_10K.pdf?SCRedire
ct=true
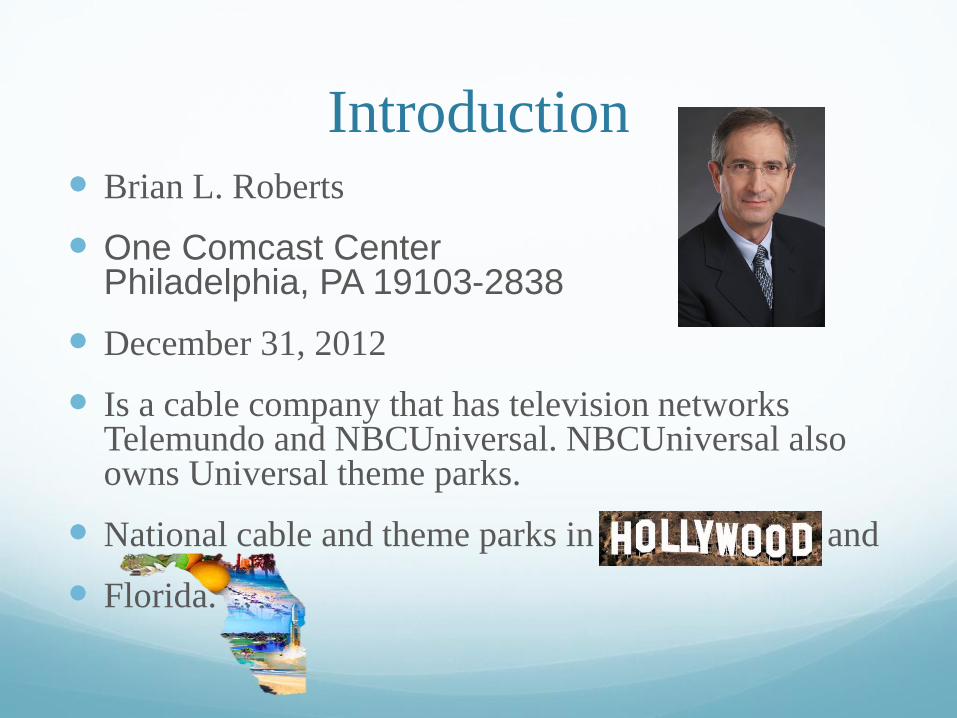
Introduction Brian L. Roberts
One Comcast Center Philadelphia, PA 19103-2838
December 31, 2012
Is a cable company that has television networks Telemundo and NBCUniversal. NBCUniversal also owns Universal theme parks.
National cable and theme parks in Hollywood and
Florida.
AUDIT REPORT
• Deloitte & Touche LLP
• I believe they said Comcast’s financial statements fairly
represented the financial position of Comcast.
• In addition they said Comcast had good internal control
over their financial reporting though they made of
mentioning how hard it was to detect and stop
misstatement or collusion on a timely basis which I found
suspicious.

STOCK MARKET INFORMATION
Last Price was $41.84
Twelve month low $28.34.
Twelve month high $43.74
Quarterly dividend of $.195 per share of common stock starting June 24. Declared
May 15, 2013
May 23, 2013
Buy and hold since it is going up and pays dividend.
http://www.cmcsa.com/dividends.cfm http://finance.yahoo.com/q/ks?s=C
MCSA+Key+Statistics
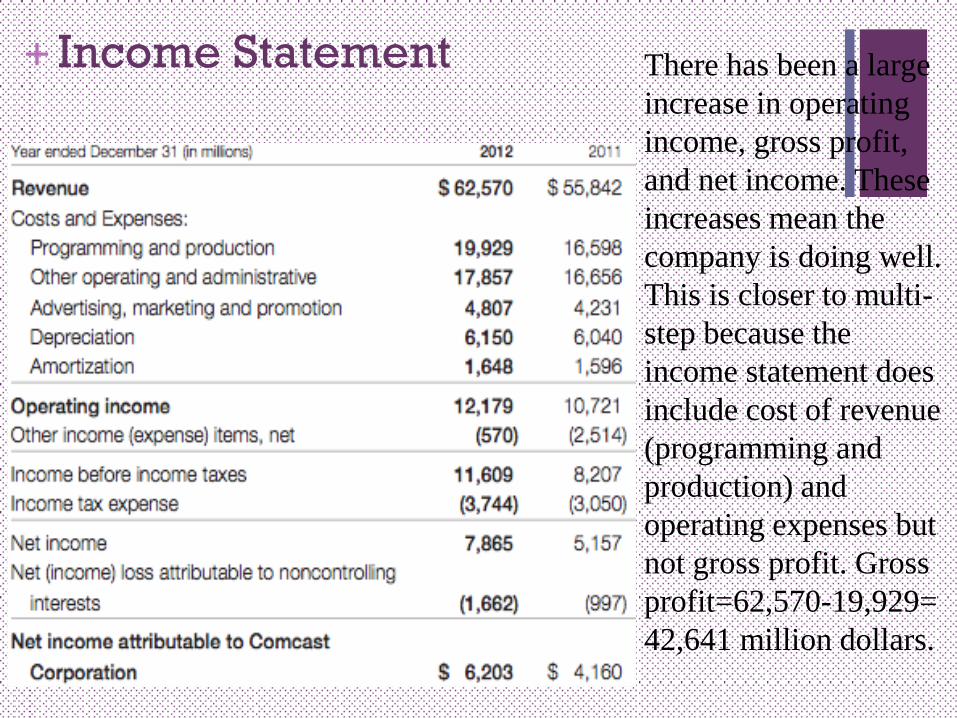
+ Income Statement There has been a large
increase in operating
income, gross profit,
and net income. These
increases mean the
company is doing well.
This is closer to multi-
step because the
income statement does
include cost of revenue
(programming and
production) and
operating expenses but
not gross profit. Gross
profit=62,570-19,929=
42,641 million dollars.

Balance Sheet Assets

Balance Sheet Liabilities and
SHE

Balance Sheet Analysis • By and far the biggest change was cash and cash
equivalents account. They most likely built up this
cash to buy NBCUniversal in 2013. Short
Investments also went up considerably which keeps
with the cash flow statement which shows an
outflow of money in investing activities. Long-term
investments though went down significantly. For
liabilities, Current portion of long-term debt and
accrued expenses both went up a great deal. Even
though Assets went up 7,153 million dollars 5,012
million of it came from liabilities so most of its
assets came from getting new debts instead of
profits.

Cash Flow Operating and Investing
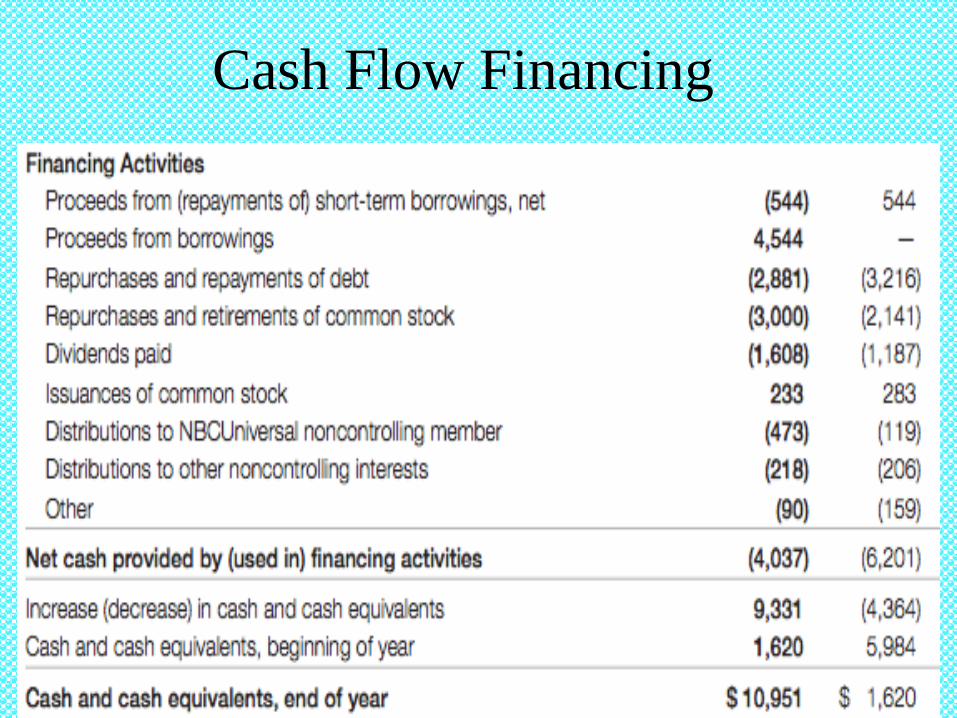
Cash Flow Financing
Cash Flow Analysis
• All of the cash inflow is coming from Comcast’s
operating activities, which was greater than its net
income for 2012 but not 2011. It is actually losing
money from both investing and financial
activities. The cash outflow in investing is mainly
from capital expenditures meaning Comcast was
purchasing assets for future benefit. These
expenditures were probably related to its buying
of NBCUniversal which was completed in 2013.
For financing, the majority of what cash inflow
there was came from long-term borrowing for
2012 and short term borrowing for 2011.

Accounting Policies: Revenue
For its source of primary revenue, cable
services, Comcast recognizes revenue when
services are provided and recognizes
installation revenue when Comcast connects
customer to their cable services.
They recognize advertising revenue when
they air the advertisements.
Other revenue is recognized when the
services are completed or events occur.
Other Segments Revenue
Recognition For the films segment, they recognize revenue when
films are played in theaters.
They recognize DVD sales when the DVDs are
delivered to retailers.
Recognized revenue from theme parks when tickets
are used and utilize a yearly straight-line basis for
annual passes.
Public investments that are not accounted for under the equity method (which are used for companies they have significant control over) are either trading securities or available for sales securities and are valued at Fair Market Value. Privately held investments are valued at cost.
For AFS unrealized gains or losses are part of comprehensive income if temporary and for TS gains or losses are part of investment income.
Comcast uses specific identification for realized gains and losses
Accounting Principles: PE
Property and Equipment are put on balance sheet at cost.
Capitalize betterments and expense maintenance and repair.
Remove cost and deprecation when selling or retiring.
Capitalize costs that deal with construction such as labor, materials, and indirect costs.

• 1: Business and Basis of Presentation
• 2: Accounting Policies 19: Financial Data by Business Segment
• 3: Earnings Per Share 20: Quarterly Financial Information (Unaudited)
• 4: Acquisitions 21: Subsequent Events
• 5: Film and Television Costs 22: Condensed Consolidating Financial Information
• 6: Investments
• 7: Property and Equipment
• 8: Goodwill and Intangible Assets
• 9: Long-Term Debt
• 10: Fair Market Value Measurements
• 11: Noncontrolling Interests
• 12: Postretirement, Pension and Other Employee Benefit Plans
• 13: Equity
• 14: Share-Based Compensation
• 15: Income Taxes Comcast
• 16: Supplemental Financial Information Notes • 17: Receivables Monetization
• 18: Commitments and Contingencies

Financial Analysis Liquidity Ratios
• Working Capital 2011: 8,573 – 13,241 = (4668) million 2012: 19,991 – 16,714 = 3277 million • Current Ratio
2011: 8,573/13,241 = .647 2012: 19,991/ 16,714= 1.196 Receivable Turnover 2011: 55,842/((4652+1,855)/2)=17.164 2012:62,570/((5521+4652)/2)=12.301 • Average days sales uncollected = Operating Cycle (no inventory)
2011: 365/17.164 ≈ 21 days 2012: 365/12.301 ≈ 30 days
• Payables Turnover 2011 : 16,598, /((5705+3291)/2) = 3.69 2012: 19,929/((6206+5705)/2) = 3.34 • Average days payable
2011: 365/3.69= 99 days 2012: 365/3.34 = 109 days
http://www.cmcsa.com/annuals.cfm
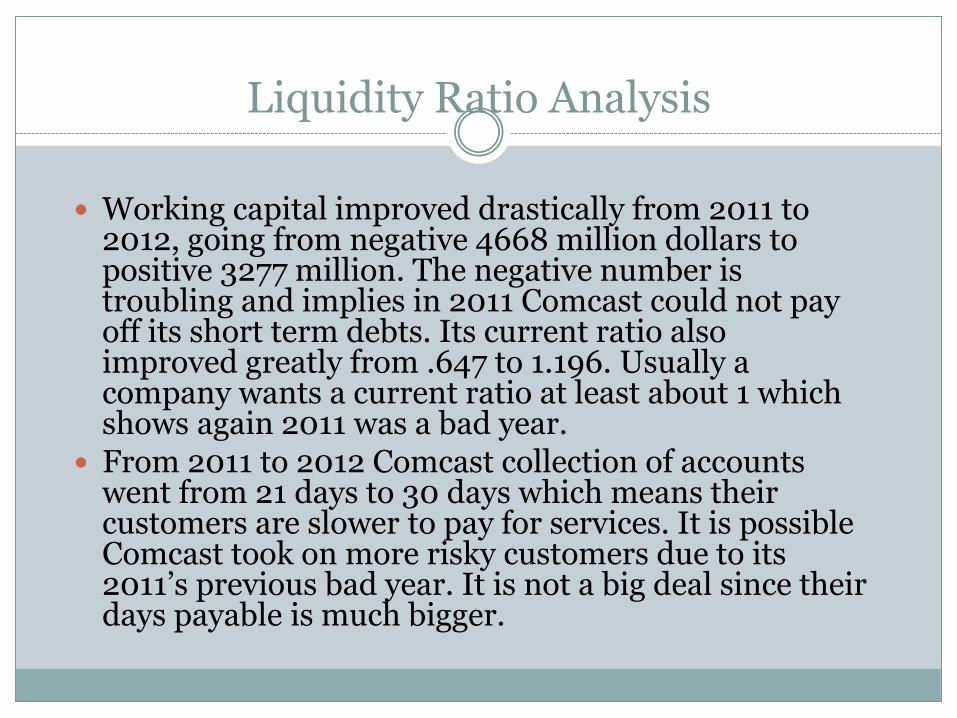
Liquidity Ratio Analysis
Working capital improved drastically from 2011 to 2012, going from negative 4668 million dollars to positive 3277 million. The negative number is troubling and implies in 2011 Comcast could not pay off its short term debts. Its current ratio also improved greatly from .647 to 1.196. Usually a company wants a current ratio at least about 1 which shows again 2011 was a bad year.
From 2011 to 2012 Comcast collection of accounts went from 21 days to 30 days which means their customers are slower to pay for services. It is possible Comcast took on more risky customers due to its 2011’s previous bad year. It is not a big deal since their days payable is much bigger.
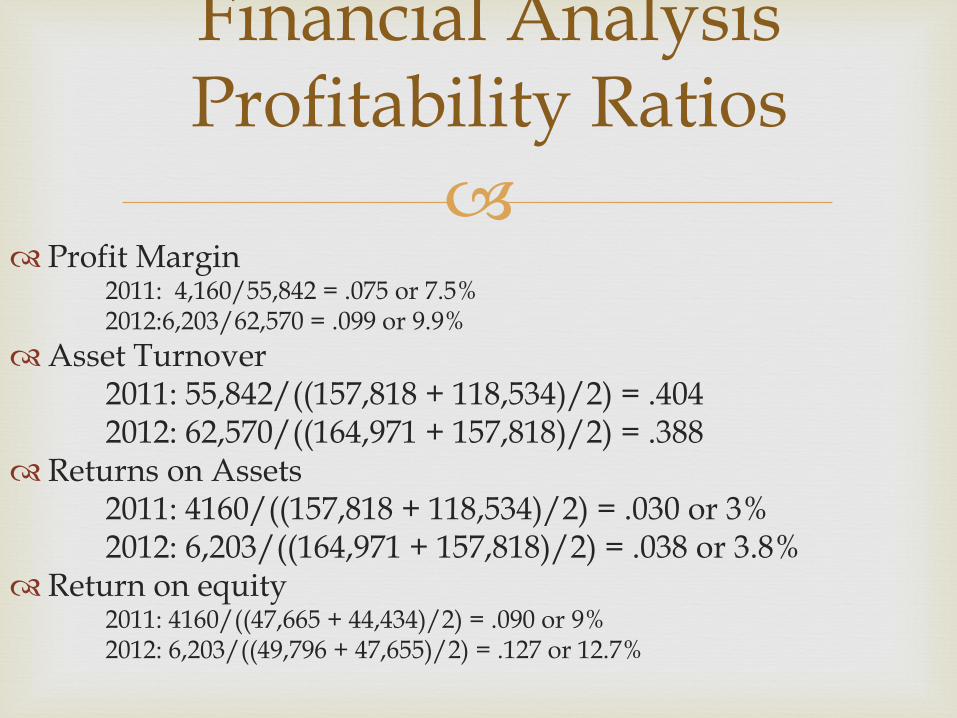
Profit Margin
2011: 4,160/55,842 = .075 or 7.5% 2012:6,203/62,570 = .099 or 9.9%
Asset Turnover 2011: 55,842/((157,818 + 118,534)/2) = .404 2012: 62,570/((164,971 + 157,818)/2) = .388 Returns on Assets 2011: 4160/((157,818 + 118,534)/2) = .030 or 3% 2012: 6,203/((164,971 + 157,818)/2) = .038 or 3.8% Return on equity
2011: 4160/((47,665 + 44,434)/2) = .090 or 9% 2012: 6,203/((49,796 + 47,655)/2) = .127 or 12.7%
Financial Analysis Profitability Ratios

Profitability Ratios Analysis
Profit margins increased 2.4% from 2011 to 2012, meaning Comcast got to keep more of each dollar it earned.
Asset turnover decreased from .404 to .388 from 2011 to 2012. This means Comcast made less revenue from their assets even though they gained more assets. However, its Return on Assets increased, meaning they were more efficient at making their assets to create net income.
Since Return on Assets increased, Return on Equity must of have also increased, which it did. This means the investors got more for the amount they invested.
These figures overall show Comcast is not doing great but is improving.
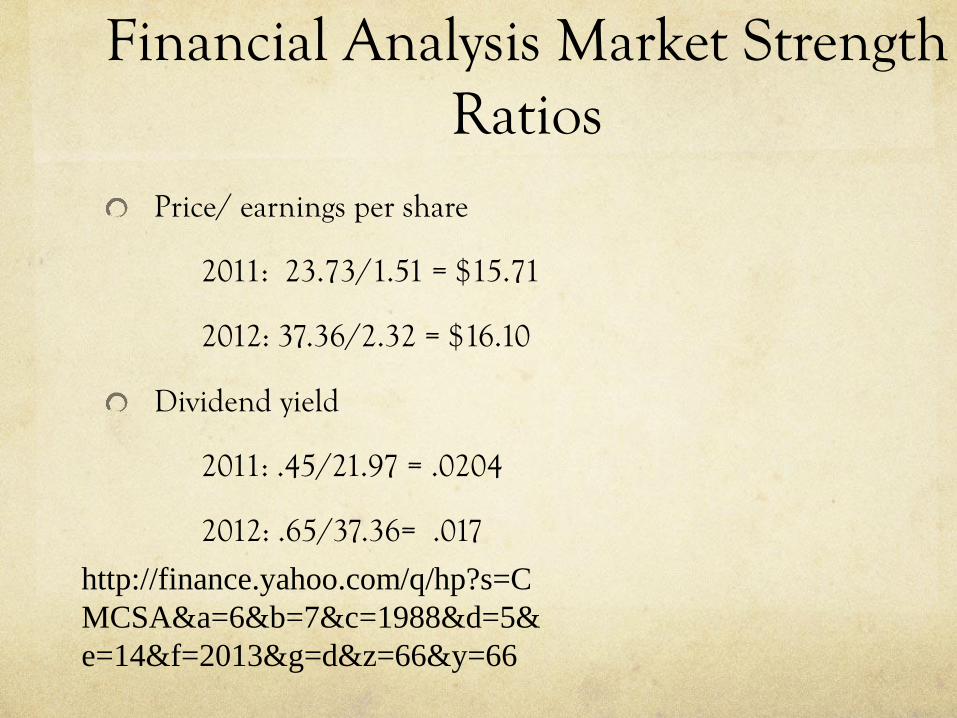
Financial Analysis Market Strength Ratios
Price/ earnings per share
2011: 23.73/1.51 = $15.71
2012: 37.36/2.32 = $16.10
Dividend yield
2011: .45/21.97 = .0204
2012: .65/37.36= .017
http://finance.yahoo.com/q/hp?s=C
MCSA&a=6&b=7&c=1988&d=5&
e=14&f=2013&g=d&z=66&y=66

Market Strength Ratios Analysis
The price/ earnings per share ratio increased from 2011 to 2012 which means the investment potential of Comcast increased. This furthers my belief that one should buy and hold Comcast stock.
The dividend / market price per share went down even though dividends went up since the market price increased so much. Even though this ratio went down I still believe Comcast to be a good company to invest in since dividends are increasing as are the stock prices meaning one will receive good dividends and price appreciation of their stock for when they sell it.
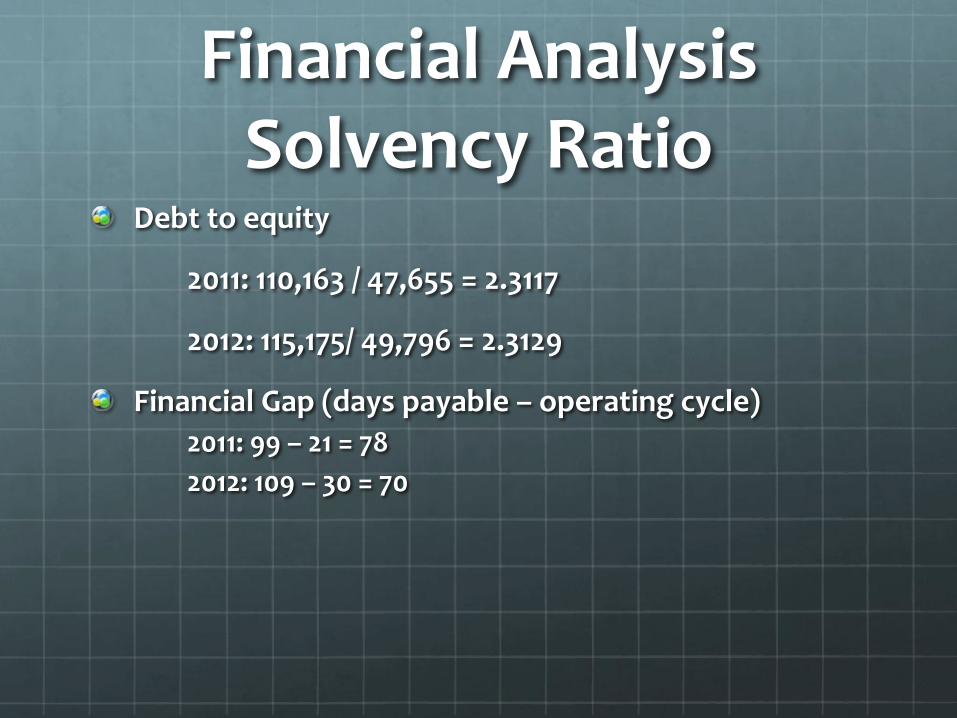
Financial Analysis Solvency Ratio
Debt to equity
2011: 110,163 / 47,655 = 2.3117
2012: 115,175/ 49,796 = 2.3129
Financial Gap (days payable – operating cycle)
2011: 99 – 21 = 78
2012: 109 – 30 = 70
Solvency Ratio Analysis
The Debt to Equity Ratio did not significantly move from
2011 to 2012.
The ratio shows Comcast is in a lot of debt and that
creditors have control over the company.
As seen by the financing gap, Comcast pays its debts
well in advance
Industry Situation
• Comcast is primarily known for its cable services but also recently acquired Universal Theme Parks when it bought NBC, which owned Universal. However the Theme parks are only make up 8% of Comcast’s total revenue. It makes most of its money from its Cable and its Television Films. It is definitely a titan of the entertainment industry. Although it is difficult to predict Comcast’s future due to its recent purchase of NBCUniversal, its profitability ratio’s and price/earnings per share indicate Comcast is becoming more profitable and a good investment. Although it goes a little up and down, long term Comcast’s stock has gone a great deal up in the last few years there does not seem to be any reason for this pattern to change. Though its debt to equity is not stellar, it is expected for a growing company. http://www.cmcsa.co
m/annuals.cfm
https://www.google.com/finance?q=NASD
AQ:CMCSA&sa=X&ei=rJ3DUdmME4m-
9gTyrYCoDA&ved=0CDoQ2AE
Comcast Future Plans
• Comcast, even after just buying NBCUniversal, has a lot of projects on its agenda. At the forefront is continuing and expanding X1, which uses the Cloud to provide a better program guide to its subscribers. Another project is the Xinfinitywifi, which will give its Xinfinity customers a second “community” wifi they can have their friends, family and visitors use while the customer still uses their own privately configured wifi.
http://www.pcmag.com/article2/0,2
817,2400326,00.asp
http://corporate.comcast.com/news-
information/news-feed/comcast-unveils-plans-for-
millions-of-xfinity-wifi-hotspots-through-its-
home-based-neighborhood-hotspot-initiative-2
Executive Summary
Comcast is a huge, growing company that does
business with both cable, film, internet and theme
parks. Due to how its stock has increased over
recent years as well as due to its price/earnings
per share ratio, I recommend buying and holding
Comcast stock.