Embed Size (px)
Citation preview
Copyright 2015 American Business Analytics & Research, LLC, www.shadowstats.com 1
COMMENTARY NUMBER 760
September Industrial Production
October 16, 2015
__________
Annual Production Growth Collapsed to Recession Levels
Despite a Quarterly Gain from the July Auto-Production Surge,
Third-Quarter 2015 Production Activity Held Below
Fourth-Quarter 2014 and First-Quarter 2015
Recession Should Be Timed from December 2014
___________
PLEASE NOTE: The next regular Commentary, scheduled for Tuesday, October 20th, will cover
September Housing Starts and a general review of current economic activity.
Best wishes to all! — John Williams
Shadow Government Statistics — Commentary No. 760, October 16, 2015
Copyright 2015 American Business Analytics & Research, LLC, www.shadowstats.com 2
OPENING COMMENTS AND EXECUTIVE SUMMARY
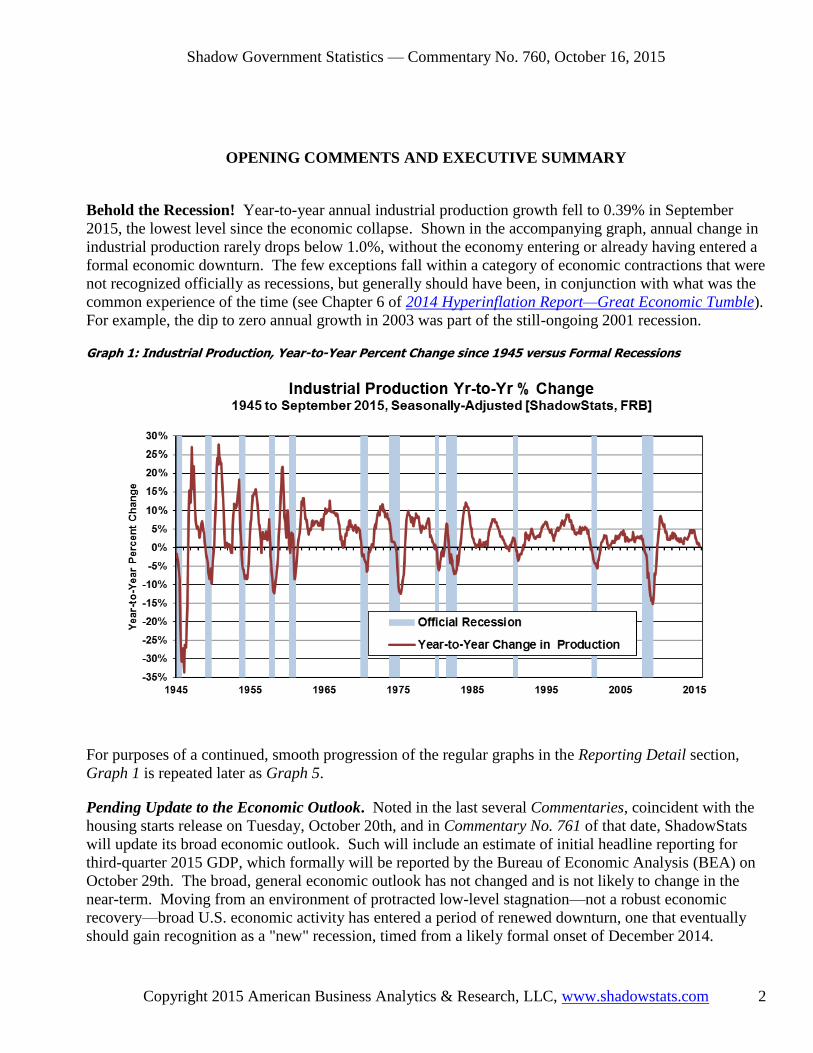
Behold the Recession! Year-to-year annual industrial production growth fell to 0.39% in September
2015, the lowest level since the economic collapse. Shown in the accompanying graph, annual change in
industrial production rarely drops below 1.0%, without the economy entering or already having entered a
formal economic downturn. The few exceptions fall within a category of economic contractions that were
not recognized officially as recessions, but generally should have been, in conjunction with what was the
common experience of the time (see Chapter 6 of 2014 Hyperinflation Report—Great Economic Tumble).
For example, the dip to zero annual growth in 2003 was part of the still-ongoing 2001 recession.
Graph 1: Industrial Production, Year-to-Year Percent Change since 1945 versus Formal Recessions
For purposes of a continued, smooth progression of the regular graphs in the Reporting Detail section,
Graph 1 is repeated later as Graph 5.
Pending Update to the Economic Outlook. Noted in the last several Commentaries, coincident with the
housing starts release on Tuesday, October 20th, and in Commentary No. 761 of that date, ShadowStats
will update its broad economic outlook. Such will include an estimate of initial headline reporting for
third-quarter 2015 GDP, which formally will be reported by the Bureau of Economic Analysis (BEA) on
October 29th. The broad, general economic outlook has not changed and is not likely to change in the
near-term. Moving from an environment of protracted low-level stagnation—not a robust economic
recovery—broad U.S. economic activity has entered a period of renewed downturn, one that eventually
should gain recognition as a "new" recession, timed from a likely formal onset of December 2014.
Shadow Government Statistics — Commentary No. 760, October 16, 2015
Copyright 2015 American Business Analytics & Research, LLC, www.shadowstats.com 3
Today's Commentary (October 16th). The balance of these Opening Comments provides summary
coverage of the September Industrial Production, and a quick update to consumer conditions for the early-
October estimate of Consumer Sentiment. The Hyperinflation Outlook Summary has not been changed.
The Week Ahead previews the September Housing Starts and Existing- and New-Home Sales releases.
Industrial Production—September 2015—Deteriorating Annual Growth Fell Well into Recession
Territory. With headline September and third-quarter 2015 industrial production reporting in place, the
production series continued to show a deteriorating economy, a deepening and intensifying recession.
Monthly and annual activity patterns continued to deteriorate in a manner last seen coming into the
economic collapse. Shown in the opening paragraphs of these Opening Comments, annual growth in
production has fallen to a low level rarely seen other than at the onset of formal recessions.
Faltering Quarterly and Annual Growth. First-quarter 2015 production contracted at an unrevised
annualized quarterly pace of 0.35% (-0.35%), followed by a revised second-quarter 2015 contraction of
2.36% (-2.36%). Based on initial full reporting for third-quarter 2015, annualized third-quarter growth
was 1.85%.
That said, although headline third-quarter activity was spiked relative to second-quarter 2015, by a one-
time, extreme surge in headline July automobile production, the level of aggregate third-quarter 2015
production remained below the headline activity in both fourth-quarter 2014 and first-quarter 2015.
Separately, year-to-year growth in quarterly production continued to decline, from 4.47% in fourth-
quarter 2014, to 3.47% in first-quarter 2015, to 1.44% in second-quarter 2015, to a post-economic
collapse low of 0.93% in third-quarter 2015. Such a pattern of declining annual growth has not been seen
since first-quarter 2008, the official onset the economic collapse.
The Fed's industrial production series continues to indicate that broad economic activity has entered a
"new" recession, which likely will be timed officially from December of 2014.
Headline Industrial Production—September 2015. In the context of an upside revision to August 2015,
headline monthly industrial production declined in September 2015 by 0.19% (-0.19%), following a
revised, narrowed decline in August of 0.15% (-0.15%), a downwardly-revised gain of 0.76% in July, and
a revised decline of 0.03% (-0.03%) in June. Net of prior-period revisions, headline monthly September
2015 production would have gained 0.01%, instead declining by a 0.19% (-0.19%).
Detailed in Graphs 9 to 11 of major industry groups, in the Reporting Detail, the headline September
2015 monthly loss of 0.2% (-0.2%) [an August contraction of 0.1% (-0.1%)] in total industrial production,
was composed of a 0.1% (-0.1%) decline in September manufacturing activity [an August decline of 0.4%
(-0.4%)]; a September decline in mining activity (including oil and gas production) of 2.0% (-2.0%)
[August unchanged at 0.0%]; and a September gain of 1.3% in utilities [August gain of 1.3%]. Upside
revisions to August activity generally came in the areas of mining and utilities.
Year-to-year September 2015 production growth fell to 0.39%, from an upwardly-revised 1.11% annual
gain in August 2015, a downwardly-revised 1.29% gain in July 2015, and an upwardly-revised 0.87%
gain in June 2015. Again, annual growth has fallen to low levels seen at the onset of formal recessions.
Shadow Government Statistics — Commentary No. 760, October 16, 2015
Copyright 2015 American Business Analytics & Research, LLC, www.shadowstats.com 4
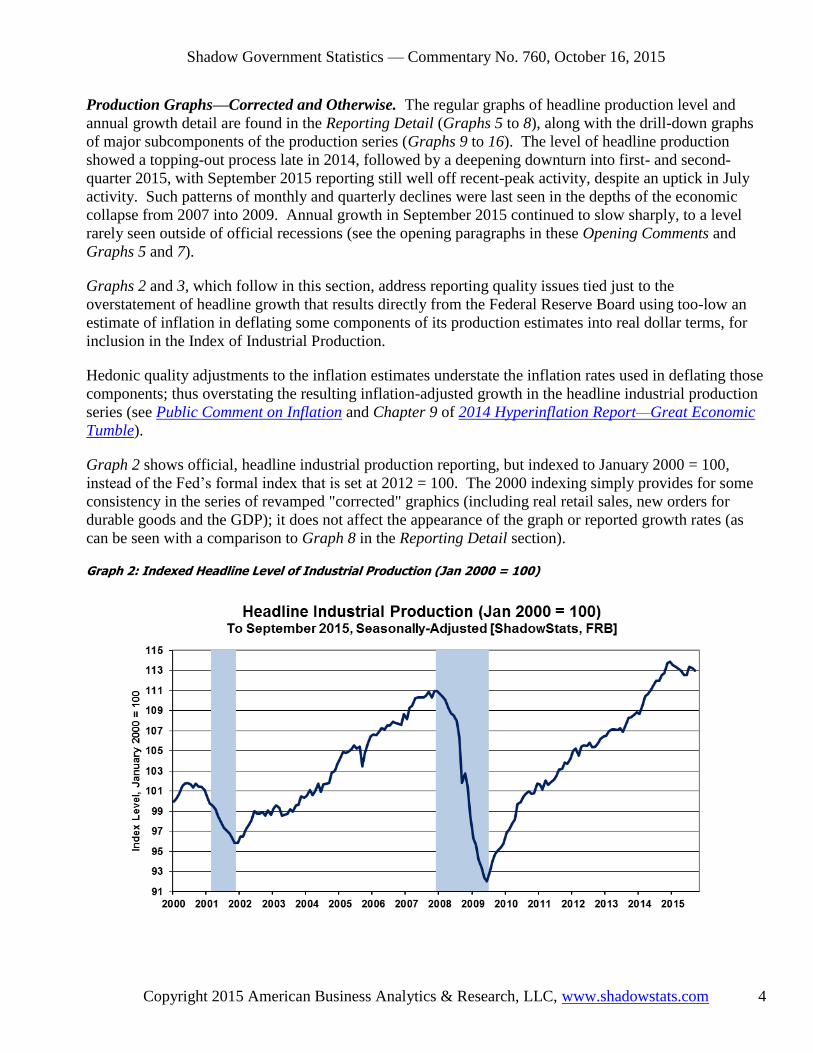
Production Graphs—Corrected and Otherwise. The regular graphs of headline production level and
annual growth detail are found in the Reporting Detail (Graphs 5 to 8), along with the drill-down graphs
of major subcomponents of the production series (Graphs 9 to 16). The level of headline production
showed a topping-out process late in 2014, followed by a deepening downturn into first- and second-
quarter 2015, with September 2015 reporting still well off recent-peak activity, despite an uptick in July
activity. Such patterns of monthly and quarterly declines were last seen in the depths of the economic
collapse from 2007 into 2009. Annual growth in September 2015 continued to slow sharply, to a level
rarely seen outside of official recessions (see the opening paragraphs in these Opening Comments and
Graphs 5 and 7).
Graphs 2 and 3, which follow in this section, address reporting quality issues tied just to the
overstatement of headline growth that results directly from the Federal Reserve Board using too-low an
estimate of inflation in deflating some components of its production estimates into real dollar terms, for
inclusion in the Index of Industrial Production.
Hedonic quality adjustments to the inflation estimates understate the inflation rates used in deflating those
components; thus overstating the resulting inflation-adjusted growth in the headline industrial production
series (see Public Comment on Inflation and Chapter 9 of 2014 Hyperinflation Report—Great Economic
Tumble).
Graph 2 shows official, headline industrial production reporting, but indexed to January 2000 = 100,
instead of the Fed’s formal index that is set at 2012 = 100. The 2000 indexing simply provides for some
consistency in the series of revamped "corrected" graphics (including real retail sales, new orders for
durable goods and the GDP); it does not affect the appearance of the graph or reported growth rates (as
can be seen with a comparison to Graph 8 in the Reporting Detail section).
Graph 2: Indexed Headline Level of Industrial Production (Jan 2000 = 100)

Shadow Government Statistics — Commentary No. 760, October 16, 2015
Copyright 2015 American Business Analytics & Research, LLC, www.shadowstats.com 5
Graph 3: Headline ShadowStats-Corrected Level of Industrial Production (Jan 2000 = 100)
Graph 3 is a recast version of Graph 2, corrected for the estimated understatement of the inflation used in
deflating certain components of the production index. Estimated hedonic-inflation adjustments have been
backed-out of the official industrial-production deflators used for headline reporting.
This "corrected" Graph 3 shows some growth in the period subsequent to the official June 2009 trough in
production activity, however, that upturn has been far shy of the full recovery and the renewed expansion
reported in official GDP estimation (see Commentary No. 755). Unlike the headline industrial production
data and the headline GDP numbers, corrected production levels have not recovered pre-recession highs.
Instead, corrected production entered a period of protracted low-level, but up-trending, stagnation in
2010, with irregular quarterly contractions seen through 2014, and an irregular uptrend into 2014, a
topping-out in late-2014 and turning down into the first two quarters of 2015. Where the corrected series
has remained well shy of a formal recovery, both the official and corrected series suffered an outright
contraction in both first- and second-quarter 2015; this a pattern of severe economic weakness last seen
during the economic collapse. Despite an initial uptick in July production, third-quarter 2015 growth
flattened out along with headline monthly declines in August and September.
Consumer Conditions Update—Early-October Consumer Sentiment. Discussed in Commentary No.
758, among other factors hurting economic activity, U.S. consumers remain constrained by currently
intractable liquidity woes. Without real growth in income, and without the ability and/or willingness to
offset declining purchasing power with debt expansion, the consumer lacks the ability to fuel traditional,
consumption-based growth or recovery in U.S. economic activity, including retail sales, personal
consumption, residential real estate and related construction activity. With a significant portion of

Shadow Government Statistics — Commentary No. 760, October 16, 2015
Copyright 2015 American Business Analytics & Research, LLC, www.shadowstats.com 6
consumers under financial stress, there has been no basis for a sustainable economic expansion since the
Panic of 2008, and there are no prospects for a recovery in the near future.
Updating the graphs of consumer conditions included in Commentary No. 758, Graph 4 here reflects this
morning's (October 16th) release by the University of Michigan of its early-estimate of October 2015
Consumer Sentiment. Although the index jumped in early-October, sentiment continued to plunge on a
three-month moving-average basis.
Graph 4: Consumer Sentiment (University of Michigan), through Early-October 2015
The Sentiment measure here is shown re-indexed to January 2000 =100 (published with an index set to
January 1966 =100). The re-indexing solely is for comparative purposes with the also re-indexed
Conference Board's Consumer Confidence measure, which will not be updated for October until October
27th. Indexing, or re-indexing of a series does not affect in any way the relative patterns of change or
levels of activity, or the appearance of the various series.
The confidence and sentiment series tend to mimic the tone of headline economic reporting in the press,
and often are highly volatile month-to-month, as a result. With increasingly-negative, headline financial
and economic reporting and circumstances at hand and ahead, successive negative hits to both the
confidence and sentiment readings remain highly likely in the months ahead.
[The Reporting Detail section includes expanded graphs and information on Industrial Production.]
__________
Shadow Government Statistics — Commentary No. 760, October 16, 2015
Copyright 2015 American Business Analytics & Research, LLC, www.shadowstats.com 7
HYPERINFLATION WATCH
HYPERINFLATION OUTLOOK SUMMARY
Broad Outlook Is Unchanged: Economy Remains in Downturn; Questions Mount on Systemic
Stability; Dollar Faces Massive Decline with Ongoing Implications for Hyperinflation. This
Summary has not been changed since Commentary No. 754 of September 24th, other than for updated
internal references or links and for minor language corrections.
Background Documents to this Summary. Underlying this Summary are No. 742 Special Commentary:
A World Increasingly Out of Balance of August 10th, and No. 692 Special Commentary: 2015 - A World
Out of Balance of February 2, 2015, which updated the Hyperinflation 2014 reports and the broad
economic outlook. Previously, the long-standing hyperinflation and economic outlooks were updated
with the publication of 2014 Hyperinflation Report—The End Game Begins – First Installment Revised,
on April 2, 2014, and publication of 2014 Hyperinflation Report—Great Economic Tumble – Second
Installment, on April 8, 2014. The two 2014 Hyperinflation Report installments, however, remain the
primary background material for the hyperinflation and economic analyses and forecasts. In terms of
underlying economic reality, one other reference is the Public Commentary on Inflation Measurement.
The regular Commentaries also update elements of the general outlook, as circumstances develop.
Primary Summary. The U.S. economy remains in ongoing downturn, while the U.S. dollar still faces a
massive decline in the wake of an extraordinary rally seen since June 2014, and in the context of a
renewed economic downturn, ongoing domestic fiscal imbalances and ongoing financial-system
instabilities. Financial-system concerns likely are the primary reason behind the inability or
unwillingness of the Federal Reserve's Federal Open Market Committee (FOMC) to raise interest rates.
Those factors have implications for a meaningful upturn in domestic inflation, eventually evolving into a
great hyperinflationary crisis.
Indeed, symptomatic of a financial system in serious distress, the FOMC remains unable or unwilling to
move decisively on raising interest rates, to move the financial system towards monetary normalcy.
Continued inaction or waffling by the Fed has begun to shift the focus and concerns of domestic and
global investors away from what appears increasingly to be perpetual moribund economic activity into the
areas of systemic instabilities, prospective or otherwise, that are so troubling to the U.S. central bank (see
Commentary No. 750 and Commentary No. 754). Fed policy inaction, if anything, has exacerbated the
long-term economic stagnation and renewed business downturn, where the quantitative easings always
were intended as covert bailouts for the banking system, under the political cover of a weak economy (see
for example, the Monetary Conditions section of Commentary No. 756).
Current fiscal conditions show the effective long-term insolvency of the U.S. government, a circumstance
that usually would be met by eventual, unfettered monetization of the national debt and obligations,

Shadow Government Statistics — Commentary No. 760, October 16, 2015
Copyright 2015 American Business Analytics & Research, LLC, www.shadowstats.com 8
leading to a hyperinflation. As first estimated by ShadowStats in 2004, such hyperinflation appeared
likely by 2020. That time horizon for the hyperinflation forecast was moved to 2014, because of the 2008
Panic, the near-collapse of the financial system, and official (U.S. government and Federal Reserve)
responses to same. That hyperinflation forecast remains in place, but it has been adjusted into 2015 or
2016, as discussed in No. 742 and No. 692.
The basic story of how and why this fiscal, financial and economic crisis has unfolded and developed over
the years—particularly in the last decade—is found in the Opening Comments and Overview and
Executive Summary of the 2014 Hyperinflation Report—The End Game Begins—First Installment
Revised.
Dollar Circumstance. Discussed in the background documents, the U.S. dollar rallied sharply from mid-
2014 into early-2015, and despite some fluttering, into August and September, there has been some easing
of the dollar's strength in October (see Commentary No. 759). Initially, the rally reflected likely covert
financial sanctions and oil-price manipulations by the United States, aimed at creating financial stresses
for Russia, in the context of the Ukraine situation. Relative U.S. economic strength, and the relative
virtuousness of Fed monetary policy versus major U.S. trading partners, were heavily picked-up on and
over-estimated by global markets looking to support the dollar.
The still unfolding, weakening domestic-economic circumstance in 2015, in confluence with other
fundamental issues, had begun to raise doubts, and more recently to confirm fears in the markets as to the
sustainability of the purported U.S. economic recovery, and as to the imminence of meaningful monetary
tightening by the U.S. Federal Reserve. As a result, the U.S. dollar briefly backed off its highs, with some
related upside pressure having been seen on oil prices. Pressures reversed recently, spiking the U.S.
dollar—also hitting oil prices anew—with false domestic economic strength being touted by Wall Street,
and with some in the Fed indicating that interest rates would be raised in September, irrespective of
negative indications on the economy (such did not happen). Coincident, with these events, not-so-covert
central-bank actions appear to have driven the price of gold lower, also in the context of mounting global
financial-market instabilities.
The U.S. economy remains in contraction (see Commentary No. 747, Commentary No. 751 and
Commentary No. 755), with a variety of key indicators, such as industrial production, real retail sales and
revenues of the S&P 500 companies continuing to show recession. Although formal recognition could
take months, consensus recognition of a "new" recession should gain relatively rapidly, in tandem with a
variety of monthly, quarterly and annual data reflecting the downturn in business activity. When formal
recognition comes, timing of the onset of the recession likely will be December 2014.
As market expectations move towards an imminent, new recession, such not only should reduce
expectations for a significant tightening in Fed policy, but also should renew expectations for a more-
accommodative or newly-accommodative Fed. While such could help to fuel further stock-market mania,
any resulting rallies in equity prices should be more than offset in real terms, by percentage declines in the
exchange-rate value of the U.S. dollar or in the eventual increases in headline consumer inflation.
Faltering expectations on the direction of domestic economic activity, also would place mounting and
eventually massive selling pressure on the U.S. dollar, as well as potentially resurrect elements of the
Panic of 2008. Physical gold and silver, and holding assets outside the U.S. dollar, remain the ultimate
primary hedges against an eventual total loss of U.S. dollar purchasing power. These circumstances
Shadow Government Statistics — Commentary No. 760, October 16, 2015
Copyright 2015 American Business Analytics & Research, LLC, www.shadowstats.com 9
should unwind what has been the sharp and generally ongoing rally in the U.S. dollar's exchange rate
since mid-2014, and the broadly-related selling pressures seen in the gold and silver markets. Further, oil
prices should spike anew, along with a sharp reversal in the dollar's strength.
A crash back to recognition of more-realistic domestic-economic circumstances looms, possibly in the
weeks and certainly in the months ahead. It should be accompanied by a crash in the U.S. dollar versus
major currencies, such as the Swiss franc, Canadian dollar and Australian dollar (currencies with some
perceived ties to gold); and related rallies in precious metals and oil. Further, a sharp deterioration in the
near-term outlook for domestic and global political stability continues and is of meaningful risk for
fueling further heavy selling of the dollar. Once in heavy downturn, the dollar's gains since June 2014
should reverse fully, pushing the exchange-rate value of the dollar to new historic lows. Again, the
nascent currency crisis also has meaningful potential to resurrect elements of the Panic of 2008.
Unexpected economic weakness intensifies stresses on an already-impaired banking system, increasing
the perceived need for expanded, not reduced, quantitative easing. The highly touted "tapering" by the
FOMC ran its course. Future, more-constructive Fed behavior—moving towards normal monetary
conditions in what had been an unfolding, purportedly near-perfect economic environment—was pre-
conditioned by a continued flow of "happy" economic news. Fed tightening likely is not now on the
horizon until after the 2016 presidential election. Suggestions that all was right again with world were
nonsense. The Fed's games likely now will be played out as far as possible, with hopes, once again, of
avoiding a financial-system collapse.
Inaction by the FOMC on September 17th was telling. The Panic of 2008 never was resolved, and the
Fed increasingly has found that it has no easy escape from its quantitative easing (QE3), which continues;
only overt expansion of QE3 ceased. If the Fed does not act quickly to extricate itself from prior actions,
QE4 will become the near-term question. Again, despite loud promises now of higher rates before year-
end or next year, banking-system issues (not the economy) may keep the "pending" interest rate hike in a
continual state of suspension. The economy certainly will supply continuing political cover for the Fed's
"inaction," with the U.S. central bank having lost control of the system.
Unexpected economic weakness—a renewed downturn—also savages prospective federal budget deficit
prognostications (particularly the 10-year versions). Such throws off estimates of U.S. Treasury funding
needs and estimates as to how long the Treasury effectively can dodge the limits of the recently re-
imposed debt ceiling. Current fiscal "good news" remains from cash-based, not GAAP-based accounting
projections and is heavily impacted by changes in business activity.
The economy has not recovered; the banking system is far from stable and solvent; and the Federal
Reserve and the federal government still have no way out. Significant banking-system and other systemic
(i.e. U.S. Treasury) liquidity needs will be provided, as needed, by the Fed, under the ongoing political
cover of a weakening economy—a renewed, deepening contraction in business activity. The Fed has no
choice. Systemic collapse is not an option for the Board of Governors. This circumstance simply does
not have a happy solution.
Accordingly, any significant, renewed market speculation in the near future, as to an added round of
Federal Reserve quantitative easing, QE4, may become a major factor behind crashing the dollar and
boosting the price of gold. The Fed has strung out its options for propping up the system as much as it
thought it could, with continual, negative impact on the U.S. economy. The easings to date, however,
Shadow Government Statistics — Commentary No. 760, October 16, 2015
Copyright 2015 American Business Analytics & Research, LLC, www.shadowstats.com 10
appear to have been largely a prop to banking system and to the increasingly unstable equity markets.
While higher domestic interest rates would tend to act as a dollar prop, a hike in rates also could crash the
stock market, as some on Wall Street fear, triggering a round of other systemic problems. Again, there is
no happy way out of this for the Fed.
The fundamental problems threatening the U.S. dollar could not be worse. The broad outlook has not
changed; it is just a matter of market perceptions shifting anew, increasingly against the U.S. currency.
That process likely will become dominated by deteriorating global perceptions of stability in U.S.
economic activity and political system, and the ability of the Federal Reserve to control its monetary
policy. Key issues include, but are not limited to:
A severely damaged U.S. economy, which never recovered post-2008, is turning down anew,
with no potential for recovery in the near-term. The circumstance includes a renewed widening
in the trade deficit and contracting production, as well as ongoing severe, structural-liquidity
constraints on the consumer, which are preventing a normal economic rebound in the traditional,
personal-consumption-driven U.S. economy (see Commentary No. 758, and the reporting of
September real earnings in Commentary No. 759). Sharply-negative economic reporting shocks,
versus softening consensus forecasts, remain a heavily-favored, proximal trigger for intensifying
the pending dollar debacle (see Opening Comments of No. 756).
U.S. government unwillingness to address its long-term solvency issues. Those controlling the
U.S. government have demonstrated not only a lack of willingness to address long-term U.S.
solvency issues, but also the current political impossibility of doing so. The shift in control of
Congress did not alter the systemic unwillingness to address underlying fundamental issues,
specifically to bring the GAAP-based deficit into balance. Any current fiscal "good news" comes
from cash-based, not GAAP-based accounting projections. The GAAP-based version continues to
run around $5 trillion for the annual shortfall, with total net obligations of the U.S. government
pushing $100 trillion, including the net present value of unfunded liabilities. Still, many in
Washington look to continue increasing spending and to take on new, unfunded liabilities. This
circumstance now operates in the context of the formal constraint of a renewed debt ceiling that is
within a month of being in crisis (see Opening Comments of No. 756).
Monetary malfeasance by the Federal Reserve, as seen in central bank efforts to provide
liquidity to a troubled banking system, and also to the U.S. Treasury. Despite the end of the
Federal Reserve's formal asset purchases, the U.S. central bank monetized 78% of the U.S.
Treasury's fiscal-2014 cash-based deficit (see Commentary No. 672). The quantitative easing QE3
asset purchase program effectively monetized 66% of the total net issuance of federal debt to be
held by the public during the productive life of the program (beginning with the January 2013
expansion of QE3). The 2014 monetization process was completed with the Federal Reserve
refunding the interest income it earned on the Treasury securities to the U.S. Treasury, but more of
that lies ahead. If the Fed does not move soon to boost interest rates, it may be trapped in a
renewed expansion of quantitative easing, given ongoing banking-system stresses, vulnerable
stock markets and weakening, actual U.S. economic activity. As has been commonplace, the Fed
likely would seek political cover for any new or expanded systemic accommodation in the
intensifying economic distress.

Shadow Government Statistics — Commentary No. 760, October 16, 2015
Copyright 2015 American Business Analytics & Research, LLC, www.shadowstats.com 11
Mounting domestic and global crises of confidence in a dysfunctional U.S. government. The
positive rating by the public of the U.S. President tends to be an indicative measure of this
circumstance, usually with a meaningful correlation with the foreign-exchange-rate strength of the
U.S. dollar. The weaker the rating, the weaker tends to be the U.S. dollar. The positive rating for
the President is off its historic low, but still at levels that traditionally are traumatic for the dollar.
Chances of a meaningful shift towards constructive cooperation between the White House and the
new Congress in addressing fundamental fiscal and economic issues remain nil. Issues such as
non-recovered, faltering economic activity, the consumer liquidity crisis and the nation's long-
range solvency issues should continue to devolve into extreme political crises.
Mounting global political pressures contrary to U.S. interests. Downside pressures on the U.S.
currency generally are intensifying, or sitting in place, in the context of global political and
military developments contrary to U.S. strategic, financial and economic interests. Current
conditions include the ongoing situation versus Russia and extraordinarily-volatile circumstances
in the Middle East. U.S. response to Russian activity in the Ukrainian situation likely was behind
part of the recent strength in the U.S. dollar and related weakness in oil prices, with U.S. actions
aimed at causing financial distress for Russia. These situations have yet to run their full courses,
and they have the potential for rapid and massive negative impact on the financial and currency
markets.
Spreading global efforts to dislodge the U.S. dollar from its primary reserve-currency status. Active efforts or comments against the U.S. dollar continue to expand. In particular, anti-dollar
rhetoric and actions have been seen with Russia, China, France, India and Iran, along with some
regular rumblings in OPEC and elsewhere. Temporary, recent dollar strength may have bought
some time versus those who have to hold dollars for various reasons. Nonetheless, developing
short-term global financial instabilities and a quick, significant reversal in the dollar's strength
should intensify the "dump-the-dollar" rhetoric rapidly. Consider that China has been selling
some of its U.S. Treasury debt holdings to raise cash in for its near-term financial needs. Again,
much of the rest of the world also has been backing away from holding U.S. treasury securities.
Slack demand for U.S. Treasuries always can be taken up by the Federal Reserve's renewed
monetization of the debt.
When the selling pressure breaks massively against the U.S. currency, the renewed and intensifying
weakness in the dollar will place upside pressure on oil prices and other commodities, boosting domestic
inflation and inflation fears. Domestic willingness to hold U.S. dollars will tend to move in parallel with
global willingness, or lack of willingness, to do the same. These circumstances will trigger the early
stages of a hyperinflation, still likely in the year ahead.
Both the renewed dollar weakness and the resulting inflation spike should boost the prices of gold and
silver, where physical holding of those key precious metals remains the ultimate hedge against the
pending inflation and financial crises. Investors need to preserve the purchasing power and liquidity of
their wealth and assets during the hyperinflation crisis ahead. See Chapter 10, 2014 Hyperinflation
Report—Great Economic Tumble for detailed discussion on approaches to handing the hyperinflation
crisis and No. 742, for other factors afoot in the current environment.
__________
Shadow Government Statistics — Commentary No. 760, October 16, 2015
Copyright 2015 American Business Analytics & Research, LLC, www.shadowstats.com 12
REPORTING DETAIL
INDEX OF INDUSTRIAL PRODUCTION (September 2015)
Deteriorating Annual Growth Fell Well into Recession Territory. With headline September and
third-quarter 2015 industrial production reporting in place, the production series continued to show a
deteriorating economy, a deepening and intensifying recession. Monthly and annual activity patterns
continued to deteriorate in a manner last seen coming into the economic collapse. Shown in the Opening
Comments, annual growth in production has fallen to a low level rarely seen other than at the onset of
formal recessions.
Faltering Quarterly and Annual Growth. First-quarter 2015 production contracted at an unrevised
annualized quarterly pace of 0.35% (-0.35%), followed by a revised second-quarter 2015 contraction of
2.36% (-2.36%) [previously down by 2.61% (-2.61%), 2.04% (-2.04%) and initially by 1.75% (-1.75%)].
Based on initial full reporting for third-quarter 2015, annualized third-quarter growth was 1.85%
[previously estimated at 2.14% based on July and August reporting, initially at 2.13% based on July
reporting].
That said, although headline third-quarter activity was spiked relative to second-quarter 2015, by a one-
time, extreme surge in headline July automobile production, the level of aggregate third-quarter 2015
production remained below the headline activity in both fourth-quarter 2014 and first-quarter 2015.
Separately, year-to-year growth in quarterly production continued to decline, from 4.47% in fourth-
quarter 2014, to 3.47% in first-quarter 2015, to 1.44% in second-quarter 2015, to a post-economic
collapse low of 0.93% in third-quarter 2015. Such a pattern of declining annual growth has not been seen
since first-quarter 2008, the official onset the economic collapse.
The Fed's industrial production series indicates that broad economic activity has entered a "new"
recession, which likely will be timed officially from December of 2014.
Headline Industrial Production—September 2015. The Federal Reserve Board released its first estimate
of seasonally-adjusted, September 2015 industrial production this morning, Friday, October 16th. In the
context of an upside revision to August 2015, headline monthly production declined in September 2015
by 0.19% (-0.19%), following a revised, narrowed decline in August of 0.15% (-0.15%) [previously down
by 0.38% (-0.38%)], a downwardly-revised gain of 0.76% [previously up by 0.87% and initially up by
0.56%] in July, and a revised decline of 0.03% (-0.03%) [previously "unchanged" at 0.00%, up by 0.09%
and initially up by 0.23%] in June. Net of prior-period revisions, the headline monthly September 2015
change would have been a gain of 0.01%, instead of the headline decline of 0.19% (-0.19%).
Shadow Government Statistics — Commentary No. 760, October 16, 2015
Copyright 2015 American Business Analytics & Research, LLC, www.shadowstats.com 13
Detailed in Graphs 9 to 11 of major industry groups, the headline September 2015 monthly aggregate
production loss of 0.2% (-0.2%) [an August contraction of 0.1% (-0.1%)] was composed of a decline of
0.1% (-0.1%) in September manufacturing activity [an August decline of 0.4% (-0.4%)]; a September
decline in mining (including oil and gas production) of 2.0% (-2.0%) [August unchanged at 0.0%]; and a
September gain of 1.3% in utilities [August gain of 1.3%]. The upside revisions to August activity
generally came in the areas of mining and utilities.
Year-to-year September 2015 production growth fell to 0.39%, from an upwardly-revised 1.11%
[previously 0.91%] annual gain in August 2015, a downwardly-revised 1.29% [previously 1.33%, initially
1.32%] gain in July 2015, and an upwardly-revised 0.87% [previously 0.80%, 1.10% and initially 1.32%]
gain in June 2015. Again, annual growth has fallen to low levels seen at the onset of formal recessions.
Production Graphs. The regular two sets of long- and short-term industrial production levels and annual
growth rates (Graphs 5 to 8) set the background for the drill-down detail graphs of various components of
the aggregate industrial series (Graphs 9 to 16).
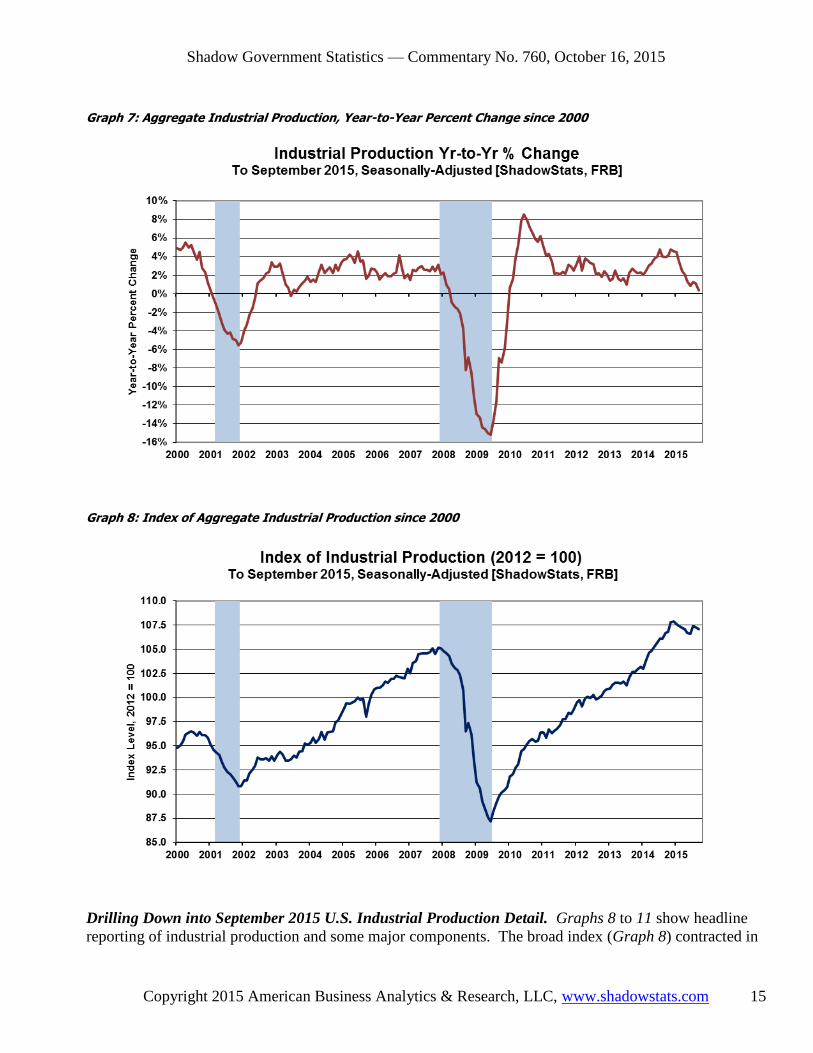
Graphs 5 and 6, and Graphs 7 and 8 show headline industrial production activity to date. Graph 5 shows
the year-to-year percent change in the aggregate industrial production series, in historical context since
World War II. With annual growth in production now well below 1.0%, the pattern again is one rarely
seen outside of the onset of a formal recession.
Graph 6 shows the monthly level of the production index, with a topping-out and renewed downturn—
deepening quarterly contractions in first- and second-quarter 2015—with a small bounce in July turning
lower again in August and September 2015. Such patterns of monthly and quarterly decline and
stagnation were seen last at the onset of the headline economic collapse from 2007 into 2009. Graphs 7
and 8 show same series for more-limited, recent historical detail, beginning January 2000.
Seen more clearly in the second set of graphs, the pattern of year-to-year activity dipped anew in 2013,
again, to levels usually seen at the onset of recent recessions, bounced higher into mid-2014, fluctuated
thereafter and has headed generally lower since. Annual growth remains well off the recent relative peak
for the series, which was 8.56% in June 2010, going against the official June 2009 trough of the economic
collapse. Indeed, as shown in the first set of graphs, the benchmark-revised year-to-year contraction of
15.20% (-15.20%) in June 2009—the end of second-quarter 2009—was the steepest annual decline in
production since the shutdown of war-time production following World War II.
Although official production levels have moved higher since the June 2009 trough, corrected for the
understatement of inflation used in deflating portions of the industrial production index (see the Opening
Comments section, Graph 3) the series has shown more of a pattern of stagnation with a slow upside
trend, since 2009, with irregular quarterly contractions interspersed. The slow uptrend continued into a
topping out pattern in late-2014. Headline real growth contracted in both first- and second-quarter 2015,
with monthly activity trending lower again. The "corrected" series has done the same but remains well
shy of a formal recovery.

Shadow Government Statistics — Commentary No. 760, October 16, 2015
Copyright 2015 American Business Analytics & Research, LLC, www.shadowstats.com 14
Graph 5: Industrial Production, Year-to-Year Percent Change since 1945
Graph 6: Index of Industrial Production (Aggregate) since 1945
Shadow Government Statistics — Commentary No. 760, October 16, 2015
Copyright 2015 American Business Analytics & Research, LLC, www.shadowstats.com 15
Graph 7: Aggregate Industrial Production, Year-to-Year Percent Change since 2000
Graph 8: Index of Aggregate Industrial Production since 2000
Drilling Down into September 2015 U.S. Industrial Production Detail. Graphs 8 to 11 show headline
reporting of industrial production and some major components. The broad index (Graph 8) contracted in
Shadow Government Statistics — Commentary No. 760, October 16, 2015
Copyright 2015 American Business Analytics & Research, LLC, www.shadowstats.com 16
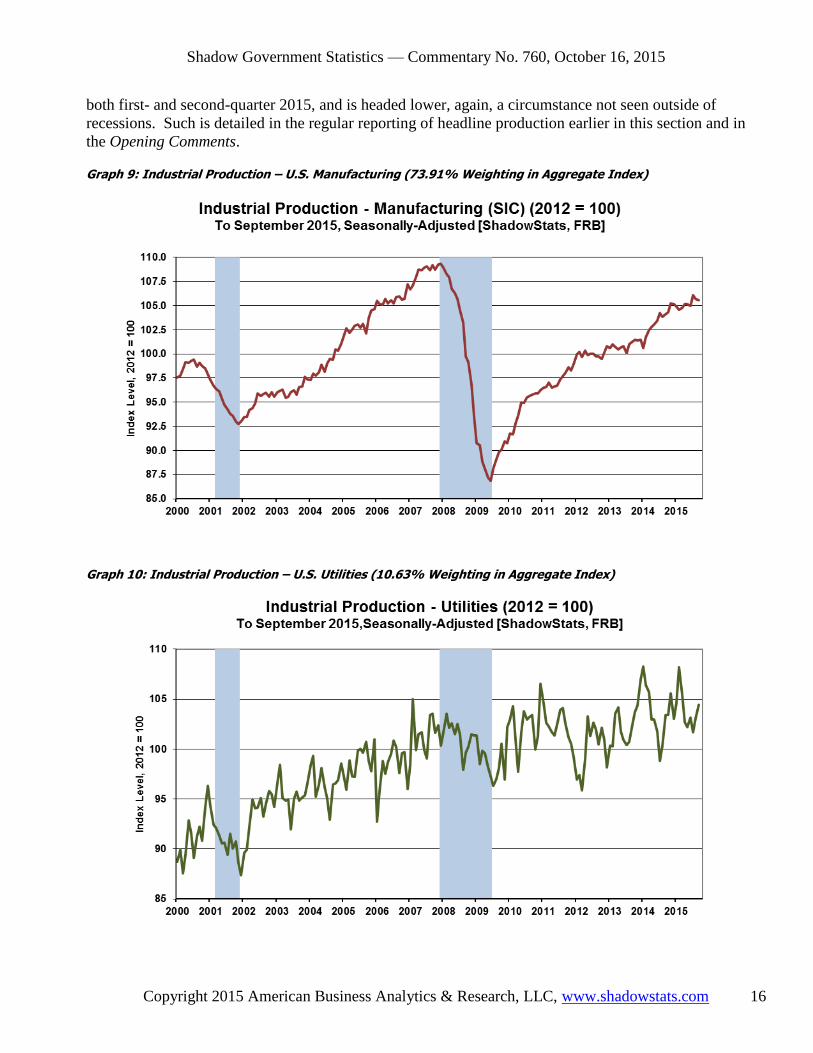
both first- and second-quarter 2015, and is headed lower, again, a circumstance not seen outside of
recessions. Such is detailed in the regular reporting of headline production earlier in this section and in
the Opening Comments.
Graph 9: Industrial Production – U.S. Manufacturing (73.91% Weighting in Aggregate Index)
Graph 10: Industrial Production – U.S. Utilities (10.63% Weighting in Aggregate Index)
Shadow Government Statistics — Commentary No. 760, October 16, 2015
Copyright 2015 American Business Analytics & Research, LLC, www.shadowstats.com 17
Graph 9 of the dominant manufacturing sector (73.91%) of aggregate production shows current, declining
month-to-month activity, in the context of series that has yet to reclaim its pre-recession high.
The utilities sector activity (Graph 10), which accounts for 10.63% of aggregate activity, by weighting,
rebounded further in September, but much of the heavy volatility in month-to-month activity reflects the
temporary impact of "unseasonable" extremes in weather patterns.
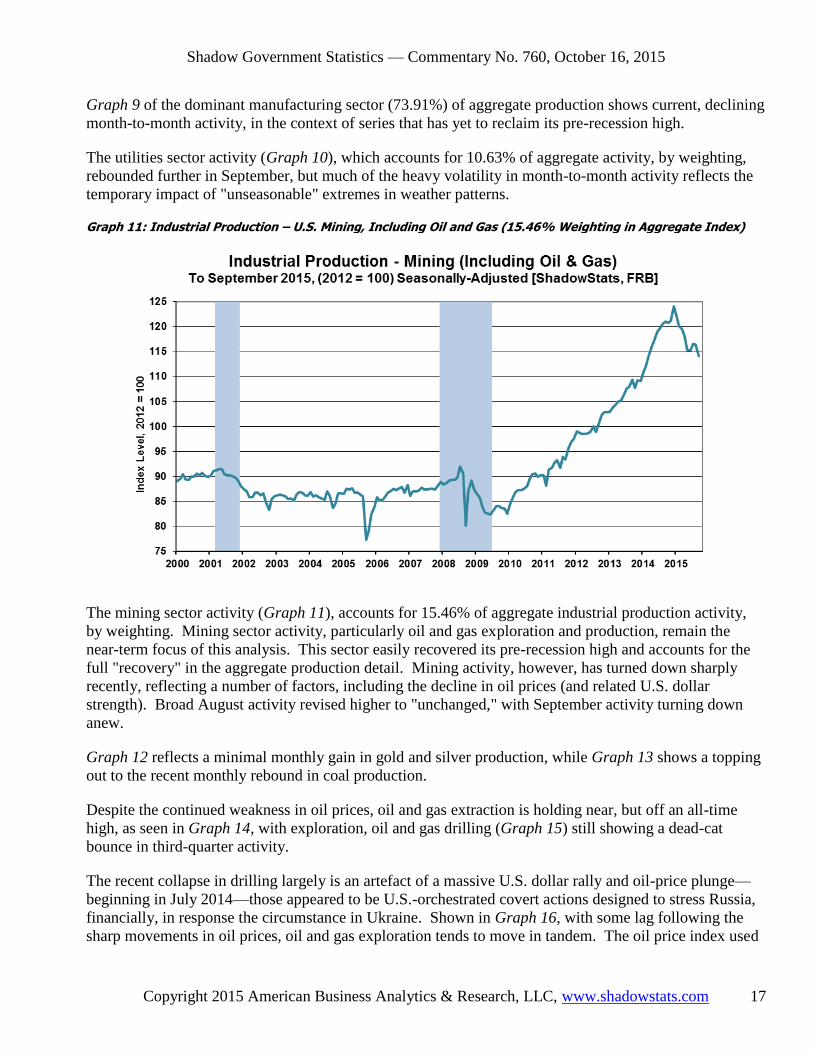
Graph 11: Industrial Production – U.S. Mining, Including Oil and Gas (15.46% Weighting in Aggregate Index)
The mining sector activity (Graph 11), accounts for 15.46% of aggregate industrial production activity,
by weighting. Mining sector activity, particularly oil and gas exploration and production, remain the
near-term focus of this analysis. This sector easily recovered its pre-recession high and accounts for the
full "recovery" in the aggregate production detail. Mining activity, however, has turned down sharply
recently, reflecting a number of factors, including the decline in oil prices (and related U.S. dollar
strength). Broad August activity revised higher to "unchanged," with September activity turning down
anew.
Graph 12 reflects a minimal monthly gain in gold and silver production, while Graph 13 shows a topping
out to the recent monthly rebound in coal production.
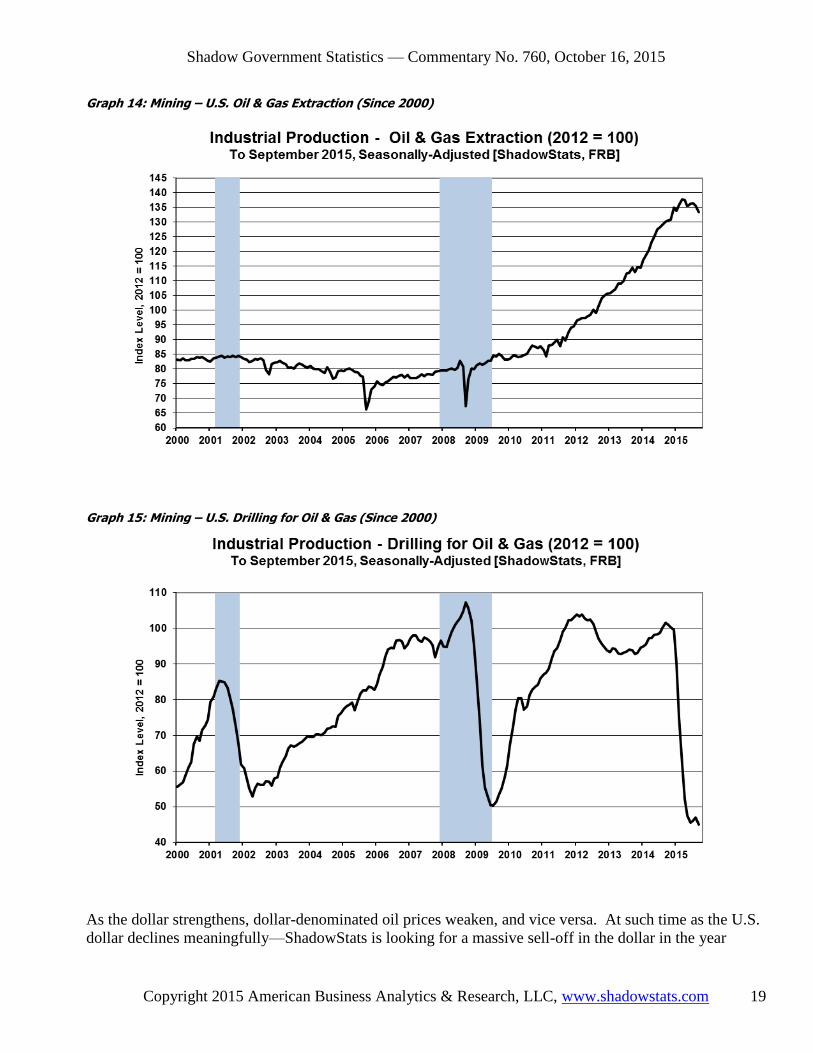
Despite the continued weakness in oil prices, oil and gas extraction is holding near, but off an all-time
high, as seen in Graph 14, with exploration, oil and gas drilling (Graph 15) still showing a dead-cat
bounce in third-quarter activity.
The recent collapse in drilling largely is an artefact of a massive U.S. dollar rally and oil-price plunge—
beginning in July 2014—those appeared to be U.S.-orchestrated covert actions designed to stress Russia,
financially, in response the circumstance in Ukraine. Shown in Graph 16, with some lag following the
sharp movements in oil prices, oil and gas exploration tends to move in tandem. The oil price index used

Shadow Government Statistics — Commentary No. 760, October 16, 2015
Copyright 2015 American Business Analytics & Research, LLC, www.shadowstats.com 18
is for the West Texas Intermediate (WTI) monthly average spot price, deflated using the ShadowStats
Alternate CPI measure (based on 1990 methodologies).
Graph 12: Mining – Gold and Silver Mining (Since 2000)
Graph 13: Mining - Coal Mining (Since 2000)
Shadow Government Statistics — Commentary No. 760, October 16, 2015
Copyright 2015 American Business Analytics & Research, LLC, www.shadowstats.com 19
Graph 14: Mining – U.S. Oil & Gas Extraction (Since 2000)
Graph 15: Mining – U.S. Drilling for Oil & Gas (Since 2000)
As the dollar strengthens, dollar-denominated oil prices weaken, and vice versa. At such time as the U.S.
dollar declines meaningfully—ShadowStats is looking for a massive sell-off in the dollar in the year

Shadow Government Statistics — Commentary No. 760, October 16, 2015
Copyright 2015 American Business Analytics & Research, LLC, www.shadowstats.com 20
ahead (again, see No. 742, and the Gold Graphs section of Commentary No. 759)—oil prices will rally
anew, along with surging gold and silver prices.
Graph 16: Mining – U.S. Drilling for Oil & Gas versus Real Oil Prices (WTI ShadowStats 1990 Base)
__________
WEEK AHEAD
Economic Reporting Generally Should Trend Much Weaker than Expected; Inflation Will Rise
Anew, Along with a Renewed Rebound in Oil Prices. Still in a fluctuating trend to the downside,
amidst mixed reporting in headline data, market expectations for business activity nonetheless tend to
move with the latest economic hype in the popular media. That general effect holds the consensus
outlook at overly-optimistic levels, with current expectations still exceeding any potential, underlying
economic reality. Again, the expectations trend generally has continued to soften, albeit at an accelerating
pace.

Shadow Government Statistics — Commentary No. 760, October 16, 2015
Copyright 2015 American Business Analytics & Research, LLC, www.shadowstats.com 21
Headline reporting of the regular monthly economic numbers increasingly should continue turning lower
in the weeks and months ahead, along with likely downside or otherwise much weaker-than-expected
reporting for at least the next several quarters of GDP (and GDI and GNP) into 2016.
CPI-U consumer inflation—driven lower earlier this year by collapsing prices for gasoline and other oil-
price related commodities—likely has seen its near-term, year-to-year low. It turned positive in June
2015, for the first time in six months, notched somewhat higher in July and August, with minimal fallback
in September tied to renewed weakness in gasoline prices. Gasoline prices appear to be bottoming out
again, with a combination of temporarily-stable gasoline prices and related, positive seasonal adjustments
likely to spike headline October 2015 CPI-U.
Meaningful upside inflation pressures should mount anew, once oil prices begin to rebound. Again, that
process eventually should accelerate, along with a pending sharp downturn in the exchange-rate value of
the U.S. dollar. Those areas, the general economic outlook and longer range reporting trends were
reviewed broadly, recently, in No. 742 Special Commentary: A World Increasingly Out of Balance, No.
692 Special Commentary: 2015 - A World Out of Balance and are covered in the Hyperinflation Outlook
Summary.
A Note on Reporting-Quality Issues and Systemic-Reporting Biases. Significant reporting-quality
problems remain with most major economic series. Beyond the pre-announced gimmicked changes to
reporting methodologies of the last several decades, which have tended to understate actual inflation and
to overstate actual economic activity, ongoing headline reporting issues are tied largely to systemic
distortions of monthly seasonal adjustments. Data instabilities—induced partially by the still-evolving
economic turmoil of the last eight-to-ten years—have been without precedent in the post-World War II
era of modern-economic reporting. The severity and ongoing nature of the downturn provide particularly
unstable headline economic results, when concurrent seasonal adjustments are used (as with retail sales,
durable goods orders, employment and unemployment data, discussed and explored in the labor-numbers
related Commentary No. 695).
Combined with recent allegations of Census Bureau falsification of data in its monthly Current Population
Survey (the source for the Bureau of Labor Statistics' Household Survey), these issues have thrown into
question the statistical-significance of the headline month-to-month reporting for many popular economic
series (see Commentary No. 669).
PENDING RELEASES:
Residential Construction—Housing Starts (September 2015). The Census Bureau will release
September 2015 residential construction detail on Tuesday, October 20th. In line with common-reporting
experience of recent years, monthly results likely will be unstable and not statistically meaningful,
holding in a general pattern of down-trending stagnation. Wherever likely positive, consensus
expectations settle, they also likely will not be statistically significant.
Irrespective of the generally meaningless headline detail, the broad pattern of housing starts should
remain consistent with the low-level, albeit slightly up-trending, stagnation, seen in the series at present,
where current activity still is down by about 50% from its pre-recession high. Such is particularly evident
Shadow Government Statistics — Commentary No. 760, October 16, 2015
Copyright 2015 American Business Analytics & Research, LLC, www.shadowstats.com 22
with the detail viewed in the context of a six-month moving average. This series also is subject to regular
and extremely-large, prior-period revisions.
As discussed in Commentary No. 660 on the August 2014 version of this most-unstable of major monthly
economic series, the monthly headline reporting detail here simply is worthless. The series best is viewed
in terms of a six-month moving average. Again, not only is month-to-month reporting volatility
frequently extreme, but also those headline monthly growth rates rarely come close to being statistically
significant.
Existing- and New-Home Sales (September 2015). September 2015 Existing-Home Sales are due for
release on Thursday, October 22nd, from the National Association of Realtors (NAR), with the September
2015 new-home sales report due from the Census Bureau on Monday, October 26th. The detail from both
series will be covered in ShadowStats regular Commentary No. 762 of October 27th.
The primary, underlying difficulty for the housing market remains intense, structural-liquidity constraints
on the consumer. That circumstance, during the last eight-plus years of economic collapse and stagnation,
has continued to prevent a normal recovery in broad U.S. business activity, as discussed fully in
Commentary No. 758, with a brief update on Consumer Sentiment in today's Opening Comments. There
remains no chance of a near-term, sustainable turnaround in the housing market, until there has been a
fundamental upturn in consumer and banking-liquidity conditions. Accordingly, prospects remain bleak
for a sustainable increase in home-sales activity.
With a longer-term flat trend in headline Existing-Home Sales, despite recent headline monthly gains,
some further downside catch-up in month-to-month activity remains a fair possibility for September 2015
reporting. Smoothed for extreme and nonsensical monthly gyrations, a continuing pattern of stagnation or
downturn in New-Home Sales also is likely. Monthly changes in activity here rarely are statistically-
significant, amidst otherwise unstable headline monthly reporting and revisions.
Again, reflecting deteriorating consumer issues, both New- and Existing-Home Sales increasingly should
continue to reflect downside volatility in headline reporting.
__________