Embed Size (px)
Citation preview

Canadian Public Policy
Comment/Commentaire: Fiscal Competitiveness and Total Competitiveness: A NoteAuthor(s): Evan MorrisSource: Canadian Public Policy / Analyse de Politiques, Vol. 34, No. 4 (Dec., 2008), pp. 511-517Published by: University of Toronto Press on behalf of Canadian Public PolicyStable URL: http://www.jstor.org/stable/25463637 .
Accessed: 15/06/2014 19:42
Your use of the JSTOR archive indicates your acceptance of the Terms & Conditions of Use, available at .http://www.jstor.org/page/info/about/policies/terms.jsp
.JSTOR is a not-for-profit service that helps scholars, researchers, and students discover, use, and build upon a wide range ofcontent in a trusted digital archive. We use information technology and tools to increase productivity and facilitate new formsof scholarship. For more information about JSTOR, please contact [email protected].
.
University of Toronto Press and Canadian Public Policy are collaborating with JSTOR to digitize, preserveand extend access to Canadian Public Policy / Analyse de Politiques.
http://www.jstor.org
This content downloaded from 91.229.229.101 on Sun, 15 Jun 2014 19:42:01 PMAll use subject to JSTOR Terms and Conditions
Comment/Commentaire
Fiscal Competitiveness and
Total Competitiveness: A Note
Evan Morris
EcoTech Research Ltd.
Regina, Saskatchewan
Mots cl?s : comp?titivit?, fiscalit?, imp?ts, investissement, industries manufacturi?res, multinationales
Keywords: competitiveness, fiscal, taxes, investment, manufacturing, multinational
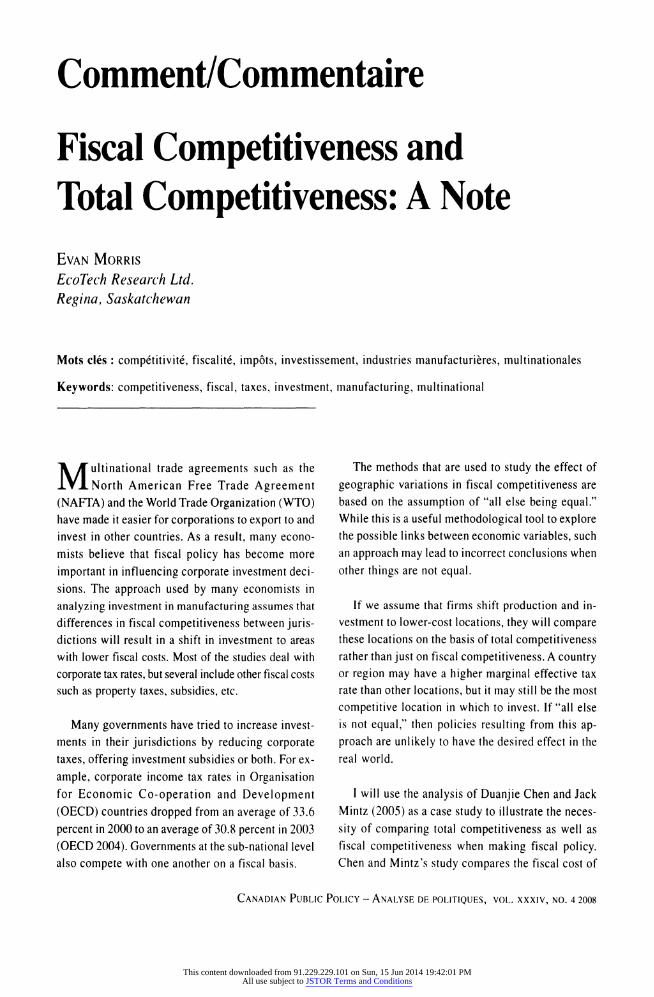
Multinational trade agreements such as the
North American Free Trade Agreement
(NAFTA) and the World Trade Organization (WTO) have made it easier for corporations to export to and
invest in other countries. As a result, many econo
mists believe that fiscal policy has become more
important in influencing corporate investment deci
sions. The approach used by many economists in
analyzing investment in manufacturing assumes that
differences in fiscal competitiveness between juris dictions will result in a shift in investment to areas
with lower fiscal costs. Most of the studies deal with
corporate tax rates, but several include other fiscal costs
such as property taxes, subsidies, etc.
Many governments have tried to increase invest
ments in their jurisdictions by reducing corporate taxes, offering investment subsidies or both. For ex
ample, corporate income tax rates in Organisation
for Economic Co-operation and Development
(OECD) countries dropped from an average of 33.6
percent in 2000 to an average of 30.8 percent in 2003
(OECD 2004). Governments at the sub-national level
also compete with one another on a fiscal basis.
The methods that are used to study the effect of
geographic variations in fiscal competitiveness are
based on the assumption of "all else being equal."
While this is a useful methodological tool to explore the possible links between economic variables, such
an approach may lead to incorrect conclusions when
other things are not equal.
If we assume that firms shift production and in
vestment to lower-cost locations, they will compare
these locations on the basis of total competitiveness rather than just on fiscal competitiveness. A country or region may have a higher marginal effective tax
rate than other locations, but it may still be the most
competitive location in which to invest. If "all else
is not equal," then policies resulting from this ap
proach are unlikely to have the desired effect in the
real world.
I will use the analysis of Duanjie Chen and Jack
Mintz (2005) as a case study to illustrate the neces
sity of comparing total competitiveness as well as
fiscal competitiveness when making fiscal policy. Chen and Mintz's study compares the fiscal cost of
Canadian Public Policy -
Analyse de politiques, vol. xxxiv, no. 4 2008
This content downloaded from 91.229.229.101 on Sun, 15 Jun 2014 19:42:01 PMAll use subject to JSTOR Terms and Conditions

512 Evan Morris
doing business in Ontario and five US states in 2003.
The authors go beyond the traditional comparison of corporate or personal income tax rates for differ
ent jurisdictions. They include corporate income
taxes, personal income taxes, capital taxes, employer
payroll taxes, and sales tax on inputs and on con
sumers. They also include subsidies and benefits that
governments provide to employers and employees, such as grants, health benefits, education of the
workforce, unemployment insurance, social security,
and workers' compensation. This makes the com
parison of fiscal costs between jurisdictions more
accurate than a simple comparison of corporate in
come tax rates.
The authors base their approach on multinational
corporations that have several plants operating in
various jurisdictions. The authors state that "a busi
ness will locate production where costs of
production are the lowest," and that if all else is
equal, the costs of production in a jurisdiction will
be higher if that jurisdiction has a higher marginal effective tax rate.
Using this approach, the authors conclude "that
fiscal policies create a disadvantage for Ontario rela
tive to other jurisdictions in the United States. The
disadvantage is quite significant. For large corpora
tions, Ontario's fiscal system results in a higher cost
of doing business by almost 25 percent..."
The authors point out than an assumption under
lying their use of the marginal fiscal cost of
production in creating recommendations is "all else
being equal." However, this is an unrealistic assump
tion. Costs of production, including new investments,
vary considerably from jurisdiction to jurisdiction. Even within Ontario there are large differences in
costs from one location to another, such as the cost
of land, property taxes, and availability of labour and
markets. It is highly unlikely that corporations will
find all these costs equal and make a production de
cision based on the marginal fiscal cost between
locations. It is more likely that they will seek to
maximize their total profit from an investment. Fis
cal costs are only one of many costs, and it may be
more profitable to invest in areas with a higher mar
ginal tax rate.
As a simple illustration, suppose that it costs $5
per unit to produce a product in location A, and $10
per unit in location B. Assume that the total amount
of taxes and subsidies is the same in both jurisdic
tions, and has a value of $1 per unit. The marginal fiscal cost (as defined by the authors) in location A
is $l/$6, or 0.17, while in location B it is $1/$11, or
0.09. While location B has a much lower marginal fiscal rate, the total cost of doing business in loca
tion A is $6, and in location B it is $11. For a
corporation, location A is a more attractive place to
do business, even though location B has a lower
marginal fiscal cost.
Where differences in taxes are large enough to
result in differences in overall costs, multinational
corporations may shift production from higher-taxed to lower-taxed areas, and may invest in lower-taxed
areas. When corporations calculate overall costs, they
need to determine the actual fiscal cost, not the mar
ginal fiscal cost. In order to determine which
jurisdiction is more competitive, we need to calcu
late fiscal and non-fiscal costs in dollar amounts
rather than as marginal rates.
If the measure of marginal fiscal cost is unlikely to be used by multinational corporations when
making production decisions, how useful is it as a
tool for governments when making fiscal policy? If
the costs of production are not roughly equal between
jurisdictions, a government's decision to make policy based on the marginal fiscal cost may lead to poor
policy choices. Using the previous example, the gov ernment of location A may decide it has to drop the
marginal tax rate from 0.17 to 0.09 in order to re
main competitive with location B. To do this it would
have to reduce taxes to half the present amount. Such
a reduction in taxes would have severe social conse
quences, and is completely unnecessary in this case.
Canadian Public Policy -
Analyse de politiques, vol. xxxiv, no. 4 2008
This content downloaded from 91.229.229.101 on Sun, 15 Jun 2014 19:42:01 PMAll use subject to JSTOR Terms and Conditions

Fiscal Competitiveness and Total Competitiveness: A Note 513
In fact, jurisdiction A has room to increase the tax
rate considerably and still be cost competitive with
jurisdiction B.
Chen and Mintz do not state in their paper what
the actual costs are for labour and capital in each of
the six jurisdictions. However, when I compare the
costs of production using the same data sources that
Chen and Mintz used (US Bureau of Labor Statis
tics), I find that their assumption of "all else being
equal" is not supported by the data. I will first com
pare labour costs among the various jurisdictions,
as labour costs make up almost 80 percent of busi
ness costs according to Chen and Mintz.
The data in Table 1 are based on US Bureau of Labor
statistics for May of 2003 (see Data Source #1). All
wages are reported in US currency. The mean hourly
wages exclude any employer costs for supplementary benefits. There is a 23 percent difference in average
wage rates between the lowest wage state (Georgia)
and the highest wage state (Massachusetts).
The values for the marginal fiscal cost on labour
are taken directly from Chen and Mintz's article. One
can estimate the mean hourly fiscal cost on labour
by multiplying the mean hourly wage by the mar
ginal fiscal cost. The total hourly cost of labour is
equal to the mean hourly wage plus the mean fiscal
cost. Georgia had lower total hourly costs than ei
ther Illinois or Michigan, even though Georgia has a
higher marginal fiscal burden than these states. For
the five states studied by Chen and Mintz, the dif
ferences in hourly wage costs between states was
influenced far more by the mean hourly wages than
by the marginal fiscal costs.
Chen and Mintz recommend that Ontario should
reduce taxes in order to remain fiscally competitive.
Let's see what the effects of tax cuts would be on
the cost of doing business in the five US states.
Michigan had the lowest marginal fiscal burden on
labour of 15.0 percent. If the other four states cut
their taxes to equal Michigan's rate, the total fiscal
cost of labour would drop in these states. However,
the cost rankings remain almost identical. Cutting taxes to make these states more fiscally competitive
will not change the total competitive positions of
these five states.
Is the situation any different for Ontario? The US
Bureau of Labor Statistics does not make comparisons
Table 1 Wage Costs Before and After Marginal Fiscal Burdens
(selected US jurisdictions for 2003)
State Mean Marginal Marginal Total Index Total Cost if Index
Hourly Fiscal Burden Fiscal Burden Hourly Total Hourly Marginal (Georgia= Wage on Labour on Labour Cost Costs Fiscal Burdens
(%) ($) (Georgia=100) are Identical
Georgia 16.77 Illinois 17.95
Michigan 18.32 California 19.54 Massachusetts 20.59
Source: Author's compilation.
16.0 2.68 15.4 2.76 15.0 2.75 19.6 3.83 16.7 3.44
19.45 100 20.71 106 21.07 108 23.37 120 24.03 124
19.29 100 20.64 107 21.07 109 22.47 117 23.68 123
Canadian Public Policy -
Analyse de politiques, vol. xxxiv, no. 4 2008
This content downloaded from 91.229.229.101 on Sun, 15 Jun 2014 19:42:01 PMAll use subject to JSTOR Terms and Conditions

514 Evan Morris
between US states and individual provinces. However, the Bureau has carried out an international compari son of wage rates for production workers in
manufacturing. The results for Canada and the
United States are summarized in Table 2.
Table 2 Hourly Compensation Costs for Production Workers in
Manufacturing, 2003-2005
Hourly Compensation Costs, 2003-2005
(US Dollars)
United States Canada Index
_($1_($) (US =100)
2003 22.20 19.53 88 2004 22.82 21.77 95 2005 23.65 23.82 101
Source: Data Source #4, pp. 7-8.
These compensation costs include "employer ex
penditures for legally required insurance programs and contractual and private benefit plans and other
labor taxes." According to the US Bureau of Labor
Statistics, Canadian compensation is increased to
account for other important taxes on payroll or em
ployment. Even when these extra costs are included, US hourly compensation costs were 14 percent
higher than in Canada in 2003.
Over the last 15 years, hourly manufacturing wage costs have sometimes been higher in Canada than in
the United States. Changes in the marginal fiscal
burden in Canada or the United States do not ex
plain this variation. Almost the entire variation in
labour costs can be explained by changes in the ex
change rate between the Canadian and US dollars.
This correspondence can be seen in Figure 1. There
is a very strong linear relationship between the ex
change rate and the difference in hourly pay rates
between the two countries (r2= 0.933, 1990-2005).
Figure 1 Hourly Pay Rates and Exchange Rates
(Canada and US, 1990-2005)
Canadian Pay Rate
Exchange Rate
1990 1992 1994
Source: Author's compilation.
1996 1998 2000 2002 2004
Canadian Public Policy -
Analyse de politiques, vol. xxxiv, no. a 2008
This content downloaded from 91.229.229.101 on Sun, 15 Jun 2014 19:42:01 PMAll use subject to JSTOR Terms and Conditions

Fiscal Competitiveness and Total Competitiveness: A Note 515
The above comparisons of US and Canadian wage rates in manufacturing do not take account of pro
ductivity differences between the two countries. Unit
labour cost provides a measure of cost competitive
ness that combines labour cost and productivity (Van
Ark and Monnikhof 2000). According to the US
Department of Labor, unit wage rates in the US were
higher than in Canada from 1992 to 2003. The dif
ference in unit wage costs between the two countries
was again related to exchange rates (Figure 2). Since
2003 the rise in the value of the Canadian dollar led
to almost identical unit labour costs in both coun
tries in 2004. Unit labour costs became higher in
Canada in 2005 and 2006. An analysis by Sparks, Bikoi and Moglia (2002) of US and non-US com
pensation costs in manufacturing confirms that hourly
wage costs were lower in Canada from 1993 to 2000,
and that movements in the exchange rate had a major
effect on US-Canada competitiveness.
It is safe to conclude that exchange rates have
had a far greater impact on wage competitiveness than changes in fiscal policy.
The above data only provide information on la
bour costs. Several studies have attempted to
compare a number of costs of doing business be
tween Canada and the United States. Recent studies
carried out by KPMG (2004, 2006) showed that in
2004 overall business costs were 9 percent lower in
Canada than in the United States, and in the second
half of 2005 overall business costs were 5.5 percent lower in Canada. Their 2004 study also included
costs from cities in each of the jurisdictions studied
by Chen and Mintz. Overall business costs were low
est in Toronto (Table 3).
Costs of production in 2003, both before and af
ter the inclusion of fiscal costs, were lower in Canada
Figure 2 Unit Labour Costs and Exchange Rates, 1990-2005
1990 1992
Source: Author's compilation.
1994 1996 1998 2000 2002 2004
Canadian Public Policy -
Analyse de politiques, vol. xxxiv, no. a 2008
This content downloaded from 91.229.229.101 on Sun, 15 Jun 2014 19:42:01 PMAll use subject to JSTOR Terms and Conditions

576 Evan Morris
Table 3 Overall Business Costs in Selected Cities
State/Province City
Ontario
Georgia Illinois
Michigan California Massachusetts
Toronto Atlanta
Chicago Detroit San Diego Boston
2004 Index
(Toronto=100)
2005 Index
(Toronto=100)
100 106 111 113 113 111
100 100 104 106 107 112
Source: KPMG, Competitive Alternatives Study (2004, 2006).
than in the United States. As a result, in 2003 there
was no need to cut costs, including taxes in order
for Canadian corporations to remain competitive with US producers. In fact, there was room to in
crease corporate taxes.
Reviews of the literature indicate that the impact of fiscal policy on investment is unclear. While
several studies have shown a link between taxation
rates and investment levels, many other studies show
only a weak link between the taxation rates in vari
ous jurisdictions and the level of investment in those
jurisdictions. See, for example, Iqbal (2003), Lee
(2007), and Wheeler (2005). The correlation between
taxation levels and investment in manufacturing is
particularly poor.
Several reasons have been given for this weak link
between fiscal incentives and new investments. One
explanation is that corporations select and eliminate
potential investment locations on a number of non
fiscal characteristics, such as the level of political risk,
location of natural resources, close proximity to mar
kets, and accessibility to major highways near
projected manufacturing locations. Only after these
characteristics have narrowed the field is fiscal policy a factor in the decision to invest. If these other charac
teristics are more important than fiscal policy, then
there will be a poor correlation between fiscal policy
and the level of investment. Another explanation for
the weak relationship is that many studies often deal
with only one aspect of fiscal policy, such as the level
of corporate taxes in a location or the level of incen
tives such as grants or tax holidays given to companies. The argument is made that companies will invest in
locations where the marginal fiscal burden is lowest,
and that all fiscal policies of a jurisdiction must be
accounted for when calculating the marginal fiscal cost
to a company investing in the region.
While these factors undoubtedly contribute to the
poor correlations between fiscal policies and invest
ment levels, the weak relationship between effective
tax rates and levels of investment between locations
may also be due to the fact that fiscal costs are only a small part of total production costs, and these other
production costs vary considerably from jurisdiction to jurisdiction. There may be a strong relationship between investment levels and marginal fiscal cost
when other costs are roughly equal, but only a weak
or non-existent relationship when other costs are
unequal, and are larger in magnitude than the differ
ences in fiscal costs.
In conclusion, differences in non-fiscal produc
tion costs vary widely between jurisdictions. Since
fiscal costs are much smaller than non-fiscal costs,
we need to compare total costs in order to deter
Canadian Public Policy -
Analyse de politiques, vol. xxxiv, no. a 2008
This content downloaded from 91.229.229.101 on Sun, 15 Jun 2014 19:42:01 PMAll use subject to JSTOR Terms and Conditions

Fiscal Competitiveness and Total Competitiveness: A Note 517
mine which location is more competitive. The total
cost per unit of production, measured in dollar terms,
will be a much better indicator of competitiveness than the marginal fiscal cost. When governments
make fiscal policy decisions they should not base
these decisions solely on fiscal competitiveness, or
they may lose corporate tax revenues unnecessarily.
References
Chen, D. and J. Mintz. 2005. "Assessing Ontario's Fiscal
Competitiveness." Canadian Public Pol icy/Analyse de
politiques 31(1): 1-28
Iqbal, M. 2003. What Drives Foreign Investment? The Role
of Taxation and Other Factors. Ottawa: Conference
Board of Canada.
KPMG. 2004. Competitive Alternatives: The CEO's Guide to
International Business Costs. 2004 edition. Toronto: KPMG.
? 2006. Competitive Alternatives: KPMG's Guide to In
ternational Business Costs. 2006 edition. Accessed 19
April 2008 at www.competitivealternatives.com/
default.asp.
Lee, Y. 2007. Geographic Redistribution of the U.S. Manu
facturing and the Role of State Development Policy.
Bureau of the Census Paper No. CES 07-06. Wash
ington, DC: Center for Economic Studies.
Organisation for Economic Co-Operation and Develop
ment (OECD). 2004. Recent Tax Policy Trends and
Reforms in OECD Countries, No. 9. Paris: OECD.
Sparks, C, T. Bikoi, and L. Moglia.2002. "A Perspective
on U.S. and Foreign Compensation Costs in Manufac
turing." Monthly Labor Review. Washington, DC: US
Department of Labor, Bureau of Labor Statistics.
(June):36-50. Accessed 19 April 2008 at http://
www.bls.gov/pub/mlr/2002/06/art3full.pdf Van Ark, B. and E. Monnikhof. 2000. Productivity and
Unit Labour Costs Comparisons: A Date Base. Em
ployment Paper No. 2000/5. Geneva: International
Labour Office.
Wheeler, L.A. 2005. Potential Effect of Eliminating the
State Corporate Income Tax on State Economic Activ
ity. Fiscal Research Center Report No. 115. Atlanta:
Georgia State University.
Data Sources
1. US Department of Labor, Bureau of Labor Statistics.
May 2003 State Occupational Employment and Wage
Estimates. Accessed 19 April 2008 at http://www.bls.gov/
oes/2003/may/oessrcst.htm
2. US Department of Labor, Bureau of Labor Statistics.
Technical Notes for May 2003 OES Estimates.
Accessed 19 April 2008 at http://www.bls.gov/oes/
2003/may/oes_tec.htm
3. US Department of Labor, Bureau of Labor Statistics.
International Comparisons of Hourly Compensation
Costs for Production Workers in Manufacturing.
Accessed 19 April 2008 at http://www.bls.gov/ news.release/ichcc.toc.htm
4. US Department of Labor, Bureau of Labor Statistics.
Hourly Compensation Costs for Production Workers:
Index U.S. = 100, Manufacturing. Accessed 19 April
2008 at ftp://ftp.bls.gov/pub/special.requests/
Foreign Labor/ind3133naics.txt
5. US Department of Labor, Bureau of Labor Statistics.
International Comparisons of Hourly Compensation
Costs for Production Workers in Manufacturing, Tech
nical Notes. Accessed 19 April 2008 at http://
www.bls.gov/news.release/ichcc.tn.htm
6. US Department of Labor, Bureau of Labor Statistics.
International Comparisons of Manufacturing Produc
tivity and Unit Labor Cost Trends, Supplementary
Tables, Unit labor costs in manufacturing, U.S. dol
lar basis, 16 countries or areas, 1950-2006. Accessed
19 April 2008 at ftp://ftp.bls.gov/pub/special.requests/
ForeignLabor/prodsupptlO.txt
7. US Department of Labor, Bureau of Labor Statistics.
Foreign Labor Statistics, Estimating Procedures.
Accessed 19 April 2008 at www.bls.gov/fls/flsestpr.htm.
Canadian Public Policy -
Analyse de politiques, vol. xxxiv, no. 4 2008
This content downloaded from 91.229.229.101 on Sun, 15 Jun 2014 19:42:01 PMAll use subject to JSTOR Terms and Conditions