Embed Size (px)
Citation preview

73
COMMENTS ON THE REPORTED STATISTICS ON NARCOTIC DRuGS
Summary
The analysis contained in this section of the technical publication is based on the statistical data furnished by Governments. The quality of the analysis depends on the data provided.
The demand for natural alkaloids that are obtained from the opium poppy plant (morphine, codeine, thebaine and oripavine) continued to be high in 2010, in line with the trend of the preceding 20 years. About 88 per cent of the morphine and 96 per cent of the thebaine manu-factured worldwide were obtained from poppy straw, while the remainder was extracted from opium. Australia, France, Spain and Turkey continued to be the main producer countries in 2010, together accounting for about 95 per cent of global production of poppy straw rich in morphine. Australia, France and Spain were the only producers of poppy straw rich in thebaine in 2010. India remained the sole licit supplier of opium to the world market.
Manufacture of morphine followed a rising trend over the past two decades, reaching a record level of 440 tons in 2007; after 2007, morphine manufacture fluctuated, and stood at 416 tons in 2010. Morphine and codeine are used in therapy and for conversion into other opioids. Manufacture of thebaine increased sharply since the late 1990s, reached an all-time high of 152 tons in 2009 and dropped in 2010 to 138 tons. Manufacture of codeine stood at 335 tons in 2010, slightly below the record high of 349 tons in 2007. Thebaine itself is not used in therapy, but it is an important starting material for the manufacture of a number of opioids. Australia, France, the United Kingdom of Great Britain and Northern Ireland and the United States of America continued to be the leading manufacturers of natural alkaloids.
Codeine has been the most commonly consumed opiate in the world in terms of the number of countries in which it is consumed. In 2010, its use reached 254 tons, close to the all-time high of 257 tons in 2009. Global consumption of morphine for the treatment of severe pain rose by a factor of almost six over the past two decades, reaching 40 tons in 2010, close to the record high of 41.8 tons in 2009. That increase is mainly due to increased consumption in high-income countries, while consumption levels in most other countries remained very low. Australia, Canada, Japan, New Zealand, the United States and some countries in Europe accounted for more than 93 per cent of total morphine consumption in 2010.
In 2010, the semi-synthetic opioid hydrocodone was the narcotic drug with the highest consumption in terms of doses consumed. Global consumption of hydrocodone amounted to 42.4 tons in 2010. High global consumption of oxycodone and hydromorphone continued in 2010 (74 tons and 3.4 tons respectively). As in the past, the United States was the principal consumer country of those three opioids. The use of dihydrocodeine (28.7 tons in 2010) and pholcodine (6.3 tons in 2010) was relatively stable in recent years, although with fluctuations from year to year.
Among the synthetic opioids, consumption of fentanyl has followed an increasing trend, reaching 1.4 tons in 2010, a slight decline from the all-time high of 1.5 tons in 2008. Fentanyl has been the synthetic opioid with the highest consumption in terms of doses consumed. Consumption of methadone also followed a steadily rising trend, reaching 31.4 tons in 2010, close to the record level of 31.8 tons in 2009. Consumption of tilidine has increased steadily over the past 20 years and reached a new record level of 41.7 tons in 2010. Diphenoxylate consumption also increased in recent years, reaching a new all-time high in 2010 (18.5 tons). Global use of dextropropoxyphene (214 tons in 2010) and pethidine (7.7 tons in 2010) has shown, with some fluctuations, a downward trend in the past 10 years.
English — Com
ments
Part four Quatrièm
e partie Cuarta parte

74
1. The present comments are intended to facilitate the use of the statistical information on the licit production, manufacture, consumption,1 utilization2 and stocks of, as well as trade in, opiate raw materials, the main opioids, including synthetic narcotic drugs under international con-trol, and cannabis, coca leaf and cocaine that is presented in the tables of reported statistics (see pages 165-327 below). References to those tables are contained in the text, as appropriate. Unless otherwise indicated, the comments refer to developments during the period 1991-2010.
1 For the purposes of the Single Convention on Narcotic Drugs of 1961, a drug is regarded as “consumed” when it has been supplied to any person or enterprise for retail distribution, medical use or scientific research; and “consumption” is construed accordingly (art. 1, para. 2).
2 The parties shall furnish INCB with statistical returns on the utiliza-tion of narcotic drugs for the manufacture of other drugs, of prepara-tions in Schedule III of the 1961 Convention and of substances not covered by the Convention and on the utilization of poppy straw for the manufacture of drugs.
2. The tables of reported statistics contain data furnished by Governments to the International Narcotics Control Board (INCB) in accordance with article 20 of the Single Convention on Narcotic Drugs of 1961.3 The most recent statistical data reflected in the comments are those relating to the year 2010. The failure by some Governments to sub-mit reports or to provide precise and complete reports may have a bearing on the accuracy of some of the information presented below.4 The most pertinent conclusions and recommendations of INCB based on the analysis of statisti-cal data are included in chapter II of its annual report.5
3 United Nations, Treaty Series, vol. 520, No. 7515.4 Details on the submission of statistical reports by individual
Governments are contained in part two of this publication.5 Report of the International Narcotics Control Board for 2011 (Unit-
ed Nations publication, Sales No. E.12.XI.5).
Opiates and opioids 3. “Opiate” is the term generally used to designate drugs derived from opium and their chemically related deriva-tives, such as the semi-synthetic alkaloids, while “opioid” is a more general term for both natural and synthetic drugs with morphine-like properties, although the chemical structure may differ from that of morphine.6
4. Opioids are used mostly for their analgesic properties to treat severe pain (fentanyl, hydromorphone, methadone,
6 From a clinical point of view, opioids may be classified according to their actions compared with those of morphine: similar affinity (ago-nist), competitive (antagonist) or mixed (agonist/antagonist) for the same receptor sites (the so-called opioid receptors) in the central and periph-eral nervous system.
morphine and pethidine), moderate to severe pain (buprenorphine7 and oxycodone) and mild to moderate pain (codeine, dihydrocodeine and dextropropoxyphene), as well as to induce or supplement anaesthesia (fentanyl and fentanyl analogues such as alfentanil and remifenta-nil). They are also used as cough suppressants (codeine, dihydrocodeine and, to a lesser extent, pholcodine and ethylmorphine), to treat gastrointestinal disorders, mainly diarrhoea (codeine and diphenoxylate), and to treat addic-tion to opioids (buprenorphine and methadone).
7 Buprenorphine is controlled under the Convention on Psychotropic Substances of 1971. Comments on its licit movement are contained in paragraph 96 below.
Opiate raw materials 5. Opium and poppy straw are the raw materials obtained from the opium poppy plant (Papaver somniferum), from which alkaloids such as morphine, thebaine, codeine and oripavine are extracted. Concentrate of poppy straw is a product obtained in the process of extracting alkaloids from poppy straw. It is controlled under the 1961 Convention.
6. The demand for alkaloids increased significantly over the 20-year period from 1991 to 2010. Throughout the period, the increased demand was covered mainly by poppy straw. In 2010, approximately 88 per cent of the morphine and about 96 per cent of the thebaine manufac-tured worldwide were obtained from poppy straw, while the rest was obtained from opium.
7. Details on trends in the production and use of opium and poppy straw, and on the manufacture and use of the
principal opiates,8 including concentrate of poppy straw, are provided below. The current balance between the sup-ply of opiate raw materials and the demand for opiates for medical and scientific needs is examined in a separate sec-tion of the present publication (see pages 94-101 below).
Opium
8. Opium (also called “raw opium”) is the latex obtained by making incisions on the green capsules of opium poppy plants. For statistical and comparison purposes, data on the production of and trade in opium are reported at 10-per-cent
8 “Opiate” is the term generally used to designate drugs derived from opium and their chemically related derivatives, such as the semi- synthetic alkaloids.

75
moisture content. When appropriate, the data on opium are also expressed in morphine equivalent,9 in order to enable comparison between opium and poppy straw. Figure 1 shows the licit production, stocks and use (consumption plus uti-lization) of opium during the period 1991-2010, expressed in morphine equivalent. Not included in the data on stocks and use are the amounts of illicitly produced opium that were seized and released for licit purposes (see paragraph 12 below).
9. India has been the leading licit producer of opium for several decades, accounting for over 90 per cent of global production. Other opium-producing countries are China,10 the Democratic People’s Republic of Korea and Japan (see table I). Production declined, with some fluc-tuations in the period 2000-2008 and then started to pick up again, reaching 580 tons in 2010 (or 64 tons in mor-phine equivalent), 99 per cent of which was produced in India. In China, opium is produced for opium prepara-tions for domestic use, while poppy straw has replaced opium as the main raw material for the manufacture of
9 The morphine or thebaine equivalent is calculated by the Interna-tional Narcotics Control Board on the basis of the industrial yield of the respective alkaloid obtained from opium or poppy straw. Lesser alkaloids contained in opium or poppy straw that are convertible into morphine or thebaine have also been included, adjusted by appropriate conversion rates, whenever the Board has been informed of their extraction in commercially significant quantities.
10 Data for China do not include statistics relating to the Hong Kong Special Administrative Region of China, the Macao Special Administrative Region of China or Taiwan Province of China.
United States Japan Other countries
Tons
Year
0
100
200
300
400
500
600
2001 2002 2003 2004 2005 2006 2007 2008 2009 2010
Figure 2. Opium: imports from India, 2001-2010
Figure 1. Opium: global production, stocksa and use (consumption and utilization),
in morphine equivalent, 1991-2010
aStocks as at 31 December of each year.
Use Stocks Production
Tons of morphine equivalent
Year
0
50
100
150
200
250
300
91 92 93 94 95 96 97 98 99 00 01 02 03 04 05 06 07 08 09 10
alkaloids. In 2010, China produced 5.2 tons of opium, and the Democratic People’s Republic of Korea produced 480 kg of opium.
10. India is the only licit supplier of opium to the world market, and most of the opium produced in India is des-tined for export. Opium exported from India contains morphine in a concentration of 9.5-12.0 per cent, codeine of about 2.5 per cent and thebaine of 1.0-1.5 per cent. As shown in figure 2, imports from India had fluctuated in recent years and decreased to about 323 tons (or 36 tons in morphine equivalent) in 2010. The United States and Japan continued to be the main importing countries, accounting for 64 per cent and 32 per cent of total imports in 2010 respectively.
11. The bulk of opium is used for the extraction of alka-loids. Total utilization of licitly produced opium for the extraction of alkaloids fluctuated during the period under consideration (see figure 3), dropping to 447 tons (or 49 tons in morphine equivalent) in 2010. The United States, Japan and India, in descending order, are the main users of opium for the extraction of alkaloids, together account-ing for almost the entire global total in 2010. Details on the utilization of opium for the extraction of alkaloids and the alkaloids obtained are provided in table III.
12. In the Islamic Republic of Iran, seized opium is released in large quantities for the extraction of alkaloids destined for domestic use. The quantities released for such purposes stood at 213 tons in 2010. The yield of alkaloids extracted from seized opium is usually less than from licitly produced opium.
English — Com
ments
Part four Quatrièm
e partie Cuarta parte

76
13. Opium is also consumed in many countries in the form of preparations, mainly for the treatment of diarrhoea and coughs. Most of those preparations are included in Sched-ule III of the 1961 Convention.11 Global consumption of opium has fluctuated, averaging around 16.7 tons per year since 2001. Total consumption in 2010 was 19.4 tons, which corresponds to 194 million defined daily doses for statistical purposes (S-DDD).12 In 2010, consumption and use of opium for the manufacture of preparations in Schedule III amounted to 11.3 tons in China, 4 tons in India and 2.5 tons in France.
14. Global stocks of opium reached their peak of the last decade in 2004 (2,176 tons) and then began to decrease. In 2010, they stood at 736 tons (or 81 tons of morphine equivalent). India continued to hold the largest stocks (521 tons, or 71 per cent of the global total), followed by Japan (99.2 tons) and the United States (80.2 tons).13
Poppy straw
15. Poppy straw consists of all parts of the opium poppy plant after mowing except the seeds. Morphine is the
11 Preparations included in Schedule III of the 1961 Convention are exempt from several control measures that are otherwise mandatory for preparations containing narcotic drugs, including reporting on their con-sumption and international trade.
12 The list of defined daily doses for statistical purposes and an explanation of that concept are contained in the notes to table XIV.1.
13 For production of, stocks of and demand for opium, see also the section entitled “Supply of opiate raw materials and demand for opiates for medical and scientific purposes”, on page 94-101.
predominant alkaloid found in the varieties of opium poppy plant cultivated in most producing countries. How-ever, the opium poppy plant with high thebaine content, commercial cultivation of which started in the second half of the 1990s, is increasingly in demand. In the present pub-lication, poppy straw produced from varieties of opium poppy plant rich in morphine is referred to as “poppy straw (M)”, and poppy straw produced from varieties of opium poppy plant rich in thebaine is referred to as “poppy straw (T)”. Some of those varieties contain, in addition to the main alkaloid (morphine or thebaine), other alkaloids that can be extracted, such as codeine and oripavine.
16. The concentration of alkaloids in poppy straw varies significantly among the producing countries.14 Production levels of poppy straw among those countries can be com-pared only by use of a common denominator, which is the morphine or thebaine equivalent of the quantity of poppy straw produced in each country.
Poppy straw produced from opium poppy rich in morphine (poppy straw (M))
17. Although submission of statistics on the production of poppy straw is voluntary, the countries cultivating opium poppy plants for the extraction of alkaloids provide such information. Global production of poppy straw (M) expressed in morphine equivalent fluctuated widely in the two decades prior to 2010, mainly because of weather con-ditions and in response to the demand in manufacturing countries. Production reached a peak in 2003, at about 450 tons in morphine equivalent, and then declined to a level of about 240 tons in 2008. Production then increased strongly in 2010, reaching a new peak of about 447 tons (see figure 4).15 Throughout the decade prior to 2010, Australia, France, Spain and Turkey were the main producer countries. In 2010, the leading producer was Turkey (140 tons, accounting for 27 per cent of global production), followed by Australia (128 tons, or 25 per cent), France (89 tons, or 17 per cent) and Spain (47 tons, or 9 per cent). Other main producers of poppy straw (M) in 2010 were Hungary and China, together accounting for about 6 per cent of global production in morphine equivalent.
18. In 2010, production of poppy straw (M) increased in Australia, France, Hungary and Turkey, owing to an expan-sion in the areas used for the cultivation of opium poppy
14 For example, in the period 2008-2010, the industrial yield of anhydrous morphine alkaloid obtained from poppy straw (M) during the manufacture of anhydrous morphine alkaloid contained in concen-trate of poppy straw (AMA (CPS)) averaged 1.68 per cent in Australia, 1.5 per cent in France, 1.34 per cent in Spain and 0.44 per cent in Turkey.
15 The morphine equivalent of the morphine and codeine alkaloids contained in poppy straw (T) is also included, where appropriate, in the data in this paragraph.
United States Japan India World totala
Tons
Year
0
100
200
300
400
500
600
700
800
900
1 000
91 92 93 94 95 96 97 98 99 00 01 02 03 04 05 06 07 08 09 10
aExcluding Iran (Islamic Republic of), Myanmar and Turkey.
Figure 3. Opium: utilization for the extraction of alkaloids, 1991-2010

77
for the production of poppy straw. Changes in the area cultivated with the opium poppy plant, the amounts of poppy straw (M) harvested and the yields obtained in producing countries are shown in table II.
19. International trade in poppy straw (M) as a raw material continues to be limited, with the Czech Republic being the only major exporter of poppy straw for the pur-pose of extraction of alkaloids (see table XVI.1). The Czech Republic, which cultivates opium poppy plants primarily for the production of seeds, produces poppy straw as a by-product and exports it to Slovakia, where it is used for the extraction of alkaloids. Such poppy straw has a signifi-cantly lower morphine content than poppy straw obtained from opium poppy plants cultivated for the production of alkaloids. In 2010, imports by Slovakia of poppy straw (M) from the Czech Republic increased to 3,549 tons.
20. In 2010, utilization of poppy straw (M) in the main user countries amounted to 23,603 tons in Turkey, 7,095 tons in Australia, 5,621 tons in France and 4,027 tons in Spain. Further details on the utilization of poppy straw (M) for the extraction of alkaloids and the yields obtained are contained in table IV.
Poppy straw produced from opium poppy rich in thebaine (poppy straw (T))
21. Australia and France started to report to INCB the production of poppy straw (T) in 1999. Spain reported the
production of poppy straw (T) for the first time in 2004. China has reported sporadic production in recent years. More details on the production of poppy straw (T) can be found in table II.
22. Global production of poppy straw (T) expressed in thebaine equivalent during the period 2001-2010 is shown in figure 5. In 2010, total production amounted to about 231 tons.16 Australia remained the leading producer (181 tons in thebaine equivalent, accounting for 78 per cent of global production), followed by Spain (47 tons, or 20 per cent) and France (2 tons, or 1 per cent).
23. All poppy straw (T) is used in the producing and manufacturing countries for the extraction of alka-loids. The quantities used, the alkaloids obtained from poppy straw (T) and the respective yields are shown in table V.
Poppy straw used for decorative purposes
24. In some countries, poppy straw is used for decorative purposes. Austria and Germany were the main exporters of poppy straw for such purposes in 2010. The main importers in 2010 were Germany and Switzerland.
16 The thebaine equivalent of the thebaine and oripavine alkaloids contained in poppy straw (M) is also included, where appropriate, in the data referred to in this paragraph.
YearAustralia France Spain Other countries
Tons of thebaine equivalent
0
20
40
60
80
100
120
140
160
180
200
220
240
2001 2002 2003 2004 2005 2006 2007 2008 2009 2010
Figure 5. Poppy straw (T): production, in thebaine equivalent, 2001-2010
YearAustralia France
Spain Turkey Other countries
Tons of morphine equivalent
0
50
100
150
200
250
300
350
400
450
91 92 93 94 95 96 97 98 99 00 01 02 03 04 05 06 07 08 09 10
Figure 4. Poppy straw (M): production, in morphine equivalent, 1991-2010
English — Com
ments
Part four Quatrièm
e partie Cuarta parte

78
Concentrate of poppy straw
25. Most countries using poppy straw for the extraction of alkaloids first manufacture an intermediate product called “concentrate of poppy straw”, although in some coun-tries morphine or thebaine are manufactured directly from poppy straw in a continuous process, which may involve a number of other intermediate products (for details, see tables IV and V). Until the second half of the 1990s, only concentrate of poppy straw containing morphine as the main alkaloid was manufactured. Since then, concentrate of poppy straw containing mainly thebaine or oripavine has started to be manufactured. Concentrate of poppy straw may contain a mixture of alkaloids, and more alkaloids than just the principal alkaloid may be extracted in industrial processes. The different types of concentrate of poppy straw are referred to by the main alkaloid contained in them.17
26. Since the actual content of alkaloids in concentrate of poppy straw may vary significantly, for purposes of compari-son and for statistical purposes, all data referring to concen-trate of poppy straw are expressed in terms of the quantity of the respective anhydrous alkaloid contained in the mate-rial. The quantities of anhydrous morphine alkaloid con-tained in concentrate of poppy straw are referred to as AMA (CPS), those of anhydrous thebaine alkaloid as ATA (CPS), those of anhydrous oripavine alkaloid as AOA (CPS) and those of anhydrous codeine alkaloid as ACA (CPS). The totals of all the individual alkaloids contained in concentrate of poppy straw are examined below, expressed in terms of 100 per cent of the respective anhydrous alkaloid content.18
Anhydrous morphine alkaloid contained in concentrate of poppy straw (AMA (CPS))
27. AMA (CPS) continues to be the most important and most widely used alkaloid among the alkaloids contained in concentrate of poppy straw. Figure 6 shows the trends in its manufacture, stocks and utilization during the 20-year period from 1991 to 2010.
28. Global manufacture of AMA (CPS) has risen sharply since the 1990s and fluctuated between 270 and 356 tons in the period 2001-2010. Trends in the manufacture of AMA (CPS) in the main manufacturing countries in the period 1991-2010 are presented in figure 7. Australia and Turkey
17 Currently, the following types are traded: (a) concentrate of poppy straw containing morphine as the main alkaloid; (b) concentrate of poppy straw containing thebaine as the main alkaloid; and (c) concen-trate of poppy straw containing oripavine as the main alkaloid.
18 The comments on concentrate of poppy straw in this publication are not directly comparable with comments on concentrate of poppy straw contained in editions of this publication prior to 2005, since at that time concentrate of poppy straw was expressed at 50 per cent of the main alkaloid contained therein.
alternate as leading manufacturer. In 2010, Australia accounted for 103 tons, or 29 per cent of the global total of 356 tons. It was followed by Turkey (93.4 tons or 26 per cent of global manufacture), France (76.7 tons, or 22 per cent of global manufacture) and Spain (51.8 tons, or 15 per cent of global manufacture). Other countries reporting manufacture of AMA (CPS) for 2010 were China (23.6 tons), the
Australia Turkey France Spain
Tons
Year
0
20
40
60
80
100
120
140
91 92 93 94 95 96 97 98 99 00 01 02 03 04 05 06 07 08 09 10
Figure 7. Anhydrous morphine alkaloid contained in concentrate of poppy straw: manufacture in the
main manufacturing countries, 1991-2010
Utilization Stocks Manufacture
Tons
Year
0
50
100
150
200
250
300
350
400
91 92 93 94 95 96 97 98 99 00 01 02 03 04 05 06 07 08 09 10
aStocks as at 31 December of each year.
Figure 6. Anhydrous morphine alkaloid contained in concentrate of poppy straw: global manufacture,
stocksa and utilization, 1991-2010

79
United Kingdom19 (8 tons) and the former Yugoslav Republic of Macedonia (377 kg).
29. Global exports of AMA (CPS) increased to 240 tons in 2003 and have fluctuated since then. In 2010, they amounted to 205 tons. Turkey remained the main exporting country in 2010 (with 88.9 tons, accounting for 43 per cent of global exports), followed by Australia (65.6 tons, or 32 per cent of global exports) and Spain (48.2 tons, or 24 per cent of global exports). The United Kingdom20 and the United States have been the leading importers of AMA (CPS), together account-ing for 80 per cent of the world total in 2010. Other major importing countries were, in descending order, Norway, South Africa and France. Further details on international trade in AMA (CPS) can be found in tables XVI.1 and XVI.2.
30. AMA (CPS) is an intermediate product for the manu-facture of morphine. It is also used in continuous manu-facturing processes for the manufacture of codeine. Utilization of AMA (CPS) increased steadily until 2003 and has been fluctuating thereafter (see figure 8). In 2010, uti-lization amounted to 364 tons. The United Kingdom, at 102 tons, accounted for 28 per cent of the global total of AMA (CPS), followed by France (77.2 tons, or 21 per cent), the United States (65.1 tons, or 18 per cent) and Australia (45.1 tons,21 or 12 per cent).
19 All data for 2010 for the United Kingdom are still under clarifica-tion with the Government.
20 All figures for exports and imports of the United Kingdom are based on data reported by the exporting countries and importing countries. They are being verified with the Government of the United Kingdom.
21 This figure is being clarified with the Government concerned.
United States France
Australia United Kingdom World total
Tons
Year
0
50
100
150
200
250
300
350
400
91 92 93 94 95 96 97 98 99 00 01 02 03 04 05 06 07 08 09 10
Figure 8. Anhydrous morphine alkaloid contained in concentrate of poppy straw: utilization for
the manufacture of opiates, 1991-2010
31. Global stocks of AMA (CPS) reached 112 tons in 2010 (see figure 9). China held the largest stocks in 2010 (32.2 tons, or 29 per cent of the global total); other coun-tries holding significant stocks of AMA (CPS) in 2010 were the United States (31.8 tons), France (15.7 tons) and Australia (10 tons).
Turkey Australia France
United States United Kingdom China
Tons
Year
Spain Other countries
0
20
40
60
80
100
120
140
160
180
200
2001 2002 2003 2004 2005 2006 2007 2008 2009 2010
Figure 9. Anhydrous morphine alkaloid contained in concentrate of poppy straw: stocks,a 2001-2010
aStocks as at 31 December of each year.
Anhydrous thebaine alkaloid contained in concentrate of poppy straw (ATA (CPS))
32. Figure 10 provides an overview of the manufacture, stocks and utilization of ATA (CPS) during the period 2001-2010.
33. Industrial manufacture of ATA (CPS) started in 1998 and has increased rapidly since then, peaking at a level of 197 tons in 2010. Australia, France and Spain, in descend-ing order, have been the only manufacturing countries, accounting respectively for 88 per cent, 9 per cent and 3 per cent of the global total in 2010. The United States has been the leading importer of ATA (CPS). In 2010, total imports were 148 tons, with the United States accounting for almost 100 per cent of those imports.
34. ATA (CPS) is an intermediate product for the manu-facture of thebaine. Global utilization of ATA (CPS) increased sharply from 22 tons in 2000 to 195 tons in 2010, the highest level ever reported. This reflects the grow-ing demand for thebaine and the substances that may be
English — Com
ments
Part four Quatrièm
e partie Cuarta parte

80
obtained from it. The United States continued to be the main user in 2010 (accounting for 72 per cent of global utilization), followed by Australia (18 per cent) and France (10 per cent). Global stocks of ATA (CPS) stood at 73.1 tons in 2010. The United States (37 tons), Australia (30 tons) and France (6.1 tons) accounted for almost 100 per cent of global stocks.
accounting respectively for 64 per cent, 34 per cent and 2 per cent of the global total in 2010. ACA (CPS) is used for the extraction of codeine. Global utilization of ACA (CPS) amounted to 12.7 tons in 2010, of which 71 per cent was accounted for by France and 22 per cent by the United States. Global stocks of ACA (CPS) in 2010 stood at 3.3 tons, most of which were held, in descending order of quantities held, in France, the United States and Turkey.
Natural alkaloids
37. Morphine, codeine, thebaine, noscapine, oripavine, papaverine and narceine are alkaloids contained in opium or poppy straw. Morphine and codeine are under interna-tional control because of their potential for abuse, while thebaine and oripavine are under such control because of their convertibility into opioids subject to abuse. Noscapine, papaverine and narceine are not under international con-trol. Morphine is the prototype of natural opiates and many opioids, and because of its strong analgesic potency, it is used as a reference parameter for comparative purposes.
Morphine
38. Figure 11 presents data on the manufacture,22 stocks, consumption and utilization of morphine in the period 1991-2010. Global manufacture of morphine followed a ris-ing trend during the 20-year period, increasing from a level of about 200 tons in 1990 to a record level of 440 tons in 2007. In 2010, global manufacture reached 416 tons. Almost 90 per cent of the morphine manufactured globally is con-verted into other narcotic drugs as well as into substances not covered by the 1961 Convention (see paragraphs 44 and 45 below). The rest is used for medical purposes.
39. In 2010, the leading manufacturing country of mor-phine was the United Kingdom (97.4 tons, or 23 per cent of global manufacture), followed by the United States (78.4 tons, or 19 per cent), France (67.9 tons, or 16 per cent), Australia (41.2 tons, or 10 per cent) and the Islamic Repub-lic of Iran (23.4 tons or 6 per cent). Together, those five countries accounted for 74 per cent of global manufacture. Four other countries reported the manufacture of mor-phine in 2010 in quantities of more than 10 tons: China (18.5 tons), Japan (12.5 tons), Slovakia (11.5 tons) and Hungary (10.5 tons).
22 In Australia, Brazil, China, Iran (Islamic Republic of), Italy, the Netherlands, Norway, Portugal, Turkey and the United Kingdom, con-centrate of poppy straw is used in continuous industrial processes for the manufacture of other narcotic drugs, without first separating mor-phine. For statistical and comparison purposes, the theoretical quantity of morphine involved in such conversions is calculated by INCB and included in the present publication in the statistics on global manufacture and utilization of morphine.
Utilization (United States) Utilization (Australia)
Utilization (France) Utilization (Other countries)Global stocks Global manufacture
Year
Tons
0
20
40
60
80
100
120
140
160
180
200
2001 2002 2003 2004 2005 2006 2007 2008 2009 2010
Figure 10. Anhydrous thebaine alkaloid contained in concentrate of poppy straw: utilization and global
manufacture and stocks,a 2001-2010
aStocks as at 31 December of each year.
Anhydrous oripavine alkaloid contained in concentrate of poppy straw (AOA (CPS))
35. Manufacture of AOA (CPS) in commercially usable quantities started in 1999; Australia has been the only manufacturing country. In 2010, global manufacture amounted to 13.9 tons. AOA (CPS) has been used in Australia and the United States for the manufacture of ori-pavine and oxymorphone. In 2010, total utilization of AOA (CPS) amounted to 19.7 tons, with 61 per cent of that total reported by Australia and 39 per cent by the United States. Global stocks of AOA (CPS) have been fluctuating since 2001. In 2010, they stood at 36.1 tons, of which 80 per cent were held in Australia and the rest in the United States.
Anhydrous codeine alkaloid contained in concentrate of poppy straw (ACA (CPS))
36. Manufacture of ACA (CPS) amounted to 16 tons in 2010. France, Turkey and Spain, in descending order, have been the only countries manufacturing ACA (CPS),

81
40. Total exports of morphine amounted to 24.6 tons in 2010. As can be seen in figure 12, the leading exporting country continued to be the United Kingdom (33 per cent of global exports), followed by Slovakia (17 per cent). Seven countries imported more than 1 ton of morphine in 2010: France (4.4 tons), Germany (4.3 tons), Brazil (2.3 tons), Austria (2.2 tons), the United Kingdom (2 tons), Canada (1.4 tons) and Hungary (1.2 tons). Further details
Consumption Utilization
Stocks Manufacture
Tons
Year
0
50
100
150
200
250
300
350
400
450
91 92 93 94 95 96 97 98 99 00 01 02 03 04 05 06 07 08 09 10
Figure 11. Morphine: global manufacture, stocks,a consumption and utilization, 1991-2010
aStocks as at 31 December of each year.
on exports and imports of morphine can be found in tables XVI.3 and XVI.4, respectively.
41. Global consumption of morphine, excluding prepa-rations included in Schedule III of the 1961 Convention (see paragraph 43 below), grew by a factor of almost six between 1991 and 2010. Between 1990 and 1999, con-sumption increased nearly threefold, from 7.2 tons to 20.3 tons, and then grew steadily throughout the following decade, amounting to 41 tons (or 410 mil-lion S-DDD) in 2010. Consumption of morphine was reported by 145 countries in 2010 (see table XII). The differences in consumption levels between countries con-tinued to be very significant (see figure 13 and table XIV) owing to various economic, knowledge, regulatory and other factors influencing the use of morphine in the treatment of pain.
United Kingdom France
Netherlands Denmark Germany
Slovakia
Australia
Belgium Other countries
Percentage
Year
0
10
20
30
40
50
60
70
80
90
100
2001 2002 2003 2004 2005 2006 2007 2008 2009 2010
Figure 12. Morphine: export shares, 2006-2010
Figure 13. Morphine: distribution of consumption, 2010
United States (5.2%)55.4%
Europe (12%)26.9%
Australia andNew Zealand (0.4%)
2.8%Japan (2.2%)
0.8%
Other countries (79.7%)
9.9%
Canada (0.5%)4.2%
Note: Percentages in parentheses refer to share of the world population (i.e. total population of all reporting countries).
42. In 2010, the United States was the main consumer country of morphine; with consumption of 22.9 tons, it accounted for 55 per cent of global consumption of mor-phine, excluding preparations included in Schedule III of the 1961 Convention. It was followed by the United King-dom (3.5 tons, or 8 per cent of the world total), France (2.2 tons, or 5 per cent), Germany and Canada (both 1.8 tons, or 4 per cent) and Austria (1 ton, or 2 per cent). Ranked according to defined daily doses for statistical pur-poses consumed per million inhabitants per day, the country with the highest consumption was Austria (3,394 S-DDD), where morphine is used for the treatment of pain as well as in substitution treatment of opioid addiction. In seven other
English — Com
ments
Part four Quatrièm
e partie Cuarta parte

82
being manufactured is obtained from morphine through a semi-synthetic process. Codeine is used mainly for the manufacture of preparations in Schedule III of the 1961 Convention, while a smaller quantity is used for the manu-facture of other narcotic drugs, such as dihydro codeine and hydrocodone. The trends in global manufacture, consump-tion, utilization and stocks of codeine during the period 1991-2010 are shown in figure 14.
Consumption Utilization
Manufacture Stocks
Tons
Year
0
50
100
150
200
250
300
350
91 92 93 94 95 96 97 98 99 00 01 02 03 04 05 06 07 08 09 10
Figure 14. Codeine: global manufacture, stocks,a consumption and utilization, 1991-2010
aStocks as at 31 December of each year.
countries, morphine consumption was over 1,000 S-DDD per million inhabitants per day in 2010: United States (2,090 S-DDD), United Kingdom (1,593 S-DDD), Denmark (1,576 S-DDD), Canada (1,487 S-DDD), Australia (1,357 S-DDD), Switzerland (1,204 S-DDD) and Iceland (1,026 S-DDD).
43. In some countries, morphine is used for the manu-facture of preparations included in Schedule III of the 1961 Convention. In 2010, China reported the use of 7.3 tons of morphine for the manufacture of such preparations. Other countries reporting the use of morphine for that purpose were Italy (676 kg), the United Kingdom (415 kg), Uganda (7.5 kg), Kazakhstan (3.1 kg), Panama (2.6 kg), Guatemala and Zimbabwe (both less than 1 kg).
44. The largest share of morphine is used for conversion into other opiates, such as codeine, ethylmorphine and pholcodine (see table VI). The amounts utilized for that purpose, which had fluctuated at around 200 tons per year until the beginning of the 1990s, has increased steadily since then, reaching 354 tons in 2010. Of the quantity uti-lized in 2010, 97 per cent was converted into codeine. The six main user countries in 2010 were the United Kingdom23 (76.9 tons, or 22 per cent of the world total), France (74.7 tons, or 21 per cent), the United States (42.6 tons, or 12 per cent), Australia23 (40.8 tons, or 12 per cent), the Islamic Republic of Iran23 (23 tons, or 7 per cent) and Norway (18.4 tons or 5 per cent), which together accounted for nearly 78 per cent of global utilization. Other countries reporting conversion of morphine into other drugs in sig-nificant quantities in 2010 were Hungary (12.6 tons), Japan (12.2 tons) and China (10.9 tons).
45. Morphine is also used for the manufacture of sub-stances not controlled under the 1961 Convention, such as noroxymorphone, nalorphine and naloxone. The quantity of morphine utilized for that purpose fluctuated consider-ably in the last two decades, amounting to 144 kg in 2010, of which (117 kg) were used by France and 27 kg by India.
46. Global stocks of morphine followed a rising trend; in 2010, they stood at 128 tons. The largest stocks were held by the United States (51.7 tons, or 40 per cent of global stocks), the United Kingdom (33 tons, or 26 per cent) and France (10.7 tons, or 8 per cent).
Codeine
47. Codeine is a natural alkaloid of the opium poppy plant, but most (90-95 per cent) of the codeine currently
23 This country reported utilization of large quantities of morphine alkaloid contained in concentrate of poppy straw for the manufacture of other alkaloids in continuous manufacturing processes. The published figure includes the theoretical quantity of morphine involved in such conversions as calculated by INCB.
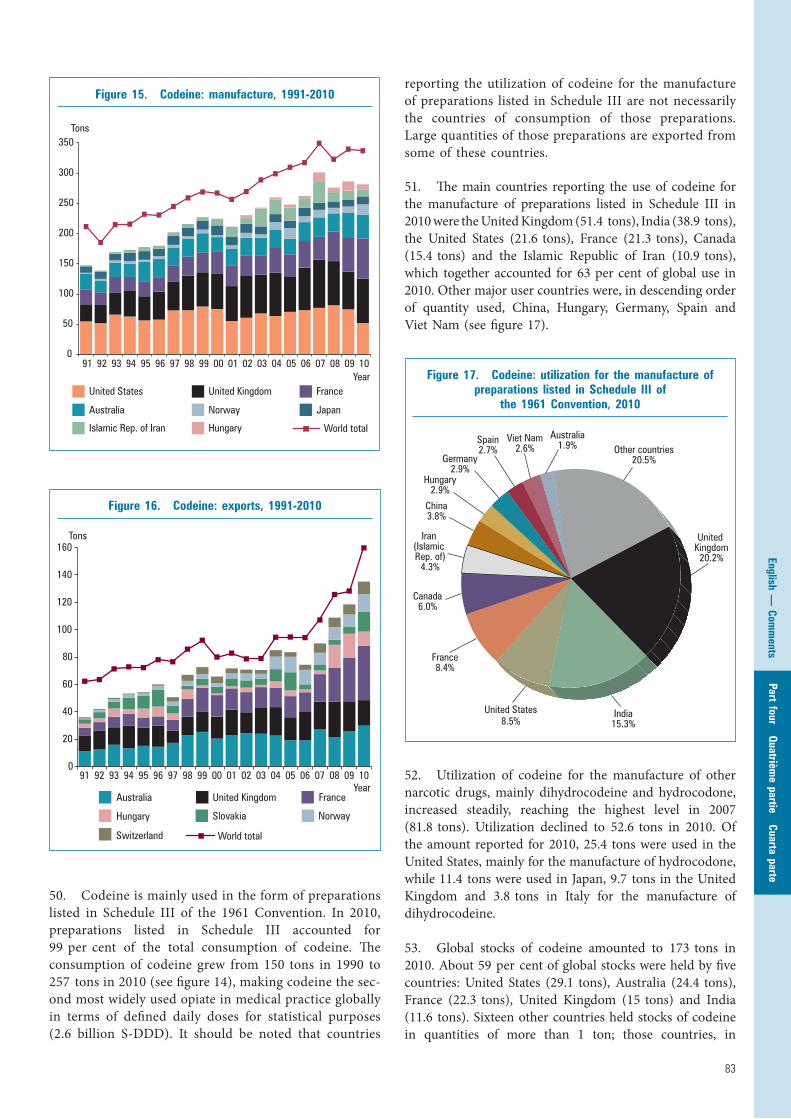
48. After a general upward trend in the 1990s and an increase to the highest level ever reported, in 2007 (349 tons), codeine manufacture stood at 337 tons in 2010 (see figure 15). The main manufacturing country was the United Kingdom, at 73.8 tons (22 per cent of global manu-facture), followed by France (66.6 tons, or 20 per cent), the United States (51.9 tons, or 15 per cent) and Australia (39.1 tons, or 12 per cent).
49. World exports of codeine followed a rising trend, reaching 160 tons in 2010, the highest level ever reported (see figure 16). France was the leading exporting country of codeine in 2010, with 39.8 tons, accounting for 25 per cent of world exports, followed by Australia (29.8 tons, or 19 per cent), the United Kingdom (18.6 tons, or 12 per cent) and Slovakia (14.4 tons, or 9 per cent). The main importing countries of codeine in 2010 were India (32.2 tons), Canada (18.4 tons), Germany (14.5 tons), the United Kingdom (14.4 tons) and Switzerland (13.9 tons). Fourteen other countries reported imports of between 1 and 9 tons in 2010. More details on international trade in codeine can be found in tables XVI.3 and XVI.4.
83
50. Codeine is mainly used in the form of preparations listed in Schedule III of the 1961 Convention. In 2010, preparations listed in Schedule III accounted for 99 per cent of the total consumption of codeine. The consumption of codeine grew from 150 tons in 1990 to 257 tons in 2010 (see figure 14), making codeine the sec-ond most widely used opiate in medical practice globally in terms of defined daily doses for statistical purposes (2.6 billion S-DDD). It should be noted that countries
United States United Kingdom France
Australia
Islamic Rep. of Iran Hungary
Norway Japan
World total
Tons
Year
0
50
100
150
200
250
300
350
91 92 93 94 95 96 97 98 99 00 01 02 03 04 05 06 07 08 09 10
Figure 15. Codeine: manufacture, 1991-2010reporting the utilization of codeine for the manufacture of preparations listed in Schedule III are not necessarily the countries of consumption of those preparations. Large quantities of those preparations are exported from some of these countries.
51. The main countries reporting the use of codeine for the manufacture of preparations listed in Schedule III in 2010 were the United Kingdom (51.4 tons), India (38.9 tons), the United States (21.6 tons), France (21.3 tons), Canada (15.4 tons) and the Islamic Republic of Iran (10.9 tons), which together accounted for 63 per cent of global use in 2010. Other major user countries were, in descending order of quantity used, China, Hungary, Germany, Spain and Viet Nam (see figure 17).
52. Utilization of codeine for the manufacture of other narcotic drugs, mainly dihydrocodeine and hydrocodone, increased steadily, reaching the highest level in 2007 (81.8 tons). Utilization declined to 52.6 tons in 2010. Of the amount reported for 2010, 25.4 tons were used in the United States, mainly for the manufacture of hydrocodone, while 11.4 tons were used in Japan, 9.7 tons in the United Kingdom and 3.8 tons in Italy for the manufacture of dihydrocodeine.
53. Global stocks of codeine amounted to 173 tons in 2010. About 59 per cent of global stocks were held by five countries: United States (29.1 tons), Australia (24.4 tons), France (22.3 tons), United Kingdom (15 tons) and India (11.6 tons). Sixteen other countries held stocks of codeine in quantities of more than 1 ton; those countries, in
Australia United Kingdom France
Norway
World total
Tons
Year
Hungary
0
20
40
60
80
100
120
140
160
91 92 93 94 95 96 97 98 99 00 01 02 03 04 05 06 07 08 09 10
Slovakia
Switzerland
Figure 16. Codeine: exports, 1991-2010
India15.3%
United States8.5%
France8.4%
Australia1.9%
Canada6.0%
China3.8%
Spain2.7%
Hungary2.9%
Other countries20.5%
United Kingdom
20.2%
Iran (Islamic Rep. of)
4.3%
Viet Nam2.6%
Germany2.9%
Figure 17. Codeine: utilization for the manufacture of preparations listed in Schedule III of
the 1961 Convention, 2010
English — Com
ments
Part four Quatrièm
e partie Cuarta parte

84
descending order of quantity of stocks, were Japan, Canada, Hungary, Romania, Norway, Switzerland, Iraq, Spain, Germany, South Africa, Italy, Russian Federation, Brazil, Denmark, Ireland and China.
Thebaine
54. Until the 1990s, thebaine was manufactured mainly from opium; since 1999, it has been obtained primarily from poppy straw. Thebaine may also be obtained through the conversion of oripavine or from semi- synthetic opioids, such as hydrocodone. Thebaine itself is not used in therapy, but it is an important starting material for the manufacture of a number of opioids, mainly codeine, dihydrocodeine, etorphine, hydrocodone, oxycodone and oxymorphone (all of which are substances controlled under the 1961 Conven-tion) and buprenorphine (which is a substance controlled under the Convention on Psychotropic Substances of 197124), as well as for substances not under international control, such as the derivatives naloxone, naltrexone, nalor-phine and nalbuphine.
55. Global manufacture of thebaine has increased sharply since the late 1990s, as a consequence of the growing demand for oxycodone and other drugs and substances that may be derived from it. In 2009, global manufacture reached a peak of 152 tons (see figure 18 and tables III and V), and in 2010, manufacture decreased to 138 tons, mostly because of reductions in manufacture in France. The United States continued to be the leading manufactur-ing country, accounting for 82.1 tons, or 60 per cent of global manufacture in 2010. The other major manufactur-ers of thebaine were Australia (23.3 tons, or 17 per cent), Spain (22.9 tons, or 17 per cent) and France (6.5 tons, or 5 per cent). Global exports of thebaine reached 42 tons in 2010. Australia and Spain remained the main exporting countries in 2010, together accounting for 96 per cent of the world total. The main importing country of thebaine was the United Kingdom (23.5 tons).
56. Utilization of thebaine for the manufacture of other narcotic drugs reached 109 tons in 2010 (see figure 19 and table VII). The United States was the main user country of thebaine during the 20-year period from 1991 to 2010. In 2010, the United States accounted for 69 per cent of global use, followed by France, which accounted for 14 per cent. The quantity of thebaine reported as used for the manu-facture of substances not covered under the 1961 Conven-tion (mainly buprenorphine) fluctuated during the 10-year period from 2000 to 2010; in 2010, it amounted to 7.1 tons, with the United Kingdom accounting for 71 per cent of the world total.
24 United Nations, Treaty Series, vol. 1019, No. 14956.
57. Global stocks of thebaine stood at 57.4 tons in 2010. Major stocks were held in the United States (28 tons), France (9.8 tons), the United Kingdom (4 tons), Japan (3.7 tons), Switzerland (2.2 tons) and Germany (2.1 tons).
Stocks Manufacture Utilization
Tons
Year
0
20
40
60
80
100
120
140
160
91 92 93 94 95 96 97 98 99 00 01 02 03 04 05 06 07 08 09 10
Figure 18. Thebaine: global manufacture, utilization and stocks,a 1991-2010
aStocks as at 31 December of each year.
United States Other countries
Tons
Year
0
10
20
30
40
50
60
70
80
90
100
110
120
130
91 92 93 94 95 96 97 98 99 00 01 02 03 04 05 06 07 08 09 10
Figure 19. Thebaine: utilization for the manufacture of opioids, 1991-2010

85
Oripavine
58. In 2007, oripavine was included in Schedule I of the 1961 Convention. Australia (8.3 tons) was the only country reporting manufacture of oripavine in 2010. The use of oripavine in significant quantities for the manufacture of other drugs was reported in 2010 by Australia (5 tons, mainly for thebaine) and the United States (4.5 tons, mainly for oxymorphone and hydromorphone). In 2010, global stocks of oripavine amounted to 1.7 tons, of which 87 per cent were held in Australia.
Semi-synthetic opioids
59. Semi-synthetic opioids are made by relatively simple chemical modifications of natural opiates, such as mor-phine, codeine and thebaine. Some examples of those derivatives are dihydrocodeine, ethylmorphine, heroin, hydrocodone, oxycodone and pholcodine. The information on semi-synthetic opioids is presented in English alpha-betical order.
Dihydrocodeine
60. Global manufacture of dihydrocodeine rose until 1999, when it reached 34.8 tons. After 2000, the annual manufacture fluctuated between 27.1 tons and 31.9 tons and stood at 28.8 tons in 2010 (see figure 20). Japan (11.6 tons), the United Kingdom (9.5 tons) and Italy (4 tons) have been the main manufacturing countries,
together accounting for 87 per cent of the world total dihydro codeine manufacture in 2010. Global exports of dihydrocodeine amounted to 11 tons in 2010. The main exporting country remained Italy, accounting for 34 per cent of world exports, followed by Slovakia, the United King-dom, France and Belgium. The United Kingdom remained the leading importing country of dihydrocodeine in 2010 (3.5 tons); other main importers were the Republic of Korea (2.9 tons) and France (1.8 tons).
61. Dihydrocodeine is mainly consumed in the form of preparations included in Schedule III of the 1961 Conven-tion, accounting for 95 per cent of total consumption. In 2010, use of dihydrocodeine reached 28.7 tons (about 300 million S-DDD). The main user countries of dihydro-codeine were the United Kingdom, Japan and the Republic of Korea, together accounting for almost 88 per cent of the global total consumption. In 2010, global stocks of dihydrocodeine amounted to 21.8 tons; major stocks were held in Japan (10 tons) and the United Kingdom (3 tons).
Ethylmorphine
62. Global manufacture of ethylmorphine has followed a downward trend in the last 20 years, reaching 1 ton in 2010. France and India, the main manufacturing countries in 2010, accounted for 62 and 29 per cent of global manu-facture respectively. France, at 660 kg, continued to be the leading exporting country, accounting for 61 per cent of global exports. The two largest importers in 2010, Sweden and Belgium, imported 282 and 135 kg of ethylmorphine respectively. Ethylmorphine is consumed mainly in the form of preparations listed in Schedule III of the 1961 Convention (about 92 per cent of total consumption). Global consumption reached 1 ton in 2010 (20 million S-DDD). The main user countries in 2010 were India (29 per cent of the world total) and Sweden (26 per cent). In 2010, global stocks of ethylmorphine totalled 1.7 tons; the largest holder of stocks was France (50 per cent of global stocks).
Heroin
63. From 1989 to 2002, global licit manufacture of heroin fluctuated between 200 kg and 500 kg. In 2003, it increased sharply to 1.2 tons, the highest amount ever reported. After 2003, manufacture declined and fluctuated, reflecting the changes in the manufacture reported by the United King-dom and Switzerland, and amounted to 623 kg in 2010 (see figure 21). In 2010, the United Kingdom continued to be the main exporting country of heroin (589 kg, or 88 per cent of global exports). Other exporters of heroin exceeding 10 kg were Switzerland (32 kg), Hungary (19 kg) and the Netherlands (14 kg). Germany became the main
Stocks Manufacture Consumption
Tons
Year
0
5
10
15
20
25
30
35
40
91 92 93 94 95 96 97 98 99 00 01 02 03 04 05 06 07 08 09 10
Figure 20. Dihydrocodeine: global manufacture, consumption and stocks,a 1991-2010
aStocks as at 31 December of each year.
English — Com
ments
Part four Quatrièm
e partie Cuarta parte

86
importing country of heroin in 2010 (258 kg), followed by Switzerland (161 kg) and the Netherlands (135 kg).
hydrocodone had been used in the United States for the manufacture of thebaine for the purpose of manufacture of other narcotic drugs; no such use was reported after 2003, as extraction of thebaine from poppy straw had increased since the late 1990s and replaced the use of hydrocodone in the manufacture of thebaine (see paragraph 54 above). In 2010, global stocks of hydrocodone accounted for 36.3 tons; more than 99 per cent were held by the United States.
Stocks Manufacture Consumption
Kilograms
Year
0
200
400
600
800
1 000
1 200
1 400
91 92 93 94 95 96 97 98 99 00 01 02 03 04 05 06 07 08 09 10
Figure 21. Heroin: global manufacture, consumption and stocks,a 1991-2010
aStocks as at 31 December of each year.
Utilization Stocks
Manufacture Consumption
Tons
Year
0
5
10
15
20
25
30
35
40
45
50
91 92 93 94 95 96 97 98 99 00 01 02 03 04 05 06 07 08 09 10
Figure 22. Hydrocodone: global manufacture, consumption, utilizationa and stocks,b 1991-2010
aUtilization for the manufacture of other drugs. bStocks as at 31 December of each year.
64. Global consumption of heroin amounted to 524 kg in 2010. Switzerland, where heroin is prescribed to long-term opiate addicts, reported consumption of 219 kg in 2010. Other countries with significant heroin consumption in 2010 were the United Kingdom (158 kg) and the Neth-erlands (114 kg). In 2010, global stocks of heroin amounted to 897 kg. Among the countries holding significant stocks in 2010 were Switzerland (315 kg), Germany (268 kg), the United Kingdom (130 kg) and the Netherlands (116 kg).
Hydrocodone
65. Global manufacture of hydrocodone has followed an upward trend in the last 20 years, reaching 44.3 tons in 2010 (see figure 22), with the United States accounting for almost 100 per cent of global manufacture.
66. Global consumption of hydrocodone stood at 42.4 tons in 2010, with the United States accounting for more than 99 per cent of the total. The high consumption in the United States makes hydrocodone the most used narcotic drug in medical practice in terms of defined daily doses for statisti-cal purposes (about 2.8 billion S-DDD). Ranked according to defined daily doses for statistical purposes consumed per million inhabitants per day, the countries with the highest consumption of hydrocodone in 2010 were the United States (25,804 S-DDD) and Palau (539 S-DDD). In the past,
Hydromorphone
67. Global manufacture of hydromorphone increased sharply during the last 20 years, reaching 4.3 tons in 2010. The United States (75 per cent of global manufacture) and the United Kingdom (14 per cent) were the leading manu-facturing countries in 2010. Total exports of hydromor-phone have followed an upward trend, reaching 2.3 tons in 2010. The leading exporting countries were the United Kingdom (37 per cent of world exports) and the United States (23 per cent). Canada remained the main importing country (806 kg) in 2010, followed by Germany (554 kg) and France (362 kg).
68. Global consumption of hydromorphone increased steadily, reaching 3.4 tons (170 million S-DDD) in 2010. The United States remained the main consumer country in 2010 (56 per cent of global consumption), followed by Canada (25 per cent) and Germany (11 per cent). Ranked according to defined daily doses for statistical purposes con-sumed per million inhabitants per day, the countries with

87
the highest consumption of hydromorphone in 2010 were Canada (3,581 S-DDD) and Austria (1,237 S-DDD). Global stocks of hydromorphone reached 5.2 tons in 2010, of which 65 per cent were held in the United States.
Oxycodone
69. Global manufacture of oxycodone has increased sharply over the past years, reaching a record level of 135.9 tons in 2009 and standing at 122.5 tons in 2010 (see figure 23). The United States accounted for 83 per cent of the world total, followed by the United Kingdom and France, each contributing about 8 per cent of global manu-facture of oxycodone. Total exports of oxycodone have steadily risen and stood at 22.3 tons in 2010. The United Kingdom continued to be the main exporting country in 2010 (55 per cent of world exports), followed by the United States (26 per cent). Canada and the United Kingdom remained the major importers of oxycodone in 2010, accounting for 25 per cent and 19 per cent of global oxy-codone imports respectively. Tables XVI.3 and XVI.4 pro-vide further details on exports and imports of oxycodone.
(5.6 tons), Germany (2.4 tons) and Australia (1.6 tons). Ranked according to defined daily doses for statistical pur-poses consumed per million inhabitants per day, the coun-tries with the highest consumption of oxycodone in 2010 were the United States (7,187 S-DDD), Canada (6,343 S-DDD) and Australia (2,942 S-DDD). Global stocks of oxycodone have increased to 83 tons in 2010—the highest level ever recorded—with the United States accounting for 75 per cent of the world total.
Pholcodine
71. Global manufacture of pholcodine has fluctuated in the past 20 years, amounting to 5.5 tons in 2010 (see figure 24). The main manufacturers were France (3.8 tons) and Norway (627 kg). Total exports of pholcodine reached 3 tons in 2010, the main exporting countries being France (38 per cent of global exports), the United Kingdom (32 per cent) and Hungary (22 per cent). The main importers in 2010 were the Hong Kong Special Administrative Region of China (779 kg) and Australia (499 kg). Further details on exports and imports of pholcodine are provided in tables XVI.3 and XVI.4.
Stocks Manufacture Consumption
Tons
Year
0
20
40
60
80
100
120
140
91 92 93 94 95 96 97 98 99 00 01 02 03 04 05 06 07 08 09 10
Figure 23. Oxycodone: global manufacture, consumption and stocks,a 1991-2010
aStocks as at 31 December of each year.
70. Global consumption has been steadily rising, reflecting the increased use of oxycodone for the treatment of moderate to severe pain. In 2010, global oxycodone consumptions amounted to 74 tons (almost 1 billion S-DDD). The United States, which continued to be the principal consumer country of oxycodone, accounted for 80 per cent of the world total. Other major consumer countries in 2010 were Canada
Stocks Manufacture Consumption
Tons
Year
0
2
4
6
8
10
12
91 92 93 94 95 96 97 98 99 00 01 02 03 04 05 06 07 08 09 10
Figure 24. Pholcodine: global manufacture, consumption and stocks,a 1991-2010
aStocks as at 31 December of each year.
72. Most pholcodine is consumed in the form of prepa-rations listed in Schedule III of the 1961 Convention; in 2010, such preparations accounted for 99 per cent of total consumption. Global consumption of pholcodine amounted to 6.3 tons (126 million S-DDD) in 2010. The major user countries and territories in 2010 were France (47 per cent of the world total) and the Hong Kong Special
English — Com
ments
Part four Quatrièm
e partie Cuarta parte

88
Administrative Region of China (23 per cent). Global stocks of pholcodine decreased to 3.1 tons in 2010. Major stocks were held by France (31 per cent of global stocks) and Norway (18 per cent).
Synthetic opioids
73. Synthetic opioids are used in the treatment of chronic, moderate or severe pain. They are also used for the induc-tion of general anaesthesia and in the treatment of specific conditions such as gastrointestinal disorders. In addition, methadone is used in treatment related to drug depend-ency. The information on synthetic opioids is presented in English alphabetical order.
Dextropropoxyphene
74. Manufacture of dextropropoxyphene has followed a general downward trend since 2003 (see figure 25) and stood at 204 tons in 2010. India was the main manufactur-ing country, accounting for 72 per cent of the world total. Exports from India, the principal exporting country of dex-tropropoxyphene in 2010, accounted for 46 per cent of global exports (31 tons). Exports from Italy and France accounted for 26 per cent and 16 per cent of the global total respectively. The Syrian Arab Republic was the main import-ing country of dextropropoxyphene in 2010 (4.5 tons), followed by France (3.7 tons) and Switzerland (3.1 tons).
75. Dextropropoxyphene is consumed mainly in the form of preparations listed in Schedule III of the 1961 Conven-tion (more than 99 per cent of the total quantity used in 2010). Countries that report the utilization of dextropro-poxyphene for the manufacture of preparations listed in Schedule III may also export those preparations. Global use of dextropropoxyphene peaked in 2002 at 315 tons and has followed a downward trend since then. Global use amounted to 215 tons in 2010 (corresponding to about 855 million S-DDD). The countries reporting the highest levels of uti-lization were India (63 per cent of the global total) and the United States (21 per cent). Global stocks of dextro-propoxyphene amounted to 84 tons in 2010. The largest stocks were held by the major manufacturing countries: United States (31.2 tons) and India (22.6 tons).
Diphenoxylate
76. Manufacture of diphenoxylate has followed a gener-ally rising trend after 1992, reaching a peak of 18.9 tons in 2010 (see figure 26). India has remained the main manu facturing country in 2010, contributing 88 per cent of the global total. India was also the main exporting coun-try, accounting for 1.7 tons or 95 per cent of world exports. In 2010, the Islamic Republic of Iran was the prin-cipal importing country of diphenoxylate (698 kg), followed by Singapore (107 kg).
77. In 2010, more than 99 per cent of the diphenoxylate consumed was in the form of preparations listed in
Stocks Manufacture Consumption
Tons
Year
0
50
100
150
200
250
300
350
400
91 92 93 94 95 96 97 98 99 00 01 02 03 04 05 06 07 08 09 10
Figure 25. Dextropropoxyphene: global manufacture, consumption and stocks,a 1991-2010
aStocks as at 31 December of each year.
Stocks Manufacture Consumption
Tons
Year
0
2
4
6
8
10
12
14
16
18
20
91 92 93 94 95 96 97 98 99 00 01 02 03 04 05 06 07 08 09 10
Figure 26. Diphenoxylate: global manufacture, consumption and stocks,a 1991-2010
aStocks as at 31 December of each year.
89
Schedule III of the 1961 Convention. Global use in 2010 reached a peak of 18.5 tons, corresponding to 1.2 billion S-DDD. The countries reporting the highest use of diphen-oxylate for the manufacture of preparations listed in Sched-ule III in 2010 were India (82 per cent of the global total) and China (10 per cent). Global stocks of diphenoxylate in 2010 amounted to 5.2 tons, 87 per cent of which were held by India.
Fentanyl
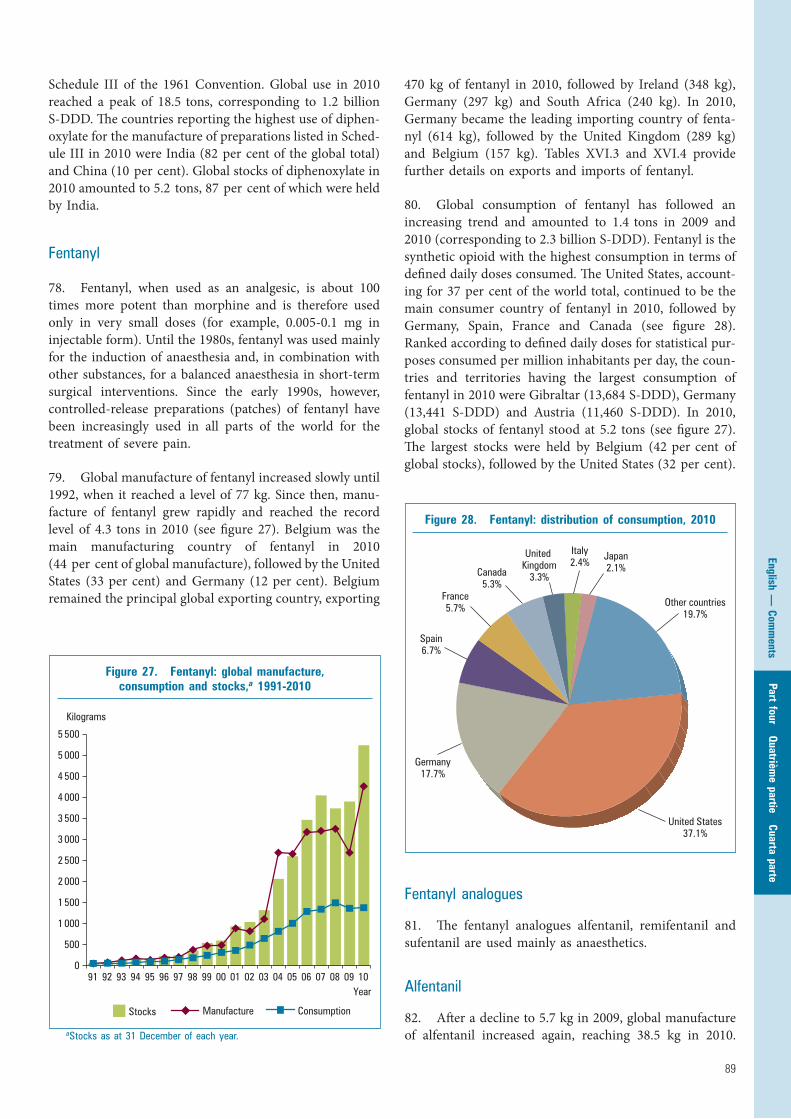
78. Fentanyl, when used as an analgesic, is about 100 times more potent than morphine and is therefore used only in very small doses (for example, 0.005-0.1 mg in injectable form). Until the 1980s, fentanyl was used mainly for the induction of anaesthesia and, in combination with other substances, for a balanced anaesthesia in short-term surgical interventions. Since the early 1990s, however, controlled-release preparations (patches) of fentanyl have been increasingly used in all parts of the world for the treatment of severe pain.
79. Global manufacture of fentanyl increased slowly until 1992, when it reached a level of 77 kg. Since then, manu-facture of fentanyl grew rapidly and reached the record level of 4.3 tons in 2010 (see figure 27). Belgium was the main manufacturing country of fentanyl in 2010 (44 per cent of global manufacture), followed by the United States (33 per cent) and Germany (12 per cent). Belgium remained the principal global exporting country, exporting
470 kg of fentanyl in 2010, followed by Ireland (348 kg), Germany (297 kg) and South Africa (240 kg). In 2010, Germany became the leading importing country of fenta-nyl (614 kg), followed by the United Kingdom (289 kg) and Belgium (157 kg). Tables XVI.3 and XVI.4 provide further details on exports and imports of fentanyl.
80. Global consumption of fentanyl has followed an increasing trend and amounted to 1.4 tons in 2009 and 2010 (corresponding to 2.3 billion S-DDD). Fentanyl is the synthetic opioid with the highest consumption in terms of defined daily doses consumed. The United States, account-ing for 37 per cent of the world total, continued to be the main consumer country of fentanyl in 2010, followed by Germany, Spain, France and Canada (see figure 28). Ranked according to defined daily doses for statistical pur-poses consumed per million inhabitants per day, the coun-tries and territories having the largest consumption of fentanyl in 2010 were Gibraltar (13,684 S-DDD), Germany (13,441 S-DDD) and Austria (11,460 S-DDD). In 2010, global stocks of fentanyl stood at 5.2 tons (see figure 27). The largest stocks were held by Belgium (42 per cent of global stocks), followed by the United States (32 per cent).
Stocks Manufacture Consumption
Kilograms
Year
0
500
1 000
1 500
2 000
2 500
3 000
3 500
4 000
4 500
5 000
5 500
91 92 93 94 95 96 97 98 99 00 01 02 03 04 05 06 07 08 09 10
Figure 27. Fentanyl: global manufacture, consumption and stocks,a 1991-2010
aStocks as at 31 December of each year.
United States37.1%
France5.7%
Canada5.3%
Germany17.7%
Spain6.7%
Italy2.4%
United Kingdom
3.3%
Japan2.1%
Other countries19.7%
Figure 28. Fentanyl: distribution of consumption, 2010
Fentanyl analogues
81. The fentanyl analogues alfentanil, remifentanil and sufentanil are used mainly as anaesthetics.
Alfentanil
82. After a decline to 5.7 kg in 2009, global manufacture of alfentanil increased again, reaching 38.5 kg in 2010.
English — Com
ments
Part four Quatrièm
e partie Cuarta parte

90
Belgium, the main manufacturing country in 2010, accounted for 70 per cent of global manufacture, followed by the United States (16 per cent) and the United Kingdom (10 per cent). Global consumption of alfentanil remained stable, at 20 kg, in 2010. The United Kingdom was the main consumer country of alfentanil (49 per cent of global con-sumption), followed by Brazil (11 per cent) and Germany (9 per cent). In 2010, global stocks of alfentanil stood at 58 kg, the largest part of which was held by Belgium (75 per cent of the global total).
Remifentanil
83. In 2010, global manufacture of remifentanil declined to 32.2 kg, down from the peak of 86.7 kg in 2009. Belgium accounted for 51 per cent of the global total, followed by the United Kingdom (19 per cent) and China (14 per cent). Global consumption of remifentanil amounted to 43 kg in 2010. Italy and Germany remained the leading consumer countries (accounting for 14 per cent and 12 per cent of the global total respectively), followed by Japan (11 per cent) and China (10 per cent). In 2010, global stocks of remifen-tanil amounted to 68 kg, of which 34 per cent were held by Belgium, 20 per cent by Italy and 13 per cent by the United Kingdom.
Sufentanil
84. Global manufacture of sufentanil dropped from 6.4 kg in 2009 to 5.3 kg in 2010, with Belgium and the United States accounting for 67 per cent and 19 per cent of global manufacture respectively. Global consumption of sufentanil amounted to 2.8 kg in 2010. Germany, France, China, the United States and Canada were the five largest consumers of sufentanil, together accounting for 82 per cent of the global total. Detailed information on the consumption of fentanyl analogues is provided in table XIII.1. In 2010, global stocks of sufentanil totalled 12.6 kg, most of which was held by the United States (50 per cent) and Belgium (30 per cent).
Ketobemidone
85. Global manufacture of ketobemidone reached 507 kg in 2003, the highest level in 10 years. In the past five years, manufacture was reported only in 2008—by Denmark, which manufactured less than 1 kg. Germany remained the main exporting country of ketobemidone in 2010, at 87.2 kg, accounting for 96 per cent of global exports. The main importing countries were France (25.2 kg), Sweden (20.6 kg) and Norway (15 kg).
86. Global consumption of ketobemidone, which takes place mostly in the Scandinavian countries, amounted to 83.6 kg in 2010 (corresponding to 1.7 million S-DDD). Sweden (40 per cent of the global total), Denmark
(39 per cent) and Norway (18 per cent) remained the main consumer countries of ketobemidone. Global stocks of ketobemidone further dropped to 146 kg in 2010, following a peak of 663 kg in 2005. Germany continued to hold the largest stocks (45 per cent of the global total).
Methadone
87. Global manufacture of methadone has increased steadily over the past 20 years, rising to its highest level at 43.7 tons in 2009 and then declining to 34 tons in 2010 (see figure 29). The two countries accounting for most of global manufacture have been the United States (15.2 tons, or 45 per cent of global manufacture) and Switzerland (11.5 tons, or 34 per cent). Four other countries reported manufacture of methadone in 2010 in quantities of more than 1 ton: China (1.8 tons), the United Kingdom (1.7 tons), Spain (1.2 tons) and India (1.1 tons).
Stocks Manufacture Consumption
Tons
Year
0
5
10
15
20
25
30
35
40
45
91 92 93 94 95 96 97 98 99 00 01 02 03 04 05 06 07 08 09 10
Figure 29. Methadone: global manufacture, consumption and stocks,a 1991-2010
aStocks as at 31 December of each year.
88. Global exports of methadone amounted to 16.9 tons in 2010. Switzerland remained the main exporting country (11.3 tons), followed by the United Kingdom (1.3 tons). The principal importing countries of methadone in 2010 were the United Kingdom (2.4 tons) and Canada (2.1 tons). Tables XVI.3 and XVI.4 provide further details on exports and imports of methadone respectively.
89. Although methadone is used in several countries for the treatment of pain, the sharp upward trend in consump-tion is mainly attributable to its growing use in the treatment of opioid addiction. Global consumption of methadone

91
amounted to 31.4 tons in 2010. The United States remained the main consumer country (49 per cent of the global total), followed by the United Kingdom (10 per cent). More details on the consumption of methadone can be found in table XII. Global stocks of methadone amounted to 33.2 tons in 2010. The countries holding the largest stocks remained Switzerland (36 per cent of global stocks) and the United States (30 per cent).
Pethidine
90. Global manufacture of pethidine followed a declining trend, reaching a record low level of 7 tons in 2010 (see figure 30). The United States continued to be the main manufacturing country (50 per cent of global manufac-ture), followed by Spain (29 per cent) and China (15 per cent). Global exports of pethidine slightly increased to 5 tons in 2010. Spain and the United States were the principal exporting countries in 2010, together accounting for more than 53 per cent of global exports. Imports of pethidine by Canada, the main importer, increased by a factor of almost three, from 489 kg in 2009 to 1.3 tons 2010. Austria more than doubled the amount of its pethi-dine imports, from 122 kg in 2009 to 278 kg in 2010. Table XVI.4 provides further details on imports of pethidine.
91. Pethidine consumption has followed a downward trend, reaching 8.1 tons in 2010 (corresponding to 20.3 million S-DDD). The United States and China were the main consumer countries, accounting for 35 and 14 per cent of global consumption respectively. Global stocks of pethidine totalled 10.8 tons in 2010. The largest
stocks were held by the United States (31 per cent of global stocks) and Germany (12 per cent).
Tilidine
92. Global tilidine manufacture, after a peak of 77 tons in 2008, amounted to 42.5 tons in 2010, of which Germany was the sole manufacturer. Tilidine exports more than dou-bled from 4.8 tons in 2009 to 10.4 tons in 2010, with Ger-many as the main exporter (88 per cent of global exports). The main importing countries of tilidine in 2010 were Germany (6 tons) and Belgium (1.9 tons).
93. Global consumption of tilidine reached a record level of 41.7 tons (208 million S-DDD) in 2010. Most tilidine has been consumed in Germany, accounting for 87 per cent of the world total in 2010. In 2010, the countries with the highest consumption of tilidine, in terms of defined daily doses for statistical purposes consumed per million inhabit-ants per day, were Germany (6,029 S-DDD), Belgium (3,697 S-DDD) and Luxembourg (1,219 S-DDD). Global stocks of tilidine stood at 44.9 tons in 2010, almost all being held by Germany (93 per cent) and Belgium (7 per cent).
Trimeperidine
94. The manufacture of trimeperidine increased from 185 kg in 2009 to 290 kg in 2010. India and the Russian Federation, the main manufacturers, accounted for 66 per cent and 29 per cent respectively. India was the leading exporting country of trimeperidine in 2010 (196 kg), followed by Ukraine (22.6 kg). Most of the global consumption of trime-peridine in 2010 (262 kg, corresponding to 1.3 million S-DDD) took place in the Russian Federation (78 per cent), Ukraine (8 per cent) and Belarus (5 per cent). The countries with the highest consumption, expressed in defined daily doses for statistical purposes per million inhabitants per day, were the Russian Federation (19 S-DDD) and Belarus (18 S-DDD). In 2010, global stocks amounted to 329 kg, with the Russian Federation reporting the largest share (84 per cent of the global total).
Opioid analgesics controlled under the 1971 Convention
95. Buprenorphine and pentazocine are opioid analge-sics that are controlled under the 1971 Convention. Brief information on these opioids is included in the present publication. More detailed comments on statistics on buprenorphine and pentazocine can be found in the INCB technical report on psychotropic substances.25
25 Psychotropic Substances: Statistics for 2010—Assessments of Annual Medical and Scientific Requirements for Substances in Schedules II, III and IV of the Convention on Psychotropic Substances of 1971 (United Nations publication, Sales No. T.12.XI.3).
Stocks Manufacture Consumption
Tons
Year
0
5
10
15
20
25
91 92 93 94 95 96 97 98 99 00 01 02 03 04 05 06 07 08 09 10
Figure 30. Pethidine: global manufacture, consumption and stocks,a 1991-2010
aStocks as at 31 December of each year.
English — Com
ments
Part four Quatrièm
e partie Cuarta parte

92
Buprenorphine
96. Buprenorphine is an opioid used as an analgesic and in detoxification and substitution treatment of opioid dependence. Since the late 1990s, manufacture of the sub-stance has increased steadily and significantly. In 2009, global manufacture reached 6.5 tons, with the United Kingdom accounting for 80 per cent of global manufacture. Similarly, global exports had peaked in 2009 with 3.4 tons with the United Kingdom as main exporter. However, due to non-reporting of manufacture and exports of buprenorphine for 2010 by the United Kingdom, reported manufacture for buprenorphine dropped to 1.8 tons and reported exports dropped to 1.7 tons in 2010 (see figure 31). In 2010, the main manufacturers were Belgium and the Czech Republic; and the main exporters were Belgium, Germany and the Czech Republic. Germany, the United States and France were the main importing countries of buprenorphine in 2010.
Pentazocine
97. Pentazocine is an opioid analgesic with properties and uses similar to those of morphine. Global reported manufac-ture of pentazocine reached a peak of 8.5 tons in 2009. Due to non-reporting of pentazocine manufacture by India, reported pentazocine manufacture in 2010 amounted to only 2.1 tons, with Italy being the main manufacturer. The United Kingdom became the world’s leading exporter of pentazocine
in 2010, followed by Italy. The United States remained the leading importer of pentazocine.
Stocks ConsumptionManufacture
Kilograms
Year
0
1 000
2 000
3 000
4 000
5 000
6 000
7 000
2001 2002 2003 2004 2005 2006 2007 2008 2009 2010c
Figure 31. Buprenorphine: global calculated consumption,a reported manufacture and stocks,b 2001-2010
aApproximate global consumption, calculated on the basis of statistical data submitted by Governments. Does not include data on the manufacture of buprenorphine in the United Kingdom. bStocks as at 31 December of each year; data are provided on a voluntary basis and may therefore be incomplete. cData for 2010 are incomplete.
Stocks Production Consumption
Tons
Year
0
5
10
15
20
25
91 92 93 94 95 96 97 98 99 00 01 02 03 04 05 06 07 08 09 10b
Figure 32. Cannabis: global production, consumption and stocks,a 1991-2010
Note: The graph does not include data on consumption of cannabis in Canada. aStocks as at 31 December of each year. bData on consumption in 2010 are under investigation.
Cannabis
98. Global licit production of cannabis grew steadily from 1.4 tons in 2000 to 5.3 tons in 2002 and then stabi-lized at a level of about 6 tons (see figure 32). After a sharp rise in 2007 (10.1 tons), global reported production of can-nabis totalled 4.4 tons in 2010. The main cannabis manu-facturer was United Kingdom, at about 2.6 tons. Reported cannabis production in Canada sharply decreased, from 3 tons in 2009 to 1.6 tons in 2010, while production in the Netherlands rose from 94 kg in 2009 to 150 kg in 2010.
99. Prior to 2000, the United States had been the only country to report the use of cannabis solely for scientific purposes. Since then, other countries have used cannabis and cannabis extracts for scientific purposes. Cannabis has been consumed for medical purposes in Canada since 2001, and in the Netherlands since 2003. In the United Kingdom, cannabis is used mainly for the manufacture of cannabis extracts for medicinal preparations. Global use of cannabis and cannabis extracts for medical and scien-tific purposes increased from 858 kg in 2000 to a peak of 8.3 tons in 2008. In 2010, reported global use dropped to 468 kg, as Canada reported only parts (231 kg) of its con-sumption in 2010, significantly below the consumption

93
reported by that country for 2009 (4.8 tons). Apart from Canada, main user countries in 2010 were the Nether-lands (60.6 kg), Germany (57 kg), the United States (49 kg) and Spain (44 kg). No data on use of cannabis in 2010 were provided by the United Kingdom, a former main user of this narcotic drug. Global stocks of cannabis
Stocks Manufacture Consumption
Kilograms
Year
0
200
400
600
800
1 000
1 200
91 92 93 94 95 96 97 98 99 00 01 02 03 04 05 06 07 08 09 10
Figure 33. Cocaine: global manufacture, consumption and stocks,a 1991-2010
aStocks as at 31 December of each year.
Coca leaf and cocaine
Coca leaf
100. Peru has been the only country exporting coca leaf for the global market since 2000. The United States has been the leading importing country, accounting for almost 100 per cent of global imports. Imports by the United States declined from 175 tons in 2001 to 67.8 tons in 2010. Coca leaf is used in the United States for the extraction of flavouring agents and the manufacture of cocaine as a by-product. Such use in the United States fluctuated in the period 1991-2010, following a general downward trend ending in 2008, and then gradually increased again to about 124 tons in 2010. In Peru, the amount of coca leaf used for the manufacture of cocaine increased from 20.3 tons in 2002 to 95.1 tons in 2009, the second highest quantity ever reported by that country, but decreased to 86.2 tons in 2010. In recent years, small quantities of coca leaf have been used in Italy, the Netherlands and Switzerland for the extraction of flavour-ing agents and, in France, for use in homeopathic medi-cines. Stocks of coca leaf held in the United States account for the majority of global stocks. In 2010, stocks held in that country amounted to about 680 tons, or 84 per cent of the world total.
Cocaine
101. Global licit manufacture of cocaine declined con-tinuously from a yearly average of 850 kg in the period 1987-1990 to 418 kg in 2010 (see figure 33). The main manufacturing countries in 2010 were Peru (388 kg) and the United States (28.7 kg). Until 2000, global exports of cocaine also followed a downward trend, totalling 211 kg in that year. Exports then picked up again, reaching 434 kg in 2010. Peru was the main supplier (304 kg, or 70 per cent of global exports) in 2010. Exports from Peru
102. Global consumption of cocaine has followed a declining trend, from a yearly average of about 670 kg in the period 1987-1990 to 215 kg in 2010. In 2010, the United States remained the main consumer country of cocaine (82.2 kg, or 38 per cent of global consumption), followed by the United Kingdom (39 kg), the Netherlands (15.1 kg) and Canada (14.3 kg). In 2010, global stocks of cocaine stood at 715 kg. The countries holding the largest stocks were Peru (225 kg), the United Kingdom (212 kg) and the United States (107 kg ).
fell sharply, from 22.6 tons in 2007 to 13.3 tons in 2010, mainly because of a large decrease in stocks held by the United Kingdom. The countries reporting significant can-nabis stocks in 2010 were the United Kingdom (10.2 tons), the United States (1 ton), Switzerland (958 kg) and Canada (831 kg).
in 2010 continued to be destined mainly for the United Kingdom, where imported cocaine is purified and partly re-exported.
English — Com
ments
Part four Quatrièm
e partie Cuarta parte