Embed Size (px)
Citation preview

Rural Food Access in North DakotaLori Capouch, Rural development directorNorth Dakota Association of Rural Electric Cooperatives
Commerce Committee
MeetingAugust 12,
2019

82% of North Dakota’s towns have less than 1,000 people!
N.D. Rural Grocery Initiative Task ForceN.D. Association of Rural Electric CooperativesBroadband Association of N.D.North Dakota Grocers AssociationCreating a Hunger-free North Dakota CoalitionDakota College at BottineauNorth Dakota Farmers UnionNDSU Extension, Great Plains Food BankBowdon Community CooperativeMarket on Main (Edinburg)Main Street Market (Hazelton)Star Grocery (New Leipzig)Tuttle Community StoreWangler Foods (Casselton, McVille & Michigan ) Wimbledon Community Store

Rural is struggling to compete under a tiered purchasing system

By the numbers
30
25
16
57
9
Number of grocery stores in communities of 2,100 people or less – August 2019
Closed or nolonger full service
Multi-storeownership
Nonprofit
Independent
Stores in townsover 2,100 in pop.
2014 baseline: 137 stores9 removed – baseline pop. lowered to 2,10030 closed or no longer full-service
2019
98 operating full-service stores
57 are Independent -13 have on-going concerns
16 are non-profit
25 are multi-store owner
*Estimates – there is not a formal reporting system.

Weekly Sales Volume Comparison
$0$50,000
$100,000$150,000$200,000$250,000$300,000$350,000
SalesVolume
Weekly Sales Volume
Average US Grocery Store Average rural ND grocery store
2016 data –"Supermarket News" and 2016 N.D. Rural Grocery Survey

Ann. profit margin
0 5 10 15
<$2,000$2,001-$5,000
$5,001-$10,000$10.001-$20,000$20,001-$30,000$30,001-$40,000$40,001-$50,000
>$50,000
Weekly Gross Sales
Number of Stores
Weekly Gross Sales Among 55 Store Respondents. 28 of 55 stores have weekly sales of $20,000 or less (51%)
Avg. net profit margin = 1.75%
$20,000 X 52 X 1.75% = $18,200/ann. net profit
Too low to entice a buyer if selling; not enough to request a bank loan for maintenance

Access to product/variety
0123456789
1X/week Once/2weeks
Once/3weeks
Once/4weeks
Other
Purchasing frequency at big box stores2016 Rural Grocery Survey
No. of Stores

EfficiencyFour main suppliers crisscross on highways
This data was used by Upper Great Plains Transportation Institute (UGPTI) to determine current distribution routes and to optimize routes.
Estimated an annual savings of $383,448

North Dakota Food Deserts
August 2019


Proposed DistributionCurrent Distribution
Walsh County Grocery Distribution ModelCollective purchasing; redistribution hub; partner with distributor already
driving the same roads
Grocery Distributor
C-Store Distributor
Store #1 Store #2 Store #3
Grocery Purchase Cost Reduction for store 1 & 2 = $525/store/week
Grocery Distributor
Store #2Store #1
Store #3

The landscape without our rural grocery sector
Communities with a full-service grocery store and a population greater than 2,100
This work has been funded by CoBank, an anonymous donor, the Bush Foundation, USDA and the rural electric and telecommunications cooperatives.

Thank you!

1
ND Living
Phone: 701.663.6501 or 800.234.0518
Fax: 701.663.3745 www.ndarec.com 3201 Nygren Drive NW • P.O. Box 727 • Mandan, ND 58554-0727
August 12, 2019
To: Commerce Committee – Representative Scott Louser, chairman
RE: Background information for Senate Concurrent Resolution (SCR 4013) From: Lori Capouch, Rural Development Director, North Dakota Rural Electric &
Telecommunications Development Center
Chairman Louser and members of the Commerce Committee, my name is Lori
Capouch and I am the rural development director for North Dakota's electric and
telecommunications cooperatives. Our work focuses on quality of life for rural people
and we serve as the facilitator for the North Dakota Rural Grocery Initiative. First and
foremost, we thank you for your willingness to study this issue.
I'm here today to share what we have learned over the past 5 years regarding rural
distribution in our state. We believe the data reveals a concerning trend about the state
of rural in North Dakota, especially for communities with less than 1,000 people,
because 82% of North Dakota's towns have less than 1,000 people.
At the core of the issue is a tiered purchasing system. Price and access to product are
based on volume. Our rural retail businesses do not have the population base to
generate the volume needed to be competitive with urban areas. As retail sector
continues to consolidate to achieve the best price, rural places are struggling to
compete and losing ground.

2
Our support of this study doesn't come from wanting to interfere with free enterprise. We
are looking to support the current distribution system and find efficiencies. We want to
give you the information we have discovered and engage in dialogue for solutions
moving forward. Suppliers will continue to deliver product to a store if they can cover
their costs and make a profit. To be able to accommodate the higher supplier charges, a
scramble occurs at the rural grocery store level just to break even. For example,
communities own the building, managers go without pay, volunteers help unload trucks
and stock shelves, and there are store fundraisers and outright donations. There are
typically no health benefits or 401K accounts for the paid employees. Salaries of those
who work in the stores are low, to the point that it's difficult to hire help. Access to
healthy foods is on the backs of the people who live in rural areas.
When we started this work in 2014, we documented 137i full-service stores in towns
with 2,100 people or less. As of today, there are about 98 stores remaining. Of the 98
remaining, 13 have indicated an ongoing concern and 16 are some form of community
owned or nonprofit store. Providing access to food in rural areas is increasingly
becoming a volunteer and donation driven proposition.
In many communities, business succession is a concern. Due to the lack of profit, it is
difficult to sell or finance a store when it becomes available for sale. There is also a lack
of people with adequate experience needed to manage a grocery store. At this point,
the store is usually transitioned to a community owned or nonprofit store or it closes.

3
Since 2014, we have collected data from the rural stores three times. We discovered
there are a host of issues leading to the closure of stores. We learned the industry is
based on volume. Stores with a higher sales volume can secure a lower wholesale price
and they receive better management tools from the supplier. An average US grocery
store has a weekly sales volume of $320,000. More than 50 percent of our rural stores
have a volume of $20,000 per week or less.
Low sales volumes lead to low profit margins. More than 50 percent of our rural stores
of have an annual net profit margin of $18,000 or less. Some owner/managers pay
themselves after the margin is set. We delivered the surveys in person, with help from
NDSU Extension, and noted that many of our stores are in older buildings and have
aging equipment. Often, cash flow or reserves cannot support the needed maintenance
and updates. On several occasions, we have scrambled to help secure grant dollars
from private entities and nonprofits when equipment fails.
We learned our smaller stores have difficulty accessing certain products from a
wholesale supplier for a variety of reasons, such as their volume is too low to attract the
supplier of a product or they cannot afford to carry the item at the price offered. Some
stores have difficulty securing common products such as bread, produce, milk or fresh
meat. Several store operators drive to urban centers to secure products from big box
stores for resale at their stores to improve their price or variety. They purchase these
items at a retail price plus travel time and costs.

4
Using collected data, we plotted the four major suppliers in the state and we were able to
see the routes were based on something other than efficiency. Their routes crisscross
each other, and their stops are usually based on the volume a store can purchase. This is
referred to as a minimum purchasing requirement. The higher the volume, the better the
price. We have confirmed an average wholesale cost difference of 14% between two
stores that are within 15 miles of each other.
We contracted with Upper Great Plains Transportation Institute to determine whether there
would be cost savings by optimizing the routes. We learned, on a basic assessment, that
around $383,000 could be saved.
Rural people work hard to keep their grocery store. They understand they need it – it’s a
pillar in their community. The feel it’s the kiss of death for their community to lose it.
Most families will not relocate to areas where there isn't access to a full-service grocery
store. The towns need new families to populate their schools and to work in their main
street businesses. Their health depends on it. The United States Department of
Agriculture has documented there is a higher incidence of obesity and diabetes in food
deserts. This map depicts the food deserts in North Dakota. The green and orange
areas reflect a full-service grocery store and a 10-mile radius. The pink areas are
considered food deserts according to USDA. The orange areas are served by some
fashion of a community owned or nonprofit store.

5
North Dakota will be among the first to feel negative consequences of this tiered
purchasing system because about 67% of our land mass is considered remote or
frontier – less than 6 people per square mile. There is only so much market dilution we
can tolerate before we fail to compete given our small customer base.
According to the health industry, the recognition of remote spaces is used to identify
areas which will likely require public intervention to assure a core set of health services.
They recognize the low volume makes market solutions unlikely. The same might be
said about other services.
We organized a task force to work on this issue because the rural grocers in our state
do not have the human or financial capital to address this issue on their own. Great
lengths have already been taken to keep stores open – we have been forming
nonprofits, cooperatives or converting to community owned. It’s a temporary fix and
difficult to sustain.
The data illustrates the distribution system is not effectively serving rural places. We are
at a distinct competitive disadvantage. This sector continues to consolidate in favor of
mega retailers in urban spaces. Many people shop based on price and rural incomes
tend to be lower than urban. Meanwhile, rural main streets in our communities continue
to empty.
We do not have a solution; we have ideas and we welcome yours. We have been
attempting to test the financial feasibility of redistribution hubs, of which I have
distributed a draft. In other words, can we purchase like Dollar General, which means

6
can we collectively purchase in large volumes for a lower price. And, can we distribute
like Amazon; they partnered with existing transportation companies that were already
traveling the same roads to reduce costs. Does the state have assets with excess
capacity that can partner in the distribution of food? We do know that the state operates
at least one transportation system, which is through the Emergency Preparedness and
Response Section of the North Daktoa Department of Health.
This streamlining of the system could potentially reduce costs, improve quality and
variety and ease the complexities of stocking a small store. This does not replace the
current suppliers but should complement their business model.
Access to healthy food is a necessity, not a luxury. This isn't a contest to be the last
store standing. It won't work that way. Suppliers need a healthy route to make
deliveries. You need to have healthy communities surrounding you. Without that, costs
will continue to climb as the routes deteriorate. We are hopeful we can address this
before the remaining infrastructure is gone. This is a larger issue than one entity can
solve on its own. We are concerned about the loss of food access and the negative
effects it will have on our state, our communities and the people living there. We
appreciate your willingness to study the issue during the interim and thank you for your
time.
i There is no publicly available system to track the status of grocery stores in North Dakota. Of the 137 identified stores, some have closed, and some are no longer considered full service.


NORTH DAKOTA RURAL GROCERY
INITIATIVEWalsh County, ND Distribution Model Analysis
The North Dakota Rural Grocery Initiative sought to build a small scale grocery distribution model that would improve the profitability of rural grocery stores.
Walsh County was selected to be the distribution location. A larger grocery store, Jim’s Supervalu located in Park River, offered to be considered a distribution hub. Two smaller grocery stores, Market on Main in Edinburg and Korner Grocery in Hoople, offered to be considered delivery points of groceries from Park River.
Monthly sales volumes to the two delivery points were analyzed along with a cost comparison between a large grocery distributor and a regional convenience store distributor (C‐Store distributor). Small rural stores do not have the sales volume to attract lower pricing for groceries from large grocery distributors and, therefore, have to accept higher pricing from C‐store distributors, who have lower minimum purchase volumes.
This analysis looks at the potential of a small scale distribution system for rural grocery stores.
1
Draft for Commerce Committee‐for discussion purposes

Image credit: Vintage illustration, via Retroarama
Grocery Glory Days
Back in the day, decades ago, rural America was thriving due to populated towns and counties that were busy with diversified farming and small business activities. Many small towns in North Dakota had several active grocers as well as specialty meat markets. As new farming practices and agricultural production shifted toward larger farming operations and less diversification, small rural towns in America were slowly drained of population. As farming practices required less labor and local inputs, young people migrated to larger population centers in search of meaningful employment.
In North Dakota, a number of factors are in play which conspire to be detrimental to the operation of rural grocery stores. A drop in rural population along with an aging rural population is perhaps the biggest factor. Intense competition from big box urban stores, Dollar General stores, convenience stores, and online stores reduce the volume of purchases in rural grocery stores. Many of the rural grocery stores in North Dakota have owners who are ready to retire and are not able to convince a younger generation to carry on the operation of their stores.
With rural North Dakota grocery stores, it all comes down to be able to be profitable and provide a decent income for owners and employees. This analysis explores a method that may help contribute toward improved grocery store cash flow.
2

Illustration by Lars Leetaru
Consumer Delivery Expectations
Now it’s Convenience, Speed, andQuality
In today’s fast paced world, consumers are now expecting next day delivery of almost any kind of product or service. Amazon and Walmart are fighting to expand their next day delivery model for a wide variety of goods. This immediate delivery mentality is a threat to rural grocery stores.
3

North Dakota Rural Grocer Survey Objectives
1. Identify ways to improve rural grocer access to current and future food distribution resources
2. Identify if there are pockets across the state where all favorable conditions converge to show an optimal location to conduct a pilot study
3. Collect and input data into a software mapping system to show current distribution routes and make future predictions
Selected Walsh County, ND to Test an Alternate Food Distribution Model
In looking at the North Dakota Rural Grocer Survey Objectives, analysis of current distribution routes showed that a number of grocery, C‐store, and direct to store delivery distribution operations daily crisscross the state. Walsh County was selected as an analysis location due to the positive attitude of participating grocers within the county.
4

Grocer + Distribution Origin Warehouse
Participating Grocers
Walsh County Map
Walsh County, in Northeast North Dakota, is home to one relatively large rural community, Grafton, Walsh County Seat, population 4,224. Walsh County has a population over 11,000 and has 12 incorporated cities in addition to Grafton. Park River has a population of 1,379, Hoople has a population of 242, Edinburg has a population of 190, and Fordville has a population of 202.
5

Independent Rural ND Grocer Facts
• Independent Rural Grocers Often Do Not Achieve Minimum Purchase Volumes
• Independent, Small Rural Grocers Pay a Premium for Goods (14% Based on Data)
• Independent Rural Grocers Require Improved Net Margins
• Improved Net Margins are Available with Increased Purchase Volumes
• Collaborative Purchasing Among Grocers Can Increase Purchase Volumes
Large grocery distributors, such as Unified Natural Foods, Inc. and Spartanash, have minimum purchase requirements for their customers. In addition, the large grocery distributors require purchases in full case quantities, which may take months to sell.
Smaller rural grocers that do not meet the minimum purchase requirements or cannot justify full case purchases, turn to C‐store distributors to purchase small volumes and partial case quantities. This analysis compared large grocery distributor prices for a range of goods compared to C‐store distributor prices and found an average of 14% reduction in pricing if those goods are purchased from a large grocery distributor.
If rural grocery stores could collaborate to purchase groceries from large grocery distributors, smaller stores in the collaboration should be able to see improved profitability.
6

Walsh County ND Rural Grocery Distribution Models
• Discussions Held With:• Jim’s Supervalu – Park River, ND
• Market on Main – Edinburg, ND
• Korner Grocery – Hoople, ND
• City Leaders – Fordville, ND
• Park River – Currently Using Large Grocery Distribution Company
• Hoople and Edinburg – Currently Using C Store Distributor Company
The participants in the analysis were Jim’s Supervalu in Park River as the distribution hub and Market on Main and Korner Grocery were delivery points in the analysis. Park River has the second largest city in Walsh County and Jim’s Supervalu grocery is large enough to be supplied by a large grocery distribution company. Korner Grocery and Market on Main serve smaller grocery markets and are supplied by the same C store distribution company.
Large grocery distribution companies that service the area are Unified Natural Foods Inc. (UNFI), Mason Brothers, and SpartanNash. C‐store distribution companies that service the area are Henry’s Foods, Inc. and Amcon Distributing Company.,
7
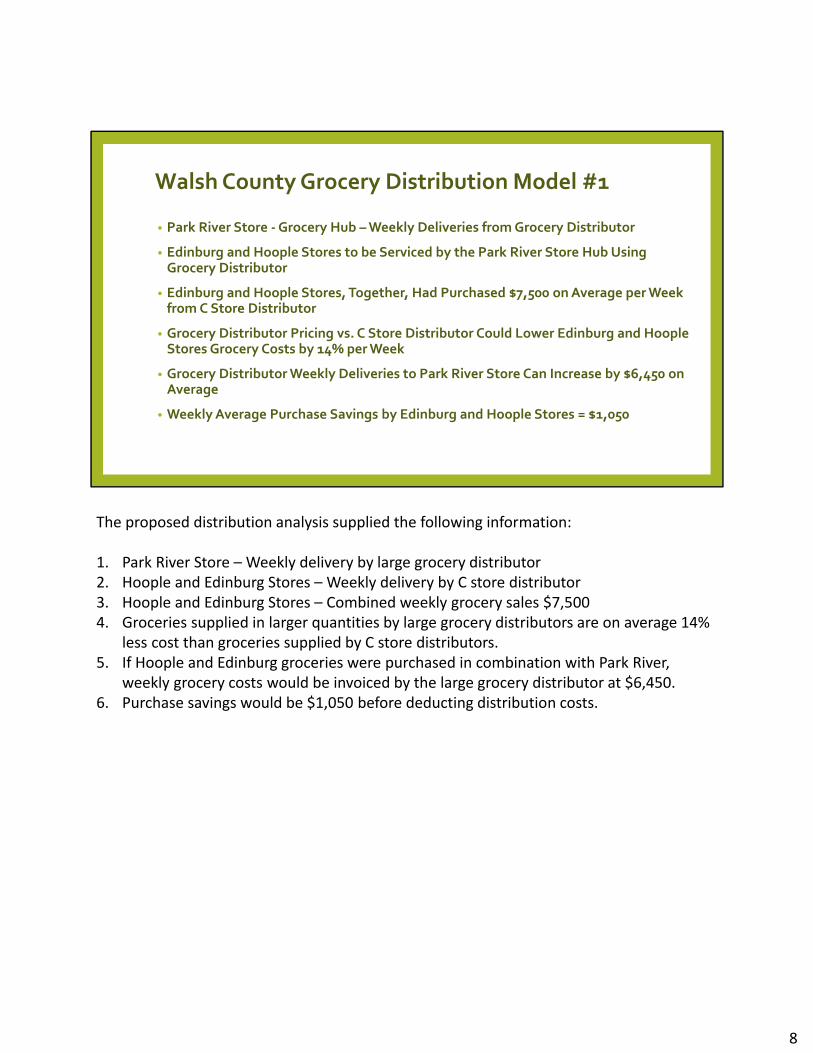
Walsh County Grocery Distribution Model #1
• Park River Store ‐Grocery Hub –Weekly Deliveries from Grocery Distributor
• Edinburg and Hoople Stores to be Serviced by the Park River Store Hub Using Grocery Distributor
• Edinburg and Hoople Stores, Together, Had Purchased $7,500 on Average per Week from C Store Distributor
• Grocery Distributor Pricing vs. C Store Distributor Could Lower Edinburg and HoopleStores Grocery Costs by 14% per Week
• Grocery Distributor Weekly Deliveries to Park River Store Can Increase by $6,450 on Average
• Weekly Average Purchase Savings by Edinburg and Hoople Stores = $1,050
The proposed distribution analysis supplied the following information:
1. Park River Store – Weekly delivery by large grocery distributor2. Hoople and Edinburg Stores – Weekly delivery by C store distributor3. Hoople and Edinburg Stores – Combined weekly grocery sales $7,5004. Groceries supplied in larger quantities by large grocery distributors are on average 14%
less cost than groceries supplied by C store distributors.5. If Hoople and Edinburg groceries were purchased in combination with Park River,
weekly grocery costs would be invoiced by the large grocery distributor at $6,450.6. Purchase savings would be $1,050 before deducting distribution costs.
8

Grocer Hub
Grocer Spoke
Grocer Spoke
Grocer Spoke
Grocer Spoke
North Dakota Rural Grocery Initiative
Hub and Spoke Distribution Model
HubJim’s Supervalu – Park River, ND
The Hub and Spoke distribution model has been employed by a variety of sizes of business. From airline companies to parcel delivery companies, the hub and spoke distribution model has worked to lower costs and improve efficiencies. With modern computing power, shipments can be tracked with accuracy and effectiveness.
9

Walsh County Grocery Distribution Model #1
Current Distribution Proposed Distribution
Grocery Distributor
C‐Store Distributor
HoopleStore
Edinburg Store
Park River Store
$3,750/wk Ave.
$3,225/wk Ave.Grocery Purchase Cost Reduction = $525/store/week
Grocery Distributor
As was previously pointed out, the Walsh County Distribution analysis estimated a grocery purchase cost reduction of $525 per store per week before subtracting distribution costs.
10

Park River
Hoople
Edinburg
15.4 miles
14.2 miles
12.4 miles
Walsh County Grocery Distribution Model #1
Park River Hub to Hoople and Edinburg Route = 45 Miles
The weekly round trip route from Park River to Hoople and Edinburg encompasses 45 miles.
11

Jim’s Supervalu ‐ Park River Weekly Distribution Costs
Mileage = $90/week$2.00/mile
Labor = $240/week$20.00/hour
Admin/Warehouse = $80/week
Overhead = $50/week
Weekly Distribution Costs to 2 Stores =
$460
Distribution Costs were estimated to be:
1. Mileage was estimated at $90 per week for 45 miles. Distribution transportation costs are estimated at $2.00 per mile due to the infrequent, weekly route.
2. Labor was estimated at $240 per week, where one individual would be employed for 12 hours at $20 per hour to receive, reorganize, pack, and deliver groceries to Hoople and Edinburg.
3. Administration costs include ordering, maintaining inventory records, and tracking distribution costs. Warehousing costs are included with Administration costs and cover the cost for utilizing space in Park River.
4. Overhead costs are initially estimated at $50 per week as a contingency to cover excess or unforeseen costs during the initial stages of distribution.
5. Initial weekly distribution cost to Hoople and Edinburg is $460 per week.
12

Walsh County Hub and Spoke Savings per Week
$1,050 Cost Reduction/week for 2
Stores
$460 Park River Distribution Costs/week for 2 Stores
$590 Savings/week to be shared
by formula to be developed among:Park River StoreEdinburg StoreHoople Store
The Walsh County distribution analysis estimated a weekly savings of $590 per week that would be shared by the Park River, Edinburg, and Hoople stores according to a mutually agreed upon formula.
13

Assumptions
Store Sales Average ‐ $3,750 per year
Mileage Costs ‐ $2.00 per mile
Labor Costs ‐ $20.00 per hour per employee
Administration/Warehousing Costs ‐ $20.00/hour
Overhead Costs ‐$25.00/hour
MileageLabor Hours
Admin/Whse
Overhead Total Store Cost
Hub Spoke
Per Store
Mileage Cost
Stores Mileage CostLabor Hours Cost Admin/Whse Cost Overhead Cost Cost Reduction Savings Savings
Per Store/wk
2 45 $90.00 12 $240.00 4 $80.00 2 $50.00 $460.00 $1,050.00 $590.00 $196.67 $30.00
3 90 $180.00 15 $300.00 5 $100.00 2.5 $62.50 $642.50 $1,575.00 $932.50 $233.13 $45.00
4 135 $270.00 18 $360.00 6 $120.00 3 $75.00 $825.00 $2,100.00$1,275.
00 $255.00 $54.00
5 180 $360.00 21 $420.00 7 $140.00 3.5 $87.50$1,007.
50 $2,625.00$1,617.
50 $269.58 $60.00
6 230 $460.00 24 $480.00 8 $160.00 4 $100.00$1,200.
00 $3,150.00$1,950.
00 $278.57 $65.71
Expanded Distribution AnalysisSavings Shared Equally by Park River Hub and Participating Grocers
An exercise has been developed to estimate the potential of expanding Park River distribution from two to six stores. Net purchase savings for 2 stores was estimated at $196.67 and was projected to rise up to $278.57 per store for a 6 store distribution system. This is provided that distribution sales volumes for the expanded number of stores would be at an average of $3,225 per store per week. This also assumes that the recipient stores would be converted from purchasing groceries from C store distributors to purchasing groceries from a large grocery distributor.
14

Expanded Distribution AnalysisSavings Shared Equally by Park River Hub and Participating Grocers
$590.00
$932.50
$1,275.00
$1,517.50
$1,950.00
$196.67 $233.13 $255.00 $269.58 $278.57
$30.00 $45.00 $54.00 $60.00 $65.71
$0.00
$500.00
$1,000.00
$1,500.00
$2,000.00
$2,500.00
2 Stores 3 Stores 4 Stores 5 Stores 6 Stores
Total Savings/Week Equal Savings/Store Mileage Cost/Store
The graphic representation of expanded distribution shows the marginal increase in weekly shared purchase savings. The graph also shows the incremental increase in mileage cost per store due to an increased route distance per week.
15

Walsh County Distribution Analysis #1 Summary
1. Purchasing from a Large Grocery Distributor Can Deliver Lower Grocery Costs Compared to Purchasing from C‐Store Distributors.
2. A 14% Reduction of Weekly Grocery Costs is Significant3. Redistribution Costs from the Park River Hub Would Absorb
Approximately ½ of the 14% Purchase Savings.4. The Park Rive Hub Would Invoice Distribution Costs to the Edinburg and
Hoople Stores to Cover Distribution Costs.5. The Edinburg and Hoople Stores Would be Invoiced for Groceries at the
Reduced 6. Nearly $200 In Grocery Purchase Savings per Week Could be had for the
Edinburg and Hoople Stores.7. The Park River Redistribution Hub Could Obtain an Income Increase of
$200 per Week for the Park River Hub. (Assuming all savings amounts after subtracting distribution costs are split 3 ways.)
Analysis of a Park River distribution hub has the potential to save a net of $590 per week for the system that would be shared among the distributor and recipient stores. Critical to the analysis is the assumption that the Edinburg and Park River grocery stores would be able to maintain an average sales volume of $3,225 per week per store.
16

Walsh County Grocery Distribution Model #2
Park River Distribution Hub Delivering Groceries to T4 Solutions Locker in Fordville, ND
Increase store volume and market area without adding additional locations ‐at a fraction of the cost. Our Lockers are Frozen, Refrigerated and Ambient to insure the freshest delivery and food safety.
A 7‐Unit Locker Cost = $65,000 includes Delivery and Installation
For discussion purposes, it is assumed that a T4 Solutions Locker would be placed in Fordville, ND and would be serviced by Jim’s Supervalu in Park River.
17

Grocer + Distribution Origin Warehouse
Participating Grocers
Walsh County Map
T4 Solutions Locker
Fordville is located in the south center portion of Walsh County and has a population of 202.
18

Walsh County Grocery Distribution Model #2
• Park River Store is the Grocery Hub –Weekly Deliveries from Grocery Distributor
• Park River Store Purchases and Operates a T4 Solutions Locker in Fordville, ND
• Park River Store Projected Purchases for FordvilleT4 Solutions Locker at $3,225 per Week
• Weekly Average Net Margin for Park River Store from Fordville Locker = $806
• Weekly T4 Solutions Locker Costs by Park River Store = $620.00• Mileage ‐ $100/week (one delivery per store per week – 50 miles/week @ $2.00/mile)
• Labor ‐ $160/week (8 hours/week @ $20/hour)
• Administration/Warehousing ‐ $60/week
• Overhead Costs ‐ $300/week (Includes Purchase of $65,000 Unit)
• Weekly Distribution Model #2 Savings = $186.00
Assuming that the Fordville T4 Solutions Locker generated weekly sales of $3,225, that Park River has a 25% gross margin that yields a weekly net margin of $806, and that distribution costs are estimated to be $620 per week. Net weekly distribution savings is estimated to be $186 per week.
19

Walsh County Distribution Analysis #2 Summary
1. Placing a T4 Solutions Locker in a Community that can Generate Increased Grocery Sales May Be a Viable Option
2. Assuming Weekly Sales Volume of $3,225 at a 25% Gross Margin at $8063. T4 Solutions Locker Weekly Costs Estimated at $6204. The Park River Redistribution Hub Could Obtain an Income Increase of $186
per Week
A T4 Solutions Locker, assumed to be located in Fordville, is estimated to produce a net increase in margin of $186 per week by being supplied by Jim’s Supervalu in Park River.
20

Park River
Hoople
Edinburg
Fordville
15.4 miles
14.2 miles
22.7 miles
21.5 miles
Park River Distribution Hub Potential Distribution RouteTwo Grocery Stores and One T4 Solutions Locker
A Combined, Weekly Distribution Route from the Park River Hub to the Hoople and Edinburg Grocery Stores and to the T4 Solutions Locker in Fordville Could Generate Nearly $400 per Week in Profitability for Hub and Also Provide nearly $200 per Week in Purchase Savings for the Two Grocery Stores.
A combined weekly distribution route that includes servicing the Hoople and Edinburg grocery stores and the installation and provision of a T4 Solutions Locker in Fordville could provide nearly $400 dollars per week in margin for the Park River distribution system. This estimation is contingent upon sales volume weekly averages of $3,225 per week per store or location.
21

1
Optimum One Shift Routes from North Dakota grocery warehouses
Map 5: Delivery Time from Fargo, Bismarck, and Minot Warehouses (Update – Minot warehouse is now closed)
The North Dakota Grocer Survey provided North Dakota rural grocer input that indicated an interest by 40% of the respondents in collaborative purchasing of foods and beverages. The survey indicated that the cost of products from distributors was the primary concern of rural grocers. The demonstration of a collaboration between a major distributor and regional grocers could be a solution for cost concerns of the grocers and efficiency concerns of the distributor.
Prepared by N.C. Doty & Associates, LLC
Rural Grocery Distribution Prefeasibility Study – Geographic Information System, Routing Analysis, and Data Visualization
UGPTI's proposal, which follows, contains information and data that are privileged, confidential, and/or proprietary to UGPTI. This information and data is not made available for public review, and is submitted on a confidential basis only in response to a specific customer request. The information contained herein is protected as codified and any improper use, distribution, or reproduction is specifically prohibited. No license or right of any kind whatsoever is granted to any third party to use the information contained herein unless a written agreement exists between UGPTI and the third party that desires access to the information. The information contained herein is submitted for purposes of review and evaluation in connection with UGPTI's response to the specific request denoted herein. No other use of the information and data contained herein is permitted without the express written permission of UGPTI. Under no condition should the information contained herein be provided in any manner whatsoever to any third party without first receiving the express written permission of UGPTI.
North Dakota State University Upper Great Plains Transportation Institute NDSU Dept 2880 l P.O. Box 6050 Fargo, North Dakota 58108-6050
AUGUST 15 2018
Prepared for: North Dakota Association of Rural Electric Cooperatives
By Alan Dybing, PhD., Associate Research Fellow Upper Great Plains Transportation Institute North Dakota State University

Contents 1. Overview ................................................................................................................................ 3
2. Geographic Information System Data ............................................................................... 3
2.1. Routable Roadway Network ........................................................................................ 3
2.2. Store and Supplier Address Geocoding ..................................................................... 4
3. Visual Representation of Survey Results ............................................................................. 5
4. Routing Comparisons ......................................................................................................... 15
Routing Assumptions............................................................................................................... 15
Baseline Routes ....................................................................................................................... 15
Distributor 1 Baseline Route ................................................................................................ 16
Distributor 2 Baseline Route ................................................................................................ 17
Distributor 3 Baseline Route ................................................................................................ 18
Distributor 4 Baseline Route ................................................................................................ 19
Optimized Routes .................................................................................................................... 20
5. Service Areas ....................................................................................................................... 21

1. Overview UGPTI was contracted to provide spatial modeling and data visualization for a pre-feasibility study of the distribution system for rural grocery stores serving small communities in North Dakota. As part of this process, publicly available data was used in conjunction with survey data collected by the North Dakota Association of Rural Electric Cooperatives and Neil Doty & Associates.
2. Geographic Information System Data 2.1. Routable Roadway Network Within the initial project scope, a primary task would be to develop a geospatial model to represent supply chain movements between grocery wholesalers and rural grocery stores. In order to complete this analysis, a routable network was constructed using line shapefiles sourced from the United States Census Bureau Topologically Integrated Geographic Encoding and Referencing (TIGER) data system. TIGER road shapefiles include numerous attributes that describe the ownership, surface type, travel speed and accessibility of all roads and trails within a specified geographic extent. Although the geographic scope of the study is the state of North Dakota, some supplier locations were located in Minnesota and selected counties linking these locations were included in the network. As not all rural grocery stores are located on primary or secondary roads, the full road system was downloaded for each of the counties within the study area. These county shapefiles were merged into one shapefile consisting of 53 counties in North Dakota and 16 in Minnesota.
A GIS network is initially a representation of a road system that is primarily used for mapping or analytical purposes. Network analysis requires a roadway network that is routable, that is – connected at logical intersections with minimal error in connectivity. Often, connecting individual road segments at end points will provide a sufficient level of connectivity, but network quality checks must be implemented to ensure that the road network is not underconnected (end points exceed a specified distance and are not connected) or overconnected (a road segment is connected to another segment that does not physically touch, such as a county road crossing an interstate road via a ramp-less overpass).
Once connectivity has been established, impedance measures are established. Impedance is essentially a cost of utilizing segments of road, and the network routing process will seek to minimize the cost of traveling between origin and destination points. Often, distance is used as an impedance factor. In North Dakota’s road network, this is often problematic, particularly on the county road systems. In cases where section line roads have curves rather than 90 degree intersections, the GIS routing algorithm interprets this as a shorter distance option and the resulting routes exhibit a tell-tale “zig-zag” pattern which is not reflective of common traveler behavior. Time is also a commonly used impedance factor and is a closer representation of traveler behavior, so long as the travel speeds have large enough discrepancies between road classes.

This study utilized time as an impedance factor with arbitrarily lower speed limits on lower classes of roads to reflect traveler behavior of choosing a higher class of road (i.e. state highway vs. township road) whenever possible.
2.2. Store and Supplier Address Geocoding Once the GIS road network was established the process of geocoding origins and destinations was undertaken. A list of mailing addresses for rural grocery stores was provided by NDAREC with street addresses where available. In cases where the store mailing address was a PO Box, the physical location of the store was determined, using Google Earth and the latitude and longitude coordinates were collected. For stores with a physical location as a mailing address, the World Geocode Service was utilized to reconcile the coordinates of individual stores. The resulting store locations are shown in Figure 1 below. A similar process was used to locate the wholesaler locations and are shown in Figure 2.
Figure 1. Locations of Rural Grocery Stores Surveyed

Figure 2. Wholesale Distributor Locations
3. Visual Representation of Survey Results Neil Doty & Associates developed the survey instrument. A separate report will be complied by Neil Doty & Associates that addresses the descriptive statistics as well as the survey process. Once the initial survey results were completed, the responses were merged with the individual store locations, where possible. A unique identifier for each store was not implemented during the survey process, but survey respondents did provide zip code information that was used to match responses with the mailing list addresses. Non-matches were identified by NDAREC staff. Visual representation of the survey responses are shown in Figures 3-11.

Figure 3. Survey Respondents and Non-Responses

Figure 4. Stores whom Indicated Wholesale Distributor Service.
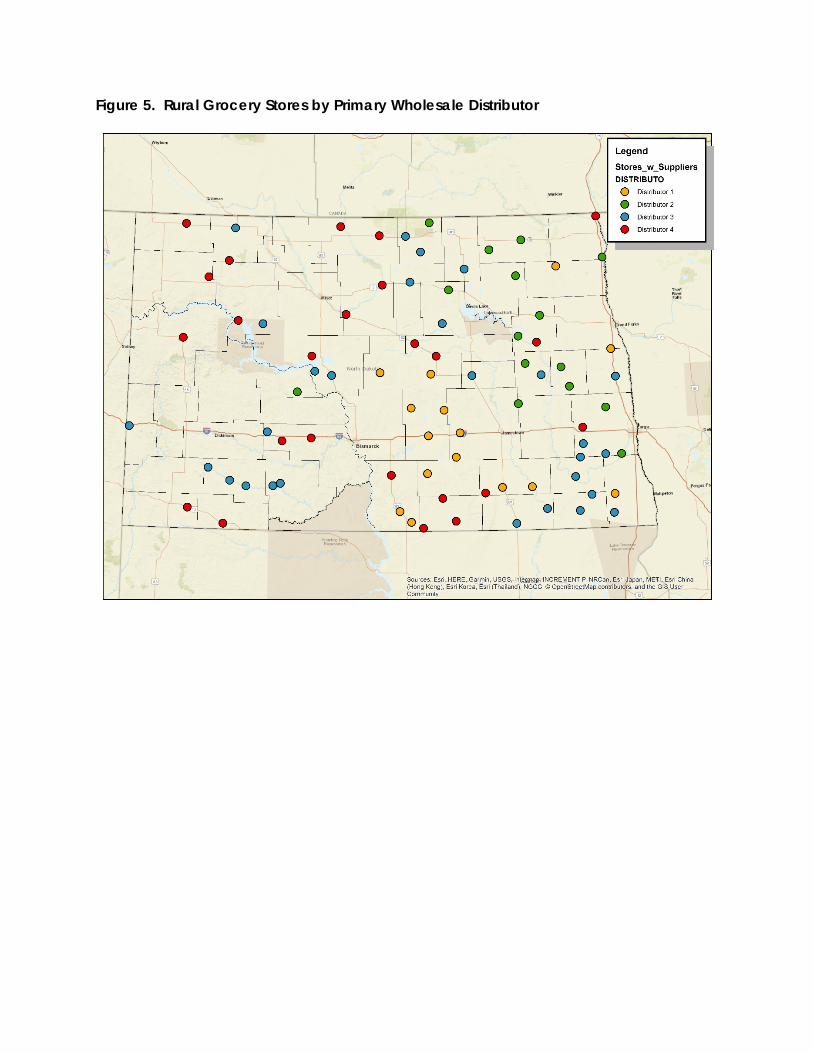
Figure 5. Rural Grocery Stores by Primary Wholesale Distributor

Figure 6. Stores that Reported Direct Sales Distributor Service

Figure 7. Stores that Reported Sourcing from Big Box Store Locations

Figure 8. Stores that Reported Direct from Farm Sourcing

Figure 9. Stores that Currently Collaborate or are Intersted in Collaboration

Figure 10. Stores that have Excess Storage Capacity

Figure 11. Percent of Goods Procured by Source

4. Routing Comparisons The reported wholesale distributors shown in Figure 5 identify the service areas of the four largest wholeale distributors by store numbers. To estimate potential distribution cost savings due to consolidation or route optimization, the initial routes for each wholesale distributor were estimated to develop a baseline cost estimate. If the actual routes numbers and highway segments traveled were known, the true distribution cost could be used for the baseline estimate. At the time of the writing of this report, the actual routes traveled are not known, and therefore were estimated. Each of the modeled baseline and optimized routes reach each store once, representing a weekly service from wholesale distributors.
Routing Assumptions A variety of assumptions was made to achieve route estimates for each of the four largest distributors. First, the routes estimated only include rural grocery stores. The survey instrument was not administered to grocery stores in urban areas, which undoubtedly comprise a portion of the routes that also serve rural grocery stores. The resulting routes connect only the distributor warehouses to rural grocery stores. Truck capacities were not known as well, but it is assumed that the volume purchased at rural stores in each route would not exceed the truck capacity, either by weight or by volume. The primary restriction on selected routes is based upon time. The routing analysis utilized a ten hour per day time limit representing the hours of service regulations for drivers serving the routes. The delivery time at each store was estimated to be 30 minutes. In reality, the time spent during deliveries would vary from store to store based upon loading facilities and volume delivered. Since this information was not available, the 30-minute delivery time was assumed for all stores. Finally, the routes estimated only include rural grocery stores located within the state of North Dakota. It is likely that many of the distributors also serve stores in Minnesota and South Dakota and that the routes used to serve stores in North Dakota would include stores outside of the state. For this reason, the baseline and estimated routes should only be used for the purpose of comparison and the costs estimated should not be used as potential cost savings under the current distribution system.
Baseline Routes For each of the four major distributors’ baseline routes were estimated using the Network Analyst add-in to ESRI ArcMap. For each of the distributors, six routes were modeled, though only the number of routes required serving a distributor’s stores were used, constrained by the hours of service per route. In all cases, the software selected no more than four routes. Network Analyst uses the highway road network to calculate distance, time and cost for use in route selection. Given all possible routes, the software selects the route, which serves locations at the lowest cost given the time constraints. The cost parameters used in developing the delivery cost were the labor rate for drivers ($25/hour) and a $2/mile truck operating cost. These costs are consistent with average truck driver wages in North Dakota and estimates of trucking cost using the UGPTI Truck Cost Calculator. Individual baseline routes for each distributor are discussed below.
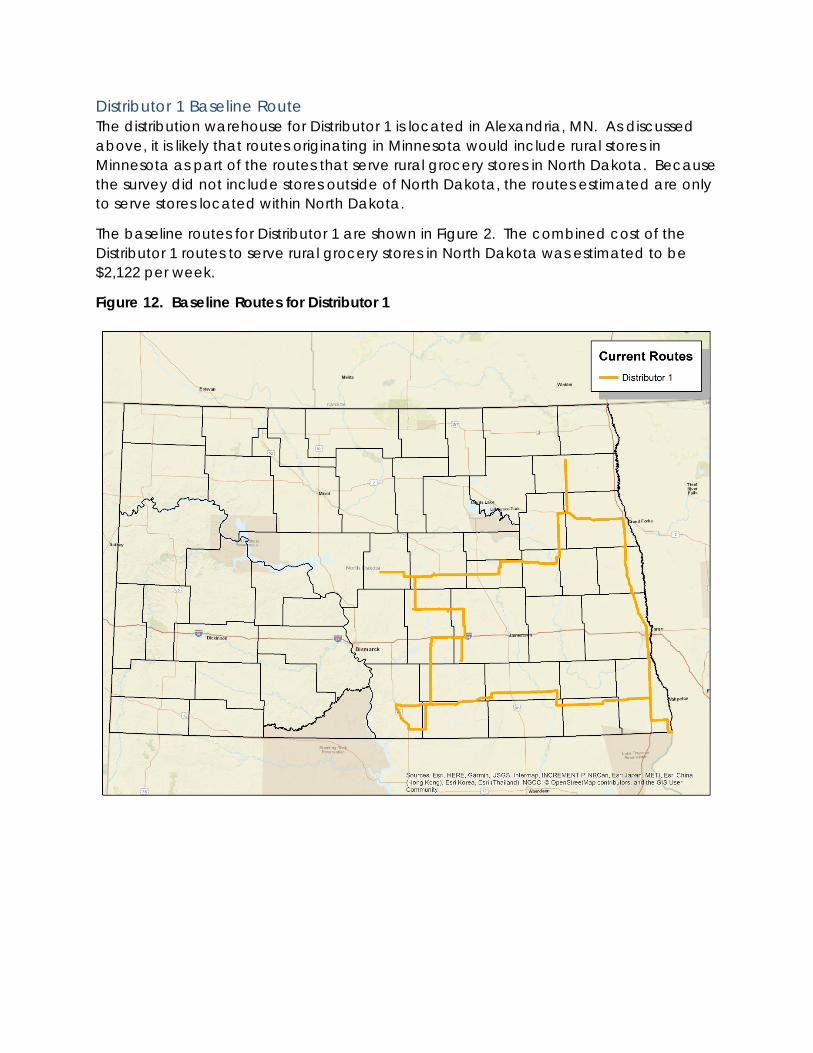
Distributor 1 Baseline Route The distribution warehouse for Distributor 1 is located in Alexandria, MN. As discussed above, it is likely that routes originating in Minnesota would include rural stores in Minnesota as part of the routes that serve rural grocery stores in North Dakota. Because the survey did not include stores outside of North Dakota, the routes estimated are only to serve stores located within North Dakota.
The baseline routes for Distributor 1 are shown in Figure 2. The combined cost of the Distributor 1 routes to serve rural grocery stores in North Dakota was estimated to be $2,122 per week.
Figure 12. Baseline Routes for Distributor 1

Distributor 2 Baseline Route The distribution warehouse for Distributor 2 is located in Ada, MN. As discussed above, it is likely that routes originating in Minnesota would include rural stores in Minnesota as part of the routes that serve rural grocery stores in North Dakota. Because the survey did not include stores outside of North Dakota, the routes estimated are only to serve stores located within North Dakota.
The baseline routes for Distributor 2 are shown in Figure 3. The combined cost of the Distributor 2 routes to serve rural grocery stores in North Dakota was estimated to be $2,559.92 per week.
Figure 13. Baseline Routes for Distributor 2

Distributor 3 Baseline Route The distribution warehouses for Distributor 3 are located in Fargo and Minot. The baseline routes for Distributor 3 are shown in Figure 4. The combined cost of the Distributor 3 routes to serve rural grocery stores in North Dakota was estimated to be $5,009.05 per week.
Figure 14. Baseline Routes for Distributor 3

Distributor 4 Baseline Route The distribution warehouses for Distributor 3 are located in Fargo and Minot. The baseline routes for SuperValu are shown in Figure 5. The combined cost of the SuperValu routes to serve rural grocery stores in North Dakota was estimated to be $5,620.29 per week.
Figure 15. Baseline Routes for Distributor 4

Optimized Routes The baseline routes discussed above are a representation of potential service routes for the four largest wholesale distributors in North Dakota. These routes assume that the current warehouse supplier remains constant for rural stores in North Dakota. The total cost for all of the combined routes for these four suppliers is $15,311.26. To examine whether there are potential efficiencies in route selection, an optimal supplier routing analysis was conducted. This analysis assumes that stores can switch suppliers and that wholesale distributors would not have any volume restrictions in place. The optimized routes are found in Figure 6. The selection of these routes are primarily based upon location of warehouses relative to the location of rural grocery stores. The total cost of the combined optimized routes is $7,937.00, which is roughly half of the combined baseline routes. This demonstrates that there are potential cost savings from route consolidation. Whether these cost savings can be realized is dependent on many decisions which are made by independent private organizations.
Figure 16. Optimized Routes without Predetermined Suppliers

5. Service Areas Using ArcMap’s Network Analyst utilities, service areas for each rural grocery store were mapped. Within the service area utility, the user can specify the search distances. For the purposes of this study, 10, 20 and 30-mile distances were specified. Figure 17 below shows the distances represented by three colors and incorporated cities in North Dakota using points.
Figure 17. Ten, Twenty and Thirty-Mile Service Boundaries from Rural Grocery Stores in North Dakota

![Research on Rural E-commerce Terminal Distribution ......2020/07/23 · commerce into rural comprehensive demonstration areas is close to 90% [1]. As the penetration rate of the rural](https://img.pdfslide.net/doc/110x75/5fed1f23539cb437676fdc50/research-on-rural-e-commerce-terminal-distribution-20200723-commerce.jpg)