Embed Size (px)
Citation preview
Commercial and Operational Planning for Revenue Growth and Cost Reduction
Dr Emre Serpen,
Intervistas Consulting Group
EVP

Realizing the vision together
Intervistas team members have extensive airline strategy
and network design assignments worldwide

Realizing the vision together 3
InterVISTAS has extensive experience and expertise with improvements in
airline commercial operations.
Driving in revenue growth and cost reduction for airlines.
Revenue Growth
• Network Optimisation
• Hub optimisation
• Fleet utilisation
• Pricing
• Revenue Management
• Distribution
• Cargo optimisation
Cost Reduction
• Benchmarking and diagnostic assessment
• Route performance and restructuring
• Crew Productivity Improvement
• MRO cost reduction and outsourcing
• Ground handling cost reduction and
outsourcing
• Operations Control Centre Improvement
• Distribution cost reduction
• Staffing and administrative costs
InterVISTAS offers industry data, optimisation tools, and former airline
experts whose approach is analytical with a focus on delivery of benefits.
InterVISTAS Offer Extensive Experience and Expertise with Improving
Airline Strategy, Tactics, and Functional Effectiveness Improving
Revenues and Reducing Costs
Realizing the vision together
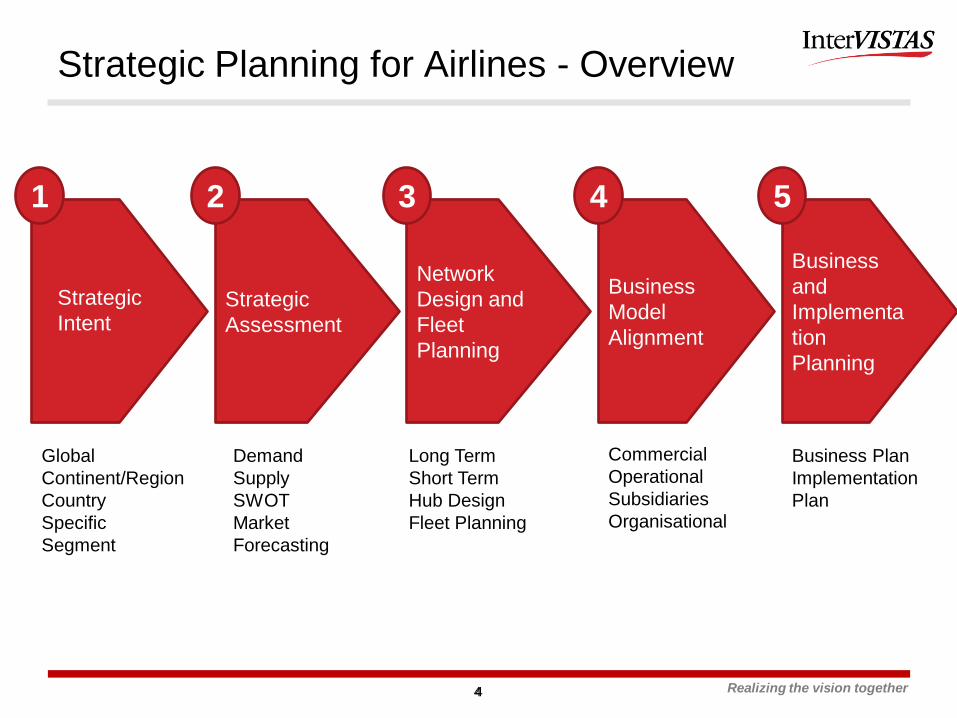
Strategic Planning for Airlines - Overview
4 4
Strategic
Assessment
Network
Design and
Fleet
Planning
Business
Model
Alignment
Business
and
Implementa
tion
Planning
Strategic
Intent
1 2 3 4 5
Global
Continent/Region
Country
Specific
Segment
Long Term
Short Term
Hub Design
Fleet Planning
Demand
Supply
SWOT
Market
Forecasting
Commercial
Operational
Subsidiaries
Organisational
Business Plan
Implementation
Plan
Realizing the vision together
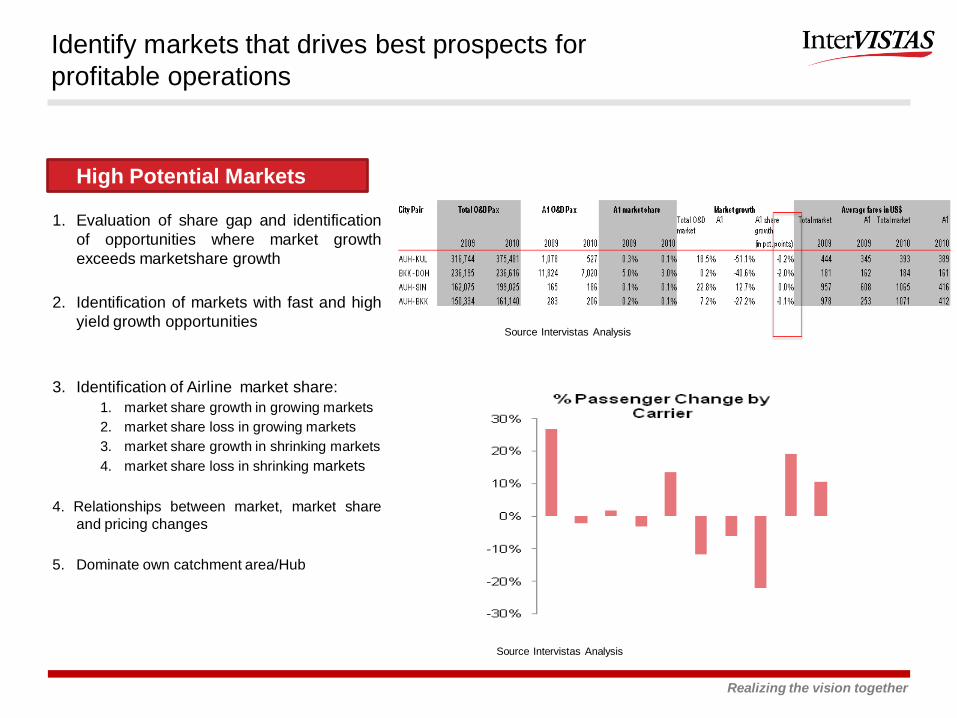
High Potential Markets
Identify markets that drives best prospects for
profitable operations
1. Evaluation of share gap and identification
of opportunities where market growth
exceeds marketshare growth
2. Identification of markets with fast and high
yield growth opportunities
3. Identification of Airline market share:
1. market share growth in growing markets
2. market share loss in growing markets
3. market share growth in shrinking markets
4. market share loss in shrinking markets
4. Relationships between market, market share
and pricing changes
5. Dominate own catchment area/Hub
Source Intervistas Analysis
Source Intervistas Analysis

Realizing the vision together
Market forecasting
Top down = GDP/capita X Elasticity
Bottom Up = MIDT/PAXIS/DIIO
Analyse forecast results to identify specific market forecast insights:
1. Sort by market size
2. Sort market growth rate
3. Sort by yield
4. Sort by circuitry
5. Sort by Size x growth rate x yield x circuitry
6. Destinations Airline is not flying
Under represented markets identified in the
market forecast will be used in scenario
formulation
Market Forecasting
Forecast and focus on
markets with growth and yield
yield
Source Airbus
Realizing the vision together
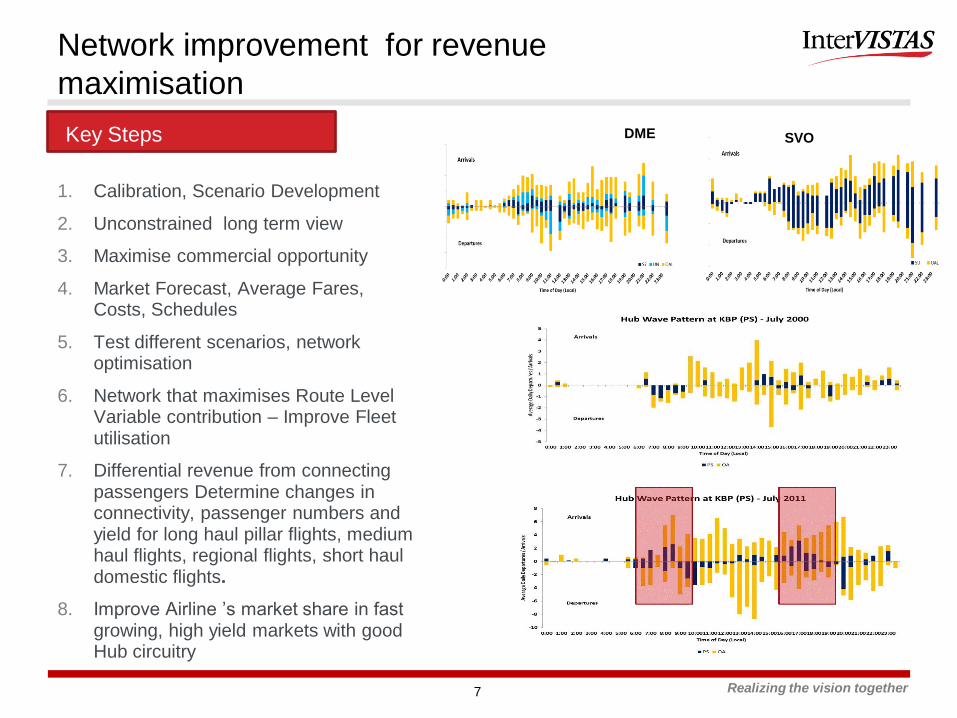
Network improvement for revenue
maximisation
7
1. Calibration, Scenario Development
2. Unconstrained long term view
3. Maximise commercial opportunity
4. Market Forecast, Average Fares, Costs, Schedules
5. Test different scenarios, network optimisation
6. Network that maximises Route Level Variable contribution – Improve Fleet utilisation
7. Differential revenue from connecting passengers Determine changes in connectivity, passenger numbers and yield for long haul pillar flights, medium haul flights, regional flights, short haul domestic flights.
8. Improve Airline ’s market share in fast growing, high yield markets with good Hub circuitry
Key Steps DME SVO
Realizing the vision together
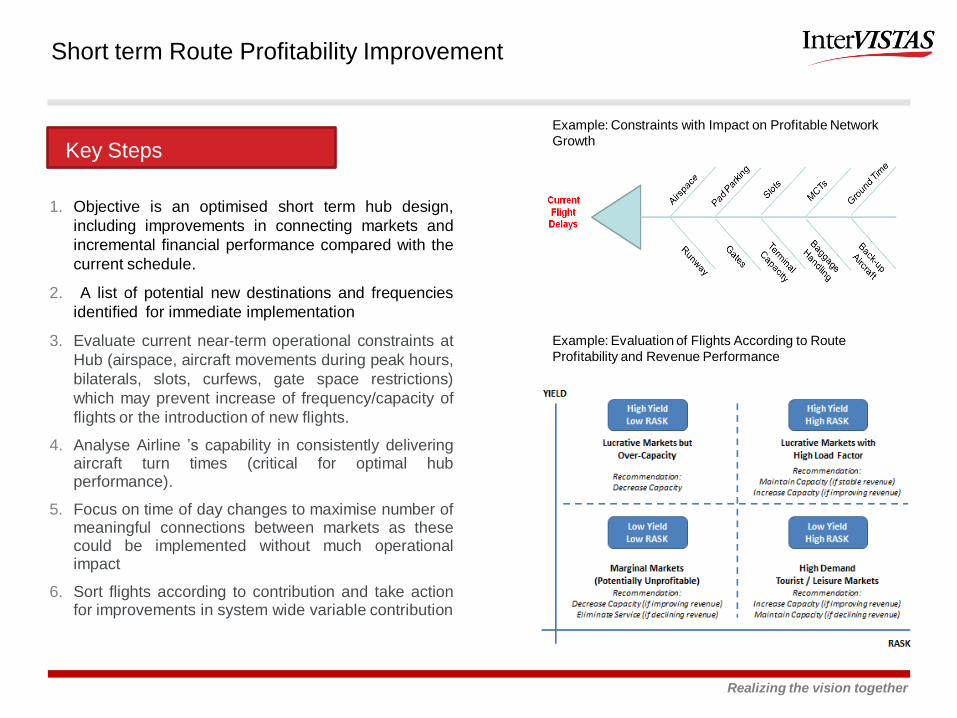
1. Objective is an optimised short term hub design,
including improvements in connecting markets and
incremental financial performance compared with the
current schedule.
2. A list of potential new destinations and frequencies
identified for immediate implementation
3. Evaluate current near-term operational constraints at
Hub (airspace, aircraft movements during peak hours,
bilaterals, slots, curfews, gate space restrictions)
which may prevent increase of frequency/capacity of
flights or the introduction of new flights.
4. Analyse Airline ’s capability in consistently delivering aircraft turn times (critical for optimal hub performance).
5. Focus on time of day changes to maximise number of meaningful connections between markets as these could be implemented without much operational impact
6. Sort flights according to contribution and take action for improvements in system wide variable contribution
Short term Route Profitability Improvement
Example: Constraints with Impact on Profitable Network
Growth
Example: Evaluation of Flights According to Route
Profitability and Revenue Performance
Key Steps

Realizing the vision together
.
1. Develop optimal fleet plan supporting the long term network plan
2. Provide recommendations for redeployment of fleet plan
3. Review current Airline fleet including age, maintenance requirements/costs, onboard product, range, fuel burn and fleet commonality.
4. Review current fleet orders and compare it against the optimised long term network requirements maximizing route profitability and fleet utilization.
5. Apply fleet plan to proposed passenger forecast and schedule to assess the optimal types/mix of aircraft that will most efficiently operate the route network.
6. Assess how the fleet plan will evolve over the forecast period taking retirements and new deliveries into consideration.
7. Ensure that fleet utilization is optimised
8. Develop optimal narrow body and wide body fleet ratios in the near term, considering optimal requirements for the Hub
9. Buy versus lease calculations
Selection of the right fleet plan, and improvement of
fleet utilisation
Example: Fleet Operating Costs Analysis
Example: Fleet Optimisation Analysis
Key Steps
Intervistas Analysis
Realizing the vision together
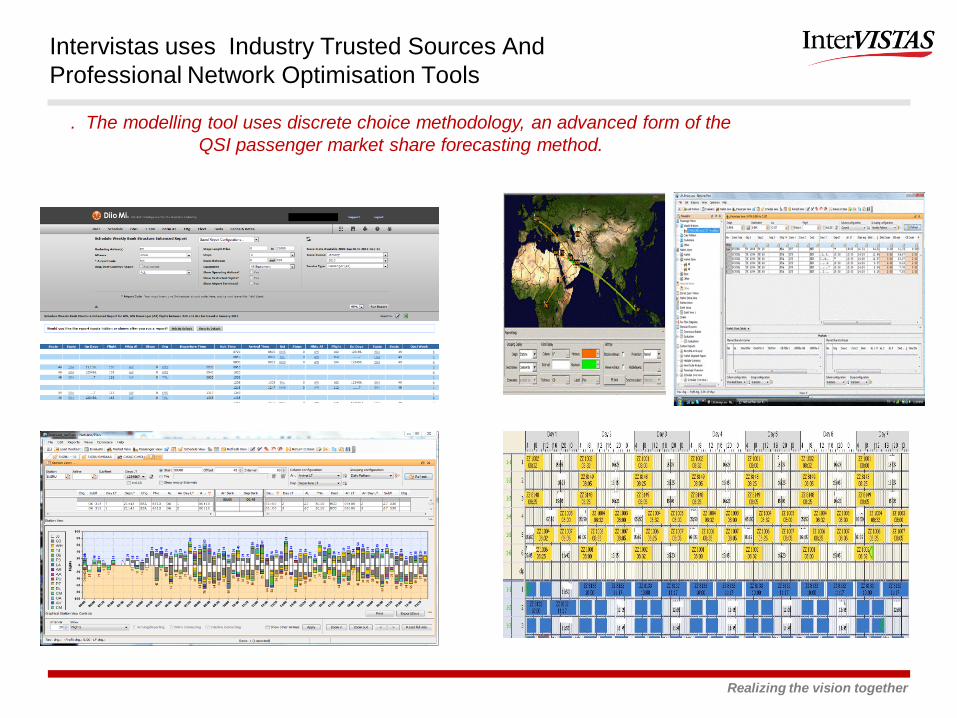
Intervistas uses Industry Trusted Sources And
Professional Network Optimisation Tools
. The modelling tool uses discrete choice methodology, an advanced form of the
QSI passenger market share forecasting method.
Realizing the vision together
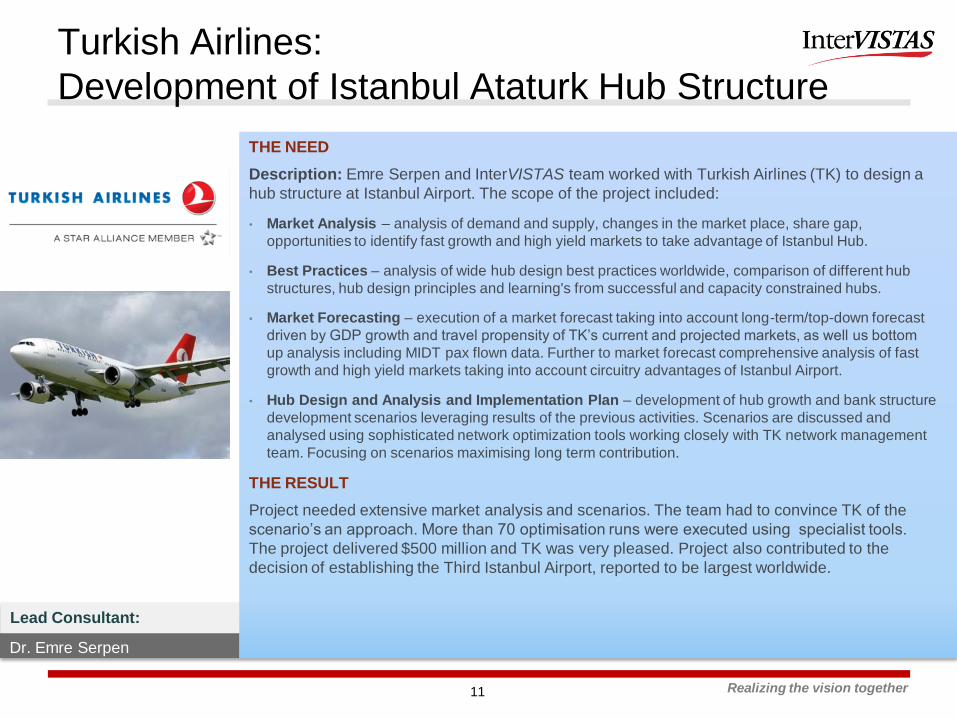
Lead Consultant:
Turkish Airlines:
Development of Istanbul Ataturk Hub Structure
THE NEED
Description: Emre Serpen and InterVISTAS team worked with Turkish Airlines (TK) to design a
hub structure at Istanbul Airport. The scope of the project included:
• Market Analysis – analysis of demand and supply, changes in the market place, share gap,
opportunities to identify fast growth and high yield markets to take advantage of Istanbul Hub.
• Best Practices – analysis of wide hub design best practices worldwide, comparison of different hub
structures, hub design principles and learning's from successful and capacity constrained hubs.
• Market Forecasting – execution of a market forecast taking into account long-term/top-down forecast
driven by GDP growth and travel propensity of TK’s current and projected markets, as well us bottom
up analysis including MIDT pax flown data. Further to market forecast comprehensive analysis of fast
growth and high yield markets taking into account circuitry advantages of Istanbul Airport.
• Hub Design and Analysis and Implementation Plan – development of hub growth and bank structure
development scenarios leveraging results of the previous activities. Scenarios are discussed and
analysed using sophisticated network optimization tools working closely with TK network management
team. Focusing on scenarios maximising long term contribution.
THE RESULT
Project needed extensive market analysis and scenarios. The team had to convince TK of the
scenario’s an approach. More than 70 optimisation runs were executed using specialist tools.
The project delivered $500 million and TK was very pleased. Project also contributed to the
decision of establishing the Third Istanbul Airport, reported to be largest worldwide.
Dr. Emre Serpen
11

Realizing the vision together
Pricing and Revenue Management Improvement Approach to
Improve Revenues, Load Factor and Yield
12
Diagnosis Solution
Development
Testing
& Evaluation
Implementation
Support
Improved
Revenue
Results
Market and Revenue Share versus Expected
Market Segmentation : use of Fare Rules and
Booking classes
Effective use of systems, tools and data
Organisation structure and interaction with
Sales, Airports
Processes and working methods
“Use of time” analysis
Development of detailed processes
and working methods
Liaise with systems suppliers
Hands on and class-room training
Coaching
Review and Assessment of results
KPIs & Performance Management

Realizing the vision together
Revenue Management Improvement
13
1. Review of fares, competitors,
Matrix
2. Strategic pricing
3. Target LF profiles
4. Critical flight management
5. Longer term focus
6. Effective sales interactions
7. Overbooking management
8. Standard processes, KPI’s
9. Commercial plan do review
Illustration – Analysis of Fare Structures and Use of RBD’s
Analysis of fare usage is important to understand where there are potential opportunities:
• Mismatch between actual yield and published fares: abuse or pro-ration issues?
• Fares in wrong class, Overlap of RBD’s, Over or under use of RBD’s
• Exchange rate impacts? Inconsistent fare conditions?
• Poor inventory controll, Revenue Leakage ?
Key Steps

Realizing the vision together
Example: Implementation a New “Revenue Planning &
Delivery” Process
14
Revenue
Budget
Revenue
BudgetMonitoringMonitoring ActionAction ForecastForecast
Shared targets
- Pricing, YM and
Sales
Shared targetsShared targets
-- Pricing, YM and Pricing, YM and
SalesSales
Revenue
Delivery Plan
Revenue
Delivery Plan
Revenue Plan
Workshops
Output = Numbers
+ Actions
Revenue Plan Revenue Plan
WorkshopsWorkshops
Output = Numbers Output = Numbers
+ Actions+ Actions
RM & Sales
review
variation vs plan
-agree actions
RM & Sales RM & Sales
reviewreview
variation variation vsvs planplan
--agree actionsagree actions
Joint actions
agreed &
coordinated
Joint actions Joint actions
agreed &agreed &
coordinatedcoordinated
Airline Exec Team
Understands
where
Revenue is going
Airline Exec TeamAirline Exec Team
Understands Understands
where where
Revenue is goingRevenue is going
Input to forecastCommunicate new
fares & product.
Manage agents.
Monitor market and
competitor actions –
price, product, promotion.
Agent performance.
Targets for Revenue
by Market. Agents
targets
Sales &
Distribution
Create ForecastRevenue AccountingRevenue AccountingBudget CreationFinance
Input to forecastApprove & file new
fares.
Input to IATA
Monitor market and
competitors fares.
Identify Price
Opportunities
Targets for Revenue
and Yield by Market.
Pricing Strategy.
Pricing Policy &
Guidelines.
Tariffs & Pricing
Input to forecastRequest capacity
changes. Adjust seat
availability and
overbooking
Set and review seat
availability versus new
bookings, schedule
Targets for R/ASK by
Route, OverbookingYield
Management
Support Pricing
PromotionsMarketing &
Advertising
Product
Short term schedule and
a/c adjustmentsNetwork &
Scheduling
Department
Route and Market
Joint Planning
Sessions to decide
actions required to
meet targets.
Annual Seasonal Daily, Weekly, Monthly Monthly
EUROPE 102,724,572 20 159,911,765 11 302,091,494 6 622 9 8.95 2 3.73 4 102,724,572 20 159,911,765 11 302,091,494 6
ABU DHABI 2,682,202 5 3,377,248 0 4,662,372 6 72 -4 0.79 5 0.58 -1 2,682,202 5 3,377,248 0 4,662,372 6
BAHRAIN 1,165,241 -21 1,431,846 -19 3,579,906 15 40 -17 0.81 -3 0.33 -32 1,165,241 -21 1,431,846 -19 3,579,906 15
DOHA 1,289,804 -4 1,675,258 -3 2,862,860 0 59 -2 0.77 0 0.45 -4 1,289,804 -4 1,675,258 -3 2,862,860 0
DUBAI 42,116,594 2 48,871,655 4 83,360,580 28 59 -13 0.86 -3 0.51 -21 42,116,594 2 48,871,655 4 83,360,580 28
KUWAIT 11,876,004 46 11,982,368 20 24,159,752 40 50 -8 0.99 22 0.49 4 11,876,004 46 11,982,368 20 24,159,752 40
MUSCAT 981,779 -12 1,663,635 -51 3,050,168 -40 55 -13 0.59 81 0.32 46 981,779 -12 1,663,635 -51 3,050,168 -40
SHARJAH 458,376 4 642,805 7 1,638,824 0 39 3 0.71 -3 0.28 4 458,376 4 642,805 7 1,638,824 0
SALALAH 123,949 0 179,072 0 1,916,761 0 9 9 0.69 0 0.06 0 123,949 0 179,072 0 1,916,761 0
GULF 60,693,949 3 69,823,887 -5 125,231,223 6 382 -6 6.21 12 3.02 0 60,693,949 3 69,823,887 -5 125,231,223 6
AMMAN 10,322,184 -16 12,355,468 -21 21,392,468 -18 58 -2 0.84 6 0.48 2 10,322,184 -16 12,355,468 -21 21,392,468 -18
AHWAZ 0 0 3,796,926 31 4,455,570 49 85 -12 0 0 0 0 0 0 3,796,926 31 4,455,570 49
YAZD 0 0 12,279,325 191 14,598,325 233 84 -12 0 0 0 0 0 0 12,279,325 191 14,598,325 233
BEIRUT 7,871,040 -66 8,560,142 -64 20,036,136 -52 43 -14 0.92 -5 0.39 -29 7,871,040 -66 8,560,142 -64 20,036,136 -52
DAMASCUS 16,539,085 -11 23,901,938 -15 37,596,418 -22 64 5 0.69 5 0.44 14 16,539,085 -11 23,901,938 -15 37,596,418 -22
ISFAHAN 0 0 8,449,787 -41 9,911,620 -35 85 -8 0 0 0 0 0 0 8,449,787 -41 9,911,620 -35
KERMAN 0 0 15,262,146 254 18,418,470 319 83 -15 0 0 0 0 0 0 15,262,146 254 18,418,470 319
MASHAD 179,930 23 16,697,264 37 19,737,648 44 85 -4 0.01 -11 0.01 -15 179,930 23 16,697,264 37 19,737,648 44
URMIEH 0 0 4,080,250 0 4,809,750 0 85 85 0 0 0 0 0 0 4,080,250 0 4,809,750 0
RASHT 0 0 11,131,965 0 14,424,480 0 77 77 0 0 0 0 0 0 11,131,965 0 14,424,480 0
SANAA 2,921,776 -32 3,799,827 -37 11,000,481 14 35 -28 0.77 8 0.27 -40 2,921,776 -32 3,799,827 -37 11,000,481 14
SARY 0 0 16,275,054 119 18,056,040 132 90 -5 0 0 0 0 0 0 16,275,054 119 18,056,040 132
SHIRAZ 0 0 13,580,796 444 15,677,440 514 87 -11 0 0 0 0 0 0 13,580,796 444 15,677,440 514
TABRIZ 0 0 5,850,390 19 6,375,980 26 92 -5 0 0 0 0 0 0 5,850,390 19 6,375,980 26
TEHRAN 29,961,031 20 62,757,134 11 75,952,362 23 83 -9 0.48 8 0.39 -2 29,961,031 20 62,757,134 11 75,952,362 23
ZAHEDAN 0 0 5,046,722 0 6,309,800 0 80 80 0 0 0 0 0 0 5,046,722 0 6,309,800 0
MIDDLE EAST 67,795,046 -5 223,825,134 58 298,752,988 77 1214 8 3.71 1 1.98 -4 67,795,046 -5 223,825,134 58 298,752,988 77
(SAR) % vly (000s) % vly (000s) % vly % pts vly % vly % vly (SAR) % vly (000s) % vly (000s) % vly % pts vly % vly % vly
ASKs Seat Factor Rev/ASK Rev/RPK Revenue Rev/RPKRPKs ASKs Seat Factor Rev/ASKMarket
Month Year To Date
Revenue RPKs

Realizing the vision together
Lead Consultant:
An Example of How a Leading Latin American Carrier Improved its Revenues
Through a Commercial Change Management Program
1. Kept fare differential with competitors
2. Fine tuned pax mix
Dr.. Emre Serpen
15
1. Worked with promotions
2. Opened economic classes
3. Unsold group blocks released
System
Total Flights 2226 2174 2140 2129 2155 2144 2109
Total Passengers 171434 163862 170296 165571 157237 155198 158447
Total Capacity 272927 264816 261146 260323 263648 262129 257723
Load Factor 62.8% 61.9% 65.2% 63.6% 59.6% 59.2% 61.5%
Total Revenue
RASK
Average Fare
Managed Flights 441 395 406 352 320 369 418
Managed Flight - % of TTL 19.8% 18.2% 19.0% 16.5% 14.8% 17.2% 19.8%
Low Yield Spill Managed Flights' LF 82.5% 82.3% 82.4% 82.8% 79.0% 78.7% 78.7%
Posted Flights 91 73 68 62 39 50 57
High Yield Spill Posted Flights - % of TTL 4.1% 3.4% 3.2% 2.9% 1.8% 2.3% 2.7%
Overbook ing Levels Low Posted Flights' LF 91.5% 94.3% 92.1% 95.9% 91.0% 91.7% 89.2%
Denied Boardings 283 165 242 155 108 130 195
Overbook ing Levels High DBs per 1000 pax 1.65 1.01 1.42 0.94 0.69 0.84 1.23
Managed/Posted Flights 4.8 5.4 6.0 5.7 8.2 7.4 7.3
Managed Flights’ LF
should be approx. 90%
Managed Flights’ LF
should be approx. 90%
Posted Flights’
LF
should be
approx. 95%
Posted Flights’
LF
should be
approx. 95%
AM YOY Change in RASK
-30%
-20%
-10%
0%
10%
20%
30%
AC
AM
EX
BJX
LA
X
CU
NM
EX
GD
LLA
X
GD
LM
EX
GD
LTIJ
HM
OM
EX
LA
XM
EX
ME
XM
IA
ME
XM
ID
ME
XM
TY
ME
XP
VR
ME
XTIJ
ME
XV
ER
ME
XV
SA
Market
% C
hange,
2002 t
o 2
003
Q1
Q2
Q3
THE RESULTS
• Improvement of revenue
during project
• Significant knowledge
development
• Adopt PRM policies and
procedures
• Adopt performance
measures
• Excellent teamwork with
sales
• Effective use of RM tool

Realizing the vision together
Lead Consultant:
Copa Airlines Revenue Management Needs Study
THE NEED
In 2005 Copa Airlines had grown to a size and network complexity where they needed a sophisticated revenue management system to manage the diverse markets and mix of local and connecting traffic. The airline was unfamiliar with the science behind the various systems and needed guidance in selecting a solution that would address their needs.
THE SOLUTION
InterVISTAS performed a requirements analysis study to define the airline’s critical RM needs from which an RFI and RFP where developed and distributed to the prospective vendors. InterVISTAS coordinated evaluation of the vendor responses leading to a sound system recommendation. InterVISTAS applied its revenue management simulation model to demonstrate the value of increased forecast accuracy and provide the justification for the system investment. Additionally, InterVISTAS identified a number of opportunities for process and policy improvements necessary to maximize system benefits and provided a comprehensive revenue management concept training program to better focus the efforts of the RM controllers.
THE RESULT
As a result of the study, Copa Airlines selected and implemented a sophisticated revenue management system that recovered its costs within the first three months of implementation and contributed substantially to the airline’s ability to maintain a yield premium versus their competitors.
Nigel Brownlow
16

Realizing the vision together
Cost savings thru improving distribution Mix
17
1. Determine the current channel mix, identify
distribution processes, revenue and cost by
channel, and find improvement opportunity
2. Develop future distribution channel mix
including specific processes, costs, and
margins
3. Reduce distribution costs
4. Review channel mix 1. current distribution channel mix, segments,
2. unit revenues, unit costs per channel,
3. including benchmarking GDS fares,
4. particular high yield segments, first and
business class sales
5. Channels to include Travel Agency/GDS,
ATO/CTO, online corporate, call centre,
website
Retail Travel Agents
Wholesale Travel Agents
Corporate Travel Agents
Internet travel agents such as
Expedia, Travelocity
Portals linked via GDS such as
Opodo and Orbitz (other)
Indirect
Call Centres
ATO/CTO
Corporate Implants
GSA’s
Airlines’ own websites
Airlines’ websites for corporate
bookings
Orbitz “Supplier Link”
Direct
Off-LineOn-Line
Business
Leisure
Decreasing distribution costs
De
creasin
g d
istr
ibu
tio
n c
osts
Key Steps

Realizing the vision together
Distribution cost reduction
18
Source Intervistas Analysis

Realizing the vision together
Lead Consultant:
Oman Air:
Distribution Strategy
THE NEED
Description: Oman Air wanted to improve its distribution cost structure and take advantage of
direct distribution as well as achieving better reach to high yield business passengers. Team led
by Dr. Emre Serpen developed a distribution strategy executing following project activities:
• Interviews and information capture on channels, segments per channel, unit revenues and
costs per channel
• Develop ‘as is’ distribution mix where segments per channel, and channel costs are identified
• Review distribution industry best practices
• Develop ‘to be‘ distribution mix expanding share of direct distribution and other measures
• Develop financial model identifying the benefits of the new distribution mix where the
distribution costs are reduced and access to high yield customers is improved
• Benchmark ancillary revenues and develop ancillary revenue improvement strategy
• Define specific projects and implementation plan for execution of the proposed distribution
strategy
THE RESULT
Distribution strategy was approved and currently being implemented by Oman Air. Project
identified significant opportunities for reduction of distribution costs.
Dr.. Emre Serpen
19

Realizing the vision together
Crew Optimisation Approach to Improve Cockpit
and Cabin Crew Productivity and Cost Reduction
20

Realizing the vision together
Cost reduction thru operations planning – reduce crew costs
1. Alignment of the operational activities support business
model changes – Review cost structure, assess changes
to the operational costs, productivity improvements
2. Determine improvements in performance targets to
support the business model changes
3. Determine target CASK to support business model
4. Review current cost structure, direct and indirect
5. Direct costs include
1. Fuel, MRO, Ground Handling, Catering,
6. Determine initiatives for productivity improvement and
unit cost reduction to meet target CASK
7. Alignment of the operational activities support business
model changes- Crew and integrated operations control
improvements
8. Alignment of organisation and performance measures
9. Projects and initiatives for reduction of operational costs
and improvements in productivity This will include major
cost items such as Fleet (Utilisation), maintenance, crew,
ground handling costs, overheads and other areas
21
Key Steps

Realizing the vision together
Example: Crew Manpower Plan
22
Dec-10 Jan Feb Mar Apr May Jun Jul Aug Sep Oct Nov Dec
Crew Demand
Block Hours Scheduled 4713 4609 5205 5225 5924 6278 6121 6368 6234 6302 6279 5836
Block Hours--Crew Month 4561 4938 5037 5225 5924 6278 6121 6368 6234 6302 6279 5836
Pay & Credit Percentage 7.39% 7.69% 7.69% 7.69% 7.69% 7.69% 7.69% 7.69% 7.69% 7.69% 7.69% 7.69%
Credit Hours 337 380 387 402 456 483 471 490 479 485 483 449
Total Hours to Crew 4898 5318 5424 5627 6380 6761 6592 6858 6713 6787 6762 6285
Crew Utilization (per line) 75.9 78.0 79.5 79.5 79.5 79.5 79.5 79.5 79.5 79.5 79.5 79.5
Crew Required: Scheduled Flying 64.6 68.2 68.2 70.8 80.2 85.0 82.9 86.3 84.4 85.4 85.1 79.1
Crew Required: Reserves for IrOps 6.5 6.8 6.8 7.1 8.0 8.5 8.3 8.6 8.4 8.5 8.5 7.9
Sick Leave 4.4 4.6 4.7 4.9 5.1 5.1 5.0 5.0 5.0 5.0 4.9 4.9
Extended sick 1.0 0.9 0.8 0.7 0.7 0.7 0.7 0.7 0.7 0.7 0.7 0.7
Vacation--Committed 5.4 9.0 9.3 4.6 13.3 9.4 10.7 13.4 10.5 11.1 4.3 8.2
Vacation for new captains 0.0 0.0 0.0 2.5 0.0 1.1 0.8 0.0 0.8 0.7 2.6 1.5
Recurrent Training 4.4 4.5 4.7 4.9 5.1 5.0 5.0 5.0 5.0 4.9 4.9 4.9
Miscellaneous Absence 1.0 1.0 1.0 1.0 1.0 1.0 1.0 1.0 1.0 1.0 1.0 1.0
Crew Required: Total 87.1 95.0 95.6 96.4 113.4 115.9 114.4 120.0 115.8 117.2 112.0 108.1
Crew Availability
Initial Headcount 110.0 114.5 118.9 123.3 127.7 127.0 126.4 125.8 125.1 124.5 123.9 123.3
New Hire Captains (qualified) 0.0 0.0 0.0 0.0 0.0 0.0 0.0 0.0 0.0 0.0 0.0 0.0
New Upgrade Captains (qualified) 5.0 5.0 5.0 5.0 0.0 0.0 0.0 0.0 0.0 0.0 0.0 0.0
Attrition 0.6 0.6 0.6 0.6 0.6 0.6 0.6 0.6 0.6 0.6 0.6 0.6
Revised Headcount 110.0 114.5 118.9 123.3 127.7 127.0 126.4 125.8 125.1 124.5 123.9 123.3 122.6
Year Avg 123.6
Training Captains
Trainer (simulator, line check) 1.8 1.9 2.0 2.1 2.1 2.1 2.1 2.1 2.1 2.1 2.1 2.1
Line Captain covered by FO IOE 0.0 0.0 2.5 7.5 10.0 5.0 0.0 0.0 0.0 0.0 0.0 0.0 0.0
Displaced Captains from FO IOE 0.0 0.0 0.0 0.0 0.0 0.0 0.0 0.0 0.0 0.0 0.0 0.0 0.0
Line FO covered by Captain IOE 2.5 5.0 5.0 5.0 2.5 0.0 0.0 0.0 0.0 0.0 0.0 0.0 0.0
Management Pilots 3.0 3.0 3.0 3.0 3.0 3.0 3.0 3.0 3.0 3.0 3.0 3.0
Total Training Captain FTE's 2.5 9.8 12.4 17.5 17.6 10.1 5.1 5.1 5.1 5.1 5.1 5.1 5.1
Adjustment: Training Capt. As Capt. 0.0 0.0 -2.5 -7.5 -10.0 -5.0 0.0 0.0 0.0 0.0 0.0 0.0 0.0
Headcount Available (for line duty) 107.5 104.6 109.0 113.3 120.1 121.9 121.3 120.7 120.0 119.4 118.8 118.2 117.6
Surplus / Shortfall 17.5 14.0 17.7 23.7 8.5 5.4 6.2 0.1 3.6 1.6 6.2 9.5
Hard Hours per Line Crewmember 43.6 45.3 44.5 43.5 48.6 51.8 50.7 53.1 52.2 53.0 53.1 49.6
Crews / Aircraft 5.8 6.2 6.0 6.2 5.6 5.1 5.1 5.0 5.0 4.9 4.9 4.9
Number of Aircraft 20 20 20 20 22 24 24 24 24 24 24 24
Year Avg 5.4

Realizing the vision together
Lead Consultant:
40 million USD benefits through better
operational planning
THE NEED
Client saw an opportunity gain efficiencies through restructuring its airline operations
management, including production planning. Emre Serpen and team of consultants (in a previous
role) were engaged to lead the project.
THE SOLUTION
Emre Serpen’s team examined the prevailing crew resource, maintenance and engineering
management. A new process and procedural model was developed which the team then helped
to implement. Job specifications were devised and assistance given with staff selection and
appointments. Human resource capability was expanded. Training and coaching was given to
support the model.
THE RESULT
Following implementation of the recommendations, client achieved an average of a 10%
increase in productivity across key resources.
Dr.. Emre Serpen
23
Source: Mercer Report
Airline Business
Strategy Feature Oct 2002

Realizing the vision together
Typical IOC Program Overview to Reduce Costs, Protect
Revenue and Customer Service
24
Diagnostic and new IOC
vision
Process and organization
change implementation IOC Systems
implementation
Review of the Business
Strategy
Collect and review existing
information
Diagnostic review of the current
Hub/Operations Control and
Systems
Industry best practices and
OCC benchmarking
Future Blueprint Including
• Proposed concepts,
analysis and
recommendation
• Functional representation
and key processes,
Organisation, layout
• Information requirements
Benefits Case
Implementation Plan
Develop and implement processes
complementing selected system
solution
Co-location of new functions in
OCC
Develop and implement
organisation and job specifications
Develop and implement key
performance measures
Staff selection, development centre
appointments and implementation
of the organization
Change management and
communications program
Training and support
Program Management
Systems integration plan and
interfaces
Preparation of RFI
Development of the technical
specification and RFP
Evaluation of bids and
recommendation
Negotiation Support
Process mapping and description
of systems configuration
Map interfaces and define
information flow
Coordinate support for the
development of facility, and
infrastructure
Program Monitoring
Realizing the vision together
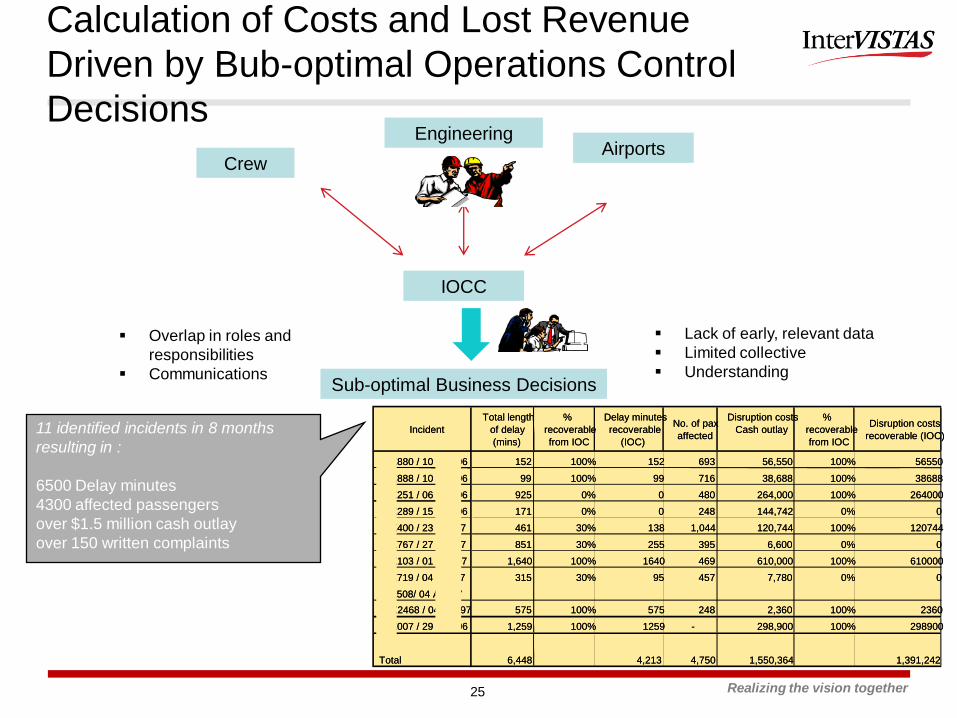
Calculation of Costs and Lost Revenue
Driven by Bub-optimal Operations Control
Decisions
25
Crew
Engineering Airports
IOCC
Sub-optimal Business Decisions
Overlap in roles and
responsibilities
Communications
Lack of early, relevant data
Limited collective
Understanding
11 identified incidents in 8 months
resulting in :
6500 Delay minutes
4300 affected passengers
over $1.5 million cash outlay
over 150 written complaints
Incident
Total length
of delay
(mins)
%
recoverable
from IOC
Delay minutes
recoverable
(IOC)
No. of pax
affected
Disruption costs
Cash outlay
%
recoverable
from IOC
Disruption costs
recoverable (IOC)
CX880 / 10 Aug 96 152 100% 152 693 56,550 100% 56550
CX888 / 10 Aug 96 99 100% 99 716 38,688 100% 38688
CX251 / 06 Dec 96 925 0% 0 480 264,000 100% 264000
CX289 / 15 Dec 96 171 0% 0 248 144,742 0% 0
CX400 / 23 Jan 97 461 30% 138 1,044 120,744 100% 120744
CX767 / 27 Jan 97 851 30% 255 395 6,600 0% 0
CX103 / 01 Feb 97 1,640 100% 1640 469 610,000 100% 610000
CX719 / 04 Apr 97 315 30% 95 457 7,780 0% 0
CX508/ 04 Apr 97
CX2468 / 04 Apr 97 575 100% 575 248 2,360 100% 2360
CX007 / 29 Nov 96 1,259 100% 1259 - 298,900 100% 298900
Total 6,448 4,213 4,750 1,550,364 1,391,242

Realizing the vision together
Lead Consultant:
Deliver benefits thru effective IOCC
OCC has good functionality and an operationally sound design. The physical structure of the
building presents many limitations, however. This emphasizes the importance of ensuring that an
appropriately sized facility is secured, with the proper dimension to facilitate a proper layout from
conceptualisation.
Dr.. Emre Serpen
26
Strengths Weaknesses
Cost-effective
Good cross-functional
coordination
Focus on passengers and
service
Long, thin room limits
communications
Operational responsibility spread
across multiple buildings

Realizing the vision together
Effective integration of the commercial and maintenance plan
processes drive the greatest downstream improvement value
Determine heavy check
Strategy and location
Determine line
maintenance
Strategy
Determination of
maintenance costs
Schedule design to
be optimised for
maintenance costs
M&E considerations
in the design of the
schedule, selection of fleet,
heavy and line
maintenance centres
Value lost in
commercial and
Maintenance Activity
coordination
Value lost in
ineffective Representation of
Maintenance Control Activity in
day-to-day operations control
locations
Cross-functional
Production planning
Team to have both
Network and maintenance
Representation
Regular meetings and
forward management of
the plan and changes
Colocate MCC in OCC
Design of KPIs avoid
‘Delay code’ problem
Savings in delay
minutes due increased
Stability of aircraft
allocations
Improvement action
(e.g., colocate MCC with
OCC)
Benefit is gained
efficiency due to better
coordination
Expected Savings (e.g.,
one A-check per aircraft
per year)
Expected savings in man
hour cost: 450 man hours
per Acheck * 50 USD per
hour $ 22,500 saving per
A-check
Expected savings in
material cost 3000 USD
per material costs per
A-check
Total savings, 25,500
per A-check
Prorate to total fleet
for 100 fleet airline, 2.5
million saving impact
on the bottom line
Realizing the vision together
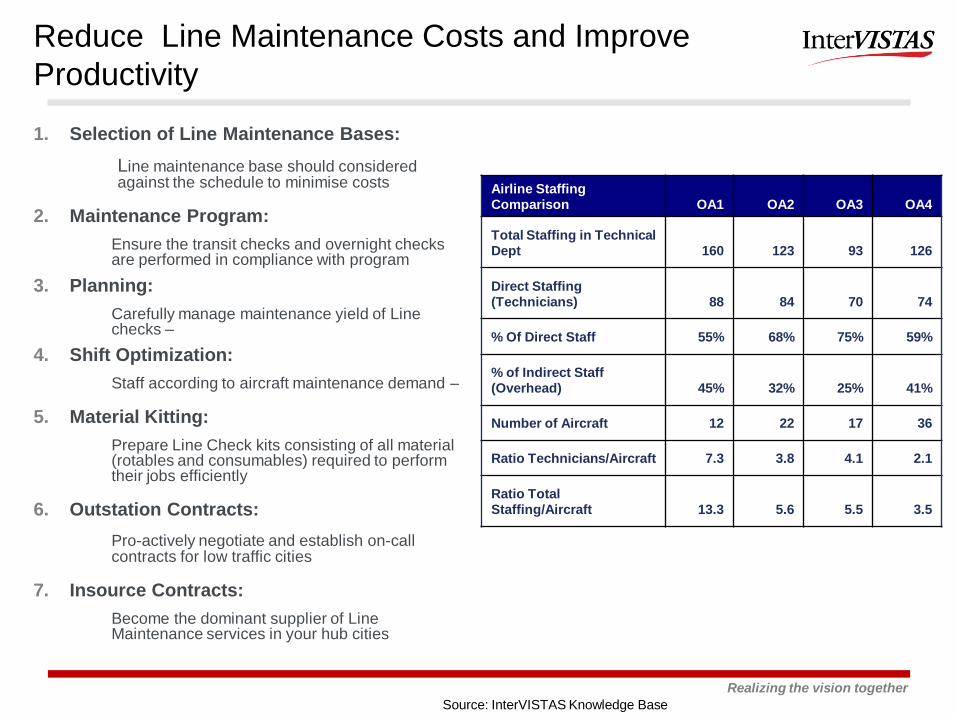
Reduce Line Maintenance Costs and Improve
Productivity
1. Selection of Line Maintenance Bases:
Line maintenance base should considered against the schedule to minimise costs
2. Maintenance Program:
Ensure the transit checks and overnight checks are performed in compliance with program
3. Planning:
Carefully manage maintenance yield of Line checks –
4. Shift Optimization:
Staff according to aircraft maintenance demand –
5. Material Kitting:
Prepare Line Check kits consisting of all material (rotables and consumables) required to perform their jobs efficiently
6. Outstation Contracts:
Pro-actively negotiate and establish on-call contracts for low traffic cities
7. Insource Contracts:
Become the dominant supplier of Line Maintenance services in your hub cities
Airline Staffing Comparison OA1 OA2 OA3 OA4
Total Staffing in Technical Dept 160 123 93 126
Direct Staffing (Technicians) 88 84 70 74
% Of Direct Staff 55% 68% 75% 59%
% of Indirect Staff (Overhead) 45% 32% 25% 41%
Number of Aircraft 12 22 17 36
Ratio Technicians/Aircraft 7.3 3.8 4.1 2.1
Ratio Total Staffing/Aircraft 13.3 5.6 5.5 3.5
Source: InterVISTAS Knowledge Base
Realizing the vision together
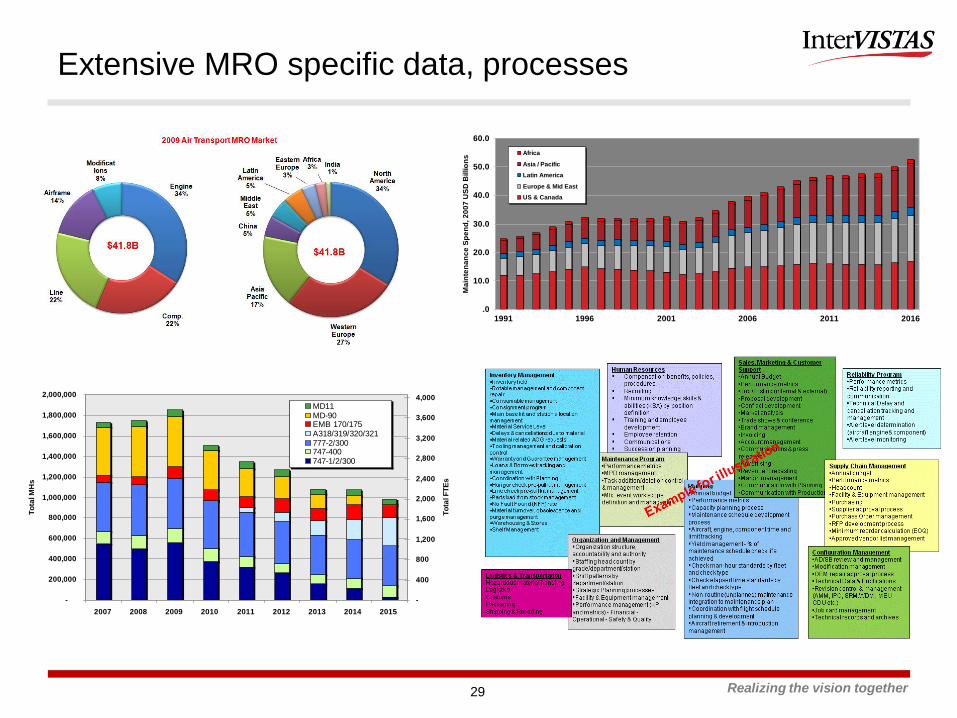
Extensive MRO specific data, processes
29
-
200,000
400,000
600,000
800,000
1,000,000
1,200,000
1,400,000
1,600,000
1,800,000
2,000,000
2007 2008 2009 2010 2011 2012 2013 2014 2015
To
tal M
Hs
-
400
800
1,200
1,600
2,000
2,400
2,800
3,200
3,600
4,000
To
tal F
TE
s
MD11MD-90EMB 170/175A318/319/320/321777-2/300747-400747-1/2/300
.0
10.0
20.0
30.0
40.0
50.0
60.0
1991 1996 2001 2006 2011 2016
Ma
inte
na
nc
e S
pe
nd
, 2
00
7 U
SD
Billio
ns
Africa
Asia / Pacific
Latin America
Europe & Mid East
US & Canada

Realizing the vision together
Lead Consultant:
Significant cost reduction and productivity improvement
THE NEED
• Extensive participation including 120+ management and mobilization days including 3500+ Turkish Technic staff
• Diagnostic Assessment, Benchmarking, Design of Processes, Organization, Job Specifications, Performance Measures recommendations implemented with successful results
• Customer Service processes and organisation
• Development of Long term maintenance plan
• Supply Chain is driven by material forecasts as defined in long term maintenance plan rather than previous years usage
• Acceptance of accountability by Body, Engine Shop, Component Shops to develop their own short term production plans with delivery accountability
• Engineering spending more time at the shop floor, with engineers gaining practical experience and contributing their engineering knowledge
• Increased productivity Turkish Technic is supporting 100 aircraft with the same workforce (20+ Aircraft) and with significantly increased third party revenues
• Implementation of performance measures
THE RESULT
Dr. Emre Serpen
30
$XM
Labour productivityVolume discounts
Narrowbody improvedutilisation
Widebody improvedutilisation
Improved engine TAT
$XM
Labour productivityVolume discounts
Narrowbody improvedutilisation
Widebody improvedutilisation
Improved engine TAT

Realizing the vision together
Cargo Revenue Growth, Belly and Freighter Revenue
Improvement and Cost Reduction
31

Realizing the vision together
Improving cargo profitability
32
CGK-HKG (V.V.) by A330 Freighter 2012 2013 2014 2015 2016
Total Operating Revenues
Scheduled Full Freighter Revenue - 6.879.467 6.879.467 10.319.201 10.319.201
Cargo Charter Revenue - - - - -
Other Revenue - - - - -
Passenger (belly) Revenue 4.009.805 4.121.705 4.233.606 4.345.506 4.469.619
Total Revenue CGK-HKG (V.V.) 4.009.805 11.001.173 11.113.073 14.664.707 14.788.820
Direct Operating Cost (including Ownership)
Fuel - 4.872.671 4.872.671 7.309.006 7.309.006
Cockpit Crew - 487.267 487.267 730.901 730.901
Maintenance - 584.721 584.721 877.081 877.081
Depreciation - 1.533.989 1.533.989 2.300.983 2.300.983
Insurrance 63.916 63.916 95.874 95.874
ATC/LDG charges - 608.920 608.920 913.379 913.379
Sales Commision - 93.054 93.054 139.581 139.581
Total Direct Operating Cost - 6.553.578 6.553.578 9.830.367 9.830.367
Total Indirect Operating Cost - 1.690.959 1.690.959 2.536.438 2.536.438
Total Full Freighter Operating Cost - 8.244.537 8.244.537 12.366.805 12.366.805
Charter Operating Cost 0 0 0 0 0
Passenger (belly) Operating Cost 5.371.896 5.525.471 5.679.046 5.832.622 6.002.598
Total Operating Cost CGK-HKG (V.V.) 5.371.896 13.770.008 13.923.583 18.199.427 18.369.403
Profit (Loss US$) -1.362.090 -2.768.835 -2.810.510 -3.534.720 -3.580.583
Profit Margin -34% -25% -25% -24% -24%
Profit Margin Freighter -19,8% -19,8% -19,8% -19,8%

Realizing the vision together
Proprietary analysis tools
33
2006 2007 2008 2009 2010 2011 2012 2013
SAR (Millions) Baseline Year 1 Year 2 Year 3 Year 4 Year 5 Year 6 Year 7
Total Operating Revenues (Net)
Total Cargo Scheduled Revenue 488 569 622 749 799 844 880 918
Cargo Charter Revenue 8 15 15 15 15 15 15 15
Other Revenue 49 49 49 49 49 49 49 49
Total Revenue 544 633 685 813 863 907 944 981
Aircraft & Other Lease Costs (Incl. Ownership)
Flight Crew Employment Cost 30 38 47 57 59 60 61 62
Fuel 51 142 181 220 227 233 237 240
Direct Maintenance 47 100 124 147 153 157 160 162
Landing Fees 7 4 6 7 7 7 7 7
Overflight 12 13 16 19 19 20 20 21
Aircraft, Engines & Components Depreciation 56 55 65 75 79 81 82 84
Insurance 2 2 3 3 3 3 3 3
Passenger Operating Costs 7 5 5 6 6 6 6 7
Charter Operating Costs 6 11 11 11 11 11 11 11
Total Aircraft & Other Lease Costs 218 370 458 544 564 580 589 598
Total Indirect Operating Costs 307 269 282 306 306 312 313 312
Total Operating Costs 525 639 740 850 870 892 901 910
Profit (Loss) 19 -6 -55 -37 -8 15 42 71
Profit Margin 4% -1% -8% -5% -1% 2% 4% 7%
Operating Metrics
Freighter Fleet at Year-End 12/31 -- -- -- -- -- -- -- --
Total Weekly Departures (both directions) 26 26 34 38 40 42 42 42
Total Block Hours 8,173 9,623 11,859 13,757 14,073 14,454 14,454 14,454
Total Available Ton Kilometers (Millions) 517 596 734 884 905 919 922 926
Total Cargo Carried (000s) 63,649 70,161 77,818 92,531 98,483 105,357 109,794 114,426
Average Rate per Kilogram 8.6 9.0 8.8 8.8 8.8 8.6 8.6 8.6
Comparative Metrics
Average Daily Utilization (Block Hours) -- -- -- -- -- -- -- --
Average Block Hours per Flight 6.0 7.1 6.7 7.0 6.8 6.6 6.6 6.6
System Load Factor (Belly/Freighter Combi) 76.9% 64.5% 55.4% 58.5% 59.4% 62.0% 64.6% 67.3%
Total Operating Revenues per ATK 1.05 1.06 0.93 0.92 0.95 0.99 1.02 1.06
Total Direct Operating Costs per ATK 0.42 0.62 0.62 0.62 0.62 0.63 0.64 0.65
Total Operating Costs per ATK 1.02 1.07 1.01 0.96 0.96 0.97 0.98 0.98
Total Operating Revenues per Block Hour 66,613 65,776 57,786 59,065 61,304 62,771 65,279 67,896
Total Direct Operating Costs per Block Hour 26,705 38,497 38,640 39,566 40,075 40,133 40,736 41,349
Total Operating Costs per Block Hour 64,272 66,431 62,444 61,786 61,854 61,699 62,370 62,969
Example for illustration
Example: Project Approach
Example: Diagnostic Analysis
Example: Freighter and Belly Business Plan
Example: Route
Analysis

Realizing the vision together
Our Airline Practice Lines are Focused on Airline
Strategy & Airline Performance Improvement
34
Strategy – Develop strategy, feasibility studies and
business planning
‒ Market Forecasting (Airline, Airport, MRO, Cargo)
‒ Start up Airline and MRO feasibility and business plan
‒ Mergers and acquisitions planning
‒ Product strategy
Network and Fleet Planning – Develop and
optimise airline network and route plans
‒ Route Planning and Schedule Development, Alliances
‒ Hub design and optimization, slot remarketing
‒ Fleet planning , Aircraft leasing and remarketing
Financial Services – Evaluate airline investment
opportunities
‒ Due diligence (Airline, Airport, MRO, Cargo, GH)
‒ Privatization and spin-off and financing of Airline,
MRO, Pilot School, GH, Cargo
IT Strategy – Assess IT strategy and infra-
structure
‒ Information systems and corporate data warehouse
‒ Passenger service systems and distribution
Strategy and Finance Performance Improvement
Commercial Improvement – Airline Revenue
Improvement
‒ Pricing and Revenue Management
‒ Marketing, Sales and Distribution
‒ Technology solutions supporting revenue growth
‒ Product, Customer Service, CRM
Operations Improvement – Airline Productivity
Improvement and Cost Reduction
‒ Diagnostic and Cost reduction
‒ MRO productivity improvement
‒ Crew Resource Management
‒ Integrated Operations Control
Restructuring & Change Management – Airline
Transformation and Turnaround
‒ Restructuring (Airline, MRO, Cargo, Aerospace)
‒ Start up Implementation
‒ Performance management
‒ Organisation improvement and change management.
IT Implementation – Project Management
‒ IT project management, Systems Integration
‒ Supplier negotiation and implementation management

Realizing the vision together
Delivering financial improvements through revenue growth
and cost reduction for 70+ airlines
Company-wide strategy
and turnaround
Development of network,
Cairo hub, and
schedules
Improvements in sales,
marketing, organization,
IT
Fleet & Business Plan
EgyptAir
Lead Consultant:
Dr. Emre Serpen
Lead Consultant:
Dr. Emre Serpen
Lead Consultant:
Dr. Emre Serpen
Lead Consultant:
Dr. Emre Serpen
Lead Consultant:
Dr. Emre Serpen
Turkish Airlines Temasek (SQ) South African Airways
Market evaluation,
capacity assessment,
SWOT analysis
2016 and 2012 network
design, hub design, and
schedule
Business plan
associated with the
strategy
SWOT analysis of
Singapore Airlines
Market forecasting
Identify growth
opportunities
Develop strategy for
medium and long haul
network and fleet
Marker assessment
Strategy for maximizing
share in Africa
Selection of hub
locations in west and
central Africa
Network design and fleet
plan
Business plan
Malaysian Airlines
Evaluated the feasibility
of a premium service in
conjunction with another
airline
Market Forecasting
Route Design
Commercial Workshops
Joint Venture/Codeshare
Benefits
Lead Consultant:
Dr. Emre Serpen
LOT Polish Airlines
Multiple network
optimisation projects
Alliance strategy
analysis and decision for
LOT to joined Star
Alliance
Develop Asian strategy
and network for LOT
Evaluate joint venture
with Indian partner
Dr. Emre
Serpen
Executive Vice
President, Head of
Airline Practice
• 20+ years, 70+
airlines in 50+
countries
Realizing the vision together
Our delivery team include experts from leading airlines and aviation
consultancies worldwide

Thank You
Please contact Emre Serpen for queries
+447944163891