Embed Size (px)
Citation preview
COALITION for RESOURCE RECOVERY COALITION for RESOURCE RECOVERY
April 17, 2012
Commercial Food Waste
Recovery Options
In New York City
Matt de la Houssaye
About Global Green USA
• Global Green: US Chapter of Green Cross International
• Founded by President Mikhail S. Gorbachev to foster a value shift to a
sustainable and secure future by reconnecting humanity with the
environment. Over 30 national affiliates around the world.
• Global Green creates sustainable urban environments that combat
global warming through a unique cross-cutting approach that merges
innovative research, technical assistance, cutting-edge community
based projects and targeted education and outreach
• 501c3 non-profit organization
Global Green’s Coalition for Resource Recovery
(CoRR)
• Industry working group dedicated to combating climate change and
transforming waste to assets, and assisting cities in reaching 70% waste
diversion.
• Conduct pilots and related research to identify and accelerate
development of scalable, transferable waste diversion programs and
technologies.
A Coalition of Members
Action Env’l Group
Baluchi’s
BASF
Bemis
Chemol
Clean River Systems
DBB Partners
Design & Source
Duro Bag
First Fiber
Green Bay Packaging
HAVI Global Solutions
IESI/Progressive
Imerys
Interstate Container
Jamba Juice
LBP Manufacturing
N&V International
Pret A Manger
Spectra-Kote
Starbucks
Transtech, Inc.
Ulterion
Waste Management
Wastequip
Western Michigan Univ.
Commercial Food Waste Recovery Program
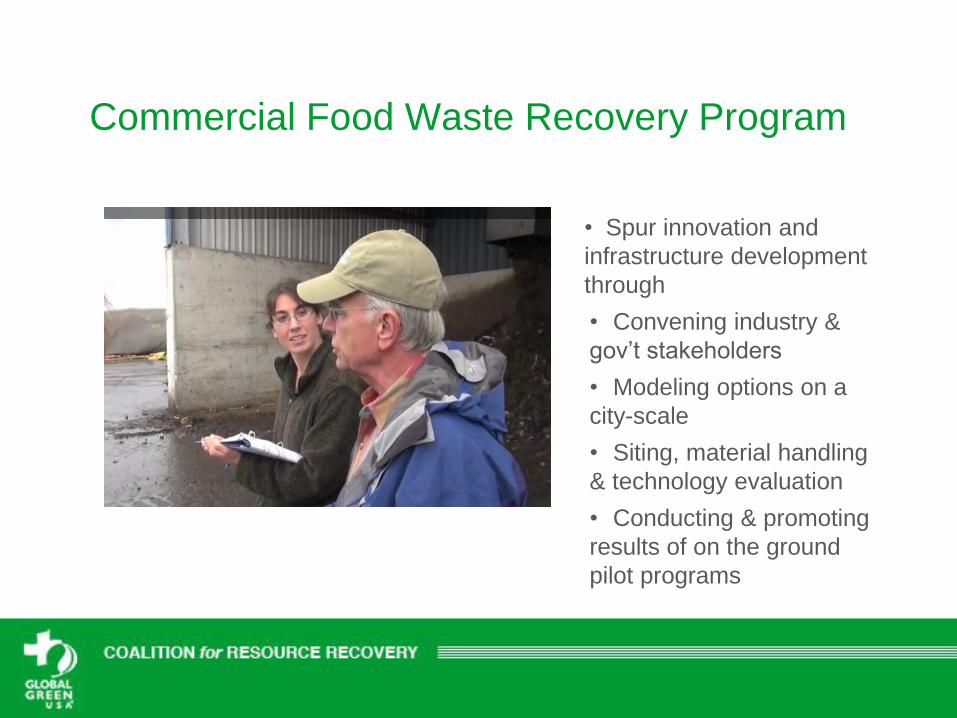
• Spur innovation and
infrastructure development
through
• Convening industry &
gov’t stakeholders
• Modeling options on a
city-scale
• Siting, material handling
& technology evaluation
• Conducting & promoting
results of on the ground
pilot programs
Presentation Overview
1. Vision for Food Waste Recovery
2. The Market Opportunity & NYC Solid Waste System
3. Food Waste Recovery Options and Scenarios
For Recovering Value from Commercial Food Waste
• Cost-effective, cheaper for restaurants and grocers than
landfill
• Operationally and environmentally sound
• Recovers energy and nutrient value in food waste
• Value recovered locally
• Benefits local communities where facilities are sited
COALITION for RESOURCE RECOVERY
Vision
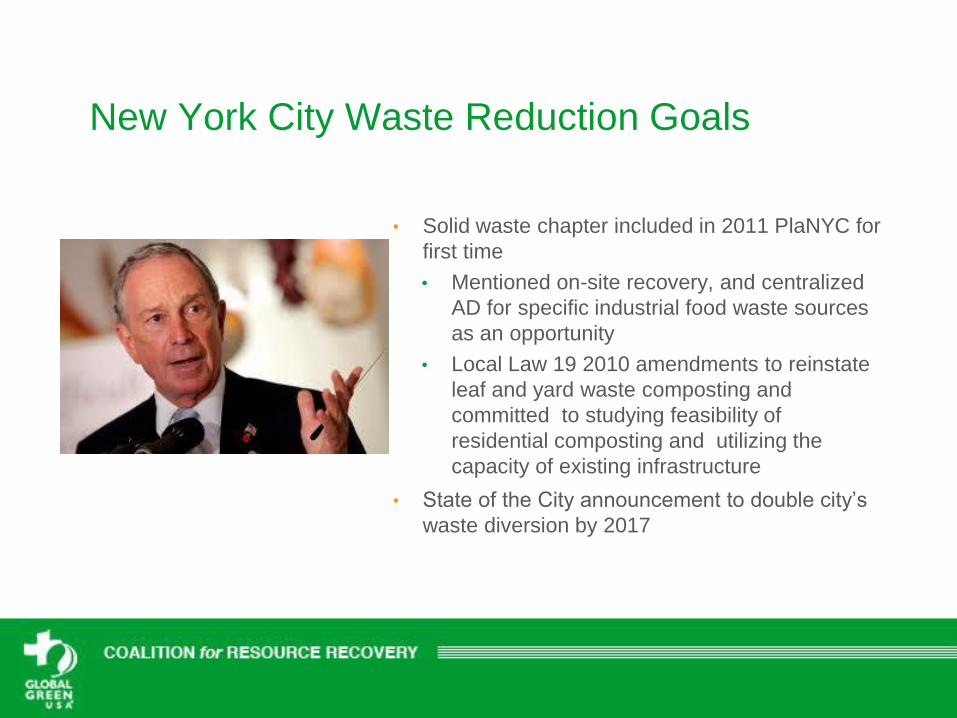
New York City Waste Reduction Goals
• Solid waste chapter included in 2011 PlaNYC for
first time
• Mentioned on-site recovery, and centralized
AD for specific industrial food waste sources
as an opportunity
• Local Law 19 2010 amendments to reinstate
leaf and yard waste composting and
committed to studying feasibility of
residential composting and utilizing the
capacity of existing infrastructure
• State of the City announcement to double city’s
waste diversion by 2017
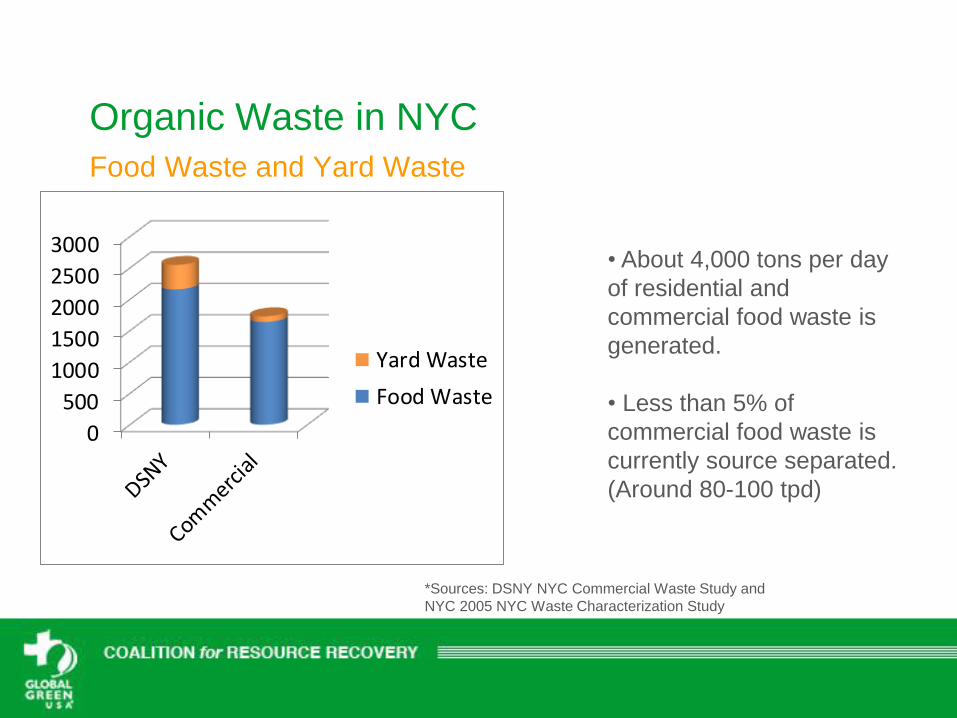
Organic Waste in NYC
Food Waste and Yard Waste
• About 4,000 tons per day
of residential and
commercial food waste is
generated.
• Less than 5% of
commercial food waste is
currently source separated.
(Around 80-100 tpd)
*Sources: DSNY NYC Commercial Waste Study and
NYC 2005 NYC Waste Characterization Study
0
500
1000
1500
2000
2500
3000
Yard Waste
Food Waste
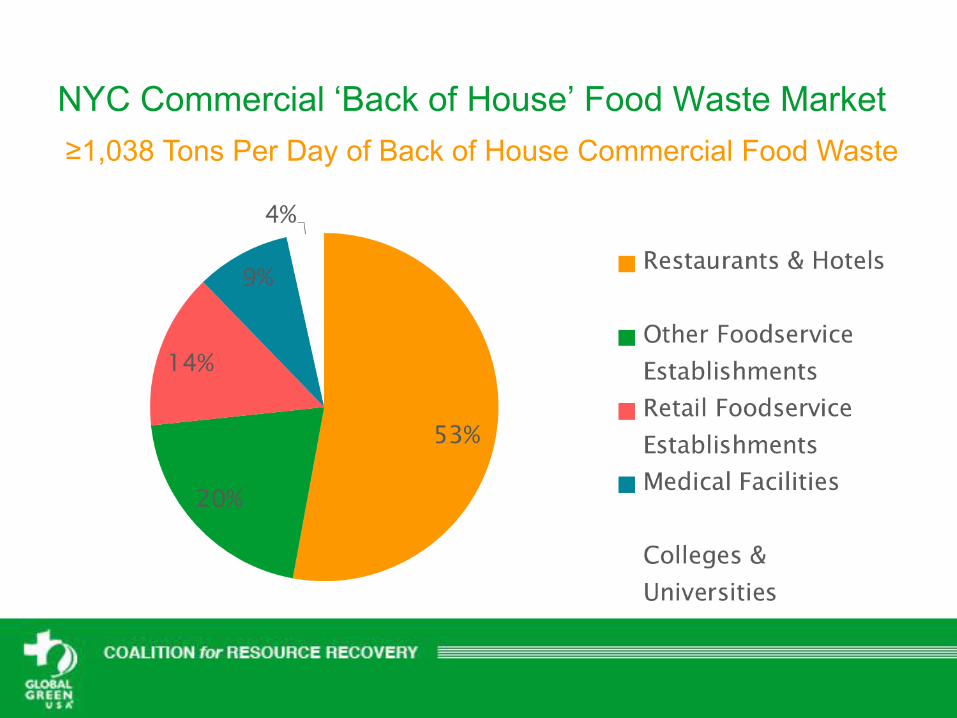
NYC Commercial ‘Back of House’ Food Waste Market
≥1,038 Tons Per Day of Back of House Commercial Food Waste
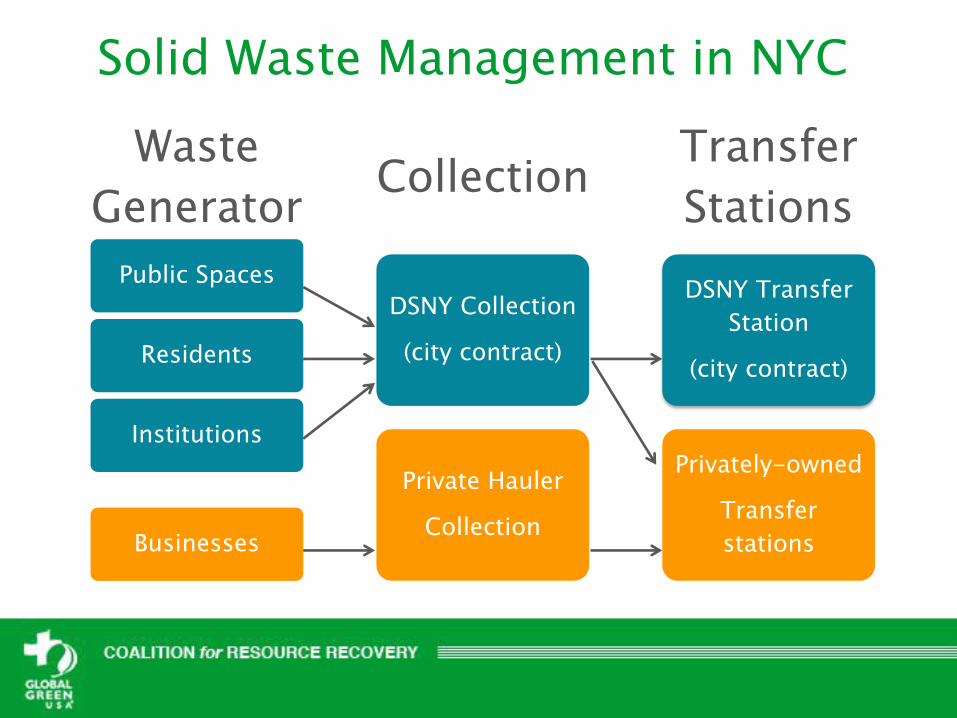
Solid Waste Management in NYC
Waste
Generator
Public Spaces
Residents
Institutions
Businesses
Collection
DSNY Collection
(city contract)
Private Hauler
Collection
Transfer
Stations
DSNY Transfer
Station
(city contract)
Privately-owned
Transfer
stations
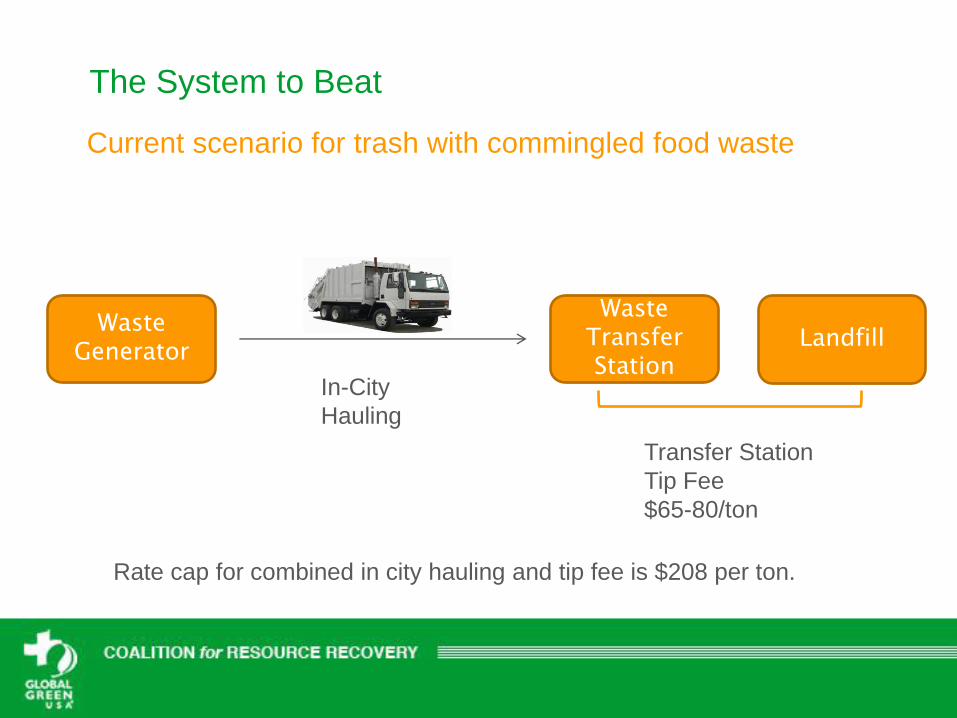
The System to Beat
Current scenario for trash with commingled food waste
Waste Generator
Waste Transfer Station
In-City
Hauling
Transfer Station
Tip Fee
$65-80/ton
Rate cap for combined in city hauling and tip fee is $208 per ton.
Landfill
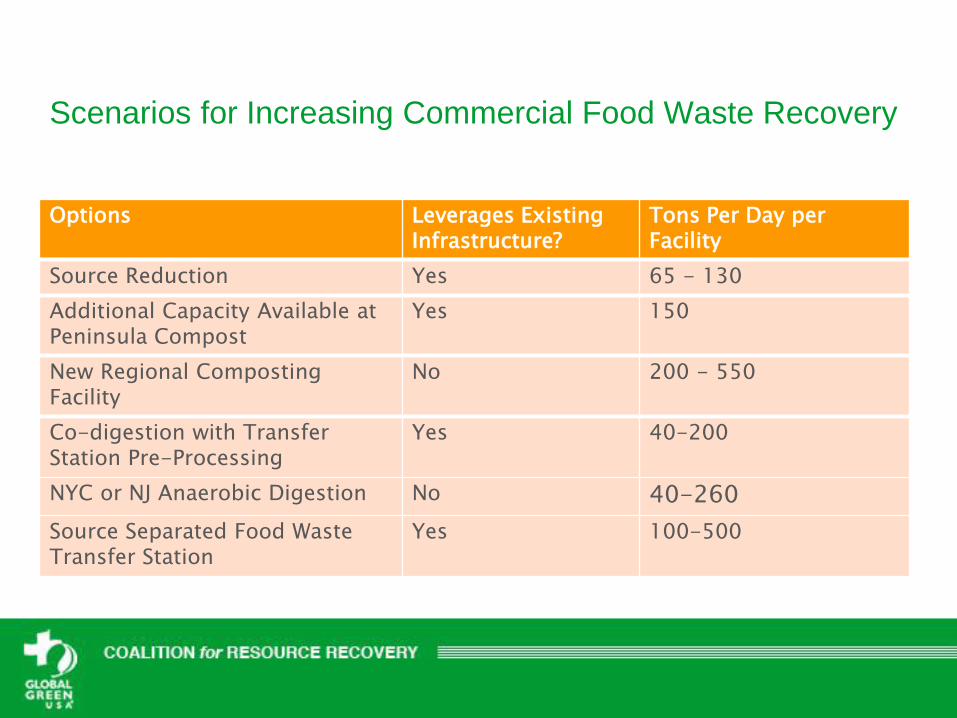
Scenarios for Increasing Commercial Food Waste Recovery
Options Leverages Existing Infrastructure?
Tons Per Day per Facility
Source Reduction Yes 65 - 130
Additional Capacity Available at Peninsula Compost
Yes 150
New Regional Composting Facility
No 200 - 550
Co-digestion with Transfer Station Pre-Processing
Yes 40-200
NYC or NJ Anaerobic Digestion No 40-260
Source Separated Food Waste Transfer Station
Yes 100-500
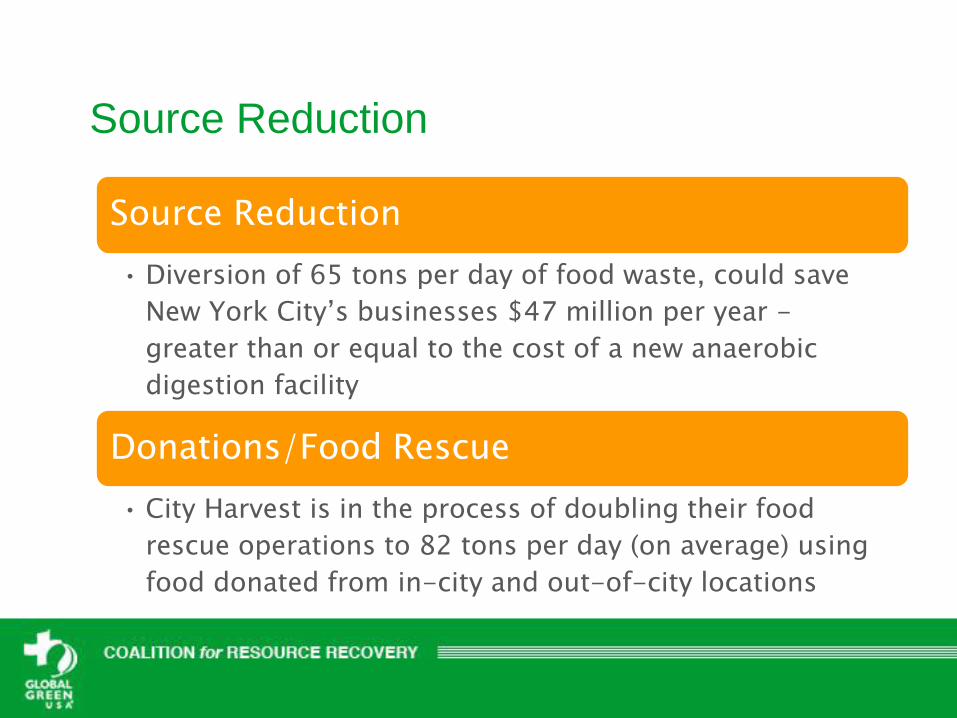
Source Reduction
Source Reduction
• Diversion of 65 tons per day of food waste, could save
New York City’s businesses $47 million per year -
greater than or equal to the cost of a new anaerobic
digestion facility
Donations/Food Rescue
• City Harvest is in the process of doubling their food
rescue operations to 82 tons per day (on average) using
food donated from in-city and out-of-city locations
5/11/2012 1
6
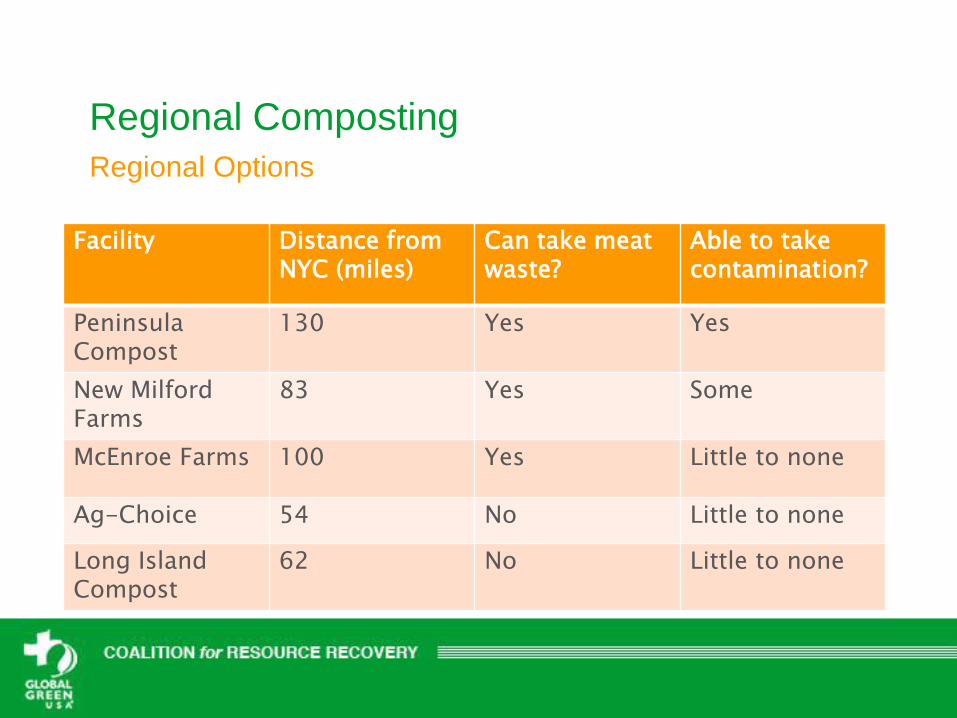
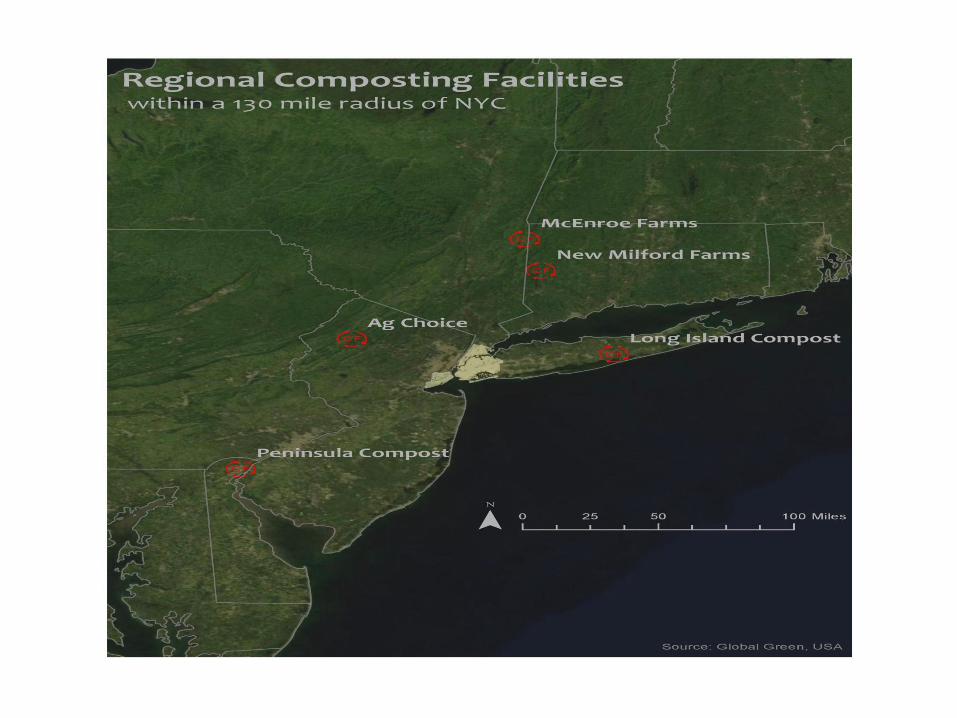
Regional Composting
Regional Options
Facility Distance from NYC (miles)
Can take meat waste?
Able to take contamination?
Peninsula Compost
130 Yes Yes
New Milford Farms
83 Yes Some
McEnroe Farms 100 Yes Little to none
Ag-Choice 54 No Little to none
Long Island Compost
62 No Little to none
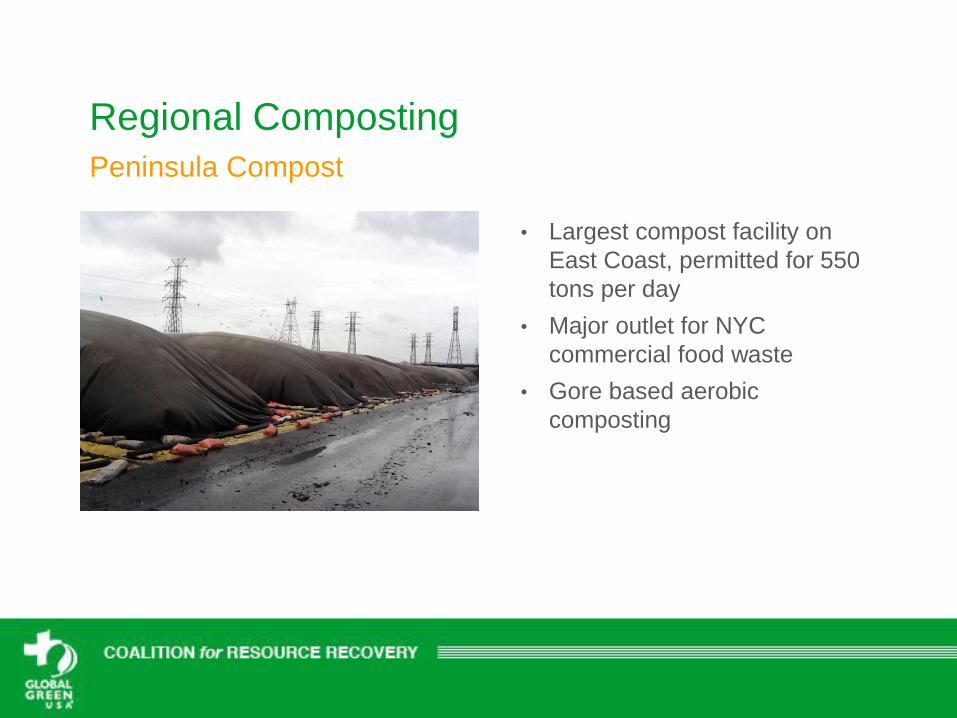
Regional Composting
• Largest compost facility on
East Coast, permitted for 550
tons per day
• Major outlet for NYC
commercial food waste
• Gore based aerobic
composting
Peninsula Compost
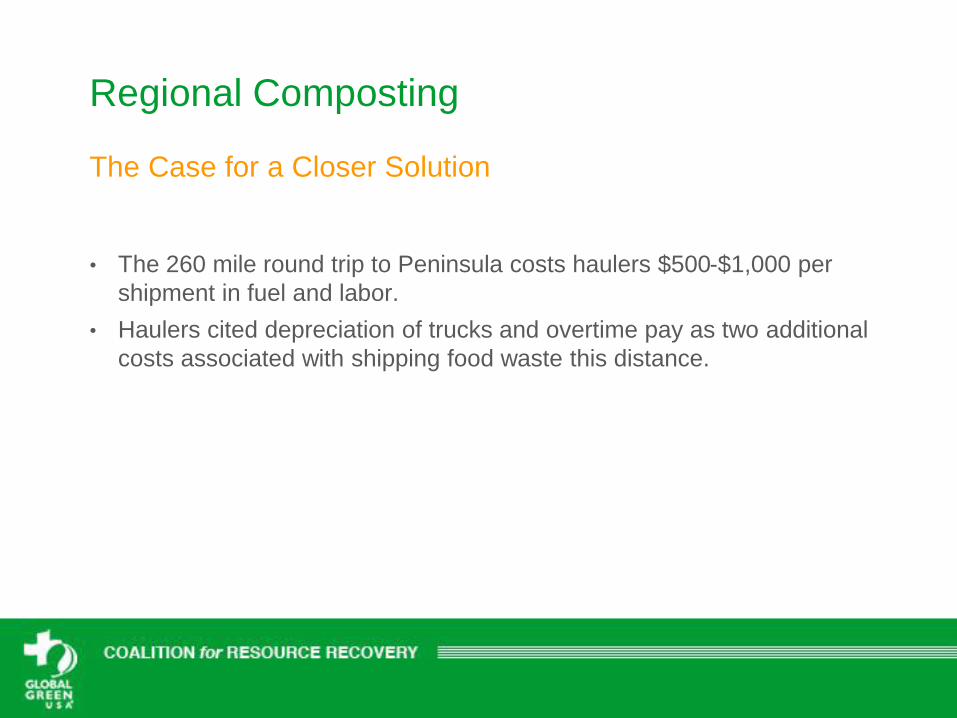
Regional Composting
The Case for a Closer Solution
• The 260 mile round trip to Peninsula costs haulers $500-$1,000 per
shipment in fuel and labor.
• Haulers cited depreciation of trucks and overtime pay as two additional
costs associated with shipping food waste this distance.
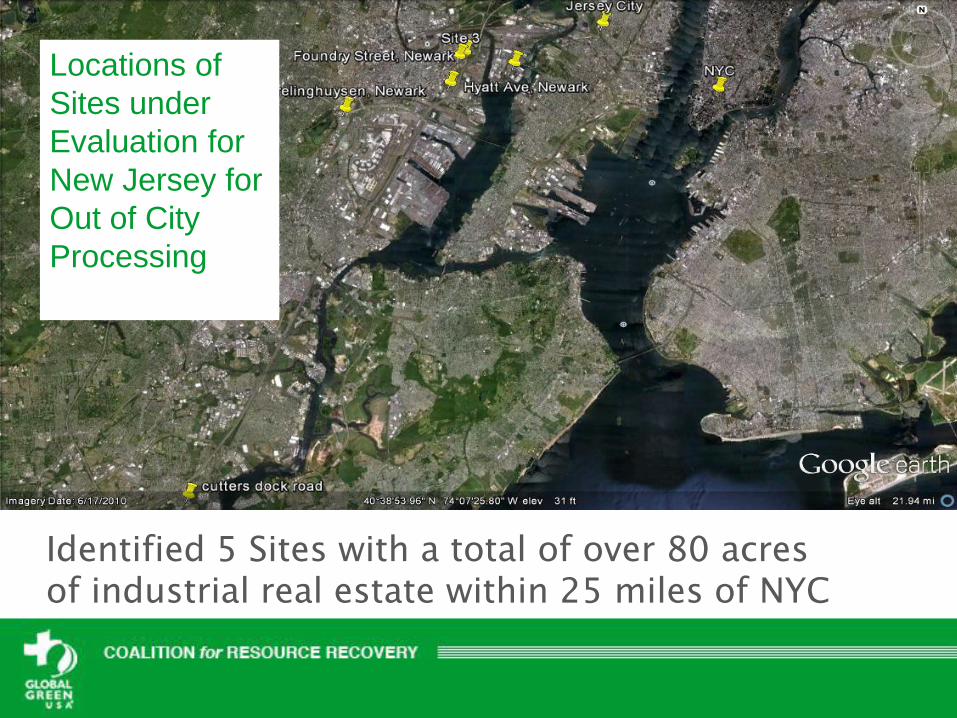
Identified 5 Sites with a total of over 80 acres of industrial real estate within 25 miles of NYC
Locations of
Sites under
Evaluation for
New Jersey for
Out of City
Processing
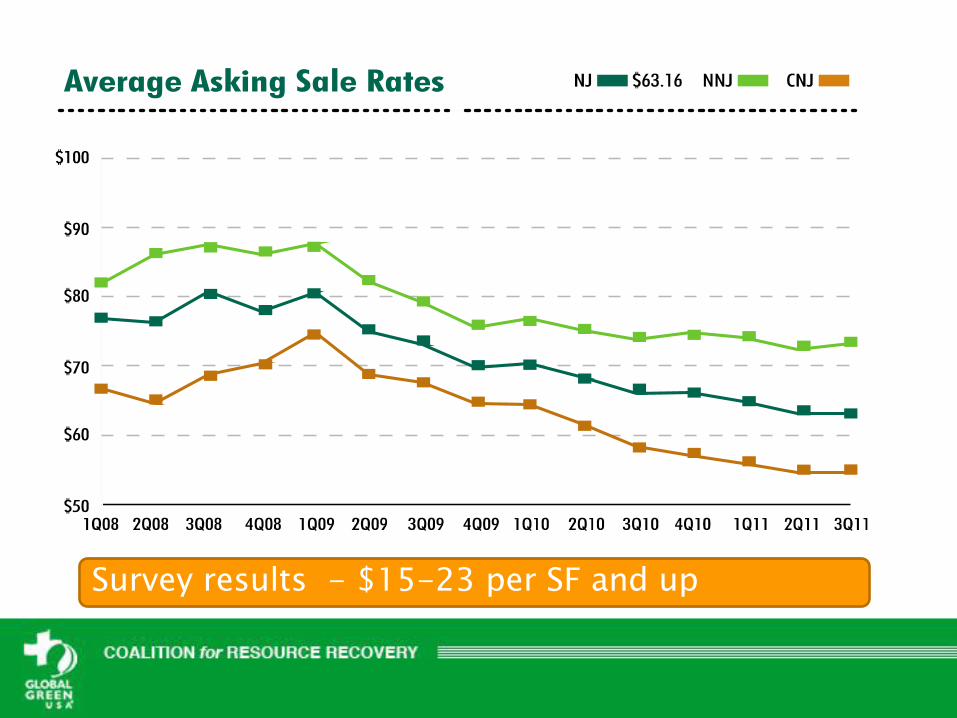
Survey results - $15-23 per SF and up
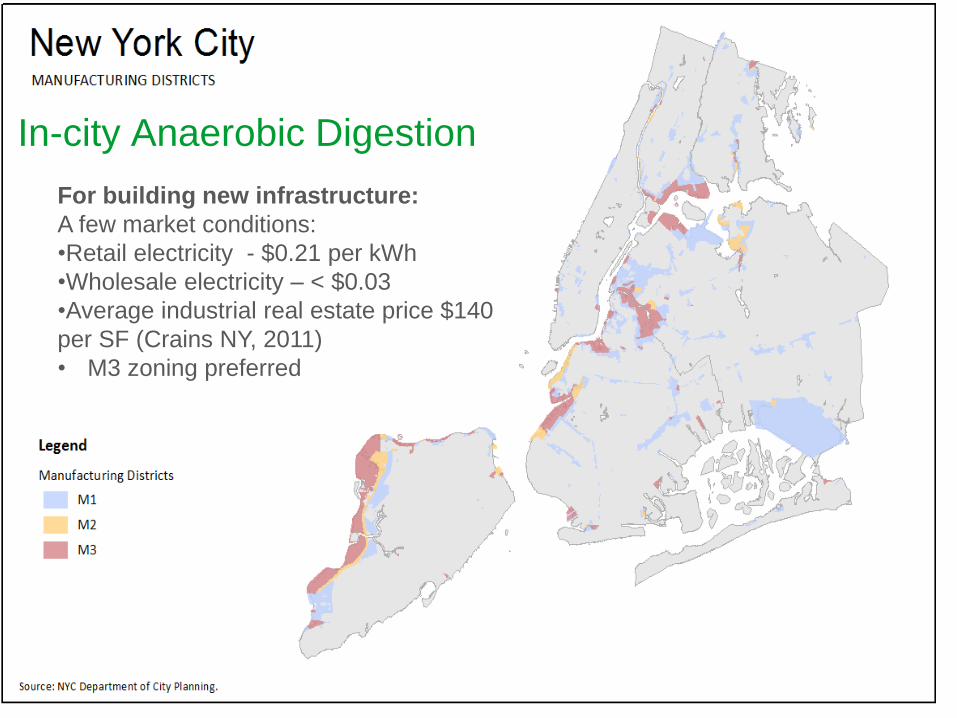
For building new infrastructure:
A few market conditions:
•Retail electricity - $0.21 per kWh
•Wholesale electricity – < $0.03
•Average industrial real estate price $140
per SF (Crains NY, 2011)
• M3 zoning preferred
In-city Anaerobic Digestion
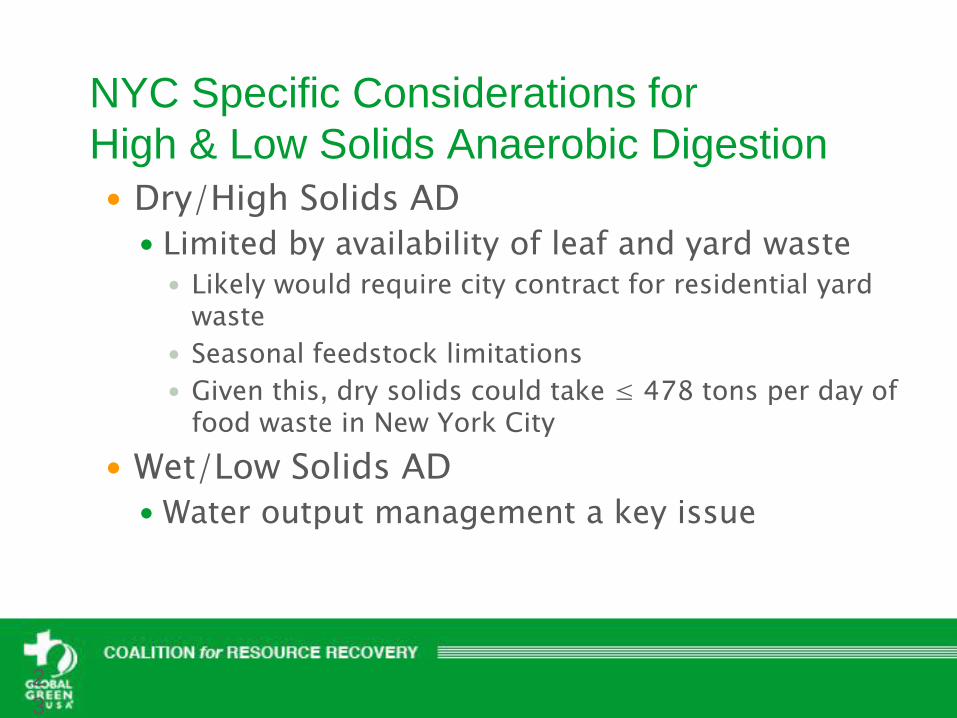
NYC Specific Considerations for
High & Low Solids Anaerobic Digestion
Dry/High Solids AD
Limited by availability of leaf and yard waste Likely would require city contract for residential yard
waste
Seasonal feedstock limitations
Given this, dry solids could take ≤ 478 tons per day of food waste in New York City
Wet/Low Solids AD
Water output management a key issue
2
3
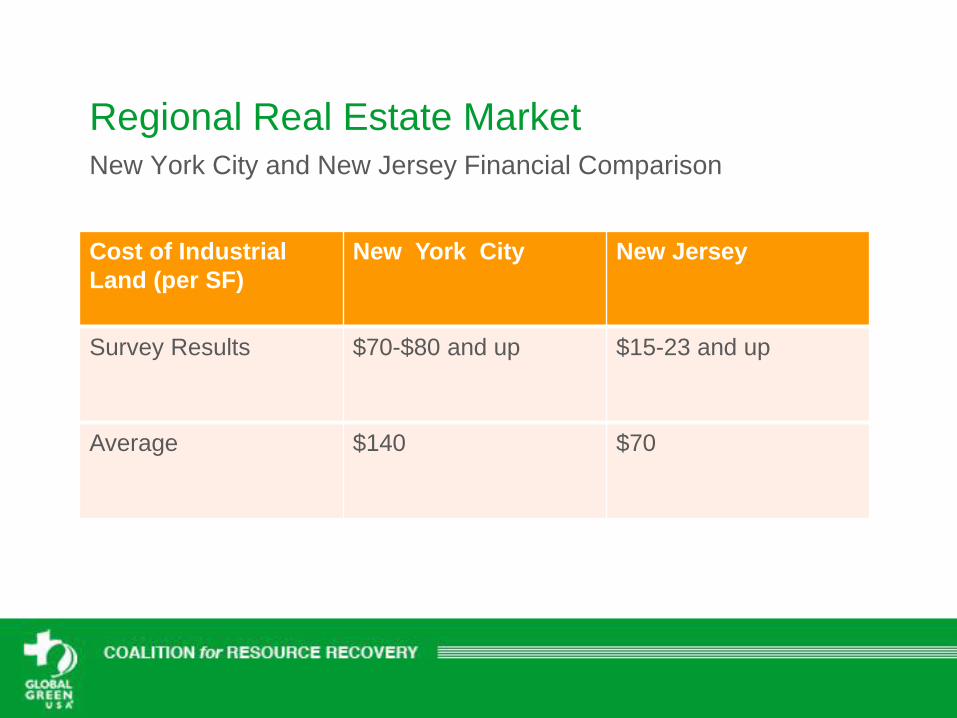
Regional Real Estate Market New York City and New Jersey Financial Comparison
Cost of Industrial
Land (per SF)
New York City New Jersey
Survey Results $70-$80 and up $15-23 and up
Average $140 $70
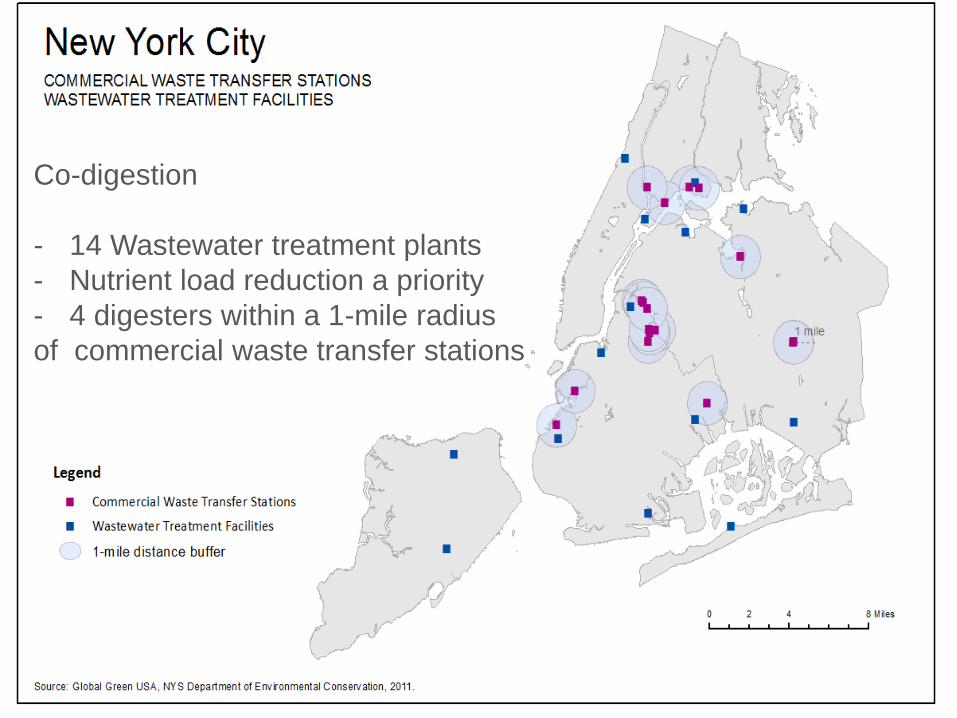
Co-digestion
- 14 Wastewater treatment plants
- Nutrient load reduction a priority
- 4 digesters within a 1-mile radius
of commercial waste transfer stations
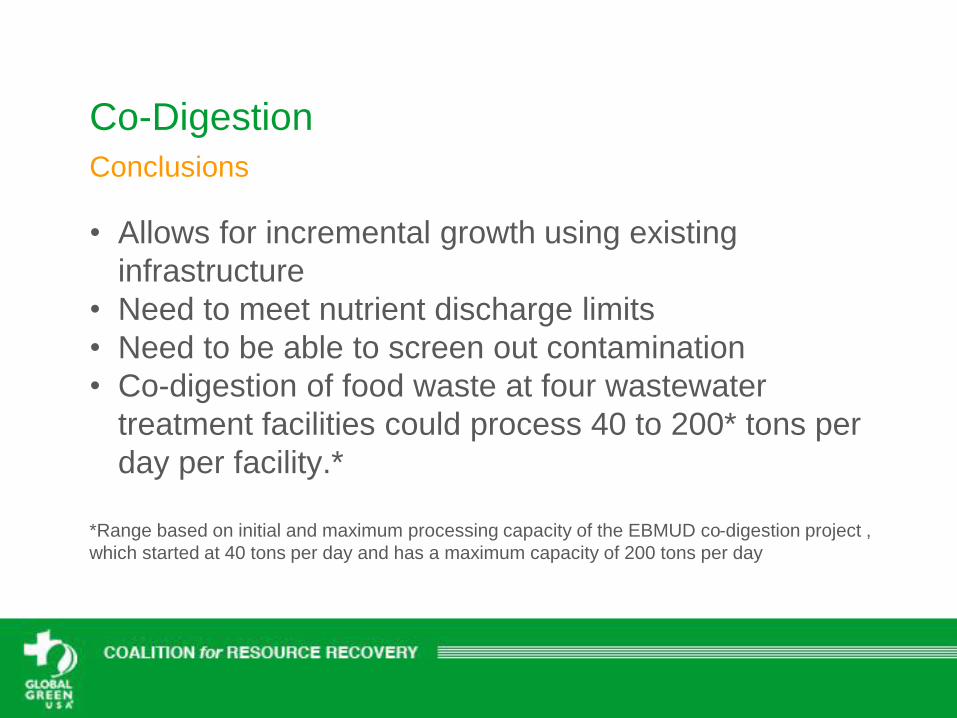
Co-Digestion
Conclusions
• Allows for incremental growth using existing
infrastructure
• Need to meet nutrient discharge limits
• Need to be able to screen out contamination
• Co-digestion of food waste at four wastewater
treatment facilities could process 40 to 200* tons per
day per facility.*
*Range based on initial and maximum processing capacity of the EBMUD co-digestion project ,
which started at 40 tons per day and has a maximum capacity of 200 tons per day
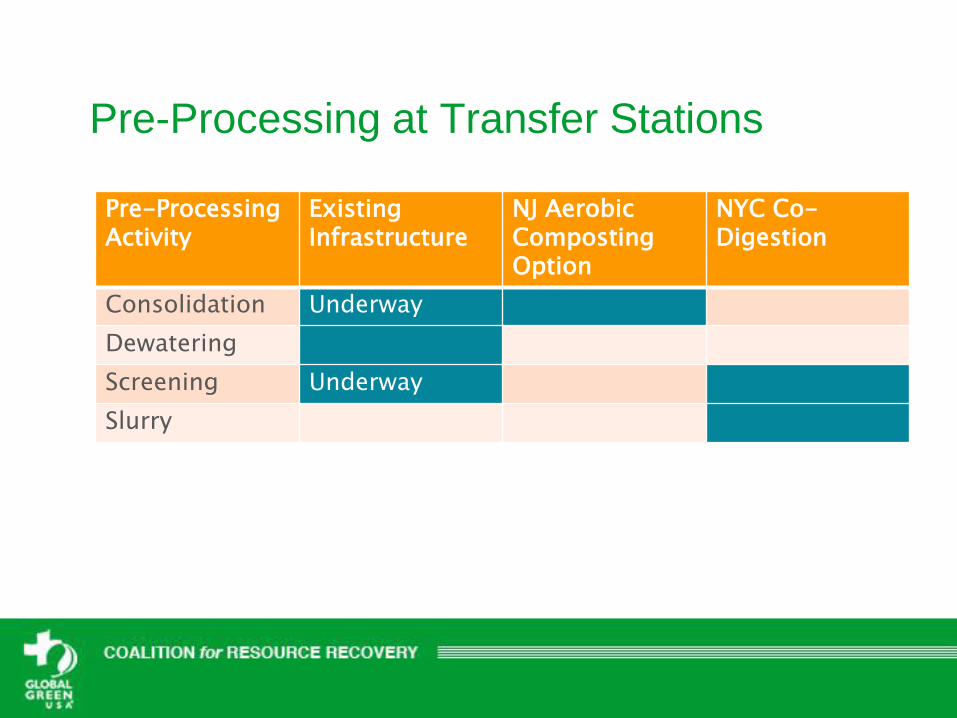
Pre-Processing at Transfer Stations
Pre-Processing Activity
Existing Infrastructure
NJ Aerobic Composting Option
NYC Co-Digestion
Consolidation Underway
Dewatering
Screening Underway
Slurry
Source Separated Transfer Station Opportunity
• Maximize consolidation, pre-processing, and fuel economy
efficiencies to deliver food waste to regional compost facilities
and wastewater treatment facilities
• Opportunities for co-location with existing infrastructure
• Provides an incremental and local outlet for source separated
residential food waste
• Opportunity for scaling up. NYC transfer stations surveyed are
permitted to receive on average over 500 tons per day
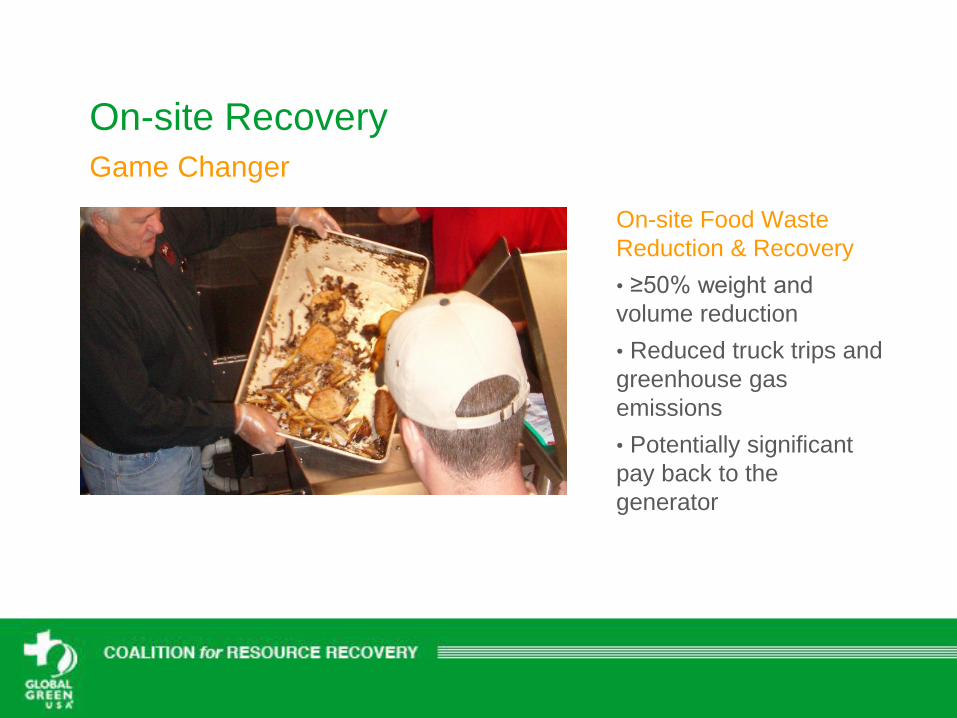
On-site Recovery
Game Changer
On-site Food Waste
Reduction & Recovery
• ≥50% weight and
volume reduction
• Reduced truck trips and
greenhouse gas
emissions
• Potentially significant
pay back to the
generator
Thank You
Annie White
Matt de la Houssaye
NY Office & Coalition for Resource
Recovery
Global Green USA
www.thecorr.org
Sources
Slide 9
Slide 9
• New York City Council (2010). A Local Law to amend the administrative code of
the city of New York, in relation to the composting of food waste.
• http://legistar.council.nyc.gov/LegislationDetail.aspx?ID=657931&GUID=35911E
72-C47B-48B6-968A-8744A02253DB&Options=&Search
• New York City Office of the Mayor. “Mayor Bloomberg Delivers 2012 State of the
City Address – NYC: Capital of Innovation.” January 12, 2012
www.nyc.gov/portal/site/nycgov/menuitem.c0935b9a57bb4ef3daf2f1c701c789a0
/index.jsp?pageID=mayor_press_release&catID=1194&doc_name=http%3A%2F
%2Fwww.nyc.gov%2Fhtml%2Fom%2Fhtml%2F2012a%2Fpr014-
12.html&cc=unused1978&rc=1194&ndi=1
• PlaNYC. Chapter on Solid Waste (2011).
http://nytelecom.vo.llnwd.net/o15/agencies/planyc2030/pdf/planyc_2011_solid_w
aste.pdf
Sources
Slides 10-11
Slide 10
NYC 2005 NYC Waste Characterization Study, Table 1-28, p. 14 and 15
http://www.nyc.gov/html/nycwasteless/downloads/pdf/wastecharreports/wcsfinal/report/wcs_05_
V1_2_detailedresresults.pdf
DSNY Commercial Waste Management Study Volume 2: table 1.4-2 (2004)
http://www.nyc.gov/html/dsny/downloads/pdf/swmp/swmp/cwms/cwms-ces/v2-cwgp.pdf
NYC Evaluation of New and Emerging Waste Management and Recycling Technologies,
Phase 3 (2012; page v; http://www.nyc.gov/html/dsny/downloads/pdf/business/p3_sitestudy.pdf
Slide 11
DEP Commercial Food Waste Disposer Study (2008).
http://www.nyc.gov/html/dep/pdf/dep_commercial_food_waste_disposal_study_12312008.pdf
Sources
Slides 12-21
Slide 13, 17, and 20
Communications with NYC haulers and regional compost facility operators
New York City Government Website. Business Integrity Commission www.nyc.gov/html/bic\
Slide 16
City Harvest Website; http://www.cityharvest.org/facility/
http://www.cityharvest.org/media/pdf/Paving_the_Way_to_a_Hunger-Free_City_Presentation.pdf
Communications with Andrew Shakman, President., Leanpath
Slide 20 and 21
Communications with owners and brokers
Slide 21
CBRE. MarketView. New Jersey Industrial. 3rd Quarter 2011.
Sources
Slides 22-28
Slide 22
Crain’s New York. “Demand for NYC industrial space drives rents up.” Andrew Marks Apr 17,
2011:
www.crainsnewyork.com/keywords/1297/Grubb+%26+Ellis+Co.#ixzz1b3HJPXPwhttp://www.crai
nsnewyork.com/article/20110417/REAL_ESTATE02/304179996#ixzz1b0sfQ1FF
Energy Information Administration. Electricity Sales, Revenue, and Average Price
http://www.eia.gov/electricity/sales_revenue_price/
NYISO Website. Nyiso.com. Accessed April 15, 2012.
Slide 28
Kerr, Dara. “Meet the 'Digester' — It Turns Your Food Scraps into Energy: East Bay water
agency produces nearly all its own power in first-of-its-kind program.” The Bay Citizen [San
Francisco, CA] 10 Nov. 2010. http://www.baycitizen.org/environment/story/introducing-digester-
it-turns-your-food/
US EPA Website. Pacific Southwest Waste Program. “Turning Food Waste into Energy at the
East Bay Municipal Utility District (EBMUD).”
http://www.epa.gov/region9/waste/features/foodtoenergy/wastewater.html
Sources
Slides 30
Slide 30
Profiles of NYC commercial putrescible waste transfer stations provided by New York City
Department of Sanitation


![Waste Heat Recovery[1]](https://img.pdfslide.net/doc/110x75/577d28de1a28ab4e1ea56f01/waste-heat-recovery1.jpg)