Embed Size (px)
Citation preview
1
Commercial Lunar Transportation Study Market Assessment Summary
FOR RELEASE September 2010
This work has been performed under NASA Contract NNH06CC38B
Futron Corporation
2
LUNAR TRANSPORTATION STUDY
SUMMARY REPORT
1 Objectives
In September, 2009, Futron, working with ASRC, built a business model for NASA to demonstrate how a
hypothetical new company entering the lunar transportation market as a supplier might evolve. As
NASA’s plans for human lunar return changed during the course of the project, the project focus shifted
to assessment of a somewhat limited business model purely for cargo transportation, excluding human
lunar return and related activities such as communications or navigation. The analysis hypothesized that
the business model could be enriched through the offer of ancillary services, such as cargo warehousing
or scheduling, but the revenue potential of such activities is not incorporated into the current view.
The overall study was intended to assess the viability of the commercial lunar transportation market and
associated business models. This was essentially a pre-market analysis as opposed to a detailed market
assessment. Specific objectives included:
Evaluate the economic feasibility of private sector participation in the provision of lunar
transportation
Identify the types of business models through which NASA might partner with industry in the
provision of lunar transportation services
Frame the business model for commercial activity relative to NASA’s objectives
Assessment of the potential for other uses/users
2 Analysis Overview and Conclusions
The analysis was undertaken in two phases: first to explore the demand for commercial lunar
transportation; and second to build a business case for a hypothetical commercial company providing
lunar transportation services. The demand exploration was conducted through interviews with possible
suppliers, possible customers, financiers, and stakeholders and also through background research. One of
the key challenges was to separate knowledge-based points of view from hypothetical responses only
valid in the event of a long string of “what ifs”. Because of this challenge, our general approach was to
consider all data to be a starting point and to test sensitivities and alternative scenarios for the most
critical assumptions.
The second phase entailed development of an Excel-based financial model to track our assumptions and
assess the likely financial returns of such a venture. The model was used to estimate how much demand
would be needed to make a lunar transportation venture commercially successful. Scenario analysis
against specific assumptions was performed to provide some color as to the sensitivity of the projections.
The financial model was built to address several objectives:
1. To determine, based on selected assumptions, what level of market demand would be necessary
to support a commercial lunar transportation industry, and how much of that demand would have
to come from NASA, assuming NASA’s only role is as a customer.

3
2. To initiate a dialog about appropriate cost and pricing / revenue assumptions within the space and
financial communities by proposing starting values for those assumptions based on whatever data
points are publicly available.
3. To educate the entrepreneurial and financial communities about commercial lunar transportation
business by offering a sample, highly generic financial model.
Based on the assumptions used in the model, the key model findings are:
As suggested in the 2009 Review of U.S. Human Space Flight Plans report, NASA’s assurances
regarding its demand will have a strong impact on the way the market develops, particularly with
regard to pricing
NASA’s early commitment to market development through entering the market as a customer can
represent a significant driver of change to long-term pricing for lunar transportation. A decision
by NASA to take a strong leadership role in this market could result in prices as much as 10%
less than the baseline ($4.5M/kg as opposed to $5M/kg) and a decision to act only as an
occasional buyer could lead to prices 40% higher than baseline ($7M/kg as opposed to $5M/kg). 3 Model Overview
The model starts with a set of business inputs and then calculates the demand needed to make the business
bankable (i.e., able to raise external financing) at a given price point. For the purposes of this analysis, the
bankable return is defined to mean a minimum 40% internal rate of return (IRR) within 7 years. This
definition was developed from interviews conducted with the investor community in which they
described a 40-50% return in a 5-7 year period as their expected target rate for such an opportunity.
3.1 Key Assumptions and Rationale
The key business assumptions for the model are:
Parameter Range Rationale / Sources
Total Missions, 2011-2021
18-24 Based on NASA’s plans at the time of the study ,to establish a lunar outpost and consistent with several external analyses
Target Cargo Capacity
40kg Assumption based on market status in Q4 2009; since then Astrobotic has announced higher target cargo capacity
Years to achieve target cargo size
3-10 Scenario definitions
Capacity Utilization 100% Ramp up of capacity accounts for demand conditions; all missions are now presumed to be fully subscribed
Price per kg (at target capacity)
$4.5-7 million/kg
Based on Astrobotic website as of October, 2009. Subsequent to the model development, in March, 2010, Astrobotic’s public price and mass statements were changed to reflect different capacity assumptions
Direct Cost per Mission (at startup capacity)
$50 million NASA Ames Research Center paper: "Small Spacecraft in Support of the Lunar Exploration Program" by William S. Marshall, Mark F. Turner, Butler P. Hine and Alan R. Weston assume cost per kg declines as capacity increases
Direct Cost per Mission (at target capacity)
$100 million
Sales, General, & Administrative (SG&A) Costs
$10-330 million Includes Indirect Labor, Insurance, R&D, and Other; based on interviews
4
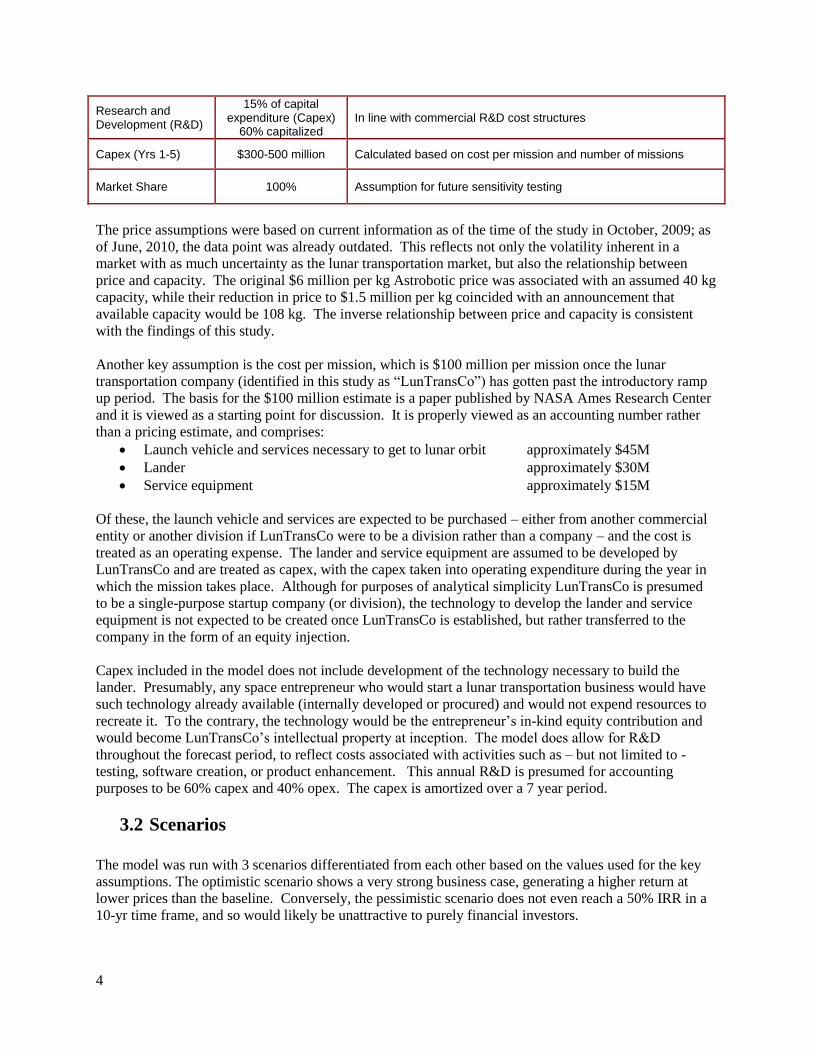
Research and Development (R&D)
15% of capital expenditure (Capex)
60% capitalized In line with commercial R&D cost structures
Capex (Yrs 1-5) $300-500 million Calculated based on cost per mission and number of missions
Market Share 100% Assumption for future sensitivity testing
The price assumptions were based on current information as of the time of the study in October, 2009; as
of June, 2010, the data point was already outdated. This reflects not only the volatility inherent in a
market with as much uncertainty as the lunar transportation market, but also the relationship between
price and capacity. The original $6 million per kg Astrobotic price was associated with an assumed 40 kg
capacity, while their reduction in price to $1.5 million per kg coincided with an announcement that
available capacity would be 108 kg. The inverse relationship between price and capacity is consistent
with the findings of this study.
Another key assumption is the cost per mission, which is $100 million per mission once the lunar
transportation company (identified in this study as “LunTransCo”) has gotten past the introductory ramp
up period. The basis for the $100 million estimate is a paper published by NASA Ames Research Center
and it is viewed as a starting point for discussion. It is properly viewed as an accounting number rather
than a pricing estimate, and comprises:
Launch vehicle and services necessary to get to lunar orbit approximately $45M
Lander approximately $30M
Service equipment approximately $15M
Of these, the launch vehicle and services are expected to be purchased – either from another commercial
entity or another division if LunTransCo were to be a division rather than a company – and the cost is
treated as an operating expense. The lander and service equipment are assumed to be developed by
LunTransCo and are treated as capex, with the capex taken into operating expenditure during the year in
which the mission takes place. Although for purposes of analytical simplicity LunTransCo is presumed
to be a single-purpose startup company (or division), the technology to develop the lander and service
equipment is not expected to be created once LunTransCo is established, but rather transferred to the
company in the form of an equity injection.
Capex included in the model does not include development of the technology necessary to build the
lander. Presumably, any space entrepreneur who would start a lunar transportation business would have
such technology already available (internally developed or procured) and would not expend resources to
recreate it. To the contrary, the technology would be the entrepreneur’s in-kind equity contribution and
would become LunTransCo’s intellectual property at inception. The model does allow for R&D
throughout the forecast period, to reflect costs associated with activities such as – but not limited to -
testing, software creation, or product enhancement. This annual R&D is presumed for accounting
purposes to be 60% capex and 40% opex. The capex is amortized over a 7 year period.
3.2 Scenarios
The model was run with 3 scenarios differentiated from each other based on the values used for the key
assumptions. The optimistic scenario shows a very strong business case, generating a higher return at
lower prices than the baseline. Conversely, the pessimistic scenario does not even reach a 50% IRR in a
10-yr time frame, and so would likely be unattractive to purely financial investors.

5
The main take-away from this is that while the lunar transportation market has a bankable business case,
it is somewhat tenuous and can be broken based on changes in a few key assumptions. As a large
customer, NASA can influence how much security exists in the market and how it actually develops by
acting at the market’s inception. If NASA chooses not to be a market maker at this point in the evolution
of commercial lunar transportation, the market will be driven by other significant buyer(s).
A summary of the scenario analysis is shown below:
3.3 Sensitivities
The model is set up to evaluate sensitivity to three major risks:
Catastrophic loss: The possibility of a catastrophic loss at some point during the 10-year
program is non-trivial. The model tests the impact of such a loss by assuming full costs and 0
revenue for the mission on which the loss occurs. For purposes of this discussion, the model
assumes that the catastrophic loss occurs in the first year of the enterprise, to model a worst case
scenario.
Results of the catastrophic loss sensitivity are to reduce the 7-yr IRR from 41% to 14%. In order
to reach the 40% IRR threshold in 7 years, prices for the years following the year of the loss
would need to be increased by approximately 22%.
Cost efficiencies: Another potential area for sensitivity testing is the total cost. If the commercial
sector is able to achieve scale economies, then costs could be somewhat less than the assumptions
made in the baseline model. The baseline model assumes that after an initial ramp up period,
costs remain constant over time. The sensitivity that was tested was intended to calculate the
impact on price of a 20% reduction in cost, with 20% chosen to show the expected lower limit on
pricing, rather than to target a specific magnitude of cost reduction. It is anticipated that cost
reductions would be achieved through gains in production efficiency and volume purchases. The
Baseline Optimistic Pessimistic
- Returns - 41% in 7 yrs 43% in 7 yrs 47% in 10 yrs
- Target Pricing - $5.0 m/kg $4.5 m/kg $7 m/kg
- Likely Players - • SpaceX
• GLXP companies
• Established industry
• Established industry
• Emerging space
players
• ESA
• Arianespace
• Wealthy entrepreneurs
- Market
Development -
• Attain 40 kg capacity
in 5 yrs; 5% growth
thereafter
• Attain 40 kg capacity
in 3 yrs; 5% growth
thereafter
• Attain 40 kg capacity
in 10 yrs
- NASA Role - Dominant player
(avg 28 kg / mission)
Market maker
(avg 32 kg / mission)
Periodic buyer
(avg 12 kg / mission)
- Funding - Private equity Private equity
Capital markets
Wealthy individuals /
corporate coalitions
- Initial Pricing - $6.0 m/kg $6.0 m/kg $6.0 m/kg

6
impact of cost overruns was not tested. The impact of lower costs on the price necessary to reach
the 40% IRR target are shown in the following graphic:
Prices: The model’s sensitivity to pricing was also tested. The baseline assumption sets target
pricing at $5.0 m per kg. This would be the price once the commercial operator comes off of the
start-up ramp. In this model, that is assumed to be a 5-year ramp, which is also the period
assumed to get up to a 40 kg capacity per mission, 2 missions per year, and a full $100m per
mission cost. Although the pricing sensitivity holds capacity constant, some of the pricing
volatility can be linked to changes in payload capacity. The IRRs associated with different target
pricing within the $4.2-6.7 million per kg are shown below:
4 Demand Overview
Supporting the model was an independent market analysis of the potential business opportunity associated
with commercially provided lunar transportation and landing capability for the decade from 2012 through
2021, along with the key likely associated markets. This analysis focused primarily on commercially-
$3.70
$4.10
$5.10
$4.50
$5.00
$7.00
$0.00
$1.00
$2.00
$3.00
$4.00
$5.00
$6.00
$7.00
$8.00
Optimistic Baseline Pessimistic
millio
ns
pe
r k
g
Prices Yielding the Same ROI Given Different Cost Levels
80% of cost
100% of cost
-7%
41%
78%
-20%
0%
20%
40%
60%
80%
100%
$4.2 $5.0 $5.8 $6.7
7-y
ea
r IR
R
$ million per kg
Price Sensitivity
Baseline Scenario
7
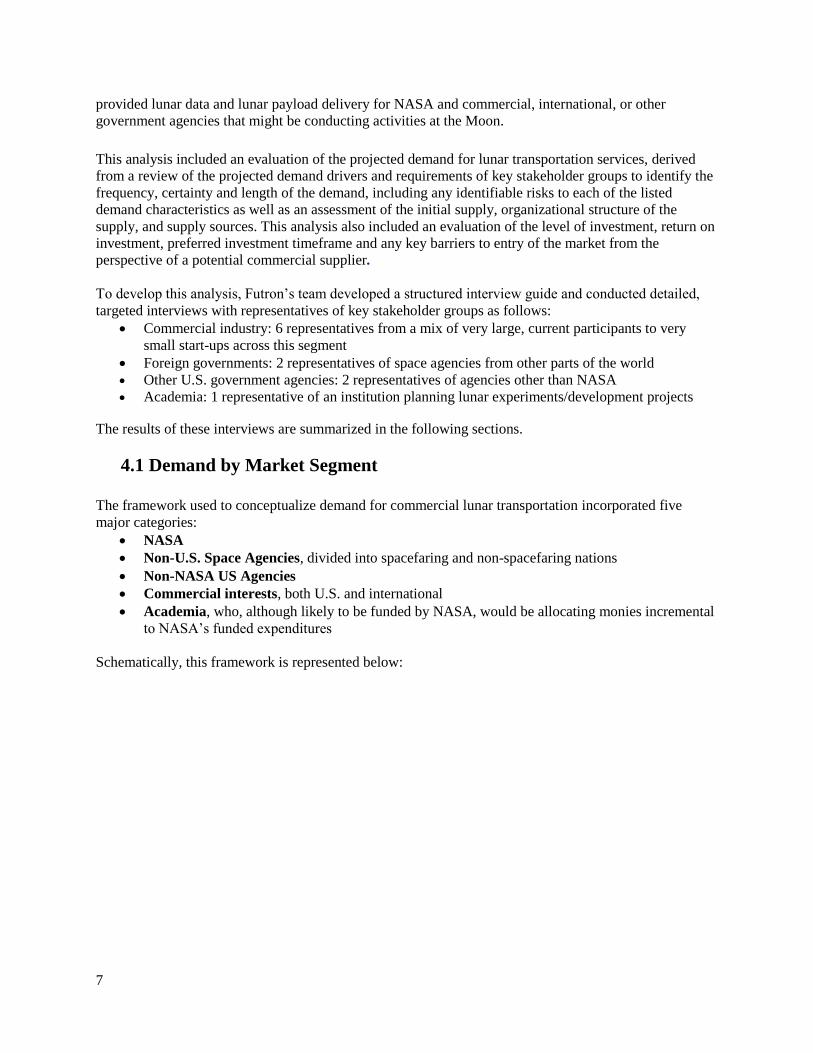
provided lunar data and lunar payload delivery for NASA and commercial, international, or other
government agencies that might be conducting activities at the Moon.
This analysis included an evaluation of the projected demand for lunar transportation services, derived
from a review of the projected demand drivers and requirements of key stakeholder groups to identify the
frequency, certainty and length of the demand, including any identifiable risks to each of the listed
demand characteristics as well as an assessment of the initial supply, organizational structure of the
supply, and supply sources. This analysis also included an evaluation of the level of investment, return on
investment, preferred investment timeframe and any key barriers to entry of the market from the
perspective of a potential commercial supplier.
To develop this analysis, Futron’s team developed a structured interview guide and conducted detailed,
targeted interviews with representatives of key stakeholder groups as follows:
Commercial industry: 6 representatives from a mix of very large, current participants to very
small start-ups across this segment
Foreign governments: 2 representatives of space agencies from other parts of the world
Other U.S. government agencies: 2 representatives of agencies other than NASA
Academia: 1 representative of an institution planning lunar experiments/development projects
The results of these interviews are summarized in the following sections.
4.1 Demand by Market Segment
The framework used to conceptualize demand for commercial lunar transportation incorporated five
major categories:
NASA
Non-U.S. Space Agencies, divided into spacefaring and non-spacefaring nations
Non-NASA US Agencies
Commercial interests, both U.S. and international
Academia, who, although likely to be funded by NASA, would be allocating monies incremental
to NASA’s funded expenditures
Schematically, this framework is represented below:
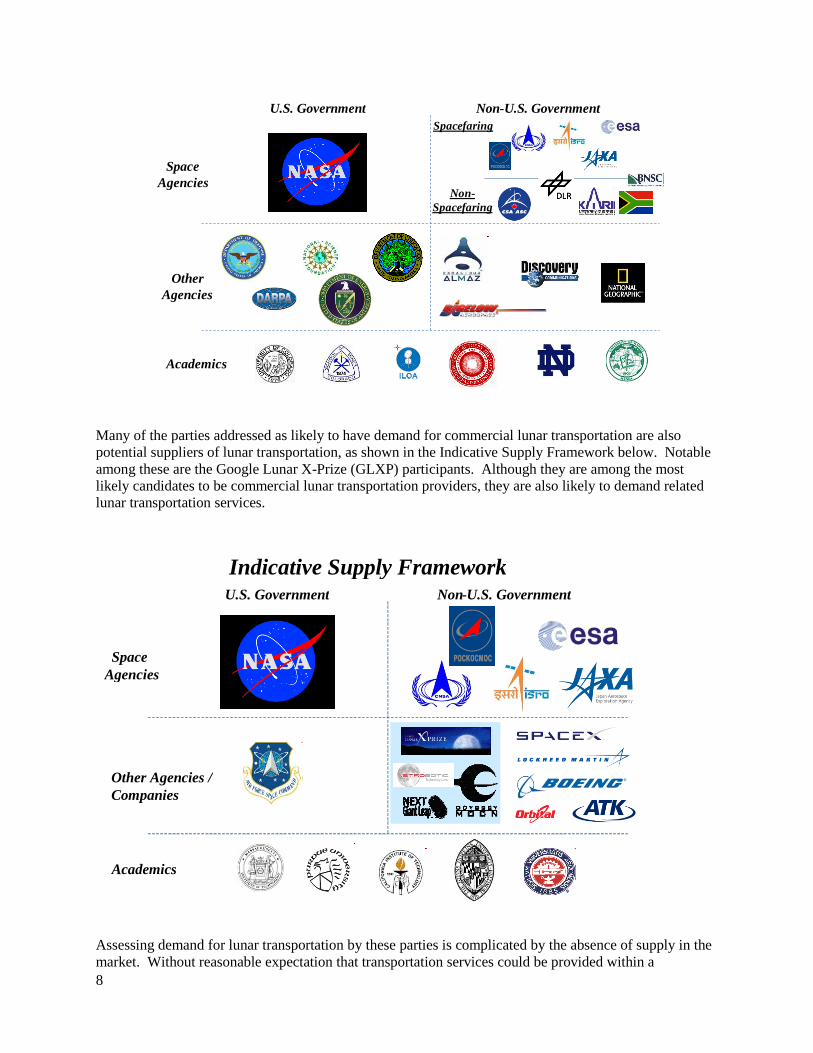
8
Many of the parties addressed as likely to have demand for commercial lunar transportation are also
potential suppliers of lunar transportation, as shown in the Indicative Supply Framework below. Notable
among these are the Google Lunar X-Prize (GLXP) participants. Although they are among the most
likely candidates to be commercial lunar transportation providers, they are also likely to demand related
lunar transportation services.
Assessing demand for lunar transportation by these parties is complicated by the absence of supply in the
market. Without reasonable expectation that transportation services could be provided within a
U.S. Government Non-U.S. Government
Space
Agencies
Other
Agencies
Spacefaring
Non-
Spacefaring
Academics
Indicative Supply Framework
U.S. Government Non - U.S. Government
Space
Agencies
Other Agencies /
Companies
Academics
9
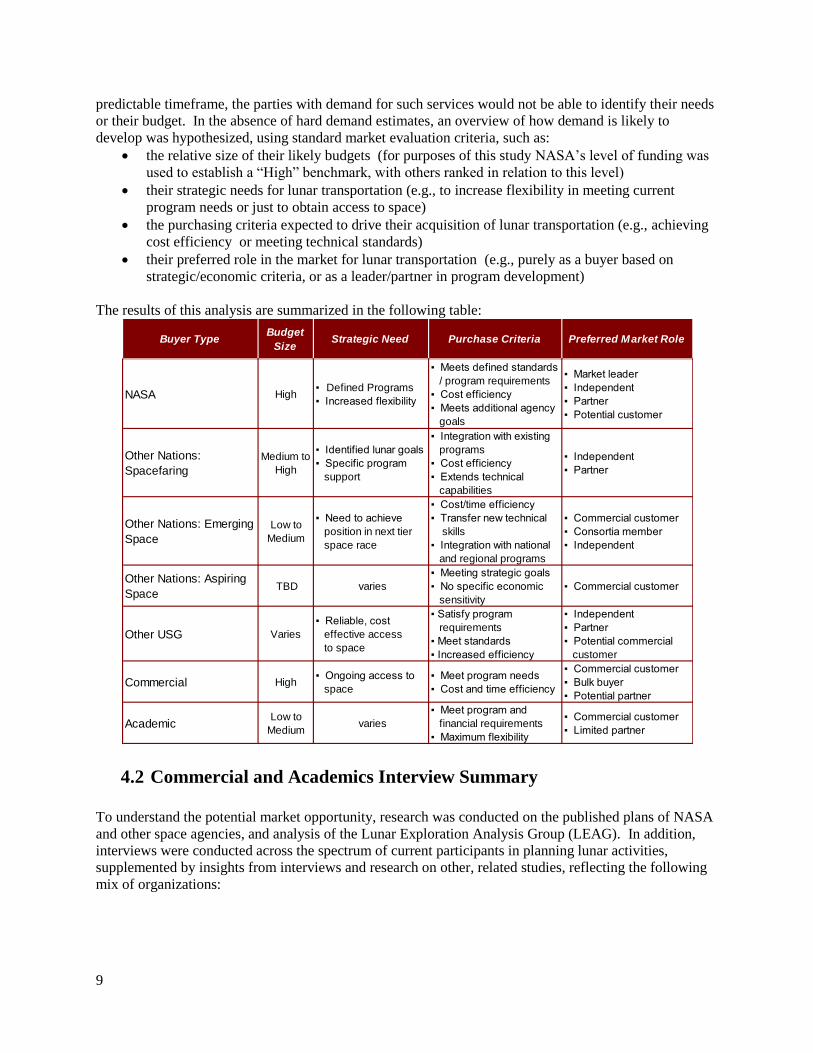
predictable timeframe, the parties with demand for such services would not be able to identify their needs
or their budget. In the absence of hard demand estimates, an overview of how demand is likely to
develop was hypothesized, using standard market evaluation criteria, such as:
the relative size of their likely budgets (for purposes of this study NASA’s level of funding was
used to establish a “High” benchmark, with others ranked in relation to this level)
their strategic needs for lunar transportation (e.g., to increase flexibility in meeting current
program needs or just to obtain access to space)
the purchasing criteria expected to drive their acquisition of lunar transportation (e.g., achieving
cost efficiency or meeting technical standards)
their preferred role in the market for lunar transportation (e.g., purely as a buyer based on
strategic/economic criteria, or as a leader/partner in program development)
The results of this analysis are summarized in the following table:
4.2 Commercial and Academics Interview Summary
To understand the potential market opportunity, research was conducted on the published plans of NASA
and other space agencies, and analysis of the Lunar Exploration Analysis Group (LEAG). In addition,
interviews were conducted across the spectrum of current participants in planning lunar activities,
supplemented by insights from interviews and research on other, related studies, reflecting the following
mix of organizations:
Buyer TypeBudget
SizeStrategic Need Purchase Criteria Preferred Market Role
NASA High▪ Defined Programs
▪ Increased flexibility
▪ Meets defined standards
/ program requirements
▪ Cost efficiency
▪ Meets additional agency
goals
▪ Market leader
▪ Independent
▪ Partner
▪ Potential customer
Other Nations:
Spacefaring
Medium to
High
▪ Identified lunar goals
▪ Specific program
support
▪ Integration with existing
programs
▪ Cost efficiency
▪ Extends technical
capabilities
▪ Independent
▪ Partner
Other Nations: Emerging
Space
Low to
Medium
▪ Need to achieve
position in next tier
space race
▪ Cost/time efficiency
▪ Transfer new technical
skills
▪ Integration with national
and regional programs
▪ Commercial customer
▪ Consortia member
▪ Independent
Other Nations: Aspiring
Space TBD varies
▪ Meeting strategic goals
▪ No specific economic
sensitivity
▪ Commercial customer
Other USG Varies
▪ Reliable, cost
effective access
to space
▪ Satisfy program
requirements
▪ Meet standards
▪ Increased efficiency
▪ Independent
▪ Partner
▪ Potential commercial
customer
Commercial High▪ Ongoing access to
space
▪ Meet program needs
▪ Cost and time efficiency
▪ Commercial customer
▪ Bulk buyer
▪ Potential partner
AcademicLow to
Medium varies
▪ Meet program and
financial requirements
▪ Maximum flexibility
▪ Commercial customer
▪ Limited partner

10
Note: These numbers differ from the number of interviews conducted specifically for this project because interviews
from other recent, relevant studies were also incorporated.
Commercial and academic interviewees expressed a strong preference for a NASA-supported economic
model. In particular, the following needs were articulated:
Government must be the driving customer at the outset; no other markets make sense unless
commercial transportation infrastructure exists.
Commitment to buy the service after development; during development pay on a milestone basis.
Stimulate market development by being a short-term investor and a short- and medium-term
customer.
Similarly, the interviewees identified the following key risks to the business model:
Concerns about NASA’s ability to commit to the timeframe and dollars required to support a
COTS-like model for lunar activities.
COTS-like model can be riskier than cost plus when under-funded or limited funds split between
players
Can NASA be a reliable customer? Funding and programmatic uncertainty.
4.3 International Space Agency Summary
Through the interview and research processes, the missions and funding statuses of non-U.S. space
agencies was compiled, as follows:
Category Number
Academic 2
Commercial Space Companies 24
International Space Agency 3
NASA 1
U.S. Government/Non-NASA 2
- Funding Status of International Space Agency Lunar Missions -
1
1
1
1
3
3
1
2
1
1
1
1
2
2
1
3
0 1 2 3 4 5 6
DLR
CSA
KARI
ESA
BNSC
ISRO
Roscosmos
JAXA
CNSA
Launched Funded Proposed Discussed
5
5
4
1
3
2
2
2
1

11
At a more summary level, the funding status of non-U.S. trips to the moon breaks down as follows:
5 Finance Interview Summary
A separate module of the analysis entailed conducting interviews with financial players who may be
interested in the space industry. The investors referred to in this section are financial investors, who may
make their investment via debt or equity, but who are third parties (i.e., neither suppliers, customers, nor
operators of lunar transportation companies) providing capital solely for the purpose of achieving a future
return. A total of 14 representatives of the financial investment community were interviewed, including:
1 “angel investor”
9 venture capital companies
2 investment bankers
2 space entrepreneurs
The majority of investors view lunar transportation as a new, unproven industry without proven business
models that provide multiple revenue streams. Venture capital experience allows for acceptable internal
rates of return in the 30-40% for communications ventures and requires 40-50% for space-related
ventures. Private equity has realized 20-25% for communications projects and seeks 30%+ to
compensate for the high risks of space-related investment. A traditional time period for return on
investment is 3-4 years, but for lunar transportation, a slightly longer time frame would be acceptable – 4-
7 years. Institutional investors will be the last to engage.
Investors’ stated requirements to become interested in space in the short-term included:
A largely NASA-funded program, such as a lunar version of a COTS program, with strong
NASA commitment over the start-up timeframe
Several “beta-successful” companies during the initial years of the program
Substantial revenue guarantees offered by NASA during the early years
Improve on successful government / industry programs
Multiple revenue streams
- Status of Non-U.S. Lunar
Missions (Aggregate) -
12%
28%
24%
36%Launched
Funded
Proposed
Discussed
12
Overall, the investor community’s position is well described by the following quotes from these
interviews:
• “One of the biggest problems related to lunar development are the high costs and NASA's ability
to manage. Moving NASA from the supply to the demand side of the equation will likely lower
costs and induce other players to get into the game.” –Space Sector Academic
• “Investors will look at the market potential (eg.., demand, multiple revenue streams, guarantees,
etc.) much the same way they currently look at satellite deals. They will want to understand who
else will be customers, yet a program that has a solid market foundation, attracts multiple clients
(not just NASA), and has a risk/adjusted return – will spark interest. The government will have to
jump-start the effort by adding more revenue guarantees, and this will allow VCs, in particular,
to step up and take the risk, and reap the returns/rewards.” – Space Industry Investment Banker
• “When one looks at the lunar investment opportunities, the issue for investors will be to create
the right risk/reward incentive to invest (e.g., lower the downside risk) and provide the belief that
there are multiple revenue sources (e.g., other space agencies, consumers, governments as
buyers). Once there are 5 or more successful ventures, then VC, private equity, and institutions
will be much more likely to invest, too. For NASA, the question needs to be “How to get the first
early-stage companies involved?” – Space Angel Investor

13
6 High Level Findings Overall, this analysis suggests that there are benefits to NASA of a commercial lunar transportation
market and a reasonable chance of success for the market to develop, if NASA is able to provide clear
support. In particular:
Lunar transportation is an economically feasible market, in which the private sector is prepared to
participate
o Capability and capital are both available, but not easy
o The business model is feasible and offers attractive returns, subject to multiple
assumptions, including capacity, timing, price and cost
o Commercial players are already preparing to enter this market
o International space agencies are ready to start working with commercial providers
The private sector is waiting for NASA to signal its interest in commercial lunar transport
o NASA’s leadership is critical to market development
o A positive return is generated at either high or low levels of NASA demand, but the time
to success is variable, and companies need guidance :
At low levels of NASA demand, the return may not be sufficient to attract
financial investors, suggesting that the market will be dominated by alternative
types of financial models, which may include high net worth individuals whose
return horizon differs from the financial community overall, companies who may
accept a lower level of return to create a market for a complementary product, or
foreign government-supported entities where governments may make a non-
commercial investment in exchange for greater market control.
o A multi-year, phased approach is required for funding and deployment
Commercial lunar transportation could provide a mechanism for NASA to accomplish multiple
objectives
o Supports positive image for NASA for proactively considering multiple options for key
markets
o Expands NASA’s credibility relative to international collaboration and public-private
partnerships
o Early participation gives NASA the ability to influence how the market develops
Overall, this market continues to be volatile, and faces market and investment, more than technical
barriers. Since the market will evolve with changes in technology as well as both corporate, and
government strategies, updated, expanded analysis will be required.