Embed Size (px)
Citation preview

2Q15
Commercial Real Estate Market Trends and Transaction Analysis l SECOND QUARTER l www.ccim.com
QUARTERLY MARKET TRENDS u NATIONAL ASSOCIAT ION OF REALTORS ® AND CCIM INST ITUTE 2
Headline Line HEADLINE
Vacancy Rate34%
2Q • 15
Dear CCIM Institute members,
Welcome to the second-quarter 2015 edition of CCIM Institute’s Quarterly
Market Trends. The report provides timely insight into major commercial
real estate indicators for core income-producing properties. It is produced by
the National Association of Realtors® for members of the CCIM Institute, the
commercial real estate industry’s global standard for professional achievement.
The second-quarter 2015 report features commentary from Lawrence Yun, Ph.D.,
NAR chief economist, and George Ratiu, director of NAR’s quantitative and
commercial research. I hope that the information provided in CCIM’s Quarterly
Market Trends report provides both economic and commercial real estate market information that will assist you
in your business strategies in 2015 and beyond.
Sincerely,
Mark Macek, CCIM
2015 CCIM Institute President
Quarterly Market TRENDS
June 2015 FOREWORD
QUARTERLY MARKET TRENDS u NATIONAL ASSOCIAT ION OF REALTORS ® AND CCIM INST ITUTE 3
2Q • 15
Headline Line HEADLINE
CCIM Transaction Survey Highlights 4
Commercial Property Sector Analysis 5
Commercial Real Estate Market Update 9
Commercial Real Estate Forecast 13
CCIM Survey Regional Trends 14
U S Economic Overview 18
U S Metropolitan Economic Outlook 23
Sponsors 26
Contributors 27
Table of CONTENTS
Vacancy Rate34%
Vacancy Rate34%
Vacancy Rate34%
Quarterly Market TRENDS
QUARTERLY MARKET TRENDS u NATIONAL ASSOCIAT ION OF REALTORS ® AND CCIM INST ITUTE 4
2Q • 15Quarterly Market Trends
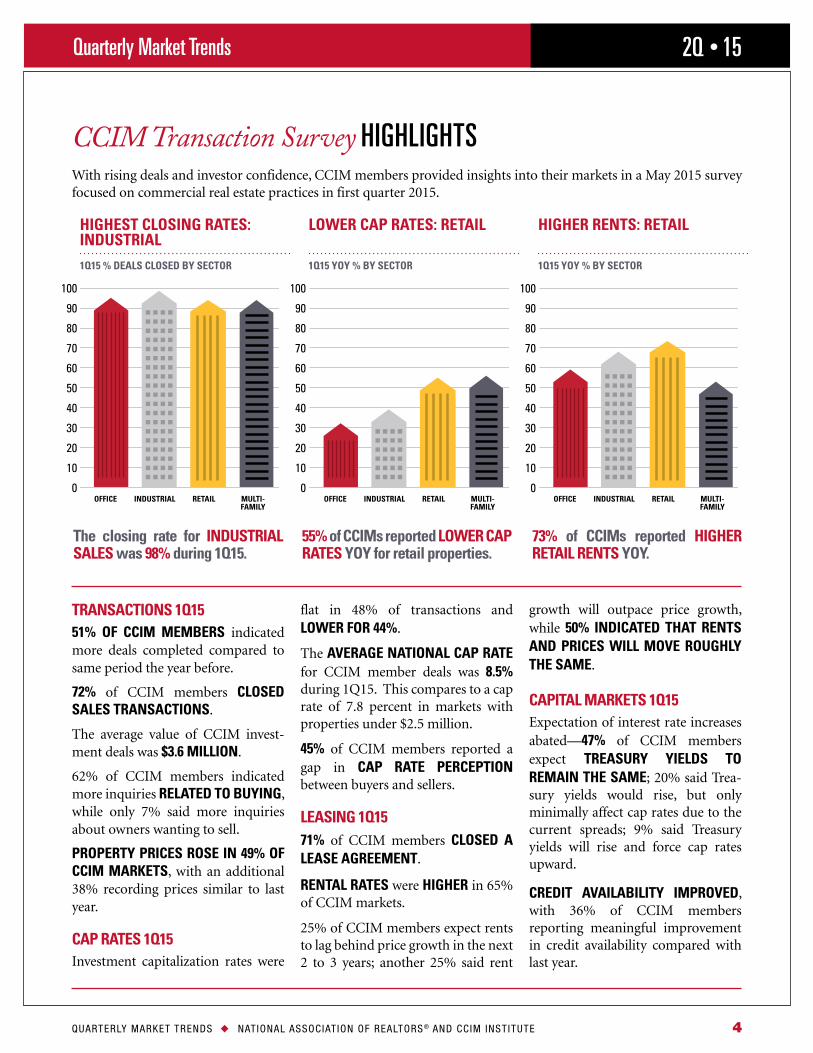
CCIM Transaction Survey HIGHLIGHTS
55% of CCIMs reported LOWER CAP RATES YOY for retail properties.
The closing rate for INDUSTRIAL SALES was 98% during 1Q15.
HIGHEST CLOSING RATES: INDUSTRIAL
1Q15 % DEALS CLOSED BY SECTOR
LOWER CAP RATES: RETAIL
1Q15 YOY % BY SECTOR
HIGHER RENTS: RETAIL
1Q15 YOY % BY SECTOR
73% of CCIMs reported HIGHER RETAIL RENTS YOY.
With rising deals and investor confidence, CCIM members provided insights into their markets in a May 2015 survey focused on commercial real estate practices in first quarter 2015.
OFFICE INDUSTRIAL RETAIL MULTI- FAMILY
OFFICE INDUSTRIAL RETAIL MULTI- FAMILY
OFFICE INDUSTRIAL RETAIL MULTI- FAMILY
TRANSACTIONS 1Q1551% OF CCIM MEMBERS indicated more deals completed compared to same period the year before.
72% of CCIM members CLOSED SALES TRANSACTIONS.
The average value of CCIM invest-ment deals was $3.6 MILLION.
62% of CCIM members indicated more inquiries RELATED TO BUYING, while only 7% said more inquiries about owners wanting to sell.
PROPERTY PRICES ROSE IN 49% OF CCIM MARKETS, with an additional 38% recording prices similar to last year.
CAP RATES 1Q15Investment capitalization rates were
flat in 48% of transactions and LOWER FOR 44%.
The AVERAGE NATIONAL CAP RATE for CCIM member deals was 8.5% during 1Q15. This compares to a cap rate of 7.8 percent in markets with properties under $2.5 million.
45% of CCIM members reported a gap in CAP RATE PERCEPTION between buyers and sellers.
LEASING 1Q1571% of CCIM members CLOSED A LEASE AGREEMENT.
RENTAL RATES were HIGHER in 65% of CCIM markets.
25% of CCIM members expect rents to lag behind price growth in the next 2 to 3 years; another 25% said rent
growth will outpace price growth, while 50% INDICATED THAT RENTS AND PRICES WILL MOVE ROUGHLY THE SAME.
CAPITAL MARKETS 1Q15Expectation of interest rate increases abated—47% of CCIM members expect TREASURY YIELDS TO REMAIN THE SAME; 20% said Trea-sury yields would rise, but only minimally affect cap rates due to the current spreads; 9% said Treasury yields will rise and force cap rates upward.
CREDIT AVAILABILITY IMPROVED, with 36% of CCIM members reporting meaningful improvement in credit availability compared with last year.
100
90
80
70
60
50
40
30
20
10
0
100
90
80
70
60
50
40
30
20
10
0
100
90
80
70
60
50
40
30
20
10
0
QUARTERLY MARKET TRENDS u NATIONAL ASSOCIAT ION OF REALTORS ® AND CCIM INST ITUTE 5
2Q • 15Quarterly Market Trends
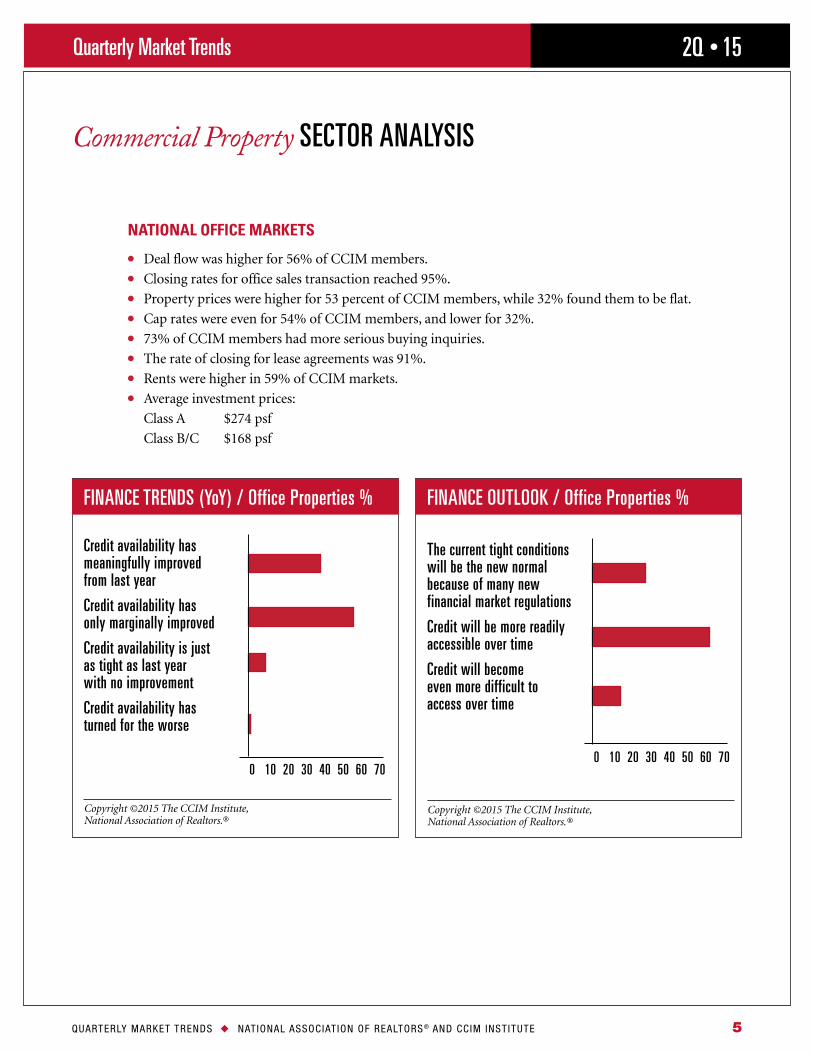
Commercial Property SECTOR ANALYSIS
NATIONAL OFFICE MARKETS
l Deal flow was higher for 56% of CCIM members.l Closing rates for office sales transaction reached 95%.l Property prices were higher for 53 percent of CCIM members, while 32% found them to be flat.l Cap rates were even for 54% of CCIM members, and lower for 32%.l 73% of CCIM members had more serious buying inquiries.l The rate of closing for lease agreements was 91%.l Rents were higher in 59% of CCIM markets.l Average investment prices:
Class A $274 psf
Class B/C $168 psf
FINANCE OUTLOOK / Office Properties %
The current tight conditions will be the new normal because of many new financial market regulations
Credit will be more readily accessible over time
Credit will become even more difficult to access over time
Copyright ©2015 The CCIM Institute, National Association of Realtors.®
FINANCE TRENDS (YoY) / Office Properties %
Credit availability has meaningfully improved from last year
Credit availability has only marginally improved
Credit availability is just as tight as last year with no improvement
Credit availability has turned for the worse
Copyright ©2015 The CCIM Institute, National Association of Realtors.®
0 10 20 30 40 50 60 700 10 20 30 40 50 60 70
QUARTERLY MARKET TRENDS u NATIONAL ASSOCIAT ION OF REALTORS ® AND CCIM INST ITUTE 6
2Q • 15Quarterly Market Trends
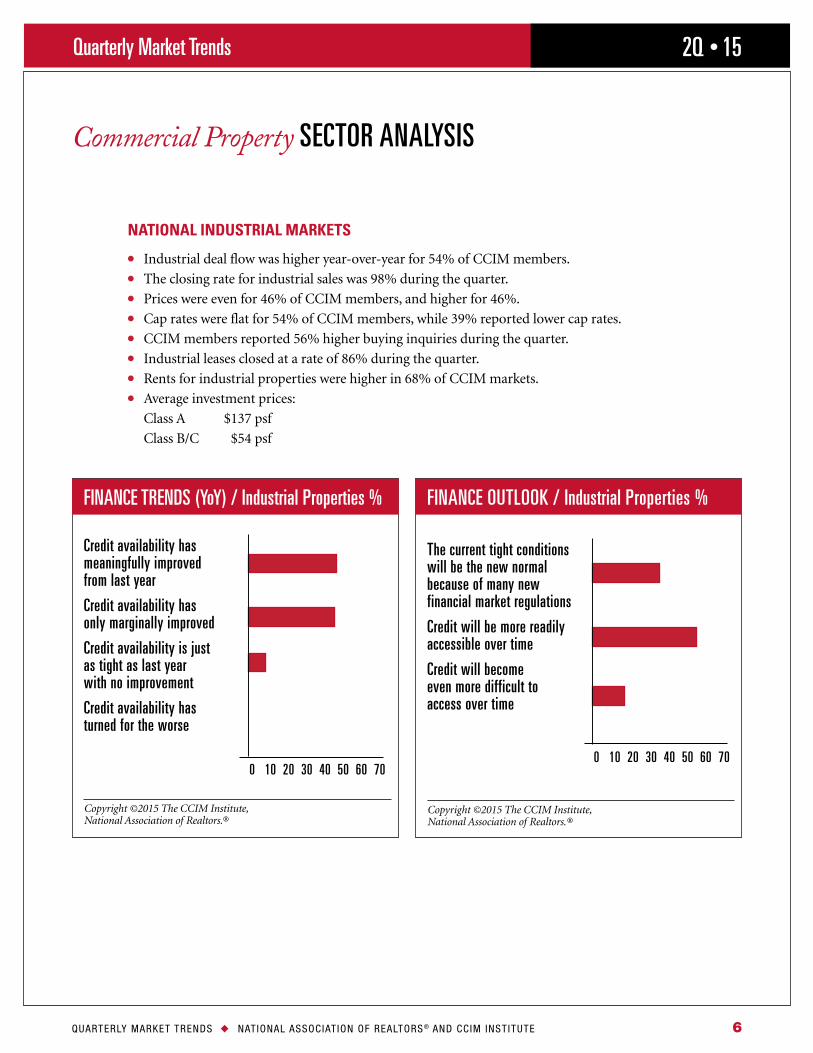
Commercial Property SECTOR ANALYSIS
NATIONAL INDUSTRIAL MARKETS
l Industrial deal flow was higher year-over-year for 54% of CCIM members. l The closing rate for industrial sales was 98% during the quarter.l Prices were even for 46% of CCIM members, and higher for 46%. l Cap rates were flat for 54% of CCIM members, while 39% reported lower cap rates. l CCIM members reported 56% higher buying inquiries during the quarter.l Industrial leases closed at a rate of 86% during the quarter. l Rents for industrial properties were higher in 68% of CCIM markets.l Average investment prices:
Class A $137 psf
Class B/C $54 psf
FINANCE OUTLOOK / Industrial Properties %
The current tight conditions will be the new normal because of many new financial market regulations
Credit will be more readily accessible over time
Credit will become even more difficult to access over time
Copyright ©2015 The CCIM Institute, National Association of Realtors.®
FINANCE TRENDS (YoY) / Industrial Properties %
Credit availability has meaningfully improved from last year
Credit availability has only marginally improved
Credit availability is just as tight as last year with no improvement
Credit availability has turned for the worse
Copyright ©2015 The CCIM Institute, National Association of Realtors.®
0 10 20 30 40 50 60 700 10 20 30 40 50 60 70
QUARTERLY MARKET TRENDS u NATIONAL ASSOCIAT ION OF REALTORS ® AND CCIM INST ITUTE 7
2Q • 15Quarterly Market Trends
Commercial Property SECTOR ANALYSIS
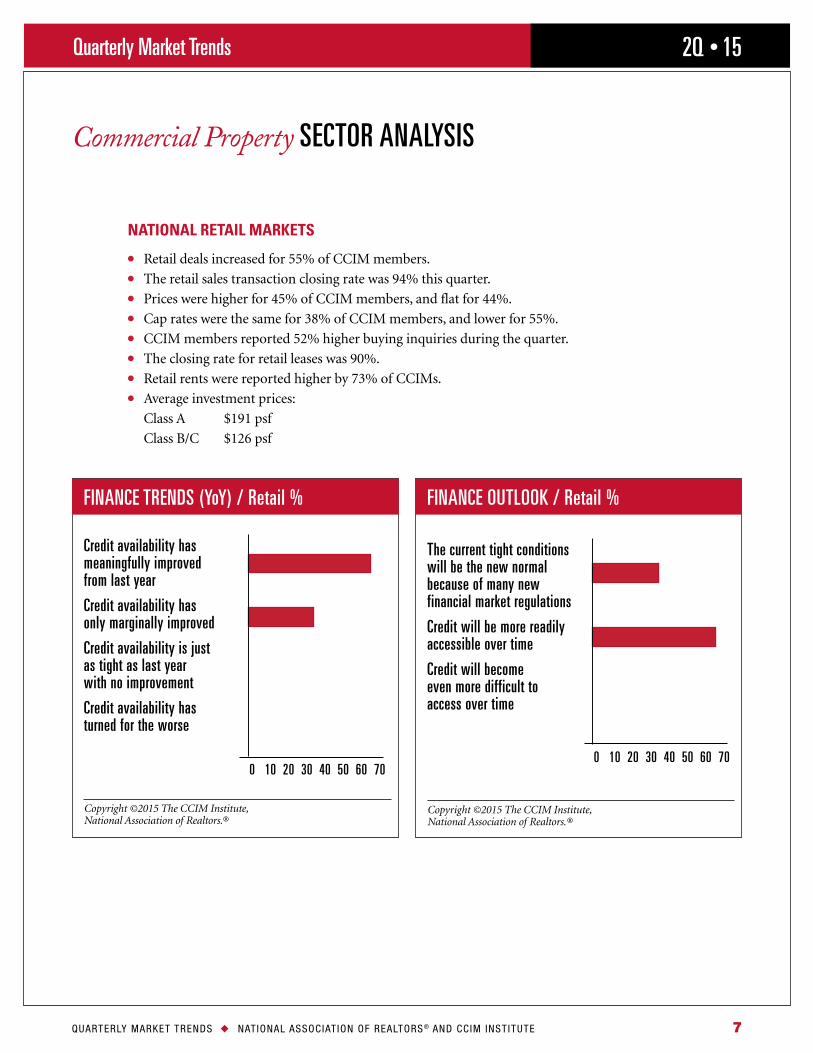
NATIONAL RETAIL MARKETS
l Retail deals increased for 55% of CCIM members. l The retail sales transaction closing rate was 94% this quarter. l Prices were higher for 45% of CCIM members, and flat for 44%. l Cap rates were the same for 38% of CCIM members, and lower for 55%. l CCIM members reported 52% higher buying inquiries during the quarter.l The closing rate for retail leases was 90%. l Retail rents were reported higher by 73% of CCIMs.l Average investment prices:
Class A $191 psf
Class B/C $126 psf
FINANCE OUTLOOK / Retail %
The current tight conditions will be the new normal because of many new financial market regulations
Credit will be more readily accessible over time
Credit will become even more difficult to access over time
Copyright ©2015 The CCIM Institute, National Association of Realtors.®
FINANCE TRENDS (YoY) / Retail %
Credit availability has meaningfully improved from last year
Credit availability has only marginally improved
Credit availability is just as tight as last year with no improvement
Credit availability has turned for the worse
Copyright ©2015 The CCIM Institute, National Association of Realtors.®
0 10 20 30 40 50 60 700 10 20 30 40 50 60 70
QUARTERLY MARKET TRENDS u NATIONAL ASSOCIAT ION OF REALTORS ® AND CCIM INST ITUTE 8
2Q • 15Quarterly Market Trends
Commercial Property SECTOR ANALYSIS
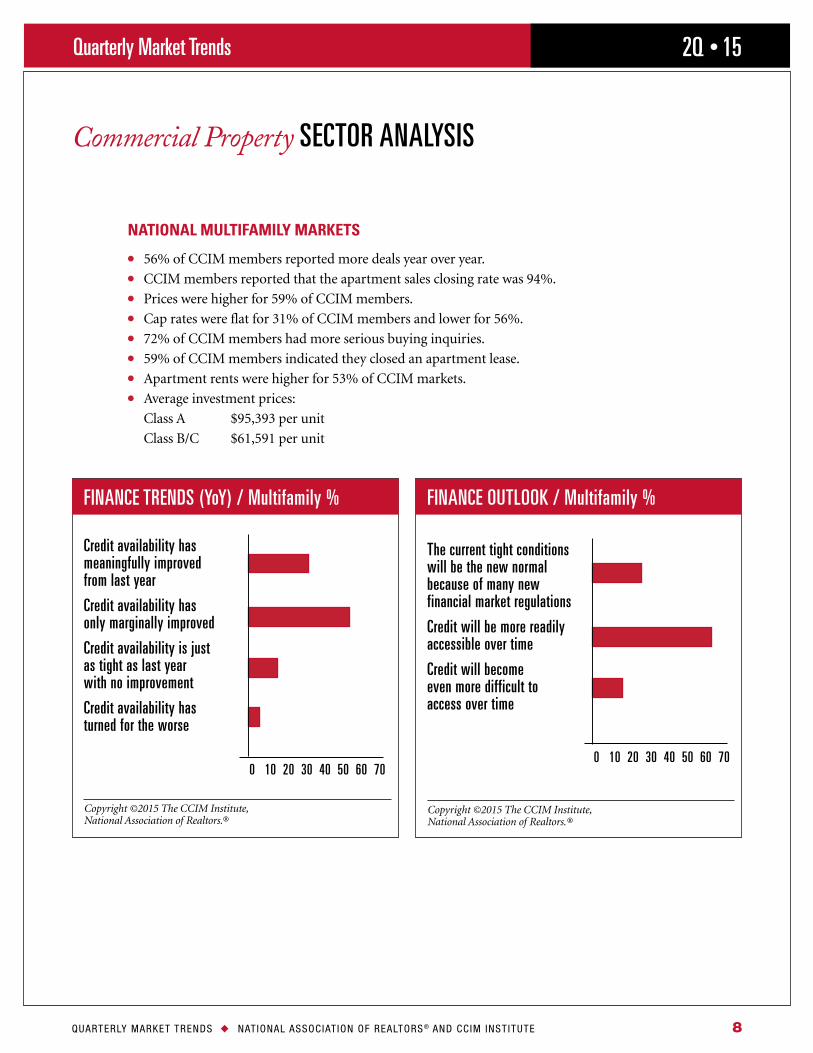
NATIONAL MULTIFAMILY MARKETS
l 56% of CCIM members reported more deals year over year. l CCIM members reported that the apartment sales closing rate was 94%. l Prices were higher for 59% of CCIM members. l Cap rates were flat for 31% of CCIM members and lower for 56%. l 72% of CCIM members had more serious buying inquiries.l 59% of CCIM members indicated they closed an apartment lease. l Apartment rents were higher for 53% of CCIM markets.l Average investment prices:
Class A $95,393 per unit
Class B/C $61,591 per unit
FINANCE OUTLOOK / Multifamily %
The current tight conditions will be the new normal because of many new financial market regulations
Credit will be more readily accessible over time
Credit will become even more difficult to access over time
Copyright ©2015 The CCIM Institute, National Association of Realtors.®
FINANCE TRENDS (YoY) / Multifamily %
Credit availability has meaningfully improved from last year
Credit availability has only marginally improved
Credit availability is just as tight as last year with no improvement
Credit availability has turned for the worse
Copyright ©2015 The CCIM Institute, National Association of Realtors.®
0 10 20 30 40 50 60 700 10 20 30 40 50 60 70
QUARTERLY MARKET TRENDS u NATIONAL ASSOCIAT ION OF REALTORS ® AND CCIM INST ITUTE 9
2Q • 15Quarterly Market Trends
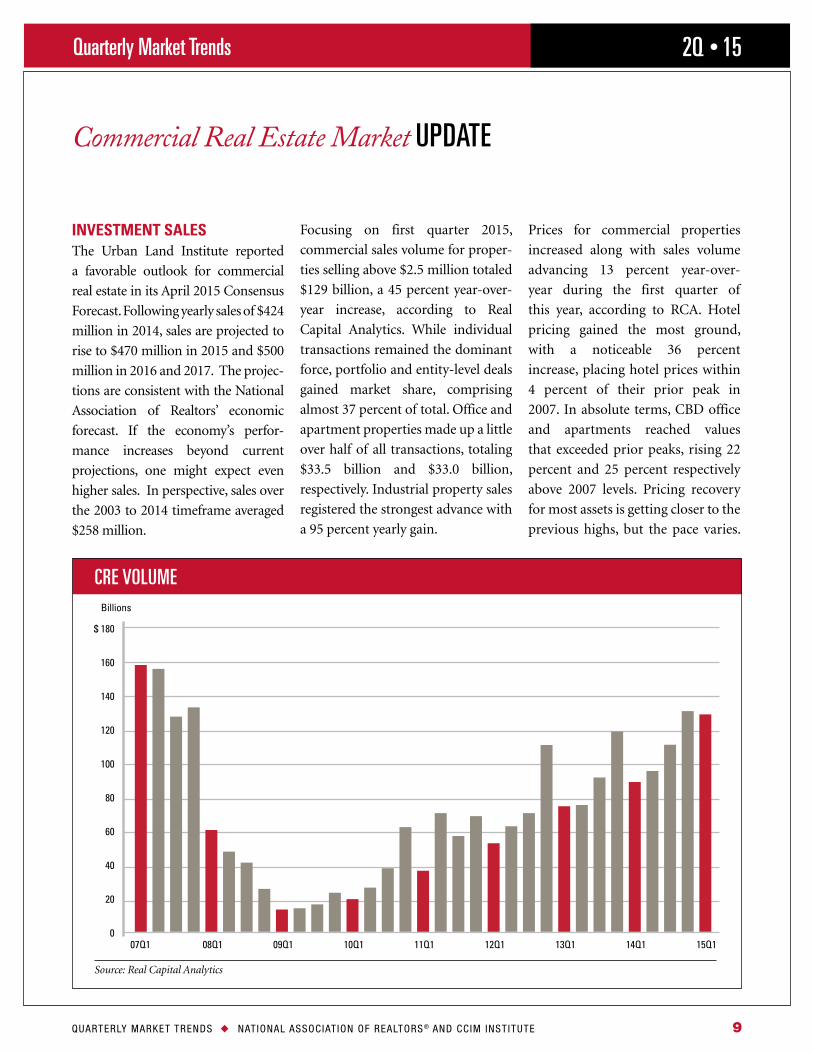
INVESTMENT SALESThe Urban Land Institute reported
a favorable outlook for commercial
real estate in its April 2015 Consensus
Forecast. Following yearly sales of $424
million in 2014, sales are projected to
rise to $470 million in 2015 and $500
million in 2016 and 2017. The projec-
tions are consistent with the National
Association of Realtors’ economic
forecast. If the economy’s perfor-
mance increases beyond current
projections, one might expect even
higher sales. In perspective, sales over
the 2003 to 2014 timeframe averaged
$258 million.
Focusing on first quarter 2015,
commercial sales volume for proper-
ties selling above $2.5 million totaled
$129 billion, a 45 percent year-over-
year increase, according to Real
Capital Analytics. While individual
transactions remained the dominant
force, portfolio and entity-level deals
gained market share, comprising
almost 37 percent of total. Office and
apartment properties made up a little
over half of all transactions, totaling
$33.5 billion and $33.0 billion,
respectively. Industrial property sales
registered the strongest advance with
a 95 percent yearly gain.
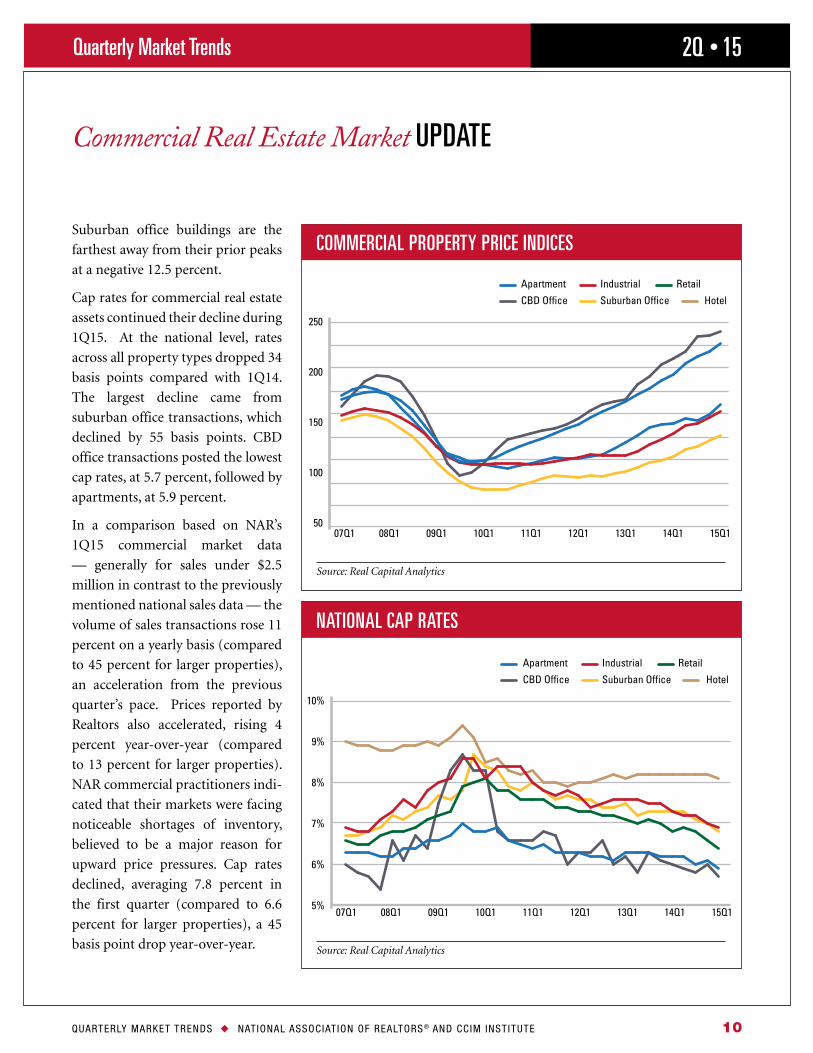
Prices for commercial properties
increased along with sales volume
advancing 13 percent year-over-
year during the first quarter of
this year, according to RCA. Hotel
pricing gained the most ground,
with a noticeable 36 percent
increase, placing hotel prices within
4 percent of their prior peak in
2007. In absolute terms, CBD office
and apartments reached values
that exceeded prior peaks, rising 22
percent and 25 percent respectively
above 2007 levels. Pricing recovery
for most assets is getting closer to the
previous highs, but the pace varies.
Commercial Real Estate Market UPDATE
Source: Real Capital Analytics
CRE VOLUME
07Q1 08Q1 09Q1 10Q1 11Q1 12Q1 13Q1 14Q1 15Q1
$ 180
160
140
120
100
80
60
40
20
0
Billions
QUARTERLY MARKET TRENDS u NATIONAL ASSOCIAT ION OF REALTORS ® AND CCIM INST ITUTE 10
2Q • 15Quarterly Market Trends
Commercial Real Estate Market UPDATE
Suburban office buildings are the
farthest away from their prior peaks
at a negative 12.5 percent.
Cap rates for commercial real estate
assets continued their decline during
1Q15. At the national level, rates
across all property types dropped 34
basis points compared with 1Q14.
The largest decline came from
suburban office transactions, which
declined by 55 basis points. CBD
office transactions posted the lowest
cap rates, at 5.7 percent, followed by
apartments, at 5.9 percent.
In a comparison based on NAR’s
1Q15 commercial market data
— generally for sales under $2.5
million in contrast to the previously
mentioned national sales data — the
volume of sales transactions rose 11
percent on a yearly basis (compared
to 45 percent for larger properties),
an acceleration from the previous
quarter’s pace. Prices reported by
Realtors also accelerated, rising 4
percent year-over-year (compared
to 13 percent for larger properties).
NAR commercial practitioners indi-
cated that their markets were facing
noticeable shortages of inventory,
believed to be a major reason for
upward price pressures. Cap rates
declined, averaging 7.8 percent in
the first quarter (compared to 6.6
percent for larger properties), a 45
basis point drop year-over-year.
07Q1 08Q1 09Q1 10Q1 11Q1 12Q1 13Q1 14Q1 15Q1
Apartment
250
200
150
100
50
Industrial Retail
CBD Office Suburban Office Hotel
07Q1 08Q1 09Q1 10Q1 11Q1 12Q1 13Q1 14Q1 15Q1
Apartment
10%
9%
8%
7%
6%
5%
Industrial Retail
CBD Office Suburban Office Hotel
COMMERCIAL PROPERTY PRICE INDICES
NATIONAL CAP RATES
Source: Real Capital Analytics
Source: Real Capital Analytics
QUARTERLY MARKET TRENDS u NATIONAL ASSOCIAT ION OF REALTORS ® AND CCIM INST ITUTE 11
2Q • 15Quarterly Market Trends
Commercial Real Estate Market UPDATE
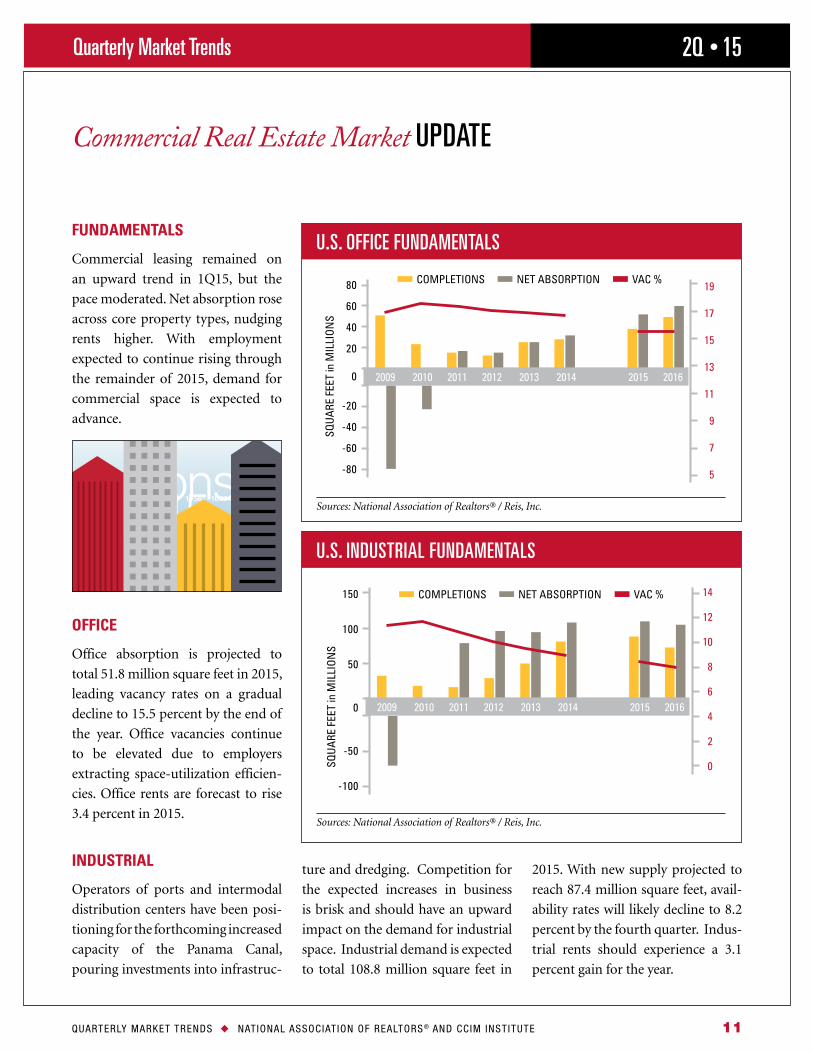
FUNDAMENTALS
Commercial leasing remained on
an upward trend in 1Q15, but the
pace moderated. Net absorption rose
across core property types, nudging
rents higher. With employment
expected to continue rising through
the remainder of 2015, demand for
commercial space is expected to
advance.
OFFICE
Office absorption is projected to
total 51.8 million square feet in 2015,
leading vacancy rates on a gradual
decline to 15.5 percent by the end of
the year. Office vacancies continue
to be elevated due to employers
extracting space-utilization efficien-
cies. Office rents are forecast to rise
3.4 percent in 2015.
INDUSTRIAL
Operators of ports and intermodal
distribution centers have been posi-
tioning for the forthcoming increased
capacity of the Panama Canal,
pouring investments into infrastruc-
ture and dredging. Competition for
the expected increases in business
is brisk and should have an upward
impact on the demand for industrial
space. Industrial demand is expected
to total 108.8 million square feet in
2015. With new supply projected to
reach 87.4 million square feet, avail-
ability rates will likely decline to 8.2
percent by the fourth quarter. Indus-
trial rents should experience a 3.1
percent gain for the year.
80
60
40
20
0
-20
-40
-60
-80
19
17
15
13
11
9
7
5
COMPLETIONS NET ABSORPTION VAC %
2009 2010 2011 2012 2013 2014 2015 2016
SQU
ARE
FEE
T in
MIL
LIO
NS
150
100
50
0
-50
-100
14
12
10
8
6
4
2
0
COMPLETIONS NET ABSORPTION VAC %
SQU
ARE
FEE
T in
MIL
LIO
NS
2009 2010 2011 2012 2013 2014 2015 2016
U.S. OFFICE FUNDAMENTALS
U.S. INDUSTRIAL FUNDAMENTALS
Sources: National Association of Realtors® / Reis, Inc.
Sources: National Association of Realtors® / Reis, Inc.
Vacancy Rate34%
QUARTERLY MARKET TRENDS u NATIONAL ASSOCIAT ION OF REALTORS ® AND CCIM INST ITUTE 12
2Q • 15Quarterly Market Trends
Commercial Real Estate Market UPDATE
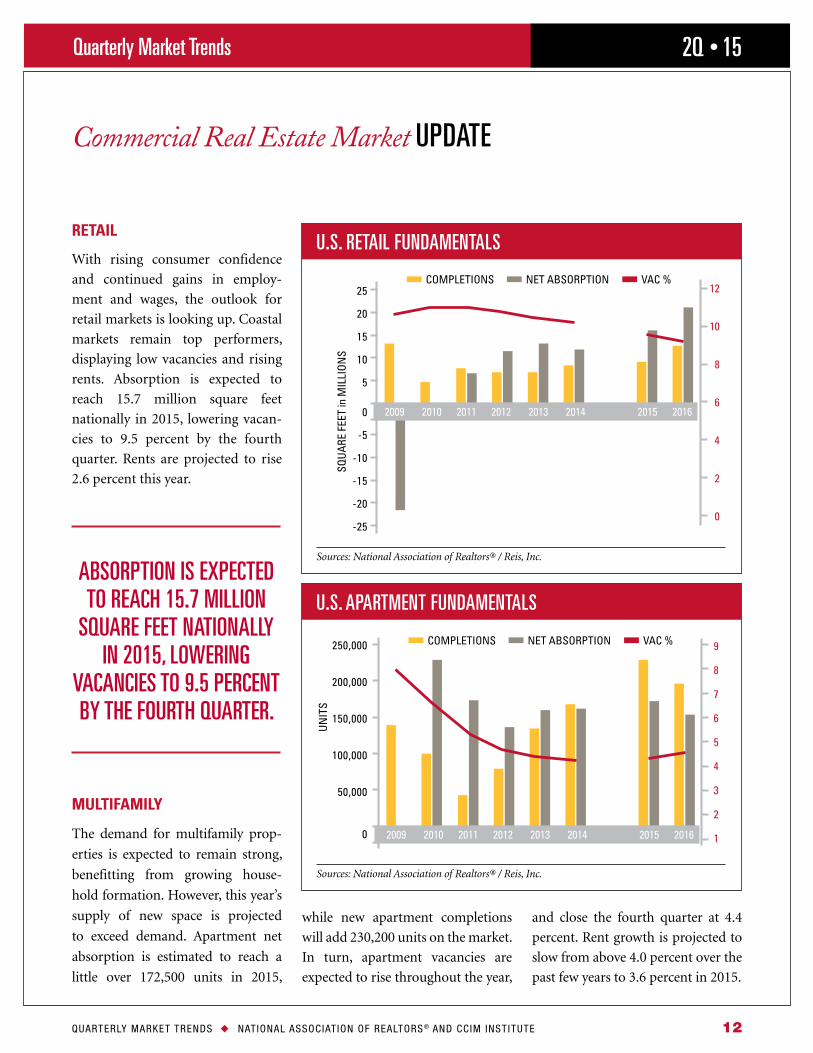
RETAIL
With rising consumer confidence
and continued gains in employ-
ment and wages, the outlook for
retail markets is looking up. Coastal
markets remain top performers,
displaying low vacancies and rising
rents. Absorption is expected to
reach 15.7 million square feet
nationally in 2015, lowering vacan-
cies to 9.5 percent by the fourth
quarter. Rents are projected to rise
2.6 percent this year.
MULTIFAMILY
The demand for multifamily prop-
erties is expected to remain strong,
benefitting from growing house-
hold formation. However, this year’s
supply of new space is projected
to exceed demand. Apartment net
absorption is estimated to reach a
little over 172,500 units in 2015,
while new apartment completions
will add 230,200 units on the market.
In turn, apartment vacancies are
expected to rise throughout the year,
and close the fourth quarter at 4.4
percent. Rent growth is projected to
slow from above 4.0 percent over the
past few years to 3.6 percent in 2015.
ABSORPTION IS EXPECTED TO REACH 15.7 MILLION
SQUARE FEET NATIONALLY IN 2015, LOWERING
VACANCIES TO 9.5 PERCENT BY THE FOURTH QUARTER.
25
20
15
10
5
0
-5
-10
-15
-20
-25
12
10
8
6
4
2
0
COMPLETIONS NET ABSORPTION VAC %
2009 2010 2011 2012 2013 2014 2015 2016
SQU
ARE
FEE
T in
MIL
LIO
NS
250,000
200,000
150,000
100,000
50,000
0
9
8
7
6
5
4
3
2
1
COMPLETIONS NET ABSORPTION VAC %
2009 2010 2011 2012 2013 2014 2015 2016
UN
ITS
U.S. RETAIL FUNDAMENTALS
U.S. APARTMENT FUNDAMENTALS
Sources: National Association of Realtors® / Reis, Inc.
Sources: National Association of Realtors® / Reis, Inc.
QUARTERLY MARKET TRENDS u NATIONAL ASSOCIAT ION OF REALTORS ® AND CCIM INST ITUTE 13
2Q • 15Quarterly Market Trends
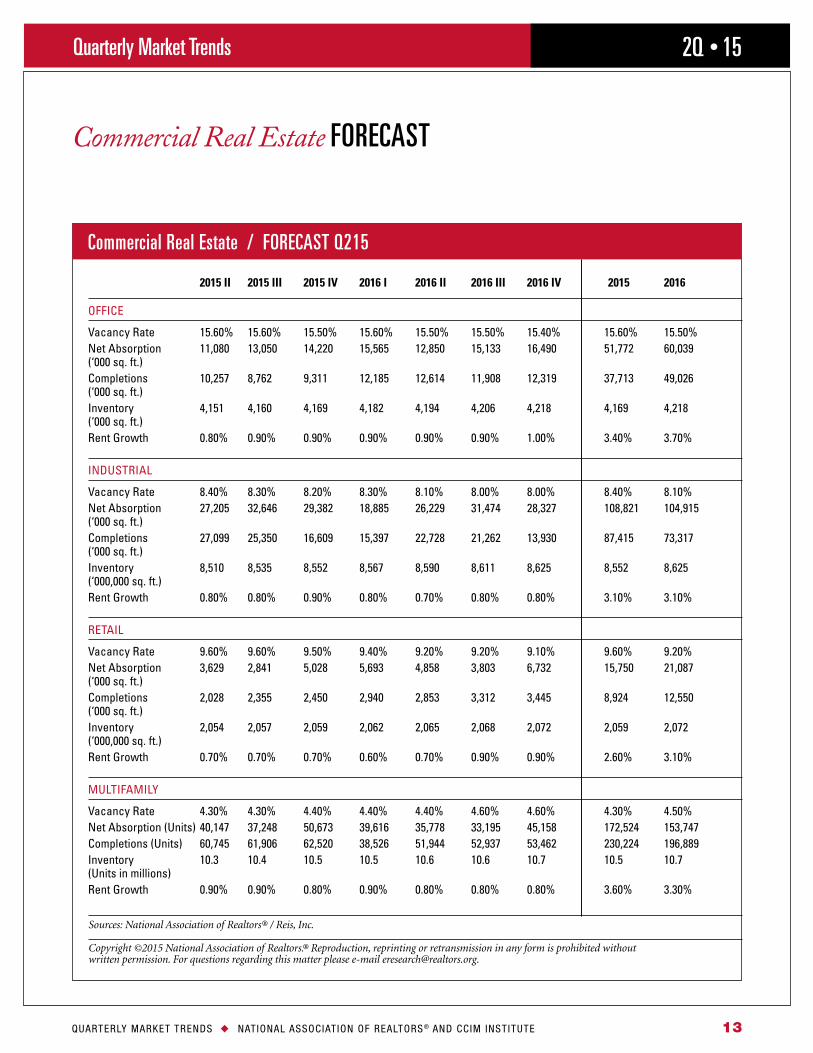
Commercial Real Estate FORECAST
Commercial Real Estate / FORECAST Q215 2015 II 2015 III 2015 IV 2016 I 2016 II 2016 III 2016 IV 2015 2016
OFFICE
Vacancy Rate 15 60% 15 60% 15 50% 15 60% 15 50% 15 50% 15 40% 15 60% 15 50%Net Absorption 11,080 13,050 14,220 15,565 12,850 15,133 16,490 51,772 60,039 (‘000 sq ft )Completions 10,257 8,762 9,311 12,185 12,614 11,908 12,319 37,713 49,026 (‘000 sq ft )Inventory 4,151 4,160 4,169 4,182 4,194 4,206 4,218 4,169 4,218 (‘000 sq ft )Rent Growth 0 80% 0 90% 0 90% 0 90% 0 90% 0 90% 1 00% 3 40% 3 70% INDUSTRIAL
Vacancy Rate 8 40% 8 30% 8 20% 8 30% 8 10% 8 00% 8 00% 8 40% 8 10%Net Absorption 27,205 32,646 29,382 18,885 26,229 31,474 28,327 108,821 104,915 (‘000 sq ft )Completions 27,099 25,350 16,609 15,397 22,728 21,262 13,930 87,415 73,317 (‘000 sq ft )Inventory 8,510 8,535 8,552 8,567 8,590 8,611 8,625 8,552 8,625 (‘000,000 sq ft )Rent Growth 0 80% 0 80% 0 90% 0 80% 0 70% 0 80% 0 80% 3 10% 3 10% RETAIL
Vacancy Rate 9 60% 9 60% 9 50% 9 40% 9 20% 9 20% 9 10% 9 60% 9 20%Net Absorption 3,629 2,841 5,028 5,693 4,858 3,803 6,732 15,750 21,087 (‘000 sq ft )Completions 2,028 2,355 2,450 2,940 2,853 3,312 3,445 8,924 12,550 (‘000 sq ft )Inventory 2,054 2,057 2,059 2,062 2,065 2,068 2,072 2,059 2,072 (‘000,000 sq ft )Rent Growth 0 70% 0 70% 0 70% 0 60% 0 70% 0 90% 0 90% 2 60% 3 10% MULTIFAMILY
Vacancy Rate 4 30% 4 30% 4 40% 4 40% 4 40% 4 60% 4 60% 4 30% 4 50%Net Absorption (Units) 40,147 37,248 50,673 39,616 35,778 33,195 45,158 172,524 153,747Completions (Units) 60,745 61,906 62,520 38,526 51,944 52,937 53,462 230,224 196,889Inventory 10 3 10 4 10 5 10 5 10 6 10 6 10 7 10 5 10 7 (Units in millions)Rent Growth 0 90% 0 90% 0 80% 0 90% 0 80% 0 80% 0 80% 3 60% 3 30%
Sources: National Association of Realtors® / Reis, Inc.
Copyright ©2015 National Association of Realtors.® Reproduction, reprinting or retransmission in any form is prohibited without written permission. For questions regarding this matter please e-mail [email protected].
QUARTERLY MARKET TRENDS u NATIONAL ASSOCIAT ION OF REALTORS ® AND CCIM INST ITUTE 14
2Q • 15Quarterly Market Trends
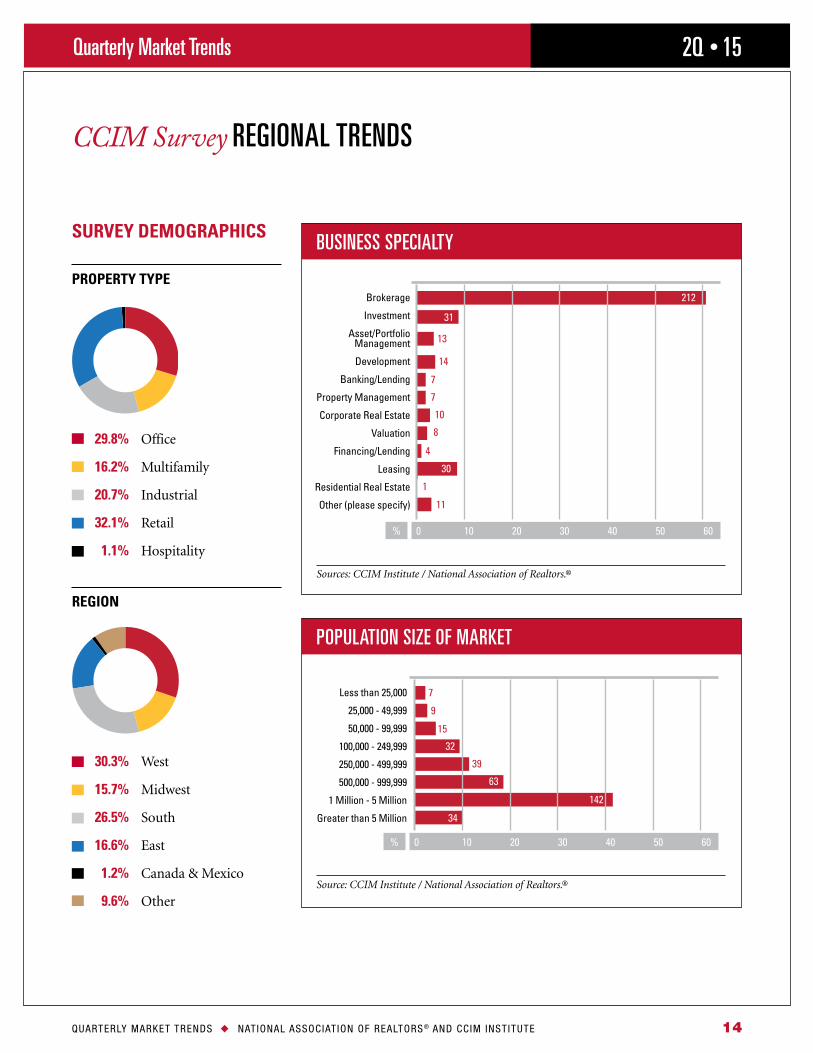
CCIM Survey REGIONAL TRENDS
SURVEY DEMOGRAPHICS
PROPERTY TYPE
29.8% Office
16.2% Multifamily
20.7% Industrial
32.1% Retail
1.1% Hospitality
REGION
30.3% West
15.7% Midwest
26.5% South
16.6% East
1.2% Canada & Mexico
9.6% Other
BUSINESS SPECIALTY
POPULATION SIZE OF MARKET
Sources: CCIM Institute / National Association of Realtors.®
Source: CCIM Institute / National Association of Realtors.®
Brokerage
Investment
Asset/PortfolioManagement
Development
Banking/Lending
Property Management
Corporate Real Estate
Valuation
Financing/Lending
Leasing
Residential Real Estate
Other (please specify)
0 10 20 30 40 50 60%
212
31
13
14
7
7
10
8
4
11
1
30
Less than 25,000
25,000 - 49,999
50,000 - 99,999
100,000 - 249,999
250,000 - 499,999
500,000 - 999,999
1 Million - 5 Million
Greater than 5 Million
0 10 20 30 40 50 60%
142
7
9
15
32
34
39
63
QUARTERLY MARKET TRENDS u NATIONAL ASSOCIAT ION OF REALTORS ® AND CCIM INST ITUTE 15
2Q • 15Quarterly Market Trends
CCIM Survey REGIONAL TRENDS
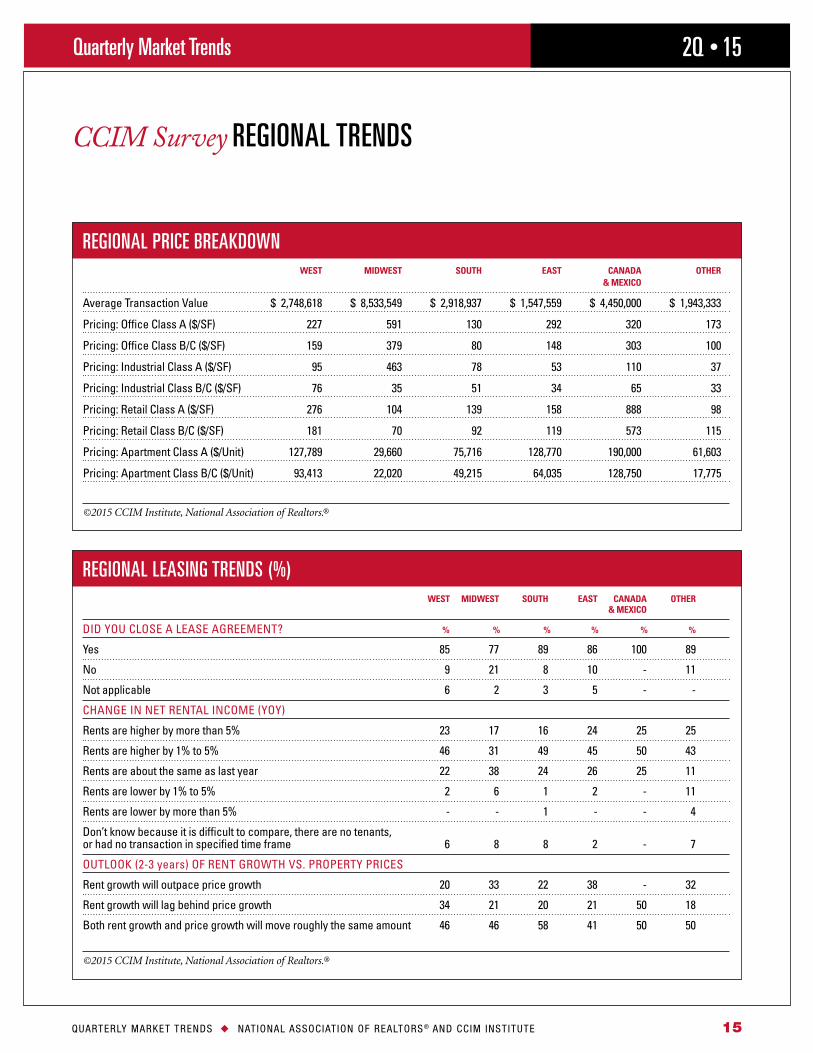
REGIONAL PRICE BREAKDOWN WEST MIDWEST SOUTH EAST CANADA OTHER & MEXICO
Average Transaction Value $ 2,748,618 $ 8,533,549 $ 2,918,937 $ 1,547,559 $ 4,450,000 $ 1,943,333
Pricing: Office Class A ($/SF) 227 591 130 292 320 173
Pricing: Office Class B/C ($/SF) 159 379 80 148 303 100
Pricing: Industrial Class A ($/SF) 95 463 78 53 110 37
Pricing: Industrial Class B/C ($/SF) 76 35 51 34 65 33
Pricing: Retail Class A ($/SF) 276 104 139 158 888 98
Pricing: Retail Class B/C ($/SF) 181 70 92 119 573 115
Pricing: Apartment Class A ($/Unit) 127,789 29,660 75,716 128,770 190,000 61,603
Pricing: Apartment Class B/C ($/Unit) 93,413 22,020 49,215 64,035 128,750 17,775
©2015 CCIM Institute, National Association of Realtors.®
REGIONAL LEASING TRENDS (%) WEST MIDWEST SOUTH EAST CANADA OTHER & MEXICO
DID YOU CLOSE A LEASE AGREEMENT? % % % % % %
Yes 85 77 89 86 100 89
No 9 21 8 10 - 11
Not applicable 6 2 3 5 - -
CHANGE IN NET RENTAL INCOME (YOY)
Rents are higher by more than 5% 23 17 16 24 25 25
Rents are higher by 1% to 5% 46 31 49 45 50 43
Rents are about the same as last year 22 38 24 26 25 11
Rents are lower by 1% to 5% 2 6 1 2 - 11
Rents are lower by more than 5% - - 1 - - 4
Don’t know because it is difficult to compare, there are no tenants, or had no transaction in specified time frame 6 8 8 2 - 7
OUTLOOK (2-3 years) OF RENT GROWTH VS PROPERTY PRICES
Rent growth will outpace price growth 20 33 22 38 - 32
Rent growth will lag behind price growth 34 21 20 21 50 18
Both rent growth and price growth will move roughly the same amount 46 46 58 41 50 50
©2015 CCIM Institute, National Association of Realtors.®
QUARTERLY MARKET TRENDS u NATIONAL ASSOCIAT ION OF REALTORS ® AND CCIM INST ITUTE 16
2Q • 15Quarterly Market Trends
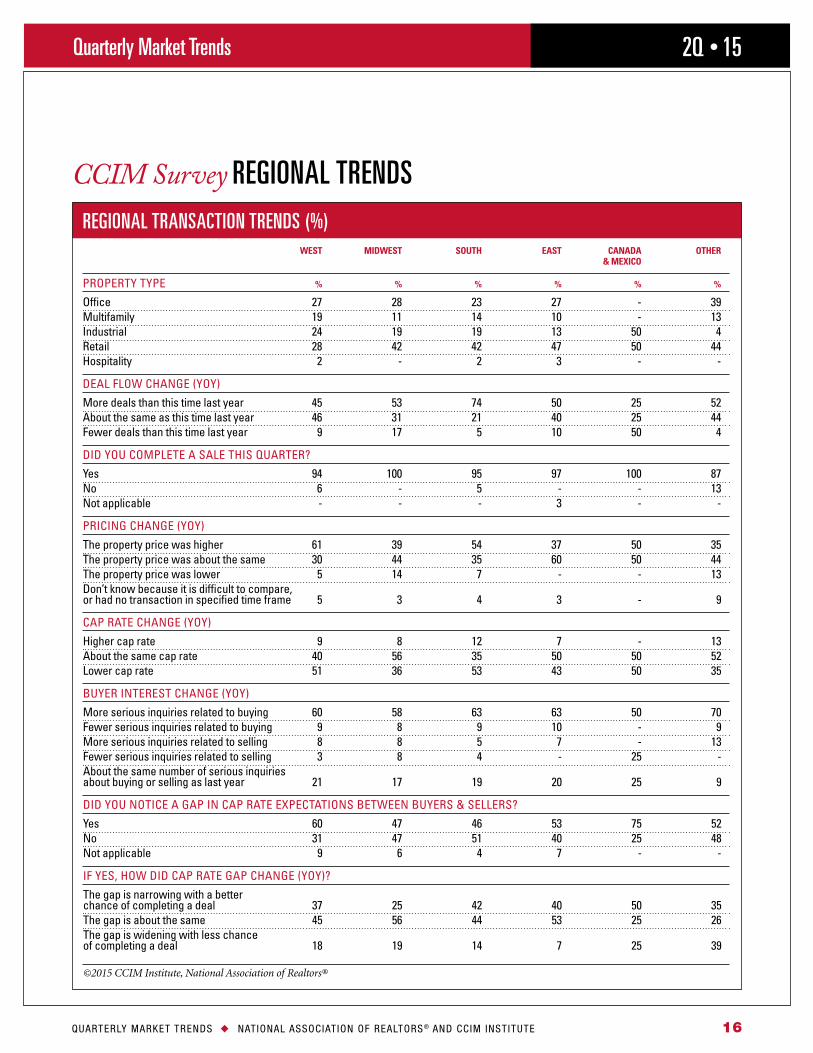
CCIM Survey REGIONAL TRENDS REGIONAL TRANSACTION TRENDS (%) WEST MIDWEST SOUTH EAST CANADA OTHER & MEXICO
PROPERTY TYPE % % % % % %
Office 27 28 23 27 - 39Multifamily 19 11 14 10 - 13Industrial 24 19 19 13 50 4Retail 28 42 42 47 50 44Hospitality 2 - 2 3 - -
DEAL FLOW CHANGE (YOY)
More deals than this time last year 45 53 74 50 25 52About the same as this time last year 46 31 21 40 25 44Fewer deals than this time last year 9 17 5 10 50 4
DID YOU COMPLETE A SALE THIS QUARTER?
Yes 94 100 95 97 100 87No 6 - 5 - - 13Not applicable - - - 3 - -
PRICING CHANGE (YOY)
The property price was higher 61 39 54 37 50 35The property price was about the same 30 44 35 60 50 44The property price was lower 5 14 7 - - 13Don’t know because it is difficult to compare, or had no transaction in specified time frame 5 3 4 3 - 9
CAP RATE CHANGE (YOY)
Higher cap rate 9 8 12 7 - 13About the same cap rate 40 56 35 50 50 52Lower cap rate 51 36 53 43 50 35
BUYER INTEREST CHANGE (YOY)
More serious inquiries related to buying 60 58 63 63 50 70Fewer serious inquiries related to buying 9 8 9 10 - 9More serious inquiries related to selling 8 8 5 7 - 13Fewer serious inquiries related to selling 3 8 4 - 25 -About the same number of serious inquiries about buying or selling as last year 21 17 19 20 25 9
DID YOU NOTICE A GAP IN CAP RATE EXPECTATIONS BETWEEN BUYERS & SELLERS?
Yes 60 47 46 53 75 52No 31 47 51 40 25 48Not applicable 9 6 4 7 - -
IF YES, HOW DID CAP RATE GAP CHANGE (YOY)?
The gap is narrowing with a better chance of completing a deal 37 25 42 40 50 35The gap is about the same 45 56 44 53 25 26The gap is widening with less chance of completing a deal 18 19 14 7 25 39
©2015 CCIM Institute, National Association of Realtors®
QUARTERLY MARKET TRENDS u NATIONAL ASSOCIAT ION OF REALTORS ® AND CCIM INST ITUTE 17
2Q • 15Quarterly Market Trends
CCIM Survey REGIONAL TRENDS
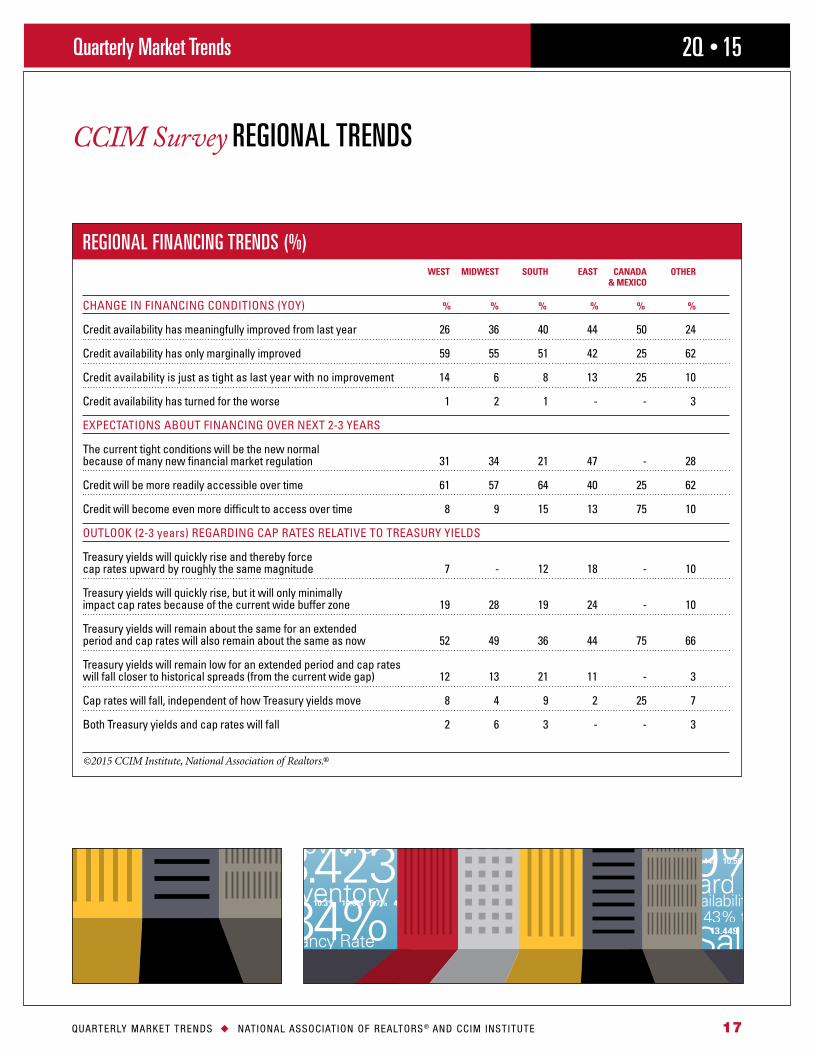
REGIONAL FINANCING TRENDS (%) WEST MIDWEST SOUTH EAST CANADA OTHER & MEXICO
CHANGE IN FINANCING CONDITIONS (YOY) % % % % % %
Credit availability has meaningfully improved from last year 26 36 40 44 50 24
Credit availability has only marginally improved 59 55 51 42 25 62
Credit availability is just as tight as last year with no improvement 14 6 8 13 25 10
Credit availability has turned for the worse 1 2 1 - - 3
EXPECTATIONS ABOUT FINANCING OVER NEXT 2-3 YEARS
The current tight conditions will be the new normal because of many new financial market regulation 31 34 21 47 - 28
Credit will be more readily accessible over time 61 57 64 40 25 62
Credit will become even more difficult to access over time 8 9 15 13 75 10
OUTLOOK (2-3 years) REGARDING CAP RATES RELATIVE TO TREASURY YIELDS
Treasury yields will quickly rise and thereby force cap rates upward by roughly the same magnitude 7 - 12 18 - 10
Treasury yields will quickly rise, but it will only minimally impact cap rates because of the current wide buffer zone 19 28 19 24 - 10
Treasury yields will remain about the same for an extended period and cap rates will also remain about the same as now 52 49 36 44 75 66
Treasury yields will remain low for an extended period and cap rates will fall closer to historical spreads (from the current wide gap) 12 13 21 11 - 3
Cap rates will fall, independent of how Treasury yields move 8 4 9 2 25 7
Both Treasury yields and cap rates will fall 2 6 3 - - 3
©2015 CCIM Institute, National Association of Realtors.®
Vacancy Rate34%Vacancy Rate34%
QUARTERLY MARKET TRENDS u NATIONAL ASSOCIAT ION OF REALTORS ® AND CCIM INST ITUTE 18
2Q • 15Quarterly Market Trends
SLOW IMPROVEMENTS
The economy continues its slow
expansion six years after the end of
the Great Recession. The outlook
for 2015 is an overall increase of
2.3 percent in real gross domestic
product based on a mediocre
first half of the year coupled with
an improving second half. The
projected 2.3 percent real growth
rate is consistent with economic
performance over the past several
years as the U.S. economy continues
to underperform relative to a 3
percent real growth rate that one
would expect.
The negative economic growth expe-
rienced in the first quarter does not
appear to be a harbinger of reces-
sion. A number of long run trends
support the current — although
slow — economic expansion:
l Consumer balance sheets and
consumer confidence have improved
relative to a few years ago.
l Employment gains and GDP
growth are starting to provide
a base for wage gains. Given
that the economy is based on
a circular flow of expenditures,
wage gains subsequently trans-
late into increased consumer
expenditures and subsequently
higher GDP.
l Concurrent with wage gains,
declining oil prices have had a
favorable impact on consumer disposable income.
l The recovery in real estate continues to be slow but improving. Housing starts increased by approximately 8 percent in 2014 and are projected to increase by 13 percent in 2015. New construction is essentially 100 percent value added, providing impetus to the GDP level. At a
time when the focus is on job
additions, it is useful to note that
new home construction can add
two to three jobs per additional
house built. Existing home sales
are projected to be up 7 percent
in 2015, with prices rising in the
neighborhood of 6 percent. The
sale of two existing homes gener-
ates economic activity equivalent
to an additional job.
U.S. Economic OVERVIEW
0.0 1.0 2.0 3.0 4.0 5.0
0.0 1.0 2.0 3.0 4.0 5.0
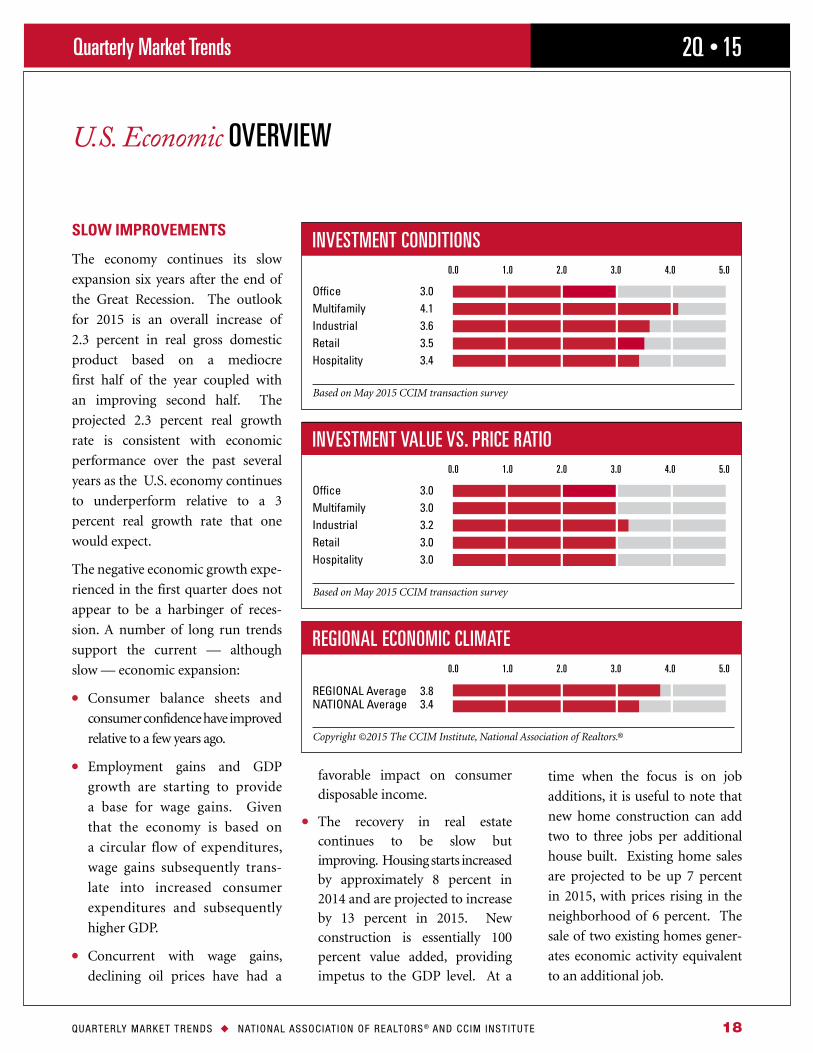
INVESTMENT CONDITIONS
Office 3 0Multifamily 4 1Industrial 3 6Retail 3 5Hospitality 3 4
Based on May 2015 CCIM transaction survey
REGIONAL ECONOMIC CLIMATE
REGIONAL Average 3 8 NATIONAL Average 3 4
Copyright ©2015 The CCIM Institute, National Association of Realtors.®
0.0 1.0 2.0 3.0 4.0 5.0
INVESTMENT VALUE VS. PRICE RATIO
Office 3 0Multifamily 3 0Industrial 3 2Retail 3 0Hospitality 3 0
Based on May 2015 CCIM transaction survey
QUARTERLY MARKET TRENDS u NATIONAL ASSOCIAT ION OF REALTORS ® AND CCIM INST ITUTE 19
2Q • 15Quarterly Market Trends
U.S. Economic OVERVIEW
However, there are some risk factors
and negative economic conditions
tending to hold back the economic
expansion; the negative factors have
slowed down economic growth but
are unlikely to cause a recession:
l Major foreign economies continue
to face challenges. Depending
on the country, Europe has been
experiencing recessionary or slow
growth conditions. As a result,
there has been a downward push
on the U.S. economy as imports
continue to rise and exports
decline. In addition, the flight to
quality in international reserves
has caused some appreciation
of the U.S. dollar. Appreciation
of the dollar also has a negative
impact on U.S. exports.
l Although consumer confidence
has increased relative to a few
years ago, the Great Recession
appears to have left a collective
economic apprehension in the
public’s memory. Therefore, any
type of adverse although tran-
sitory economic news seems to
create significant ripples in equity
markets and apprehensive chatter
in the press.
l No new, major drivers of addi-
tional economic activity appear to
be on the horizon. For example,
technological breakthroughs likely
to create waves of additional
investment have not been identi-
fied. The press is filled with reports
of computer wizards creating
billion dollar companies; however,
very little additional employment
is apparently generated.
l Major demographic changes
appear unlikely. Millennials are
increasingly participating in the
economy, but not to the extent of
causing a dramatic increase in GDP.
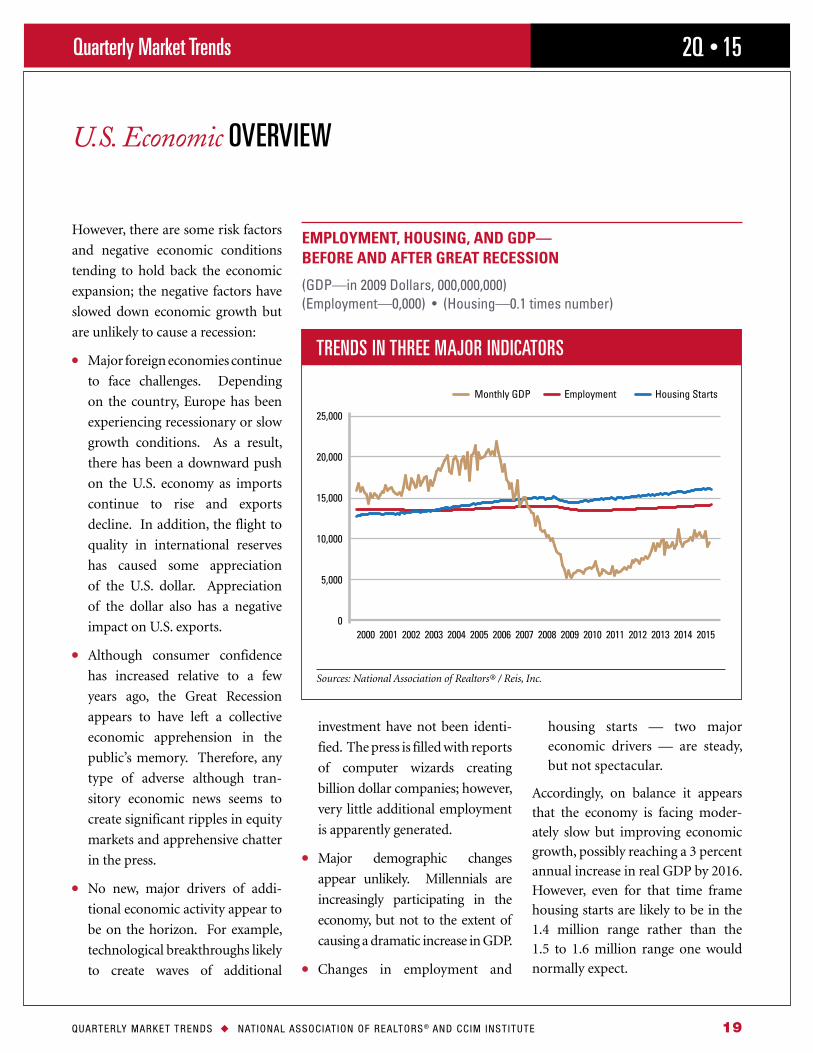
l Changes in employment and
housing starts — two major
economic drivers — are steady,
but not spectacular.
Accordingly, on balance it appears
that the economy is facing moder-
ately slow but improving economic
growth, possibly reaching a 3 percent
annual increase in real GDP by 2016.
However, even for that time frame
housing starts are likely to be in the
1.4 million range rather than the
1.5 to 1.6 million range one would
normally expect.
EMPLOYMENT, HOUSING, AND GDP— BEFORE AND AFTER GREAT RECESSION
(GDP—in 2009 Dollars, 000,000,000)(Employment—0,000) • (Housing—0 1 times number)
2000 2001 2002 2003 2004 2005 2006 2007 2008 2009 2010 2011 2012 2013 2014 2015
Monthly GDP
25,000
20,000
15,000
10,000
5,000
0
Employment Housing Starts
TRENDS IN THREE MAJOR INDICATORS
Sources: National Association of Realtors® / Reis, Inc.
QUARTERLY MARKET TRENDS u NATIONAL ASSOCIAT ION OF REALTORS ® AND CCIM INST ITUTE 20
2Q • 15Quarterly Market Trends
U.S. Economic OVERVIEW
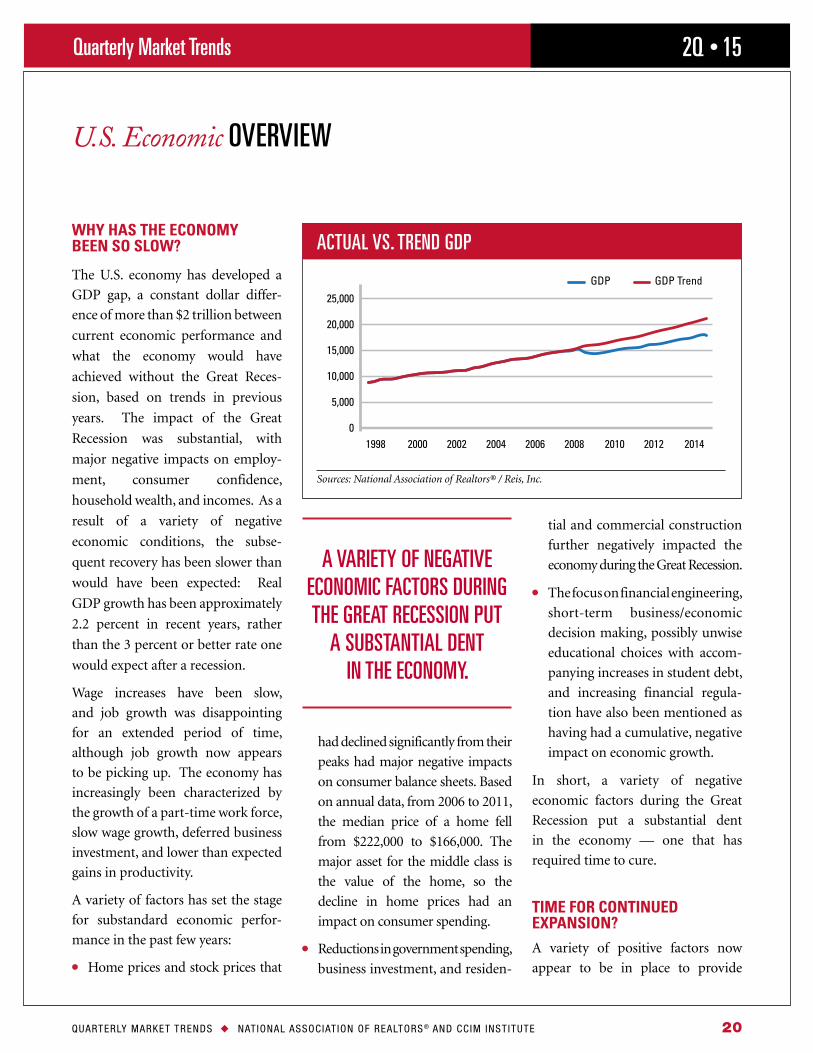
WHY HAS THE ECONOMY BEEN SO SLOW?
The U.S. economy has developed a
GDP gap, a constant dollar differ-
ence of more than $2 trillion between
current economic performance and
what the economy would have
achieved without the Great Reces-
sion, based on trends in previous
years. The impact of the Great
Recession was substantial, with
major negative impacts on employ-
ment, consumer confidence,
household wealth, and incomes. As a
result of a variety of negative
economic conditions, the subse-
quent recovery has been slower than
would have been expected: Real
GDP growth has been approximately
2.2 percent in recent years, rather
than the 3 percent or better rate one
would expect after a recession.
Wage increases have been slow,
and job growth was disappointing
for an extended period of time,
although job growth now appears
to be picking up. The economy has
increasingly been characterized by
the growth of a part-time work force,
slow wage growth, deferred business
investment, and lower than expected
gains in productivity.
A variety of factors has set the stage
for substandard economic perfor-
mance in the past few years:
l Home prices and stock prices that
had declined significantly from their
peaks had major negative impacts
on consumer balance sheets. Based
on annual data, from 2006 to 2011,
the median price of a home fell
from $222,000 to $166,000. The
major asset for the middle class is
the value of the home, so the
decline in home prices had an
impact on consumer spending.
l Reductions in government spending,
business investment, and residen-
tial and commercial construction
further negatively impacted the
economy during the Great Recession.
l The focus on financial engineering,
short-term business/economic
decision making, possibly unwise
educational choices with accom-
panying increases in student debt,
and increasing financial regula-
tion have also been mentioned as
having had a cumulative, negative
impact on economic growth.
In short, a variety of negative
economic factors during the Great
Recession put a substantial dent
in the economy — one that has
required time to cure.
TIME FOR CONTINUED EXPANSION?
A variety of positive factors now
appear to be in place to provide
1998 2000 2002 2004 2006 2008 2010 2012 2014
GDP
25,000
20,000
15,000
10,000
5,000
0
GDP Trend
ACTUAL VS. TREND GDP
Sources: National Association of Realtors® / Reis, Inc.
A VARIETY OF NEGATIVE ECONOMIC FACTORS DURING THE GREAT RECESSION PUT
A SUBSTANTIAL DENT IN THE ECONOMY.
QUARTERLY MARKET TRENDS u NATIONAL ASSOCIAT ION OF REALTORS ® AND CCIM INST ITUTE 21
2Q • 15Quarterly Market Trends
U.S. Economic OVERVIEW
upscale potential to the economy:
reasonable oil prices; the recovery
and growth of household wealth;
lower consumer debt levels; higher
consumer confidence; the millen-
nial generation reaching a point at
which household formation should
increase; pent-up demands for
housing based on under production
in recent years; U.S. businesses with
high profits, in a position to invest;
pent-up demand for increase in
infrastructure — highways, bridges,
transportation opportunities; and
rising wages as the economy expands.
The negative factors, however,
include worldwide economic and
political uncertainties; the Federal
Reserve’s prospects for getting the
economy off of an “IV of Federal
Reserve administered liquidity”; and
wage, productivity, and employment
issues. On balance, the positives
appear to outweigh the negatives.
Real GDP growth in the neighbor-
hood of 2.3 percent is forecast for
2015, rising to 3 percent in 2016:
l First quarter annualized GDP
growth appears to have been
near a negative 1 percent: falling
exports, rising imports, slower
inventory growth, weak corporate
spending, and lagging spending
on durable goods. This gener-
ally appears to have been weather
induced and, therefore, largely
irrelevant to longer run trends.
l For the second quarter, growth
could be in the neighborhood of 1
to 2 percent, rising to 3 percent or
higher during the second half of
the year.
l Millennials and their actions may
be a wild card. Up to this point,
their family formation, home
buying, and job prospects have
been below expectations. As the
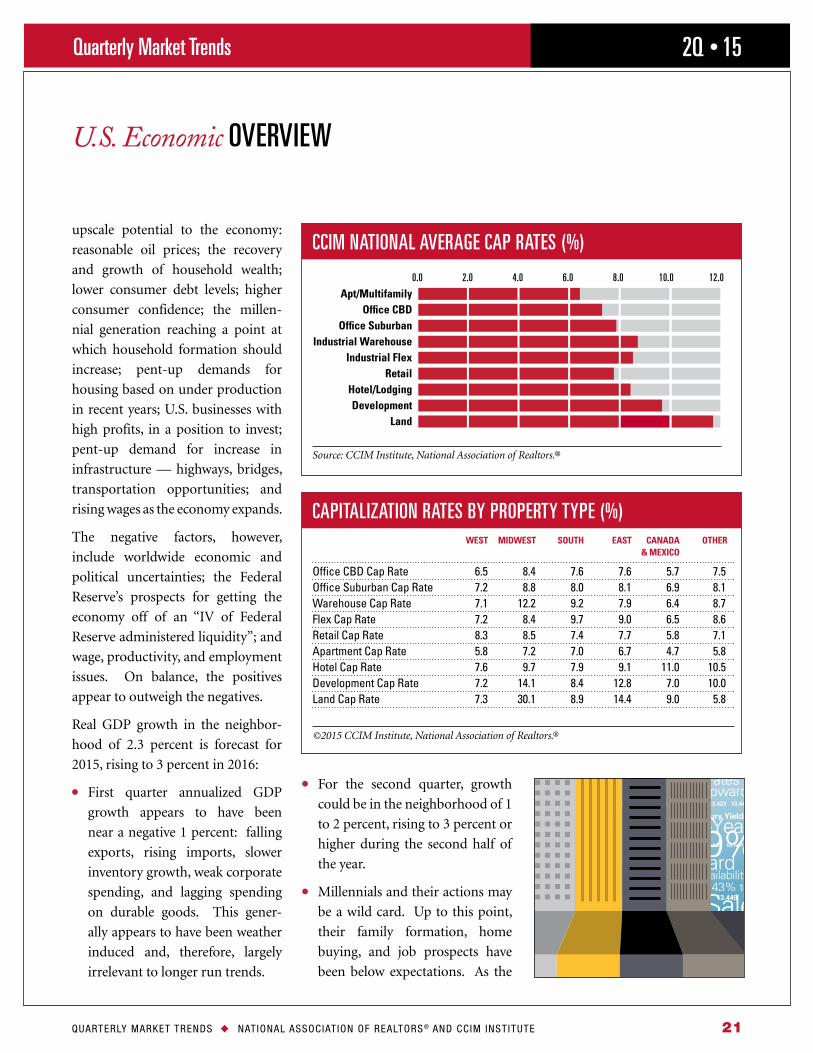
Source: CCIM Institute, National Association of Realtors.®
0.0 2.0 4.0 6.0 8.0 10.0 12.0
CAPITALIZATION RATES BY PROPERTY TYPE (%) WEST MIDWEST SOUTH EAST CANADA OTHER & MEXICO
Office CBD Cap Rate 6 5 8 4 7 6 7 6 5 7 7 5Office Suburban Cap Rate 7 2 8 8 8 0 8 1 6 9 8 1Warehouse Cap Rate 7 1 12 2 9 2 7 9 6 4 8 7Flex Cap Rate 7 2 8 4 9 7 9 0 6 5 8 6Retail Cap Rate 8 3 8 5 7 4 7 7 5 8 7 1Apartment Cap Rate 5 8 7 2 7 0 6 7 4 7 5 8Hotel Cap Rate 7 6 9 7 7 9 9 1 11 0 10 5Development Cap Rate 7 2 14 1 8 4 12 8 7 0 10 0Land Cap Rate 7 3 30 1 8 9 14 4 9 0 5 8
©2015 CCIM Institute, National Association of Realtors.®
CCIM NATIONAL AVERAGE CAP RATES (%)
Apt/Multifamily Office CBD Office Suburban Industrial Warehouse Industrial Flex Retail Hotel/Lodging Development Land
Vacancy Rate34%
QUARTERLY MARKET TRENDS u NATIONAL ASSOCIAT ION OF REALTORS ® AND CCIM INST ITUTE 22
2Q • 15Quarterly Market Trends
U.S. Economic OVERVIEW
expansion of the economy accel-
erates, millennials may provide
somewhat higher than expected
economic impetus.
IMPACT ON REAL ESTATE MARKETS
The impact of an expanding
economy should be favorable for
both residential and commercial real
estate markets.
Residential sales demand — both
for existing and new home sales
— should be favorably affected by
job growth and improved credit
availability, expected even though
accompanied by rising interest rates.
Anticipated increases in interest rates
should not, however, have a major
negative impact on the demand for
homes, for even within projected
increase rates will continue to be
well within normal historical ranges.
Home inventories are tight, and
multifamily rents are expected to
continue to increase.
Currently new home construction
is running in the neighborhood of 1
million units per year; however, the
demand for homes to meet family
formation, second homes demand,
people moving out of rental units,
and home demolitions of the existing
housing stock is approximately 1.5
to 1.6 million units per year. The
U.S. has a housing shortage, for
housing starts have been well under
1.5 million units per year. There is a
need for builders to increase supply
to reach the needed additional 1.5
million units per year. Builders are
expected to continue to ramp up
production, and an increase in home
construction should provide addi-
tional impetus to the economy.
As a result of an expanding economy,
sales and construction of commer-
cial real estate should continue to
increase, both in volumes and in
price. Vacancy rates are projected to
decrease along with rent increases,
depending on type of property.
Industrial properties — warehouses
and flex space — should be helped
by increases in freight shipments
as the economy expands and by
demands for flexible and moderate
cost office space. The millennial
generation is expected to provide a
continuing demand for the apart-
ment markets; the generation is
actually larger than the baby boom
generation but, in many cases, has
not yet moved into an apartment or
house due to previously unfavorable
economic conditions. Accordingly, the
millennial generation is expected to
have a continuing impact on housing
demand, which will help the economy.
Finally, economic expansion and
continued job additions should help
both retail and office space.
Overall, the outlook is favorable for
the economy and real estate:
l The unemployment rate is expected
to continue to decline.
l Employment growth will continue,
although the overall labor partici-
pation rate continues to be below
what it has traditionally been.
l Although inflation may pick up,
inflation and interest rates are
projected to remain relatively low,
even though increasing.
l Therefore, the projection of 2.3
percent real GDP growth in 2015
— although somewhat lower than
would be expected — appears
to be reasonable, and could be
higher if some of the unexpected
possibilities mentioned happen.
OVERALL, THE OUTLOOK IS FAVORABLE FOR THE ECONOMY AND
REAL ESTATE.
Vacancy Rate34%
QUARTERLY MARKET TRENDS u NATIONAL ASSOCIAT ION OF REALTORS ® AND CCIM INST ITUTE 23
2Q • 15Quarterly Market Trends
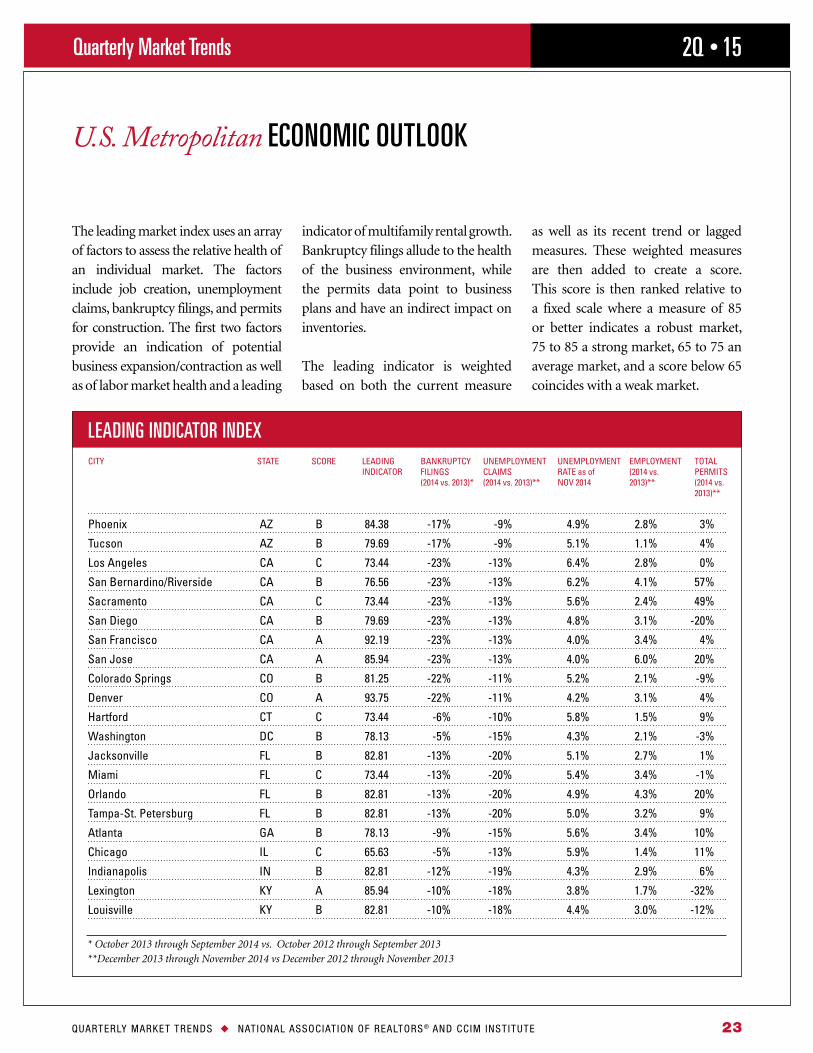
U.S. Metropolitan ECONOMIC OUTLOOK
LEADING INDICATOR INDEXCITY STATE SCORE LEADING BANKRUPTCY UNEMPLOYMENT UNEMPLOYMENT EMPLOYMENT TOTAL INDICATOR FILINGS CLAIMS RATE as of (2014 vs PERMITS (2014 vs 2013)* (2014 vs 2013)** NOV 2014 2013)** (2014 vs 2013)**
* October 2013 through September 2014 vs. October 2012 through September 2013 **December 2013 through November 2014 vs December 2012 through November 2013
The leading market index uses an array of factors to assess the relative health of an individual market. The factors include job creation, unemployment claims, bankruptcy filings, and permits for construction. The first two factors provide an indication of potential business expansion/contraction as well as of labor market health and a leading
indicator of multifamily rental growth. Bankruptcy filings allude to the health of the business environment, while the permits data point to business plans and have an indirect impact on inventories.
The leading indicator is weighted based on both the current measure
as well as its recent trend or lagged measures. These weighted measures are then added to create a score. This score is then ranked relative to a fixed scale where a measure of 85 or better indicates a robust market, 75 to 85 a strong market, 65 to 75 an average market, and a score below 65 coincides with a weak market.
Phoenix AZ B 84 38 -17% -9% 4 9% 2 8% 3%
Tucson AZ B 79 69 -17% -9% 5 1% 1 1% 4%
Los Angeles CA C 73 44 -23% -13% 6 4% 2 8% 0%
San Bernardino/Riverside CA B 76 56 -23% -13% 6 2% 4 1% 57%
Sacramento CA C 73 44 -23% -13% 5 6% 2 4% 49%
San Diego CA B 79 69 -23% -13% 4 8% 3 1% -20%
San Francisco CA A 92 19 -23% -13% 4 0% 3 4% 4%
San Jose CA A 85 94 -23% -13% 4 0% 6 0% 20%
Colorado Springs CO B 81 25 -22% -11% 5 2% 2 1% -9%
Denver CO A 93 75 -22% -11% 4 2% 3 1% 4%
Hartford CT C 73 44 -6% -10% 5 8% 1 5% 9%
Washington DC B 78 13 -5% -15% 4 3% 2 1% -3%
Jacksonville FL B 82 81 -13% -20% 5 1% 2 7% 1%
Miami FL C 73 44 -13% -20% 5 4% 3 4% -1%
Orlando FL B 82 81 -13% -20% 4 9% 4 3% 20%
Tampa-St Petersburg FL B 82 81 -13% -20% 5 0% 3 2% 9%
Atlanta GA B 78 13 -9% -15% 5 6% 3 4% 10%
Chicago IL C 65 63 -5% -13% 5 9% 1 4% 11%
Indianapolis IN B 82 81 -12% -19% 4 3% 2 9% 6%
Lexington KY A 85 94 -10% -18% 3 8% 1 7% -32%
Louisville KY B 82 81 -10% -18% 4 4% 3 0% -12%
QUARTERLY MARKET TRENDS u NATIONAL ASSOCIAT ION OF REALTORS ® AND CCIM INST ITUTE 24
2Q • 15Quarterly Market Trends
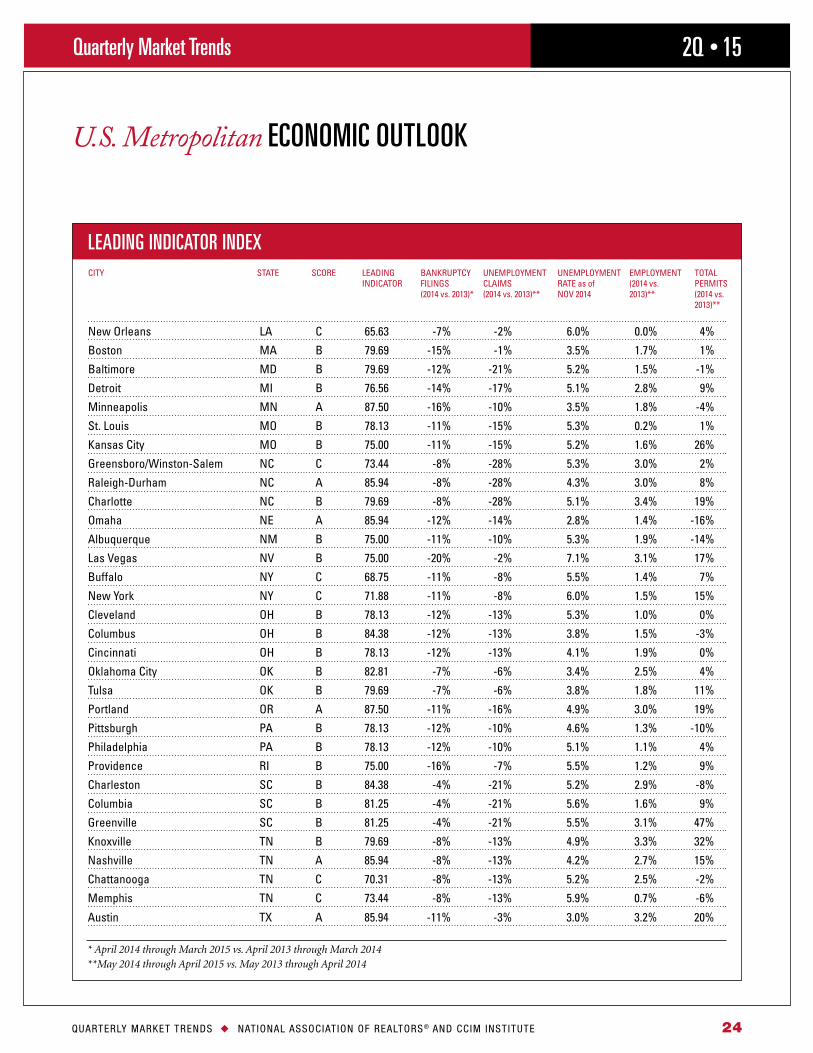
LEADING INDICATOR INDEXCITY STATE SCORE LEADING BANKRUPTCY UNEMPLOYMENT UNEMPLOYMENT EMPLOYMENT TOTAL INDICATOR FILINGS CLAIMS RATE as of (2014 vs PERMITS (2014 vs 2013)* (2014 vs 2013)** NOV 2014 2013)** (2014 vs 2013)**
U.S. Metropolitan ECONOMIC OUTLOOK
* April 2014 through March 2015 vs. April 2013 through March 2014 **May 2014 through April 2015 vs. May 2013 through April 2014
New Orleans LA C 65 63 -7% -2% 6 0% 0 0% 4%
Boston MA B 79 69 -15% -1% 3 5% 1 7% 1%
Baltimore MD B 79 69 -12% -21% 5 2% 1 5% -1%
Detroit MI B 76 56 -14% -17% 5 1% 2 8% 9%
Minneapolis MN A 87 50 -16% -10% 3 5% 1 8% -4%
St Louis MO B 78 13 -11% -15% 5 3% 0 2% 1%
Kansas City MO B 75 00 -11% -15% 5 2% 1 6% 26%
Greensboro/Winston-Salem NC C 73 44 -8% -28% 5 3% 3 0% 2%
Raleigh-Durham NC A 85 94 -8% -28% 4 3% 3 0% 8%
Charlotte NC B 79 69 -8% -28% 5 1% 3 4% 19%
Omaha NE A 85 94 -12% -14% 2 8% 1 4% -16%
Albuquerque NM B 75 00 -11% -10% 5 3% 1 9% -14%
Las Vegas NV B 75 00 -20% -2% 7 1% 3 1% 17%
Buffalo NY C 68 75 -11% -8% 5 5% 1 4% 7%
New York NY C 71 88 -11% -8% 6 0% 1 5% 15%
Cleveland OH B 78 13 -12% -13% 5 3% 1 0% 0%
Columbus OH B 84 38 -12% -13% 3 8% 1 5% -3%
Cincinnati OH B 78 13 -12% -13% 4 1% 1 9% 0%
Oklahoma City OK B 82 81 -7% -6% 3 4% 2 5% 4%
Tulsa OK B 79 69 -7% -6% 3 8% 1 8% 11%
Portland OR A 87 50 -11% -16% 4 9% 3 0% 19%
Pittsburgh PA B 78 13 -12% -10% 4 6% 1 3% -10%
Philadelphia PA B 78 13 -12% -10% 5 1% 1 1% 4%
Providence RI B 75 00 -16% -7% 5 5% 1 2% 9%
Charleston SC B 84 38 -4% -21% 5 2% 2 9% -8%
Columbia SC B 81 25 -4% -21% 5 6% 1 6% 9%
Greenville SC B 81 25 -4% -21% 5 5% 3 1% 47%
Knoxville TN B 79 69 -8% -13% 4 9% 3 3% 32%
Nashville TN A 85 94 -8% -13% 4 2% 2 7% 15%
Chattanooga TN C 70 31 -8% -13% 5 2% 2 5% -2%
Memphis TN C 73 44 -8% -13% 5 9% 0 7% -6%
Austin TX A 85 94 -11% -3% 3 0% 3 2% 20%
QUARTERLY MARKET TRENDS u NATIONAL ASSOCIAT ION OF REALTORS ® AND CCIM INST ITUTE 25
2Q • 15Quarterly Market Trends
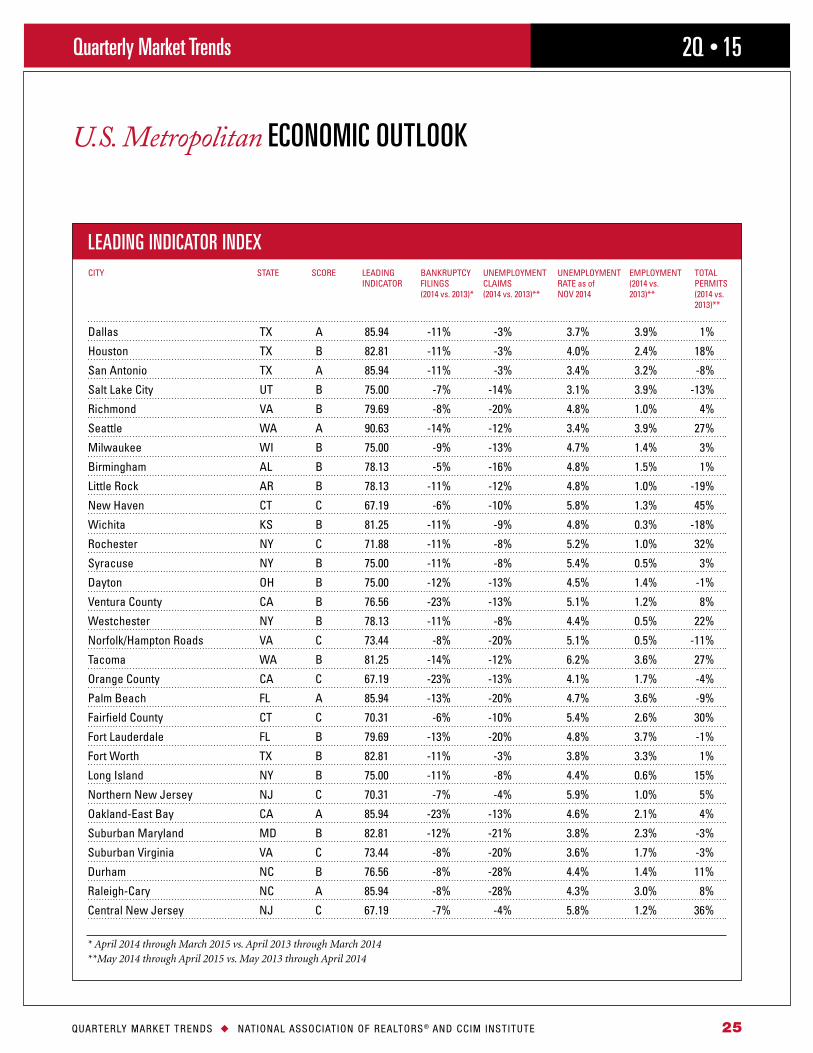
LEADING INDICATOR INDEXCITY STATE SCORE LEADING BANKRUPTCY UNEMPLOYMENT UNEMPLOYMENT EMPLOYMENT TOTAL INDICATOR FILINGS CLAIMS RATE as of (2014 vs PERMITS (2014 vs 2013)* (2014 vs 2013)** NOV 2014 2013)** (2014 vs 2013)**
U.S. Metropolitan ECONOMIC OUTLOOK
* April 2014 through March 2015 vs. April 2013 through March 2014 **May 2014 through April 2015 vs. May 2013 through April 2014
Dallas TX A 85 94 -11% -3% 3 7% 3 9% 1%
Houston TX B 82 81 -11% -3% 4 0% 2 4% 18%
San Antonio TX A 85 94 -11% -3% 3 4% 3 2% -8%
Salt Lake City UT B 75 00 -7% -14% 3 1% 3 9% -13%
Richmond VA B 79 69 -8% -20% 4 8% 1 0% 4%
Seattle WA A 90 63 -14% -12% 3 4% 3 9% 27%
Milwaukee WI B 75 00 -9% -13% 4 7% 1 4% 3%
Birmingham AL B 78 13 -5% -16% 4 8% 1 5% 1%
Little Rock AR B 78 13 -11% -12% 4 8% 1 0% -19%
New Haven CT C 67 19 -6% -10% 5 8% 1 3% 45%
Wichita KS B 81 25 -11% -9% 4 8% 0 3% -18%
Rochester NY C 71 88 -11% -8% 5 2% 1 0% 32%
Syracuse NY B 75 00 -11% -8% 5 4% 0 5% 3%
Dayton OH B 75 00 -12% -13% 4 5% 1 4% -1%
Ventura County CA B 76 56 -23% -13% 5 1% 1 2% 8%
Westchester NY B 78 13 -11% -8% 4 4% 0 5% 22%
Norfolk/Hampton Roads VA C 73 44 -8% -20% 5 1% 0 5% -11%
Tacoma WA B 81 25 -14% -12% 6 2% 3 6% 27%
Orange County CA C 67 19 -23% -13% 4 1% 1 7% -4%
Palm Beach FL A 85 94 -13% -20% 4 7% 3 6% -9%
Fairfield County CT C 70 31 -6% -10% 5 4% 2 6% 30%
Fort Lauderdale FL B 79 69 -13% -20% 4 8% 3 7% -1%
Fort Worth TX B 82 81 -11% -3% 3 8% 3 3% 1%
Long Island NY B 75 00 -11% -8% 4 4% 0 6% 15%
Northern New Jersey NJ C 70 31 -7% -4% 5 9% 1 0% 5%
Oakland-East Bay CA A 85 94 -23% -13% 4 6% 2 1% 4%
Suburban Maryland MD B 82 81 -12% -21% 3 8% 2 3% -3%
Suburban Virginia VA C 73 44 -8% -20% 3 6% 1 7% -3%
Durham NC B 76 56 -8% -28% 4 4% 1 4% 11%
Raleigh-Cary NC A 85 94 -8% -28% 4 3% 3 0% 8%
Central New Jersey NJ C 67 19 -7% -4% 5 8% 1 2% 36%
QUARTERLY MARKET TRENDS u NATIONAL ASSOCIAT ION OF REALTORS ® AND CCIM INST ITUTE 26
2Q • 15Quarterly Market Trends
SPONSORS
CCIM INSTITUTE
Since 1969, the Chicago-based CCIM Institute has conferred the Certified Commercial Investment Member (CCIM) designation to commercial real estate and allied professionals through an extensive curriculum of 160 classroom hours and professional experiential requirements. Currently, there are 9,000 CCIMs in 1,000 markets in the U.S. and 31 countries worldwide. Another 3,000 practitioners are pursuing the designation, making the Institute one of the largest commercial real estate networks in the world. An affiliate of the National Association of REALTORS®, the CCIM Institute’s recognized curriculum, networking programs, and the powerful technology tool, Site To Do Busi-ness (site analysis and demographics resource), positively impact and influence the commercial real estate industry.
Visit www.ccim.com for more information.
CCIM INSTITUTE 2015 EXECUTIVE LEADERSHIP
NATIONAL ASSOCIATION OF REALTORS®
The Mission of the National Association of REALTORS® Research Division is to collect and disseminate timely, accu-rate and comprehensive real estate data and to conduct economic analysis in order to inform and engage members, consumers, and policy makers and the media in a professional and accessible manner.
The Research Division monitors and analyzes economic indicators, including gross domestic product, retail sales, industrial production, producer price index, and employment data that impact commercial markets over time. Additionally, NAR Research examines how changes in the economy affect the commercial real estate business, and evaluates regulatory and legislative policy proposals for their impact on REALTORS,® their clients and America’s property owners.
The Research Division provides several products covering commercial real estate including:
l Commercial Real Estate Outlook l Commercial Real Estate Quarterly Market Survey l Commercial Real Estate Lending Survey l Commercial Member Profile
To find out about other products from NAR’s Research Division, visit www.realtor.org/research-and-statistics.
NATIONAL ASSOCIATION OF REALTORS® RESEARCH DIVISION
©2015 The CCIM Institute and National Association of REALTORS.® All rights reserved.
Walter S. Clements, CCIM Executive Vice President/CEO
Mark Macek, CCIM President
Steven W. Moreira, CCIM President-Elect
Robin L. Webb, CCIM First Vice President
Charles C. Connely IV, CCIM Treasurer
CCIM Institute 430 North Michigan Ave., Suite 800 Chicago, IL 60611 312-321-4460 www.ccim.com
Lawrence Yun, PhD Sr. Vice President, Chief Economist [email protected]
George Ratiu Director, Quantitative & Commercial Research [email protected]
Ken Fears Director, Regional Economics & Housing Finance Policy [email protected]
Jed Smith, Ph.D. Managing Director, Quantitative Research [email protected]
National Association of REALTORS® 500 New Jersey Ave. N.W. Washington, D.C. 20001 800-874-6500 www.realtors.org
QUARTERLY MARKET TRENDS u NATIONAL ASSOCIAT ION OF REALTORS ® AND CCIM INST ITUTE 27
2Q • 15Quarterly Market Trends
CONTRIBUTORS
Jim Baker Baker Commercial Real Estate Jeffersonville IN
Young Ja Kim Kim Commercial Duluth GA
Rogers C Smith TCHEHR Corporation, Realtors McMinnville OR
Ned Madonia Engel & Völkers Las Vegas NV
Lowrey Burnett Avison Young Denver CO
Josh Randolph Colliers International Birmingham AL
Matthew Farrell CORE Partners Birmingham MI
Jasper Tramonte Tramonte Commercial Brokerage LLC League City TX
Tom Crumpton Commercial Experts, Inc Canton GA
Ted Dang Commonwealth Real Estate Oakland CA
Felecia Studstill Silas Real Estate Advisory LLC Detroit MI
Chris Jacobson CBRE Minneapolis MN
James A Barnett J A Barnett Realty Group, Inc Tampa FL
Moe Lessan DTZ Nanaimo Real Estate Ltd Nanaimo
Mike Stuhlmiller Stuhlmiller Realty Hayden ID
Nancy Fish Park Place Real Estate Kalamazoo MI
Tarit Chaudhuri KW Commercial Texas Gulf Houston TX
Hank Futch Hank Futch Real Estate Charleston SC
Sherry Palermo Zann Commercial Brokerage Houston TX
Gregg Thompson Ratcliff Development, LLC Alexandria LA
Richard Harris Richard Harris & Associates, Inc Palm Harbor FL
Gary Hunter Westlake Associates, Inc Seattle WA
Ryan Haedrich Haedrich & Co , Inc Redding CA
Tom Davies Norris & Stevens, Inc Portland OR
Amy Mills Steve Fineberg & Associates, Inc Bentonville AR
Lloyd Miller Morris Realty Group Memphis TN
Jay Taylor Sperry Van Ness Raleigh NC
Warren Marr PwC Philadelphia PA
Daren Hebold LUX Realty Group Portland ME
Theodore Deuel Deuel International Group, Inc San Deigo CA
Richard Czoski Santa Fe Raiyayrd Community Corp Santa Fe NM
Randall Hall BrokerOne Real Estate Casper WY
Patrick D Gallagher Siegel-Gallagher, Inc Milwaukee WI
Dale Dockins North Bay Commrcial Real Estate Santa Rosa CA
Lily Seymour Gershman commercial Real Estate St Louis MO
Tom Larson RE/MAX Commercial Property Solutions La Porte IN
Frank Weiskopf Realty Executives Maryville TN
Janet Wilkerson INVEST Commercial Real Estate Leawood KS
Sharon Carz Income Property Specialists Los Angeles CA
Ryan Lasiter Doyle Rogers Company Little Rock AR
Warren Strietzel Schostak Brothers and Company Livonia MI
Jeffrey Eales Birtcher Anderson Realty San Juan Capistrano CA
James Yates Red Realty, LLC Murfreesboro TN
Scot E Hall Wolf Realty Inc Glendale AZ
Jacque Haynes Cassidy Turley Indianapolis IN
Dewey Struble Dewey Struble CCIM Reno NV
Michael Grazier Trimont Real Estate Advisors Atlanta GA
James Robertson Realty Executives Tucson Elite Tucson AZ
Robert Powell Powell Realty Advisors Dallas TX
Rob Lukemeyer III Baseline, Inc Indianapolis IN
Edward Wilson Newmark Grubb Wilson/Kibler Greenville SC
Corey Schneider Corey J Schneider, CCIM Passaic NJ
Blake Lacy Broadway Bank San Antonio TX
Tommy Gleason NAI Mobile Mobile AL
Brian Rosteck Skogman Commercial Cedar Rapids IA
kevin goeller KLNB Vienna VA
John M Stone John M Stone Company Dallas TX
James Palmer Re/Max Metro-city Realty Ottawa
Dalerie Wu STC Management Whittier CA
Todd Hamilton Cutler Commercial Phoenix AZ
Ken Krawczyk K S K Services, Inc Pewaukee WI
Michael Shaffer Skogman Commercial Cedar Rapids IA
Michel Hibbert Charles Dunn Company Los Angeles CA
Kevin Lynch Sperry Van Ness Wheeling IL
Macy Ritter NorthPoint Development Kansas City MO
Danny Zelonker Real Miami Commercial RE Miami FL
Alan Stamm Century 21 Consolidated Las Vegas NV
Jennifer Spritzer KW Commercial Indianapolis IN
Gregoy Moore Sperry Van Ness Jupiter FL
Aaron McDermott Latitude Commercial Schererville IN
Russell Hur RMH Austin TX
Chris Jacobson CBRE Minneapolis MN
Nick Nicketakis CBS Realtors AL
Olga Hallstedt Results Commercial Real Estate Grand Rapids MI
QUARTERLY MARKET TRENDS u NATIONAL ASSOCIAT ION OF REALTORS ® AND CCIM INST ITUTE 28
2Q • 15Quarterly Market Trends
CONTRIBUTORS
Phillip Greenberg Brand Name Real Estate Charleston SC
Matt Boehlke Regus Minneapolis MN
Thomas Knaub Colliers International Phoenix AZ
Craig G Johnson Maylar LP Dallas TX
Nicole Willoughby Associated Bank Milwaukee WI
Peter Rasmusson Lee & Associates Elmwood Park NJ
Hubert King Treeline Realty and Investment Co Temple City CA
Amy Silvey Clay & Company Houston TX
Ron Opfer Coldwell Banker Las Vegas NV
Evan Hammer Stanley Hammer Co San Antonio TX
Drew Augustin Alliance Commercial Group Indianapolis IN
Joe Milkes Milkes Realty Valuation Plano TX
Amy Lerseth The Buzz Oates Group of Companies Sacramento CA
Steve Jacquemin S J Financial Group, Inc St Louis MO
Andie Edmonds NAI ARIS Bend OR
Ira Korn Coldwell Banker Commercial Meridian Rochester NY
Brad Welborn iCOREglobal - Ft Myers Fort Myers FL
John Levinsohn Levi Investment Realty, Inc Indianapolis IN
Dan Mincher The Vollman Company, Inc Sacamento CA
Nick Miner ORION Investment Real Estate Scottsdale AZ
Aziz Khatri KW Commercial Fremont CA
Becky Leebens LR Real Estate Apple Valey MN
David P Reule Reule Corporation Charlotte NC
Michael Carr Coldwell Banker Commercial NRT Naples FL
Wayne Kurchina ILrealty, Inc McHenry IL
Michael C DiBella Coldwell Banker Island Properties Wailea HI
Dan Naylor Mericle Commercial Real Estate Wilkes-Barre PA
Ross Thomas Caldwell Companies Houston TX
Nathan Hughes Bandazian & Hughes, Inc Richmond VA
David Monroe Bellator Real Estate & Development Mobile AL
David Aikens KW Commercial Louisville KY
Gary Hunter Westlake Associates, Inc Seattle WA
Beau Beery Coldwell Banker Commercial M M Parrish Gainesville FL
Gary Cornelssen Marcor Investment Properties, Inc San Diego CA
N Fish Park Place Real Estate Kalamazoo MI
Tony M Amato Avison Young Las Vegas NV
Mary Martin Miller Miller Consulting Group, LLC Newberg OR
Roxana Baker Ritchie Commercial San Jose CA
Mike Armanious KW Commercial Tacoma WA
Bob Hansen Hansen Real Estate & Invest-ment Service, LLC Ellensburg WA
Skip Weber NAI/Latter & Blum New Orleans LA
Jeff Wilke Graham & Company Huntsville AL
Ghassan Jadoun Ace Commercial Real Estate New Port Richey FL
David Roth REMAX Alliance Group Sarasota FL
Patrick Ley ECR Austin TX
Brian Wolford Paradigm Tax Group Houston TX
Joel Miller Sperry Van Ness / Landmark Geneva IL
Brad Vander Linden VLRE, Inc Indianola IA
Kyle Gill Faithbridge Property Company Aledo TX
Jeff Castell Cassidy Turley Indianapolis IN
David Williamson BancorpSouth Birmingham AL
James Roberson NAI Knoxville Knoxville TN
Deb Stevens The Stevens Group Boston MA
Craig Evans Cassidy Turley New York NY
Louise Frazier Blue Ridge Realty, Inc Knoxville TN
Michael Manning Main Place Liberty Group Buffalo NY
Ross Hedlund Frauenshuh Commercial Real Estate Minneapolis MN
Jim Resha Sperry Commercial Irvine CA
QUARTERLY MARKET TRENDS u NATIONAL ASSOCIAT ION OF REALTORS ® AND CCIM INST ITUTE 29
Headline Line HEADLINE
Visit www.ccim.com/resources to learn more about
CCIM’s Quarterly Market Trends report.
Quarterly Market TRENDS
Vacancy Rate34%
2Q • 15