Embed Size (px)
Citation preview
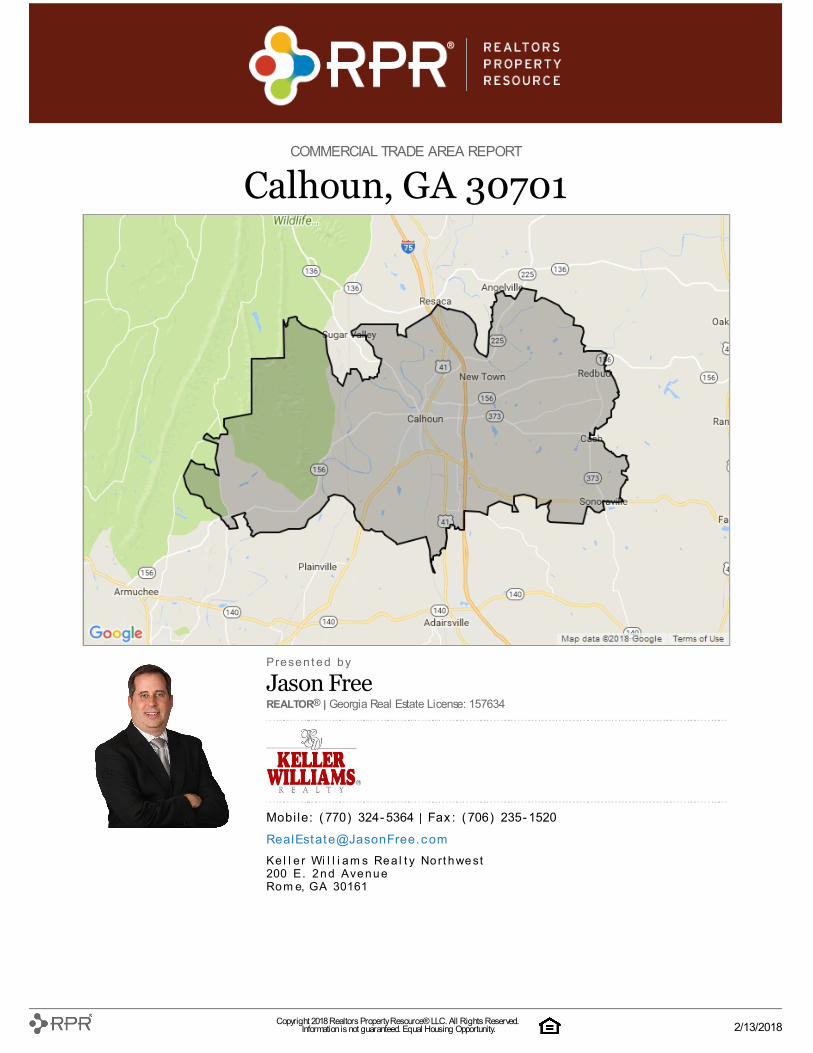
COMMERCIAL TRADE AREA REPORT
Calhoun, GA 30701
P|r|e|s|e|n|t |e|d| |b|y
Jason FreeREALTOR® | Georgia Real Estate License: 157634
M|o|b|i|l|e|: | |( |770|) | |324|- |5364 | F|a|x|:| |( |706|) | |235|- |1520
R|e|a|l|E|st|a|t|e|@|J|a|so|n|F|re|e|.|c |o|m
K|e|l |l |e|r| |W|i |l |l |i |a|m |s| |R|e|a|l |t |y| |N|o|r|t |h|w|e|s|t200| |E|. | |2|n|d| |A|v|e|n|u|eR|o|m |e, |G|A| |30161
Copyright 2018 Realtors Property Resource® LLC. All Rights Reserved. Information is not guaranteed. Equal Housing Opportunity.
2/13/2018
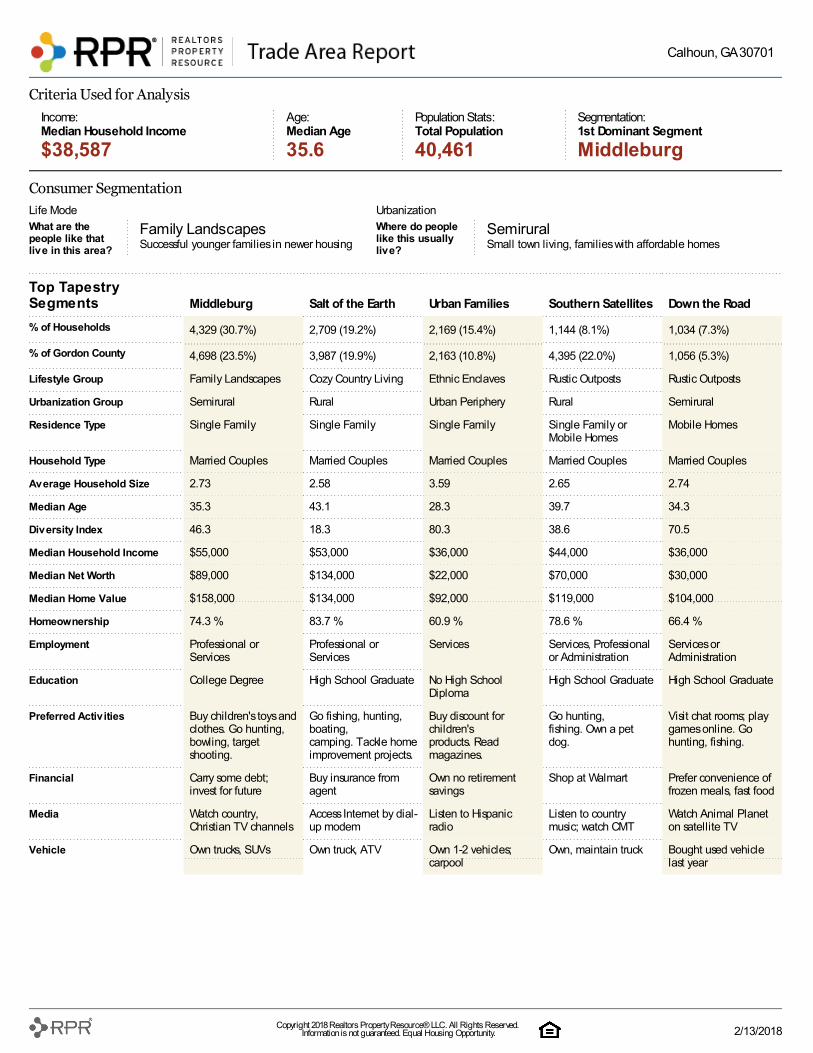
Criteria Used for Analysis
Income:Median Household Income
Age:Median Age
Population Stats:Total Population
Segmentation:1st Dominant Segment
$38,587 35.6 40,461 Middleburg
Consumer Segmentation
Life Mode Urbanization
What are thepeople like thatlive in this area?
Family LandscapesSuccessful younger families in newer housing
Where do peoplelike this usuallylive?
SemiruralSmall town living, families with affordable homes
Top TapestrySegments Middleburg Salt of the Earth Urban Families Southern Satellites Down the Road
% of Households 4,329 (30.7%) 2,709 (19.2%) 2,169 (15.4%) 1,144 (8.1%) 1,034 (7.3%)
% of Gordon County 4,698 (23.5%) 3,987 (19.9%) 2,163 (10.8%) 4,395 (22.0%) 1,056 (5.3%)
Lifestyle Group Family Landscapes Cozy Country Living Ethnic Enclaves Rustic Outposts Rustic Outposts
Urbanization Group Semirural Rural Urban Periphery Rural Semirural
Residence Type Single Family Single Family Single Family Single Family orMobile Homes
Mobile Homes
Household Type Married Couples Married Couples Married Couples Married Couples Married Couples
Average Household Size 2.73 2.58 3.59 2.65 2.74
Median Age 35.3 43.1 28.3 39.7 34.3
Diversity Index 46.3 18.3 80.3 38.6 70.5
Median Household Income $55,000 $53,000 $36,000 $44,000 $36,000
Median Net Worth $89,000 $134,000 $22,000 $70,000 $30,000
Median Home Value $158,000 $134,000 $92,000 $119,000 $104,000
Homeownership 74.3 % 83.7 % 60.9 % 78.6 % 66.4 %
Employment Professional orServices
Professional orServices
Services Services, Professionalor Administration
Services orAdministration
Education College Degree High School Graduate No High SchoolDiploma
High School Graduate High School Graduate
Preferred Activities Buy children's toys andclothes. Go hunting,bowling, targetshooting.
Go fishing, hunting,boating,camping. Tackle homeimprovement projects.
Buy discount forchildren'sproducts. Readmagazines.
Go hunting,fishing. Own a petdog.
Visit chat rooms; playgames online. Gohunting, fishing.
Financial Carry some debt;invest for future
Buy insurance fromagent
Own no retirementsavings
Shop at Walmart Prefer convenience offrozen meals, fast food
Media Watch country,Christian TV channels
Access Internet by dial-up modem
Listen to Hispanicradio
Listen to countrymusic; watch CMT
Watch Animal Planeton satellite TV
Vehicle Own trucks, SUVs Own truck, ATV Own 1-2 vehicles;carpool
Own, maintain truck Bought used vehiclelast year
Calhoun, GA 30701
Copyright 2018 Realtors Property Resource® LLC. All Rights Reserved. Information is not guaranteed. Equal Housing Opportunity. 2/13/2018
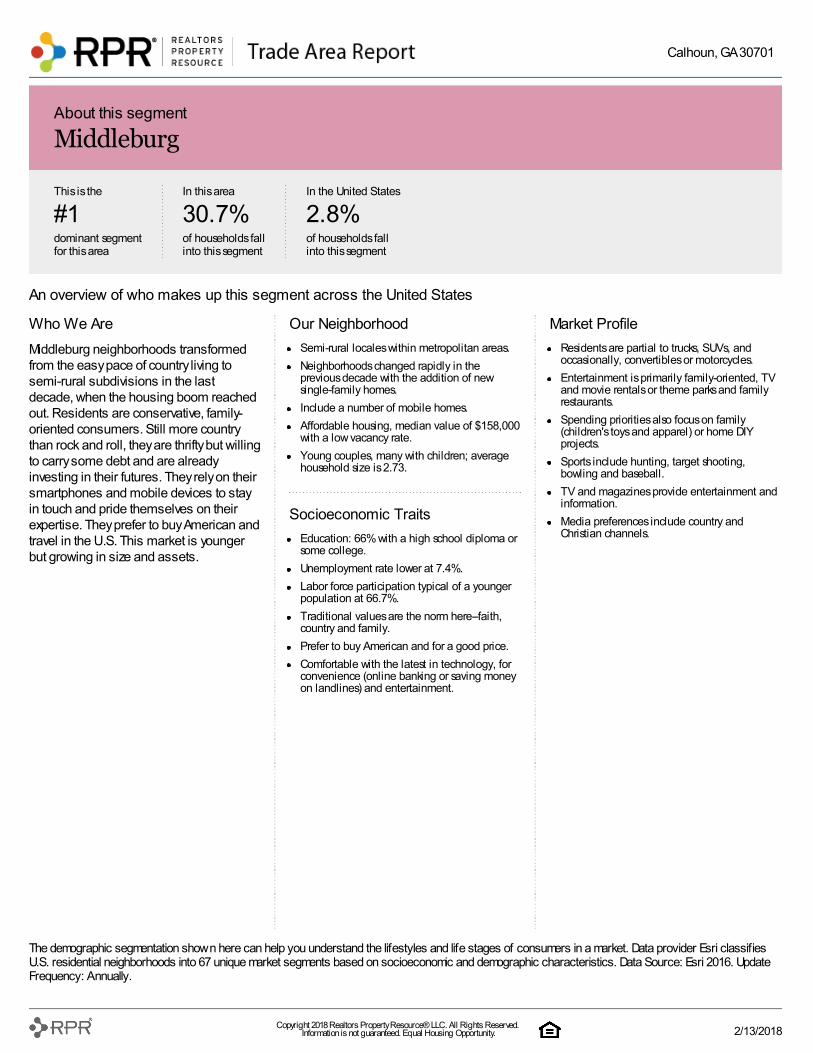
Who We Are
Middleburg neighborhoods transformedfrom the easy pace of country living tosemi-rural subdivisions in the lastdecade, when the housing boom reachedout. Residents are conservative, family-oriented consumers. Still more countrythan rock and roll, they are thrifty but willingto carry some debt and are alreadyinvesting in their futures. They rely on theirsmartphones and mobile devices to stayin touch and pride themselves on theirexpertise. They prefer to buy American andtravel in the U.S. This market is youngerbut growing in size and assets.
Our Neighborhood
Semi-rural locales within metropolitan areas.
Neighborhoods changed rapidly in theprevious decade with the addition of newsingle-family homes.
Include a number of mobile homes.
Affordable housing, median value of $158,000with a low vacancy rate.
Young couples, many with children; averagehousehold size is 2.73.
Socioeconomic Traits
Education: 66% with a high school diploma orsome college.
Unemployment rate lower at 7.4%.
Labor force participation typical of a youngerpopulation at 66.7%.
Traditional values are the norm here--faith,country and family.
Prefer to buy American and for a good price.
Comfortable with the latest in technology, forconvenience (online banking or saving moneyon landlines) and entertainment.
Market Profile
Residents are partial to trucks, SUVs, andoccasionally, convertibles or motorcycles.
Entertainment is primarily family-oriented, TVand movie rentals or theme parks and familyrestaurants.
Spending priorities also focus on family(children's toys and apparel) or home DIYprojects.
Sports include hunting, target shooting,bowling and baseball.
TV and magazines provide entertainment andinformation.
Media preferences include country andChristian channels.
An overview of who makes up this segment across the United States
The demographic segmentation shown here can help you understand the lifestyles and life stages of consumers in a market. Data provider Esri classifiesU.S. residential neighborhoods into 67 unique market segments based on socioeconomic and demographic characteristics. Data Source: Esri 2016. UpdateFrequency: Annually.
This is the
#1dominant segmentfor this area
In this area
30.7%of households fallinto this segment
In the United States
2.8%of households fallinto this segment
About this segment
Middleburg
Calhoun, GA 30701
Copyright 2018 Realtors Property Resource® LLC. All Rights Reserved. Information is not guaranteed. Equal Housing Opportunity. 2/13/2018
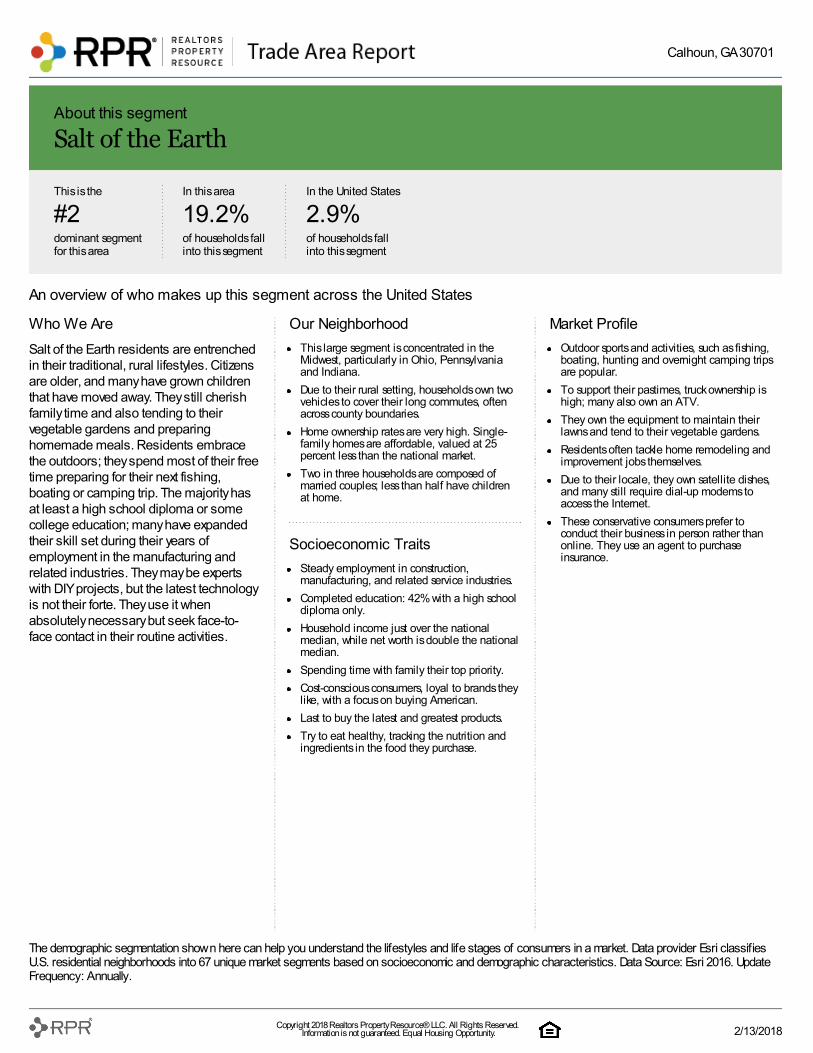
Who We Are
Salt of the Earth residents are entrenchedin their traditional, rural lifestyles. Citizensare older, and many have grown childrenthat have moved away. They still cherishfamily time and also tending to theirvegetable gardens and preparinghomemade meals. Residents embracethe outdoors; they spend most of their freetime preparing for their next fishing,boating or camping trip. The majority hasat least a high school diploma or somecollege education; many have expandedtheir skill set during their years ofemployment in the manufacturing andrelated industries. They may be expertswith DIY projects, but the latest technologyis not their forte. They use it whenabsolutely necessary but seek face-to-face contact in their routine activities.
Our Neighborhood
This large segment is concentrated in theMidwest, particularly in Ohio, Pennsylvaniaand Indiana.
Due to their rural setting, households own twovehicles to cover their long commutes, oftenacross county boundaries.
Home ownership rates are very high. Single-family homes are affordable, valued at 25percent less than the national market.
Two in three households are composed ofmarried couples; less than half have childrenat home.
Socioeconomic Traits
Steady employment in construction,manufacturing, and related service industries.
Completed education: 42% with a high schooldiploma only.
Household income just over the nationalmedian, while net worth is double the nationalmedian.
Spending time with family their top priority.
Cost-conscious consumers, loyal to brands theylike, with a focus on buying American.
Last to buy the latest and greatest products.
Try to eat healthy, tracking the nutrition andingredients in the food they purchase.
Market Profile
Outdoor sports and activities, such as fishing,boating, hunting and overnight camping tripsare popular.
To support their pastimes, truck ownership ishigh; many also own an ATV.
They own the equipment to maintain theirlawns and tend to their vegetable gardens.
Residents often tackle home remodeling andimprovement jobs themselves.
Due to their locale, they own satellite dishes,and many still require dial-up modems toaccess the Internet.
These conservative consumers prefer toconduct their business in person rather thanonline. They use an agent to purchaseinsurance.
An overview of who makes up this segment across the United States
The demographic segmentation shown here can help you understand the lifestyles and life stages of consumers in a market. Data provider Esri classifiesU.S. residential neighborhoods into 67 unique market segments based on socioeconomic and demographic characteristics. Data Source: Esri 2016. UpdateFrequency: Annually.
This is the
#2dominant segmentfor this area
In this area
19.2%of households fallinto this segment
In the United States
2.9%of households fallinto this segment
About this segment
Salt of the Earth
Calhoun, GA 30701
Copyright 2018 Realtors Property Resource® LLC. All Rights Reserved. Information is not guaranteed. Equal Housing Opportunity. 2/13/2018
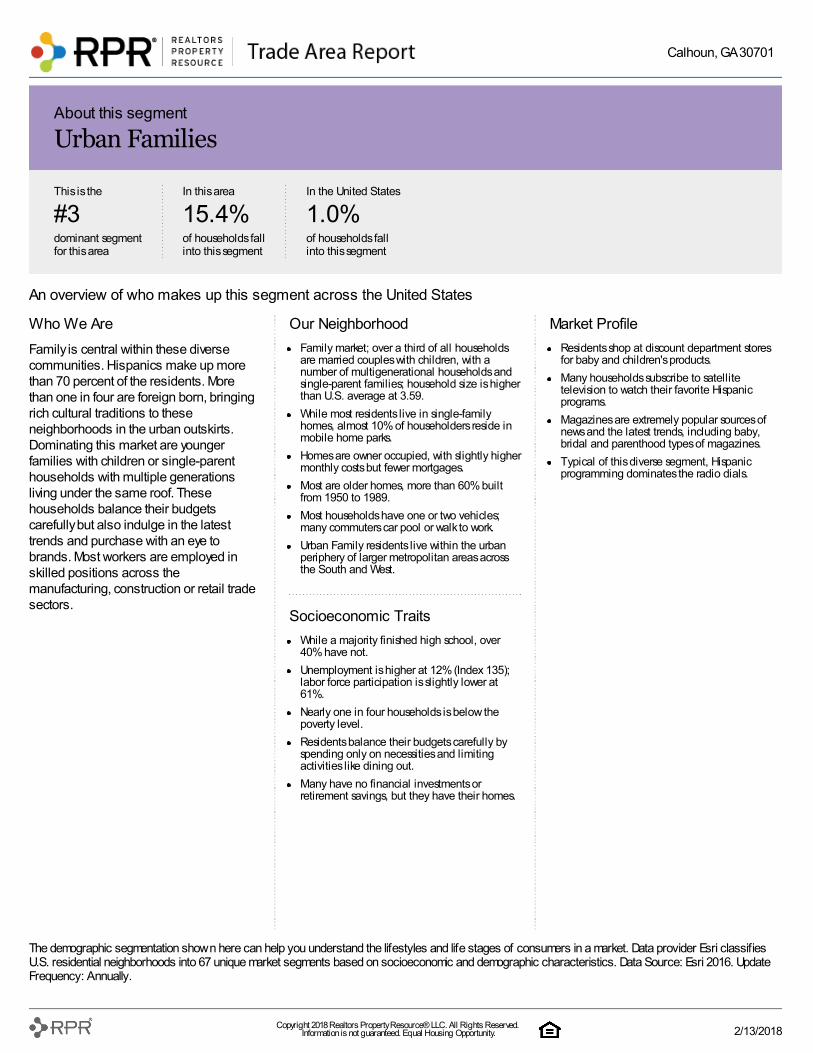
Who We Are
Family is central within these diversecommunities. Hispanics make up morethan 70 percent of the residents. Morethan one in four are foreign born, bringingrich cultural traditions to theseneighborhoods in the urban outskirts.Dominating this market are youngerfamilies with children or single-parenthouseholds with multiple generationsliving under the same roof. Thesehouseholds balance their budgetscarefully but also indulge in the latesttrends and purchase with an eye tobrands. Most workers are employed inskilled positions across themanufacturing, construction or retail tradesectors.
Our Neighborhood
Family market; over a third of all householdsare married couples with children, with anumber of multigenerational households andsingle-parent families; household size is higherthan U.S. average at 3.59.
While most residents live in single-familyhomes, almost 10% of householders reside inmobile home parks.
Homes are owner occupied, with slightly highermonthly costs but fewer mortgages.
Most are older homes, more than 60% builtfrom 1950 to 1989.
Most households have one or two vehicles;many commuters car pool or walk to work.
Urban Family residents live within the urbanperiphery of larger metropolitan areas acrossthe South and West.
Socioeconomic Traits
While a majority finished high school, over40% have not.
Unemployment is higher at 12% (Index 135);labor force participation is slightly lower at61%.
Nearly one in four households is below thepoverty level.
Residents balance their budgets carefully byspending only on necessities and limitingactivities like dining out.
Many have no financial investments orretirement savings, but they have their homes.
Market Profile
Residents shop at discount department storesfor baby and children's products.
Many households subscribe to satellitetelevision to watch their favorite Hispanicprograms.
Magazines are extremely popular sources ofnews and the latest trends, including baby,bridal and parenthood types of magazines.
Typical of this diverse segment, Hispanicprogramming dominates the radio dials.
An overview of who makes up this segment across the United States
The demographic segmentation shown here can help you understand the lifestyles and life stages of consumers in a market. Data provider Esri classifiesU.S. residential neighborhoods into 67 unique market segments based on socioeconomic and demographic characteristics. Data Source: Esri 2016. UpdateFrequency: Annually.
This is the
#3dominant segmentfor this area
In this area
15.4%of households fallinto this segment
In the United States
1.0%of households fallinto this segment
About this segment
Urban Families
Calhoun, GA 30701
Copyright 2018 Realtors Property Resource® LLC. All Rights Reserved. Information is not guaranteed. Equal Housing Opportunity. 2/13/2018
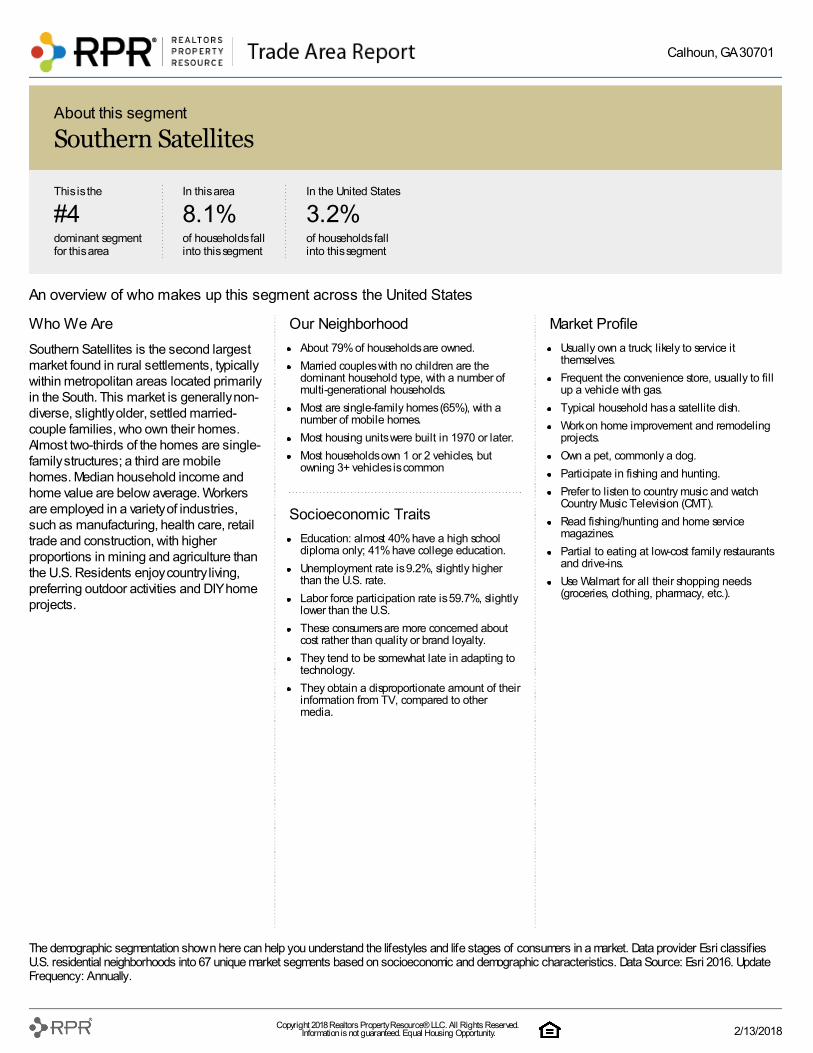
Who We Are
Southern Satellites is the second largestmarket found in rural settlements, typicallywithin metropolitan areas located primarilyin the South. This market is generally non-diverse, slightly older, settled married-couple families, who own their homes.Almost two-thirds of the homes are single-family structures; a third are mobilehomes. Median household income andhome value are below average. Workersare employed in a variety of industries,such as manufacturing, health care, retailtrade and construction, with higherproportions in mining and agriculture thanthe U.S. Residents enjoy country living,preferring outdoor activities and DIY homeprojects.
Our Neighborhood
About 79% of households are owned.
Married couples with no children are thedominant household type, with a number ofmulti-generational households.
Most are single-family homes (65%), with anumber of mobile homes.
Most housing units were built in 1970 or later.
Most households own 1 or 2 vehicles, butowning 3+ vehicles is common
Socioeconomic Traits
Education: almost 40% have a high schooldiploma only; 41% have college education.
Unemployment rate is 9.2%, slightly higherthan the U.S. rate.
Labor force participation rate is 59.7%, slightlylower than the U.S.
These consumers are more concerned aboutcost rather than quality or brand loyalty.
They tend to be somewhat late in adapting totechnology.
They obtain a disproportionate amount of theirinformation from TV, compared to othermedia.
Market Profile
Usually own a truck; likely to service itthemselves.
Frequent the convenience store, usually to fillup a vehicle with gas.
Typical household has a satellite dish.
Work on home improvement and remodelingprojects.
Own a pet, commonly a dog.
Participate in fishing and hunting.
Prefer to listen to country music and watchCountry Music Television (CMT).
Read fishing/hunting and home servicemagazines.
Partial to eating at low-cost family restaurantsand drive-ins.
Use Walmart for all their shopping needs(groceries, clothing, pharmacy, etc.).
An overview of who makes up this segment across the United States
The demographic segmentation shown here can help you understand the lifestyles and life stages of consumers in a market. Data provider Esri classifiesU.S. residential neighborhoods into 67 unique market segments based on socioeconomic and demographic characteristics. Data Source: Esri 2016. UpdateFrequency: Annually.
This is the
#4dominant segmentfor this area
In this area
8.1%of households fallinto this segment
In the United States
3.2%of households fallinto this segment
About this segment
Southern Satellites
Calhoun, GA 30701
Copyright 2018 Realtors Property Resource® LLC. All Rights Reserved. Information is not guaranteed. Equal Housing Opportunity. 2/13/2018
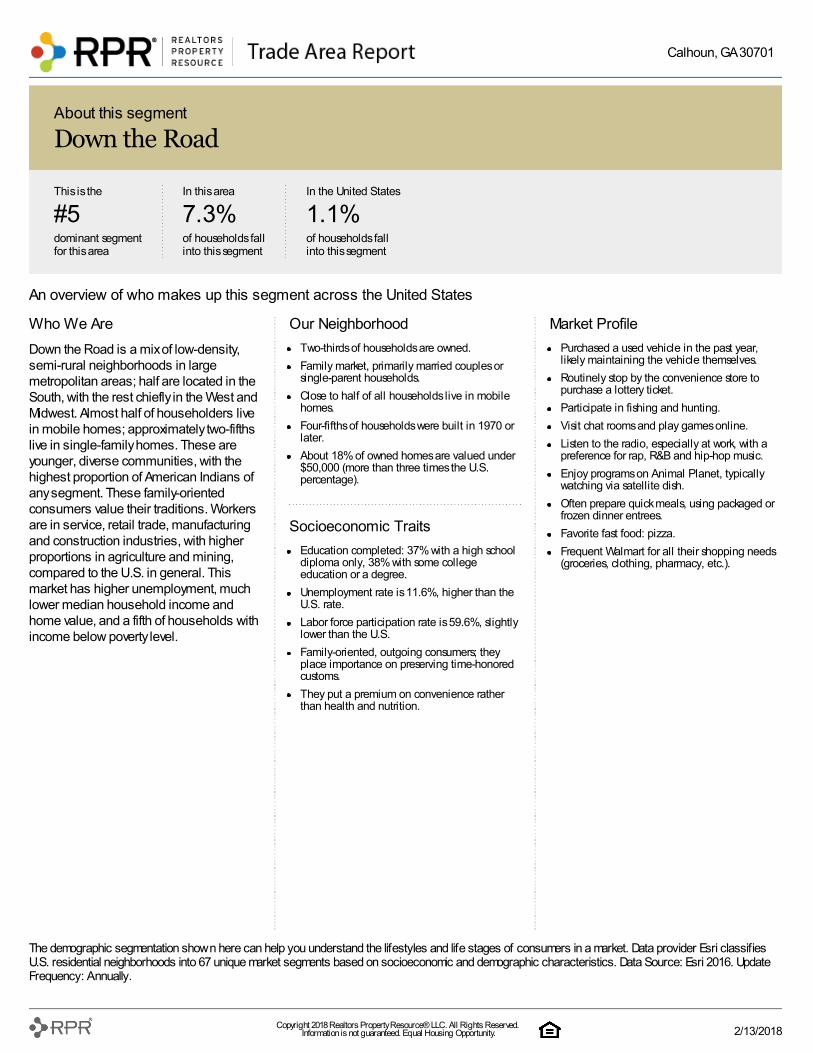
Who We Are
Down the Road is a mix of low-density,semi-rural neighborhoods in largemetropolitan areas; half are located in theSouth, with the rest chiefly in the West andMidwest. Almost half of householders livein mobile homes; approximately two-fifthslive in single-family homes. These areyounger, diverse communities, with thehighest proportion of American Indians ofany segment. These family-orientedconsumers value their traditions. Workersare in service, retail trade, manufacturingand construction industries, with higherproportions in agriculture and mining,compared to the U.S. in general. Thismarket has higher unemployment, muchlower median household income andhome value, and a fifth of households withincome below poverty level.
Our Neighborhood
Two-thirds of households are owned.
Family market, primarily married couples orsingle-parent households.
Close to half of all households live in mobilehomes.
Four-fifths of households were built in 1970 orlater.
About 18% of owned homes are valued under$50,000 (more than three times the U.S.percentage).
Socioeconomic Traits
Education completed: 37% with a high schooldiploma only, 38% with some collegeeducation or a degree.
Unemployment rate is 11.6%, higher than theU.S. rate.
Labor force participation rate is 59.6%, slightlylower than the U.S.
Family-oriented, outgoing consumers; theyplace importance on preserving time-honoredcustoms.
They put a premium on convenience ratherthan health and nutrition.
Market Profile
Purchased a used vehicle in the past year,likely maintaining the vehicle themselves.
Routinely stop by the convenience store topurchase a lottery ticket.
Participate in fishing and hunting.
Visit chat rooms and play games online.
Listen to the radio, especially at work, with apreference for rap, R&B and hip-hop music.
Enjoy programs on Animal Planet, typicallywatching via satellite dish.
Often prepare quick meals, using packaged orfrozen dinner entrees.
Favorite fast food: pizza.
Frequent Walmart for all their shopping needs(groceries, clothing, pharmacy, etc.).
An overview of who makes up this segment across the United States
The demographic segmentation shown here can help you understand the lifestyles and life stages of consumers in a market. Data provider Esri classifiesU.S. residential neighborhoods into 67 unique market segments based on socioeconomic and demographic characteristics. Data Source: Esri 2016. UpdateFrequency: Annually.
This is the
#5dominant segmentfor this area
In this area
7.3%of households fallinto this segment
In the United States
1.1%of households fallinto this segment
About this segment
Down the Road
Calhoun, GA 30701
Copyright 2018 Realtors Property Resource® LLC. All Rights Reserved. Information is not guaranteed. Equal Housing Opportunity. 2/13/2018
2016
2021 (Projected)
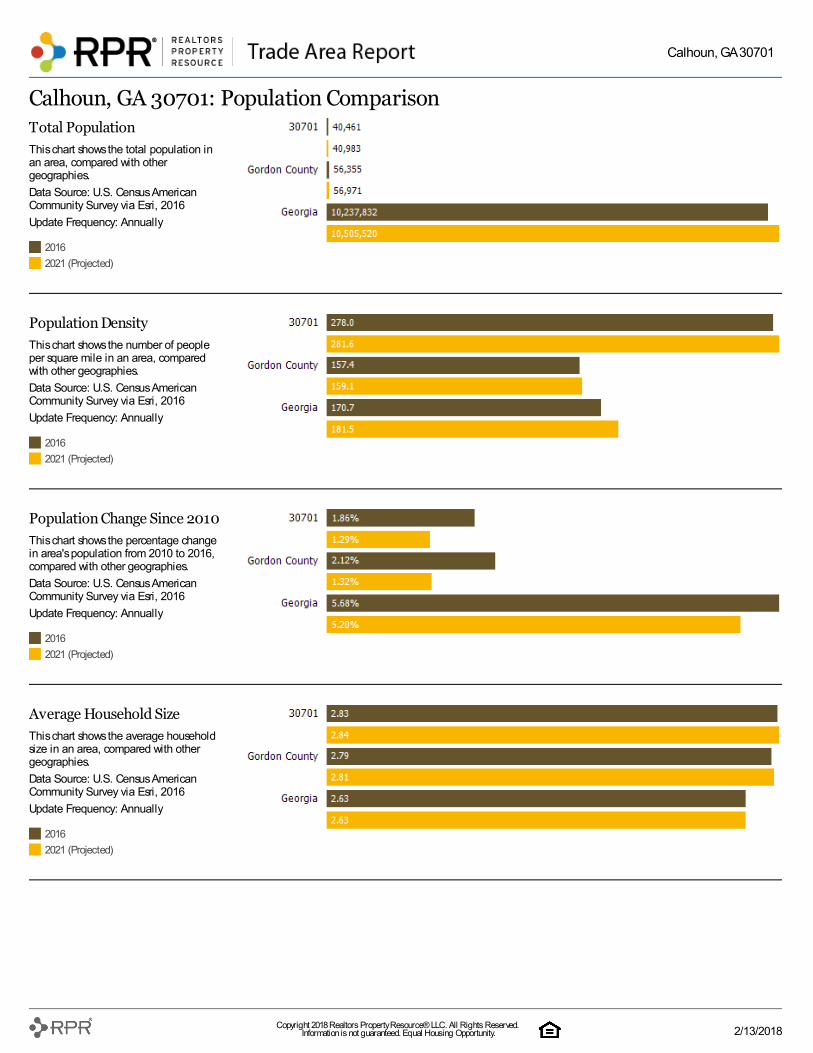
Total Population
This chart shows the total population inan area, compared with othergeographies.
Data Source: U.S. Census AmericanCommunity Survey via Esri, 2016
Update Frequency: Annually
2016
2021 (Projected)
Population Density
This chart shows the number of peopleper square mile in an area, comparedwith other geographies.
Data Source: U.S. Census AmericanCommunity Survey via Esri, 2016
Update Frequency: Annually
2016
2021 (Projected)
Population Change Since 2010
This chart shows the percentage changein area's population from 2010 to 2016,compared with other geographies.
Data Source: U.S. Census AmericanCommunity Survey via Esri, 2016
Update Frequency: Annually
2016
2021 (Projected)
Average Household Size
This chart shows the average householdsize in an area, compared with othergeographies.
Data Source: U.S. Census AmericanCommunity Survey via Esri, 2016
Update Frequency: Annually
Calhoun, GA 30701: Population Comparison
Calhoun, GA 30701
Copyright 2018 Realtors Property Resource® LLC. All Rights Reserved. Information is not guaranteed. Equal Housing Opportunity. 2/13/2018
2016
2021 (Projected)
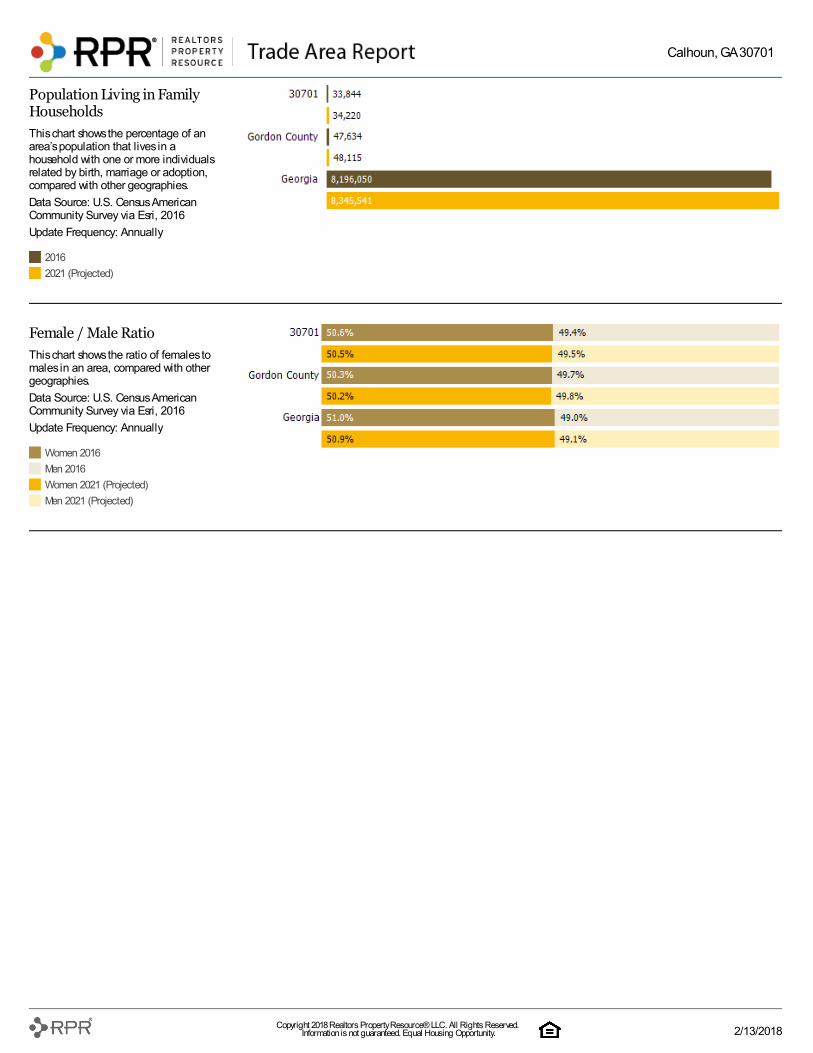
Population Living in FamilyHouseholds
This chart shows the percentage of anarea’s population that lives in ahousehold with one or more individualsrelated by birth, marriage or adoption,compared with other geographies.
Data Source: U.S. Census AmericanCommunity Survey via Esri, 2016
Update Frequency: Annually
Women 2016
Men 2016
Women 2021 (Projected)
Men 2021 (Projected)
Female / Male Ratio
This chart shows the ratio of females tomales in an area, compared with othergeographies.
Data Source: U.S. Census AmericanCommunity Survey via Esri, 2016
Update Frequency: Annually
Calhoun, GA 30701
Copyright 2018 Realtors Property Resource® LLC. All Rights Reserved. Information is not guaranteed. Equal Housing Opportunity. 2/13/2018
2016
2021 (Projected)
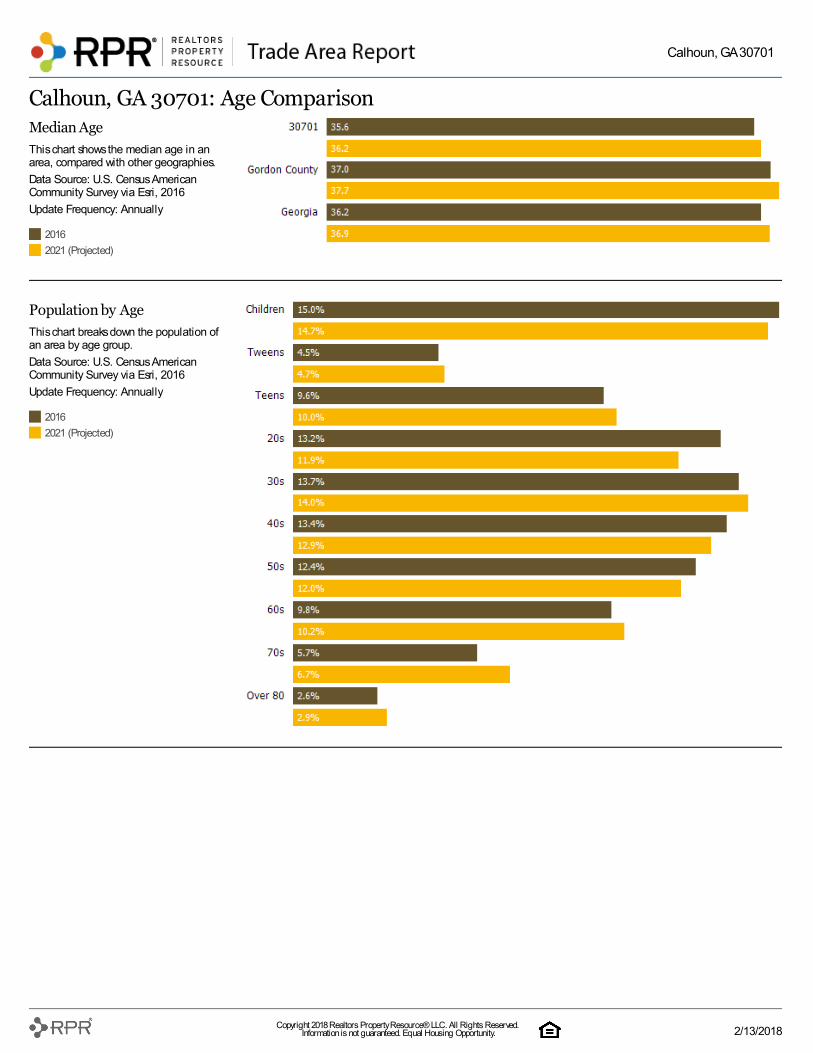
Median Age
This chart shows the median age in anarea, compared with other geographies.
Data Source: U.S. Census AmericanCommunity Survey via Esri, 2016
Update Frequency: Annually
2016
2021 (Projected)
Population by Age
This chart breaks down the population ofan area by age group.
Data Source: U.S. Census AmericanCommunity Survey via Esri, 2016
Update Frequency: Annually
Calhoun, GA 30701: Age Comparison
Calhoun, GA 30701
Copyright 2018 Realtors Property Resource® LLC. All Rights Reserved. Information is not guaranteed. Equal Housing Opportunity. 2/13/2018
Married
Unmarried
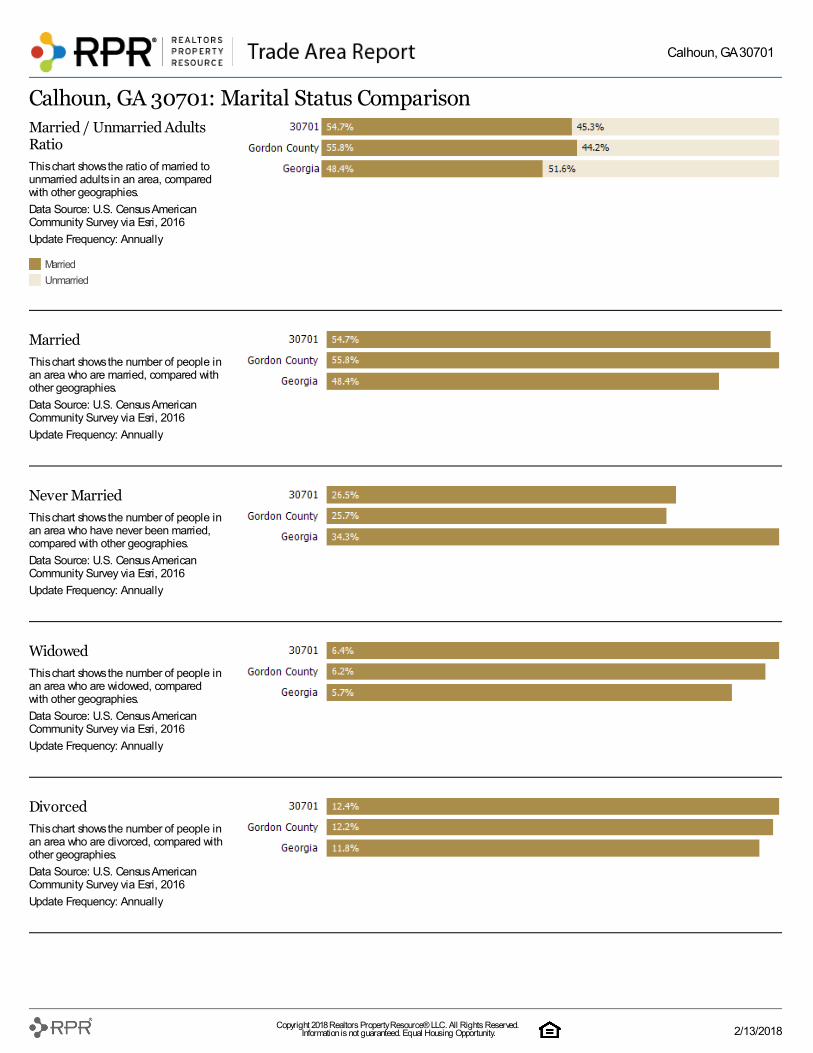
Married / Unmarried AdultsRatio
This chart shows the ratio of married tounmarried adults in an area, comparedwith other geographies.
Data Source: U.S. Census AmericanCommunity Survey via Esri, 2016
Update Frequency: Annually
Married
This chart shows the number of people inan area who are married, compared withother geographies.
Data Source: U.S. Census AmericanCommunity Survey via Esri, 2016
Update Frequency: Annually
Never Married
This chart shows the number of people inan area who have never been married,compared with other geographies.
Data Source: U.S. Census AmericanCommunity Survey via Esri, 2016
Update Frequency: Annually
Widowed
This chart shows the number of people inan area who are widowed, comparedwith other geographies.
Data Source: U.S. Census AmericanCommunity Survey via Esri, 2016
Update Frequency: Annually
Divorced
This chart shows the number of people inan area who are divorced, compared withother geographies.
Data Source: U.S. Census AmericanCommunity Survey via Esri, 2016
Update Frequency: Annually
Calhoun, GA 30701: Marital Status Comparison
Calhoun, GA 30701
Copyright 2018 Realtors Property Resource® LLC. All Rights Reserved. Information is not guaranteed. Equal Housing Opportunity. 2/13/2018
2016
2021 (Projected)
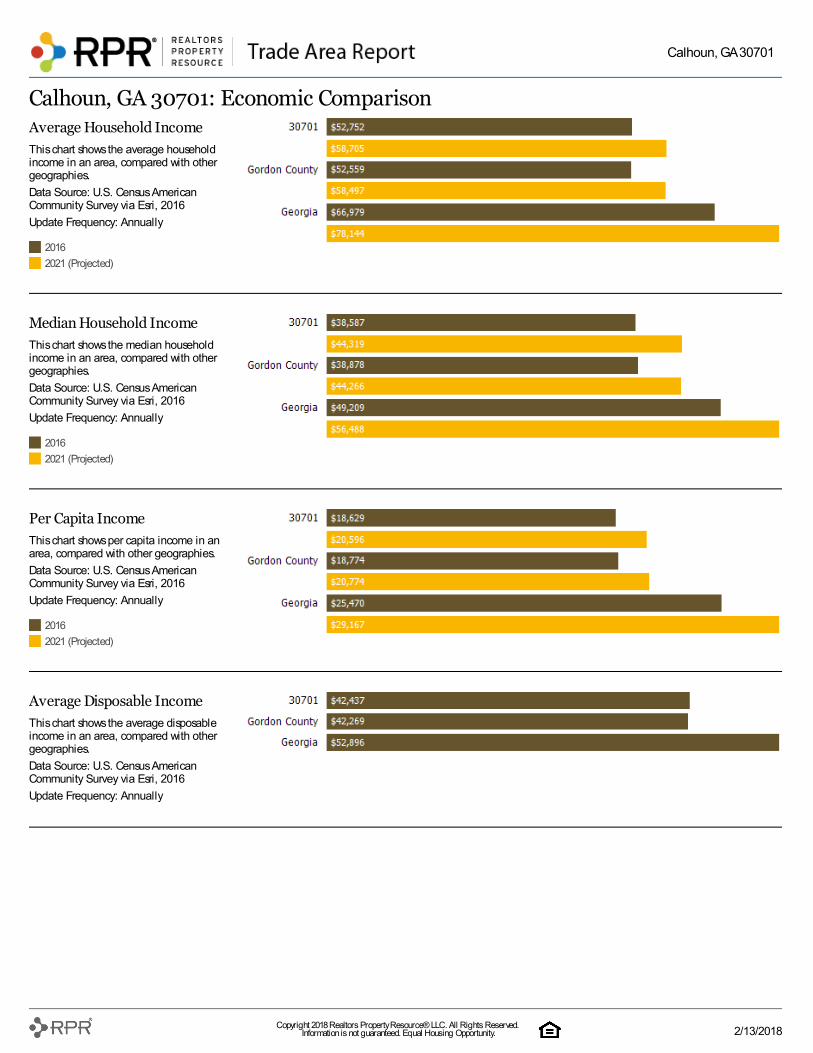
Average Household Income
This chart shows the average householdincome in an area, compared with othergeographies.
Data Source: U.S. Census AmericanCommunity Survey via Esri, 2016
Update Frequency: Annually
2016
2021 (Projected)
Median Household Income
This chart shows the median householdincome in an area, compared with othergeographies.
Data Source: U.S. Census AmericanCommunity Survey via Esri, 2016
Update Frequency: Annually
2016
2021 (Projected)
Per Capita Income
This chart shows per capita income in anarea, compared with other geographies.
Data Source: U.S. Census AmericanCommunity Survey via Esri, 2016
Update Frequency: Annually
Average Disposable Income
This chart shows the average disposableincome in an area, compared with othergeographies.
Data Source: U.S. Census AmericanCommunity Survey via Esri, 2016
Update Frequency: Annually
Calhoun, GA 30701: Economic Comparison
Calhoun, GA 30701
Copyright 2018 Realtors Property Resource® LLC. All Rights Reserved. Information is not guaranteed. Equal Housing Opportunity. 2/13/2018
Gordon County
Georgia
USA
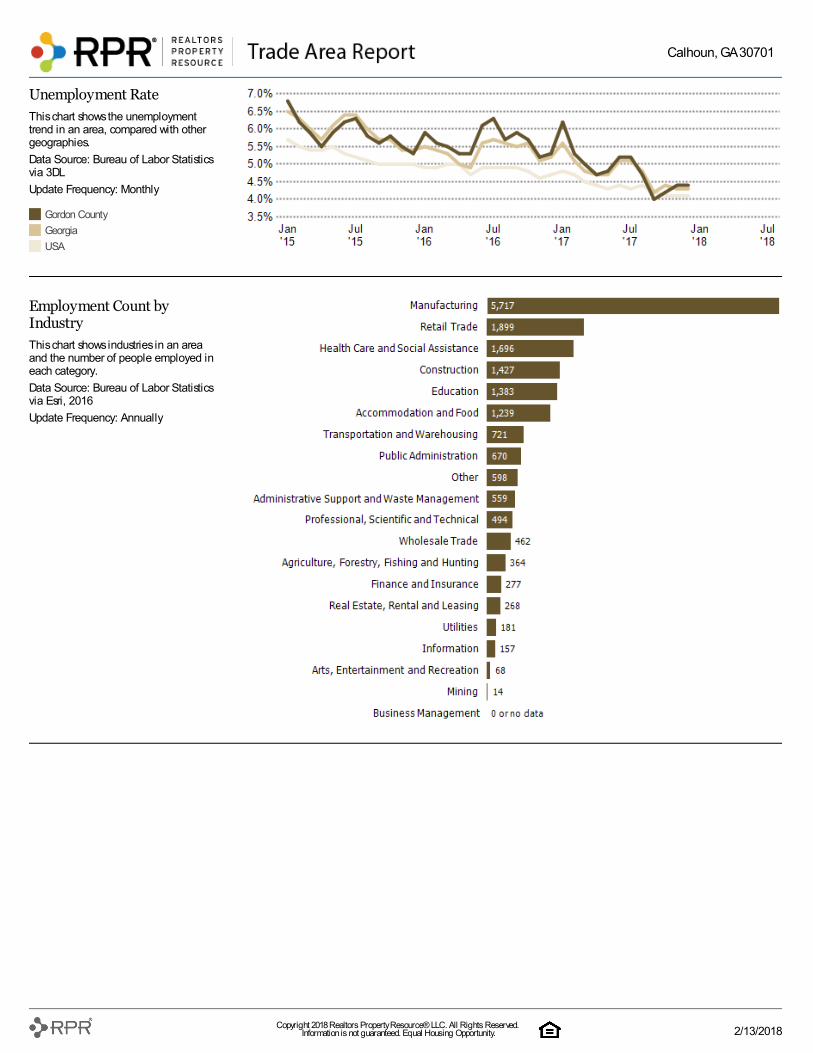
Unemployment Rate
This chart shows the unemploymenttrend in an area, compared with othergeographies.
Data Source: Bureau of Labor Statisticsvia 3DL
Update Frequency: Monthly
Employment Count byIndustry
This chart shows industries in an areaand the number of people employed ineach category.
Data Source: Bureau of Labor Statisticsvia Esri, 2016
Update Frequency: Annually
Calhoun, GA 30701
Copyright 2018 Realtors Property Resource® LLC. All Rights Reserved. Information is not guaranteed. Equal Housing Opportunity. 2/13/2018
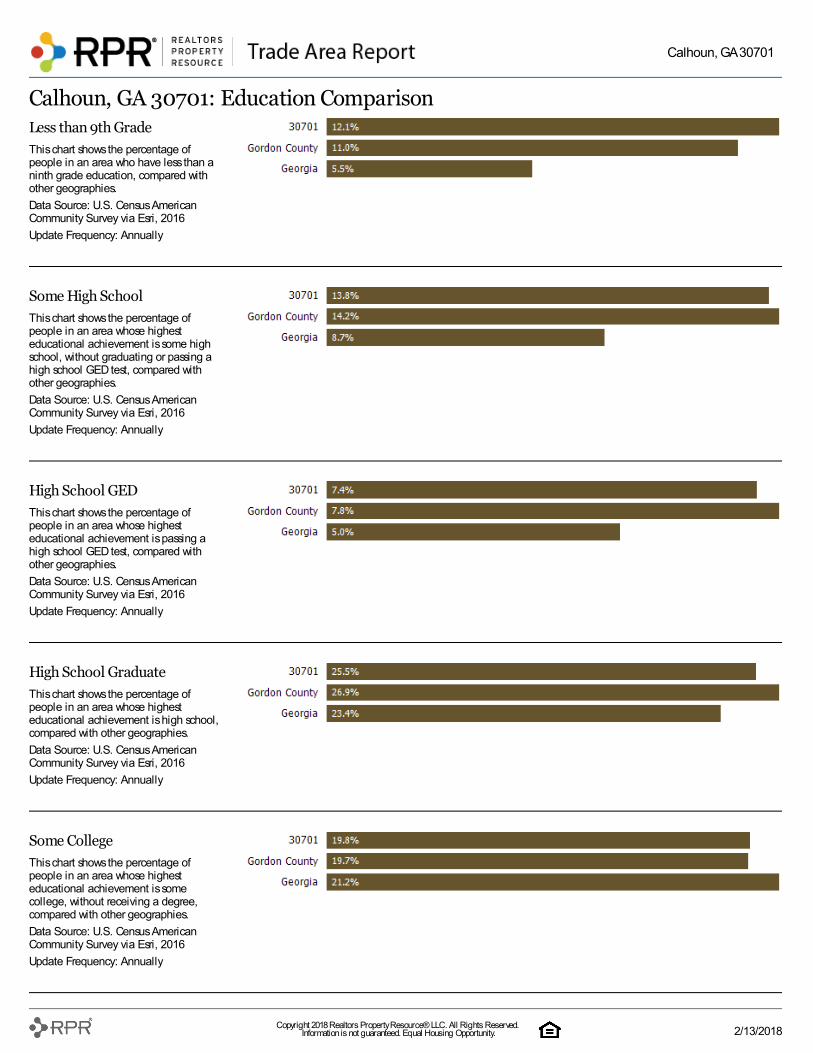
Less than 9th Grade
This chart shows the percentage ofpeople in an area who have less than aninth grade education, compared withother geographies.
Data Source: U.S. Census AmericanCommunity Survey via Esri, 2016
Update Frequency: Annually
Some High School
This chart shows the percentage ofpeople in an area whose highesteducational achievement is some highschool, without graduating or passing ahigh school GED test, compared withother geographies.
Data Source: U.S. Census AmericanCommunity Survey via Esri, 2016
Update Frequency: Annually
High School GED
This chart shows the percentage ofpeople in an area whose highesteducational achievement is passing ahigh school GED test, compared withother geographies.
Data Source: U.S. Census AmericanCommunity Survey via Esri, 2016
Update Frequency: Annually
High School Graduate
This chart shows the percentage ofpeople in an area whose highesteducational achievement is high school,compared with other geographies.
Data Source: U.S. Census AmericanCommunity Survey via Esri, 2016
Update Frequency: Annually
Some College
This chart shows the percentage ofpeople in an area whose highesteducational achievement is somecollege, without receiving a degree,compared with other geographies.
Data Source: U.S. Census AmericanCommunity Survey via Esri, 2016
Update Frequency: Annually
Calhoun, GA 30701: Education Comparison
Calhoun, GA 30701
Copyright 2018 Realtors Property Resource® LLC. All Rights Reserved. Information is not guaranteed. Equal Housing Opportunity. 2/13/2018
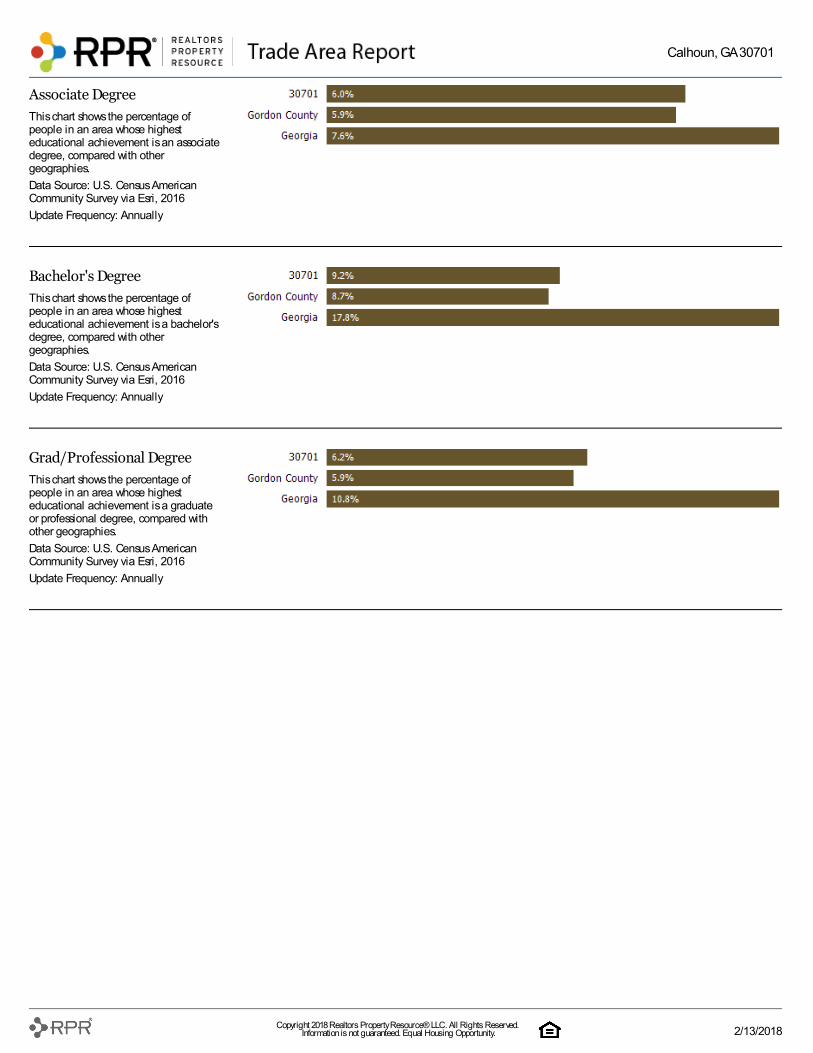
Associate Degree
This chart shows the percentage ofpeople in an area whose highesteducational achievement is an associatedegree, compared with othergeographies.
Data Source: U.S. Census AmericanCommunity Survey via Esri, 2016
Update Frequency: Annually
Bachelor's Degree
This chart shows the percentage ofpeople in an area whose highesteducational achievement is a bachelor'sdegree, compared with othergeographies.
Data Source: U.S. Census AmericanCommunity Survey via Esri, 2016
Update Frequency: Annually
Grad/Professional Degree
This chart shows the percentage ofpeople in an area whose highesteducational achievement is a graduateor professional degree, compared withother geographies.
Data Source: U.S. Census AmericanCommunity Survey via Esri, 2016
Update Frequency: Annually
Calhoun, GA 30701
Copyright 2018 Realtors Property Resource® LLC. All Rights Reserved. Information is not guaranteed. Equal Housing Opportunity. 2/13/2018
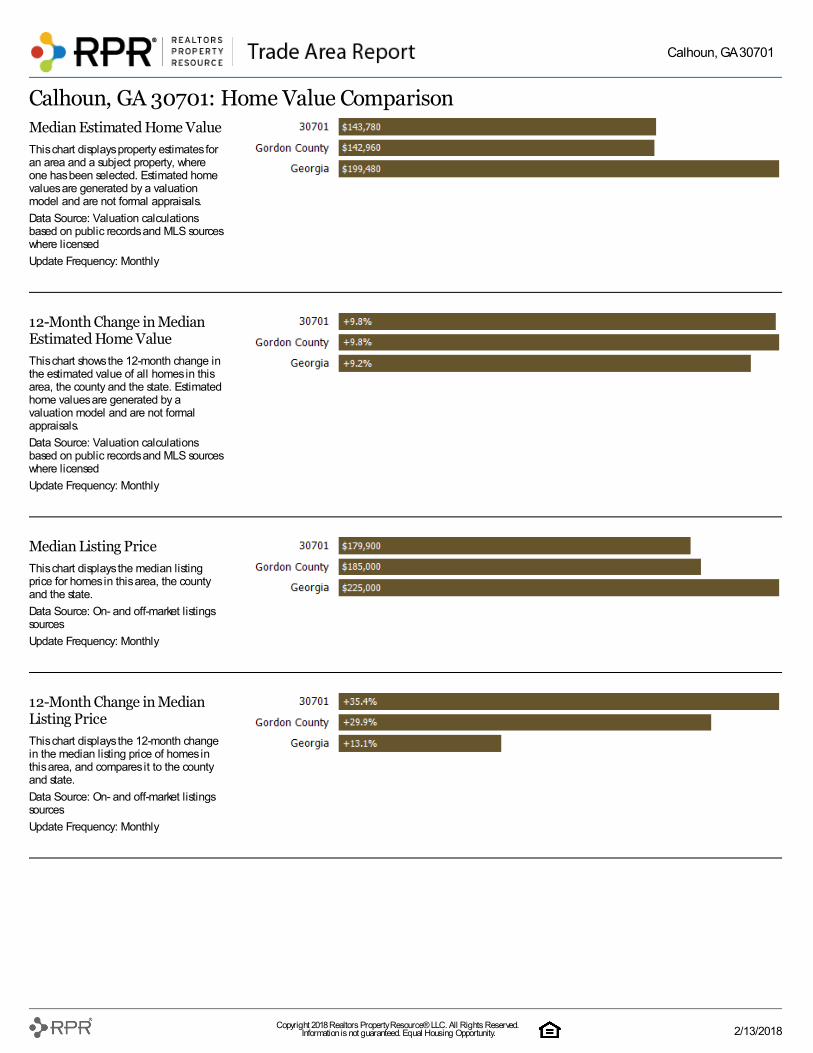
Median Estimated Home Value
This chart displays property estimates foran area and a subject property, whereone has been selected. Estimated homevalues are generated by a valuationmodel and are not formal appraisals.
Data Source: Valuation calculationsbased on public records and MLS sourceswhere licensed
Update Frequency: Monthly
12-Month Change in MedianEstimated Home Value
This chart shows the 12-month change inthe estimated value of all homes in thisarea, the county and the state. Estimatedhome values are generated by avaluation model and are not formalappraisals.
Data Source: Valuation calculationsbased on public records and MLS sourceswhere licensed
Update Frequency: Monthly
Median Listing Price
This chart displays the median listingprice for homes in this area, the countyand the state.
Data Source: On- and off-market listingssources
Update Frequency: Monthly
12-Month Change in MedianListing Price
This chart displays the 12-month changein the median listing price of homes inthis area, and compares it to the countyand state.
Data Source: On- and off-market listingssources
Update Frequency: Monthly
Calhoun, GA 30701: Home Value Comparison
Calhoun, GA 30701
Copyright 2018 Realtors Property Resource® LLC. All Rights Reserved. Information is not guaranteed. Equal Housing Opportunity. 2/13/2018
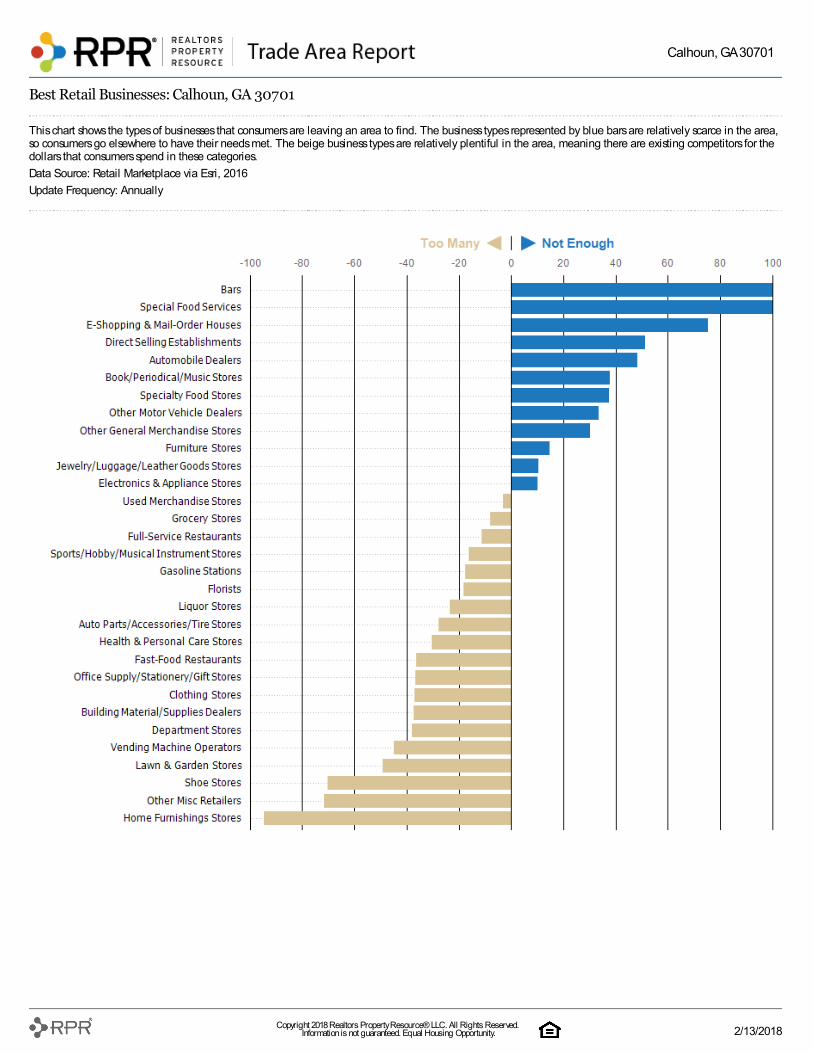
Best Retail Businesses: Calhoun, GA 30701
This chart shows the types of businesses that consumers are leaving an area to find. The business types represented by blue bars are relatively scarce in the area,so consumers go elsewhere to have their needs met. The beige business types are relatively plentiful in the area, meaning there are existing competitors for thedollars that consumers spend in these categories.
Data Source: Retail Marketplace via Esri, 2016
Update Frequency: Annually
Calhoun, GA 30701
Copyright 2018 Realtors Property Resource® LLC. All Rights Reserved. Information is not guaranteed. Equal Housing Opportunity. 2/13/2018