Embed Size (px)
Citation preview
UNITED STATESSECURITIES AND EXCHANGE COMMISSION
WASHINGTON, D.C. 20549________________________________________
FORM 10-K(Mark One)
x ANNUAL REPORT PURSUANT TO SECTION 13 OR 15(d) OF THE SECURITIESEXCHANGE ACT OF 1934
For the fiscal year ended December 30, 2017OR
o TRANSITION REPORT PURSUANT TO SECTION 13 OR 15(d) OF THESECURITIES EXCHANGE ACT OF 1934
For the Transition period from to Commission file number 1-11657
________________________________________
TUPPERWARE BRANDS CORPORATION (Exact name of registrant as specified in its charter)
Delaware 36-4062333(State or other jurisdiction of incorporation or organization) (I.R.S. Employer Identification No.)
14901 South Orange Blossom Trail,Orlando, Florida 32837
(Address of principal executive offices) (Zip Code)
Registrant's telephone number, including area code: (407) 826-5050
Securities registered pursuant to Section 12(b) of the Act:Title of Each Class Name of Each Exchange on Which Registered
Common Stock, $0.01 par value New York Stock Exchange
Securities registered pursuant to Section 12(g) of the Act: None ________________________________________
Indicate by check mark if the Registrant is a well-known seasoned issuer, as defined in Rule 405 of the SecuritiesAct. Yes x No o
Indicate by check mark if the Registrant is not required to file reports pursuant to Section 13 or Section 15(d) of theAct. Yes o No x
Indicate by check mark whether the Registrant (1) has filed all reports required to be filed by Section 13 or 15(d) of the SecuritiesExchange Act of 1934 during the preceding 12 months (or for such shorter period that the Registrant was required to file such reports),and (2) has been subject to such filing requirements for the past 90 days. Yes x No o
Indicate by check mark whether the Registrant has submitted electronically and posted on its corporate Website, if any, everyInteractive Data File required to be submitted and posted pursuant to Rule 405 of Regulation S-T (§232.405 of this chapter) during thepreceding 12 months (or for such shorter period that the Registrant was required to submit and post such files). Yes x No o
Indicate by check mark if disclosure of delinquent filers pursuant to Item 405 of Regulation S-K (§229.405) is not containedherein, and will not be contained, to the best of Registrant's knowledge, in definitive proxy or information statements incorporated byreference in Part III of this Form 10-K or any amendment to this Form 10-K. x
Indicate by check mark whether the Registrant is a large accelerated filer, an accelerated filer, a non-accelerated filer, a smallerreporting company or an emerging growth company. See definitions of "large accelerated filer," "accelerated filer", "smaller reportingcompany" and "emerging growth company " in Rule 12b-2 of the Exchange Act.
Large accelerated filer x Accelerated filer o
Non-accelerated filer o (Do not check if a smaller reporting company) Smaller reporting company o
Emerging growth company o
If an emerging growth company, indicate by check mark if the registrant has elected not to use the extended transition period forcomplying with any new or revised financial accounting standards provided pursuant to Section 13(a) of the Exchange Act. o
Indicate by check mark whether the registrant is a shell company (as defined in Rule 12b-2 of the Exchange Act). Yes o No x

The aggregate market value of the voting and non-voting common equity held by non-affiliates on the New York Stock Exchange-Composite Transaction Listing on June 30, 2017 (the last business day of the registrant's most recently completed second fiscal quarter)was $3,561,932,309. For the purposes of making this calculation only, the registrant included all of its directors, executive officers andbeneficial owners of more than ten percent of its common stock.
As of February 22, 2018, 51,116,752 shares of the common stock, $0.01 par value, of the registrant were outstanding.
Documents Incorporated by Reference:Portions of the Proxy Statement relating to the Annual Meeting of Shareholders to be held May 9, 2018 are incorporated by
reference into Part III of this Report.
Table of Contents
Item Page
Part I
Item 1 Business .......................................................................................................................................... 1Item 1A Risk Factors .................................................................................................................................... 7Item 1B Unresolved Staff Comments........................................................................................................... 9Item 2 Properties ........................................................................................................................................ 10Item 3 Legal Proceedings........................................................................................................................... 10Item 4 Mine Safety Disclosures ................................................................................................................. 10
Part II
Item 5 Market for Registrant's Common Equity, Related Stockholder Matters and Issuer Purchases ofEquity Securities...................................................................................................................... 11
Item 5a Performance Graph......................................................................................................................... 11Item 5c Changes in Securities, Use of Proceeds and Issuer Purchases of Equity Securities....................... 12Item 6 Selected Financial Data .................................................................................................................. 13Item 7 Management's Discussion and Analysis of Financial Condition and Results of Operations ......... 15Item 7A Quantitative and Qualitative Disclosures About Market Risk........................................................ 38Item 8 Financial Statements and Supplementary Data .............................................................................. 43Item 9 Changes in and Disagreements With Accountants on Accounting and Financial Disclosure ........ 93Item 9A Controls and Procedures ................................................................................................................. 93Item 9B Other Information ........................................................................................................................... 93
Part III
Item 10 Directors, Executive Officers and Corporate Governance ............................................................. 94Item 11 Executive Compensation ................................................................................................................ 94Item 12 Security Ownership of Certain Beneficial Owners and Management and Related Stockholder
Matters ..................................................................................................................................... 94Item 13 Certain Relationships and Related Transactions, and Director Independence ............................... 94Item 14 Principal Accounting Fees and Services......................................................................................... 94
Part IV
Item 15 Exhibits, Financial Statement Schedules........................................................................................ 9515 (a)(1) List of Financial Statements ............................................................................................ 9515 (a)(2) List of Financial Statement Schedules............................................................................. 9515 (a)(3) List of Exhibits ................................................................................................................ 95
Item 16 Form 10-K Summary...................................................................................................................... 98Signatures ........................................................................................................................................................ 99

PART I
1
Item 1. Business.
(a) General Development of Business
Tupperware Brands Corporation (“Registrant”, “Tupperware Brands” or the “Company”) is a global direct-to-consumer marketer of premium, innovative products across multiple brands and categories through an independentsales force of 3.2 million. Product brands and categories include design-centric preparation, storage and serving solutionsfor the kitchen and home through the Tupperware® brand and beauty and personal care products through the AvroyShlain®, Fuller®, NaturCare®, Nutrimetics® and Nuvo® brands. The Registrant is a Delaware corporation that wasorganized on February 8, 1996 in connection with the corporate reorganization of Premark International, Inc.(“Premark”).
(b) New York Stock Exchange-Required Disclosures
General. The address of the Registrant's principal office is 14901 South Orange Blossom Trail, Orlando, Florida32837. The names of the Registrant's directors are Catherine A. Bertini, Susan M. Cameron, Kriss Cloninger III, MegCrofton, E.V. Goings, Angel R. Martinez, Antonio Monteiro de Castro, David R. Parker, Richard T. Riley, Joyce M.Roché and M. Anne Szostak. Members of the Audit, Finance and Corporate Responsibility Committee of the Board ofDirectors are Mr. Monteiro de Castro (Chair), Mses. Bertini, Roché and Szostak and Mr. Riley. The members of theCompensation and Management Development Committee of the Board of Directors are Mr. Parker (Chair),Mses. Cameron and Crofton and Messrs. Cloninger and Martinez. The members of the Nominating and GovernanceCommittee of the Board of Directors are Mr. Cloninger (Chair), Messrs. Martinez, Monteiro de Castro and Parker andMs. Roché. The members of the Succession Sub-Committee are Mr. Cloninger (Chair), Messrs. Martinez and Parkerand Mses. Roché and Szostak. The members of the Executive Committee of the Board of Directors are Mr. Goings(Chair) and Messrs. Cloninger, Monteiro de Castro and Parker. The Chairman and Chief Executive Officer is Mr. Goingsand the Presiding Director is Mr. Cloninger. The Registrant's executive officers and the number of its employees areset forth below in Part I of this Report. The name and address of the Registrant's transfer agent and registrar is EquinitiTrust Company, c/o EQ Shareowner Services, 1110 Centre Pointe Curve, Suite 101, Mendota Heights, MN 55120. Thenumber of the Registrant's shareholders is set forth below in Part II, Item 5 of this Report.
Corporate Governance. Investors can obtain access to periodic reports and corporate governance documents,including board committee charters, corporate governance principles and codes of conduct and ethics for financialexecutives, and information regarding the Registrant's transfer agent and registrar through the Registrant's website freeof charge (as soon as reasonably practicable after reports are filed with the SEC, in the case of periodic reports) bygoing to www.tupperwarebrands.com, clicking on the “Investors” tab and searching under “Financial Information,”“Corporate Governance” or “IR Resources.”
BUSINESS OF TUPPERWARE BRANDS CORPORATION
The Registrant is a worldwide direct-to-consumer company engaged in the manufacture and sale of Tupperware®
brand products and cosmetics and personal care products under a variety of trade names, including Avroy Shlain®,Fuller®, NaturCare®, Nutrimetics® and Nuvo®. Each business manufactures and/or markets a broad line of high qualityproducts.
I. PRINCIPAL PRODUCTS
Tupperware. The core of the Tupperware brand product line consists of design-centric preparation, storage, andserving solutions for the kitchen and home. Tupperware also has established lines of cookware, knives, microwaveproducts, microfiber textiles, water-filtration related items and an array of products for on-the-go consumers. TheCompany has continued to refresh its traditional kitchen and home products with updated designs and incrementaltechnological enhancements while evolving towards more lifestyle-oriented products. These new lifestyle solutionsare based on consumer insights from the Company's market and product leaders around the globe.
In 2017, key launches to contemporize the Tupperware brand product offering included the Micro Urban Large 3in 1 Family-sized Rice and Pasta Cooker and Steamer for the microwave, Chef Series Pressure Cooker, MandoJunior*Vegetable and Fruit Slicer and SpeedyMando* Small Food Slicer. Other key launches included the 3L Universal Jar,a new generation of Storage and On the Go Usage containers and a Clear Storage Collection. The successful FusionMaster* System was expanded to include a new Sorbet Maker Accessory. The silicone baking range was expanded toinclude a ring and a rectangular brownie cutter. The Eco Bottle range was expanded to include “Minions” charactersunder license from Universal Studios Licensing LLC and a trophy shape under license from Fèdèration Internationalede Football Association.
The Company continues to introduce new materials, designs, colors and decoration in its product lines, to vary itsofferings including by season and to extend existing products into new markets. The development of new productsvaries across markets in order to address differences in cultures, lifestyles, tastes and needs, although most productsare offered in a large number of markets.
Research and development and the resultant new products will continue to be an important part of the Company'sstrategy going forward. See “Research and Development” in Part I, Item I of this Report for additional information onthe Company’s recent research and development.
Beauty. In Beauty, the Company manufactures and distributes skin and hair care products, cosmetics, bath andbody care, toiletries, fragrances, jewelry and nutritional products. There were a number of key product launches bybrand in 2017:
Fuller Cosmetics expanded its celebrity fragrances franchise introducing Vivir de Noche by Lucía Mendez andEdwin Luna & La Trakalosa, featuring a popular Mexican music star. Armand Dupree Black* Fragrance for him waslaunched in 2017. Other key fragrance launches included Colorfun Fruty*, Salvaggio Blue* and Sofisticada*. FullerCosmetics redesigned the Sensual Sensations* line with the focus to strengthen its hair care and skin care categories.Fuller Cosmetics repositioned the CF Colorfun* brand with the introduction of CF Colorfun* BFF water resistantmascara and a collection of matte lipsticks.
Tupperware Brands Brazil expanded the Nutrimetics* brand offerings by adding Nutrimetics Nutri-RichMoisturizing Body Satin and Nutrimetics Reserved Room* to its fragrance line and by launching its first celebrityendorsed fragrance, Nutrimetics Ocean.
Tupperware Brands Philippines continued to focus on its top two women’s fragrances: Ivana* and A LittleRomance*. The fragrance category was expanded to add Justice League characters Wonder Woman, Batman andSuperman, under license from Warner Bros. (F.E.) Inc.
Nutrimetics Australia’s Ultra Care+ Platinum Skin Care range added the Intense Skincare Programme, an innovativekit targeted for treating wrinkles, pigmentation and loss of firmness. The skin care category was expanded by addingUltra Care+ Clarifying Clay Treatment and Smart Shield* Protection Crème SPF50 and extending the NutrimeticsRestore* anti-ageing line. Professional Flawless Air* Serum Foundation was introduced under the NutrimeticsProfessional* Color Range.
Avroy Shlain re-branded its Colorfull* line under the CF Colorfun brand with a larger color palette and a newconcept eye shadow stick. Their fragrance category’s key launches included Premium Noir under the Black Diamond*brand and Isara*, Forever Be Mine Whisper and Forever Be Mine Temptation for ladies' fragrances, and the introductionof gift sets under the Coppelia* and Endangered* brands. Other key launches included Perfect Cover Foundation inthe Coppelia Colour* range, Argan oil under the Body Essence* brand in the personal care category and NutritiveFacial Oil under the Nucelle* brand in the skin care category.
(Words followed by * are registered or unregistered trademarks of the Registrant.)
2
II. RECENT DEVELOPMENTS AND MARKETS
In July 2017, the Company announced that it would wind down its Beauticontrol business. As a result of the windingdown of the Beauticontrol business, the Company changed its segment reporting in the fourth quarter of 2017. Priorto the change, the Company had five reporting segments in four broad geographic regions.
Effective as of the fourth quarter of 2017, the Company combined its Beauty North America and Tupperware NorthAmerica segments into one North America segment. The Company operates its business under four reporting segmentsin four broad geographic regions: (1) Europe (Europe, Africa and the Middle East), (2) Asia Pacific, (3) North Americaand (4) South America. Market penetration varies throughout the world. Several areas that have low penetration, suchas Latin America, Asia and Eastern and Central Europe, provide the Company significant growth potential. TheCompany's strategy continues to include greater penetration in markets throughout the world.
Tupperware Brands' products are sold around the world under six brands: Tupperware, Avroy Shlain, Fuller,NaturCare, Nutrimetics and Nuvo. The Company defines its established market economy units as those in WesternEurope (including Scandinavia), Australia, Canada, Japan, New Zealand and the United States. All other units areclassified as operating in emerging market economies. Businesses operating in emerging markets accounted for 69percent of 2017 sales, while businesses operating in established markets accounted for the other 31 percent. For thepast five fiscal years, 91 to 92 percent of total revenues from the sale of Tupperware Brands' products have been ininternational markets.
See Note 15 to the Consolidated Financial Statements in Part II, Item 8 of this Report for further details regardingsegments and geographic areas.
III. DISTRIBUTION OF PRODUCTS
The Company's products are distributed worldwide primarily through the “direct-to-consumer” method, underwhich products are sold by an independent sales force to consumers outside traditional retail store locations. The systemfacilitates the timely distribution of products to consumers, without having to work through retail intermediaries, andestablishes uniform practices regarding the use of Tupperware Brands' trademarks and administrative arrangements,such as order entry, delivery and payment, along with the addition and training of new sales force members.
Products are primarily sold directly to distributors, directors, managers and dealers (“sales force”) throughout theworld. Where distributorships are granted, they have the right to market the Company's products using parties and othernon-retail methods and to utilize Tupperware Brands' trademarks, pursuant to certain limitations. The vast majority ofthe sales force members are independent contractors and not employees of Tupperware. In certain limited circumstances,the Company has acquired ownership of distributorships for a period of time, until an independent distributor can beinstalled, in order to maintain market presence.
In addition to the introduction of new products and development of new geographic markets, a key element of theCompany's strategy is expanding its business by increasing the size of its sales force. Under the system, distributors,directors, team leaders, managers and dealers add, train, and motivate a large number of dealers. Managers are developedfrom among the dealer group, and team leaders from among the manager group, and promoted to assist in adding,training and motivating dealers, while continuing to sell products.
As of December 30, 2017, the Company's distribution system had approximately 2,100 distributors, 112,300managers (including directors and team leaders) and 3.2 million dealers worldwide.
3
Tupperware has traditionally relied upon the group demonstration method of sales, which is designed to enablepurchasers to appreciate, through demonstration, the features and benefits of the Company's products. Groupdemonstrations are held in homes, offices, social clubs and other locations. Products are also promoted through brochuresmailed or given to people invited to attend demonstrations. Some business units utilize a campaign merchandisingsystem, whereby sales force members sell through brochures generated every two or three weeks, to their friends,neighbors and relatives. Sales of products are supported through programs of sales promotions, sales and training aidsand motivational conferences for the sales force. In addition, to support its sales force, the Company utilizes catalogs,television and magazine advertising, as well as various social media channels, which help to increase its sales levelswith hard-to-reach customers and generate leads for sales and new dealers. A significant portion of the Company'sbusiness is operated through distributors, many of whom stock inventory and fulfill orders of the sales force that aregenerally placed after orders have been received from end consumers. In other cases, the Company sells directly to thesales force, also generally after they have received a consumer order. In China, the Company operated at the end of2017 through 6,100 independent retail outlets, with heavy emphasis on digital marketing to acquire and sell to membersof the outlets that are end consumers.
In 2017, the Company continued to sell directly, and/or through its sales force, to end consumers via the Internet.It also entered into a limited number of business-to-business transactions, in which it sells products to a partner company.Sales through the Internet to end consumers and business-to-business transactions do not constitute a significant portionof the Company's sales.
IV. COMPETITION
There are many competitors to Tupperware Brands' businesses both domestically and internationally. The principalbases of competition generally are marketing, price, quality and innovation of products, as well as competition withother “direct-to-consumer” companies for sales personnel and demonstration dates. Due to the nature of the direct-to-consumer industry, it is critical that the Company provides a compelling earnings opportunity for the sales force, alongwith developing new and innovative products. The Company maintains its competitive position, in part, through theuse of strong incentives and promotional programs.
Through its Tupperware® brand, the Company competes in the food storage, serving and preparation, containers,toys and gifts categories. Through its beauty and personal care brands, the Company also competes in the skin care,cosmetics, toiletries, fragrances and nutritionals categories. The Company works to differentiate itself from itscompetitors through its brand names, product innovation, quality, value-added services, celebrity endorsements,technological sophistication, new product introductions and its channel of distribution, including the training, motivationand compensation arrangements for its independent sales forces.
V. EMPLOYEES
At December 30, 2017, the Registrant employed approximately 12,000 people, of whom approximately 1,000 werebased in the United States.
VI. RESEARCH AND DEVELOPMENT
The Registrant incurred $16.7 million, $18.3 million and $18.1 million for fiscal years 2017, 2016 and 2015,respectively, on research and development activities for new products and production processes.
VII. RAW MATERIALS
Many of the products manufactured by and for the Company require plastic resins that meet its specifications.These resins are purchased through various arrangements with a number of large chemical companies located in manyof the Company's markets. As a result, the Company has not experienced difficulties in obtaining adequate suppliesand generally has been successful in obtaining favorable resin prices on a relative basis. Research and developmentrelating to resins used in Tupperware® brand products is performed by both the Company and its suppliers.
4
Materials used in the Company's skin care, cosmetic and bath and body care products consist primarily of readilyavailable ingredients, containers and packaging materials. Such raw materials and components used in goodsmanufactured and assembled by the Company and through outsource arrangements are available from a number ofsources. To date, the Company has been able to secure an adequate supply of raw materials for its products, and itendeavors to maintain relationships with backup suppliers in an effort to ensure that no interruptions occur in itsoperations.
VIII. TRADEMARKS AND PATENTS
Tupperware Brands considers its trademarks and patents to be of material importance to its business; however,except for the Tupperware® trademark, Tupperware Brands is not dependent upon any single patent or trademark, orgroup of patents or trademarks. The Tupperware® trademark, as well as its other trademarks, is registered on a country-by-country basis. The current duration for such registration ranges from five years to ten years; however, each suchregistration may be renewed an unlimited number of times. The patents used in Tupperware Brands' business areregistered and maintained on a worldwide basis, with a variety of durations. Tupperware Brands has followed thepractice of applying for design and utility patents with respect to most of its significant patentable developments.
IX. ENVIRONMENTAL LAWS
Compliance with federal, state and local environmental protection laws has not had in the past, and is not expectedto have in the future, a material effect upon the Registrant's capital expenditures, liquidity, earnings or competitiveposition.
X. OTHER
Sales do not vary significantly on a quarterly basis; however, sales in the first and third quarter are generally lowerthan the other quarters in any year due to holiday schedules, vacations by dealers and their customers, as well as reducedpromotional activities during these periods. Sales generally increase in the fourth quarter, as it includes traditional gift-giving occasions in many markets and as children return to school and households refocus on activities that includeparty plan sales events and the use of the Company's housewares products, along with increased promotional activitiessupporting these opportunities.
Generally, there are no working capital practices or backlog conditions which are material to an understanding ofthe Registrant's business, although the Company does seek to minimize its net working capital position at the end ofeach fiscal year and normally generates a significant portion of its annual cash flow from operating activities in itsfourth quarter. The Registrant's business is not dependent on a small number of customers, nor is any of its businesssubject to renegotiation of profits or termination of contracts or subcontracts at the election of the United Statesgovernment.
5
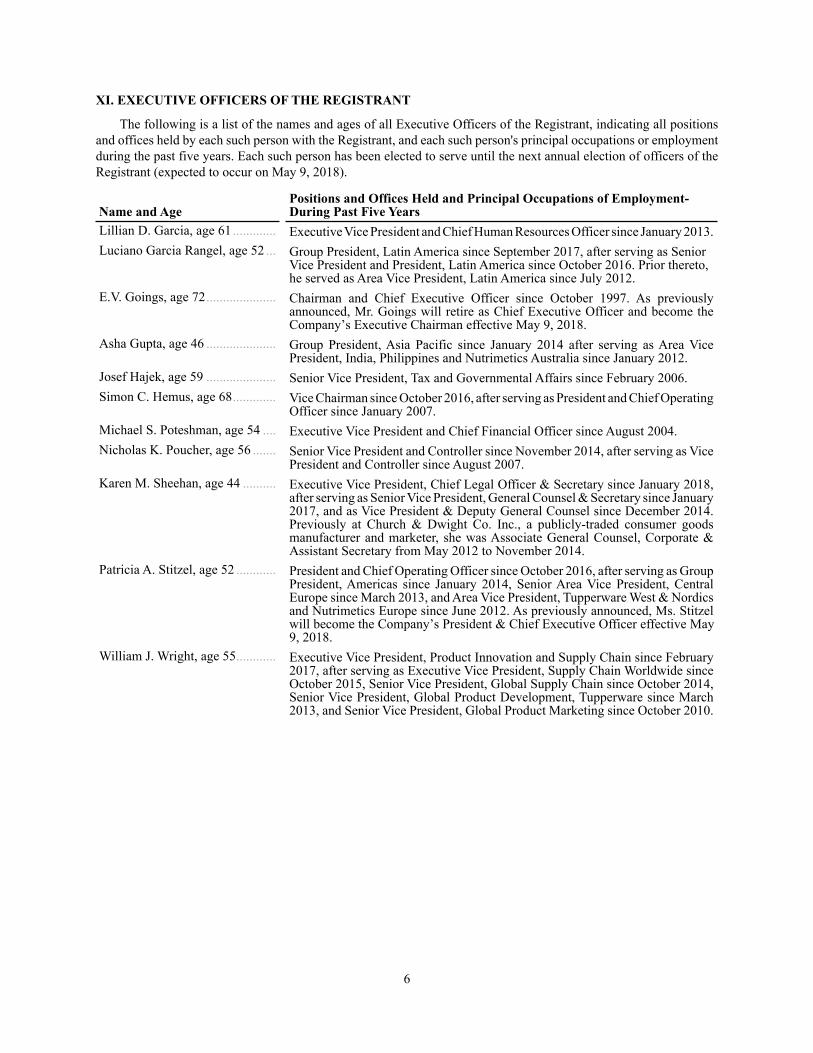
XI. EXECUTIVE OFFICERS OF THE REGISTRANT
The following is a list of the names and ages of all Executive Officers of the Registrant, indicating all positionsand offices held by each such person with the Registrant, and each such person's principal occupations or employmentduring the past five years. Each such person has been elected to serve until the next annual election of officers of theRegistrant (expected to occur on May 9, 2018).
Name and AgePositions and Offices Held and Principal Occupations of Employment-During Past Five Years
Lillian D. Garcia, age 61 ............. Executive Vice President and Chief Human Resources Officer since January 2013.Luciano Garcia Rangel, age 52 ... Group President, Latin America since September 2017, after serving as Senior
Vice President and President, Latin America since October 2016. Prior thereto,he served as Area Vice President, Latin America since July 2012.
E.V. Goings, age 72..................... Chairman and Chief Executive Officer since October 1997. As previouslyannounced, Mr. Goings will retire as Chief Executive Officer and become theCompany’s Executive Chairman effective May 9, 2018.
Asha Gupta, age 46 ..................... Group President, Asia Pacific since January 2014 after serving as Area VicePresident, India, Philippines and Nutrimetics Australia since January 2012.
Josef Hajek, age 59 ..................... Senior Vice President, Tax and Governmental Affairs since February 2006.Simon C. Hemus, age 68............. Vice Chairman since October 2016, after serving as President and Chief Operating
Officer since January 2007.Michael S. Poteshman, age 54 .... Executive Vice President and Chief Financial Officer since August 2004.Nicholas K. Poucher, age 56 ....... Senior Vice President and Controller since November 2014, after serving as Vice
President and Controller since August 2007.Karen M. Sheehan, age 44 .......... Executive Vice President, Chief Legal Officer & Secretary since January 2018,
after serving as Senior Vice President, General Counsel & Secretary since January2017, and as Vice President & Deputy General Counsel since December 2014.Previously at Church & Dwight Co. Inc., a publicly-traded consumer goodsmanufacturer and marketer, she was Associate General Counsel, Corporate &Assistant Secretary from May 2012 to November 2014.
Patricia A. Stitzel, age 52 ............ President and Chief Operating Officer since October 2016, after serving as GroupPresident, Americas since January 2014, Senior Area Vice President, CentralEurope since March 2013, and Area Vice President, Tupperware West & Nordicsand Nutrimetics Europe since June 2012. As previously announced, Ms. Stitzelwill become the Company’s President & Chief Executive Officer effective May9, 2018.
William J. Wright, age 55............ Executive Vice President, Product Innovation and Supply Chain since February2017, after serving as Executive Vice President, Supply Chain Worldwide sinceOctober 2015, Senior Vice President, Global Supply Chain since October 2014,Senior Vice President, Global Product Development, Tupperware since March2013, and Senior Vice President, Global Product Marketing since October 2010.
6
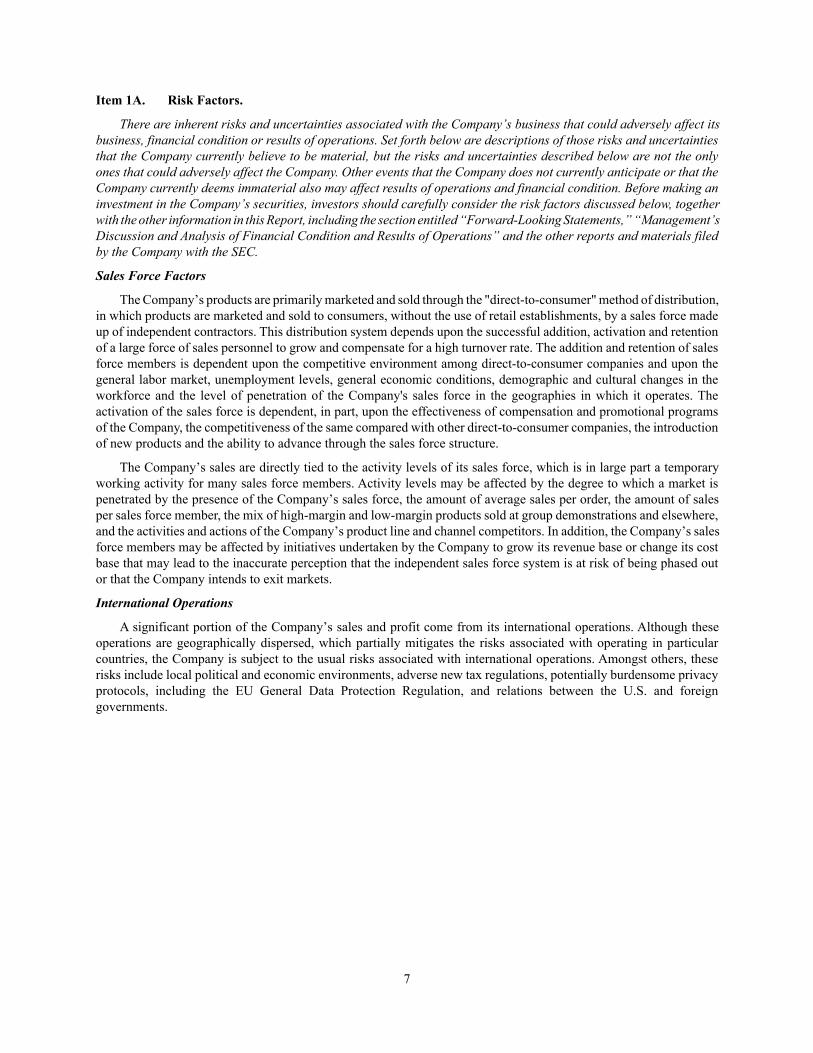
Item 1A. Risk Factors.
There are inherent risks and uncertainties associated with the Company’s business that could adversely affect itsbusiness, financial condition or results of operations. Set forth below are descriptions of those risks and uncertaintiesthat the Company currently believe to be material, but the risks and uncertainties described below are not the onlyones that could adversely affect the Company. Other events that the Company does not currently anticipate or that theCompany currently deems immaterial also may affect results of operations and financial condition. Before making aninvestment in the Company’s securities, investors should carefully consider the risk factors discussed below, togetherwith the other information in this Report, including the section entitled “Forward-Looking Statements,” “Management’sDiscussion and Analysis of Financial Condition and Results of Operations” and the other reports and materials filedby the Company with the SEC.
Sales Force Factors
The Company’s products are primarily marketed and sold through the "direct-to-consumer" method of distribution,in which products are marketed and sold to consumers, without the use of retail establishments, by a sales force madeup of independent contractors. This distribution system depends upon the successful addition, activation and retentionof a large force of sales personnel to grow and compensate for a high turnover rate. The addition and retention of salesforce members is dependent upon the competitive environment among direct-to-consumer companies and upon thegeneral labor market, unemployment levels, general economic conditions, demographic and cultural changes in theworkforce and the level of penetration of the Company's sales force in the geographies in which it operates. Theactivation of the sales force is dependent, in part, upon the effectiveness of compensation and promotional programsof the Company, the competitiveness of the same compared with other direct-to-consumer companies, the introductionof new products and the ability to advance through the sales force structure.
The Company’s sales are directly tied to the activity levels of its sales force, which is in large part a temporaryworking activity for many sales force members. Activity levels may be affected by the degree to which a market ispenetrated by the presence of the Company’s sales force, the amount of average sales per order, the amount of salesper sales force member, the mix of high-margin and low-margin products sold at group demonstrations and elsewhere,and the activities and actions of the Company’s product line and channel competitors. In addition, the Company’s salesforce members may be affected by initiatives undertaken by the Company to grow its revenue base or change its costbase that may lead to the inaccurate perception that the independent sales force system is at risk of being phased outor that the Company intends to exit markets.
International Operations
A significant portion of the Company’s sales and profit come from its international operations. Although theseoperations are geographically dispersed, which partially mitigates the risks associated with operating in particularcountries, the Company is subject to the usual risks associated with international operations. Amongst others, theserisks include local political and economic environments, adverse new tax regulations, potentially burdensome privacyprotocols, including the EU General Data Protection Regulation, and relations between the U.S. and foreigngovernments.
7
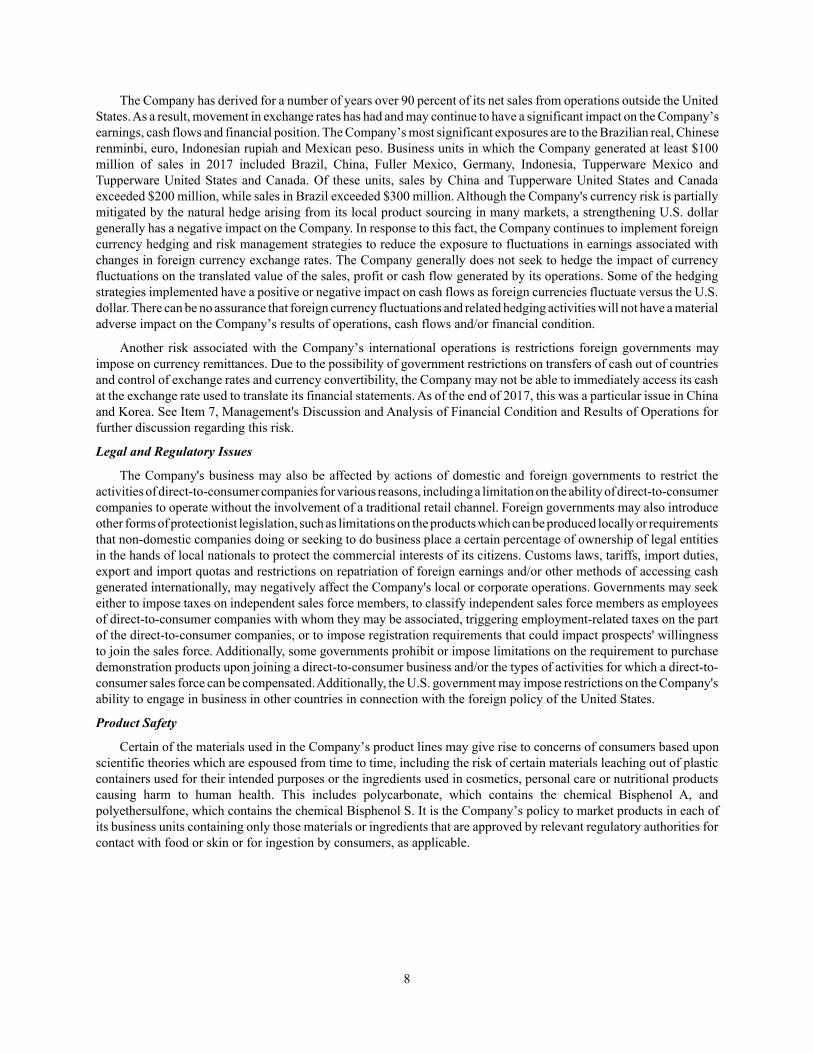
The Company has derived for a number of years over 90 percent of its net sales from operations outside the UnitedStates. As a result, movement in exchange rates has had and may continue to have a significant impact on the Company’searnings, cash flows and financial position. The Company’s most significant exposures are to the Brazilian real, Chineserenminbi, euro, Indonesian rupiah and Mexican peso. Business units in which the Company generated at least $100million of sales in 2017 included Brazil, China, Fuller Mexico, Germany, Indonesia, Tupperware Mexico andTupperware United States and Canada. Of these units, sales by China and Tupperware United States and Canadaexceeded $200 million, while sales in Brazil exceeded $300 million. Although the Company's currency risk is partiallymitigated by the natural hedge arising from its local product sourcing in many markets, a strengthening U.S. dollargenerally has a negative impact on the Company. In response to this fact, the Company continues to implement foreigncurrency hedging and risk management strategies to reduce the exposure to fluctuations in earnings associated withchanges in foreign currency exchange rates. The Company generally does not seek to hedge the impact of currencyfluctuations on the translated value of the sales, profit or cash flow generated by its operations. Some of the hedgingstrategies implemented have a positive or negative impact on cash flows as foreign currencies fluctuate versus the U.S.dollar. There can be no assurance that foreign currency fluctuations and related hedging activities will not have a materialadverse impact on the Company’s results of operations, cash flows and/or financial condition.
Another risk associated with the Company’s international operations is restrictions foreign governments mayimpose on currency remittances. Due to the possibility of government restrictions on transfers of cash out of countriesand control of exchange rates and currency convertibility, the Company may not be able to immediately access its cashat the exchange rate used to translate its financial statements. As of the end of 2017, this was a particular issue in Chinaand Korea. See Item 7, Management's Discussion and Analysis of Financial Condition and Results of Operations forfurther discussion regarding this risk.
Legal and Regulatory Issues
The Company's business may also be affected by actions of domestic and foreign governments to restrict theactivities of direct-to-consumer companies for various reasons, including a limitation on the ability of direct-to-consumercompanies to operate without the involvement of a traditional retail channel. Foreign governments may also introduceother forms of protectionist legislation, such as limitations on the products which can be produced locally or requirementsthat non-domestic companies doing or seeking to do business place a certain percentage of ownership of legal entitiesin the hands of local nationals to protect the commercial interests of its citizens. Customs laws, tariffs, import duties,export and import quotas and restrictions on repatriation of foreign earnings and/or other methods of accessing cashgenerated internationally, may negatively affect the Company's local or corporate operations. Governments may seekeither to impose taxes on independent sales force members, to classify independent sales force members as employeesof direct-to-consumer companies with whom they may be associated, triggering employment-related taxes on the partof the direct-to-consumer companies, or to impose registration requirements that could impact prospects' willingnessto join the sales force. Additionally, some governments prohibit or impose limitations on the requirement to purchasedemonstration products upon joining a direct-to-consumer business and/or the types of activities for which a direct-to-consumer sales force can be compensated. Additionally, the U.S. government may impose restrictions on the Company'sability to engage in business in other countries in connection with the foreign policy of the United States.
Product Safety
Certain of the materials used in the Company’s product lines may give rise to concerns of consumers based uponscientific theories which are espoused from time to time, including the risk of certain materials leaching out of plasticcontainers used for their intended purposes or the ingredients used in cosmetics, personal care or nutritional productscausing harm to human health. This includes polycarbonate, which contains the chemical Bisphenol A, andpolyethersulfone, which contains the chemical Bisphenol S. It is the Company’s policy to market products in each ofits business units containing only those materials or ingredients that are approved by relevant regulatory authorities forcontact with food or skin or for ingestion by consumers, as applicable.
8
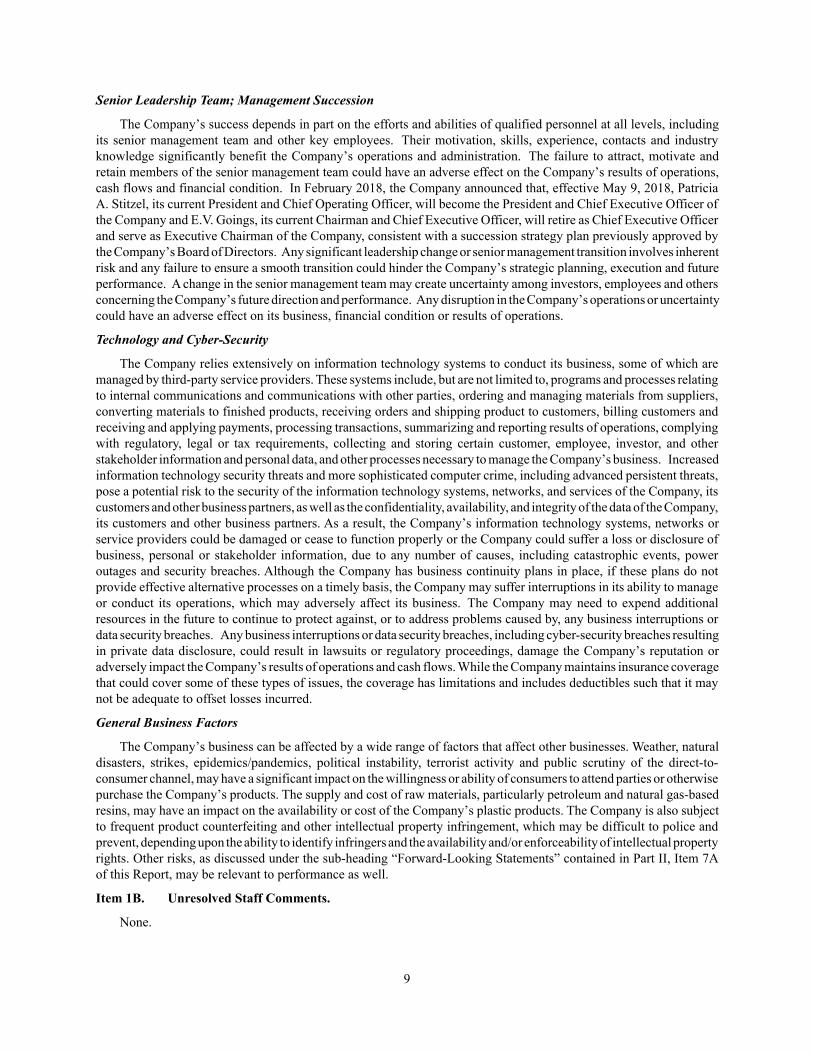
Senior Leadership Team; Management Succession
The Company’s success depends in part on the efforts and abilities of qualified personnel at all levels, includingits senior management team and other key employees. Their motivation, skills, experience, contacts and industryknowledge significantly benefit the Company’s operations and administration. The failure to attract, motivate andretain members of the senior management team could have an adverse effect on the Company’s results of operations,cash flows and financial condition. In February 2018, the Company announced that, effective May 9, 2018, PatriciaA. Stitzel, its current President and Chief Operating Officer, will become the President and Chief Executive Officer ofthe Company and E.V. Goings, its current Chairman and Chief Executive Officer, will retire as Chief Executive Officerand serve as Executive Chairman of the Company, consistent with a succession strategy plan previously approved bythe Company’s Board of Directors. Any significant leadership change or senior management transition involves inherentrisk and any failure to ensure a smooth transition could hinder the Company’s strategic planning, execution and futureperformance. A change in the senior management team may create uncertainty among investors, employees and othersconcerning the Company’s future direction and performance. Any disruption in the Company’s operations or uncertaintycould have an adverse effect on its business, financial condition or results of operations.
Technology and Cyber-Security
The Company relies extensively on information technology systems to conduct its business, some of which aremanaged by third-party service providers. These systems include, but are not limited to, programs and processes relatingto internal communications and communications with other parties, ordering and managing materials from suppliers,converting materials to finished products, receiving orders and shipping product to customers, billing customers andreceiving and applying payments, processing transactions, summarizing and reporting results of operations, complyingwith regulatory, legal or tax requirements, collecting and storing certain customer, employee, investor, and otherstakeholder information and personal data, and other processes necessary to manage the Company’s business. Increasedinformation technology security threats and more sophisticated computer crime, including advanced persistent threats,pose a potential risk to the security of the information technology systems, networks, and services of the Company, itscustomers and other business partners, as well as the confidentiality, availability, and integrity of the data of the Company,its customers and other business partners. As a result, the Company’s information technology systems, networks orservice providers could be damaged or cease to function properly or the Company could suffer a loss or disclosure ofbusiness, personal or stakeholder information, due to any number of causes, including catastrophic events, poweroutages and security breaches. Although the Company has business continuity plans in place, if these plans do notprovide effective alternative processes on a timely basis, the Company may suffer interruptions in its ability to manageor conduct its operations, which may adversely affect its business. The Company may need to expend additionalresources in the future to continue to protect against, or to address problems caused by, any business interruptions ordata security breaches. Any business interruptions or data security breaches, including cyber-security breaches resultingin private data disclosure, could result in lawsuits or regulatory proceedings, damage the Company’s reputation oradversely impact the Company’s results of operations and cash flows. While the Company maintains insurance coveragethat could cover some of these types of issues, the coverage has limitations and includes deductibles such that it maynot be adequate to offset losses incurred.
General Business Factors
The Company’s business can be affected by a wide range of factors that affect other businesses. Weather, naturaldisasters, strikes, epidemics/pandemics, political instability, terrorist activity and public scrutiny of the direct-to-consumer channel, may have a significant impact on the willingness or ability of consumers to attend parties or otherwisepurchase the Company’s products. The supply and cost of raw materials, particularly petroleum and natural gas-basedresins, may have an impact on the availability or cost of the Company’s plastic products. The Company is also subjectto frequent product counterfeiting and other intellectual property infringement, which may be difficult to police andprevent, depending upon the ability to identify infringers and the availability and/or enforceability of intellectual propertyrights. Other risks, as discussed under the sub-heading “Forward-Looking Statements” contained in Part II, Item 7Aof this Report, may be relevant to performance as well.
9
Item 1B. Unresolved Staff Comments.
None.
Item 2. Properties.
The principal executive office of the Registrant is owned by the Registrant and is located in Orlando, Florida. TheRegistrant owns and maintains significant manufacturing and/or distribution facilities in Australia, Brazil, France,Greece, Indonesia, Japan, Korea, Mexico, New Zealand, Portugal, South Africa and the United States, and leasesmanufacturing and distribution facilities in Belgium, China, India and Venezuela. The Registrant owns and maintainsthe headquarters in India and leases the former Beauticontrol manufacturing and distribution facility in Texas. TheRegistrant is seeking to sub-lease the Beauticontrol facility as well as planning to close and dispose of its manufacturingand distribution facility in France, and its distribution facilities in Australia and Japan in connection with the Company'srestructuring plan announced in July 2017 .
The Registrant conducts a continuing program of new product design and development at its facilities in Florida,Australia, Belgium and Mexico. None of the owned principal properties is subject to any encumbrance material to theconsolidated operations of the Company. Notwithstanding the planned dispositions noted above the Registrant considersthe condition and extent of utilization of its plants, warehouses and other properties to be good and the nature of theproperties and the capacity of its plants and warehouses generally to be adequate for its needs.
In addition to the above-described improved properties, the Registrant owns unimproved real estate surroundingits corporate headquarters in Orlando, Florida. The Registrant prepared certain portions of this real estate for a varietyof development purposes and, in 2002, began selling parts of this property. To date, approximately 360 acres have beensold and about 200 acres remain to be sold in connection with this project that is expected to continue for a number ofyears.
10
Item 3. Legal Proceedings.
A number of ordinary-course legal and administrative proceedings against the Registrant or its subsidiaries arepending. In addition to such proceedings, there are certain proceedings that involve the discharge of materials into, orotherwise relating to the protection of, the environment. Certain of such proceedings involve federal environmentallaws such as the Comprehensive Environmental Response, Compensation and Liability Act of 1980, as well as stateand local laws. The Registrant has established reserves with respect to certain of such proceedings. Because of theinvolvement of other parties and the uncertainty of potential environmental impacts, the eventual outcomes of suchactions and the cost and timing of expenditures cannot be determined with certainty. It is not expected that the outcomeof such proceedings, either individually or in the aggregate, will have a material adverse effect upon the Registrant.
As part of the 1986 reorganization involving the formation of Premark, Premark was spun-off by Dart & Kraft,Inc., and Kraft Foods, Inc. assumed any liabilities arising out of any legal proceedings in connection with certaindivested or discontinued former businesses of Dart Industries Inc., a subsidiary of the Registrant, including mattersalleging product and environmental liability. The assumption of liabilities by Kraft Foods, Inc. remains effectivesubsequent to the distribution of the equity of the Registrant to Premark shareholders in 1996.
Item 4. Mine Safety Procedures.
Not applicable.
PART II
11
Item 5. Market for Registrant’s Common Equity, Related Stockholder Matters and Issuer Purchases ofEquity Securities.
The Registrant has not sold any securities in 2015 through 2017 that were not registered under the Securities Actof 1933 as amended. As of February 22, 2018, the Registrant had 66,898 shareholders of record and beneficial holders.The principal United States market on which the Registrant’s common stock is traded is the New York Stock Exchange.The stock price and dividend information set forth in the “Financing Activities” section of Management’s Discussionand Analysis of Financial Condition and Results of Operations in Part II, Item 7 of this Report and Note 19 to theConsolidated Financial Statements in Part II, Item 8 of this Report, entitled “Quarterly Financial Summary (Unaudited),”are incorporated by reference into this Item 5.
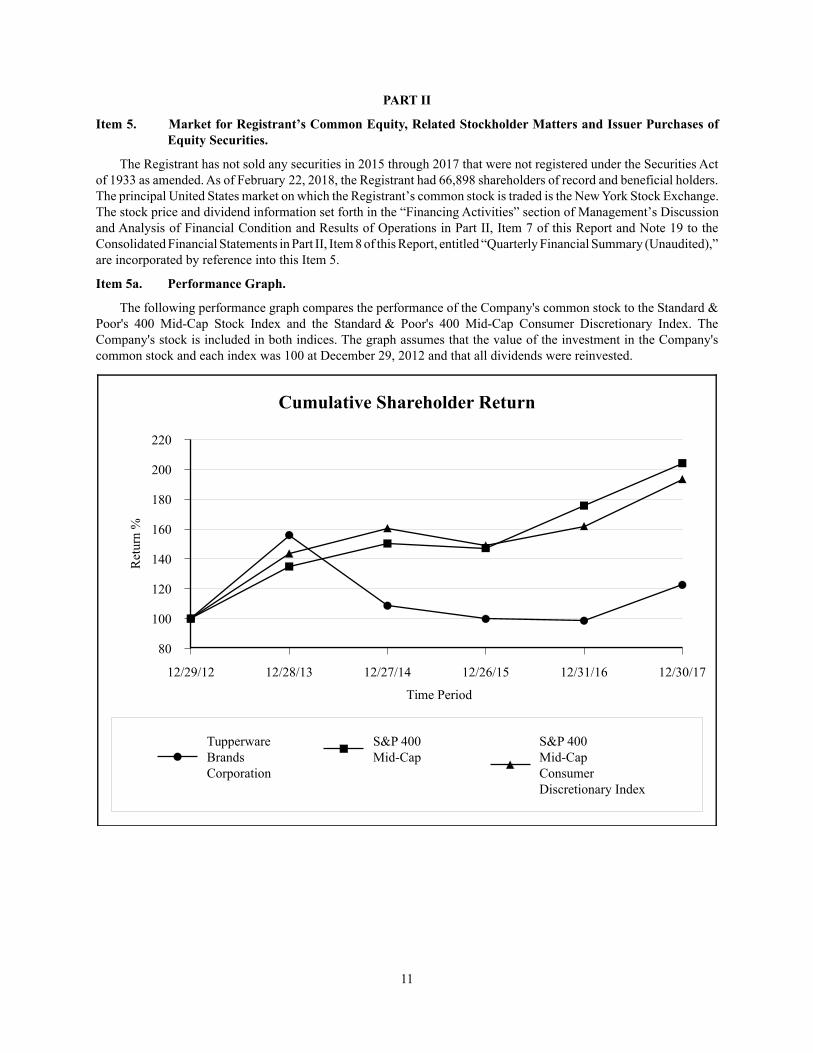
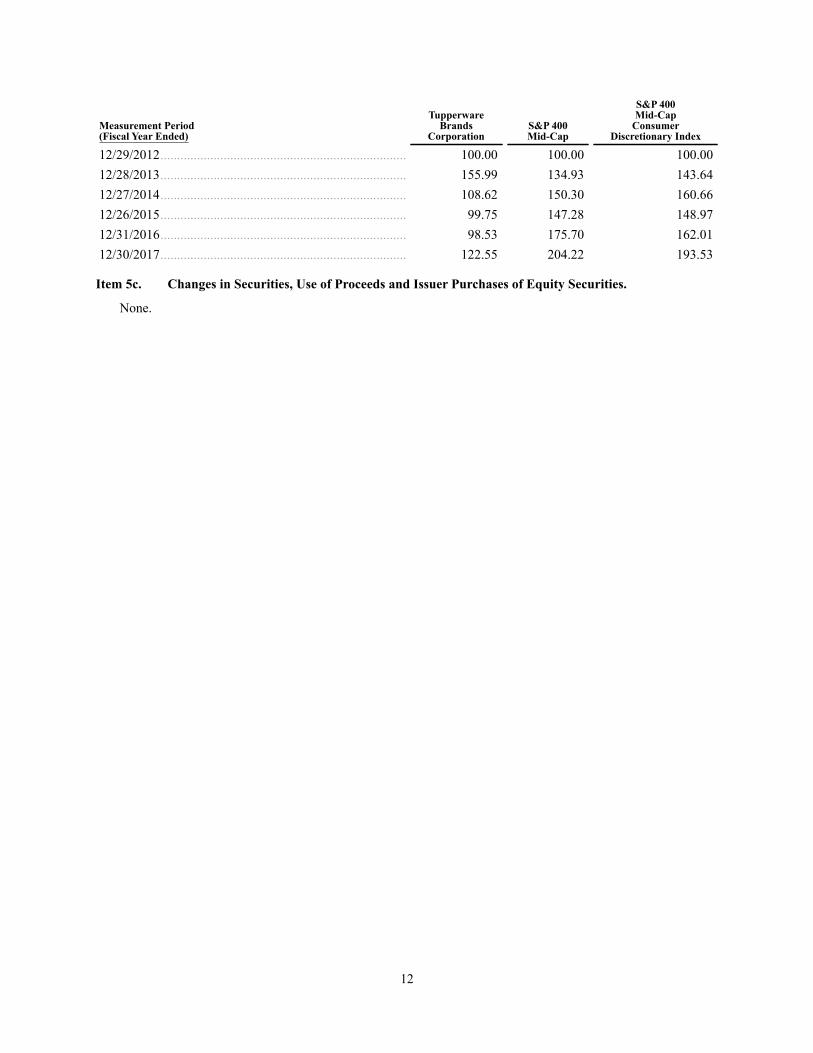
Item 5a. Performance Graph.
The following performance graph compares the performance of the Company's common stock to the Standard &Poor's 400 Mid-Cap Stock Index and the Standard & Poor's 400 Mid-Cap Consumer Discretionary Index. TheCompany's stock is included in both indices. The graph assumes that the value of the investment in the Company'scommon stock and each index was 100 at December 29, 2012 and that all dividends were reinvested.
TupperwareBrandsCorporation
S&P 400Mid-Cap
S&P 400Mid-CapConsumerDiscretionary Index
Cumulative Shareholder Return
220
200
180
160
140
120
100
80
Ret
urn
%
12/29/12 12/28/13 12/27/14 12/26/15 12/31/16 12/30/17
Time Period
Measurement Period(Fiscal Year Ended)
TupperwareBrands
CorporationS&P 400Mid-Cap
S&P 400Mid-Cap
ConsumerDiscretionary Index
12/29/2012.......................................................................... 100.00 100.00 100.0012/28/2013.......................................................................... 155.99 134.93 143.6412/27/2014.......................................................................... 108.62 150.30 160.6612/26/2015.......................................................................... 99.75 147.28 148.9712/31/2016.......................................................................... 98.53 175.70 162.0112/30/2017.......................................................................... 122.55 204.22 193.53
12
Item 5c. Changes in Securities, Use of Proceeds and Issuer Purchases of Equity Securities.
None.
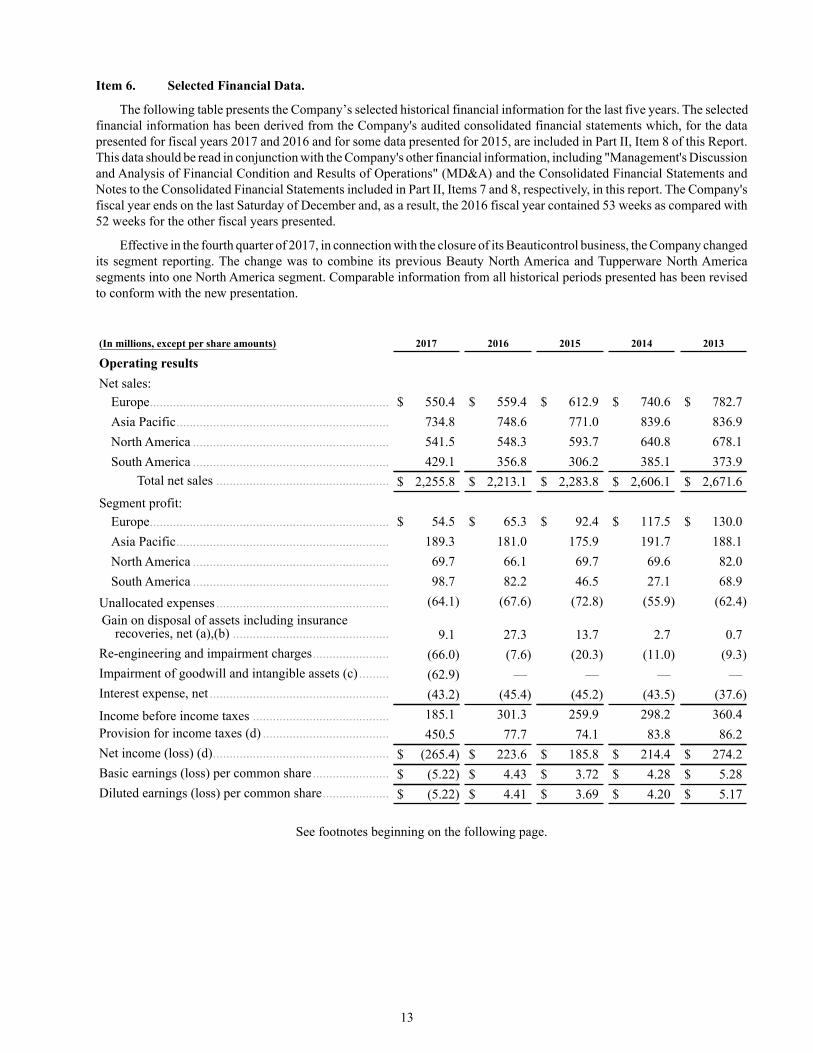
Item 6. Selected Financial Data.
The following table presents the Company’s selected historical financial information for the last five years. The selectedfinancial information has been derived from the Company's audited consolidated financial statements which, for the datapresented for fiscal years 2017 and 2016 and for some data presented for 2015, are included in Part II, Item 8 of this Report.This data should be read in conjunction with the Company's other financial information, including "Management's Discussionand Analysis of Financial Condition and Results of Operations" (MD&A) and the Consolidated Financial Statements andNotes to the Consolidated Financial Statements included in Part II, Items 7 and 8, respectively, in this report. The Company'sfiscal year ends on the last Saturday of December and, as a result, the 2016 fiscal year contained 53 weeks as compared with52 weeks for the other fiscal years presented.
Effective in the fourth quarter of 2017, in connection with the closure of its Beauticontrol business, the Company changedits segment reporting. The change was to combine its previous Beauty North America and Tupperware North Americasegments into one North America segment. Comparable information from all historical periods presented has been revisedto conform with the new presentation.
(In millions, except per share amounts) 2017 2016 2015 2014 2013
Operating resultsNet sales:
Europe........................................................................ $ 550.4 $ 559.4 $ 612.9 $ 740.6 $ 782.7Asia Pacific................................................................ 734.8 748.6 771.0 839.6 836.9North America ........................................................... 541.5 548.3 593.7 640.8 678.1South America ........................................................... 429.1 356.8 306.2 385.1 373.9
Total net sales .................................................... $ 2,255.8 $ 2,213.1 $ 2,283.8 $ 2,606.1 $ 2,671.6Segment profit:
Europe........................................................................ $ 54.5 $ 65.3 $ 92.4 $ 117.5 $ 130.0Asia Pacific................................................................ 189.3 181.0 175.9 191.7 188.1North America ........................................................... 69.7 66.1 69.7 69.6 82.0South America ........................................................... 98.7 82.2 46.5 27.1 68.9
Unallocated expenses .................................................... (64.1) (67.6) (72.8) (55.9) (62.4)Gain on disposal of assets including insurance
recoveries, net (a),(b) ............................................... 9.1 27.3 13.7 2.7 0.7Re-engineering and impairment charges....................... (66.0) (7.6) (20.3) (11.0) (9.3)Impairment of goodwill and intangible assets (c) ......... (62.9) — — — —Interest expense, net ...................................................... (43.2) (45.4) (45.2) (43.5) (37.6)Income before income taxes ......................................... 185.1 301.3 259.9 298.2 360.4Provision for income taxes (d) ...................................... 450.5 77.7 74.1 83.8 86.2Net income (loss) (d)..................................................... $ (265.4) $ 223.6 $ 185.8 $ 214.4 $ 274.2Basic earnings (loss) per common share....................... $ (5.22) $ 4.43 $ 3.72 $ 4.28 $ 5.28Diluted earnings (loss) per common share.................... $ (5.22) $ 4.41 $ 3.69 $ 4.20 $ 5.17
See footnotes beginning on the following page.
13
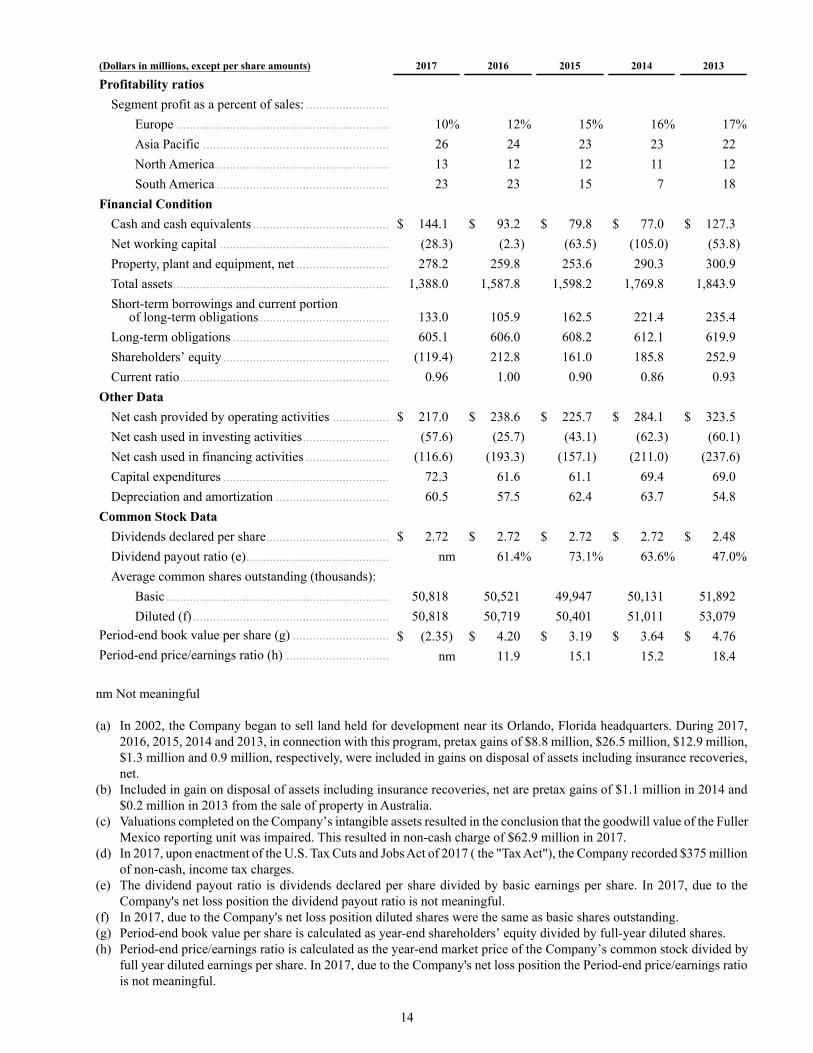
(Dollars in millions, except per share amounts) 2017 2016 2015 2014 2013
Profitability ratiosSegment profit as a percent of sales: .........................
Europe ................................................................ 10% 12% 15% 16% 17%Asia Pacific ........................................................ 26 24 23 23 22North America .................................................... 13 12 12 11 12South America .................................................... 23 23 15 7 18
Financial ConditionCash and cash equivalents ......................................... $ 144.1 $ 93.2 $ 79.8 $ 77.0 $ 127.3Net working capital ................................................... (28.3) (2.3) (63.5) (105.0) (53.8)Property, plant and equipment, net ............................ 278.2 259.8 253.6 290.3 300.9Total assets................................................................. 1,388.0 1,587.8 1,598.2 1,769.8 1,843.9Short-term borrowings and current portion
of long-term obligations....................................... 133.0 105.9 162.5 221.4 235.4Long-term obligations ............................................... 605.1 606.0 608.2 612.1 619.9Shareholders’ equity.................................................. (119.4) 212.8 161.0 185.8 252.9Current ratio............................................................... 0.96 1.00 0.90 0.86 0.93
Other DataNet cash provided by operating activities ................. $ 217.0 $ 238.6 $ 225.7 $ 284.1 $ 323.5Net cash used in investing activities.......................... (57.6) (25.7) (43.1) (62.3) (60.1)Net cash used in financing activities ......................... (116.6) (193.3) (157.1) (211.0) (237.6)Capital expenditures .................................................. 72.3 61.6 61.1 69.4 69.0Depreciation and amortization .................................. 60.5 57.5 62.4 63.7 54.8
Common Stock DataDividends declared per share..................................... $ 2.72 $ 2.72 $ 2.72 $ 2.72 $ 2.48Dividend payout ratio (e)........................................... nm 61.4% 73.1% 63.6% 47.0%Average common shares outstanding (thousands):
Basic ................................................................... 50,818 50,521 49,947 50,131 51,892Diluted (f) ........................................................... 50,818 50,719 50,401 51,011 53,079
Period-end book value per share (g) ............................. $ (2.35) $ 4.20 $ 3.19 $ 3.64 $ 4.76Period-end price/earnings ratio (h) ............................... nm 11.9 15.1 15.2 18.4
nm Not meaningful
(a) In 2002, the Company began to sell land held for development near its Orlando, Florida headquarters. During 2017,2016, 2015, 2014 and 2013, in connection with this program, pretax gains of $8.8 million, $26.5 million, $12.9 million,$1.3 million and 0.9 million, respectively, were included in gains on disposal of assets including insurance recoveries,net.
(b) Included in gain on disposal of assets including insurance recoveries, net are pretax gains of $1.1 million in 2014 and$0.2 million in 2013 from the sale of property in Australia.
(c) Valuations completed on the Company’s intangible assets resulted in the conclusion that the goodwill value of the FullerMexico reporting unit was impaired. This resulted in non-cash charge of $62.9 million in 2017.
(d) In 2017, upon enactment of the U.S. Tax Cuts and Jobs Act of 2017 ( the "Tax Act"), the Company recorded $375 millionof non-cash, income tax charges.
(e) The dividend payout ratio is dividends declared per share divided by basic earnings per share. In 2017, due to theCompany's net loss position the dividend payout ratio is not meaningful.
(f) In 2017, due to the Company's net loss position diluted shares were the same as basic shares outstanding.(g) Period-end book value per share is calculated as year-end shareholders’ equity divided by full-year diluted shares.(h) Period-end price/earnings ratio is calculated as the year-end market price of the Company’s common stock divided by
full year diluted earnings per share. In 2017, due to the Company's net loss position the Period-end price/earnings ratiois not meaningful.
14
Item 7. Management's Discussion and Analysis of Financial Condition and Results of Operations.
The following is a discussion of the results of operations for 2017 compared with 2016 and 2016 compared with2015, and changes in financial condition during 2017 and 2016. The Company’s fiscal year ends on the last Saturdayof December. As a result, the 2016 fiscal year included 53 weeks, as compared with 52 weeks for 2017 and 2015. Thisinformation should be read in conjunction with the consolidated financial information provided in Part II, Item 8 ofthis Annual Report.
The Company's primary means of distributing its products is through independent sales organizations andindividuals, which in many cases are also its customers. The vast majority of the Company's products are, in turn, soldto end customers who are not members of its sales force. The Company is largely dependent upon these independentsales organizations and individuals to reach end consumers, and any significant disruption of this distribution networkwould have a negative financial impact on the Company and its ability to generate sales, earnings and operating cashflows. The Company's primary business drivers are the size, activity, diversity and productivity of its independent salesorganizations.
As the impacts of foreign currency translation are an important factor in understanding period-to-periodcomparisons, the Company believes the presentation of results on a local currency basis, as a supplement to reportedresults, helps improve readers' ability to understand the Company's operating results and evaluate performance incomparison with prior periods. The Company presents local currency information that compares results between periodsas if current period exchange rates had been used to translate results in the prior period. The Company uses results ona local currency basis as one measure to evaluate performance. The Company generally refers to such amounts ascalculated on a "local currency" basis, or "excluding the impact of foreign currency." These results should be consideredin addition to, not as a substitute for, results reported in accordance with generally accepted accounting principles inthe United States ("GAAP"). Results on a local currency basis may not be comparable to similarly titled measures usedby other companies.
The Company defines established market economies as those in Western Europe (including Scandinavia), Australia,Canada, Japan, New Zealand, and the United States. All other countries are classified as having emerging marketeconomies.
Effective in the fourth quarter of 2017, in connection with the closure of its Beauticontrol business, the Companychanged its segment reporting. The change was to combine its previous Beauty North America and Tupperware NorthAmerica segments into one North America segment. Comparable information from all historical periods presented hasbeen revised to conform with the new presentation.
Estimates included herein are those of the Company’s management and are subject to the risks and uncertaintiesas described in the Forward Looking Statements caption included in Item 7A.
15
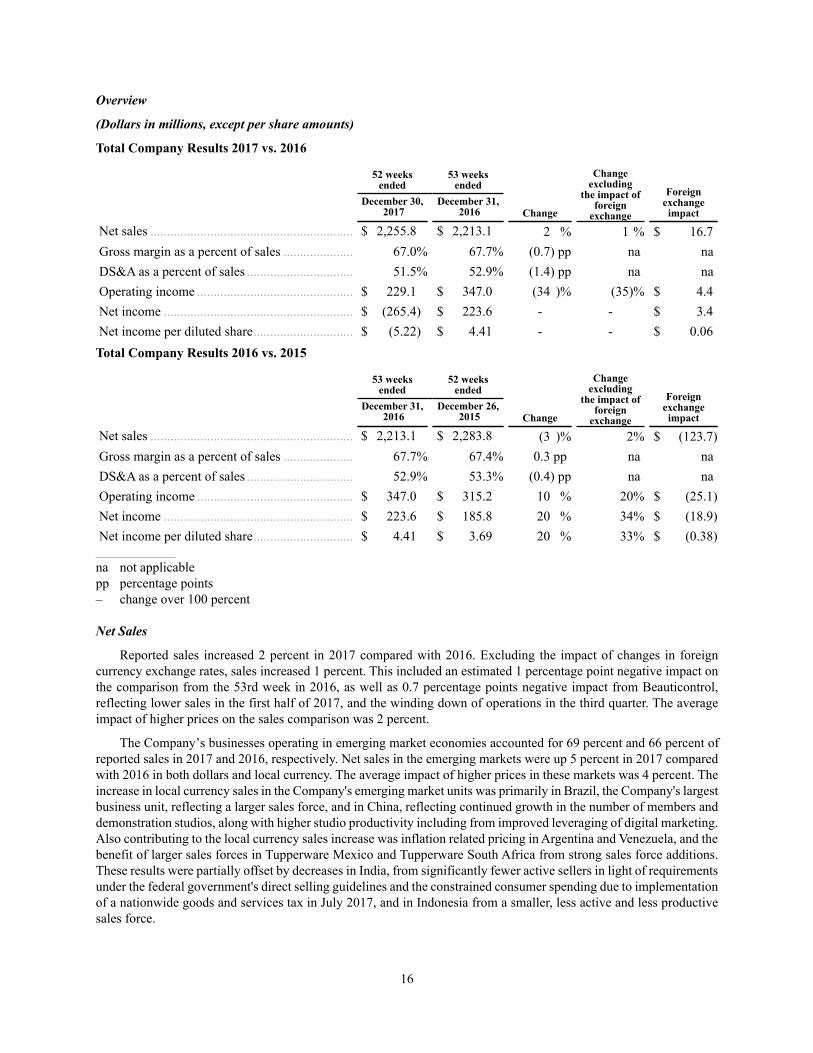
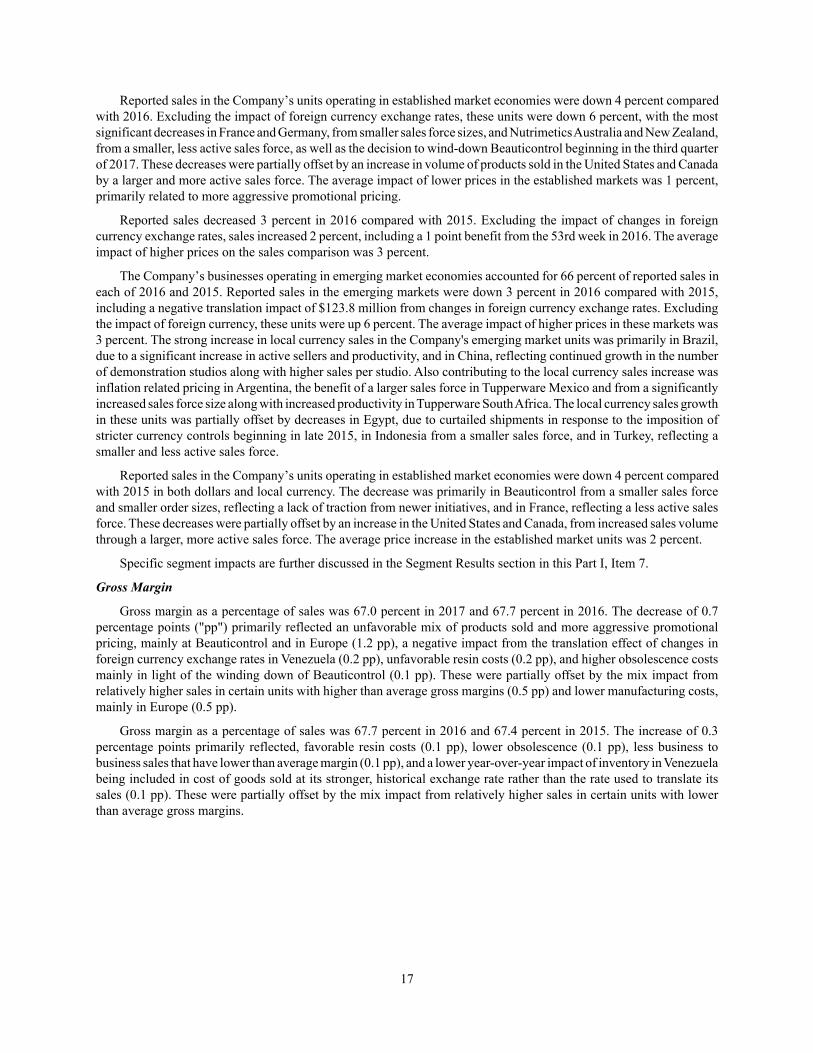
Overview
(Dollars in millions, except per share amounts)
Total Company Results 2017 vs. 2016
52 weeksended
53 weeksended
Change
Changeexcluding
the impact offoreign
exchange
Foreignexchangeimpact
December 30, 2017
December 31, 2016
Net sales ............................................................. $ 2,255.8 $ 2,213.1 2 % 1 % $ 16.7Gross margin as a percent of sales ..................... 67.0% 67.7% (0.7) pp na naDS&A as a percent of sales ................................ 51.5% 52.9% (1.4) pp na naOperating income ............................................... $ 229.1 $ 347.0 (34 )% (35)% $ 4.4Net income ......................................................... $ (265.4) $ 223.6 - - $ 3.4Net income per diluted share.............................. $ (5.22) $ 4.41 - - $ 0.06Total Company Results 2016 vs. 2015
53 weeksended
52 weeksended
Change
Changeexcluding
the impact offoreign
exchange
Foreignexchangeimpact
December 31, 2016
December 26, 2015
Net sales ............................................................. $ 2,213.1 $ 2,283.8 (3 )% 2% $ (123.7)Gross margin as a percent of sales ..................... 67.7% 67.4% 0.3 pp na naDS&A as a percent of sales ................................ 52.9% 53.3% (0.4) pp na naOperating income ............................................... $ 347.0 $ 315.2 10 % 20% $ (25.1)Net income ......................................................... $ 223.6 $ 185.8 20 % 34% $ (18.9)Net income per diluted share.............................. $ 4.41 $ 3.69 20 % 33% $ (0.38)
____________________
na not applicablepp percentage points– change over 100 percent
Net Sales
Reported sales increased 2 percent in 2017 compared with 2016. Excluding the impact of changes in foreigncurrency exchange rates, sales increased 1 percent. This included an estimated 1 percentage point negative impact onthe comparison from the 53rd week in 2016, as well as 0.7 percentage points negative impact from Beauticontrol,reflecting lower sales in the first half of 2017, and the winding down of operations in the third quarter. The averageimpact of higher prices on the sales comparison was 2 percent.
The Company’s businesses operating in emerging market economies accounted for 69 percent and 66 percent ofreported sales in 2017 and 2016, respectively. Net sales in the emerging markets were up 5 percent in 2017 comparedwith 2016 in both dollars and local currency. The average impact of higher prices in these markets was 4 percent. Theincrease in local currency sales in the Company's emerging market units was primarily in Brazil, the Company's largestbusiness unit, reflecting a larger sales force, and in China, reflecting continued growth in the number of members anddemonstration studios, along with higher studio productivity including from improved leveraging of digital marketing.Also contributing to the local currency sales increase was inflation related pricing in Argentina and Venezuela, and thebenefit of larger sales forces in Tupperware Mexico and Tupperware South Africa from strong sales force additions.These results were partially offset by decreases in India, from significantly fewer active sellers in light of requirementsunder the federal government's direct selling guidelines and the constrained consumer spending due to implementationof a nationwide goods and services tax in July 2017, and in Indonesia from a smaller, less active and less productivesales force.
16
Reported sales in the Company’s units operating in established market economies were down 4 percent comparedwith 2016. Excluding the impact of foreign currency exchange rates, these units were down 6 percent, with the mostsignificant decreases in France and Germany, from smaller sales force sizes, and Nutrimetics Australia and New Zealand,from a smaller, less active sales force, as well as the decision to wind-down Beauticontrol beginning in the third quarterof 2017. These decreases were partially offset by an increase in volume of products sold in the United States and Canadaby a larger and more active sales force. The average impact of lower prices in the established markets was 1 percent,primarily related to more aggressive promotional pricing.
Reported sales decreased 3 percent in 2016 compared with 2015. Excluding the impact of changes in foreigncurrency exchange rates, sales increased 2 percent, including a 1 point benefit from the 53rd week in 2016. The averageimpact of higher prices on the sales comparison was 3 percent.
The Company’s businesses operating in emerging market economies accounted for 66 percent of reported sales ineach of 2016 and 2015. Reported sales in the emerging markets were down 3 percent in 2016 compared with 2015,including a negative translation impact of $123.8 million from changes in foreign currency exchange rates. Excludingthe impact of foreign currency, these units were up 6 percent. The average impact of higher prices in these markets was3 percent. The strong increase in local currency sales in the Company's emerging market units was primarily in Brazil,due to a significant increase in active sellers and productivity, and in China, reflecting continued growth in the numberof demonstration studios along with higher sales per studio. Also contributing to the local currency sales increase wasinflation related pricing in Argentina, the benefit of a larger sales force in Tupperware Mexico and from a significantlyincreased sales force size along with increased productivity in Tupperware South Africa. The local currency sales growthin these units was partially offset by decreases in Egypt, due to curtailed shipments in response to the imposition ofstricter currency controls beginning in late 2015, in Indonesia from a smaller sales force, and in Turkey, reflecting asmaller and less active sales force.
Reported sales in the Company’s units operating in established market economies were down 4 percent comparedwith 2015 in both dollars and local currency. The decrease was primarily in Beauticontrol from a smaller sales forceand smaller order sizes, reflecting a lack of traction from newer initiatives, and in France, reflecting a less active salesforce. These decreases were partially offset by an increase in the United States and Canada, from increased sales volumethrough a larger, more active sales force. The average price increase in the established market units was 2 percent.
Specific segment impacts are further discussed in the Segment Results section in this Part I, Item 7.
Gross Margin
Gross margin as a percentage of sales was 67.0 percent in 2017 and 67.7 percent in 2016. The decrease of 0.7percentage points ("pp") primarily reflected an unfavorable mix of products sold and more aggressive promotionalpricing, mainly at Beauticontrol and in Europe (1.2 pp), a negative impact from the translation effect of changes inforeign currency exchange rates in Venezuela (0.2 pp), unfavorable resin costs (0.2 pp), and higher obsolescence costsmainly in light of the winding down of Beauticontrol (0.1 pp). These were partially offset by the mix impact fromrelatively higher sales in certain units with higher than average gross margins (0.5 pp) and lower manufacturing costs,mainly in Europe (0.5 pp).
Gross margin as a percentage of sales was 67.7 percent in 2016 and 67.4 percent in 2015. The increase of 0.3percentage points primarily reflected, favorable resin costs (0.1 pp), lower obsolescence (0.1 pp), less business tobusiness sales that have lower than average margin (0.1 pp), and a lower year-over-year impact of inventory in Venezuelabeing included in cost of goods sold at its stronger, historical exchange rate rather than the rate used to translate itssales (0.1 pp). These were partially offset by the mix impact from relatively higher sales in certain units with lowerthan average gross margins.
17
Operating Expenses
Delivery, sales and administrative expense ("DS&A") as a percentage of sales was 51.5 percent in 2017, comparedwith 52.9 percent in 2016. The lower DS&A expense reflected more efficient promotional spending primarily in AsiaPacific and Europe (0.8 pp), relatively higher sales in certain units with lower than average operating expenses (0.6pp), lower pension settlement costs (0.2 pp), a positive impact from the translation effect of changes in foreign currencyexchange rates (0.2 pp) and a lower marketing costs mainly in Europe (0.1 pp). Partially offsetting these decreases,was the higher distribution costs in Tupperware North America (0.2 pp) and higher bad debt expense in Europe andSouth America (0.3 pp).
DS&A as a percentage of sales was 52.9 percent in 2016, compared with 53.3 percent in 2015. The lower DS&Aexpense was primarily due to decreased administrative costs in Europe, investment spending in North America andunallocated corporate expenses from management incentives (0.6 pp). Lower marketing expenses in Asia Pacific andNorth America also contributed to the lower DS&A as a percent of sales (0.3 pp). Partially offsetting these decreaseswas the translation effect of changes in foreign currency exchange rates, particularly the impact of overall dollardenominated costs as a ratio of sales in light of weaker foreign exchange rates (0.4 pp).
The Company segregates corporate operating expenses into allocated and unallocated components based upon theestimated time spent managing segment operations. The allocated costs are then apportioned on a local currency basisto each segment based primarily upon segment revenues. The unallocated expenses reflect amounts unrelated to segmentoperations. Operating expenses to be allocated are determined at the beginning of the year based upon estimatedexpenditures. Total unallocated expenses in 2017 decreased $3.5 million compared with 2016, reflecting reducedcorporate marketing initiatives and higher allocation of costs to the segments, partially offset by increased managementincentive costs.
Total unallocated expenses in 2016 decreased $5.2 million compared with 2015, reflecting lower managementincentive costs and increased allocation to the segments, partially offset by the negative translation effect of changesin foreign currency exchange rates.
As discussed in Note 1 to the Consolidated Financial Statements in Part II, Item 8 of this Report, the Companyincludes costs related to the distribution of its products in DS&A expense. As a result, the Company’s gross marginmay not be comparable with other companies that include these elements in cost of products sold.
Re-engineering Costs
As the Company continuously evaluates its operating structure in light of current business conditions and strivesto maintain the most efficient possible structure, it periodically implements actions designed to reduce costs, improveoperating efficiency and otherwise transform its business. These actions often result in re-engineering costs related toheadcount reductions and to facility downsizing and closure, as well as related asset write downs and other costs thatmay be necessary in light of the revised operating landscape. In addition, the Company may recognize gains or lossesupon disposal of excess facilities or other activities directly related to its re-engineering efforts.
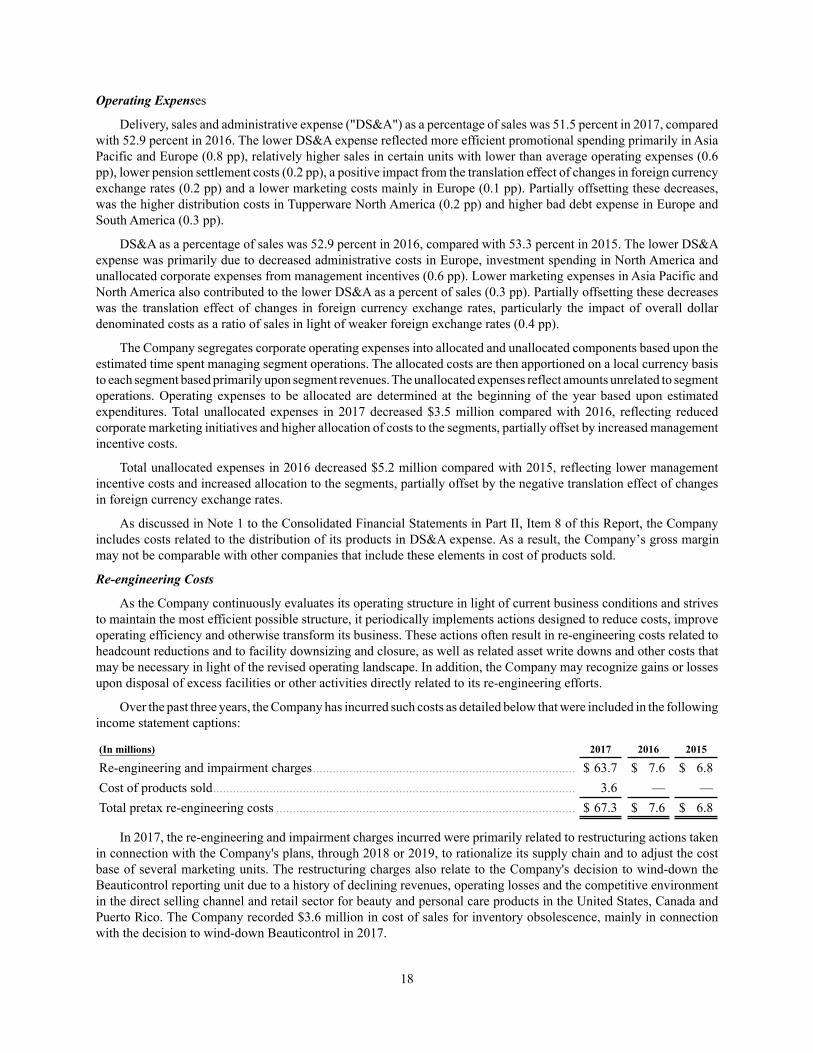
Over the past three years, the Company has incurred such costs as detailed below that were included in the followingincome statement captions:
(In millions) 2017 2016 2015
Re-engineering and impairment charges............................................................................... $ 63.7 $ 7.6 $ 6.8Cost of products sold............................................................................................................. 3.6 — —Total pretax re-engineering costs .......................................................................................... $ 67.3 $ 7.6 $ 6.8
In 2017, the re-engineering and impairment charges incurred were primarily related to restructuring actions takenin connection with the Company's plans, through 2018 or 2019, to rationalize its supply chain and to adjust the costbase of several marketing units. The restructuring charges also relate to the Company's decision to wind-down theBeauticontrol reporting unit due to a history of declining revenues, operating losses and the competitive environmentin the direct selling channel and retail sector for beauty and personal care products in the United States, Canada andPuerto Rico. The Company recorded $3.6 million in cost of sales for inventory obsolescence, mainly in connectionwith the decision to wind-down Beauticontrol in 2017.
18
Under the Company's re-engineering program announced in July 2017, it expects to incur a total of $100 to $110million in pretax costs from 2017 through 2019. In addition to the amounts recorded in 2017, the Company expects torecord an additional $30 million of pretax re-engineering costs in 2018. The Company's estimates reflect about 80%of the total program cost relating to severance and benefits, while the balance is predominantly related to costs to exitleases and other contracts, as well as write-offs of excess assets for which there are not expected to be disposal proceeds.Cash outflows associated with the overall program are expected to total $90 to $100 million, including $13 millionpaid in 2017 and $70 million expected in 2018. Both the cost and cash flow are before related asset sales that couldbring proceeds of up to $50 to $60 million over time. The annualized benefit of these actions, once fully implemented,is estimated to be $35 million with a small amount realized in 2017, about two-thirds of the annualized benefit to berealized in 2018 and the remainder in 2019. After reinvestment of a portion of the benefits, improved profitability willbe reflected most significantly through lower cost of products sold, but also through lower DS&A.
In 2016 and 2015, these charges were primarily associated with headcount reductions in several of the Company'soperations in connection with changes in its management and organizational structures.
See also Note 2 to the Consolidated Financial Statements in Part II, Item 8 of this Report, regarding the Company'sre-engineering actions.
Fixed Asset Impairment - Venezuela
As of the end of December 2017, the Company evaluated the significant inflationary environment, the early 2018devaluation of the currency in relation to the U.S. dollar and the actual exchange rates being used to conduct business,particularly procurement of resins to manufacture product in Venezuela. As a result of that evaluation that was similarto its analysis in 2015 described below, the Company concluded it was appropriate to record an impairment charge of$2.3 million dollars to reduce the carrying value of its long-term fixed assets to zero. This impairment charge wasincluded in the re-engineering and impairment charge caption of the Company's consolidated income statement, but isnot a component of the program announced in July 2017.
In February 2015, the Venezuelan government launched an overhaul of its foreign currency exchange structure,eliminating the SICAD 2 mechanism that the Company had referenced for translating and measuring its financialstatements, replacing it with a new exchange mechanism called Simadi. During the first quarter of 2015, Simadipublished a rate that was approximately 75 percent lower than the final SICAD 2 rate, which was expected to, andsubsequently had, severely reduced the unit’s sales and profit. As a result, the Company deemed this change to be atriggering event to evaluate the $15.7 million of long-term fixed assets in Venezuela, which at that time, due to Venezuelabeing deemed hyperinflationary, had continued to be included on the balance sheet at the historical rates in effect whenthe assets were purchased. As a result of this evaluation, the Company recorded an impairment charge of $13.5 millionto reduce the carrying value of its long-term fixed assets in Venezuela in the first quarter of 2015. This impairmentcharge was included in the re-engineering and impairment charge caption of the Company's consolidated incomestatement.
There were no fixed asset impairments in 2016.
See Note 2 to the Consolidated Financial Statements in Part II, Item 8 of this Report for further details.
Goodwill and Intangible Assets
The Company's goodwill and intangible assets relate primarily to the December 2005 acquisition of the direct-to-consumer businesses of Sara Lee Corporation. The Company has early adopted Accounting Standards Update 2017-04:Simplifying the Test for Goodwill Impairment.
In the third quarters of 2017 and 2016, the Company completed the annual assessments for all of its reporting unitsand indefinite-lived intangible assets, concluding there were no impairments. The Company performed only qualitativeassessments in the third quarter of 2017.
In the second quarter of 2017, as part of its on-going assessment of goodwill and intangible assets, the Companynoted that the sales, profitability and cash flow of Fuller Mexico had fallen below its recent trend lines and was expectedto fall significantly short of previous expectations for the year. As a result, the Company performed an interim impairmenttest as of the end of May 2017, recording an impairment charge of $62.9 million. The remaining goodwill balance atFuller Mexico is $17.4 million.
19
The impairment evaluation of the Fuller Mexico reporting unit included a fair value analysis, for which the significantassumptions included annual revenue growth rates ranging from negative 10 percent to positive 4 percent, a compoundaverage growth rate of 1.6 percent, and a 3 percent growth rate used in calculating the terminal value. The discountrate used for Fuller Mexico was 15.8 percent, which was 1.0 percentage point higher than at the time of the annualassessment performed in the third quarter of 2016 based on changes to interest rates and other macro-economic factorsin Mexico since that time.
In 2016, the Company estimated the fair value of this reporting unit at an amount that exceeded its carrying valueby about 20 percent. However, the estimated fair value was dependent upon the Company's ability in 2017 to overcomea trend of negative sales, profit and cash flow that began in 2011, and the discount rate to be applied not increasing. Inits 2016 annual assessment for Fuller Mexico, the Company projected 1 percent growth in sales for 2017, mainly fromexpectations over the second half of the year. In 2011 through 2016, local currency sales had declined an average of 5percent, ranging from negative 2 percent to negative 9 percent. Local currency sales declined 9 percent in the firstquarter of 2017. Operating profit as a percentage of sales declined from the mid-teens in 2012 to a high-single digit inthe first quarter of 2017. In April and May of 2017, the sales, profit and cash flow trends had worsened significantlywith declines in the mid-to-high teens and operating profit as a percentage of sales in the mid-single digits. As a result,the Company concluded, as part of its on-going process to assess goodwill and intangible assets, that a triggering eventfor impairment had occurred and performed the fair value analysis as described. Since 2011, Fuller Mexico has beenimpacted by a challenging macro-economic environment, increased competition in the retail and direct selling sectorsfor beauty and personal care products, as well as the results of certain strategies and margin investments implementedby the Company that did not successfully change its negative trends in sales force and field manager key performanceindicators necessary to grow the sales, profit and cash flow.
The estimated fair value of the Fuller Mexico reporting unit equaled its carrying value as of May 2017 in light ofthe impairment charge recorded. Having the carrying value equal to fair value results in an elevated risk of additionalfuture impairment, Fuller Mexico continued to carry a total sales force size and field manager deficit as of the end ofDecember 2017, despite new programs aimed at higher rates of sales force additions and retention and increased activity.These programs and trends were considered as part of the fair value evaluation performed as of the end of May 2017.Fuller Mexico's performance in the second half of 2017 was not out of line with assumptions built into the fair valueevaluation performed as of the end of May 2017, despite the impact of the natural disasters in Mexico during the thirdquarter. Local currency sales declined 9 percent in 2017. A deterioration in key operating metrics, such as sales forcesize, and/or operating performance significantly below expectations built into the May 2017 evaluation, includingchanges in projected future revenue, profitability and cash flow, as well as higher working capital, interest rates, or costof capital, could have a negative effect on the fair value of the reporting unit. In addition, the Company is unable topredict, at this time, whether there will be a significant, long-term impact to the Fuller Mexico operations or value dueto changes in the macro-economic environment. Should the Company's programs and strategies to improve the keyperformance indicators as outlined above not be able to overcome the general trends in the business and/or any negativemacro-economic factors in the time frame forecast, which could also impact the long-term discount rate values usedin estimating fair value, the estimated fair value of the reporting unit could fall below its carrying value, resulting inadditional impairment charges to the goodwill of Fuller Mexico.
Other than for the Fuller Mexico reporting unit, management has concluded there is no significant foreseeable riskof failing a future goodwill impairment test, nor is there significant foreseeable risk of the fair value of the indefinite-lived intangible assets falling materially below their respective carrying values. Given the sensitivity of fair valuevaluations to changes in cash flow or market multiples, the Company may be required to recognize an impairment ofgoodwill or indefinite-lived intangible assets in the future due to changes in market conditions or other factors relatedto the Company’s performance. Actual results below forecasted results or a decrease in the forecasted future results ofthe Company’s business plans or changes in discount rates could also result in an impairment charge, as could changesin market characteristics including declines in valuation multiples of comparable publicly-traded companies.Impairment charges would have an adverse impact on the Company’s net income and shareholders' equity.
Refer to Note 6 of the Consolidated Financial Statements in Part II, Item 8 for further information.
20
Gains on Disposal of Assets
The Company continues with its program to sell land for development near its Orlando, Florida headquarters,which began in 2002, recognizing pretax gains of $8.8 million, $26.5 million and $12.9 million under this program in2017, 2016 and 2015, respectively. Gains on land transactions are recorded based upon when the transactions closeand proceeds are collected. Transactions in one period may not be representative of what may occur in future periods.Since the Company began this program in 2002, cumulative proceeds from these sales have totaled $136 million withadditional net proceeds of up to $100 million expected as the program is completed, including future capital spendingassociated with the development currently estimated in the $10 to $12 million range. The carrying value of the remainingland included in the Company's land sales program was $24 million as of 2017, which was included in property, plantand equipment held for use within the Consolidated Balance Sheets as it is not considered probable that any significantland sales will be completed within one year. The Company has concluded that the fair value of the land under thisprogram significantly exceeded the carrying value as of the end of 2017, and will continue to do so into the foreseeablefuture.
In 2015 and 2014, the Company entered into two joint ventures with a real estate development partner to developland near the Company's Orlando headquarters. The Company received a fifty percent ownership in each joint venturein exchange for contributions of land. During the third quarter of 2016, the Company recorded gains of $24.2 millionin connection with its subsequent sale of the joint ventures. Total cash proceeds from the sale were $30.2 million,including $0.9 million related to the operation of the joint ventures during development. The income from the jointventure operations was recorded in other income on the Company's Consolidated Statements of Income in 2016.
Net Interest Expense
Net interest expense was $43.2 million in 2017, compared with $45.4 million in 2016. Interest expense decreasedin the year-over-year comparison reflecting less expense related to forward points from the Company's hedging activity,partially offset by the impact of higher interest rates on short-term borrowings.
Net interest expense was $45.4 million in 2016, compared with $45.2 million in 2015. Interest expense increasedin the year-over-year comparison reflecting more expense related to forward points from the Company's hedging activity,partially offset by lower interest expense on lower average borrowings.
Tax Rate
The effective tax rates for 2017, 2016 and 2015 were 243.4, 25.8 and 28.5 percent, respectively. The effective taxrate for 2017 reflects the estimated impact of the Tax Act. The effective tax rates for 2016 and 2015 were below theU.S. statutory rate, reflecting the availability of excess foreign tax credits and mix of income prior to the Tax Act, aswell as lower foreign effective tax rates.
On December 22, 2017, the U.S. government enacted comprehensive tax legislation, the Tax Act. The Tax Actmakes broad and complex changes to the U.S. tax code that affected 2017, including but not limited to a one-timetransition tax on certain unrepatriated earnings of foreign subsidiaries that is payable over eight years.
The Tax Act also established new tax laws that will affect 2018 and future years, including but not limited to (1)reducing the U.S. federal corporate rate from 35 percent to 21 percent; (2) elimination of the corporate alternativeminimum tax (AMT); (3) the creation of the base erosion anti-abuse tax (BEAT); (4) a general elimination of U.S.federal income taxes on dividends from foreign subsidiaries; (5) a new provision designed to tax global intangible low-taxed income (GILTI); (6) a new limitation on deductible interest expense; (7) limitations on the deductibility of certainexecutive compensation ; (8) significant limitations on the use of foreign tax credits (FTCs) to reduce U.S. income taxliability; and (9) changing the rules related to the uses and limitations of net operating loss carryforwards created intax years beginning after December 21, 2017.
21
ASC 740 requires a company to record the effect of a tax law change in the period of enactment. However, shortlyafter the enactment of the Tax Act, the SEC staff issued SEC Staff Accounting Bulletin 118 (“SAB 118”), which allowsa company to record a provisional amount when it does not have the necessary information available, prepared, oranalyzed in reasonable detail to complete its accounting for the change in tax law. The measurement period ends whenthe company has obtained, prepared and analyzed the information necessary to finalize its accounting, but cannot extendbeyond one year. In instances where the Company was able to make a reasonable estimate of the effects of elementsfor which the analysis was not complete, the Company recorded amounts in tax expense. Related to provisions of theTax Act for which the Company was not able to make reasonable estimates of the impact, it did not record any amountand continued accounting for them on the basis of tax laws in effect before the Tax Act as required under SAB 118.
In addition to, and in some cases interacting with the Tax Act, tax expense is affected by factors, including theglobal mix of earnings, changes in foreign tax legislation, acquisitions or dispositions as well as the tax characteristicsof income. The Company is required to make judgments on the need to record deferred tax assets and liabilities, uncertaintax positions and assessments regarding the realizability of deferred tax assets in determining the income tax provision.The Company has recognized deferred tax assets based upon its analysis of the likelihood of realizing the benefitsinherent in them in accordance with the requirements of SAB 118. The changes in law from the Tax Act are broad,complex and are subject to new technical interpretations and additional legislative actions to address ambiguities as aresult of the Tax Act. Where possible, the Company has made reasonable estimates of the impact of the Tax Act inaccordance with SAB 118. The Company’s existing corporate structure and intercompany arrangements have beenimplemented in a manner believed to be in compliance with current prevailing tax laws.
Implementation of the Tax Act resulted in recording $264 million in expense for the revaluation of the Company’snet domestic deferred tax assets, and a one-time provisional transition tax charge of approximately $96 million for therepatriation tax provision of the Tax Act. Reversal of various net tax benefits recorded under previous tax law changedby the Tax Act totaled $15 million. In reaching these estimates, the Company took into account all available guidanceand notices issued by the U.S. Department of the Treasury. The amounts are to be considered provisional and are subjectto change that could be significant given the complexity of the underlying calculations and uncertainty as to how someprovisions of the Tax Act are to be applied.
The Company continues to analyze the impact of provisions that will be effective in future years. Relevant to the2017 Consolidated Financial Statements is the Company’s selection of an accounting policy with respect to the newGILTI tax rules, and whether to account for GILTI as a periodic charge in the period it arises, or to record deferredtaxes associated with the basis in the Company’s foreign subsidiaries. Due to the intricacy of this topic, the Companyis still in the process of investigating the implications of accounting for the GILTI tax, and intends to make an accountingpolicy decision once additional guidance is available.
At December 30, 2017 and December 31, 2016, the Company had valuation allowances against certain deferredtax assets totaling $235.5 million and $24.8 million, respectively. The increase in valuation allowance was primarilyfrom the estimated impact of the limitation of usage of FTCs under the Tax Act. These valuation allowances relate totax assets in jurisdictions where it is management's best estimate that there is not a greater than 50 percent probabilitythat the benefit of the assets will be realized in the associated tax returns. This assessment is based in part upon expectedfuture domestic results under the Tax Act, and available foreign source income, including rents and royalties availablefor credit usage under the Tax Act, as well as anticipated gains related to future sales of land held for development nearthe Company's Orlando, Florida headquarters. Certain tax planning transactions may be entered into to facilitaterealization of these benefits. In evaluating uncertain tax positions, the Company makes determinations regarding theapplication of complex tax rules, regulations and practices. Uncertain tax positions are evaluated based on many factorsincluding but not limited to changes in tax laws, new developments and the impact of settlements on future periods.Refer to the critical accounting policies section and Note 12 to the Consolidated Financial Statements in Part II, Item8 of this Report for additional discussions of the Company's methodology for evaluating deferred tax assets.
As of December 30, 2017 and December 31, 2016, the Company's accrual for uncertain tax positions was $19.8million and $20.7 million, respectively. During the year ended December 30, 2017, the accrual for uncertain tax positionsdecreased by $3.7 million primarily due to the expiration of the statute of limitations in various jurisdictions and $1.2million as a result of the settlement of certain foreign tax audits. During the year, increases in uncertain positions beingtaken during the year in various foreign tax jurisdictions were partially offset by the impact of foreign exchange ratetranslation.
22
The Company estimates that it may settle one or more foreign and domestic audits in the next twelve months thatmay result in a decrease in the amount of accrual for uncertain tax positions of up to $0.8 million. For the remainingbalance as of December 30, 2017, the Company is not able to reliably estimate the timing or ultimate settlement amount.While the Company does not currently expect material changes, it is possible that the amount of unrecognized benefitwith respect to the uncertain tax positions will significantly increase or decrease related to audits in various foreignjurisdictions that may conclude during that period or new developments that could also, in turn, impact the Company'sassessment relative to the establishment of valuation allowances against certain existing deferred tax assets. At thistime, the Company is not able to make a reasonable estimate of the range of impact on the balance of unrecognized taxbenefits or the impact on the effective tax rate related to these items.
Net Income and Operating Income
Operating income decreased 34 percent in 2017 compared with 2016, which included a 1 point positive translationimpact on the comparison from changes in foreign currency exchange rates. Net loss of $265.4 million represented adecrease of $489.0 million from 2016. The decrease in local currency net income was primarily due to $375.0 millionof non-cash income tax charges related to the Tax Act, $62.9 million goodwill impairment related to Fuller Mexico,higher pre-tax re-engineering costs in connection with the Company's restructuring plan announced in July 2017 andlower pre-tax gains from real estate transactions and lower segment profit in Europe primarily due to lower sales, alongwith higher bad debt. These local currency decreases were partially offset by higher segment profit in South America,reflecting increased sales in Brazil and lower operating expenses in Asia Pacific, as well as sales growth and a mixshift toward China that has very good profitability, and higher sales in Tupperware Mexico, the United States andCanada in North America.
Operating income increased 10 percent in 2016 compared with 2015, which included a 10 point negative translationimpact on the comparison from changes in foreign currency exchange rates. Net income increased 20 percent on areported basis. Excluding the translation impact of foreign exchange rates, net income was 34 percent higher than 2015.The increase in local currency net income came primarily in South America, reflecting an improved gross margin andlower operating expenses on increased sales in Brazil, as well as $10.6 million in lower expenses related to inventoryand net monetary assets in connection with the devaluation of the currency exchange rates in Venezuela in 2016 comparedwith 2015. Also contributing to the local currency net income increase was higher segment profit from higher grossmargin despite lower sales in Asia Pacific and higher sales and improved contribution margin in Tupperware businessesin North America. In addition, the Company had $13.6 million higher gains in connection with land transactions nearthe Company's Orlando headquarters, lower unallocated corporate costs primarily reflecting incentive accruals underthe Company's incentive plans, and a lower tax rate. These local currency increases were partially offset by lowersegment profit in Europe primarily from lower sales volume and higher promotional spending primarily in France, andlower sales in Beauty businesses in North America along with a lower gross margin in Fuller Mexico.
International operations accounted for 91 percent of sales in 2017, 2016 and 2015. They accounted for 98 percentof segment profit in 2017 and 99 percent in 2016 and 2015.
23
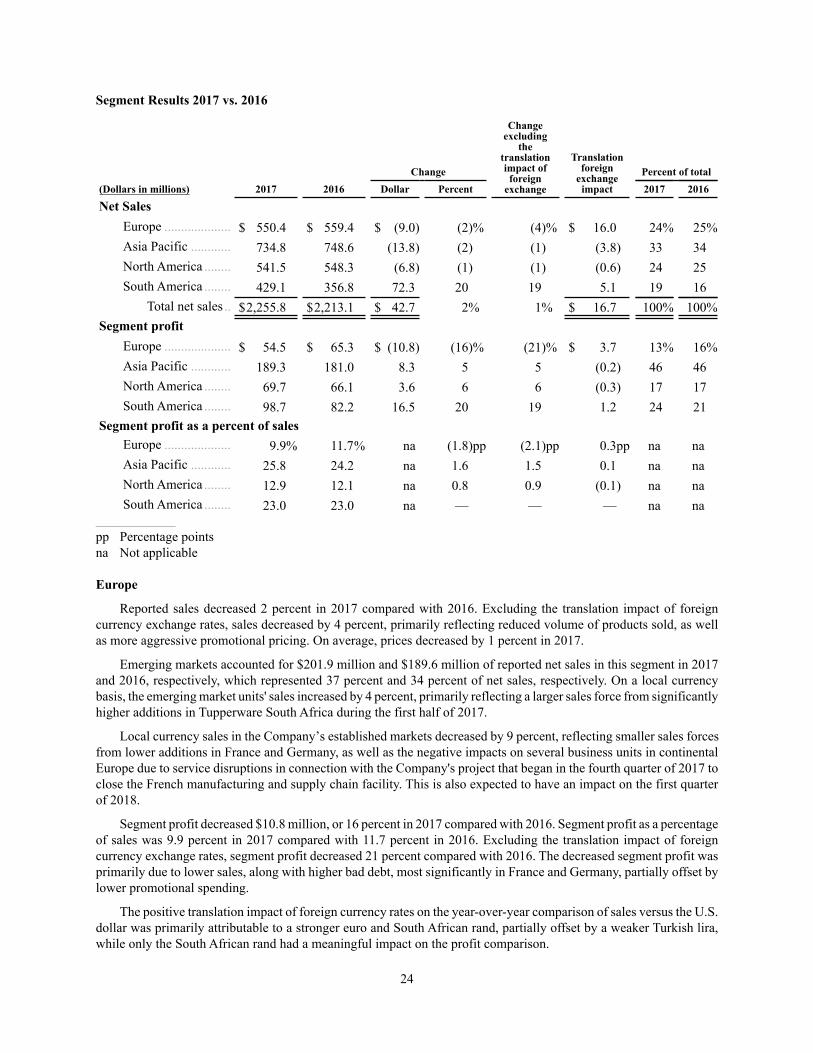
Segment Results 2017 vs. 2016
(Dollars in millions) 2017 2016Change
Changeexcluding
thetranslationimpact offoreign
exchange
Translationforeign
exchangeimpact
Percent of totalDollar Percent 2017 2016
Net SalesEurope .................... $ 550.4 $ 559.4 $ (9.0) (2)% (4)% $ 16.0 24% 25%Asia Pacific ............ 734.8 748.6 (13.8) (2) (1) (3.8) 33 34North America ........ 541.5 548.3 (6.8) (1) (1) (0.6) 24 25South America ........ 429.1 356.8 72.3 20 19 5.1 19 16
Total net sales.. $2,255.8 $2,213.1 $ 42.7 2% 1% $ 16.7 100% 100%Segment profit
Europe .................... $ 54.5 $ 65.3 $ (10.8) (16)% (21)% $ 3.7 13% 16%Asia Pacific ............ 189.3 181.0 8.3 5 5 (0.2) 46 46North America ........ 69.7 66.1 3.6 6 6 (0.3) 17 17South America ........ 98.7 82.2 16.5 20 19 1.2 24 21
Segment profit as a percent of salesEurope .................... 9.9% 11.7% na (1.8)pp (2.1)pp 0.3pp na naAsia Pacific ............ 25.8 24.2 na 1.6 1.5 0.1 na naNorth America ........ 12.9 12.1 na 0.8 0.9 (0.1) na naSouth America ........ 23.0 23.0 na — — — na na
____________________
pp Percentage pointsna Not applicable
Europe
Reported sales decreased 2 percent in 2017 compared with 2016. Excluding the translation impact of foreigncurrency exchange rates, sales decreased by 4 percent, primarily reflecting reduced volume of products sold, as wellas more aggressive promotional pricing. On average, prices decreased by 1 percent in 2017.
Emerging markets accounted for $201.9 million and $189.6 million of reported net sales in this segment in 2017and 2016, respectively, which represented 37 percent and 34 percent of net sales, respectively. On a local currencybasis, the emerging market units' sales increased by 4 percent, primarily reflecting a larger sales force from significantlyhigher additions in Tupperware South Africa during the first half of 2017.
Local currency sales in the Company’s established markets decreased by 9 percent, reflecting smaller sales forcesfrom lower additions in France and Germany, as well as the negative impacts on several business units in continentalEurope due to service disruptions in connection with the Company's project that began in the fourth quarter of 2017 toclose the French manufacturing and supply chain facility. This is also expected to have an impact on the first quarterof 2018.
Segment profit decreased $10.8 million, or 16 percent in 2017 compared with 2016. Segment profit as a percentageof sales was 9.9 percent in 2017 compared with 11.7 percent in 2016. Excluding the translation impact of foreigncurrency exchange rates, segment profit decreased 21 percent compared with 2016. The decreased segment profit wasprimarily due to lower sales, along with higher bad debt, most significantly in France and Germany, partially offset bylower promotional spending.
The positive translation impact of foreign currency rates on the year-over-year comparison of sales versus the U.S.dollar was primarily attributable to a stronger euro and South African rand, partially offset by a weaker Turkish lira,while only the South African rand had a meaningful impact on the profit comparison.
24
Asia Pacific
Reported sales in Asia Pacific in 2017 decreased 2 percent compared with 2016. Excluding the translation impactof foreign currency exchange rates, the segment's sales decreased 1 percent, including a 1 percentage point negativeimpact from the 53rd week in 2016, as well as lower volume in India, Indonesia and Nutrimetics Australia and NewZealand, partially offset by higher volume in China. The average price increase for the segment was 1 percent.
Emerging markets accounted for $622.2 million and $629.5 million in 2017 and 2016, respectively, or 85 percentand 84 percent of the sales in this segment in 2017 and 2016, respectively. Excluding the $5.2 million negative impactof foreign currencies on the comparison, these markets' sales in 2017 were even with 2016. The most significant decreaseamong the units was a decrease in Indonesia from a smaller, less active and less productive sales force in connectionwith the response to the Company's product and promotional programs, as well as lower sales force member additions.In addition, India had lower sales due to significantly fewer active sellers in light of requirements under the federalgovernment's direct selling guidelines and the constrained consumer spending environment due to the implementationof a nationwide goods and services tax in July 2017. These decreases were offset by China, primarily related toaccelerating the net addition of experience studios with significantly higher productivity, including from digitalmarketing initiatives to its members, as well as some timing benefit from a shift in ordering patterns. China ended 2017with 6,100 experience studios, which was 11 percent more than at the end of 2016.
Reported sales in the established markets decreased 5 percent. Excluding the impact of foreign currencies, thesemarkets' sales decreased 7 percent, primarily in Nutrimetics Australia and New Zealand due to a smaller, less activesales force from lower additions.
Total segment profit increased $8.3 million, or 5 percent, in 2017. The impact of foreign currency translation wasnot significant. Segment profit as a percentage of sales was 25.8 percent in 2017 compared with 24.2 percent in 2016.The improved profitability was primarily related to higher sales in China, which has a high contribution margin onincremental sales, and lower promotional spending, partially offset by lower sales in India and Indonesia.
The Philippine peso and Malaysian ringgit were the most significant currencies that led to the translation impactfrom foreign currencies on the year-over-year sales comparison. The Chinese renminbi and Indonesian rupiah generallycarry the highest exposure to changes in foreign currency rates due to the volume of revenue and profits.
North America
Reported sales decreased 1 percent in 2017 compared with 2016. The translation impact of foreign currencyexchange rates was not significant. There was a 3-point negative impact on the comparison from the winding down ofBeauticontrol, reflecting lower sales in the first half of 2017 and the winding down of its operations in the third quarter.There was also an estimated 1-point negative impact from the 53rd week in 2016. The average price increase in thissegment was 2%.
Emerging markets accounted for $292.4 million and $295.3 million of reported net sales in this segment in 2017and 2016, respectively, which represented 54 percent of sales in both years. On a local currency basis, the emergingmarket units' sales were even, primarily reflecting sales increase in Tupperware Mexico, due to a larger sales force,offset by Fuller Mexico from fewer active and less productive sellers.
Reported sales in the established markets decreased 2 percent, primarily due to Beauticontrol, partially offset bysales increase in the United States and Canada, due to more active sellers and good response to programs to drive highervolumes of products sold.
Segment profit increased $3.6 million, or 6 percent, in 2017 compared with 2016. Segment profit as a percentageof sales at 12.9 percent was 0.8 percentage points higher than 2016, reflecting higher sales with lower operating expensesin Tupperware Mexico and the United States and Canada, partially offset by lower profit on lower sales in Fuller Mexico,as well as inventory write-offs and operating losses from winding down Beauticontrol in the second half of 2017.
The Mexican peso was the main foreign currency that impacted the year-over-year comparisons.
25
South America
Reported sales for this segment increased 20 percent in 2017 compared with 2016. Excluding the translation impactof changes in foreign currency exchange rates, sales increased 19 percent with approximately two-thirds of the increasereflecting the impact of higher prices throughout the segment, mainly due to high inflation in Argentina and Venezuela.The remaining increase was the result of higher volume of products sold with an estimated 2 point negative impact onthe comparison from the 53rd week in 2016. All of the businesses in this segment operate in emerging market economies.
The most significant increase in local currency sales was in Brazil, the Company's largest business unit, mainlyfrom higher volume of products sold, reflecting a larger sales force size, partially offset by lower productivity in thesecond half of 2017 in light of a tough consumer spending environment. Argentina and Venezuela's local currency salesalso increased significantly, mainly due to the higher prices in light of significant inflation.
Segment profit increased $16.5 million, or 20 percent, in 2017 compared with 2016, including a positive $1.2million impact from changes in foreign currency exchange rates. Segment profit as a percentage of sales, at 23.0 percent,was even with 2016. The most significant increase in local currency segment profit was in Brazil from higher sales.Argentina and Venezuela also contributed to the increased local currency profit due to higher sales. In addition, therewas $5.4 million more in expenses in 2017 in connection with items on the Venezuelan balance sheet, including fixedasset impairments, that were impacted by the weakening of the currency exchange rate that occurred in 2017 and 2016.Venezuela is accounted for as hyperinflationary. As a consequence, amounts related to the translation of monetary assetswhen the exchange rate to the U.S. dollar fluctuates are recorded in income, whereas for non-hyperinflationary unitsthey are recorded as a cumulative translation adjustment on the consolidated balance sheet.
The Argentine peso and Venezuelan bolivar were the main currencies with significant negative translation impactson the year-over-year comparisons.
As of the end of December 2017, the Company evaluated the significant inflationary environment in Venezuela,as well as the actual exchange rates used to conduct business, particularly related to the procurement of resins tomanufacture product. The Company concluded it would not be appropriate to use the official rate to value sales andprofit beginning in 2018. As a result, the Company will use the parallel rate, which is approximately 99% lower thanthe official rate used in 2017.
26
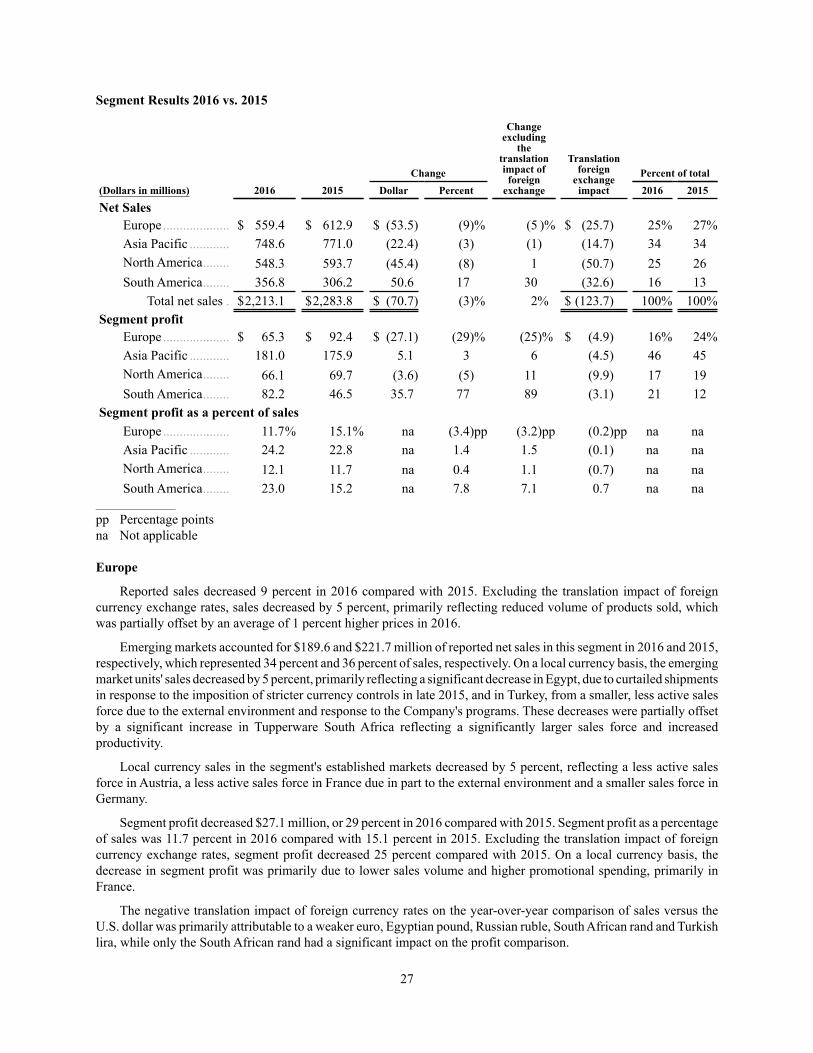
Segment Results 2016 vs. 2015
(Dollars in millions) 2016 2015Change
Changeexcluding
thetranslationimpact offoreign
exchange
Translationforeign
exchangeimpact
Percent of totalDollar Percent 2016 2015
Net SalesEurope .................... $ 559.4 $ 612.9 $ (53.5) (9)% (5 )% $ (25.7) 25% 27%Asia Pacific ............ 748.6 771.0 (22.4) (3) (1) (14.7) 34 34North America........ 548.3 593.7 (45.4) (8) 1 (50.7) 25 26South America........ 356.8 306.2 50.6 17 30 (32.6) 16 13
Total net sales . $2,213.1 $2,283.8 $ (70.7) (3)% 2% $ (123.7) 100% 100%Segment profit
Europe .................... $ 65.3 $ 92.4 $ (27.1) (29)% (25)% $ (4.9) 16% 24%Asia Pacific ............ 181.0 175.9 5.1 3 6 (4.5) 46 45North America........ 66.1 69.7 (3.6) (5) 11 (9.9) 17 19South America........ 82.2 46.5 35.7 77 89 (3.1) 21 12
Segment profit as a percent of salesEurope .................... 11.7% 15.1% na (3.4)pp (3.2)pp (0.2)pp na naAsia Pacific ............ 24.2 22.8 na 1.4 1.5 (0.1) na naNorth America........ 12.1 11.7 na 0.4 1.1 (0.7) na naSouth America........ 23.0 15.2 na 7.8 7.1 0.7 na na
____________________
pp Percentage pointsna Not applicable
Europe
Reported sales decreased 9 percent in 2016 compared with 2015. Excluding the translation impact of foreigncurrency exchange rates, sales decreased by 5 percent, primarily reflecting reduced volume of products sold, whichwas partially offset by an average of 1 percent higher prices in 2016.
Emerging markets accounted for $189.6 and $221.7 million of reported net sales in this segment in 2016 and 2015,respectively, which represented 34 percent and 36 percent of sales, respectively. On a local currency basis, the emergingmarket units' sales decreased by 5 percent, primarily reflecting a significant decrease in Egypt, due to curtailed shipmentsin response to the imposition of stricter currency controls in late 2015, and in Turkey, from a smaller, less active salesforce due to the external environment and response to the Company's programs. These decreases were partially offsetby a significant increase in Tupperware South Africa reflecting a significantly larger sales force and increasedproductivity.
Local currency sales in the segment's established markets decreased by 5 percent, reflecting a less active salesforce in Austria, a less active sales force in France due in part to the external environment and a smaller sales force inGermany.
Segment profit decreased $27.1 million, or 29 percent in 2016 compared with 2015. Segment profit as a percentageof sales was 11.7 percent in 2016 compared with 15.1 percent in 2015. Excluding the translation impact of foreigncurrency exchange rates, segment profit decreased 25 percent compared with 2015. On a local currency basis, thedecrease in segment profit was primarily due to lower sales volume and higher promotional spending, primarily inFrance.
The negative translation impact of foreign currency rates on the year-over-year comparison of sales versus theU.S. dollar was primarily attributable to a weaker euro, Egyptian pound, Russian ruble, South African rand and Turkishlira, while only the South African rand had a significant impact on the profit comparison.
27
Asia Pacific
Reported sales in Asia Pacific in 2016 decreased 3 percent compared with 2015. Excluding the translation impactof foreign currency exchange rates, the segment's sales decreased 1 percent, including a 1 point benefit from the 53rdweek in 2016. This decrease primarily reflected lower volume in Indonesia. The average price decrease for the segmentwas 1 percent.
Emerging markets accounted for $629.5 million and $646.6 million in 2016 and 2015, respectively, or 84 percentof the sales in this segment in both years. Total emerging market sales decreased $17.1 million, or 3 percent in 2016,compared with 2015. The comparison was negatively impacted by changes in foreign currency exchange rates totaling$18.8 million. Excluding the impact of foreign currencies, these markets' sales in 2016 were even with 2015. The mostsignificant increases and decreases among the units included a decrease in India due mainly to changes made in thebusiness under new government guidelines for operating a direct selling business, including eliminating the requirementto purchase a demonstration set of products when joining the business and for much of the year, prizes for bringing anew seller into the business. As allowed, prizes upon activation of a new seller were instituted late in the year. In thefourth quarter, the Company also began implementing a requirement that all new and existing sales force members beregistered with the government, and there was also an impact on the business from the government’s decision to removeexisting high-denomination currency notes from circulation. Sales were also down in Indonesia due to a smaller salesforce size and poor response to sales force programs, and the Philippines from fewer active sellers related to the exitof the fashion category in late 2015. These decreases were offset by an increase in China, where at the end of 2016,the Company operated 5,500 demonstration studios through independent studio owners. The increase in China relatedto growth in the number of demonstration studios and higher studio productivity from 28 percent more members of thestudios as of the end of the year, and successful digital and other marketing and product offerings. In addition, Malaysia/Singapore increased local currency sales, primarily due to increased productivity.
Reported sales in the established markets decreased 4 percent. Excluding the impact of foreign currencies, thesemarkets' sales decreased 7 percent, primarily from a lower volume of products sold.
Total segment profit increased $5.1 million, or 3 percent, in 2016. Segment profit as a percentage of sales was 24.2percent in 2016 compared with 22.8 percent in 2015. The segment profit comparison was negatively impacted bychanges in foreign currency, and excluding this impact, segment profit increased 6 percent compared with 2015, despitethe lower local currency sales as a result of an improved gross margin.
The Chinese renminbi, Indian rupee, Japanese yen, Malaysian ringgit, and Philippine peso were the most significantcurrencies that led to the translation impact from foreign currencies on the year-over-year sales comparison. The Chineserenminbi and Malaysian ringgit were the main currencies that had a negative translation impact on the profit comparison.
North America
Reported sales decreased 8 percent in 2016 compared with 2015. Excluding the translation impact of foreigncurrency exchange rates, sales increased 1 percent versus the prior year, including a 1 point benefit from the 53rd weekin 2016, reflecting growth in both Mexico and the United States and Canada. The average price increase in this segmentwas 3 percent.
Emerging markets accounted for $295.3 and $338.9 million of reported net sales in this segment in 2016 and 2015,respectively, which represented 54 percent and 57 percent of sales, respectively. On a local currency basis, the emergingmarket units' sales increased 2 percent, primarily reflecting an increase in Mexico due to increased volume from a largersales force. This increase was partially offset by a decrease in Fuller Mexico reflecting a smaller sales force in light ofa lower number of sales force field managers. Field managers are those directly responsible for sales force additionsand motivating and training sales force members.
Reported sales in the established markets decreased 1 percent, primarily reflecting a decrease in Beauticontrolfrom a smaller sales force and smaller order sizes, from a lack of traction from newer initiatives. This decrease waspartially offset by an increase in the United States and Canada from increased sales volume through a larger, moreactive sales force, despite having to manage through the impact of having modified the sales force compensation planin the United States, announced in the fourth quarter 2015 and effective in the first quarter 2016.
28
Segment profit decreased $3.6 million, or 5 percent, in 2016 compared with 2015. Segment profit as a percentageof sales at 12.1 was 0.4 percentage points higher than 2015. Excluding the impact of changes in foreign currencyexchange rates, segment profit increased 11 percent, primarily reflecting higher sales along with lower costs forimplementing strategic initiatives and operating expenses in the United States and Canada. This increase was partiallyoffset by lower sales with a lower gross margin percentage at Fuller Mexico.
The Mexican peso was the main foreign currency that impacted the year-over-year comparisons.
South America
Reported sales for this segment increased 17 percent in 2016 compared with 2015. Excluding the translation impactof changes in foreign currency exchange rates, sales increased 30 percent with approximately one-third of the increasereflecting the impact of higher prices throughout the segment. There was also a 2 point benefit from the 53rd week in2016. The remaining increase was the result of higher volume of products sold. All of the businesses in this segmentoperate in emerging market economies.
The most significant increase in local currency sales was in Brazil. The volume improvement reflected a significantsales force size advantage and higher productivity from the product mix sold and favorable response to consumer offersand electronic point-of-sales offers to the sales force. Argentina's sales also increased significantly, mainly due to higherprices in light of significant inflation.
Segment profit increased $35.7 million, or 77 percent, in 2016 compared with 2015, including a negative $3.1million impact from changes in foreign currency exchange rates. Segment profit as a percentage of sales, at 23.0 percent,was 7.8 percentage points higher than in 2015. The most significant increase in local currency segment profit was inBrazil from the higher sales and improved gross margin percentage. Argentina and Venezuela also contributed to theincreased local currency profit due to higher sales. In addition, there was $10.6 million less expense in 2016 in connectionwith items on the Venezuelan balance sheet that were impacted by the weakening of the currency exchange rate thatoccurred in 2016 and 2015.
The Argentine peso, Brazilian real and Venezuelan bolivar were the main currencies with significant negativetranslation impacts on the year-over-year comparisons.
29
Financial Condition
Liquidity and Capital Resources
Net working capital was negative $28.3 million as of December 30, 2017, compared with negative $2.3 millionas of December 31, 2016 and negative $63.5 million as of December 26, 2015. The current ratio was 1.0 to 1.0 at theend of 2017 and 2016, and 0.9 to 1.0 at the end of 2015.
The Company’s reported net working capital decreased $26.0 million in 2017 compared with 2016. Excluding thenegative $2.6 million impact due to changes in foreign currency exchange rates, working capital decreased $23.4million, primarily reflecting a $68.9 million net increase in accounts payable and accrued liabilities, excluding theliabilities related to hedging activities, which included $45.4 million under the re-engineering program announced inJuly 2017, a $15.6 million increase in short-term borrowings and a $6.9 million decrease related to amounts on thebalance sheet for hedging activities. These local currency decreases were partially offset by a $42.8 million increasein cash and cash equivalents, a $13.5 million increase in inventory, related to a lower than expected sell through, a $11.5million increase in accounts receivable due to the level and timing of sales around the end of each period as well ashigher overdue amounts.
The Company’s reported net working capital increased $61.2 million in 2016 compared with 2015. Excluding thenegative $8.1 million impact due to changes in foreign currency exchange rates, working capital increased $69.3 million,primarily reflecting, in local currency, a $53.0 million decrease in short-term borrowings using cash generated in excessof dividends paid, an increase in cash of $19.6 million, and excluding the liabilities related to hedging activities, adecrease of $14.1 million in payables and accruals mainly due to the timing of payments around year-end. Theseincreases were partially offset by a $10.4 million decrease in accounts receivable and a slight decrease in inventory.
In June 2011, the Company completed the sale of $400 million in aggregate principal amount of 4.75% SeniorNotes due June 1, 2021. On March 11, 2013, the Company issued and sold an additional $200.0 million in aggregateprincipal amount of these notes (both issuances together, the "Senior Notes"). The Senior Notes form a single seriesunder the Indenture, dated as of June 2, 2011 (the “Indenture”).
On June 9, 2015, the Company and its wholly owned subsidiary Tupperware International Holdings B.V. (the“Subsidiary Borrower”), entered into Amendment No. 2 (the "Amendment”) to their multicurrency Amended andRestated Credit Agreement dated September 11, 2013, as amended by Amendment No. 1 dated June 2, 2014 (as soamended, the “Credit Agreement”). The Credit Agreement makes available to the Company and the Subsidiary Borrowera committed five-year credit facility in an aggregate amount of $600 million (the “Facility Amount”). The CreditAgreement provides (i) a revolving credit facility, available up to the full amount of the Facility Amount, (ii) a letterof credit facility, available up to $50 million of the Facility Amount, and (iii) a swingline facility, available up to $100million of the Facility Amount. Each of such facilities is fully available to the Company and is available to the SubsidiaryBorrower up to an aggregate amount not to exceed $325 million. The Company is permitted to increase, on up to threeoccasions, the Facility Amount by a total of up to $200 million (for a maximum aggregate Facility Amount of $800million), subject to certain conditions including the agreement of the lenders. As of December 30, 2017, the Companyhad total borrowings of $131.0 million outstanding under its Credit Agreement, with $96.1 million of that amountdenominated in euros.
The Company routinely increases its revolver borrowings under the Credit Agreement during each quarter to fundoperating, investing and financing activities and uses cash available at the end of each quarter to reduce borrowinglevels. As a result, the Company incurs more interest expense and has higher foreign exchange exposure on the valueof its cash and debt during each quarter than would relate solely to the quarter end balances.
Loans taken under the Credit Agreement bear interest under a formula that includes, at the Company's option, oneof three different base rates, plus an applicable spread. The Company generally selects the London Interbank OfferedRate ("LIBOR"). As of December 30, 2017, the Credit Agreement dictated a base rate spread of 150 basis points, whichgave the Company a weighted average interest rate on LIBOR based borrowings of 1.92 percent on borrowings underthe Credit Agreement. The LIBOR rate used in determining the interest rate cannot be below zero, which it wasthroughout 2017 for euro based borrowings.
The Credit Agreement contains customary covenants, including financial covenants requiring minimum interestcoverage and allowing a maximum amount of leverage. As of December 30, 2017, and currently, the Company hadconsiderable cushion under its financial covenants. However, economic conditions, adverse changes in foreign exchangerates, lower than foreseen sales, profit and/or cash flow generation, the ability to access cash generated internationallyin Brazil, China, Indonesia, Korea, Mexico or elsewhere, share repurchases or the occurrence of other events discussedunder “Forward Looking Statements” in this Part II, Item 7 and in the Company’s other reports filed with the SECcould impact the Company’s ability to comply with these covenants.
See Note 7 to the Consolidated Financial Statements in Part II, Item 8 of this Report for further details regardingthe Company's debt.
The Company monitors the financial stability of third-party depository institutions that hold its cash and cashequivalents and diversifies its cash and cash equivalents among counterparties, which minimizes exposure to any oneof these entities. Furthermore, the Company is exposed to financial market risk resulting from changes in interest rates,foreign currency rates and the possible liquidity and credit risks of its counterparties. The Company believes that it hassufficient liquidity to fund its working capital and capital spending needs and its current dividend. This liquidity includesits year-end 2017 cash and cash equivalents balance of $144.1 million, cash flows from operating activities, and accessto its $600 million Credit Agreement and other uncommitted lines of credit. As of December 30, 2017, the Companyhad $553.6 million of unused lines of credit, including $467.5 million available under its Credit Agreement and $86.1million available under other uncommitted lines of credit. The Company has not experienced any limitations on itsability to access its committed facility.
30
Cash and cash equivalents (“cash”) totaled $144.1 million as of December 30, 2017. The cash was held by foreignsubsidiaries, and 60 percent was not currently eligible for repatriation due to the level of past statutory earnings by theforeign unit in which the cash was held or other local restrictions. The Company is in the process of evaluating theimpact of the Tax Act on its indefinite reinvestment assertion with respect to accumulated earnings of certain foreignsubsidiaries. Other than for the one-time mandatory repatriation transition tax charge, no U.S. federal income taxes orforeign withholding taxes have been recorded related to earnings for which there is an indefinite reinvestment assertion.The Company expects to complete its assessment within the one-year measurement period allowed by SAB 118, andwhen that assessment is completed, it is possible that additional expense will be recorded, and that amount may besignificant. Withholding taxes would be due in some jurisdictions when foreign earnings are repatriated.
The Company’s most significant foreign currency exposures are to the Brazilian real, Chinese renminbi, euro,Indonesian rupiah and Mexican peso. Business units in which the Company generated at least $100 million of sales in2017 included Brazil, China, Fuller Mexico, Germany, Indonesia, Tupperware Mexico and Tupperware United Statesand Canada. Of these units, sales by China and Tupperware United States and Canada exceeded $200 million, whilesales in Brazil exceeded $300 million. A significant downturn in the Company’s business in these units would adverselyimpact its ability to generate operating cash flows. Operating cash flows would also be adversely impacted by significantdifficulties in the additions, retention and activity of the Company’s independent sales force or the success of newproducts, promotional programs and/or possibly changes in sales force compensation programs.
Operating Activities
Net cash provided by operating activities in 2017 was $217.0 million, compared with $238.6 million in 2016. Theunfavorable comparison was primarily due to a decrease in reported net income, notwithstanding the non-cash taxprovision elements in connection with the enactment of the Tax Act and non-cash re-engineering and impairmentcharges. Additionally, there were cash outflows from an increase in accounts receivable, due to the level and timing ofsales around the end of each period as well as higher overdue amounts and inventory, related to a lower than expectedsell through. These outflows were partially offset by increases in accounts payable and accrued liabilities, primarilyrelated to the Company's re-engineering program.
Net cash provided by operating activities in 2016 was $238.6 million, compared with $225.7 million in 2015. Thefavorable comparison was primarily due to an increase in reported net income, which was net of an $18.9 millionnegative impact on the comparison from weaker foreign currency exchange rates in relation to the U.S. dollar.Additionally, there were cash inflows from a reduction in accounts receivable, along with lower outflows versus lastyear in connection with the Company's hedging activities, and cash taxes due to incremental cash paid in 2015, inconnection with tax law reform in Mexico in 2013. These improvements were partially offset by an outflow in 2016from a reduction in accounts payable and accrued liabilities due to timing of distributions around the end of the year.
Investing Activities
In 2017, 2016 and 2015, the Company spent $72.3 million, $61.6 million and $61.1 million, respectively, on capitalexpenditures. The most significant type of spending in all years was for molds for new products. The Company alsospent $23 million, $17 million, and $18 million, in each respective year for the expansion of manufacturing capacityand supply chain capabilities, most significantly in Brazil. The Company also spent significant capital on various globalinformation technology projects and marketing offices to support operations as well as for vehicles in South Africa. Inaddition, the Company also spent $7.5 million, $3.8 million and $2.4 million, in each respective year for landdevelopment near its Orlando headquarters.
Partially offsetting the capital spending were proceeds from the sale of long-term assets of $14.7 million, $35.9million and $18.0 million in 2017, 2016 and 2015, respectively, primarily reflecting transactions associated with landnear the Company's Orlando, Florida headquarters. In all years, there were also proceeds related to the sale of vehiclesthat had been purchased for the sales force, primarily in South Africa.
Financing Activities
In 2017, 2016 and 2015, the Company made net payments on long-term debt of $2.0 million, $2.2 million and$2.6 million, respectively, mainly related to its scheduled lease payments. In addition, the Company had a net inflowof $15.6 million and outflows of $52.0 million and $36.4 million for changes in borrowings under its revolving creditagreements in each of these respective periods.
31
Dividends
During 2017, 2016 and 2015, the Company declared dividends of $2.72 per share of common stock totaling $139.5million, $138.8 million and $138.0 million, respectively.
Going forward, the Company expects its Board of Directors to evaluate its dividend rate annually with its declarationin the first quarter of each year. In the first quarter of 2018, the Board of Directors voted to keep the regular quarterlydividend rate even with 2017 and 2016, at $0.68. The payment of a dividend on common shares is a discretionarydecision and subject to a significant event that would require cash, the ability to continue to comply with debt covenants,cash needed to finance operations, making necessary investments in the future growth of the business, required ordiscretionary debt repayment obligations, the impacts of changes in foreign currency exchange rates, the ability toaccess internationally generated cash or other cash needs, as well as compliance with Delaware law regarding capitalsurplus. As well, if there is an event requiring the use of cash, such as a strategic acquisition, the Company would needto reevaluate whether to maintain its dividend payout.
Stock Option Exercises
During 2017, 2016 and 2015, the Company received proceeds of $11.8 million, $0.8 million and $16.1 million,respectively, related to the exercise of stock options. The corresponding shares were issued out of the Company’sbalance held in treasury.
Stock Repurchases
In January 2017, the Company's Board of Directors extended its existing share repurchase authorization for openmarket share repurchases, which allows up to $2.0 billion to be spent, through February 1, 2020. There were no sharerepurchases under this program during 2017, 2016 and 2015. Since inception of the program in May 2007, and throughDecember 30, 2017, the Company repurchased 21.3 million shares at an aggregate cost of $1.29 billion. Going forward,in setting share repurchase amounts, the Company expects to target over time a debt-to-EBITDA ratio of 1.75 timesconsolidated funded debt (as defined in the Company's Credit Agreement). Based on the Company’s year-end 2017debt level, its expected disbursements for dividends and its projected 2018 cash flow and its timing during the year,the Company does not currently plan to make open market share repurchases in 2018.
Employees are also allowed to use shares to pay withholding taxes, up to the minimum statutory amount, relatedto activity under all of the Company's stock incentive plans. For 2017, 2016 and 2015, the value of shares used forwithholding taxes was $2.5 million, $1.7 million and $1.5 million, respectively, which is included as stock repurchasesin the Consolidated Statements of Cash Flows.
32
Contractual Obligations
The following summarizes the Company’s contractual obligations at December 30, 2017 and the effect suchobligations are expected to have on its liquidity and cash flow in future periods.
(In millions) TotalLess than
1 year 1-3 years 3-5 yearsMore than
5 years
Debt obligations ................................................................. $ 738.1 $ 133.0 $ 3.1 $ 602.0 $ —Interest payments on long term obligations ....................... 100.7 29.0 57.4 14.3 —Pension benefits.................................................................. 154.7 13.4 39.8 29.5 72.0Post-employment medical benefits .................................... 15.2 1.5 2.7 2.5 8.5Income tax payments (a) .................................................... 0.8 0.8 — — — —Capital commitments (b) .................................................... 1.3 1.3 — — —Operating lease obligations ................................................ 111.7 35.1 37.5 15.7 23.4Total contractual obligations (c)......................................... $ 1,122.5 $ 214.1 $ 140.5 $ 664.0 $ 103.9
____________________
(a) Other than the amount presented, the Company has not included in the table above, amounts related to itsunrecognized tax positions, as it is unable to make a reliable estimate of the amount and period in which theseitems might lead to payments. As of December 30, 2017 the Company’s total accrual for uncertain tax positionswere $19.8 million. It is reasonably possible that the accrual for uncertain tax positions could materially changewithin the next 12 months based on the results of tax examinations, expiration of statutes of limitations in variousjurisdictions and additions due to ongoing transactions and activity. However, the Company is unable to estimatethe impact of such events.
(b) Capital commitments represent signed agreements as of December 30, 2017 on several capital projects in processat the Company’s various units.
(c) The table excludes information on recurring purchases of inventory as these are made under non-binding purchaseorders, are generally consistent from year to year, and are short-term in nature.
Application of Critical Accounting Policies and Estimates
Management’s Discussion and Analysis of Financial Condition and Results of Operations is based upon theCompany’s Consolidated Financial Statements that have been prepared in accordance with accounting principlesgenerally accepted in the United States of America. The preparation of these financial statements requires managementto make estimates and assumptions that affect the reported and disclosed amounts. Actual results may differ from theseestimates under different assumptions or conditions. The Company believes the implementation of the following criticalaccounting policies are the most significantly affected by its judgments and estimates.
Allowance for Doubtful Accounts.
The Company maintains current receivable amounts with most of its independent distributors and sales force incertain markets. It also maintains long-term receivable amounts with certain of these customers. The Company regularlymonitors and assesses its risk of not collecting amounts owed to it by customers. This evaluation is based upon ananalysis of amounts current and past due, along with relevant history and facts particular to the customer. It is alsobased upon estimates of distributor business prospects, particularly related to the evaluation of the recoverability oflong-term amounts due. This evaluation is performed by business unit and account by account, based upon historicalexperience, market penetration levels and similar factors. It also considers collateral of the customer that could berecovered to satisfy debts. The Company records its allowance for doubtful accounts based on the results of this analysis.The analysis requires the Company to make significant estimates and as such, changes in facts and circumstances couldresult in material changes in the allowance for doubtful accounts. The Company considers as past due any receivablebalance not collected within its contractual terms.
33
Inventory Valuation
The Company writes down its inventory for obsolescence or unmarketability in an amount equal to the differencebetween the cost of the inventory and estimated market value based upon expected future demand and pricing. Thedemand and pricing is estimated based upon the historical success of product lines as well as the projected success ofpromotional programs, new product introductions and the availability of new markets or distribution channels. TheCompany prepares projections of demand and pricing on an item by item basis for all of its products. If inventory onhand exceeds projected demand or the expected market value is less than the carrying value, the excess is written downto its net realizable value. However, if actual demand or the estimate of market value decreases, additional write-downswould be required.
Income Taxes
Deferred tax assets and liabilities are recognized for the future tax consequences attributable to temporarydifferences between the financial statement carrying amounts of assets and liabilities and their respective tax bases.Deferred tax assets also are recognized for credit carryforwards. Deferred tax assets and liabilities are measured usingthe enacted rates applicable to taxable income in the years in which the temporary differences are expected to reverseand the credits are expected to be used. The effect on deferred tax assets and liabilities of a change in tax rates isrecognized in income in the period that includes the enactment date. The Tax Act reduced the U.S. corporate tax rateto 21 percent from 35 percent effective January 1, 2018. The value of the Company’s net deferred tax assets werereduced by an estimated $75 million with a corresponding net adjustment to its current year tax expense for theremeasurement of the Company’s U.S. net deferred to assets. The Tax Act also reduced the Company’s estimate of theamount of its foreign tax credits it would be able to utilize resulting in the recording of an additional valuation allowanceof $189 million. After considering the valuation allowance as of December 30, 2017, the Company’s ConsolidatedBalance Sheet included $10 million of deferred tax assets for future use of foreign tax credits.
At December 30, 2017 and December 31, 2016, the Company had valuation allowances against certain deferredtax assets totaling $235.5 million and $24.8 million, respectively. These valuation allowances relate to tax assets injurisdictions where it is management's best estimate that there is not a greater than 50 percent probability that the benefitof the assets will be realized in the associated tax returns. At the end of 2017, the Company had gross domestic deferredtax assets of $323.8 million against which a valuation allowance of $194.5 million had been recorded. Of these totalassets, $62.7 million relates to recurring type temporary differences which reverse regularly and are replaced by newlyoriginated items. The balance included assets of $49.0 million related to advanced payment agreements, which areexpected to reverse over the next three years, and other deferred tax assets. The gross balance also included approximately$199 million of foreign tax credits, after applying $20 million against the transition tax. While the Company estimatesit will be able to use the $10 million of foreign tax credits referred to above, it will continue to evaluate the implicationsof the Tax Act and avenues available to use additional foreign tax credits prior to their expiration. In addition, theCompany has $3.0 million of federal net operating losses which would expire in the years 2025 through 2035 if notutilized, and $5.2 million of federal tax credits that have no expiration date and $4.1 million other liability associatedwith the future distribution of previously taxed foreign income. The balance also included $3.8 million of net stateoperating losses and other book versus tax asset differences of approximately $4.9 million.
The Company will be restricted to using foreign source taxable income generated by intercompany royalties, andmold rentals. In preparing its 2017 U.S. income tax return, the Company anticipates using $136 million foreign taxcredits generated in 2017, and $20 million of prior year credits against the cost of the transition tax. The federal netoperating losses are related to a subsidiary that is excluded from the federal consolidated tax return, and is engaged inland sales and development near the Company's Orlando, Florida headquarters. As such, the federal net operating lossesdo not impact the utilization of foreign tax credits. The Company believes that gains related to future sales of land andother income will be sufficient to realize, before they expire, the $3.0 million net operating loss of this subsidiary. Theseestimates are made based upon the Company's business plans and growth strategies in each market and are made onan ongoing basis; consequently, future material changes in the valuation allowance are possible. Any change in valuationallowance amounts are reflected in the period in which the change occurs.
34
As of December 30, 2017 and December 31, 2016, the Company's accrual for uncertain tax positions was $19.8million and $20.7 million, respectively. During the year ended December 30, 2017, the accrual for uncertain tax positionsdecreased by $3.7 million primarily due to the expiration of the statute of limitations in various jurisdictions and $1.2million as a result of the settlement of certain foreign tax audits. During the year, increases in uncertain positions beingtaken during the year in various foreign tax jurisdictions were partially offset by the impact of foreign exchange ratetranslation.
Interest and penalties related to uncertain tax positions in the Company's global operations are recorded as acomponent of the provision for income taxes. Accrued interest and penalties were $7.3 million and $7.1 million as ofDecember 30, 2017 and December 31, 2016, respectively. Interest and penalties included in the provision for incometaxes totaled $0.2 million and $1.1 million for 2017 and 2016, respectively and no significant interest and penaltieswere included in the provision for income taxes for 2015.
The Company estimates that it may settle one or more foreign and domestic audits in the next twelve months thatmay result in a decrease in the amount of accrual for uncertain tax positions of up to $0.8 million. For the remainingbalance as of December 30, 2017, the Company is not able to reliably estimate the timing or ultimate settlement amount.While the Company does not currently expect material changes, it is possible that the amount of unrecognized benefitwith respect to the uncertain tax positions will significantly increase or decrease related to audits in various foreignjurisdictions that may conclude during that period or new developments that could also, in turn, impact the Company'sassessment relative to the establishment of valuation allowances against certain existing deferred tax assets. At thistime, the Company is not able to make a reasonable estimate of the range of impact on the balance of unrecognized taxbenefits or the impact on the effective tax rate related to these items.
Promotional Accruals
The Company frequently makes promotional offers to its independent sales force to encourage them to meet specificgoals or targets for sales levels, party attendance, addition of new sales force members or other business critical activities.The awards offered are in the form of product awards, special prizes or trips. The cost of these awards is recordedduring the period over which the sales force qualifies for the award. These accruals require estimates as to the cost ofthe awards based upon estimates of achievement and actual cost to be incurred. The Company makes these estimateson a market by market and program by program basis. It considers the historical success of similar programs, currentmarket trends and perceived enthusiasm of the sales force when the program is launched. During the promotionqualification period, actual results are monitored and appropriate changes to the original estimates are made whenknown.
Goodwill and Intangible Assets
The Company’s goodwill and intangible assets relate primarily to the December 2005 acquisition of the direct-to-consumer businesses of Sara Lee Corporation. The Company does not amortize its goodwill or indefinite-livedtradename intangible assets. Instead, the Company performs an annual impairment assessment of these assets, or morefrequently if events or changes in circumstances indicate they may be impaired.
The annual process for evaluating goodwill begins with an assessment for each entity of qualitative factors todetermine whether a quantitative evaluation of the unit's fair value compared with its carrying value is necessary. Thequalitative factors evaluated by the Company include: macro-economic conditions of the local business environment,overall financial performance, sensitivity analysis from the most recent quantitative fair value evaluation ("fair valuetest").
35
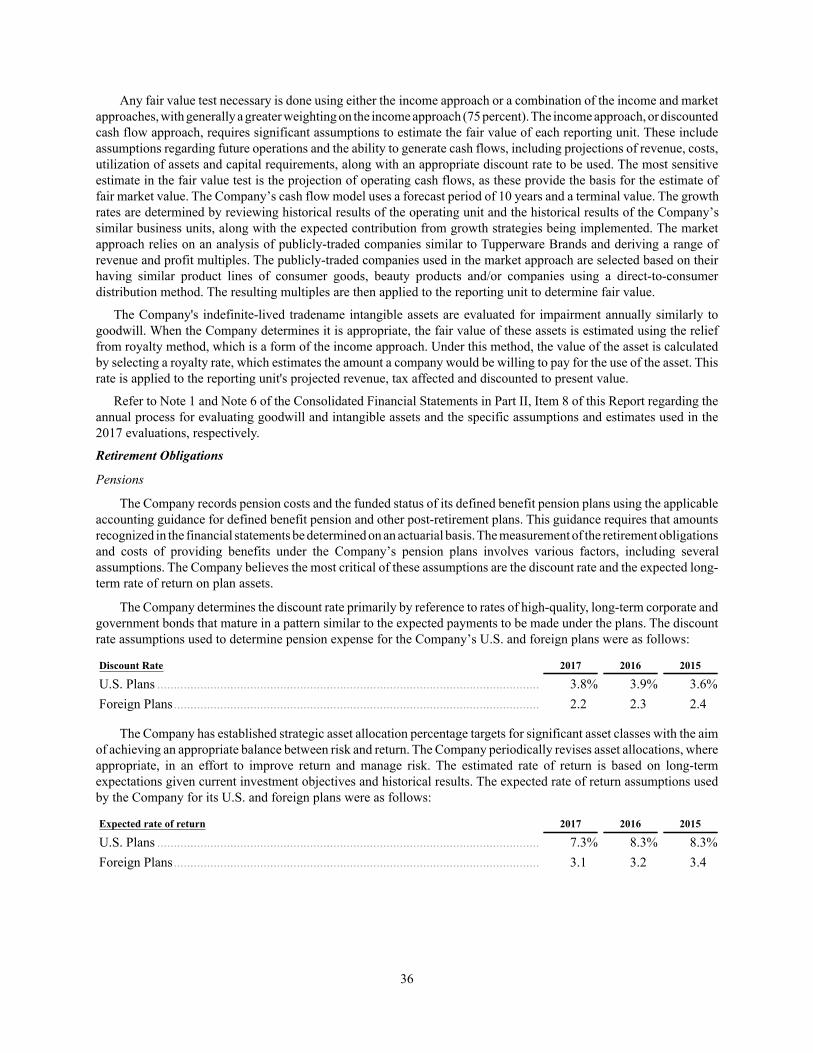
Any fair value test necessary is done using either the income approach or a combination of the income and marketapproaches, with generally a greater weighting on the income approach (75 percent). The income approach, or discountedcash flow approach, requires significant assumptions to estimate the fair value of each reporting unit. These includeassumptions regarding future operations and the ability to generate cash flows, including projections of revenue, costs,utilization of assets and capital requirements, along with an appropriate discount rate to be used. The most sensitiveestimate in the fair value test is the projection of operating cash flows, as these provide the basis for the estimate offair market value. The Company’s cash flow model uses a forecast period of 10 years and a terminal value. The growthrates are determined by reviewing historical results of the operating unit and the historical results of the Company’ssimilar business units, along with the expected contribution from growth strategies being implemented. The marketapproach relies on an analysis of publicly-traded companies similar to Tupperware Brands and deriving a range ofrevenue and profit multiples. The publicly-traded companies used in the market approach are selected based on theirhaving similar product lines of consumer goods, beauty products and/or companies using a direct-to-consumerdistribution method. The resulting multiples are then applied to the reporting unit to determine fair value.
The Company's indefinite-lived tradename intangible assets are evaluated for impairment annually similarly togoodwill. When the Company determines it is appropriate, the fair value of these assets is estimated using the relieffrom royalty method, which is a form of the income approach. Under this method, the value of the asset is calculatedby selecting a royalty rate, which estimates the amount a company would be willing to pay for the use of the asset. Thisrate is applied to the reporting unit's projected revenue, tax affected and discounted to present value.
Refer to Note 1 and Note 6 of the Consolidated Financial Statements in Part II, Item 8 of this Report regarding theannual process for evaluating goodwill and intangible assets and the specific assumptions and estimates used in the2017 evaluations, respectively.
Retirement Obligations
Pensions
The Company records pension costs and the funded status of its defined benefit pension plans using the applicableaccounting guidance for defined benefit pension and other post-retirement plans. This guidance requires that amountsrecognized in the financial statements be determined on an actuarial basis. The measurement of the retirement obligationsand costs of providing benefits under the Company’s pension plans involves various factors, including severalassumptions. The Company believes the most critical of these assumptions are the discount rate and the expected long-term rate of return on plan assets.
The Company determines the discount rate primarily by reference to rates of high-quality, long-term corporate andgovernment bonds that mature in a pattern similar to the expected payments to be made under the plans. The discountrate assumptions used to determine pension expense for the Company’s U.S. and foreign plans were as follows:
Discount Rate 2017 2016 2015
U.S. Plans ................................................................................................................... 3.8% 3.9% 3.6%Foreign Plans.............................................................................................................. 2.2 2.3 2.4
The Company has established strategic asset allocation percentage targets for significant asset classes with the aimof achieving an appropriate balance between risk and return. The Company periodically revises asset allocations, whereappropriate, in an effort to improve return and manage risk. The estimated rate of return is based on long-termexpectations given current investment objectives and historical results. The expected rate of return assumptions usedby the Company for its U.S. and foreign plans were as follows:
Expected rate of return 2017 2016 2015
U.S. Plans ................................................................................................................... 7.3% 8.3% 8.3%Foreign Plans.............................................................................................................. 3.1 3.2 3.4
36
The following table highlights the potential impact on the Company’s annual pension expense due to changes incertain key assumptions with respect to the Company’s plans, based on assets and liabilities at December 30, 2017:
(In millions) Increase Decrease
Discount rate change by 50 basis points ................................................................................... $ (1.8) $ 1.9Expected rate of return on plan assets change by 50 basis points............................................. (0.6) 0.6
Other Post Retirement Benefits
The Company accounts for its post-retirement benefit plan in accordance with applicable accounting guidance,which requires that amounts recognized in financial statements be determined on an actuarial basis. This determinationrequires the selection of various assumptions, including a discount rate, to value benefit obligations. The Companydetermines the discount rate primarily by reference to rates of return on high-quality, long term corporate bonds thatmature in a pattern similar to the expected payments to be made under the plan. The discount rate assumptions usedby the Company to determine other post-retirement benefit expense were 4.0 percent for 2017 and 2016, and 3.8 percentfor 2015. A change in discount rate of 50 basis points would not materially change the annual expense associated withthe plan.
Revenue Recognition
Revenue is recognized when the price is fixed, the title and risks and rewards of ownership have passed to thecustomer who, in most cases, is one of the Company’s independent distributors or a member of its independent salesforce, and when collection is reasonably assured. Depending on the contractual arrangements for each business, revenueis recognized upon either delivery or shipment, which is when title and risk and rewards of ownership have passed tothe customer. When revenue is recorded, estimates of returns are made and recorded as a reduction of revenue. Discountsearned based on promotional programs in place, volume of purchases or other factors are also estimated at the time ofrevenue recognition and recorded as a reduction of that revenue.
Stock-Based Compensation
The Company measures compensation cost for stock-based awards at fair value and recognizes compensation overthe service period for awards expected to vest. The Company uses the Black-Scholes option-pricing model to valuestock options, which requires the input of assumptions, including dividend yield, risk-free interest rate, the estimatedlength of time employees will retain their vested stock options before exercising them (expected term) and the estimatedvolatility of the Company's common stock price over the expected term.
Impact of Inflation
Inflation, as measured by consumer price indices, has continued at a low level in most of the countries in whichthe Company operates, except in South America, particularly in Argentina and Venezuela. Refer to Note 1 to theConsolidated Financial Statements in Part II, Item 8 of this Report for a discussion of inflation.
New Pronouncements
Refer to Note 1 to the Consolidated Financial Statements in Part II, Item 8 of this Report for a discussion of newaccounting pronouncements.
37
Item 7A. Quantitative and Qualitative Disclosures About Market Risk.
One of the Company's market risks is its exposure to the impact of interest rate changes on its borrowings. TheCompany has elected to manage this risk through the maturity structure of its borrowings and the currencies in whichit borrows.
Interest Rate Risk
Loans taken under the Credit Agreement are of a short duration and bear interest under a formula that includes, atthe Company's option, one of three different base rates, plus an applicable spread. The Company generally selectsLIBOR as its base rate. Although the Company’s euro LIBOR base rate was below zero throughout 2017, the base ratecannot be below zero under the Credit Agreement. As of December 30, 2017, the Credit Agreement dictated a spreadof 150 basis points, which gave the Company a weighted average interest rate on its U.S. dollar and euro denominatedLIBOR based borrowings under the Credit Agreement of 1.92 percent.
As of December 30, 2017, the Company had total borrowings of $131.0 million outstanding under its CreditAgreement, with $96.1 million denominated in euro. If short-term interest rates varied by 10 percent, which in theCompany's case would mean short duration U.S. dollar and euro LIBOR, with all other variables remaining constant,the Company's annual interest expense would not be significantly impacted.
The Company routinely increases its revolver borrowings under the Credit Agreement during each quarter to fundoperating, investing and financing activities and uses cash available at the end of each quarter to reduce borrowinglevels. As a result, the Company incurs more interest expense and has higher foreign exchange exposure on the valueof its cash and debt during each quarter than would relate solely to the quarter end balances.
Foreign Exchange Rate Risk
A significant portion of the Company's sales and profit come from its international operations. Although theseoperations are geographically dispersed, which partially mitigates the risks associated with operating in particularcountries, the Company is subject to the usual risks associated with international operations. These risks include localpolitical and economic environments and relations between foreign and U.S. governments.
Another economic risk of the Company is exposure to changes in foreign currency exchange rates on the earnings,cash flows and financial position of its international operations. The Company is not able to project, in any meaningfulway, the effect of these possible fluctuations on translated amounts or future earnings. This is due to the Company'sconstantly changing exposure to various currencies, the fact that all foreign currencies do not react in the same mannerin relation to the U.S. dollar and the large number of currencies involved, although the Company's most significantincome and cash flow exposures are to the Brazilian real, Chinese renminbi, euro, Indonesian rupiah and Mexican peso.
Although this currency risk is partially mitigated by the natural hedge arising from the Company's local productsourcing in many countries, a strengthening U.S. dollar generally has a negative impact on the Company. In responseto this fact, the Company uses financial instruments, such as forward contracts, to hedge its exposure to certain foreignexchange risks associated with a portion of its investment in international operations. In addition to hedging againstthe balance sheet impact of changes in exchange rates, the hedge of investments in international operations also hasthe effect of hedging cash flow generated by those operations. The Company also hedges, with these instruments,certain other exposures to various currencies arising from amounts payable and receivable, non-permanent intercompanytransactions and a portion of purchases forecasted for generally up to the following 15 months. The Company does notseek to hedge the impact of currency fluctuations on the translated value of the sales, profit or cash flow generated byits operations.
While the Company's derivatives that hedge a portion of its equity in its foreign subsidiaries and its fair valuehedges of balance sheet risks all work together to mitigate its exposure to foreign exchange gains or losses, they resultin an impact to operating cash flows as they are settled. The net cash flow impact of these currency hedges was aninflow of $0.1 million and outflows of $2.7 million and $17.0 million in 2017, 2016 and 2015, respectively.
38
The U.S. dollar equivalent of the Company's most significant net open forward contracts as of December 30, 2017were to buy U.S. dollars worth $68.9 million and euro worth $23.7 million, and to sell Mexican pesos worth $36.6million. In agreements to sell foreign currencies in exchange for U.S. dollars, for example, an appreciating dollar versusthe opposing currency would generate a cash inflow for the Company at settlement, with the opposite result in agreementsto buy foreign currencies for U.S. dollars. The notional amounts change based upon changes in the Company'soutstanding currency exposures. Based on rates existing as of December 30, 2017, the Company was in a net receivableposition of $2.6 million related to its currency hedges under forward contracts. Currency fluctuations could have asignificant impact on the Company's cash flow upon the settlement of its forward contracts. The Company records theimpact of forward points in net interest expense.
A precise calculation of the impact of currency fluctuations is not practical since some of the contracts are betweennon-U.S. dollar currencies. The Company continuously monitors its foreign currency exposure and expects to enterinto additional contracts to hedge exposure in the future. See further discussion regarding the Company's hedgingactivities for foreign currency in Note 8 to the Consolidated Financial Statements.
The Company is subject to credit risks relating to the ability of counterparties of hedging transactions to meet theircontractual payment obligations. The risks related to creditworthiness and non-performance have been considered inthe determination of fair value for the Company's foreign currency forward exchange contracts. The Company continuesto closely monitor its counterparties and will take action, as appropriate and possible, to further manage its counterpartycredit risk.
Commodity Price Risk
The Company is also exposed to rising material prices in its manufacturing operations and, in particular, the costof oil and natural gas-based resins, including the fact that in some cases resin prices are actually in, or are based on,currencies other than that of the unit buying the resin, which introduces a currency exposure that is incremental to theexposure to changing market prices. Resins are the primary material used in production of most Tupperware® products,and the Company estimates that 2018 cost of sales will include approximately $150 million for the cost of resin in theTupperware® brand products it produces and has contract manufactured. The Company uses many different kinds ofresins in its products. About three-fourths of its resins are “polyolefins” (simple chemical structure, easily refined fromoil and natural gas), and as such, the price of these is typically strongly affected by the underlying price of thosecommodities. The remaining one-fourth of its resins is more highly engineered, where the price of oil and natural gasplays a less direct role in determining price. With a comparable product mix and exchange rates, a 10 percent fluctuationin the cost of resin would impact the Company's annual cost of sales by approximately $15 million compared with theprior year. For 2017, the Company estimates there was a $7.0 million negative local currency impact on its gross marginrelated to sales of the Tupperware® products it produced and had contract manufactured due to resin cost changes, ascompared with 2016. For full year 2018, the estimated impact of resin cost changes, on a local currency basis, on theCompany's gross margin related to sales of the Tupperware® products it produces and has contract manufactured isnegative $4 million, as compared with 2017. In addition to the impact of the price of oil and natural gas, the price theCompany pays for its resins is also impacted by the relative changes in supply and demand. The Company partiallymanages its risk associated with rising resin costs by utilizing a centralized procurement function that is able to takeadvantage of bulk discounts while maintaining multiple suppliers, and also enters into short-term pricing arrangements.It also manages its margin through cash flow hedges in some cases when it purchases resin in currencies, or effectivelyin currencies, other than that of the purchasing unit, through the pricing of its products, with price increases on itsproduct offerings generally in line with consumer inflation in each market, and its mix of sales through its promotionalprograms and promotionally priced offers. It also, on occasion, makes advance material purchases to take advantageof current favorable pricing. At this point in time, the Company has determined that entering into forward contracts forresin is not practical or cost beneficial and has no such contracts in place. However, should circumstances warrant, theCompany may consider such contracts in the future.
The Company has a program to sell land held for development around its Orlando, Florida headquarters. Thisprogram is exposed to the risks inherent in the real estate development process. Included among these risks is the abilityto obtain all necessary government approvals, the success of attracting tenants for commercial or residentialdevelopments in the Orlando real estate market, obtaining financing and general economic conditions, such as interestrate increases. Based on the variety of factors that impact the Company's ability to close sales transactions, it cannotpredict when the program will be completed.
39
Forward-Looking Statements
Certain written and oral statements made or incorporated by reference from time to time by the Company or itsrepresentatives in this report, other reports, filings with the SEC, press releases, conferences or otherwise are “forward-looking statements” within the meaning of the Private Securities Litigation Reform Act of 1995. Statements in thisreport or elsewhere that are not based on historical facts or information are forward-looking statements. Statementsthat include the words “believes,” “expects,” “anticipates,” “intends,” “projects,” “estimates,” “plans” and similarexpressions or future or conditions verbs such as “will,” “should,” “would,” “may” and “could” are generally forward-looking in nature and not historical facts. Where, in any forward-looking statement, the Company expresses anexpectation or belief as to future results or events, such expectation or belief is based on the current plans and expectationsat the time this report is filed with the SEC or, with respect to any documents incorporated by reference, available atthe time such document was prepared or filed with the SEC. Such forward-looking statements involve risks anduncertainties that may cause actual results to differ materially from those projected in forward-looking statements.Except as required by law, the Company undertakes no obligation to update or revise any forward-looking statementsto reflect changed assumptions, the occurrence of anticipated or unanticipated events, new information or changes tofuture results over time or otherwise. Such risks and uncertainties include, among others, the following:
• successful recruitment, retention and productivity levels of the Company's independent sales forces;
• disruptions caused by the introduction of new or revised distributor operating models or sales forcecompensation systems or allegations by equity analysts, former distributors or sales force members,government agencies or others as to the legality or viability of the Company's business model, particularlyin India;
• disruptions caused by restructuring activities impacting business models, the supply chain, facility closure,and the combination and exit of business units, as well as not fully realizing expected savings from actionstaken;
• success of new products and promotional programs;
• the ability to implement appropriate product mix and pricing strategies;
• governmental regulation of materials used in products coming into contact with food (e.g. polycarbonateand polyethersulfone), as well as beauty, personal care and nutritional products;
• the ability to procure and pay for at reasonable economic cost, sufficient raw materials and/or finished goodsto meet current and future consumer demands at reasonable suggested retail pricing levels in certain markets,particularly Argentina, Ecuador, Egypt, Philippines and Venezuela due to government regulations andrestrictions;
• the impact of changes in consumer spending patterns and preferences, particularly given the global natureof the Company's business;
• the value of long-term assets, particularly goodwill and indefinite and definite-lived intangibles associatedwith acquisitions, and the realizability of the value of recognized tax assets;
• changes in plastic resin prices, other raw materials and packaging components, the cost of converting suchitems into finished goods and procured finished products and the cost of delivering products to customers;
• the introduction of Company operations in new markets outside the United States;
• general social, economic and political conditions in markets, such as in Argentina, Brazil, Ecuador, Egypt,Greece, India, Kazakhstan, Russia, Turkey, Ukraine and Venezuela and other countries impacted by suchevents;
• issues arising out of the sovereign debt in the countries in which the Company operates, such as in Argentinaand those in the Euro zone, resulting in potential economic and operational challenges for the Company'ssupply chains, heightened counterparty credit risk due to adverse effects on customers and suppliers,exchange controls (such as in Argentina, Egypt and Venezuela) and translation risks due to potentialimpairments of investments in affected markets and the potential for banks with which the Companymaintains lines of credit to be unable to fulfill their commitments;
40
• disruptions resulting from either internal or external labor strikes, work stoppages, or similar difficulties,particularly in France and South Africa;
• changes in cash flow resulting from changes in operating results, including from changes in foreign exchangerates, restructuring activities, working capital management, debt payments, share repurchases and hedgesettlements;
• the impact of currency fluctuations on the value of the Company's operating results, assets, liabilities andcommitments of foreign operations generally, including their cash balances during and at the end of quarterlyreporting periods, the results of those operations, the cost of sourcing products across geographies and thesuccess of foreign hedging and risk management strategies;
• the impact of natural disasters, terrorist activities and epidemic or pandemic disease outbreaks;
• the ability to repatriate, or otherwise make available, cash in the United States and to do so at a favorableforeign exchange rate and with favorable tax ramifications, particularly from Brazil, China, India, Korea,Indonesia and Mexico;
• the ability to obtain all government approvals on, and to control the cost of infrastructure obligationsassociated with, property, plant and equipment;
• the ability to timely and effectively implement, transition, maintain and protect necessary informationtechnology systems and infrastructure;
• cyber attacks and ransomware demands that could cause the Company to not be able to operate its systemsand/or access or control its data, including private data and/or costs incurred in light of such issues;
• the ability to attract and retain certain executive officers and key management personnel and the success oftransitions or changes in leadership or key management personnel;
• the success of land buyers in attracting tenants for commercial and residential development and obtainingfinancing;
• the costs and covenant restrictions associated with the Company's credit arrangements;
• integration of non-traditional product lines into Company operations;
• the effect of legal, regulatory and tax proceedings, as well as restrictions imposed on the Company'soperations or Company representatives by foreign governments, including exposure to tax responsibilitiesimposed on the sales force and their potential impact on the sales force's value chain and resulting disruptionto the business and actions taken by governments to set or restrict the freedom of the Company to set itsown prices or its suggested retail prices for product sales by its sales force to end consumers and actionstaken by governments to restrict the ability to convert local currency to other currencies in order to satisfyobligations outside the country generally, and in particular in Argentina, Egypt and Venezuela;
• the effect of competitive forces in the markets in which the Company operates, particularly related to salesof beauty, personal care and nutritional products, where there are a greater number of competitors;
• the impact of counterfeit and knocked-off products and programs in the markets in which the Companyoperates and the effect this can have on the confidence of the Company's sales force members;
• the impact of changes, changes in interpretation of or challenges to positions taken by the Company withrespect to U.S. federal, state and foreign tax or other laws, including with respect to the Tax Act in the U.S.and non-income taxes issues in Brazil, India and the Philippines;
• the Company's access to, and the costs of, financing; and
• other risks discussed in Part I, Item 1A, Risk Factors, of this Report, as well as the Company's ConsolidatedFinancial Statements, Notes to Consolidated Financial Statements, other financial information appearingelsewhere in this Report and the Company's other filings with the SEC.
41

Other than updating for changes in foreign currency exchange rates through its monthly website updates, theCompany does not intend to update forward-looking information, except through its quarterly earnings releases, unlessit expects diluted earnings per share for the current quarter, excluding items impacting comparability and changesversus its guidance of the impact of changes in foreign exchange rates, to be significantly below its previous guidance.
Investors should also be aware that while the Company does, from time to time, communicate with securitiesanalysts, it is against the Company's policy to disclose to them any material non-public information or other confidentialcommercial information. Accordingly, it should not be assumed that the Company agrees with any statement or reportissued by any analyst irrespective of the content of the confirming financial forecasts or projections issued by others.
42
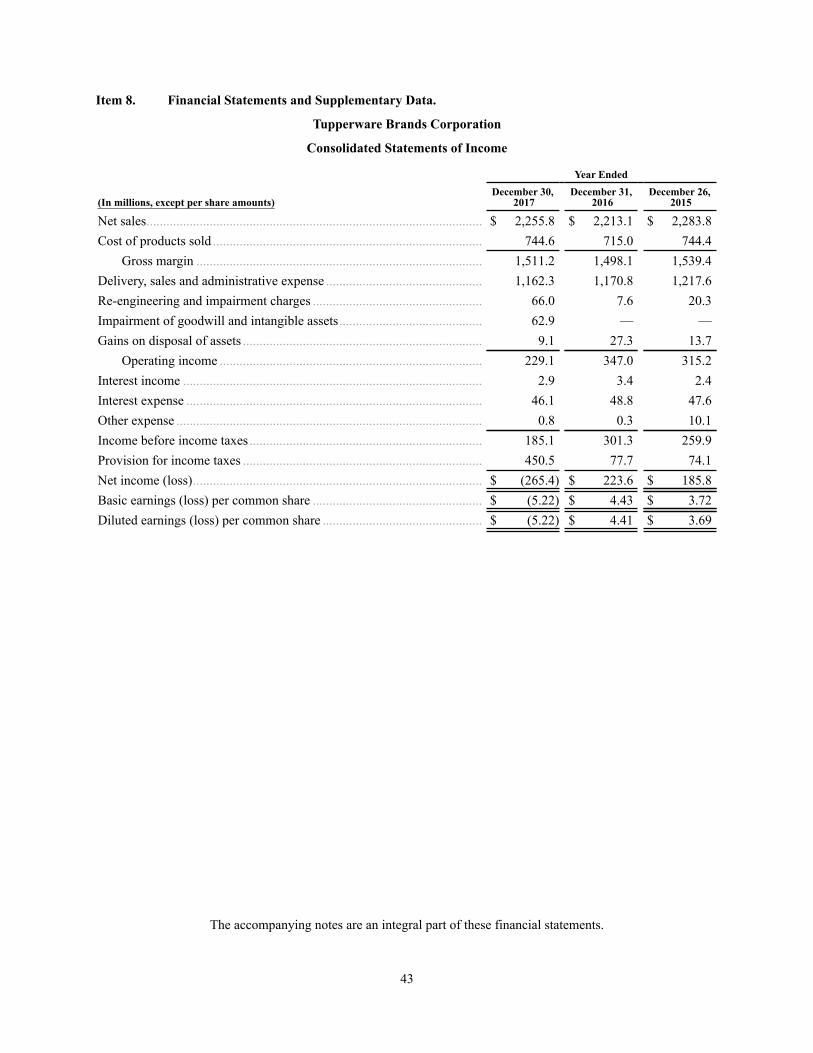
Item 8. Financial Statements and Supplementary Data.
43
Tupperware Brands Corporation
Consolidated Statements of Income
Year Ended
(In millions, except per share amounts)December 30,
2017December 31,
2016December 26,
2015
Net sales..................................................................................................... $ 2,255.8 $ 2,213.1 $ 2,283.8Cost of products sold ................................................................................. 744.6 715.0 744.4
Gross margin ...................................................................................... 1,511.2 1,498.1 1,539.4Delivery, sales and administrative expense ............................................... 1,162.3 1,170.8 1,217.6Re-engineering and impairment charges ................................................... 66.0 7.6 20.3Impairment of goodwill and intangible assets........................................... 62.9 — —Gains on disposal of assets ........................................................................ 9.1 27.3 13.7
Operating income ............................................................................... 229.1 347.0 315.2Interest income .......................................................................................... 2.9 3.4 2.4Interest expense ......................................................................................... 46.1 48.8 47.6Other expense ............................................................................................ 0.8 0.3 10.1Income before income taxes...................................................................... 185.1 301.3 259.9Provision for income taxes ........................................................................ 450.5 77.7 74.1Net income (loss)....................................................................................... $ (265.4) $ 223.6 $ 185.8Basic earnings (loss) per common share ................................................... $ (5.22) $ 4.43 $ 3.72Diluted earnings (loss) per common share ................................................ $ (5.22) $ 4.41 $ 3.69
The accompanying notes are an integral part of these financial statements.
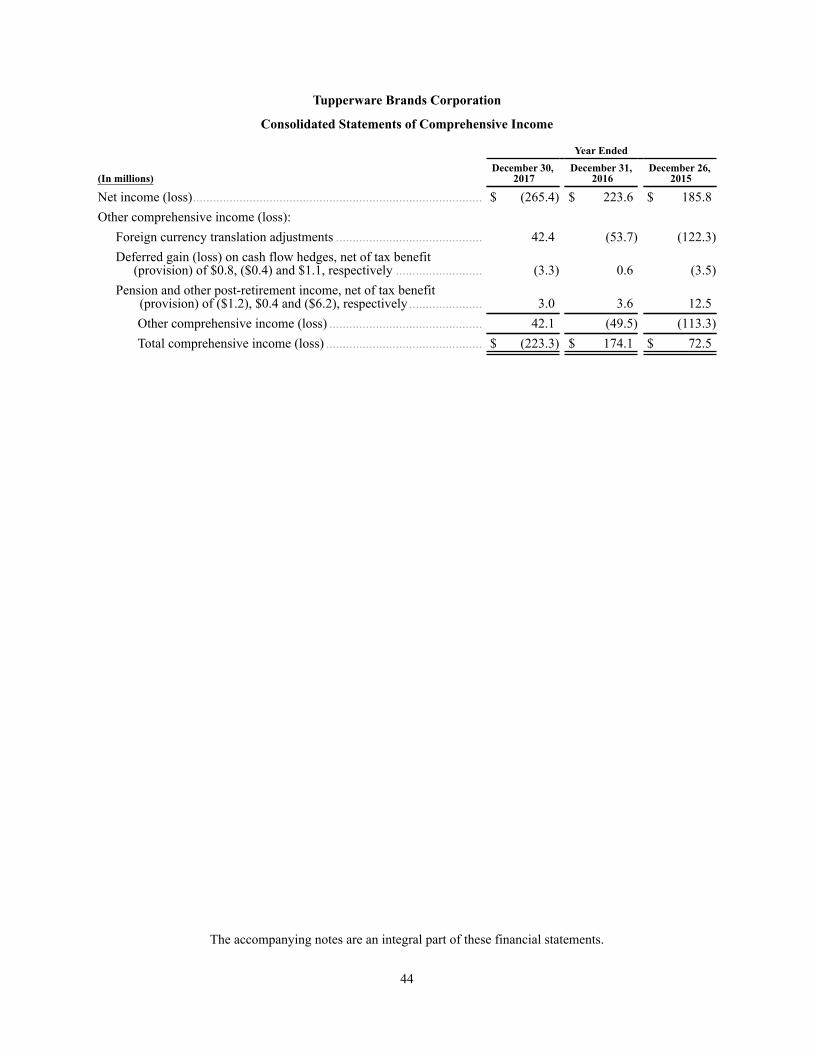
Tupperware Brands Corporation
Consolidated Statements of Comprehensive Income
Year Ended
(In millions)December 30,
2017December 31,
2016December 26,
2015
Net income (loss)....................................................................................... $ (265.4) $ 223.6 $ 185.8Other comprehensive income (loss):
Foreign currency translation adjustments ............................................ 42.4 (53.7) (122.3)Deferred gain (loss) on cash flow hedges, net of tax benefit
(provision) of $0.8, ($0.4) and $1.1, respectively .......................... (3.3) 0.6 (3.5)Pension and other post-retirement income, net of tax benefit
(provision) of ($1.2), $0.4 and ($6.2), respectively ...................... 3.0 3.6 12.5Other comprehensive income (loss) .............................................. 42.1 (49.5) (113.3)Total comprehensive income (loss) ............................................... $ (223.3) $ 174.1 $ 72.5
The accompanying notes are an integral part of these financial statements.
44
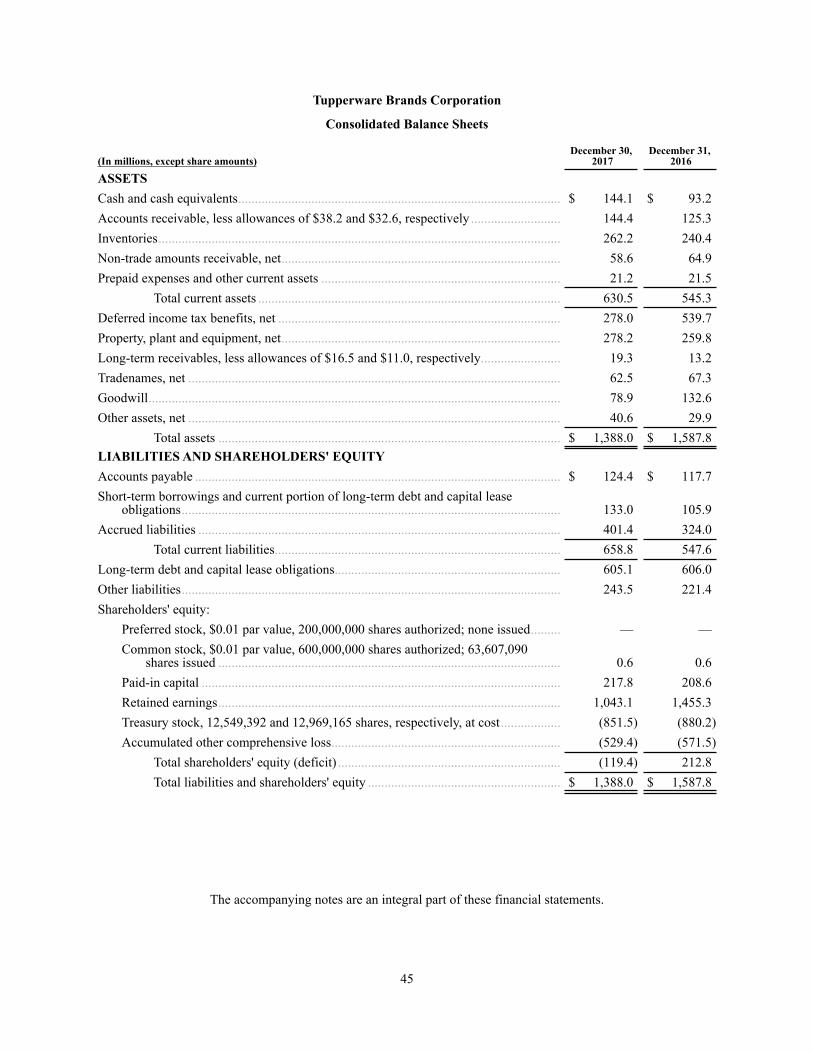
Tupperware Brands Corporation
Consolidated Balance Sheets
(In millions, except share amounts)December 30,
2017December 31,
2016
ASSETSCash and cash equivalents................................................................................................. $ 144.1 $ 93.2Accounts receivable, less allowances of $38.2 and $32.6, respectively ........................... 144.4 125.3Inventories......................................................................................................................... 262.2 240.4Non-trade amounts receivable, net.................................................................................... 58.6 64.9Prepaid expenses and other current assets ........................................................................ 21.2 21.5
Total current assets ........................................................................................... 630.5 545.3Deferred income tax benefits, net ..................................................................................... 278.0 539.7Property, plant and equipment, net.................................................................................... 278.2 259.8Long-term receivables, less allowances of $16.5 and $11.0, respectively........................ 19.3 13.2Tradenames, net ................................................................................................................ 62.5 67.3Goodwill............................................................................................................................ 78.9 132.6Other assets, net ................................................................................................................ 40.6 29.9
Total assets ....................................................................................................... $ 1,388.0 $ 1,587.8LIABILITIES AND SHAREHOLDERS' EQUITYAccounts payable .............................................................................................................. $ 124.4 $ 117.7Short-term borrowings and current portion of long-term debt and capital lease
obligations.................................................................................................................. 133.0 105.9Accrued liabilities ............................................................................................................. 401.4 324.0
Total current liabilities...................................................................................... 658.8 547.6Long-term debt and capital lease obligations.................................................................... 605.1 606.0Other liabilities.................................................................................................................. 243.5 221.4Shareholders' equity:
Preferred stock, $0.01 par value, 200,000,000 shares authorized; none issued......... — —Common stock, $0.01 par value, 600,000,000 shares authorized; 63,607,090
shares issued ....................................................................................................... 0.6 0.6Paid-in capital ............................................................................................................ 217.8 208.6Retained earnings....................................................................................................... 1,043.1 1,455.3Treasury stock, 12,549,392 and 12,969,165 shares, respectively, at cost.................. (851.5) (880.2)Accumulated other comprehensive loss..................................................................... (529.4) (571.5)
Total shareholders' equity (deficit) ................................................................... (119.4) 212.8Total liabilities and shareholders' equity .......................................................... $ 1,388.0 $ 1,587.8
The accompanying notes are an integral part of these financial statements.
45
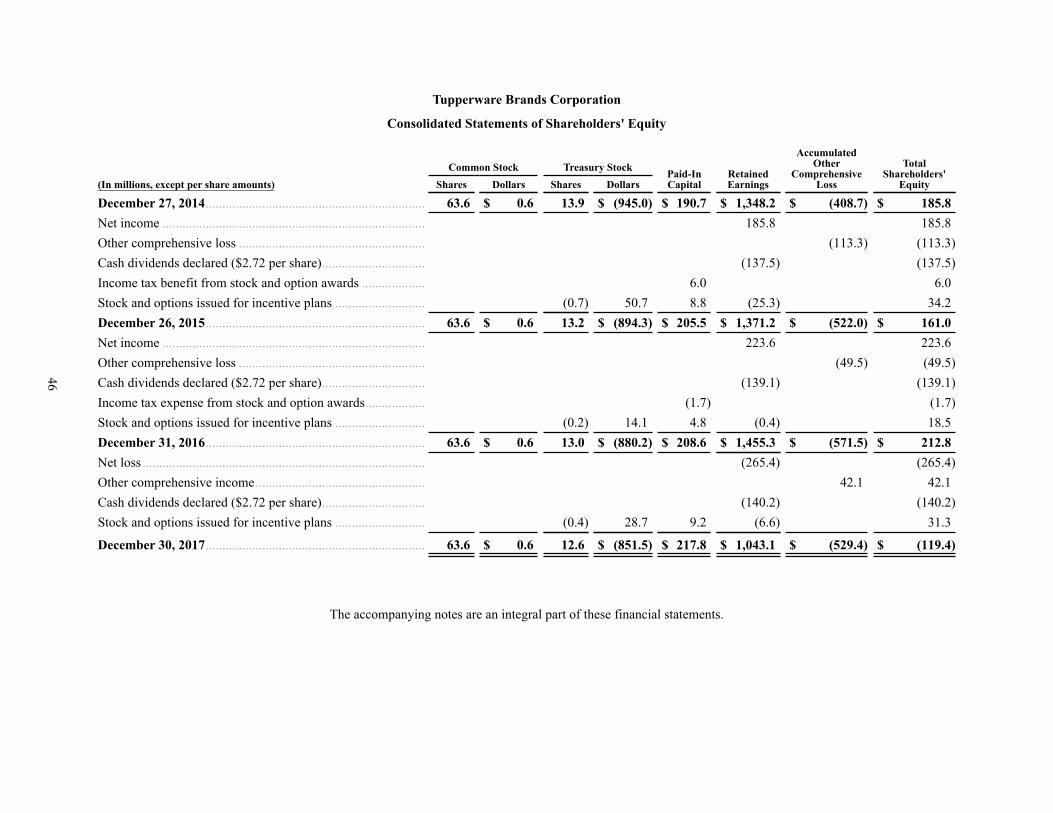
Tupperware Brands Corporation
Consolidated Statements of Shareholders' Equity
Common Stock Treasury Stock Paid-InCapital
RetainedEarnings
AccumulatedOther
ComprehensiveLoss
TotalShareholders'
Equity(In millions, except per share amounts) Shares Dollars Shares Dollars
December 27, 2014.................................................................. 63.6 $ 0.6 13.9 $ (945.0) $ 190.7 $ 1,348.2 $ (408.7) $ 185.8Net income ............................................................................... 185.8 185.8Other comprehensive loss ........................................................ (113.3) (113.3)Cash dividends declared ($2.72 per share)............................... (137.5) (137.5)Income tax benefit from stock and option awards ................... 6.0 6.0Stock and options issued for incentive plans ........................... (0.7) 50.7 8.8 (25.3) 34.2December 26, 2015.................................................................. 63.6 $ 0.6 13.2 $ (894.3) $ 205.5 $ 1,371.2 $ (522.0) $ 161.0Net income ............................................................................... 223.6 223.6Other comprehensive loss ........................................................ (49.5) (49.5)Cash dividends declared ($2.72 per share)............................... (139.1) (139.1)Income tax expense from stock and option awards.................. (1.7) (1.7)Stock and options issued for incentive plans ........................... (0.2) 14.1 4.8 (0.4) 18.5December 31, 2016.................................................................. 63.6 $ 0.6 13.0 $ (880.2) $ 208.6 $ 1,455.3 $ (571.5) $ 212.8Net loss ..................................................................................... (265.4) (265.4)Other comprehensive income................................................... 42.1 42.1Cash dividends declared ($2.72 per share)............................... (140.2) (140.2)Stock and options issued for incentive plans ........................... (0.4) 28.7 9.2 (6.6) 31.3
December 30, 2017.................................................................. 63.6 $ 0.6 12.6 $ (851.5) $ 217.8 $ 1,043.1 $ (529.4) $ (119.4)
The accompanying notes are an integral part of these financial statements.
46
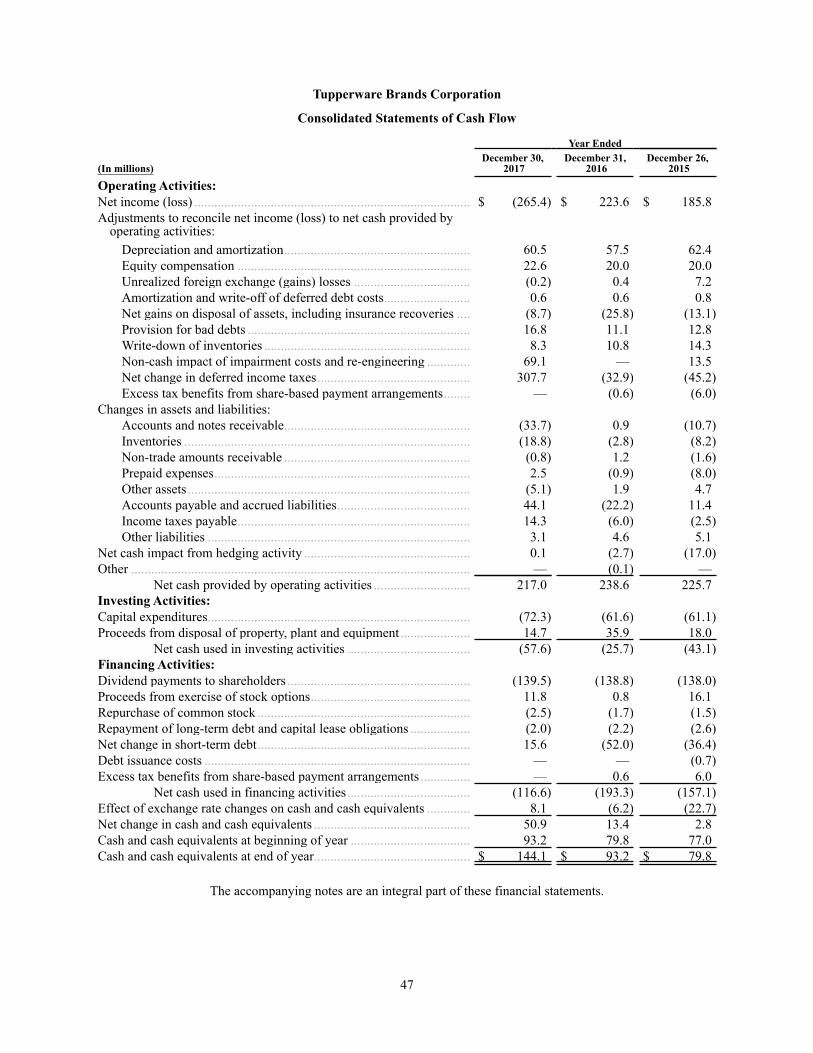
Tupperware Brands Corporation
Consolidated Statements of Cash Flow
Year Ended
(In millions)December 30,
2017December 31,
2016December 26,
2015
Operating Activities:Net income (loss) ................................................................................... $ (265.4) $ 223.6 $ 185.8Adjustments to reconcile net income (loss) to net cash provided by
operating activities:Depreciation and amortization........................................................ 60.5 57.5 62.4Equity compensation ...................................................................... 22.6 20.0 20.0Unrealized foreign exchange (gains) losses ................................... (0.2) 0.4 7.2Amortization and write-off of deferred debt costs.......................... 0.6 0.6 0.8Net gains on disposal of assets, including insurance recoveries .... (8.7) (25.8) (13.1)Provision for bad debts ................................................................... 16.8 11.1 12.8Write-down of inventories .............................................................. 8.3 10.8 14.3Non-cash impact of impairment costs and re-engineering ............. 69.1 — 13.5Net change in deferred income taxes.............................................. 307.7 (32.9) (45.2)Excess tax benefits from share-based payment arrangements........ — (0.6) (6.0)
Changes in assets and liabilities:Accounts and notes receivable........................................................ (33.7) 0.9 (10.7)Inventories ...................................................................................... (18.8) (2.8) (8.2)Non-trade amounts receivable ........................................................ (0.8) 1.2 (1.6)Prepaid expenses............................................................................. 2.5 (0.9) (8.0)Other assets..................................................................................... (5.1) 1.9 4.7Accounts payable and accrued liabilities........................................ 44.1 (22.2) 11.4Income taxes payable...................................................................... 14.3 (6.0) (2.5)Other liabilities ............................................................................... 3.1 4.6 5.1
Net cash impact from hedging activity .................................................. 0.1 (2.7) (17.0)Other ...................................................................................................... — (0.1) —
Net cash provided by operating activities ............................. 217.0 238.6 225.7Investing Activities:Capital expenditures............................................................................... (72.3) (61.6) (61.1)Proceeds from disposal of property, plant and equipment ..................... 14.7 35.9 18.0
Net cash used in investing activities ..................................... (57.6) (25.7) (43.1)Financing Activities:Dividend payments to shareholders ....................................................... (139.5) (138.8) (138.0)Proceeds from exercise of stock options................................................ 11.8 0.8 16.1Repurchase of common stock ................................................................ (2.5) (1.7) (1.5)Repayment of long-term debt and capital lease obligations .................. (2.0) (2.2) (2.6)Net change in short-term debt................................................................ 15.6 (52.0) (36.4)Debt issuance costs ................................................................................ — — (0.7)Excess tax benefits from share-based payment arrangements............... — 0.6 6.0
Net cash used in financing activities..................................... (116.6) (193.3) (157.1)Effect of exchange rate changes on cash and cash equivalents ............. 8.1 (6.2) (22.7)Net change in cash and cash equivalents ............................................... 50.9 13.4 2.8Cash and cash equivalents at beginning of year .................................... 93.2 79.8 77.0Cash and cash equivalents at end of year............................................... $ 144.1 $ 93.2 $ 79.8
The accompanying notes are an integral part of these financial statements.
47
Notes to the Consolidated Financial Statements
48
Note 1: Summary of Significant Accounting Policies
Principles of Consolidation. The condensed consolidated financial statements include the accounts of TupperwareBrands Corporation and its subsidiaries, collectively “Tupperware” or the “Company”, with all intercompanytransactions and balances having been eliminated. The Company’s fiscal year ends on the last Saturday of Decemberand included 53 weeks during 2016 and 52 weeks during 2017 and 2015.
Use of Estimates. The preparation of financial statements in conformity with accounting principles generallyaccepted in the United States of America requires management to make estimates and assumptions. These estimatesand assumptions affect the reported amounts of assets and liabilities and disclosure of contingent liabilities at the dateof the financial statements, as well as the reported amounts of revenues and expenses during the reporting period. Actualresults could differ materially from these estimates.
Cash and Cash Equivalents. The Company considers all highly liquid investments with a maturity of three monthsor less when purchased to be cash equivalents. As of December 30, 2017 and December 31, 2016, $10.2 million and$9.6 million, respectively, of the cash and cash equivalents included on the Consolidated Balance Sheets were held inthe form of time deposits, certificates of deposit or similar instruments.
Allowance for Doubtful Accounts. The Company maintains current receivable amounts with most of its independentdistributors and sales force in certain markets. It also maintains long-term receivable amounts with certain of thesecustomers. The Company regularly monitors and assesses its risk of not collecting amounts owed to it by customers.This evaluation is based upon an analysis of amounts current and past due, along with relevant history and facts particularto the customer. It is also based upon estimates of distributor business prospects, particularly related to the evaluationof the recoverability of long-term amounts due. This evaluation is performed by business unit and account by account,based upon historical experience, market penetration levels and similar factors. It also considers collateral of thecustomer that could be recovered to satisfy debts. The Company records its allowance for doubtful accounts based onthe results of this analysis. The analysis requires the Company to make significant estimates and as such, changes infacts and circumstances could result in material changes in the allowance for doubtful accounts. The Company considersas past due any receivable balance not collected within its contractual terms.
Inventories. Inventories are valued at the lower of cost or net realizable value on a first-in, first-out basis. Inventorycost includes cost of raw material, labor and overhead. The Company writes down its inventory for obsolescence orunmarketability in an amount equal to the difference between the cost of the inventory and estimated market valuebased upon expected future demand and pricing. The demand and pricing is estimated based upon the historical successof product lines as well as the projected success of promotional programs, new product introductions and the availabilityof new markets or distribution channels. The Company prepares projections of demand and pricing on an item by itembasis for all of its products. If inventory on hand exceeds projected demand or the expected market value is less thanthe carrying value, the excess is written down to its net realizable value. However, if actual demand or the estimate ofmarket value decreases, additional write-downs would be required.
Internal Use Software Development Costs. The Company capitalizes internal use software development costs asthey are incurred and amortizes such costs over their estimated useful lives of three to five years, beginning when thesoftware is placed in service. Net unamortized costs of such amounts included in property, plant and equipment were$24.4 million and $21.3 million at December 30, 2017 and December 31, 2016, respectively. Amortization cost relatedto internal use software development costs totaled $5.4 million, $6.9 million and $5.7 million in 2017, 2016 and 2015,respectively.
Property, Plant and Equipment. Property, plant and equipment is initially stated at cost. Depreciation is recordedon a straight-line basis over the following estimated useful lives of the assets:
Years
Building and improvements.............................................................................................................................. 10 - 40Molds ................................................................................................................................................................ 4 - 10Production equipment....................................................................................................................................... 10 - 20Distribution equipment ..................................................................................................................................... 5 - 10Computer/telecom equipment........................................................................................................................... 3 - 5Capitalized software ......................................................................................................................................... 3 - 5
Depreciation expense was $45.6 million, $43.0 million and $46.5 million in 2017, 2016 and 2015, respectively.The Company considers the need for an impairment review when events occur that indicate that the book value of along-lived asset may exceed its recoverable value. Upon the sale or retirement of property, plant and equipment, a gainor loss, if any, is recognized equal to the difference between sales price and net book value. Expenditures for maintenanceand repairs are charged to cost of products sold or delivery, sales and administrative (DS&A) expense, depending onthe asset to which the expenditure relates.
Goodwill. The Company's recorded goodwill relates primarily to the December 2005 acquisition of the direct-to-consumer businesses of Sara Lee Corporation. The Company does not amortize its goodwill. Instead, the Companyperforms an annual assessment during the third quarter of each year to evaluate the assets in each of its reporting unitsfor impairment, or more frequently if events or changes in circumstances indicate that a triggering event for animpairment evaluation has occurred. The Company has early adopted the Financial Accounting Standards Board's("FASB") Accounting Standards Update 2017-04: Simplifying the Test for Goodwill Impairment.
The annual process for evaluating goodwill begins with an assessment for each entity of qualitative factors todetermine whether a quantitative evaluation of the unit's fair value compared with its carrying value is appropriate fordetermining potential goodwill impairment. The qualitative factors evaluated by the Company include: macro-economicconditions of the local business environment, overall financial performance, sensitivity analysis from the most recentquantitative fair value evaluation ("fair value test"), as prescribed under Accounting Standards Codification ("ASC")350, Intangibles - Goodwill and Other, and other entity specific factors as deemed appropriate. When the Companydetermines a fair value test is appropriate, it estimates the fair value of the reporting unit and compares the result withits carrying amount, including goodwill, after any long-lived asset impairment charges. If the carrying amount of thereporting unit exceeds its fair value, an impairment charge is recorded equal to the amount by which the carrying valueexceeds the fair value, up to the amount of goodwill associated with the reporting unit.
Any fair value test necessary is done by using either the income approach or a combination of the income andmarket approaches, with generally a greater weighting on the income approach (75 percent). The income approach, ordiscounted cash flow approach, requires significant assumptions to estimate the fair value of each reporting unit. Theseinclude assumptions regarding future operations and the ability to generate cash flows, including projections of revenue,costs, utilization of assets and capital requirements, along with an appropriate discount rate to be used. The most sensitiveestimate in the fair value test is the projection of operating cash flows, as these provide the basis for the estimate offair market value. The Company’s cash flow model uses a forecast period of 10 years and a terminal value. The growthrates are determined by reviewing historical results of the operating unit and the historical results of the Company’ssimilar business units, along with the expected contribution from growth strategies being implemented. The marketapproach relies on an analysis of publicly-traded companies similar to Tupperware and deriving a range of revenueand profit multiples. The publicly-traded companies used in the market approach are selected based on their havingsimilar product lines of consumer goods, beauty products and/or companies using a direct-to-consumer distributionmethod. The resulting multiples are then applied to the reporting unit to determine fair value. Goodwill is furtherdiscussed in Note 6 to the Consolidated Financial Statements.
49
Intangible Assets. Intangible assets are recorded at their fair market values at the date of acquisition and definite-lived intangibles are amortized over their estimated useful lives. The intangible assets included in the Company'sConsolidated Financial Statements at December 30, 2017 and December 31, 2016 were related to the acquisition ofthe Sara Lee direct-to-consumer businesses in December 2005. The weighted average estimated useful lives of theCompany's intangible assets were as follows:
Weighted AverageEstimated Useful Life
Indefinite-lived tradenames............................................................................................................ IndefiniteDefinite-lived tradename................................................................................................................ 10 years
The Company's indefinite-lived tradename intangible assets are evaluated for impairment annually similarly togoodwill beginning with a qualitative assessment. The annual process for assessing the carrying value of indefinite-lived tradename intangible assets begins with a qualitative assessment that is similar to the assessment performed forgoodwill. When the Company determines it is appropriate, the quantitative impairment evaluation for the Company'sindefinite-lived tradenames involves comparing the estimated fair value of the assets to the carrying amounts, todetermine if fair value is lower and a write-down required. If the carrying amount of a tradename exceeds its estimatedfair value, an impairment charge is recognized in an amount equal to the excess. The fair value of these assets is estimatedusing the relief from royalty method, which is a form of the income approach. Under this method, the value of the assetis calculated by selecting a royalty rate, which estimates the amount a company would be willing to pay for the use ofthe asset. This rate is applied to the reporting unit's projected revenue, tax affected and discounted to present value.
The Company's definite-lived intangible asset relates to the Fuller tradename and is being amortized since August2013 based on its estimated useful life of 10 years. The Fuller tradename's useful life was estimated, at that time, basedon the period that the tradename was expected to contribute directly to the Company's revenue. Definite-lived intangibleassets are reviewed for impairment in a similar manner as property, plant and equipment as discussed above. Amortizationrelated to definite-lived intangible assets is included in DS&A on the Consolidated Statements of Income. Intangibleassets are further discussed in Note 6 to the Consolidated Financial Statements.
Promotional and Other Accruals. The Company frequently makes promotional offers to members of its independentsales force to encourage them to fulfill specific goals or targets for sales levels, party attendance, addition of new salesforce members or other business-critical functions. The awards offered are in the form of product awards, special prizesor trips.
Programs are generally designed to recognize sales force members for achieving a primary objective. An exampleis holding a certain number of product demonstrations. In this situation, the Company offers a prize to sales forcemembers that achieve the targeted number of product demonstrations over a specified period. The period runs from acouple of weeks to several months. The prizes are generally graded, in that meeting one level may result in receivinga piece of jewelry, with higher achievement resulting in more valuable prizes such as a television set or a trip. Similarprograms are designed to reward current sales force members who reach certain goals by promoting them to a higherlevel in the organization where their earning opportunity would be expanded, and they would take on additionalresponsibilities for adding new sales force members and providing training and motivation to new and existing salesforce members. Other business drivers, such as scheduling product demonstrations, increasing the number of salesforce members, holding product demonstrations or increasing end consumer attendance at product demonstrations,may also be the focus of a program.
The Company also offers commissions for achieving targeted sales levels. These types of awards are generallybased upon the sales achievement of at least a mid-level member of the sales force, and her or his down-line members. Thedown-line consists of those sales force members that have been directly added to the sales force by a given sales forcemember, as well as those added by her or his down-line member. In this manner, sales force members can build anextensive organization over time if they are committed to adding and developing their units. In addition to thecommission, the positive performance of a unit may also entitle its leader to the use of a company-provided vehicleand in some cases, the permanent awarding of a vehicle. Similar to the prize programs noted earlier, these programsgenerally offer varying levels of vehicles that are dependent upon performance.
50
The Company accrues for the costs of these awards during the period over which the sales force qualifies for theaward and reports these costs primarily as a component of DS&A expense. These accruals require estimates as to thecost of the awards, based upon estimates of achievement and actual cost to be incurred. During the qualification period,actual results are monitored and changes to the original estimates are made when known. Promotional and other salesforce compensation expenses included in DS&A expense totaled $356.2 million, $376.2 million and $378.7 million in2017, 2016 and 2015, respectively.
Like promotional accruals, other accruals are recorded over the time period that a liability is incurred and is bothprobable and reasonably estimable. Adjustments to amounts previously accrued are made when changes occur in thefacts and circumstances that generated the accrual.
Revenue Recognition. Revenue is recognized when the price is fixed, the title and risks and rewards of ownershiphave passed to the customer who, in most cases, is one of the Company’s independent distributors or a member of itsindependent sales force, and when collection is reasonably assured. Depending on the contractual arrangements foreach business, revenue is recognized upon either delivery or shipment, which is when title and risk and rewards ofownership have passed to the customer. When revenue is recorded, estimates of returns are made and recorded as areduction of revenue. Discounts earned based on promotional programs in place, volume of purchases or other factorsare also estimated at the time of revenue recognition and recorded as a reduction of that revenue.
Shipping and Handling Costs. The cost of products sold line item includes costs related to the purchase andmanufacture of goods sold by the Company. Among these costs are inbound freight charges, duties, purchasing andreceiving costs, inspection costs, depreciation expense, internal transfer costs and warehousing costs of raw material,work in process and packing materials. The warehousing and distribution costs of finished goods are included in DS&Aexpense. Distribution costs are comprised of outbound freight and associated labor costs. Fees billed to customersassociated with the distribution of products are classified as revenue. The distribution costs included in DS&A expensein 2017, 2016 and 2015 were $142.2 million, $137.0 million and $139.3 million, respectively.
Advertising and Research and Development Costs. Advertising and research and development costs are chargedto expense as incurred. Advertising expense totaled $9.3 million, $8.3 million and $13.4 million in 2017, 2016 and2015, respectively. Research and development costs totaled $16.7 million, $18.3 million and $18.1 million, in 2017,2016 and 2015, respectively. Research and development expenses primarily include salaries, contractor costs and facilitycosts. Both advertising and research and development costs are included in DS&A expense.
Accounting for Stock-Based Compensation. The Company has several stock-based employee and directorcompensation plans, which are described more fully in Note 14 to the Consolidated Financial Statements. Compensationcost for share-based awards is recorded on a straight line basis over the required service period, based on the fair valueof the award. The fair value of the stock option grants is estimated using the Black-Scholes option-pricing model, whichrequires assumptions, including dividend yield, risk-free interest rate, the estimated length of time employees will retaintheir stock options before exercising them (expected term) and the estimated volatility of the Company's common stockprice over the expected term. These assumptions are generally based on historical averages of the Company.
Compensation expense associated with restricted stock, restricted stock units and performance-vested share awardsis equal to the market value of the Company's common stock on the date of grant and is recorded pro rata over therequired service period. The fair value of market-vested awards is based on a Monte-Carlo simulation that estimatesthe fair value based on the Company's share price activity between the beginning of the year and the grant date relativeto a defined comparative group of companies, expected term of the award, risk-free interest rate, expected dividends,and the expected volatility of the stock of the Company and those in the comparative group. The grant date fair valueper share of market-vested awards already reflects the probability of achieving the market condition, and is thereforeused to record expense straight line over the performance period regardless of actual achievement. For those awardswith performance vesting criteria, the expense is recorded straight-line over the required service period based on anassessment of achieving the criteria.
51
Through 2016, the Company reported the excess tax benefits from share-based payment arrangements as an inflowfrom financing activities. For 2016 and 2015, the Company generated $0.6 million and $6.0 million of excess taxbenefits, respectively. Effective as of the beginning of 2017, the tax effects from share-based payments is recognizedas part of the Company's tax provision and is included in net income within operating activities on the statement ofcash flows.
Income Taxes. Deferred tax assets and liabilities are recognized for the future tax consequences attributable totemporary differences between the financial statement carrying amounts of assets and liabilities and their respectivetax bases. Deferred tax assets also are recognized for credit carryforwards. Deferred tax assets and liabilities are measuredusing the enacted rates applicable to taxable income in the years in which the temporary differences are expected toreverse and the credits are expected to be used. The effect on deferred tax assets and liabilities of a change in tax ratesis recognized in income in the period that includes the enactment date. An assessment is made as to whether or not avaluation allowance is required to offset deferred tax assets. This assessment requires estimates as to future operatingresults, as well as an evaluation of the effectiveness of the Company's tax planning strategies. These estimates are madeon an ongoing basis based upon the Company's business plans and growth strategies in each market and consequently,future material changes in the valuation allowance are possible. It also requires estimates associated with enactmenteffects, as of December 22, 2017, and ongoing activity under the the U.S. Tax Cuts and Jobs Act of 2017 (the "TaxAct”).
ASC 740 requires a company to record the effect of tax law change in the period of enactment. However, shortlyafter the enactment of the Tax Act, the SEC staff issued SEC Staff Accounting Bulletin 118 (“SAB 118”), which allowsa company to record a provisional amount when it does not have the necessary information available, prepared, oranalyzed in reasonable detail to complete its accounting for the change in tax law. The measurement period ends whenthe company has obtained, prepared and analyzed the information necessary to finalize its accounting, but cannot extendbeyond one year. To the extent that the Company was able to make a reasonable estimate of the effects of elements ofthe Tax Act for which the analysis was not complete, it recorded those amounts. In instance where the Company wasnot able to make reasonable estimates of the impact of certain elements, as provided for by SAB 118, it did not recordan amount related to those elements and accounted for them on the basis of tax laws in effect before the Tax Act.
The Company accounts for uncertain tax positions in accordance with ASC 740, Income Taxes. This guidanceprescribes a minimum probability threshold that a tax position must meet before a financial statement benefit isrecognized. The minimum threshold is defined as a tax position that is more likely than not to be sustained uponexamination by the applicable taxing authority, including resolution of any related appeals or litigation processes, basedon the technical merits of the position. The tax benefit to be recognized is measured as the largest amount of benefitthat is greater than 50 percent likely of being realized upon ultimate settlement.
Interest and penalties related to tax contingency or settlement items are recorded as a component of the provisionfor income taxes in the Company's Consolidated Statements of Income. The Company records accruals for taxcontingencies as a component of accrued liabilities or other long-term liabilities on its balance sheet.
Net Income Per Common Share. Basic per share information is calculated by dividing net income by the weightedaverage number of shares outstanding. Diluted per share information is calculated by also considering the impact ofpotential common stock on both net income and the weighted average number of shares outstanding. The Company'spotential common stock consists of employee and director stock options, restricted stock, restricted stock units andperformance share units. Performance share awards are included in the diluted per share calculation when theperformance criteria are achieved. The Company's potential common stock is excluded from the basic per sharecalculation, or when the Company has a net loss for the period, and is included in the diluted per share calculation whendoing so would not be anti-dilutive.
52
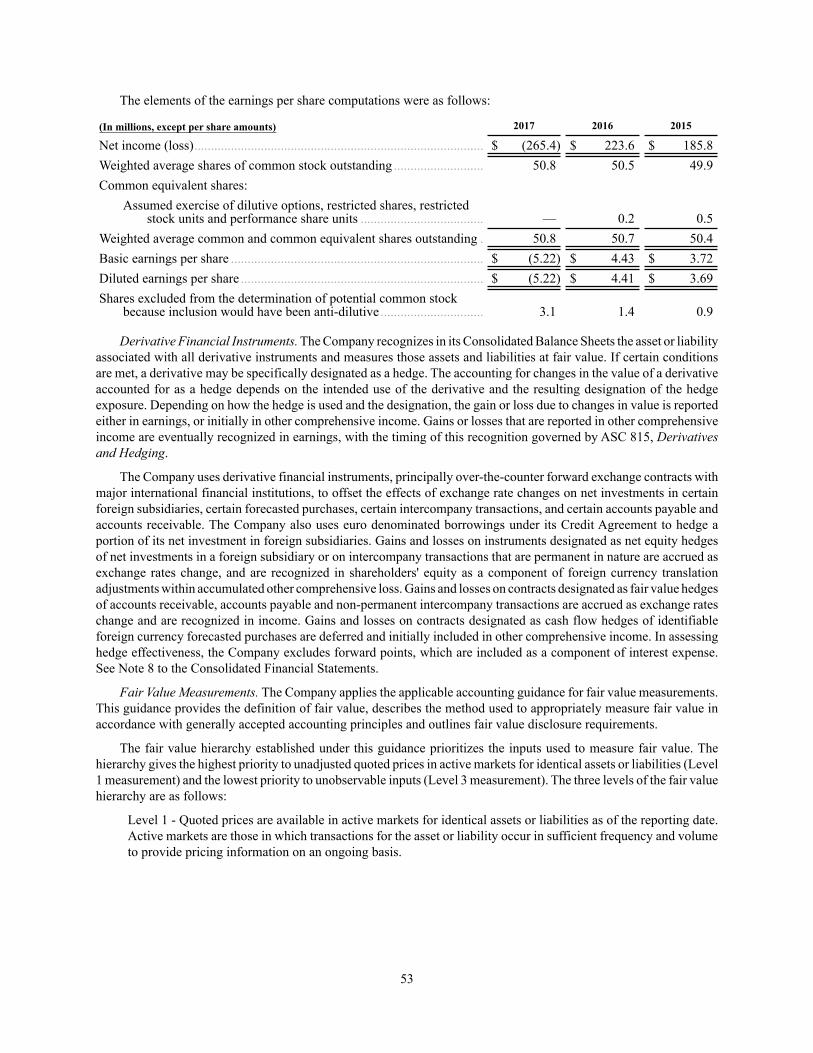
The elements of the earnings per share computations were as follows:
(In millions, except per share amounts) 2017 2016 2015
Net income (loss)....................................................................................... $ (265.4) $ 223.6 $ 185.8Weighted average shares of common stock outstanding ........................... 50.8 50.5 49.9Common equivalent shares:
Assumed exercise of dilutive options, restricted shares, restrictedstock units and performance share units ..................................... — 0.2 0.5
Weighted average common and common equivalent shares outstanding . 50.8 50.7 50.4Basic earnings per share ............................................................................ $ (5.22) $ 4.43 $ 3.72Diluted earnings per share ......................................................................... $ (5.22) $ 4.41 $ 3.69Shares excluded from the determination of potential common stock
because inclusion would have been anti-dilutive ............................... 3.1 1.4 0.9
Derivative Financial Instruments. The Company recognizes in its Consolidated Balance Sheets the asset or liabilityassociated with all derivative instruments and measures those assets and liabilities at fair value. If certain conditionsare met, a derivative may be specifically designated as a hedge. The accounting for changes in the value of a derivativeaccounted for as a hedge depends on the intended use of the derivative and the resulting designation of the hedgeexposure. Depending on how the hedge is used and the designation, the gain or loss due to changes in value is reportedeither in earnings, or initially in other comprehensive income. Gains or losses that are reported in other comprehensiveincome are eventually recognized in earnings, with the timing of this recognition governed by ASC 815, Derivativesand Hedging.
The Company uses derivative financial instruments, principally over-the-counter forward exchange contracts withmajor international financial institutions, to offset the effects of exchange rate changes on net investments in certainforeign subsidiaries, certain forecasted purchases, certain intercompany transactions, and certain accounts payable andaccounts receivable. The Company also uses euro denominated borrowings under its Credit Agreement to hedge aportion of its net investment in foreign subsidiaries. Gains and losses on instruments designated as net equity hedgesof net investments in a foreign subsidiary or on intercompany transactions that are permanent in nature are accrued asexchange rates change, and are recognized in shareholders' equity as a component of foreign currency translationadjustments within accumulated other comprehensive loss. Gains and losses on contracts designated as fair value hedgesof accounts receivable, accounts payable and non-permanent intercompany transactions are accrued as exchange rateschange and are recognized in income. Gains and losses on contracts designated as cash flow hedges of identifiableforeign currency forecasted purchases are deferred and initially included in other comprehensive income. In assessinghedge effectiveness, the Company excludes forward points, which are included as a component of interest expense.See Note 8 to the Consolidated Financial Statements.
Fair Value Measurements. The Company applies the applicable accounting guidance for fair value measurements.This guidance provides the definition of fair value, describes the method used to appropriately measure fair value inaccordance with generally accepted accounting principles and outlines fair value disclosure requirements.
The fair value hierarchy established under this guidance prioritizes the inputs used to measure fair value. Thehierarchy gives the highest priority to unadjusted quoted prices in active markets for identical assets or liabilities (Level1 measurement) and the lowest priority to unobservable inputs (Level 3 measurement). The three levels of the fair valuehierarchy are as follows:
Level 1 - Quoted prices are available in active markets for identical assets or liabilities as of the reporting date.Active markets are those in which transactions for the asset or liability occur in sufficient frequency and volumeto provide pricing information on an ongoing basis.
53
Level 2 - Pricing inputs are other than quoted prices in active markets included in Level 1, which are eitherdirectly or indirectly observable as of the reporting date. Level 2 includes those financial instruments that arevalued using models or other valuation methodologies. These models are primarily industry-standard models thatconsider various assumptions, including quoted prices, time value, volatility factors, and current market andcontractual prices for the underlying instruments, as well as other relevant economic measures. Substantially allof these assumptions are observable in the marketplace throughout the full term of the instrument, can be derivedfrom observable data or are supported by observable levels at which transactions are executed in the marketplace.
Level 3 - Pricing inputs include significant inputs that are generally less observable from objective sources. Theseinputs may be used with internally developed methodologies that result in management's best estimate of fairvalue from the perspective of a market participant. The Company does not have any recurring Level 3 fair valuemeasurements.
Foreign Currency Translation. Results of operations of foreign subsidiaries are translated into U.S. dollars usingaverage exchange rates during the year. The assets and liabilities of those subsidiaries, other than those of operationsin highly inflationary countries, are translated into U.S. dollars using exchange rates at the balance sheet date. Therelated translation adjustments are included in accumulated other comprehensive loss. Foreign currency transactiongains and losses, as well as re-measurement of financial statements of subsidiaries in highly inflationary countries, areincluded in income.
Inflation in Venezuela has been at a high level the past several years. The Company uses a blended index of theConsumer Price Index and National Consumer Price Index for determining highly inflationary status in Venezuela.This blended index reached cumulative three-year inflation in excess of 100 percent at November 30, 2009 and as such,the Company transitioned to highly inflationary status at the beginning of its 2010 fiscal year. Gains and losses resultingfrom the translation of the financial statements of subsidiaries operating in highly inflationary economies are recordedin earnings.
For Venezuela, through fiscal 2017, the bolivar to U.S. dollar exchange rates used in translating the Company’soperating activity was based on an official rate recognized by the Venezuelan government. As of the end of December2017, the Company evaluated the significant inflationary environment in Venezuela, as well as the actual exchangerates used to conduct business, particularly related to the procurement of resins to manufacture product. The Companyconcluded it would not be appropriate to use the official rate to value sales and profit beginning in 2018, and will usea parallel rate that is currently approximately 99 percent lower than the official rate used during 2017. As a result, asof the end of 2017, the Company remeasured its balance sheet at the parallel rate available at that time, and evaluatedthe Venezuelan fixed assets for impairment. In 2017, 2016 and 2015, the net expense in connection with re-measuringnet monetary assets and recording in cost of sales inventory at the exchange rate when it was purchased or manufacturedcompared with when it was sold, and in 2017 the write-down of inventory, was $7.4 million, $4.3 million and $14.9million, respectively. The amounts related to remeasurement are included in other expense. In 2017, there was also afixed asset impairment charge of $2.3 million recorded in re-engineering and impairments caption.
As of the end of 2017, the net monetary assets in Venezuela, which were of a nature that would generate incomeor expense associated with future exchange rate fluctuations versus the U.S. dollar were not material. In addition, therewas $25.5 million in cumulative foreign currency translation losses related to Venezuela included in equity within theConsolidated Balance Sheets.
Product Warranty. Tupperware® brand products are guaranteed against chipping, cracking, breaking or peelingunder normal non-commercial use of the product with certain limitations. The cost of replacing defective products isnot material.
54
New Accounting Pronouncements. In May 2014, the FASB issued an amendment to existing guidance regardingrevenue from contracts with customers. The amendment outlines a single comprehensive model for entities to use inaccounting for revenue arising from contracts with customers. Subsequently, the FASB has issued several otheramendments clarifying specific topics within the scope of the new guidance regarding contracts with customers. Thisguidance is effective for fiscal years beginning after December 15, 2017, and interim periods within those fiscal years.The Company has surveyed revenue recognition policies and sales incentives programs across each of its globaloperating segments, and has evaluated the impact of the adoption of this amendment on its Consolidated FinancialStatements. While there are expected to be changes in policy in certain units, the Company does not believe the impactto the Consolidated Financial Statements, including adjustments to the 2018 beginning retained earnings, will besignificant, as the majority of the Company's transactions have not been accounted for under industry-specific guidancethat will be superseded by the new guidance, and generally only consist of a single performance obligation to transfernon-customized, promised goods. The Company has used the modified retrospective method of adoption beginningJanuary 2018.
In February 2016, the FASB issued an amendment to existing guidance on lease accounting that requires the assetsand liabilities arising from operating leases be presented in the balance sheet. This guidance is effective for fiscal yearsbeginning after December 15, 2018. Early adoption is permitted. The Company is currently evaluating the specificimpact of the adoption of this amendment on its Consolidated Financial Statements, though it does expect an increasein both assets and liabilities upon adoption due to recognition of operating lease assets and related liabilities.
In August 2016, the FASB issued an amendment to existing guidance on presentation and classification of certaincash receipts and cash payments in the Statement of Cash Flows. This guidance is intended to reduce diversity in theclassification of transactions related to debt prepayment or debt extinguishment costs, zero-coupon debt instrumentssettlement, contingent consideration payments made after a business combination, insurance claims settlement andcorporate-owned life insurance settlement, distributions from equity method investments and beneficial interests insecuritization transactions. This guidance is effective for fiscal years beginning after December 15, 2017, and interimperiods within those fiscal years. The Company does not expect adoption of this amendment to have an impact on itsConsolidated Financial Statements.
In October 2016, the FASB issued an amendment to existing guidance on income tax consequences of intra-entitytransfers of assets other than inventory. Under the amendment, the income tax consequences of an intra-entity transferof an asset other than inventory will be recognized when the transfer occurs. This guidance is effective for fiscal yearsbeginning after December 15, 2017, and interim periods within those fiscal years. The Company is currently evaluatingthe impact of the adoption of this amendment on its Consolidated Financial Statements.
In November 2016, the FASB issued an amendment to existing guidance on classification and presentation ofchanges in restricted cash on the statement of cash flows. Under the amendment, the restricted cash and restricted cashequivalents will be included with cash and cash equivalents when reconciling the total cash balance for the period onthe statement of cash flows. This guidance is effective for fiscal years beginning after December 15, 2017, and interimperiods within those fiscal years. The Company does not expect the adoption of this amendment to have a significantimpact on the Company’s Consolidated Financial Statements.
In March 2017, the FASB issued an amendment to existing guidance on presentation of net periodic pension andpost-retirement benefit costs. Under the amendment, the service cost component will be presented in the same incomestatement line item as other compensation costs arising from services rendered during the period. The other componentsof the net periodic benefit cost will be presented separately from the service cost and outside operating income subtotal.Only the service cost will be eligible for capitalization in assets. This guidance is effective for fiscal years beginningafter December 15, 2017, and interim periods within those fiscal years. The Company does not expect a significantimpact from the adoption of this amendment on its Consolidated Financial Statements.
In May 2017, the FASB issued an amendment to existing guidance on stock compensation to provide clarity andreduce diversity in modification accounting. Under the amendment, modification accounting is to be applied unlessthe fair value, vesting conditions and classification of the modified award are the same as that of the original awardimmediately before the modification. This guidance is effective for fiscal years beginning after December 15, 2017,and interim periods within those fiscal years. The Company does not expect an impact from the adoption of thisamendment on its Consolidated Financial Statements.
55
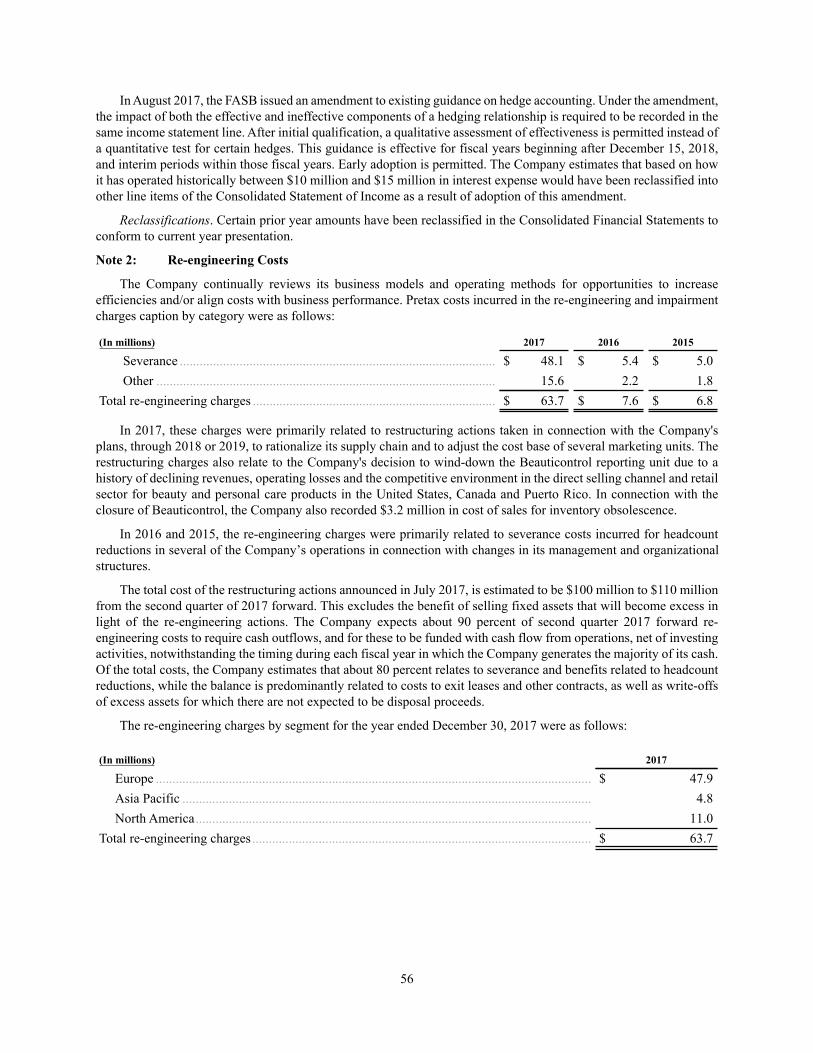
In August 2017, the FASB issued an amendment to existing guidance on hedge accounting. Under the amendment,the impact of both the effective and ineffective components of a hedging relationship is required to be recorded in thesame income statement line. After initial qualification, a qualitative assessment of effectiveness is permitted instead ofa quantitative test for certain hedges. This guidance is effective for fiscal years beginning after December 15, 2018,and interim periods within those fiscal years. Early adoption is permitted. The Company estimates that based on howit has operated historically between $10 million and $15 million in interest expense would have been reclassified intoother line items of the Consolidated Statement of Income as a result of adoption of this amendment.
Reclassifications. Certain prior year amounts have been reclassified in the Consolidated Financial Statements toconform to current year presentation.
56
Note 2: Re-engineering Costs
The Company continually reviews its business models and operating methods for opportunities to increaseefficiencies and/or align costs with business performance. Pretax costs incurred in the re-engineering and impairmentcharges caption by category were as follows:
(In millions) 2017 2016 2015
Severance ............................................................................................... $ 48.1 $ 5.4 $ 5.0Other ...................................................................................................... 15.6 2.2 1.8
Total re-engineering charges ......................................................................... $ 63.7 $ 7.6 $ 6.8
In 2017, these charges were primarily related to restructuring actions taken in connection with the Company'splans, through 2018 or 2019, to rationalize its supply chain and to adjust the cost base of several marketing units. Therestructuring charges also relate to the Company's decision to wind-down the Beauticontrol reporting unit due to ahistory of declining revenues, operating losses and the competitive environment in the direct selling channel and retailsector for beauty and personal care products in the United States, Canada and Puerto Rico. In connection with theclosure of Beauticontrol, the Company also recorded $3.2 million in cost of sales for inventory obsolescence.
In 2016 and 2015, the re-engineering charges were primarily related to severance costs incurred for headcountreductions in several of the Company’s operations in connection with changes in its management and organizationalstructures.
The total cost of the restructuring actions announced in July 2017, is estimated to be $100 million to $110 millionfrom the second quarter of 2017 forward. This excludes the benefit of selling fixed assets that will become excess inlight of the re-engineering actions. The Company expects about 90 percent of second quarter 2017 forward re-engineering costs to require cash outflows, and for these to be funded with cash flow from operations, net of investingactivities, notwithstanding the timing during each fiscal year in which the Company generates the majority of its cash.Of the total costs, the Company estimates that about 80 percent relates to severance and benefits related to headcountreductions, while the balance is predominantly related to costs to exit leases and other contracts, as well as write-offsof excess assets for which there are not expected to be disposal proceeds.
The re-engineering charges by segment for the year ended December 30, 2017 were as follows:
(In millions) 2017
Europe ................................................................................................................................... $ 47.9Asia Pacific ........................................................................................................................... 4.8North America....................................................................................................................... 11.0
Total re-engineering charges...................................................................................................... $ 63.7
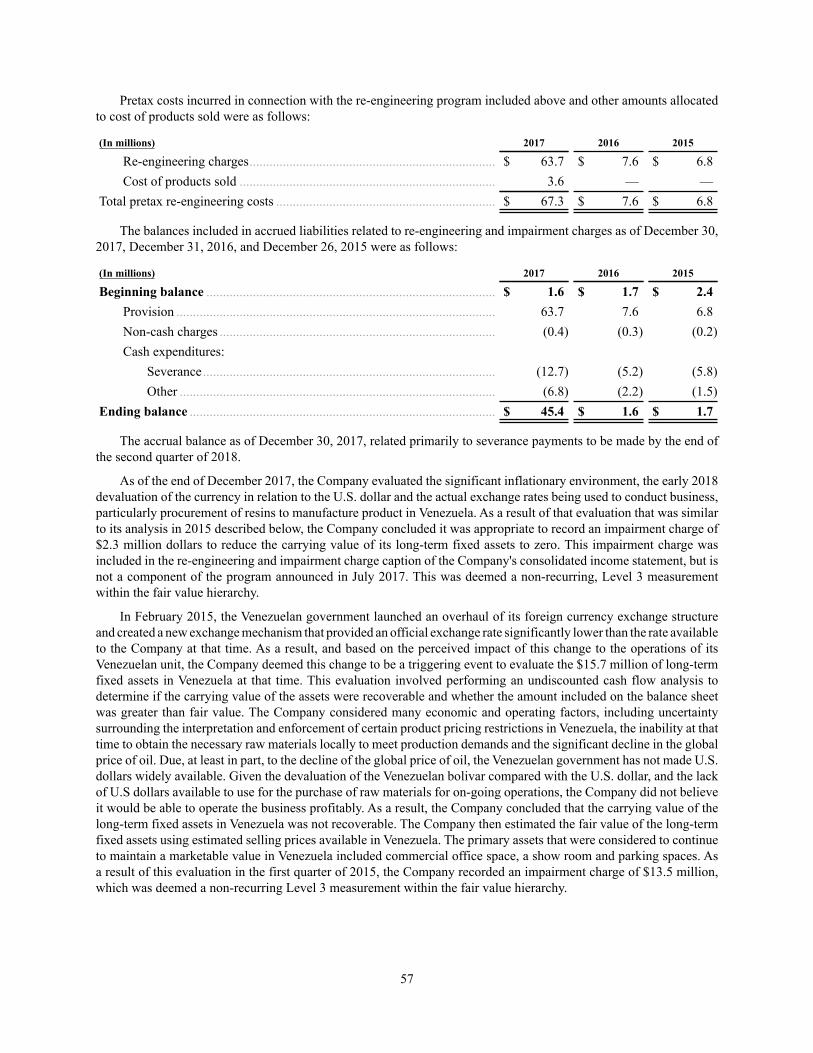
Pretax costs incurred in connection with the re-engineering program included above and other amounts allocatedto cost of products sold were as follows:
(In millions) 2017 2016 2015
Re-engineering charges.......................................................................... $ 63.7 $ 7.6 $ 6.8Cost of products sold ............................................................................. 3.6 — —
Total pretax re-engineering costs .................................................................. $ 67.3 $ 7.6 $ 6.8
The balances included in accrued liabilities related to re-engineering and impairment charges as of December 30,2017, December 31, 2016, and December 26, 2015 were as follows:
(In millions) 2017 2016 2015
Beginning balance ....................................................................................... $ 1.6 $ 1.7 $ 2.4Provision ................................................................................................ 63.7 7.6 6.8Non-cash charges ................................................................................... (0.4) (0.3) (0.2)Cash expenditures:
Severance........................................................................................ (12.7) (5.2) (5.8)Other ............................................................................................... (6.8) (2.2) (1.5)
Ending balance ............................................................................................ $ 45.4 $ 1.6 $ 1.7
The accrual balance as of December 30, 2017, related primarily to severance payments to be made by the end ofthe second quarter of 2018.
As of the end of December 2017, the Company evaluated the significant inflationary environment, the early 2018devaluation of the currency in relation to the U.S. dollar and the actual exchange rates being used to conduct business,particularly procurement of resins to manufacture product in Venezuela. As a result of that evaluation that was similarto its analysis in 2015 described below, the Company concluded it was appropriate to record an impairment charge of$2.3 million dollars to reduce the carrying value of its long-term fixed assets to zero. This impairment charge wasincluded in the re-engineering and impairment charge caption of the Company's consolidated income statement, but isnot a component of the program announced in July 2017. This was deemed a non-recurring, Level 3 measurementwithin the fair value hierarchy.
In February 2015, the Venezuelan government launched an overhaul of its foreign currency exchange structureand created a new exchange mechanism that provided an official exchange rate significantly lower than the rate availableto the Company at that time. As a result, and based on the perceived impact of this change to the operations of itsVenezuelan unit, the Company deemed this change to be a triggering event to evaluate the $15.7 million of long-termfixed assets in Venezuela at that time. This evaluation involved performing an undiscounted cash flow analysis todetermine if the carrying value of the assets were recoverable and whether the amount included on the balance sheetwas greater than fair value. The Company considered many economic and operating factors, including uncertaintysurrounding the interpretation and enforcement of certain product pricing restrictions in Venezuela, the inability at thattime to obtain the necessary raw materials locally to meet production demands and the significant decline in the globalprice of oil. Due, at least in part, to the decline of the global price of oil, the Venezuelan government has not made U.S.dollars widely available. Given the devaluation of the Venezuelan bolivar compared with the U.S. dollar, and the lackof U.S dollars available to use for the purchase of raw materials for on-going operations, the Company did not believeit would be able to operate the business profitably. As a result, the Company concluded that the carrying value of thelong-term fixed assets in Venezuela was not recoverable. The Company then estimated the fair value of the long-termfixed assets using estimated selling prices available in Venezuela. The primary assets that were considered to continueto maintain a marketable value in Venezuela included commercial office space, a show room and parking spaces. Asa result of this evaluation in the first quarter of 2015, the Company recorded an impairment charge of $13.5 million,which was deemed a non-recurring Level 3 measurement within the fair value hierarchy.
57
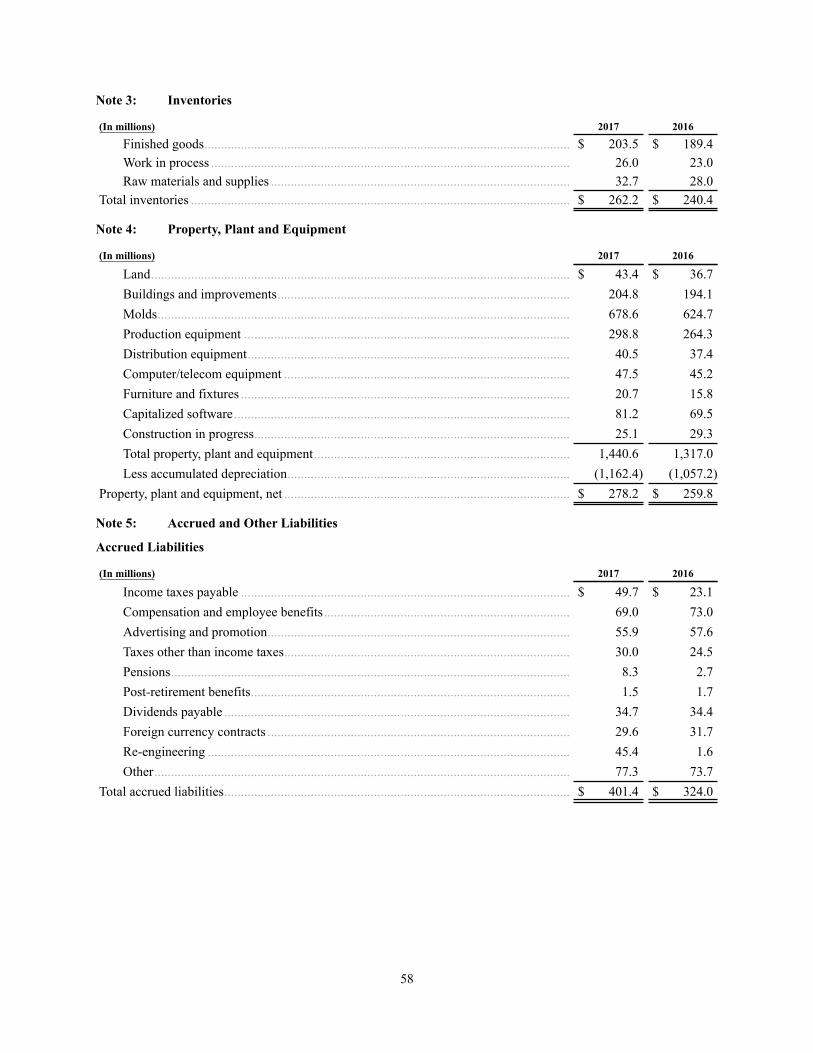
Note 3: Inventories
(In millions) 2017 2016
Finished goods.............................................................................................................. $ 203.5 $ 189.4Work in process ............................................................................................................ 26.0 23.0Raw materials and supplies .......................................................................................... 32.7 28.0
Total inventories .................................................................................................................. $ 262.2 $ 240.4
58
Note 4: Property, Plant and Equipment
(In millions) 2017 2016
Land.............................................................................................................................. $ 43.4 $ 36.7Buildings and improvements........................................................................................ 204.8 194.1Molds............................................................................................................................ 678.6 624.7Production equipment .................................................................................................. 298.8 264.3Distribution equipment................................................................................................. 40.5 37.4Computer/telecom equipment ...................................................................................... 47.5 45.2Furniture and fixtures ................................................................................................... 20.7 15.8Capitalized software ..................................................................................................... 81.2 69.5Construction in progress............................................................................................... 25.1 29.3Total property, plant and equipment............................................................................. 1,440.6 1,317.0Less accumulated depreciation..................................................................................... (1,162.4) (1,057.2)
Property, plant and equipment, net ...................................................................................... $ 278.2 $ 259.8
Note 5: Accrued and Other Liabilities
Accrued Liabilities
(In millions) 2017 2016
Income taxes payable ................................................................................................... $ 49.7 $ 23.1Compensation and employee benefits.......................................................................... 69.0 73.0Advertising and promotion........................................................................................... 55.9 57.6Taxes other than income taxes...................................................................................... 30.0 24.5Pensions........................................................................................................................ 8.3 2.7Post-retirement benefits................................................................................................ 1.5 1.7Dividends payable ........................................................................................................ 34.7 34.4Foreign currency contracts ........................................................................................... 29.6 31.7Re-engineering ............................................................................................................. 45.4 1.6Other............................................................................................................................. 77.3 73.7
Total accrued liabilities........................................................................................................ $ 401.4 $ 324.0
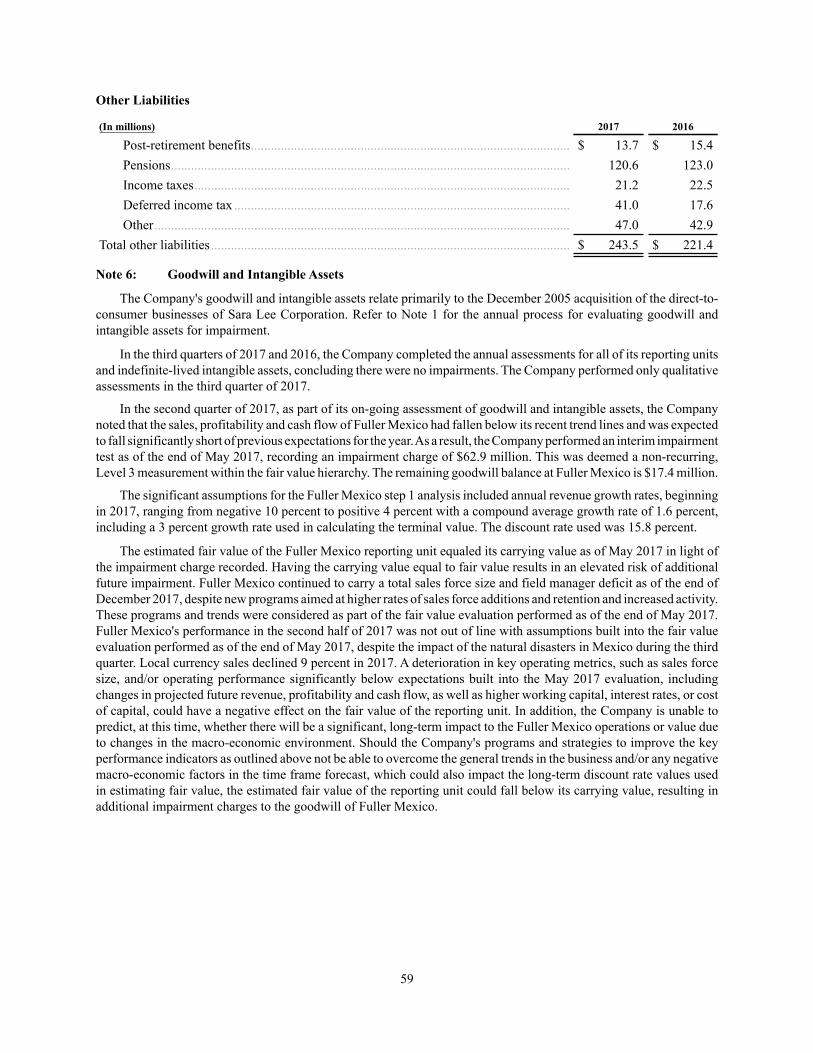
Other Liabilities
(In millions) 2017 2016
Post-retirement benefits................................................................................................ $ 13.7 $ 15.4Pensions........................................................................................................................ 120.6 123.0Income taxes................................................................................................................. 21.2 22.5Deferred income tax ..................................................................................................... 41.0 17.6Other............................................................................................................................. 47.0 42.9
Total other liabilities............................................................................................................ $ 243.5 $ 221.4
59
Note 6: Goodwill and Intangible Assets
The Company's goodwill and intangible assets relate primarily to the December 2005 acquisition of the direct-to-consumer businesses of Sara Lee Corporation. Refer to Note 1 for the annual process for evaluating goodwill andintangible assets for impairment.
In the third quarters of 2017 and 2016, the Company completed the annual assessments for all of its reporting unitsand indefinite-lived intangible assets, concluding there were no impairments. The Company performed only qualitativeassessments in the third quarter of 2017.
In the second quarter of 2017, as part of its on-going assessment of goodwill and intangible assets, the Companynoted that the sales, profitability and cash flow of Fuller Mexico had fallen below its recent trend lines and was expectedto fall significantly short of previous expectations for the year. As a result, the Company performed an interim impairmenttest as of the end of May 2017, recording an impairment charge of $62.9 million. This was deemed a non-recurring,Level 3 measurement within the fair value hierarchy. The remaining goodwill balance at Fuller Mexico is $17.4 million.
The significant assumptions for the Fuller Mexico step 1 analysis included annual revenue growth rates, beginningin 2017, ranging from negative 10 percent to positive 4 percent with a compound average growth rate of 1.6 percent,including a 3 percent growth rate used in calculating the terminal value. The discount rate used was 15.8 percent.
The estimated fair value of the Fuller Mexico reporting unit equaled its carrying value as of May 2017 in light ofthe impairment charge recorded. Having the carrying value equal to fair value results in an elevated risk of additionalfuture impairment. Fuller Mexico continued to carry a total sales force size and field manager deficit as of the end ofDecember 2017, despite new programs aimed at higher rates of sales force additions and retention and increased activity.These programs and trends were considered as part of the fair value evaluation performed as of the end of May 2017.Fuller Mexico's performance in the second half of 2017 was not out of line with assumptions built into the fair valueevaluation performed as of the end of May 2017, despite the impact of the natural disasters in Mexico during the thirdquarter. Local currency sales declined 9 percent in 2017. A deterioration in key operating metrics, such as sales forcesize, and/or operating performance significantly below expectations built into the May 2017 evaluation, includingchanges in projected future revenue, profitability and cash flow, as well as higher working capital, interest rates, or costof capital, could have a negative effect on the fair value of the reporting unit. In addition, the Company is unable topredict, at this time, whether there will be a significant, long-term impact to the Fuller Mexico operations or value dueto changes in the macro-economic environment. Should the Company's programs and strategies to improve the keyperformance indicators as outlined above not be able to overcome the general trends in the business and/or any negativemacro-economic factors in the time frame forecast, which could also impact the long-term discount rate values usedin estimating fair value, the estimated fair value of the reporting unit could fall below its carrying value, resulting inadditional impairment charges to the goodwill of Fuller Mexico.
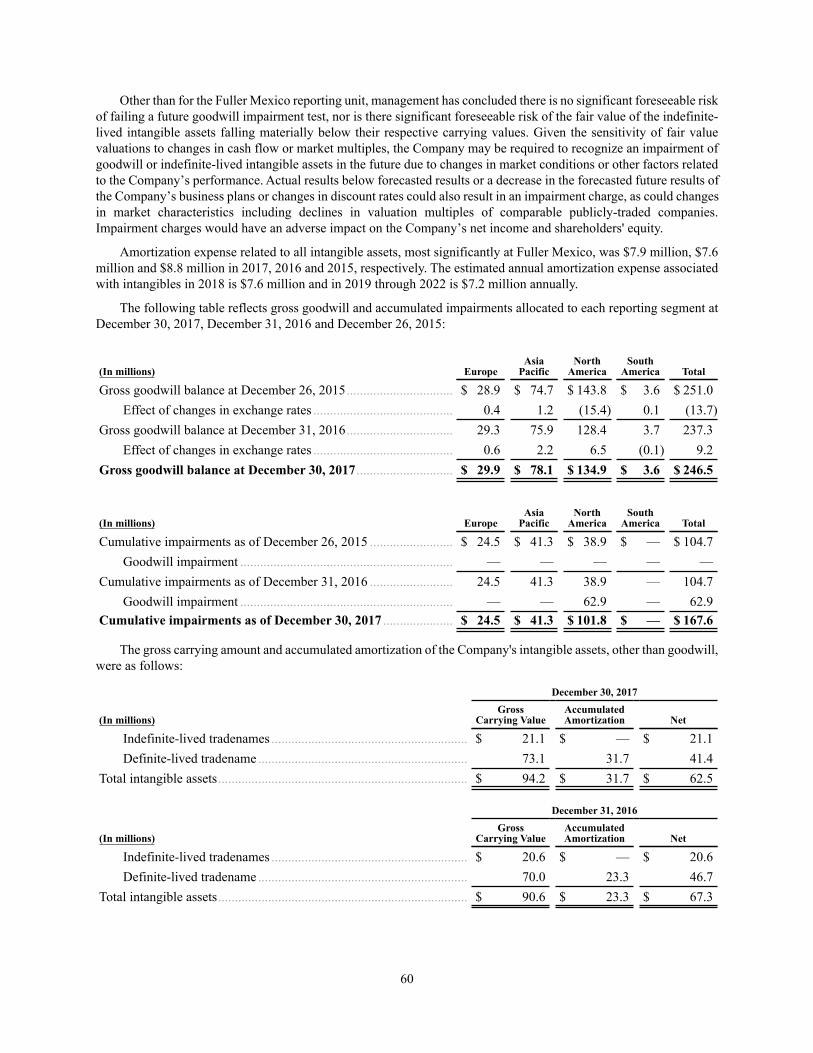
Other than for the Fuller Mexico reporting unit, management has concluded there is no significant foreseeable riskof failing a future goodwill impairment test, nor is there significant foreseeable risk of the fair value of the indefinite-lived intangible assets falling materially below their respective carrying values. Given the sensitivity of fair valuevaluations to changes in cash flow or market multiples, the Company may be required to recognize an impairment ofgoodwill or indefinite-lived intangible assets in the future due to changes in market conditions or other factors relatedto the Company’s performance. Actual results below forecasted results or a decrease in the forecasted future results ofthe Company’s business plans or changes in discount rates could also result in an impairment charge, as could changesin market characteristics including declines in valuation multiples of comparable publicly-traded companies.Impairment charges would have an adverse impact on the Company’s net income and shareholders' equity.
Amortization expense related to all intangible assets, most significantly at Fuller Mexico, was $7.9 million, $7.6million and $8.8 million in 2017, 2016 and 2015, respectively. The estimated annual amortization expense associatedwith intangibles in 2018 is $7.6 million and in 2019 through 2022 is $7.2 million annually.
The following table reflects gross goodwill and accumulated impairments allocated to each reporting segment atDecember 30, 2017, December 31, 2016 and December 26, 2015:
(In millions) EuropeAsia
PacificNorth
AmericaSouth
America Total
Gross goodwill balance at December 26, 2015................................ $ 28.9 $ 74.7 $ 143.8 $ 3.6 $ 251.0Effect of changes in exchange rates .......................................... 0.4 1.2 (15.4) 0.1 (13.7)
Gross goodwill balance at December 31, 2016................................ 29.3 75.9 128.4 3.7 237.3Effect of changes in exchange rates .......................................... 0.6 2.2 6.5 (0.1) 9.2
Gross goodwill balance at December 30, 2017 ............................. $ 29.9 $ 78.1 $ 134.9 $ 3.6 $ 246.5
(In millions) EuropeAsia
PacificNorth
AmericaSouth
America Total
Cumulative impairments as of December 26, 2015 ......................... $ 24.5 $ 41.3 $ 38.9 $ — $ 104.7Goodwill impairment ................................................................ — — — — —
Cumulative impairments as of December 31, 2016 ......................... 24.5 41.3 38.9 — 104.7Goodwill impairment ................................................................ — — 62.9 — 62.9
Cumulative impairments as of December 30, 2017 ..................... $ 24.5 $ 41.3 $ 101.8 $ — $ 167.6
The gross carrying amount and accumulated amortization of the Company's intangible assets, other than goodwill,were as follows:
December 30, 2017
(In millions)Gross
Carrying ValueAccumulatedAmortization Net
Indefinite-lived tradenames ........................................................... $ 21.1 $ — $ 21.1Definite-lived tradename ............................................................... 73.1 31.7 41.4
Total intangible assets........................................................................... $ 94.2 $ 31.7 $ 62.5
December 31, 2016
(In millions)Gross
Carrying ValueAccumulatedAmortization Net
Indefinite-lived tradenames ........................................................... $ 20.6 $ — $ 20.6Definite-lived tradename ............................................................... 70.0 23.3 46.7
Total intangible assets........................................................................... $ 90.6 $ 23.3 $ 67.3
60
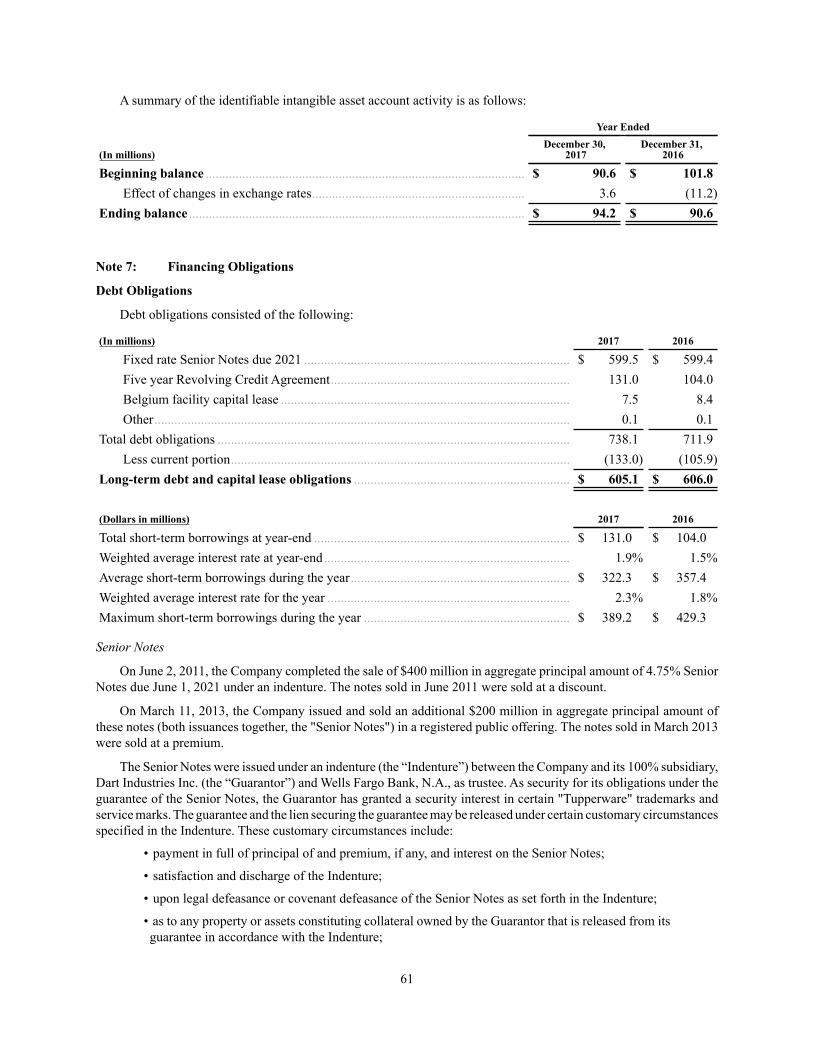
A summary of the identifiable intangible asset account activity is as follows:
Year Ended
(In millions)December 30,
2017December 31,
2016
Beginning balance ................................................................................................ $ 90.6 $ 101.8Effect of changes in exchange rates................................................................ 3.6 (11.2)
Ending balance ..................................................................................................... $ 94.2 $ 90.6
61
Note 7: Financing Obligations
Debt Obligations
Debt obligations consisted of the following:
(In millions) 2017 2016
Fixed rate Senior Notes due 2021 ................................................................................ $ 599.5 $ 599.4Five year Revolving Credit Agreement........................................................................ 131.0 104.0Belgium facility capital lease ....................................................................................... 7.5 8.4Other............................................................................................................................. 0.1 0.1
Total debt obligations .......................................................................................................... 738.1 711.9Less current portion...................................................................................................... (133.0) (105.9)
Long-term debt and capital lease obligations ................................................................. $ 605.1 $ 606.0
(Dollars in millions) 2017 2016
Total short-term borrowings at year-end ............................................................................. $ 131.0 $ 104.0Weighted average interest rate at year-end.......................................................................... 1.9% 1.5%Average short-term borrowings during the year.................................................................. $ 322.3 $ 357.4Weighted average interest rate for the year ......................................................................... 2.3% 1.8%Maximum short-term borrowings during the year .............................................................. $ 389.2 $ 429.3
Senior Notes
On June 2, 2011, the Company completed the sale of $400 million in aggregate principal amount of 4.75% SeniorNotes due June 1, 2021 under an indenture. The notes sold in June 2011 were sold at a discount.
On March 11, 2013, the Company issued and sold an additional $200 million in aggregate principal amount ofthese notes (both issuances together, the "Senior Notes") in a registered public offering. The notes sold in March 2013were sold at a premium.
The Senior Notes were issued under an indenture (the “Indenture”) between the Company and its 100% subsidiary,Dart Industries Inc. (the “Guarantor”) and Wells Fargo Bank, N.A., as trustee. As security for its obligations under theguarantee of the Senior Notes, the Guarantor has granted a security interest in certain "Tupperware" trademarks andservice marks. The guarantee and the lien securing the guarantee may be released under certain customary circumstancesspecified in the Indenture. These customary circumstances include:
• payment in full of principal of and premium, if any, and interest on the Senior Notes;
• satisfaction and discharge of the Indenture;
• upon legal defeasance or covenant defeasance of the Senior Notes as set forth in the Indenture;
• as to any property or assets constituting collateral owned by the Guarantor that is released from itsguarantee in accordance with the Indenture;
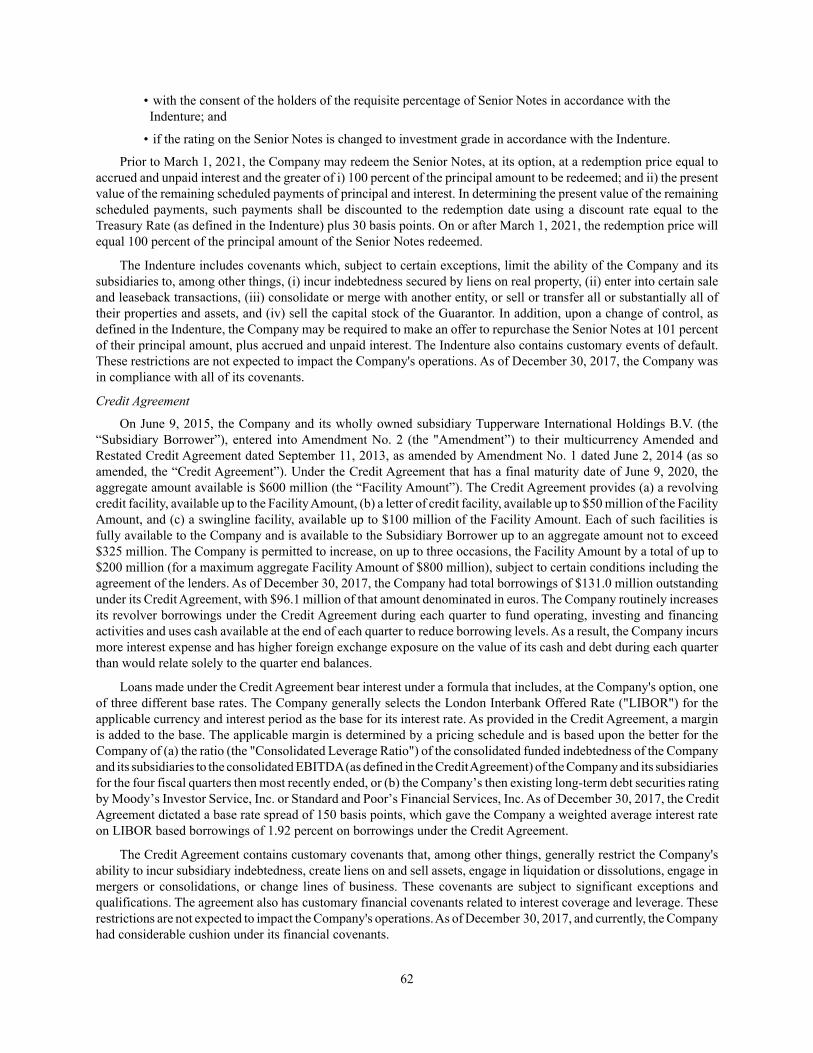
• with the consent of the holders of the requisite percentage of Senior Notes in accordance with theIndenture; and
• if the rating on the Senior Notes is changed to investment grade in accordance with the Indenture.
Prior to March 1, 2021, the Company may redeem the Senior Notes, at its option, at a redemption price equal toaccrued and unpaid interest and the greater of i) 100 percent of the principal amount to be redeemed; and ii) the presentvalue of the remaining scheduled payments of principal and interest. In determining the present value of the remainingscheduled payments, such payments shall be discounted to the redemption date using a discount rate equal to theTreasury Rate (as defined in the Indenture) plus 30 basis points. On or after March 1, 2021, the redemption price willequal 100 percent of the principal amount of the Senior Notes redeemed.
The Indenture includes covenants which, subject to certain exceptions, limit the ability of the Company and itssubsidiaries to, among other things, (i) incur indebtedness secured by liens on real property, (ii) enter into certain saleand leaseback transactions, (iii) consolidate or merge with another entity, or sell or transfer all or substantially all oftheir properties and assets, and (iv) sell the capital stock of the Guarantor. In addition, upon a change of control, asdefined in the Indenture, the Company may be required to make an offer to repurchase the Senior Notes at 101 percentof their principal amount, plus accrued and unpaid interest. The Indenture also contains customary events of default.These restrictions are not expected to impact the Company's operations. As of December 30, 2017, the Company wasin compliance with all of its covenants.
Credit Agreement
On June 9, 2015, the Company and its wholly owned subsidiary Tupperware International Holdings B.V. (the“Subsidiary Borrower”), entered into Amendment No. 2 (the "Amendment”) to their multicurrency Amended andRestated Credit Agreement dated September 11, 2013, as amended by Amendment No. 1 dated June 2, 2014 (as soamended, the “Credit Agreement”). Under the Credit Agreement that has a final maturity date of June 9, 2020, theaggregate amount available is $600 million (the “Facility Amount”). The Credit Agreement provides (a) a revolvingcredit facility, available up to the Facility Amount, (b) a letter of credit facility, available up to $50 million of the FacilityAmount, and (c) a swingline facility, available up to $100 million of the Facility Amount. Each of such facilities isfully available to the Company and is available to the Subsidiary Borrower up to an aggregate amount not to exceed$325 million. The Company is permitted to increase, on up to three occasions, the Facility Amount by a total of up to$200 million (for a maximum aggregate Facility Amount of $800 million), subject to certain conditions including theagreement of the lenders. As of December 30, 2017, the Company had total borrowings of $131.0 million outstandingunder its Credit Agreement, with $96.1 million of that amount denominated in euros. The Company routinely increasesits revolver borrowings under the Credit Agreement during each quarter to fund operating, investing and financingactivities and uses cash available at the end of each quarter to reduce borrowing levels. As a result, the Company incursmore interest expense and has higher foreign exchange exposure on the value of its cash and debt during each quarterthan would relate solely to the quarter end balances.
Loans made under the Credit Agreement bear interest under a formula that includes, at the Company's option, oneof three different base rates. The Company generally selects the London Interbank Offered Rate ("LIBOR") for theapplicable currency and interest period as the base for its interest rate. As provided in the Credit Agreement, a marginis added to the base. The applicable margin is determined by a pricing schedule and is based upon the better for theCompany of (a) the ratio (the "Consolidated Leverage Ratio") of the consolidated funded indebtedness of the Companyand its subsidiaries to the consolidated EBITDA (as defined in the Credit Agreement) of the Company and its subsidiariesfor the four fiscal quarters then most recently ended, or (b) the Company’s then existing long-term debt securities ratingby Moody’s Investor Service, Inc. or Standard and Poor’s Financial Services, Inc. As of December 30, 2017, the CreditAgreement dictated a base rate spread of 150 basis points, which gave the Company a weighted average interest rateon LIBOR based borrowings of 1.92 percent on borrowings under the Credit Agreement.
The Credit Agreement contains customary covenants that, among other things, generally restrict the Company'sability to incur subsidiary indebtedness, create liens on and sell assets, engage in liquidation or dissolutions, engage inmergers or consolidations, or change lines of business. These covenants are subject to significant exceptions andqualifications. The agreement also has customary financial covenants related to interest coverage and leverage. Theserestrictions are not expected to impact the Company's operations. As of December 30, 2017, and currently, the Companyhad considerable cushion under its financial covenants.
62
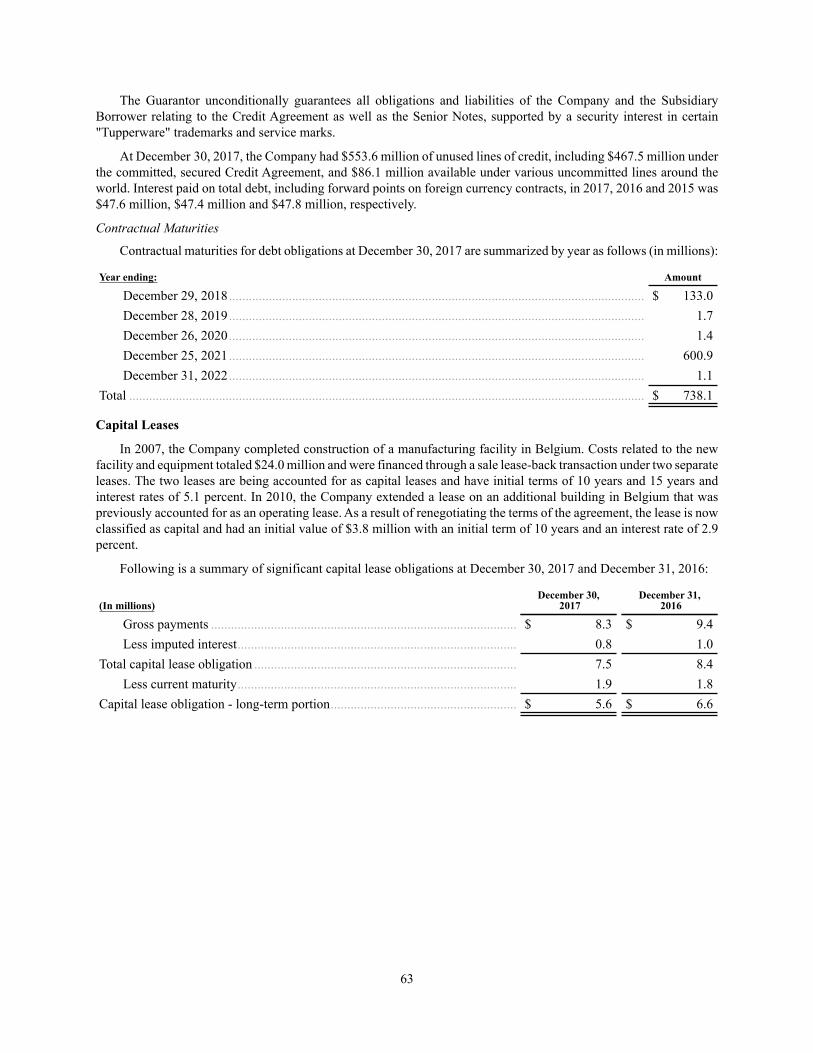
The Guarantor unconditionally guarantees all obligations and liabilities of the Company and the SubsidiaryBorrower relating to the Credit Agreement as well as the Senior Notes, supported by a security interest in certain"Tupperware" trademarks and service marks.
At December 30, 2017, the Company had $553.6 million of unused lines of credit, including $467.5 million underthe committed, secured Credit Agreement, and $86.1 million available under various uncommitted lines around theworld. Interest paid on total debt, including forward points on foreign currency contracts, in 2017, 2016 and 2015 was$47.6 million, $47.4 million and $47.8 million, respectively.
Contractual Maturities
Contractual maturities for debt obligations at December 30, 2017 are summarized by year as follows (in millions):
Year ending: Amount
December 29, 2018............................................................................................................................. $ 133.0December 28, 2019............................................................................................................................. 1.7December 26, 2020............................................................................................................................. 1.4December 25, 2021............................................................................................................................. 600.9December 31, 2022............................................................................................................................. 1.1
Total ........................................................................................................................................................... $ 738.1
Capital Leases
In 2007, the Company completed construction of a manufacturing facility in Belgium. Costs related to the newfacility and equipment totaled $24.0 million and were financed through a sale lease-back transaction under two separateleases. The two leases are being accounted for as capital leases and have initial terms of 10 years and 15 years andinterest rates of 5.1 percent. In 2010, the Company extended a lease on an additional building in Belgium that waspreviously accounted for as an operating lease. As a result of renegotiating the terms of the agreement, the lease is nowclassified as capital and had an initial value of $3.8 million with an initial term of 10 years and an interest rate of 2.9percent.
Following is a summary of significant capital lease obligations at December 30, 2017 and December 31, 2016:
(In millions)December 30,
2017December 31,
2016
Gross payments ............................................................................................ $ 8.3 $ 9.4Less imputed interest.................................................................................... 0.8 1.0
Total capital lease obligation ............................................................................... 7.5 8.4Less current maturity.................................................................................... 1.9 1.8
Capital lease obligation - long-term portion........................................................ $ 5.6 $ 6.6
63
Note 8: Derivative Financial Instruments
The Company is exposed to fluctuations in foreign currency exchange rates on the earnings, cash flows and financialposition of its international operations. Although this currency risk is partially mitigated by the natural hedge arisingfrom the Company's local manufacturing in many markets, a strengthening U.S. dollar generally has a negative impacton the Company. In response to these fluctuations, the Company uses financial instruments to hedge certain of itsexposures and to manage the foreign exchange impact to its financial statements. At its inception, a derivative financialinstrument used for hedging is designated as a fair value, cash flow or net equity hedge as described in Note 1 to theConsolidated Financial Statements.
Fair value hedges are entered into with financial instruments such as forward contracts, with the objective oflimiting exposure to certain foreign exchange risks primarily associated with accounts payable and non-permanentintercompany transactions. For derivative instruments that are designated and qualify as fair value hedges, the gain orloss on the derivative, as well as the offsetting gain or loss on the hedged item attributable to the hedged risk, arerecognized in current earnings. In assessing hedge effectiveness, the Company excludes forward points, which areconsidered to be a component of interest expense. In 2017, 2016 and 2015, forward points on fair value hedges resultedin pretax gains of $22.6 million, $15.7 million and $14.1 million, respectively.
The Company also uses derivative financial instruments to hedge foreign currency exposures resulting from certainforecasted purchases and classifies these as cash flow hedges. At initiation, the Company's cash flow hedge contractsare generally for periods ranging from one to fifteen months. The effective portion of the gain or loss on the hedginginstrument is recorded in other comprehensive income and is reclassified into earnings as the transactions being hedgedare recorded. As such, the balance at the end of the current reporting period in other comprehensive income, related tocash flow hedges, will generally be reclassified into earnings within the next twelve months. The associated asset orliability on the open hedges is recorded in Non-trade amounts receivable or accrued liabilities, as applicable. The balancein accumulated other comprehensive loss, net of tax, resulting from open foreign currency hedges designated as cashflow hedges was a deferred gain of $1.6 million, $4.9 million and $4.3 million as of December 30, 2017, December 31,2016 and December 26, 2015, respectively. In 2017, 2016 and 2015, the Company recorded in other comprehensiveloss, net of tax, net (losses)/gains associated with cash flow hedges of $(3.3) million, $0.6 million and $(3.5) million,respectively, which represents the net change to accumulated other comprehensive income on the Company's balancesheet related to these type of hedges.
The Company also uses financial instruments, such as forward contracts and certain euro denominated borrowingsunder the Company's Credit Agreement, to hedge a portion of its net equity investment in international operations andclassifies these as net equity hedges. Changes in the value of these financial instruments, excluding any ineffectiveportion of the hedges, are included in foreign currency translation adjustments within accumulated other comprehensiveloss. The Company recorded, net of tax, in other comprehensive income a net loss of $21.2 million and gains of $28.6million and $54.6 million associated with these hedges in 2017, 2016 and 2015, respectively. Due to the permanentnature of the investments, the Company does not anticipate reclassifying any portion of these amounts to the incomestatement in the next twelve months. In assessing hedge effectiveness, the Company excludes forward points, whichare included as a component of interest expense.
While the forward contracts used for net equity and fair value hedges of non-permanent intercompany balancesmitigate its exposure to foreign exchange gains or losses, they result in an impact to operating cash flows as they aresettled, whereas the hedged items do not generate offsetting cash flows. The net cash flow impact of these currencyhedges for the years ended 2017, 2016 and 2015 was an inflow of $0.1 million and outflows of $2.7 million and $17.0million, respectively. The cash flow impact of certain of these exposures is in turn partially offset by certain hedges ofnet equity.
The Company considers the total notional value of its forward contracts as the best measure of the volume ofderivative transactions. As of December 30, 2017 and December 31, 2016, the notional amounts of outstanding forwardcontracts to purchase currencies were $111.1 million and $116.7 million, respectively, and the notional amounts ofoutstanding forward contracts to sell currencies were $112.1 million and $109.6 million, respectively. As ofDecember 30, 2017, the notional values of the largest positions outstanding were to purchase U.S. dollars $68.9 millionand euro $23.7 million and to sell Mexican pesos $36.6 million.
64
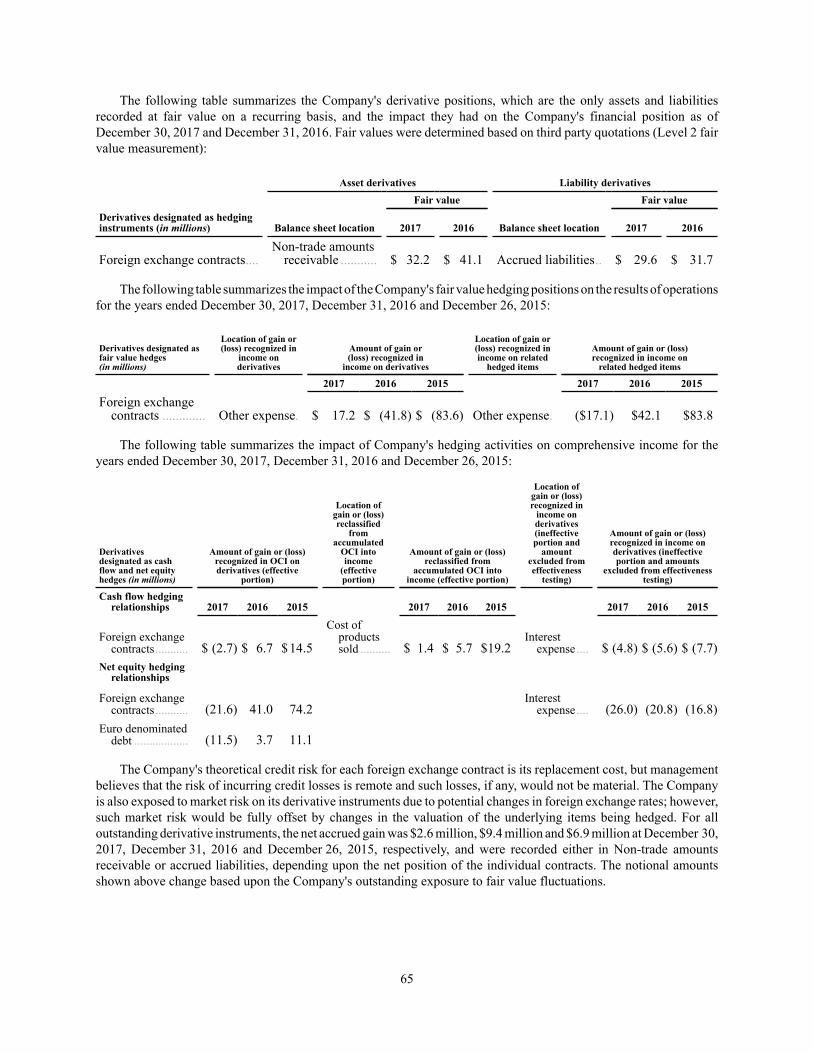
The following table summarizes the Company's derivative positions, which are the only assets and liabilitiesrecorded at fair value on a recurring basis, and the impact they had on the Company's financial position as ofDecember 30, 2017 and December 31, 2016. Fair values were determined based on third party quotations (Level 2 fairvalue measurement):
Asset derivatives Liability derivativesFair value Fair value
Derivatives designated as hedginginstruments (in millions) Balance sheet location 2017 2016 Balance sheet location 2017 2016
Foreign exchange contracts....Non-trade amounts
receivable ........... $ 32.2 $ 41.1 Accrued liabilities.. $ 29.6 $ 31.7
The following table summarizes the impact of the Company's fair value hedging positions on the results of operationsfor the years ended December 30, 2017, December 31, 2016 and December 26, 2015:
Derivatives designated asfair value hedges(in millions)
Location of gain or(loss) recognized in
income onderivatives
Amount of gain or(loss) recognized in
income on derivatives
Location of gain or(loss) recognized inincome on related
hedged items
Amount of gain or (loss)recognized in income on
related hedged items
2017 2016 2015 2017 2016 2015
Foreign exchangecontracts ............. Other expense. $ 17.2 $ (41.8) $ (83.6) Other expense. ($17.1) $42.1 $83.8
The following table summarizes the impact of Company's hedging activities on comprehensive income for theyears ended December 30, 2017, December 31, 2016 and December 26, 2015:
Derivativesdesignated as cashflow and net equityhedges (in millions)
Amount of gain or (loss)recognized in OCI onderivatives (effective
portion)
Location ofgain or (loss)reclassified
fromaccumulated
OCI intoincome
(effectiveportion)
Amount of gain or (loss)reclassified from
accumulated OCI intoincome (effective portion)
Location ofgain or (loss)recognized in
income onderivatives(ineffectiveportion and
amountexcluded fromeffectiveness
testing)
Amount of gain or (loss)recognized in income onderivatives (ineffectiveportion and amounts
excluded from effectivenesstesting)
Cash flow hedgingrelationships 2017 2016 2015 2017 2016 2015 2017 2016 2015
Foreign exchangecontracts........... $ (2.7) $ 6.7 $14.5
Cost ofproductssold .......... $ 1.4 $ 5.7 $19.2
Interestexpense .... $ (4.8) $ (5.6) $ (7.7)
Net equity hedgingrelationships
Foreign exchangecontracts........... (21.6) 41.0 74.2
Interestexpense .... (26.0) (20.8) (16.8)
Euro denominateddebt .................. (11.5) 3.7 11.1
The Company's theoretical credit risk for each foreign exchange contract is its replacement cost, but managementbelieves that the risk of incurring credit losses is remote and such losses, if any, would not be material. The Companyis also exposed to market risk on its derivative instruments due to potential changes in foreign exchange rates; however,such market risk would be fully offset by changes in the valuation of the underlying items being hedged. For alloutstanding derivative instruments, the net accrued gain was $2.6 million, $9.4 million and $6.9 million at December 30,2017, December 31, 2016 and December 26, 2015, respectively, and were recorded either in Non-trade amountsreceivable or accrued liabilities, depending upon the net position of the individual contracts. The notional amountsshown above change based upon the Company's outstanding exposure to fair value fluctuations.
65
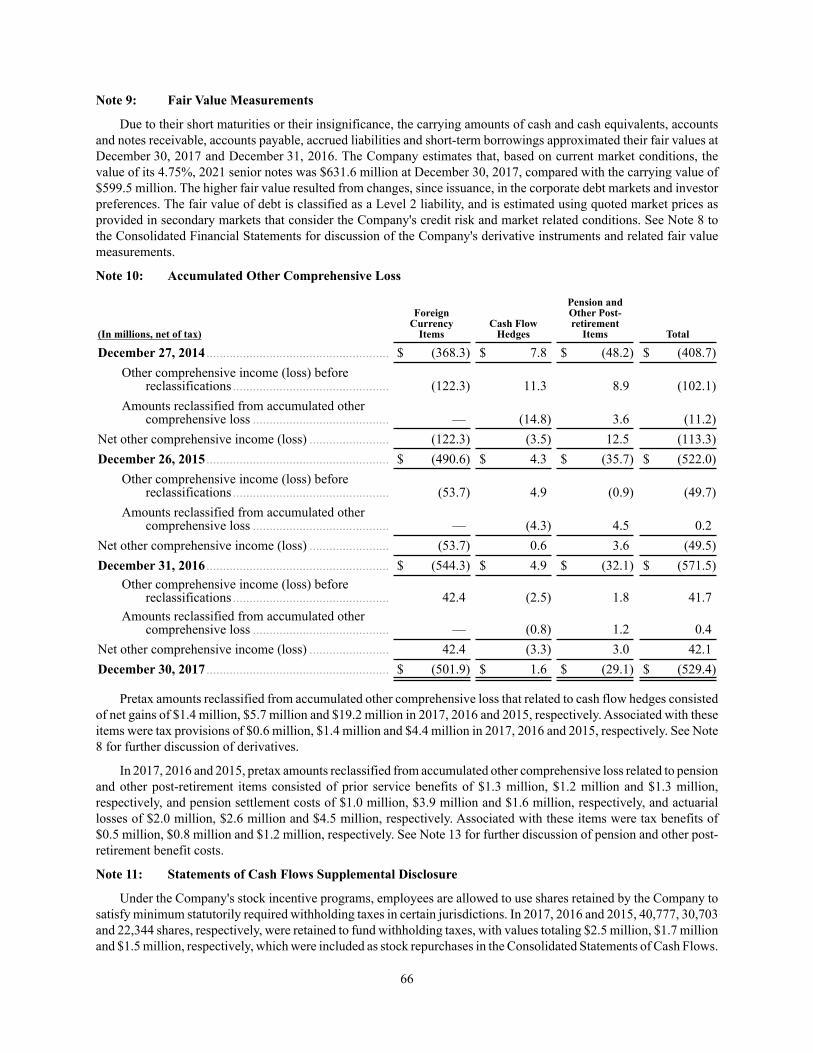
Note 9: Fair Value Measurements
Due to their short maturities or their insignificance, the carrying amounts of cash and cash equivalents, accountsand notes receivable, accounts payable, accrued liabilities and short-term borrowings approximated their fair values atDecember 30, 2017 and December 31, 2016. The Company estimates that, based on current market conditions, thevalue of its 4.75%, 2021 senior notes was $631.6 million at December 30, 2017, compared with the carrying value of$599.5 million. The higher fair value resulted from changes, since issuance, in the corporate debt markets and investorpreferences. The fair value of debt is classified as a Level 2 liability, and is estimated using quoted market prices asprovided in secondary markets that consider the Company's credit risk and market related conditions. See Note 8 tothe Consolidated Financial Statements for discussion of the Company's derivative instruments and related fair valuemeasurements.
66
Note 10: Accumulated Other Comprehensive Loss
(In millions, net of tax)
ForeignCurrency
ItemsCash Flow
Hedges
Pension andOther Post-retirement
Items Total
December 27, 2014 ....................................................... $ (368.3) $ 7.8 $ (48.2) $ (408.7)Other comprehensive income (loss) before
reclassifications ............................................... (122.3) 11.3 8.9 (102.1)Amounts reclassified from accumulated other
comprehensive loss ......................................... — (14.8) 3.6 (11.2)Net other comprehensive income (loss) ........................ (122.3) (3.5) 12.5 (113.3)December 26, 2015 ....................................................... $ (490.6) $ 4.3 $ (35.7) $ (522.0)
Other comprehensive income (loss) beforereclassifications ............................................... (53.7) 4.9 (0.9) (49.7)
Amounts reclassified from accumulated othercomprehensive loss ......................................... — (4.3) 4.5 0.2
Net other comprehensive income (loss) ........................ (53.7) 0.6 3.6 (49.5)December 31, 2016 ....................................................... $ (544.3) $ 4.9 $ (32.1) $ (571.5)
Other comprehensive income (loss) beforereclassifications ............................................... 42.4 (2.5) 1.8 41.7
Amounts reclassified from accumulated othercomprehensive loss ......................................... — (0.8) 1.2 0.4
Net other comprehensive income (loss) ........................ 42.4 (3.3) 3.0 42.1December 30, 2017 ....................................................... $ (501.9) $ 1.6 $ (29.1) $ (529.4)
Pretax amounts reclassified from accumulated other comprehensive loss that related to cash flow hedges consistedof net gains of $1.4 million, $5.7 million and $19.2 million in 2017, 2016 and 2015, respectively. Associated with theseitems were tax provisions of $0.6 million, $1.4 million and $4.4 million in 2017, 2016 and 2015, respectively. See Note8 for further discussion of derivatives.
In 2017, 2016 and 2015, pretax amounts reclassified from accumulated other comprehensive loss related to pensionand other post-retirement items consisted of prior service benefits of $1.3 million, $1.2 million and $1.3 million,respectively, and pension settlement costs of $1.0 million, $3.9 million and $1.6 million, respectively, and actuariallosses of $2.0 million, $2.6 million and $4.5 million, respectively. Associated with these items were tax benefits of$0.5 million, $0.8 million and $1.2 million, respectively. See Note 13 for further discussion of pension and other post-retirement benefit costs.
Note 11: Statements of Cash Flows Supplemental Disclosure
Under the Company's stock incentive programs, employees are allowed to use shares retained by the Company tosatisfy minimum statutorily required withholding taxes in certain jurisdictions. In 2017, 2016 and 2015, 40,777, 30,703and 22,344 shares, respectively, were retained to fund withholding taxes, with values totaling $2.5 million, $1.7 millionand $1.5 million, respectively, which were included as stock repurchases in the Consolidated Statements of Cash Flows.
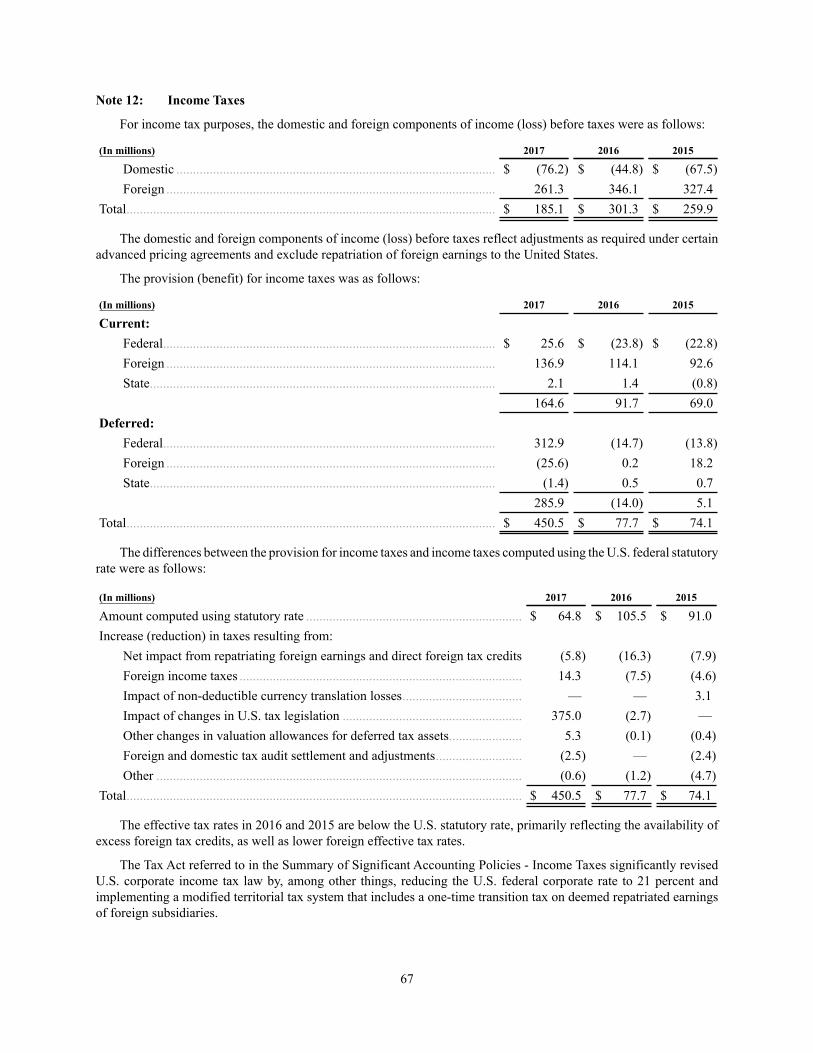
Note 12: Income Taxes
For income tax purposes, the domestic and foreign components of income (loss) before taxes were as follows:
(In millions) 2017 2016 2015
Domestic ................................................................................................ $ (76.2) $ (44.8) $ (67.5)Foreign ................................................................................................... 261.3 346.1 327.4
Total............................................................................................................... $ 185.1 $ 301.3 $ 259.9
The domestic and foreign components of income (loss) before taxes reflect adjustments as required under certainadvanced pricing agreements and exclude repatriation of foreign earnings to the United States.
The provision (benefit) for income taxes was as follows:
(In millions) 2017 2016 2015
Current:Federal.................................................................................................... $ 25.6 $ (23.8) $ (22.8)Foreign ................................................................................................... 136.9 114.1 92.6State........................................................................................................ 2.1 1.4 (0.8)
164.6 91.7 69.0Deferred:
Federal.................................................................................................... 312.9 (14.7) (13.8)Foreign ................................................................................................... (25.6) 0.2 18.2State........................................................................................................ (1.4) 0.5 0.7
285.9 (14.0) 5.1Total............................................................................................................... $ 450.5 $ 77.7 $ 74.1
The differences between the provision for income taxes and income taxes computed using the U.S. federal statutoryrate were as follows:
(In millions) 2017 2016 2015
Amount computed using statutory rate ................................................................. $ 64.8 $ 105.5 $ 91.0Increase (reduction) in taxes resulting from:
Net impact from repatriating foreign earnings and direct foreign tax credits (5.8) (16.3) (7.9)Foreign income taxes ..................................................................................... 14.3 (7.5) (4.6)Impact of non-deductible currency translation losses.................................... — — 3.1Impact of changes in U.S. tax legislation ...................................................... 375.0 (2.7) —Other changes in valuation allowances for deferred tax assets...................... 5.3 (0.1) (0.4)Foreign and domestic tax audit settlement and adjustments.......................... (2.5) — (2.4)Other .............................................................................................................. (0.6) (1.2) (4.7)
Total....................................................................................................................... $ 450.5 $ 77.7 $ 74.1
The effective tax rates in 2016 and 2015 are below the U.S. statutory rate, primarily reflecting the availability ofexcess foreign tax credits, as well as lower foreign effective tax rates.
The Tax Act referred to in the Summary of Significant Accounting Policies - Income Taxes significantly revisedU.S. corporate income tax law by, among other things, reducing the U.S. federal corporate rate to 21 percent andimplementing a modified territorial tax system that includes a one-time transition tax on deemed repatriated earningsof foreign subsidiaries.
67
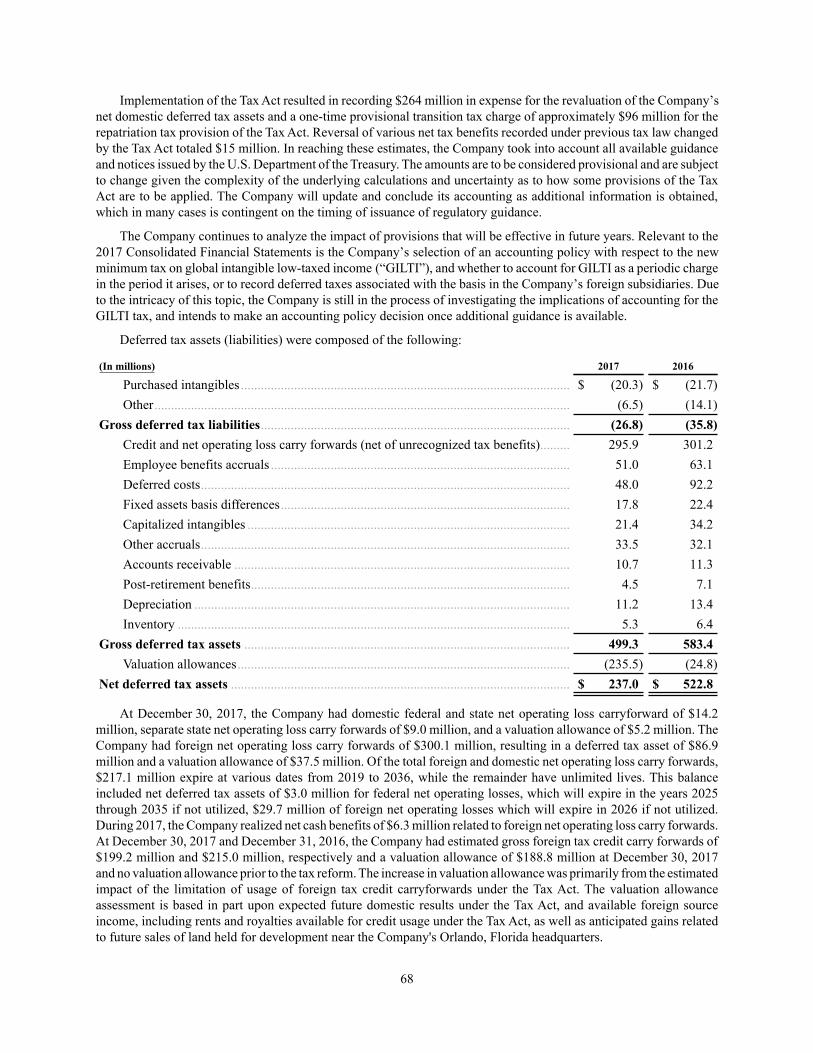
Implementation of the Tax Act resulted in recording $264 million in expense for the revaluation of the Company’snet domestic deferred tax assets and a one-time provisional transition tax charge of approximately $96 million for therepatriation tax provision of the Tax Act. Reversal of various net tax benefits recorded under previous tax law changedby the Tax Act totaled $15 million. In reaching these estimates, the Company took into account all available guidanceand notices issued by the U.S. Department of the Treasury. The amounts are to be considered provisional and are subjectto change given the complexity of the underlying calculations and uncertainty as to how some provisions of the TaxAct are to be applied. The Company will update and conclude its accounting as additional information is obtained,which in many cases is contingent on the timing of issuance of regulatory guidance.
The Company continues to analyze the impact of provisions that will be effective in future years. Relevant to the2017 Consolidated Financial Statements is the Company’s selection of an accounting policy with respect to the newminimum tax on global intangible low-taxed income (“GILTI”), and whether to account for GILTI as a periodic chargein the period it arises, or to record deferred taxes associated with the basis in the Company’s foreign subsidiaries. Dueto the intricacy of this topic, the Company is still in the process of investigating the implications of accounting for theGILTI tax, and intends to make an accounting policy decision once additional guidance is available.
Deferred tax assets (liabilities) were composed of the following:
(In millions) 2017 2016
Purchased intangibles ................................................................................................... $ (20.3) $ (21.7)Other............................................................................................................................. (6.5) (14.1)
Gross deferred tax liabilities............................................................................................. (26.8) (35.8)Credit and net operating loss carry forwards (net of unrecognized tax benefits)......... 295.9 301.2Employee benefits accruals .......................................................................................... 51.0 63.1Deferred costs............................................................................................................... 48.0 92.2Fixed assets basis differences....................................................................................... 17.8 22.4Capitalized intangibles ................................................................................................. 21.4 34.2Other accruals............................................................................................................... 33.5 32.1Accounts receivable ..................................................................................................... 10.7 11.3Post-retirement benefits................................................................................................ 4.5 7.1Depreciation ................................................................................................................. 11.2 13.4Inventory ...................................................................................................................... 5.3 6.4
Gross deferred tax assets .................................................................................................. 499.3 583.4Valuation allowances.................................................................................................... (235.5) (24.8)
Net deferred tax assets ...................................................................................................... $ 237.0 $ 522.8
At December 30, 2017, the Company had domestic federal and state net operating loss carryforward of $14.2million, separate state net operating loss carry forwards of $9.0 million, and a valuation allowance of $5.2 million. TheCompany had foreign net operating loss carry forwards of $300.1 million, resulting in a deferred tax asset of $86.9million and a valuation allowance of $37.5 million. Of the total foreign and domestic net operating loss carry forwards,$217.1 million expire at various dates from 2019 to 2036, while the remainder have unlimited lives. This balanceincluded net deferred tax assets of $3.0 million for federal net operating losses, which will expire in the years 2025through 2035 if not utilized, $29.7 million of foreign net operating losses which will expire in 2026 if not utilized.During 2017, the Company realized net cash benefits of $6.3 million related to foreign net operating loss carry forwards.At December 30, 2017 and December 31, 2016, the Company had estimated gross foreign tax credit carry forwards of$199.2 million and $215.0 million, respectively and a valuation allowance of $188.8 million at December 30, 2017and no valuation allowance prior to the tax reform. The increase in valuation allowance was primarily from the estimatedimpact of the limitation of usage of foreign tax credit carryforwards under the Tax Act. The valuation allowanceassessment is based in part upon expected future domestic results under the Tax Act, and available foreign sourceincome, including rents and royalties available for credit usage under the Tax Act, as well as anticipated gains relatedto future sales of land held for development near the Company's Orlando, Florida headquarters.
68
The Company paid income taxes in 2017, 2016 and 2015 of $123.3 million, $118.7 million and $113.7 million,respectively. The Company has a foreign subsidiary which receives a tax holiday that expires in 2020. The net benefitof this and other expired tax holidays was $0.7 million, $1.3 million and $2.6 million in 2017, 2016 and 2015, respectively.
As of December 30, 2017 and December 31, 2016, the Company's accrual for uncertain tax positions was $19.8million and $20.7 million, respectively. The Company estimates that approximately $19.2 million of that amount, ifrecognized, would impact the effective tax rate. A reconciliation of the beginning and ending amount of accrual foruncertain tax positions is as follows:
(In millions) 2017 2016 2015
Balance, beginning of year ......................................................................... $ 20.7 $ 21.8 $ 22.5Additions based on tax positions related to the current year ................. 3.6 2.7 3.3Additions for tax positions of prior year................................................ 2.2 1.2 3.4Reduction for tax positions of prior years.............................................. (3.0) (1.2) (1.6)Settlements............................................................................................. (1.2) — (1.1)Reductions for lapse in statute of limitations......................................... (3.7) (3.1) (3.2)Impact of foreign currency rate changes versus the U.S. dollar ............ 1.2 (0.7) (1.5)
Balance, end of year .................................................................................... $ 19.8 $ 20.7 $ 21.8
Interest and penalties related to uncertain tax positions in the Company's global operations are recorded as acomponent of the provision for income taxes. Accrued interest and penalties were $7.3 million and $7.1 million as ofDecember 30, 2017 and December 31, 2016, respectively. Interest and penalties included in the provision for incometaxes totaled $0.2 million and $1.1 million for 2017 and 2016, respectively and no significant interest and penaltiesincluded in the provision for income taxes for 2015.
During the year ended December 30, 2017, the accrual for uncertain tax positions decreased by $3.7 millionprimarily due to the expiration of the statute of limitations in various jurisdictions and decreased by another $1.2 millionas a result of the Company agreeing to tax settlements in various foreign tax jurisdictions. During the year, increasesin uncertain positions being taken during the year in various foreign tax jurisdictions were partially offset by the impactof changes in foreign exchange rates.
During the year ended December 31, 2016, the accrual for uncertain tax positions decreased by $3.1 millionprimarily due to the expiration of the statute of limitations in various jurisdictions. During the year, increases in uncertainpositions being taken during the year in various foreign tax jurisdictions were partially offset by the impact of changesin foreign exchange rates.
During the year ended December 26, 2015, the accrual for uncertain tax positions decreased by $1.1 millionprimarily as a result of the Company agreeing to tax settlements in various foreign jurisdictions, as well as a $3.2 milliondecrease of accruals for uncertain tax positions due to the expiration of the statute of limitations in various jurisdictions.During the year, increases in uncertain positions being taken in various foreign tax jurisdictions were partially offsetby the impact of changes in foreign exchange rates.
The Company operates globally and files income tax returns in the United States with federal and various stateagencies, and in foreign jurisdictions. In the normal course of business, the Company is subject to examination bytaxing authorities throughout the world. The Company is no longer subject to income tax examination in the followingmajor jurisdictions: for U.S. tax for years before 2003, Australia (2012), Brazil (2005), China (2005), France (2012),Germany (2011), Greece (2011), India (2002), Indonesia (2010), Italy (2015), Malaysia (2010), Mexico (2005), andSouth Africa (2013), with limited exceptions.
69
The Company estimates that it may settle one or more foreign and domestic audits in the next twelve months thatmay result in a decrease in the amount of accrual for uncertain tax positions of up to $0.8 million. For the remainingbalance as of December 30, 2017, the Company is not able to reliably estimate the timing or ultimate settlement amount.While the Company does not currently expect material changes, it is possible that the amount of unrecognized benefitwith respect to the uncertain tax positions will significantly increase or decrease related to audits in various foreignjurisdictions that may conclude during that period or new developments that could also, in turn, impact the Company'sassessment relative to the establishment of valuation allowances against certain existing deferred tax assets. At thistime, the Company is not able to make a reasonable estimate of the range of impact on the balance of unrecognized taxbenefits or the impact on the effective tax rate related to these items.
As of December 30, 2017, the Company had foreign undistributed earnings of $1.7 billion where it is the Company'sintent that the earnings be reinvested indefinitely. The Company is in the process of evaluating the impact of the TaxAct on its indefinite reinvestment assertion, including the impact of foreign withholding taxes and it expects to completeits evaluation in the one-year period provided by SAB 118. With respect to accumulated earnings of foreign subsidiaries,no additional U.S. federal and state income taxes or foreign withholding taxes have been provided as all accumulatedearnings of foreign subsidiaries are deemed to have been remitted as part of the one-time mandatory repatriationtransition tax charge recorded in 2017, although the amount recorded is subject to adjustment if estimates change. Inthe event that in certain foreign jurisdictions earnings that are currently considered indefinitely invested would nolonger be classified as such, expense would be recorded at that time for withholding taxes that would be due in theforeign jurisdictions when those earnings are repatriated.
70
Note 13: Retirement Benefit Plans
The Company has various defined benefit pension plans covering substantially all domestic employees employedas of June 30, 2005 and certain employees in other countries. In addition to providing pension benefits, the Companyprovides certain post-retirement healthcare and life insurance benefits for selected U.S. and Canadian employees.Employees may become eligible for these benefits if they reach normal retirement age while working for the Companyor satisfy certain age and years of service requirements. The medical plans are contributory for most retirees withcontributions adjusted annually, and contain other cost-sharing features, such as deductibles and coinsurance. Themedical plans include an allowance for Medicare for post-65 age retirees. Most employees and retirees outside theUnited States are covered by government healthcare programs.
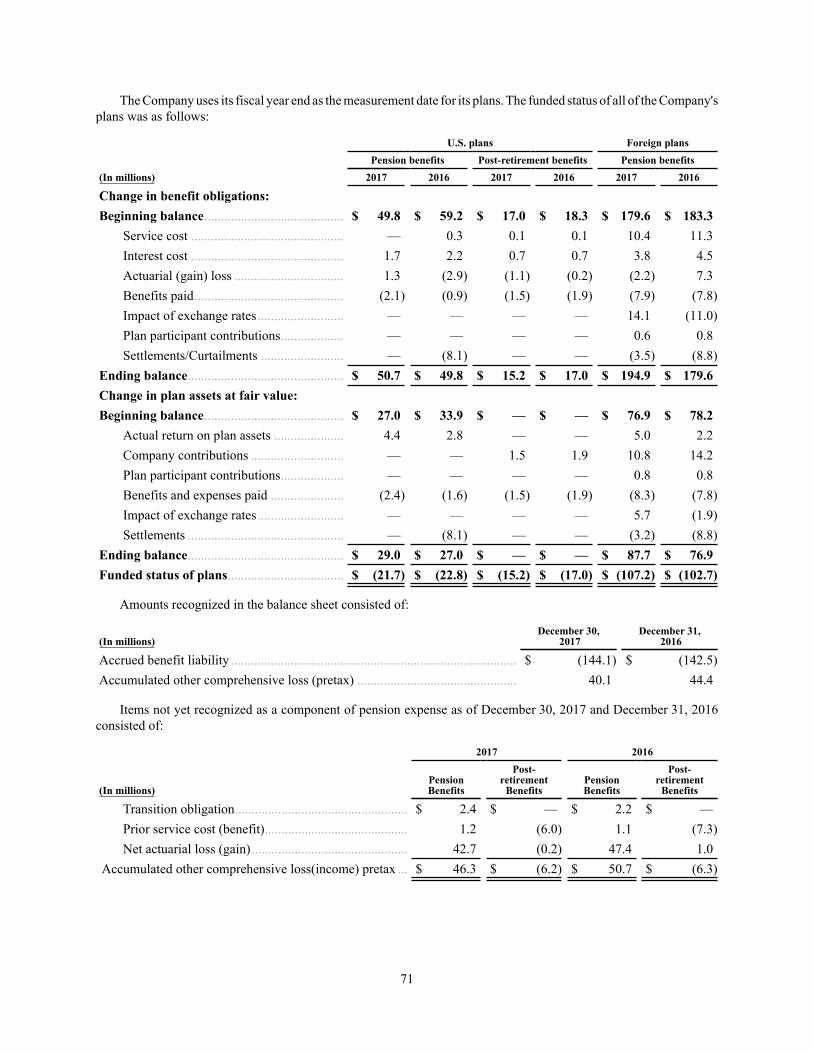
The Company uses its fiscal year end as the measurement date for its plans. The funded status of all of the Company'splans was as follows:
U.S. plans Foreign plansPension benefits Post-retirement benefits Pension benefits
(In millions) 2017 2016 2017 2016 2017 2016
Change in benefit obligations:Beginning balance.......................................... $ 49.8 $ 59.2 $ 17.0 $ 18.3 $ 179.6 $ 183.3
Service cost .............................................. — 0.3 0.1 0.1 10.4 11.3Interest cost .............................................. 1.7 2.2 0.7 0.7 3.8 4.5Actuarial (gain) loss ................................. 1.3 (2.9) (1.1) (0.2) (2.2) 7.3Benefits paid............................................. (2.1) (0.9) (1.5) (1.9) (7.9) (7.8)Impact of exchange rates.......................... — — — — 14.1 (11.0)Plan participant contributions................... — — — — 0.6 0.8Settlements/Curtailments ......................... — (8.1) — — (3.5) (8.8)
Ending balance............................................... $ 50.7 $ 49.8 $ 15.2 $ 17.0 $ 194.9 $ 179.6Change in plan assets at fair value:Beginning balance.......................................... $ 27.0 $ 33.9 $ — $ — $ 76.9 $ 78.2
Actual return on plan assets ..................... 4.4 2.8 — — 5.0 2.2Company contributions ............................ — — 1.5 1.9 10.8 14.2Plan participant contributions................... — — — — 0.8 0.8Benefits and expenses paid ...................... (2.4) (1.6) (1.5) (1.9) (8.3) (7.8)Impact of exchange rates.......................... — — — — 5.7 (1.9)Settlements ............................................... — (8.1) — — (3.2) (8.8)
Ending balance............................................... $ 29.0 $ 27.0 $ — $ — $ 87.7 $ 76.9Funded status of plans................................... $ (21.7) $ (22.8) $ (15.2) $ (17.0) $ (107.2) $ (102.7)
Amounts recognized in the balance sheet consisted of:
(In millions)December 30,
2017December 31,
2016
Accrued benefit liability ...................................................................................... $ (144.1) $ (142.5)Accumulated other comprehensive loss (pretax) ................................................ 40.1 44.4
Items not yet recognized as a component of pension expense as of December 30, 2017 and December 31, 2016consisted of:
2017 2016
(In millions)PensionBenefits
Post-retirement
BenefitsPensionBenefits
Post-retirement
Benefits
Transition obligation.................................................... $ 2.4 $ — $ 2.2 $ —Prior service cost (benefit)........................................... 1.2 (6.0) 1.1 (7.3)Net actuarial loss (gain)............................................... 42.7 (0.2) 47.4 1.0
Accumulated other comprehensive loss(income) pretax ... $ 46.3 $ (6.2) $ 50.7 $ (6.3)
71
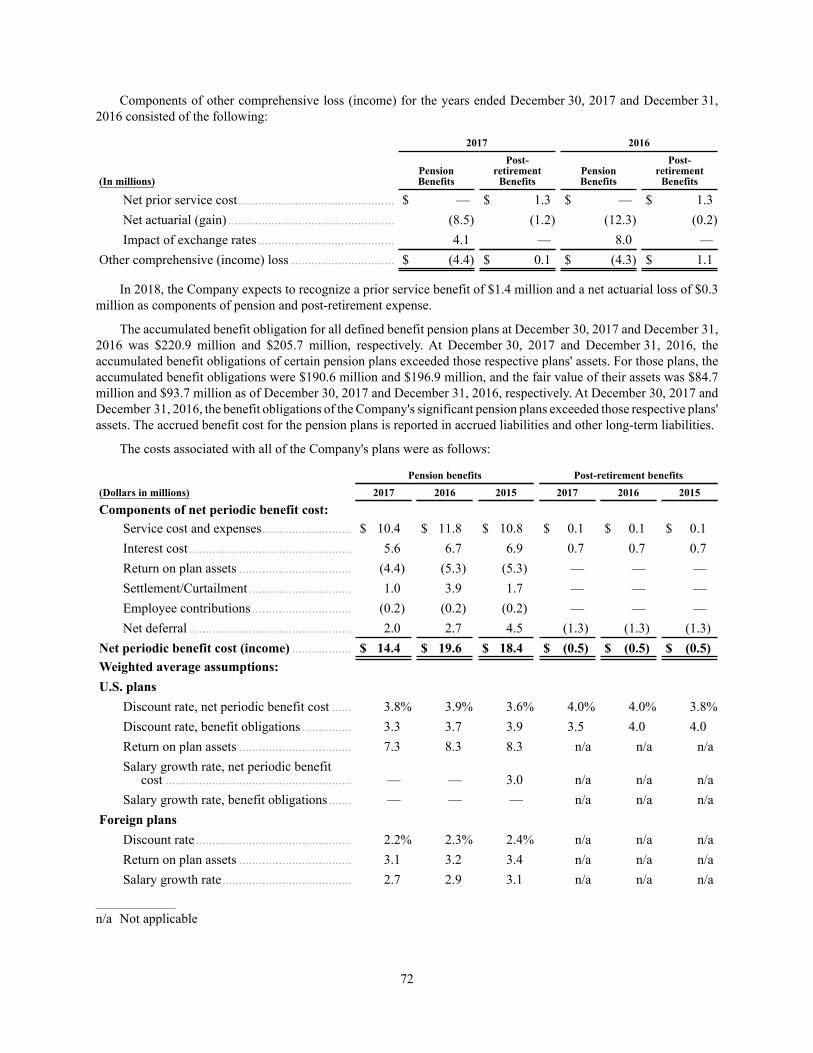
Components of other comprehensive loss (income) for the years ended December 30, 2017 and December 31,2016 consisted of the following:
2017 2016
(In millions)PensionBenefits
Post-retirement
BenefitsPensionBenefits
Post-retirement
Benefits
Net prior service cost............................................... $ — $ 1.3 $ — $ 1.3Net actuarial (gain) .................................................. (8.5) (1.2) (12.3) (0.2)Impact of exchange rates ......................................... 4.1 — 8.0 —
Other comprehensive (income) loss ............................... $ (4.4) $ 0.1 $ (4.3) $ 1.1
In 2018, the Company expects to recognize a prior service benefit of $1.4 million and a net actuarial loss of $0.3million as components of pension and post-retirement expense.
The accumulated benefit obligation for all defined benefit pension plans at December 30, 2017 and December 31,2016 was $220.9 million and $205.7 million, respectively. At December 30, 2017 and December 31, 2016, theaccumulated benefit obligations of certain pension plans exceeded those respective plans' assets. For those plans, theaccumulated benefit obligations were $190.6 million and $196.9 million, and the fair value of their assets was $84.7million and $93.7 million as of December 30, 2017 and December 31, 2016, respectively. At December 30, 2017 andDecember 31, 2016, the benefit obligations of the Company's significant pension plans exceeded those respective plans'assets. The accrued benefit cost for the pension plans is reported in accrued liabilities and other long-term liabilities.
The costs associated with all of the Company's plans were as follows:
Pension benefits Post-retirement benefits(Dollars in millions) 2017 2016 2015 2017 2016 2015
Components of net periodic benefit cost:Service cost and expenses........................... $ 10.4 $ 11.8 $ 10.8 $ 0.1 $ 0.1 $ 0.1Interest cost ................................................. 5.6 6.7 6.9 0.7 0.7 0.7Return on plan assets .................................. (4.4) (5.3) (5.3) — — —Settlement/Curtailment ............................... 1.0 3.9 1.7 — — —Employee contributions .............................. (0.2) (0.2) (0.2) — — —Net deferral ................................................. 2.0 2.7 4.5 (1.3) (1.3) (1.3)
Net periodic benefit cost (income) .................. $ 14.4 $ 19.6 $ 18.4 $ (0.5) $ (0.5) $ (0.5)Weighted average assumptions:U.S. plans
Discount rate, net periodic benefit cost ...... 3.8% 3.9% 3.6% 4.0% 4.0% 3.8%Discount rate, benefit obligations ............... 3.3 3.7 3.9 3.5 4.0 4.0Return on plan assets .................................. 7.3 8.3 8.3 n/a n/a n/aSalary growth rate, net periodic benefit
cost ........................................................ — — 3.0 n/a n/a n/aSalary growth rate, benefit obligations....... — — — n/a n/a n/a
Foreign plansDiscount rate............................................... 2.2% 2.3% 2.4% n/a n/a n/aReturn on plan assets .................................. 3.1 3.2 3.4 n/a n/a n/aSalary growth rate....................................... 2.7 2.9 3.1 n/a n/a n/a
____________________
n/a Not applicable
72
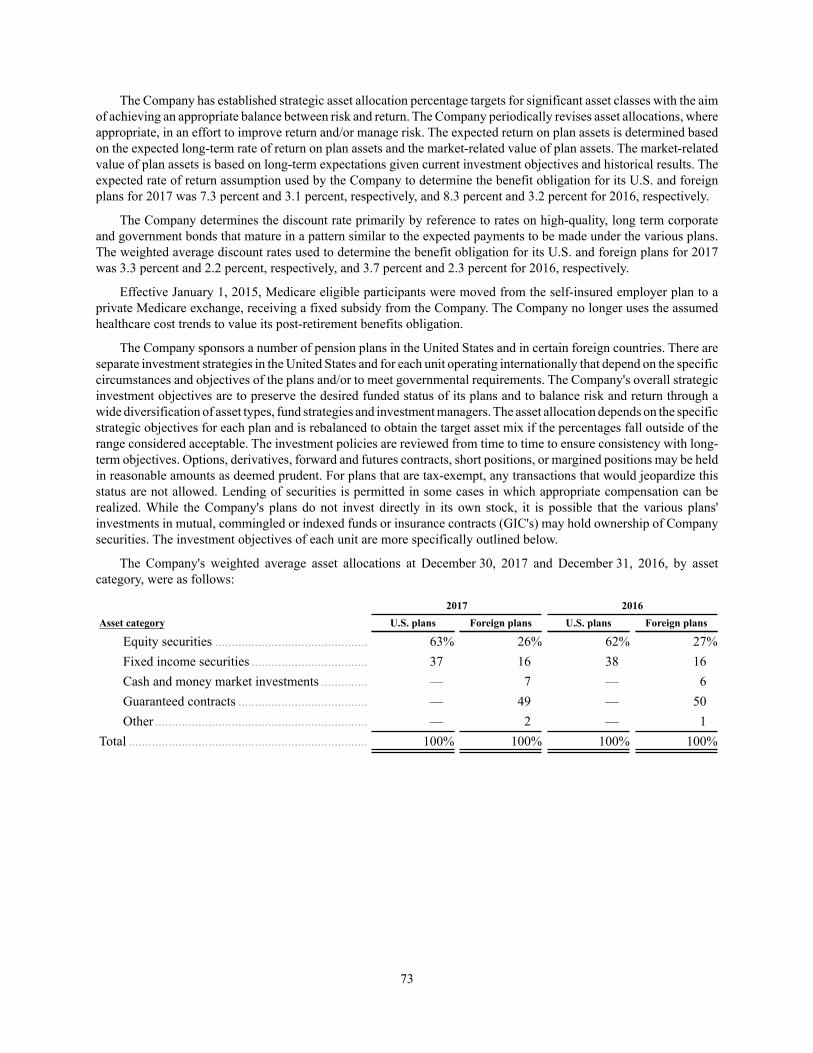
The Company has established strategic asset allocation percentage targets for significant asset classes with the aimof achieving an appropriate balance between risk and return. The Company periodically revises asset allocations, whereappropriate, in an effort to improve return and/or manage risk. The expected return on plan assets is determined basedon the expected long-term rate of return on plan assets and the market-related value of plan assets. The market-relatedvalue of plan assets is based on long-term expectations given current investment objectives and historical results. Theexpected rate of return assumption used by the Company to determine the benefit obligation for its U.S. and foreignplans for 2017 was 7.3 percent and 3.1 percent, respectively, and 8.3 percent and 3.2 percent for 2016, respectively.
The Company determines the discount rate primarily by reference to rates on high-quality, long term corporateand government bonds that mature in a pattern similar to the expected payments to be made under the various plans.The weighted average discount rates used to determine the benefit obligation for its U.S. and foreign plans for 2017was 3.3 percent and 2.2 percent, respectively, and 3.7 percent and 2.3 percent for 2016, respectively.
Effective January 1, 2015, Medicare eligible participants were moved from the self-insured employer plan to aprivate Medicare exchange, receiving a fixed subsidy from the Company. The Company no longer uses the assumedhealthcare cost trends to value its post-retirement benefits obligation.
The Company sponsors a number of pension plans in the United States and in certain foreign countries. There areseparate investment strategies in the United States and for each unit operating internationally that depend on the specificcircumstances and objectives of the plans and/or to meet governmental requirements. The Company's overall strategicinvestment objectives are to preserve the desired funded status of its plans and to balance risk and return through awide diversification of asset types, fund strategies and investment managers. The asset allocation depends on the specificstrategic objectives for each plan and is rebalanced to obtain the target asset mix if the percentages fall outside of therange considered acceptable. The investment policies are reviewed from time to time to ensure consistency with long-term objectives. Options, derivatives, forward and futures contracts, short positions, or margined positions may be heldin reasonable amounts as deemed prudent. For plans that are tax-exempt, any transactions that would jeopardize thisstatus are not allowed. Lending of securities is permitted in some cases in which appropriate compensation can berealized. While the Company's plans do not invest directly in its own stock, it is possible that the various plans'investments in mutual, commingled or indexed funds or insurance contracts (GIC's) may hold ownership of Companysecurities. The investment objectives of each unit are more specifically outlined below.
The Company's weighted average asset allocations at December 30, 2017 and December 31, 2016, by assetcategory, were as follows:
2017 2016Asset category U.S. plans Foreign plans U.S. plans Foreign plans
Equity securities .............................................. 63% 26% 62% 27%Fixed income securities ................................... 37 16 38 16Cash and money market investments .............. — 7 — 6Guaranteed contracts ....................................... — 49 — 50Other ................................................................ — 2 — 1
Total ........................................................................ 100% 100% 100% 100%
73
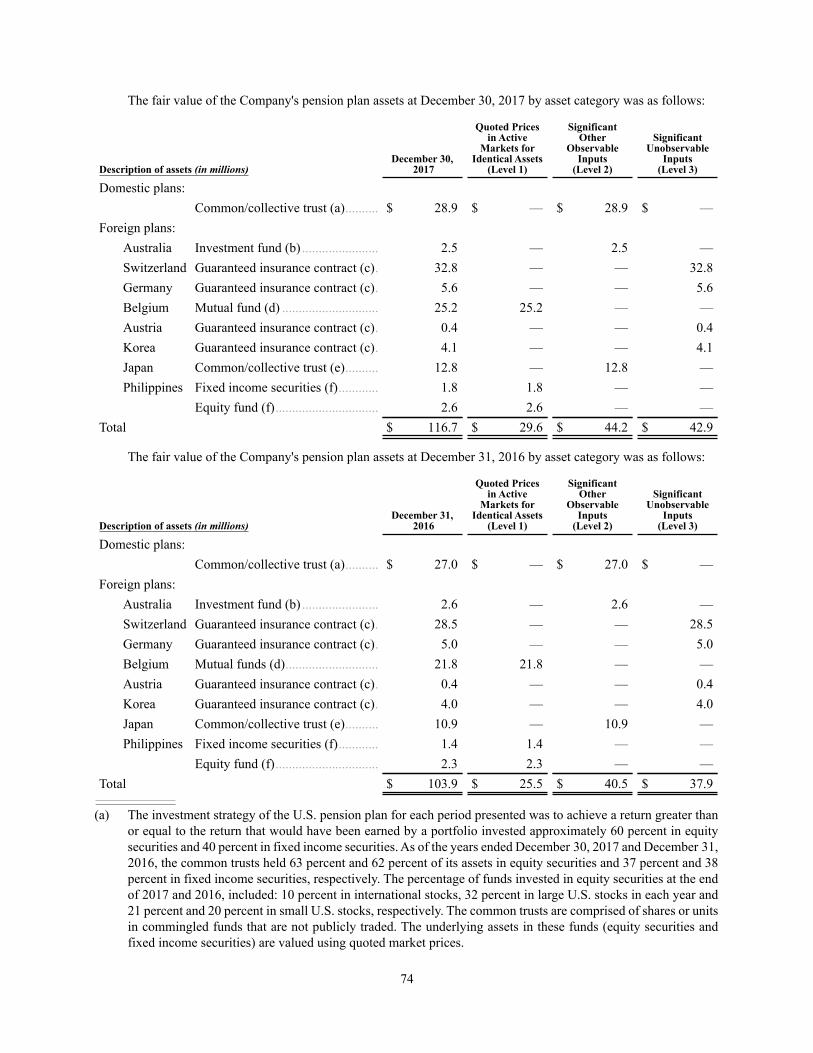
The fair value of the Company's pension plan assets at December 30, 2017 by asset category was as follows:
Description of assets (in millions)December 30,
2017
Quoted Pricesin Active
Markets forIdentical Assets
(Level 1)
SignificantOther
ObservableInputs
(Level 2)
SignificantUnobservable
Inputs(Level 3)
Domestic plans:Common/collective trust (a).......... $ 28.9 $ — $ 28.9 $ —
Foreign plans:Australia Investment fund (b) ....................... 2.5 — 2.5 —Switzerland Guaranteed insurance contract (c). 32.8 — — 32.8Germany Guaranteed insurance contract (c). 5.6 — — 5.6Belgium Mutual fund (d) ............................. 25.2 25.2 — —Austria Guaranteed insurance contract (c). 0.4 — — 0.4Korea Guaranteed insurance contract (c). 4.1 — — 4.1Japan Common/collective trust (e).......... 12.8 — 12.8 —Philippines Fixed income securities (f)............ 1.8 1.8 — —
Equity fund (f)............................... 2.6 2.6 — —Total $ 116.7 $ 29.6 $ 44.2 $ 42.9
The fair value of the Company's pension plan assets at December 31, 2016 by asset category was as follows:
Description of assets (in millions)December 31,
2016
Quoted Pricesin Active
Markets forIdentical Assets
(Level 1)
SignificantOther
ObservableInputs
(Level 2)
SignificantUnobservable
Inputs(Level 3)
Domestic plans:Common/collective trust (a).......... $ 27.0 $ — $ 27.0 $ —
Foreign plans:Australia Investment fund (b) ....................... 2.6 — 2.6 —Switzerland Guaranteed insurance contract (c). 28.5 — — 28.5Germany Guaranteed insurance contract (c). 5.0 — — 5.0Belgium Mutual funds (d)............................ 21.8 21.8 — —Austria Guaranteed insurance contract (c). 0.4 — — 0.4Korea Guaranteed insurance contract (c). 4.0 — — 4.0Japan Common/collective trust (e).......... 10.9 — 10.9 —Philippines Fixed income securities (f)............ 1.4 1.4 — —
Equity fund (f)............................... 2.3 2.3 — —Total $ 103.9 $ 25.5 $ 40.5 $ 37.9
____________________
(a) The investment strategy of the U.S. pension plan for each period presented was to achieve a return greater thanor equal to the return that would have been earned by a portfolio invested approximately 60 percent in equitysecurities and 40 percent in fixed income securities. As of the years ended December 30, 2017 and December 31,2016, the common trusts held 63 percent and 62 percent of its assets in equity securities and 37 percent and 38percent in fixed income securities, respectively. The percentage of funds invested in equity securities at the endof 2017 and 2016, included: 10 percent in international stocks, 32 percent in large U.S. stocks in each year and21 percent and 20 percent in small U.S. stocks, respectively. The common trusts are comprised of shares or unitsin commingled funds that are not publicly traded. The underlying assets in these funds (equity securities andfixed income securities) are valued using quoted market prices.
74
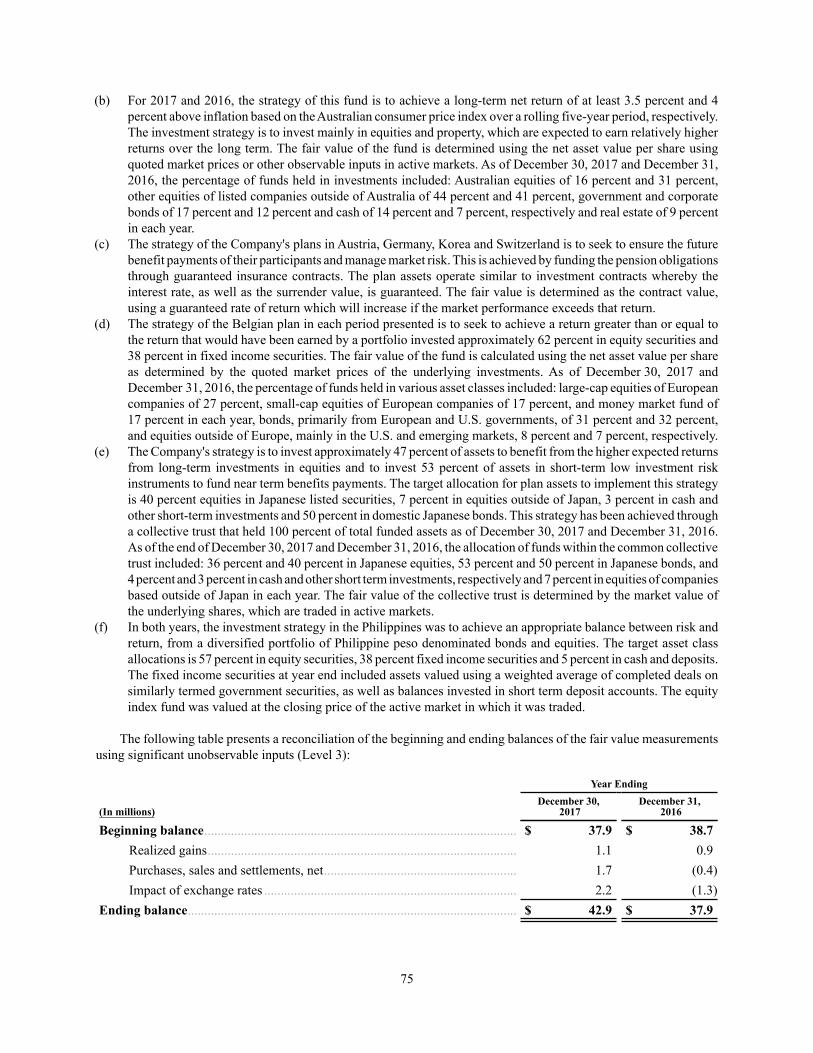
(b) For 2017 and 2016, the strategy of this fund is to achieve a long-term net return of at least 3.5 percent and 4percent above inflation based on the Australian consumer price index over a rolling five-year period, respectively.The investment strategy is to invest mainly in equities and property, which are expected to earn relatively higherreturns over the long term. The fair value of the fund is determined using the net asset value per share usingquoted market prices or other observable inputs in active markets. As of December 30, 2017 and December 31,2016, the percentage of funds held in investments included: Australian equities of 16 percent and 31 percent,other equities of listed companies outside of Australia of 44 percent and 41 percent, government and corporatebonds of 17 percent and 12 percent and cash of 14 percent and 7 percent, respectively and real estate of 9 percentin each year.
(c) The strategy of the Company's plans in Austria, Germany, Korea and Switzerland is to seek to ensure the futurebenefit payments of their participants and manage market risk. This is achieved by funding the pension obligationsthrough guaranteed insurance contracts. The plan assets operate similar to investment contracts whereby theinterest rate, as well as the surrender value, is guaranteed. The fair value is determined as the contract value,using a guaranteed rate of return which will increase if the market performance exceeds that return.
(d) The strategy of the Belgian plan in each period presented is to seek to achieve a return greater than or equal tothe return that would have been earned by a portfolio invested approximately 62 percent in equity securities and38 percent in fixed income securities. The fair value of the fund is calculated using the net asset value per shareas determined by the quoted market prices of the underlying investments. As of December 30, 2017 andDecember 31, 2016, the percentage of funds held in various asset classes included: large-cap equities of Europeancompanies of 27 percent, small-cap equities of European companies of 17 percent, and money market fund of17 percent in each year, bonds, primarily from European and U.S. governments, of 31 percent and 32 percent,and equities outside of Europe, mainly in the U.S. and emerging markets, 8 percent and 7 percent, respectively.
(e) The Company's strategy is to invest approximately 47 percent of assets to benefit from the higher expected returnsfrom long-term investments in equities and to invest 53 percent of assets in short-term low investment riskinstruments to fund near term benefits payments. The target allocation for plan assets to implement this strategyis 40 percent equities in Japanese listed securities, 7 percent in equities outside of Japan, 3 percent in cash andother short-term investments and 50 percent in domestic Japanese bonds. This strategy has been achieved througha collective trust that held 100 percent of total funded assets as of December 30, 2017 and December 31, 2016.As of the end of December 30, 2017 and December 31, 2016, the allocation of funds within the common collectivetrust included: 36 percent and 40 percent in Japanese equities, 53 percent and 50 percent in Japanese bonds, and4 percent and 3 percent in cash and other short term investments, respectively and 7 percent in equities of companiesbased outside of Japan in each year. The fair value of the collective trust is determined by the market value ofthe underlying shares, which are traded in active markets.
(f) In both years, the investment strategy in the Philippines was to achieve an appropriate balance between risk andreturn, from a diversified portfolio of Philippine peso denominated bonds and equities. The target asset classallocations is 57 percent in equity securities, 38 percent fixed income securities and 5 percent in cash and deposits.The fixed income securities at year end included assets valued using a weighted average of completed deals onsimilarly termed government securities, as well as balances invested in short term deposit accounts. The equityindex fund was valued at the closing price of the active market in which it was traded.
The following table presents a reconciliation of the beginning and ending balances of the fair value measurementsusing significant unobservable inputs (Level 3):
Year Ending
(In millions)December 30,
2017December 31,
2016
Beginning balance.............................................................................................. $ 37.9 $ 38.7Realized gains............................................................................................. 1.1 0.9Purchases, sales and settlements, net.......................................................... 1.7 (0.4)Impact of exchange rates ............................................................................ 2.2 (1.3)
Ending balance................................................................................................... $ 42.9 $ 37.9
75
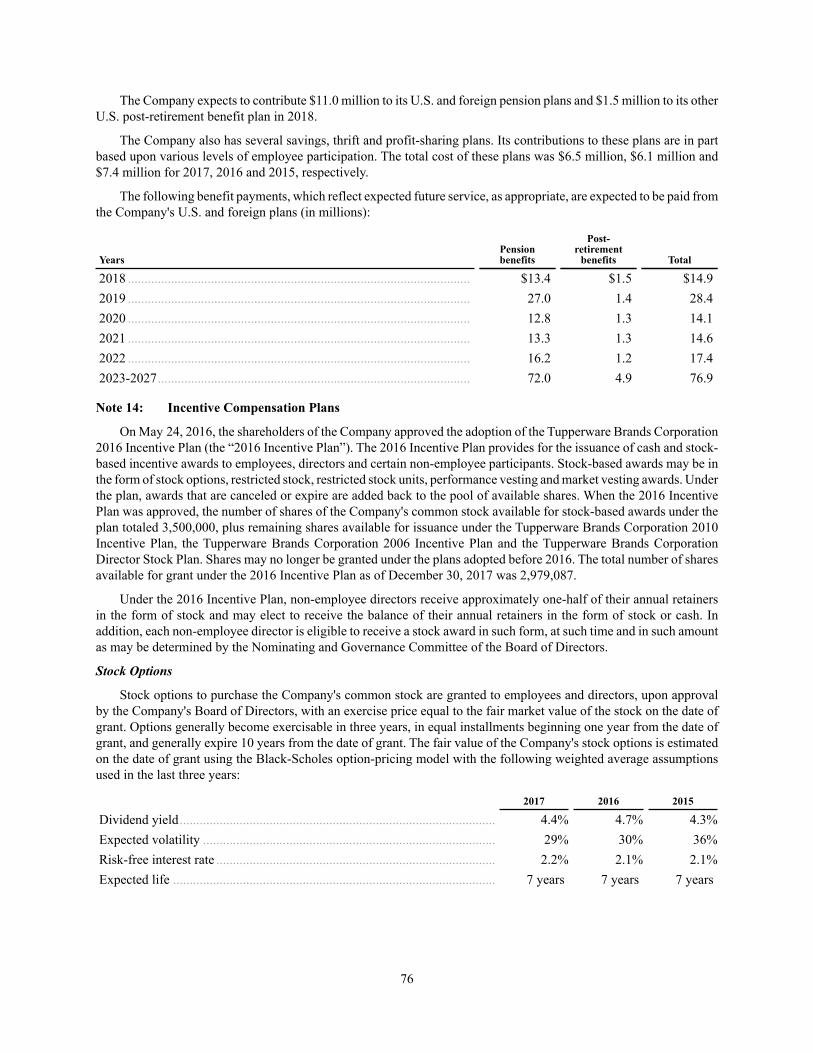
The Company expects to contribute $11.0 million to its U.S. and foreign pension plans and $1.5 million to its otherU.S. post-retirement benefit plan in 2018.
The Company also has several savings, thrift and profit-sharing plans. Its contributions to these plans are in partbased upon various levels of employee participation. The total cost of these plans was $6.5 million, $6.1 million and$7.4 million for 2017, 2016 and 2015, respectively.
The following benefit payments, which reflect expected future service, as appropriate, are expected to be paid fromthe Company's U.S. and foreign plans (in millions):
YearsPensionbenefits
Post-retirement
benefits Total
2018 ....................................................................................................... $13.4 $1.5 $14.92019 ....................................................................................................... 27.0 1.4 28.42020 ....................................................................................................... 12.8 1.3 14.12021 ....................................................................................................... 13.3 1.3 14.62022 ....................................................................................................... 16.2 1.2 17.42023-2027.............................................................................................. 72.0 4.9 76.9
76
Note 14: Incentive Compensation Plans
On May 24, 2016, the shareholders of the Company approved the adoption of the Tupperware Brands Corporation2016 Incentive Plan (the “2016 Incentive Plan”). The 2016 Incentive Plan provides for the issuance of cash and stock-based incentive awards to employees, directors and certain non-employee participants. Stock-based awards may be inthe form of stock options, restricted stock, restricted stock units, performance vesting and market vesting awards. Underthe plan, awards that are canceled or expire are added back to the pool of available shares. When the 2016 IncentivePlan was approved, the number of shares of the Company's common stock available for stock-based awards under theplan totaled 3,500,000, plus remaining shares available for issuance under the Tupperware Brands Corporation 2010Incentive Plan, the Tupperware Brands Corporation 2006 Incentive Plan and the Tupperware Brands CorporationDirector Stock Plan. Shares may no longer be granted under the plans adopted before 2016. The total number of sharesavailable for grant under the 2016 Incentive Plan as of December 30, 2017 was 2,979,087.
Under the 2016 Incentive Plan, non-employee directors receive approximately one-half of their annual retainersin the form of stock and may elect to receive the balance of their annual retainers in the form of stock or cash. Inaddition, each non-employee director is eligible to receive a stock award in such form, at such time and in such amountas may be determined by the Nominating and Governance Committee of the Board of Directors.
Stock Options
Stock options to purchase the Company's common stock are granted to employees and directors, upon approvalby the Company's Board of Directors, with an exercise price equal to the fair market value of the stock on the date ofgrant. Options generally become exercisable in three years, in equal installments beginning one year from the date ofgrant, and generally expire 10 years from the date of grant. The fair value of the Company's stock options is estimatedon the date of grant using the Black-Scholes option-pricing model with the following weighted average assumptionsused in the last three years:
2017 2016 2015
Dividend yield............................................................................................... 4.4% 4.7% 4.3%Expected volatility ........................................................................................ 29% 30% 36%Risk-free interest rate .................................................................................... 2.2% 2.1% 2.1%Expected life ................................................................................................. 7 years 7 years 7 years
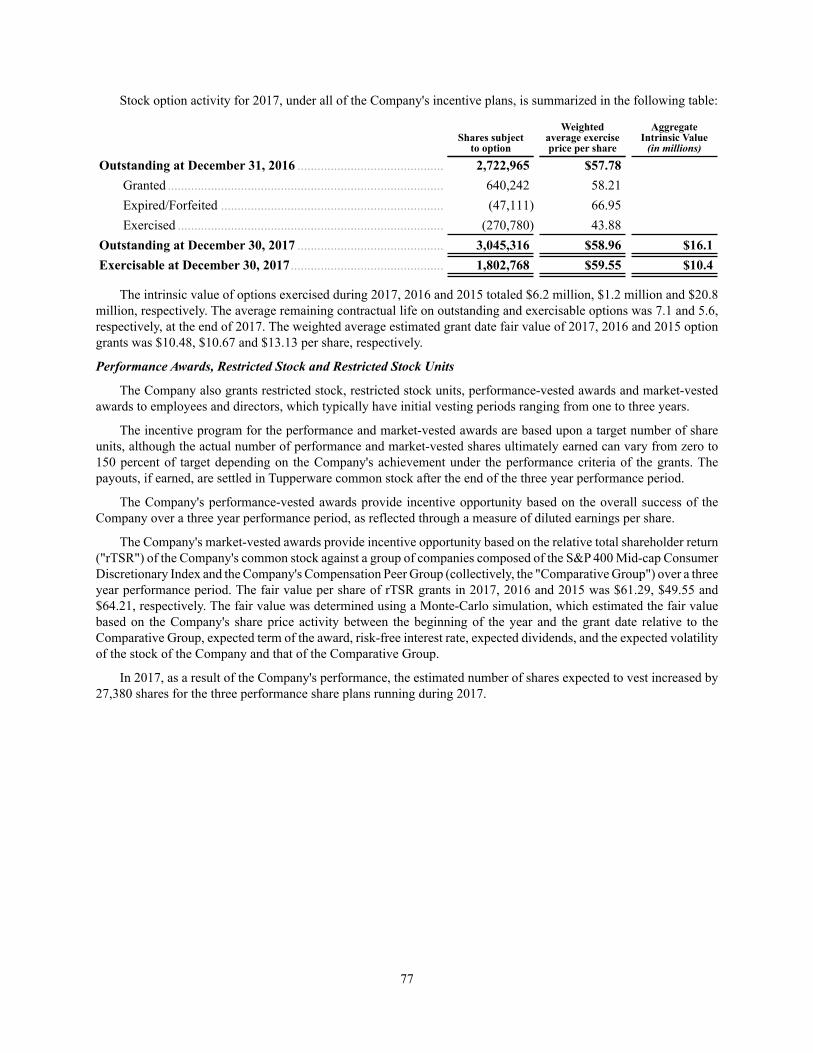
Stock option activity for 2017, under all of the Company's incentive plans, is summarized in the following table:
Shares subjectto option
Weightedaverage exerciseprice per share
AggregateIntrinsic Value
(in millions)
Outstanding at December 31, 2016 ............................................ 2,722,965 $57.78Granted ................................................................................... 640,242 58.21Expired/Forfeited ................................................................... (47,111) 66.95Exercised ................................................................................ (270,780) 43.88
Outstanding at December 30, 2017 ............................................ 3,045,316 $58.96 $16.1Exercisable at December 30, 2017 .............................................. 1,802,768 $59.55 $10.4
The intrinsic value of options exercised during 2017, 2016 and 2015 totaled $6.2 million, $1.2 million and $20.8million, respectively. The average remaining contractual life on outstanding and exercisable options was 7.1 and 5.6,respectively, at the end of 2017. The weighted average estimated grant date fair value of 2017, 2016 and 2015 optiongrants was $10.48, $10.67 and $13.13 per share, respectively.
Performance Awards, Restricted Stock and Restricted Stock Units
The Company also grants restricted stock, restricted stock units, performance-vested awards and market-vestedawards to employees and directors, which typically have initial vesting periods ranging from one to three years.
The incentive program for the performance and market-vested awards are based upon a target number of shareunits, although the actual number of performance and market-vested shares ultimately earned can vary from zero to150 percent of target depending on the Company's achievement under the performance criteria of the grants. Thepayouts, if earned, are settled in Tupperware common stock after the end of the three year performance period.
The Company's performance-vested awards provide incentive opportunity based on the overall success of theCompany over a three year performance period, as reflected through a measure of diluted earnings per share.
The Company's market-vested awards provide incentive opportunity based on the relative total shareholder return("rTSR") of the Company's common stock against a group of companies composed of the S&P 400 Mid-cap ConsumerDiscretionary Index and the Company's Compensation Peer Group (collectively, the "Comparative Group") over a threeyear performance period. The fair value per share of rTSR grants in 2017, 2016 and 2015 was $61.29, $49.55 and$64.21, respectively. The fair value was determined using a Monte-Carlo simulation, which estimated the fair valuebased on the Company's share price activity between the beginning of the year and the grant date relative to theComparative Group, expected term of the award, risk-free interest rate, expected dividends, and the expected volatilityof the stock of the Company and that of the Comparative Group.
In 2017, as a result of the Company's performance, the estimated number of shares expected to vest increased by27,380 shares for the three performance share plans running during 2017.
77
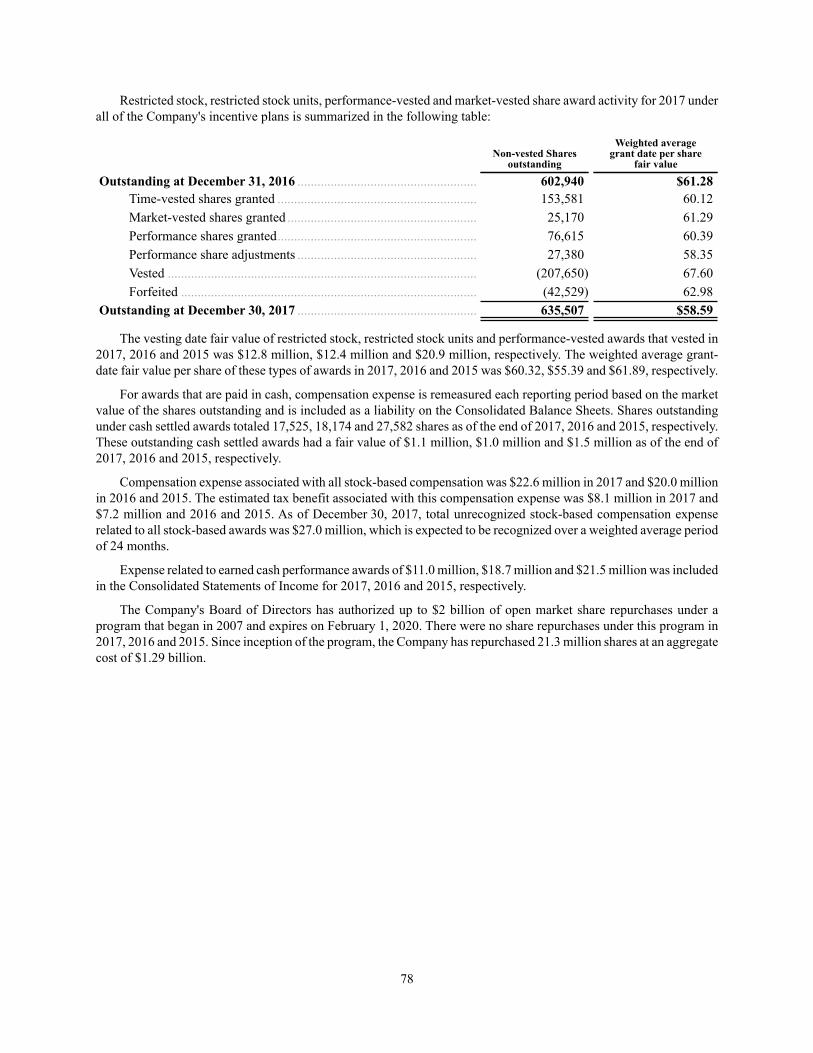
Restricted stock, restricted stock units, performance-vested and market-vested share award activity for 2017 underall of the Company's incentive plans is summarized in the following table:
Non-vested Sharesoutstanding
Weighted averagegrant date per share
fair value
Outstanding at December 31, 2016 ...................................................... 602,940 $61.28Time-vested shares granted ............................................................ 153,581 60.12Market-vested shares granted ......................................................... 25,170 61.29Performance shares granted............................................................ 76,615 60.39Performance share adjustments ...................................................... 27,380 58.35Vested ............................................................................................. (207,650) 67.60Forfeited ......................................................................................... (42,529) 62.98
Outstanding at December 30, 2017 ...................................................... 635,507 $58.59
The vesting date fair value of restricted stock, restricted stock units and performance-vested awards that vested in2017, 2016 and 2015 was $12.8 million, $12.4 million and $20.9 million, respectively. The weighted average grant-date fair value per share of these types of awards in 2017, 2016 and 2015 was $60.32, $55.39 and $61.89, respectively.
For awards that are paid in cash, compensation expense is remeasured each reporting period based on the marketvalue of the shares outstanding and is included as a liability on the Consolidated Balance Sheets. Shares outstandingunder cash settled awards totaled 17,525, 18,174 and 27,582 shares as of the end of 2017, 2016 and 2015, respectively.These outstanding cash settled awards had a fair value of $1.1 million, $1.0 million and $1.5 million as of the end of2017, 2016 and 2015, respectively.
Compensation expense associated with all stock-based compensation was $22.6 million in 2017 and $20.0 millionin 2016 and 2015. The estimated tax benefit associated with this compensation expense was $8.1 million in 2017 and$7.2 million and 2016 and 2015. As of December 30, 2017, total unrecognized stock-based compensation expenserelated to all stock-based awards was $27.0 million, which is expected to be recognized over a weighted average periodof 24 months.
Expense related to earned cash performance awards of $11.0 million, $18.7 million and $21.5 million was includedin the Consolidated Statements of Income for 2017, 2016 and 2015, respectively.
The Company's Board of Directors has authorized up to $2 billion of open market share repurchases under aprogram that began in 2007 and expires on February 1, 2020. There were no share repurchases under this program in2017, 2016 and 2015. Since inception of the program, the Company has repurchased 21.3 million shares at an aggregatecost of $1.29 billion.
78
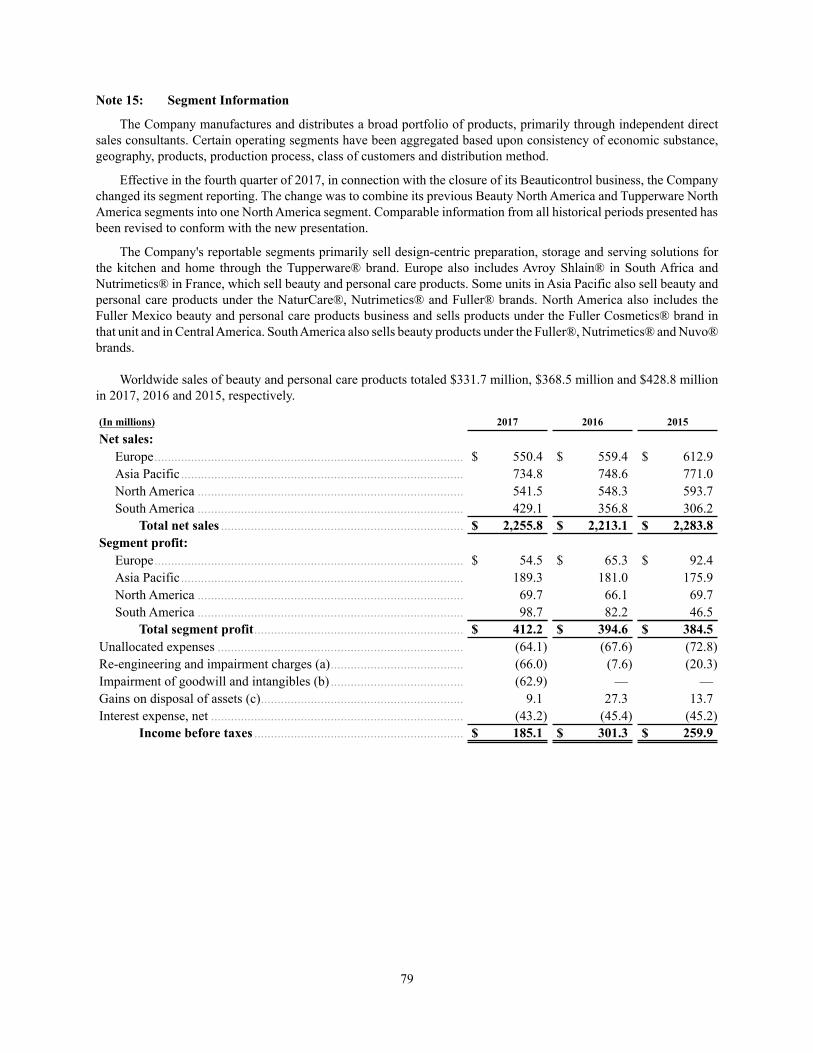
Note 15: Segment Information
The Company manufactures and distributes a broad portfolio of products, primarily through independent directsales consultants. Certain operating segments have been aggregated based upon consistency of economic substance,geography, products, production process, class of customers and distribution method.
Effective in the fourth quarter of 2017, in connection with the closure of its Beauticontrol business, the Companychanged its segment reporting. The change was to combine its previous Beauty North America and Tupperware NorthAmerica segments into one North America segment. Comparable information from all historical periods presented hasbeen revised to conform with the new presentation.
The Company's reportable segments primarily sell design-centric preparation, storage and serving solutions forthe kitchen and home through the Tupperware® brand. Europe also includes Avroy Shlain® in South Africa andNutrimetics® in France, which sell beauty and personal care products. Some units in Asia Pacific also sell beauty andpersonal care products under the NaturCare®, Nutrimetics® and Fuller® brands. North America also includes theFuller Mexico beauty and personal care products business and sells products under the Fuller Cosmetics® brand inthat unit and in Central America. South America also sells beauty products under the Fuller®, Nutrimetics® and Nuvo®brands.
Worldwide sales of beauty and personal care products totaled $331.7 million, $368.5 million and $428.8 millionin 2017, 2016 and 2015, respectively.
(In millions) 2017 2016 2015
Net sales:Europe............................................................................................. $ 550.4 $ 559.4 $ 612.9Asia Pacific..................................................................................... 734.8 748.6 771.0North America ................................................................................ 541.5 548.3 593.7South America ................................................................................ 429.1 356.8 306.2
Total net sales ......................................................................... $ 2,255.8 $ 2,213.1 $ 2,283.8Segment profit:
Europe............................................................................................. $ 54.5 $ 65.3 $ 92.4Asia Pacific..................................................................................... 189.3 181.0 175.9North America ................................................................................ 69.7 66.1 69.7South America ................................................................................ 98.7 82.2 46.5
Total segment profit............................................................... $ 412.2 $ 394.6 $ 384.5Unallocated expenses .......................................................................... (64.1) (67.6) (72.8)Re-engineering and impairment charges (a)........................................ (66.0) (7.6) (20.3)Impairment of goodwill and intangibles (b) ........................................ (62.9) — —Gains on disposal of assets (c)............................................................. 9.1 27.3 13.7Interest expense, net ............................................................................ (43.2) (45.4) (45.2)
Income before taxes ............................................................... $ 185.1 $ 301.3 $ 259.9
79
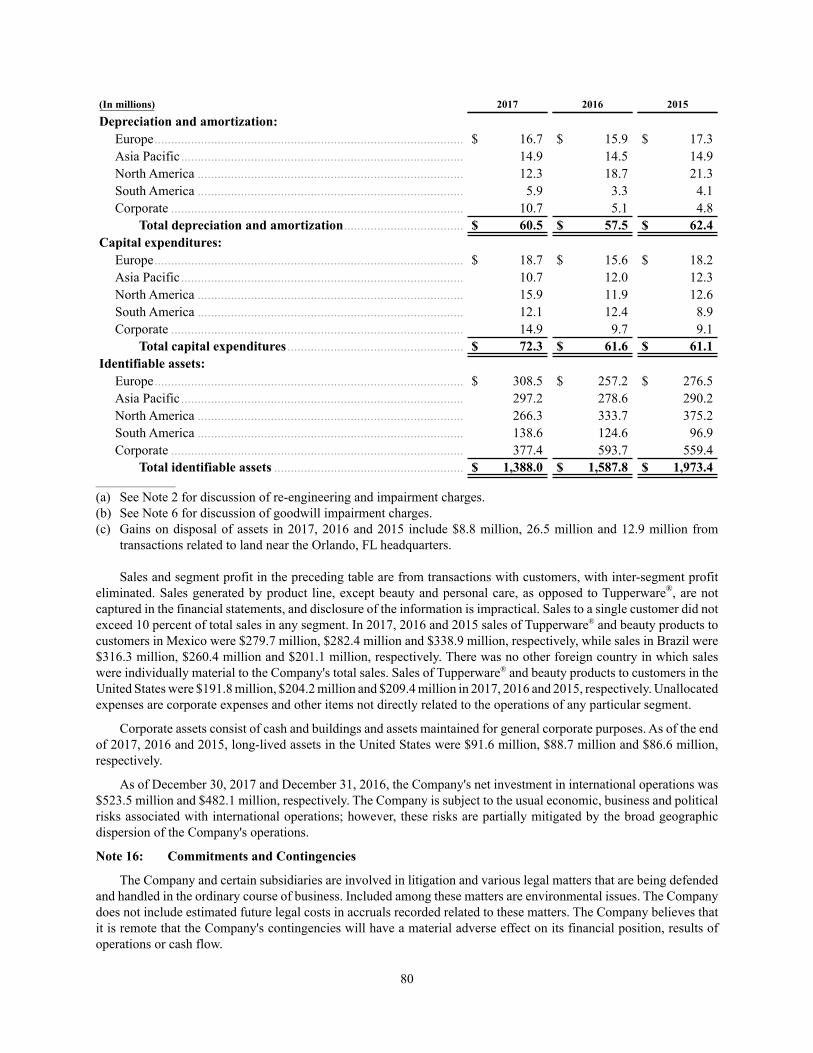
(In millions) 2017 2016 2015
Depreciation and amortization:Europe............................................................................................. $ 16.7 $ 15.9 $ 17.3Asia Pacific..................................................................................... 14.9 14.5 14.9North America ................................................................................ 12.3 18.7 21.3South America ................................................................................ 5.9 3.3 4.1Corporate ........................................................................................ 10.7 5.1 4.8
Total depreciation and amortization.................................... $ 60.5 $ 57.5 $ 62.4Capital expenditures:
Europe............................................................................................. $ 18.7 $ 15.6 $ 18.2Asia Pacific..................................................................................... 10.7 12.0 12.3North America ................................................................................ 15.9 11.9 12.6South America ................................................................................ 12.1 12.4 8.9Corporate ........................................................................................ 14.9 9.7 9.1
Total capital expenditures ..................................................... $ 72.3 $ 61.6 $ 61.1Identifiable assets:
Europe............................................................................................. $ 308.5 $ 257.2 $ 276.5Asia Pacific..................................................................................... 297.2 278.6 290.2North America ................................................................................ 266.3 333.7 375.2South America ................................................................................ 138.6 124.6 96.9Corporate ........................................................................................ 377.4 593.7 559.4
Total identifiable assets ......................................................... $ 1,388.0 $ 1,587.8 $ 1,973.4____________________
(a) See Note 2 for discussion of re-engineering and impairment charges.(b) See Note 6 for discussion of goodwill impairment charges. (c) Gains on disposal of assets in 2017, 2016 and 2015 include $8.8 million, 26.5 million and 12.9 million from
transactions related to land near the Orlando, FL headquarters.
Sales and segment profit in the preceding table are from transactions with customers, with inter-segment profiteliminated. Sales generated by product line, except beauty and personal care, as opposed to Tupperware®, are notcaptured in the financial statements, and disclosure of the information is impractical. Sales to a single customer did notexceed 10 percent of total sales in any segment. In 2017, 2016 and 2015 sales of Tupperware® and beauty products tocustomers in Mexico were $279.7 million, $282.4 million and $338.9 million, respectively, while sales in Brazil were$316.3 million, $260.4 million and $201.1 million, respectively. There was no other foreign country in which saleswere individually material to the Company's total sales. Sales of Tupperware® and beauty products to customers in theUnited States were $191.8 million, $204.2 million and $209.4 million in 2017, 2016 and 2015, respectively. Unallocatedexpenses are corporate expenses and other items not directly related to the operations of any particular segment.
Corporate assets consist of cash and buildings and assets maintained for general corporate purposes. As of the endof 2017, 2016 and 2015, long-lived assets in the United States were $91.6 million, $88.7 million and $86.6 million,respectively.
As of December 30, 2017 and December 31, 2016, the Company's net investment in international operations was$523.5 million and $482.1 million, respectively. The Company is subject to the usual economic, business and politicalrisks associated with international operations; however, these risks are partially mitigated by the broad geographicdispersion of the Company's operations.
80
Note 16: Commitments and Contingencies
The Company and certain subsidiaries are involved in litigation and various legal matters that are being defendedand handled in the ordinary course of business. Included among these matters are environmental issues. The Companydoes not include estimated future legal costs in accruals recorded related to these matters. The Company believes thatit is remote that the Company's contingencies will have a material adverse effect on its financial position, results ofoperations or cash flow.
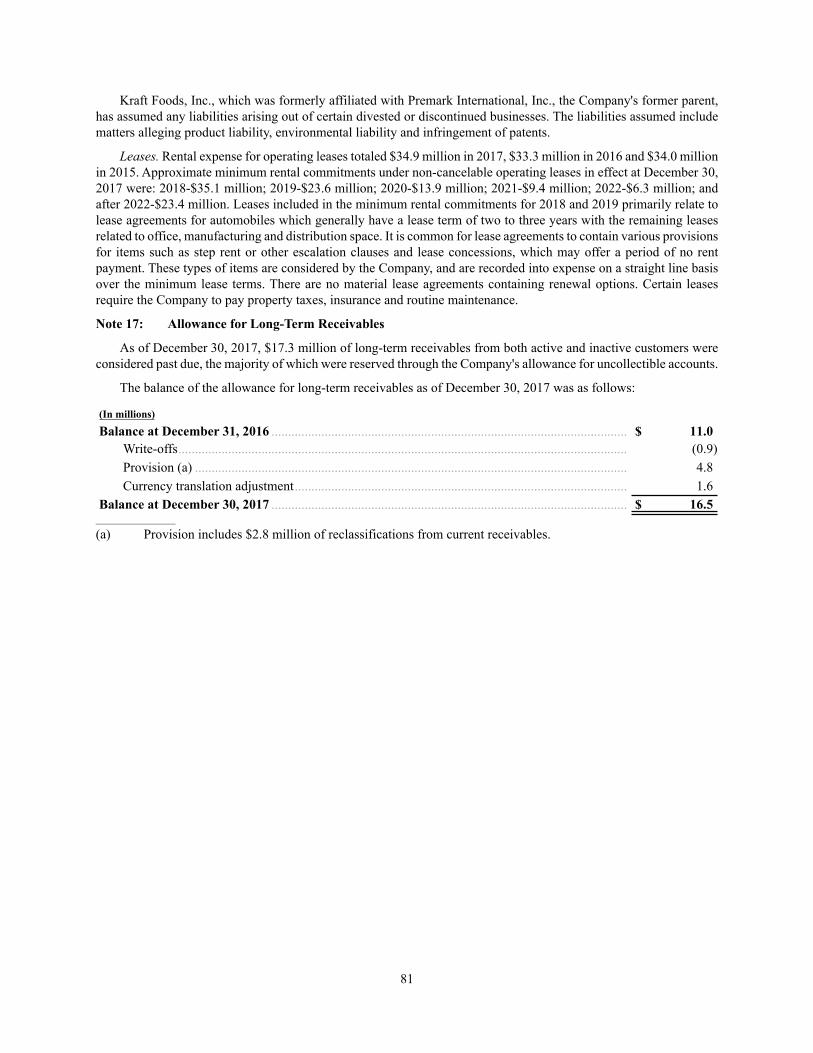
Kraft Foods, Inc., which was formerly affiliated with Premark International, Inc., the Company's former parent,has assumed any liabilities arising out of certain divested or discontinued businesses. The liabilities assumed includematters alleging product liability, environmental liability and infringement of patents.
Leases. Rental expense for operating leases totaled $34.9 million in 2017, $33.3 million in 2016 and $34.0 millionin 2015. Approximate minimum rental commitments under non-cancelable operating leases in effect at December 30,2017 were: 2018-$35.1 million; 2019-$23.6 million; 2020-$13.9 million; 2021-$9.4 million; 2022-$6.3 million; andafter 2022-$23.4 million. Leases included in the minimum rental commitments for 2018 and 2019 primarily relate tolease agreements for automobiles which generally have a lease term of two to three years with the remaining leasesrelated to office, manufacturing and distribution space. It is common for lease agreements to contain various provisionsfor items such as step rent or other escalation clauses and lease concessions, which may offer a period of no rentpayment. These types of items are considered by the Company, and are recorded into expense on a straight line basisover the minimum lease terms. There are no material lease agreements containing renewal options. Certain leasesrequire the Company to pay property taxes, insurance and routine maintenance.
81
Note 17: Allowance for Long-Term Receivables
As of December 30, 2017, $17.3 million of long-term receivables from both active and inactive customers wereconsidered past due, the majority of which were reserved through the Company's allowance for uncollectible accounts.
The balance of the allowance for long-term receivables as of December 30, 2017 was as follows:
(In millions)
Balance at December 31, 2016 ........................................................................................................... $ 11.0Write-offs....................................................................................................................................... (0.9)Provision (a) .................................................................................................................................. 4.8Currency translation adjustment.................................................................................................... 1.6
Balance at December 30, 2017 ........................................................................................................... $ 16.5____________________
(a) Provision includes $2.8 million of reclassifications from current receivables.
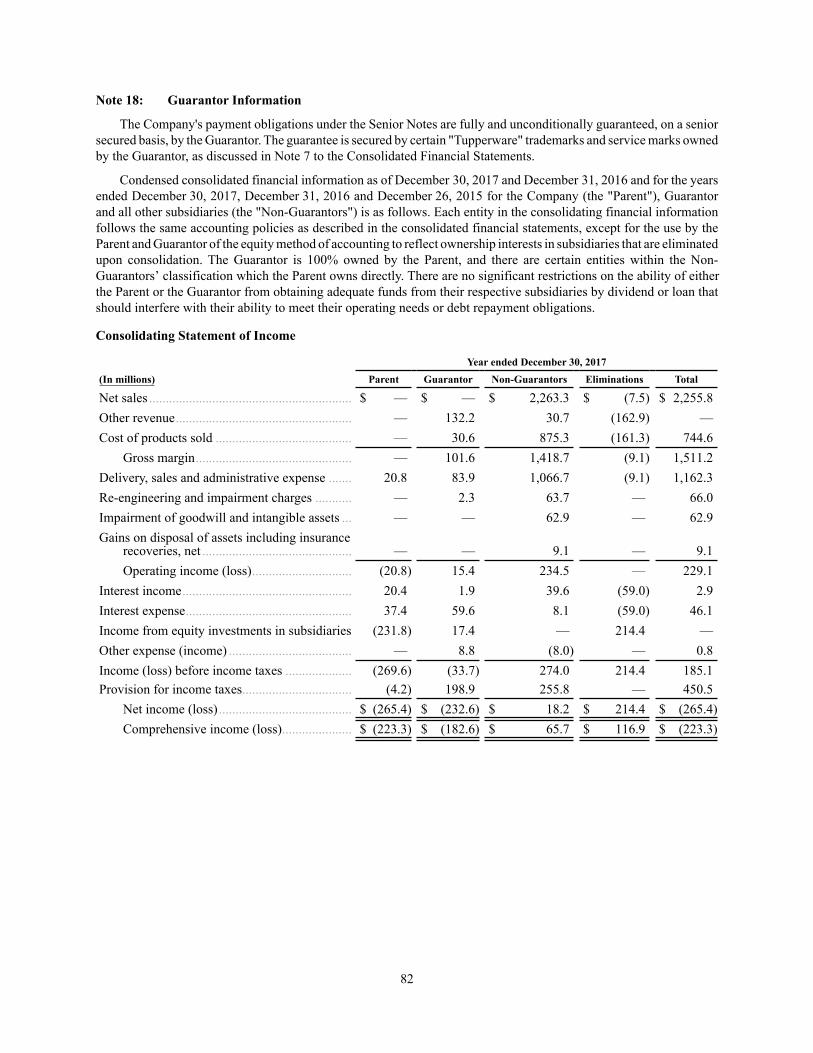
Note 18: Guarantor Information
The Company's payment obligations under the Senior Notes are fully and unconditionally guaranteed, on a seniorsecured basis, by the Guarantor. The guarantee is secured by certain "Tupperware" trademarks and service marks ownedby the Guarantor, as discussed in Note 7 to the Consolidated Financial Statements.
Condensed consolidated financial information as of December 30, 2017 and December 31, 2016 and for the yearsended December 30, 2017, December 31, 2016 and December 26, 2015 for the Company (the "Parent"), Guarantorand all other subsidiaries (the "Non-Guarantors") is as follows. Each entity in the consolidating financial informationfollows the same accounting policies as described in the consolidated financial statements, except for the use by theParent and Guarantor of the equity method of accounting to reflect ownership interests in subsidiaries that are eliminatedupon consolidation. The Guarantor is 100% owned by the Parent, and there are certain entities within the Non-Guarantors’ classification which the Parent owns directly. There are no significant restrictions on the ability of eitherthe Parent or the Guarantor from obtaining adequate funds from their respective subsidiaries by dividend or loan thatshould interfere with their ability to meet their operating needs or debt repayment obligations.
Consolidating Statement of Income
Year ended December 30, 2017(In millions) Parent Guarantor Non-Guarantors Eliminations Total
Net sales ............................................................. $ — $ — $ 2,263.3 $ (7.5) $ 2,255.8Other revenue..................................................... — 132.2 30.7 (162.9) —Cost of products sold ......................................... — 30.6 875.3 (161.3) 744.6
Gross margin............................................... — 101.6 1,418.7 (9.1) 1,511.2Delivery, sales and administrative expense ....... 20.8 83.9 1,066.7 (9.1) 1,162.3Re-engineering and impairment charges ........... — 2.3 63.7 — 66.0Impairment of goodwill and intangible assets ... — — 62.9 — 62.9Gains on disposal of assets including insurance
recoveries, net ............................................. — — 9.1 — 9.1Operating income (loss).............................. (20.8) 15.4 234.5 — 229.1
Interest income................................................... 20.4 1.9 39.6 (59.0) 2.9Interest expense.................................................. 37.4 59.6 8.1 (59.0) 46.1Income from equity investments in subsidiaries (231.8) 17.4 — 214.4 —Other expense (income) ..................................... — 8.8 (8.0) — 0.8Income (loss) before income taxes .................... (269.6) (33.7) 274.0 214.4 185.1Provision for income taxes................................. (4.2) 198.9 255.8 — 450.5
Net income (loss)........................................ $ (265.4) $ (232.6) $ 18.2 $ 214.4 $ (265.4)Comprehensive income (loss)..................... $ (223.3) $ (182.6) $ 65.7 $ 116.9 $ (223.3)
82
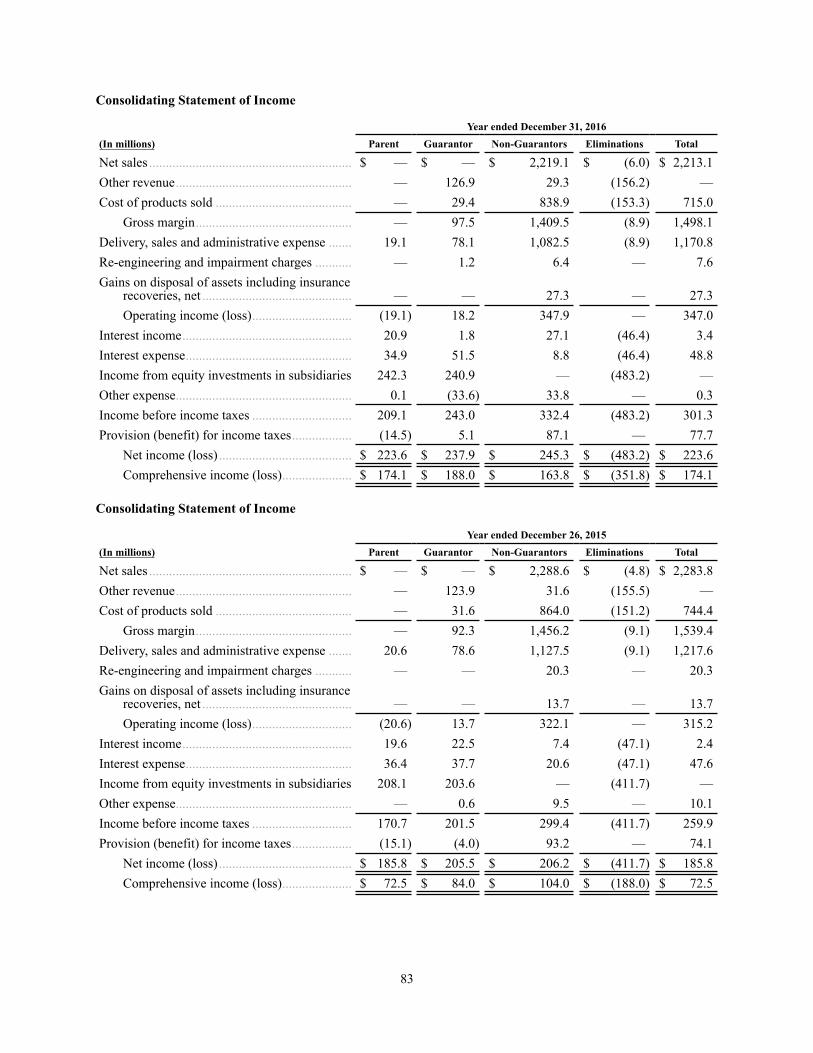
Consolidating Statement of Income
Year ended December 31, 2016(In millions) Parent Guarantor Non-Guarantors Eliminations Total
Net sales ............................................................. $ — $ — $ 2,219.1 $ (6.0) $ 2,213.1Other revenue..................................................... — 126.9 29.3 (156.2) —Cost of products sold ......................................... — 29.4 838.9 (153.3) 715.0
Gross margin............................................... — 97.5 1,409.5 (8.9) 1,498.1Delivery, sales and administrative expense ....... 19.1 78.1 1,082.5 (8.9) 1,170.8Re-engineering and impairment charges ........... — 1.2 6.4 — 7.6Gains on disposal of assets including insurance
recoveries, net ............................................. — — 27.3 — 27.3Operating income (loss).............................. (19.1) 18.2 347.9 — 347.0
Interest income................................................... 20.9 1.8 27.1 (46.4) 3.4Interest expense.................................................. 34.9 51.5 8.8 (46.4) 48.8Income from equity investments in subsidiaries 242.3 240.9 — (483.2) —Other expense..................................................... 0.1 (33.6) 33.8 — 0.3Income before income taxes .............................. 209.1 243.0 332.4 (483.2) 301.3Provision (benefit) for income taxes.................. (14.5) 5.1 87.1 — 77.7
Net income (loss)........................................ $ 223.6 $ 237.9 $ 245.3 $ (483.2) $ 223.6Comprehensive income (loss)..................... $ 174.1 $ 188.0 $ 163.8 $ (351.8) $ 174.1
Consolidating Statement of Income
Year ended December 26, 2015(In millions) Parent Guarantor Non-Guarantors Eliminations Total
Net sales ............................................................. $ — $ — $ 2,288.6 $ (4.8) $ 2,283.8Other revenue..................................................... — 123.9 31.6 (155.5) —Cost of products sold ......................................... — 31.6 864.0 (151.2) 744.4
Gross margin............................................... — 92.3 1,456.2 (9.1) 1,539.4Delivery, sales and administrative expense ....... 20.6 78.6 1,127.5 (9.1) 1,217.6Re-engineering and impairment charges ........... — — 20.3 — 20.3Gains on disposal of assets including insurance
recoveries, net ............................................. — — 13.7 — 13.7Operating income (loss).............................. (20.6) 13.7 322.1 — 315.2
Interest income................................................... 19.6 22.5 7.4 (47.1) 2.4Interest expense.................................................. 36.4 37.7 20.6 (47.1) 47.6Income from equity investments in subsidiaries 208.1 203.6 — (411.7) —Other expense..................................................... — 0.6 9.5 — 10.1Income before income taxes .............................. 170.7 201.5 299.4 (411.7) 259.9Provision (benefit) for income taxes.................. (15.1) (4.0) 93.2 — 74.1
Net income (loss)........................................ $ 185.8 $ 205.5 $ 206.2 $ (411.7) $ 185.8Comprehensive income (loss)..................... $ 72.5 $ 84.0 $ 104.0 $ (188.0) $ 72.5
83
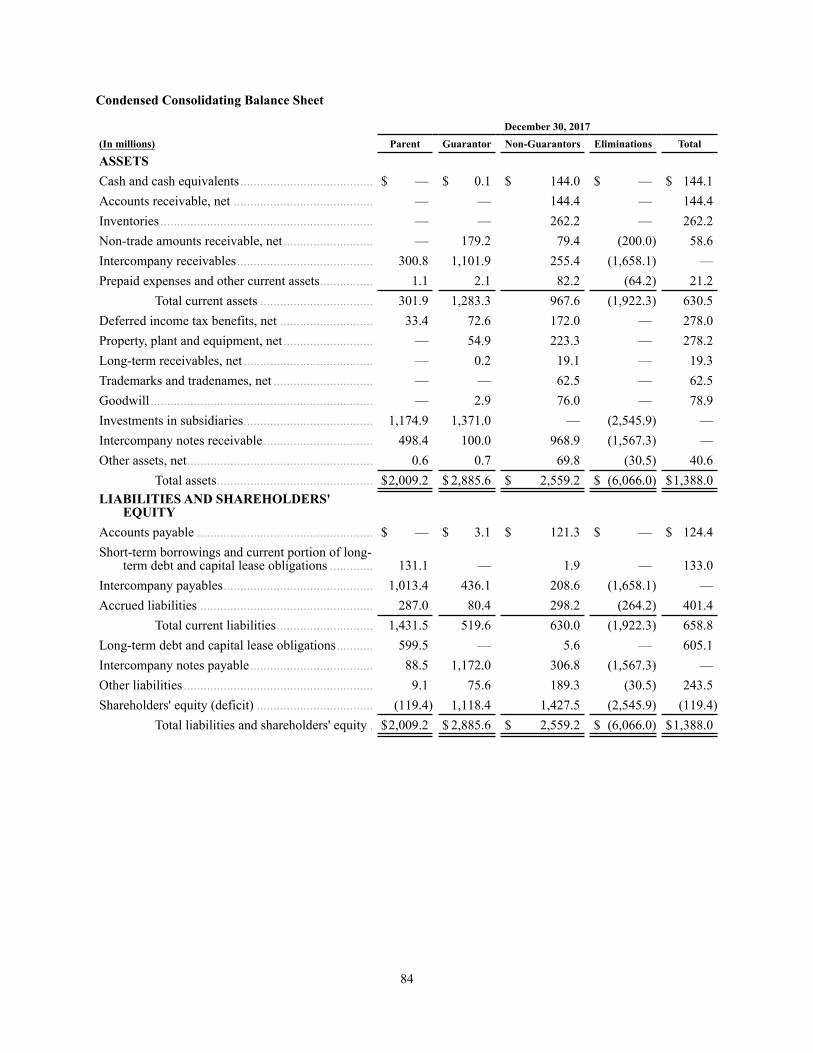
Condensed Consolidating Balance Sheet
December 30, 2017(In millions) Parent Guarantor Non-Guarantors Eliminations Total
ASSETSCash and cash equivalents........................................ $ — $ 0.1 $ 144.0 $ — $ 144.1Accounts receivable, net .......................................... — — 144.4 — 144.4Inventories ................................................................ — — 262.2 — 262.2Non-trade amounts receivable, net........................... — 179.2 79.4 (200.0) 58.6Intercompany receivables......................................... 300.8 1,101.9 255.4 (1,658.1) —Prepaid expenses and other current assets................ 1.1 2.1 82.2 (64.2) 21.2
Total current assets .................................. 301.9 1,283.3 967.6 (1,922.3) 630.5Deferred income tax benefits, net ............................ 33.4 72.6 172.0 — 278.0Property, plant and equipment, net........................... — 54.9 223.3 — 278.2Long-term receivables, net ....................................... — 0.2 19.1 — 19.3Trademarks and tradenames, net .............................. — — 62.5 — 62.5Goodwill................................................................... — 2.9 76.0 — 78.9Investments in subsidiaries....................................... 1,174.9 1,371.0 — (2,545.9) —Intercompany notes receivable................................. 498.4 100.0 968.9 (1,567.3) —Other assets, net........................................................ 0.6 0.7 69.8 (30.5) 40.6
Total assets............................................... $2,009.2 $ 2,885.6 $ 2,559.2 $ (6,066.0) $1,388.0LIABILITIES AND SHAREHOLDERS'
EQUITYAccounts payable ..................................................... $ — $ 3.1 $ 121.3 $ — $ 124.4Short-term borrowings and current portion of long-
term debt and capital lease obligations ............. 131.1 — 1.9 — 133.0Intercompany payables............................................. 1,013.4 436.1 208.6 (1,658.1) —Accrued liabilities .................................................... 287.0 80.4 298.2 (264.2) 401.4
Total current liabilities............................. 1,431.5 519.6 630.0 (1,922.3) 658.8Long-term debt and capital lease obligations........... 599.5 — 5.6 — 605.1Intercompany notes payable..................................... 88.5 1,172.0 306.8 (1,567.3) —Other liabilities ......................................................... 9.1 75.6 189.3 (30.5) 243.5Shareholders' equity (deficit) ................................... (119.4) 1,118.4 1,427.5 (2,545.9) (119.4)
Total liabilities and shareholders' equity . $2,009.2 $ 2,885.6 $ 2,559.2 $ (6,066.0) $1,388.0
84
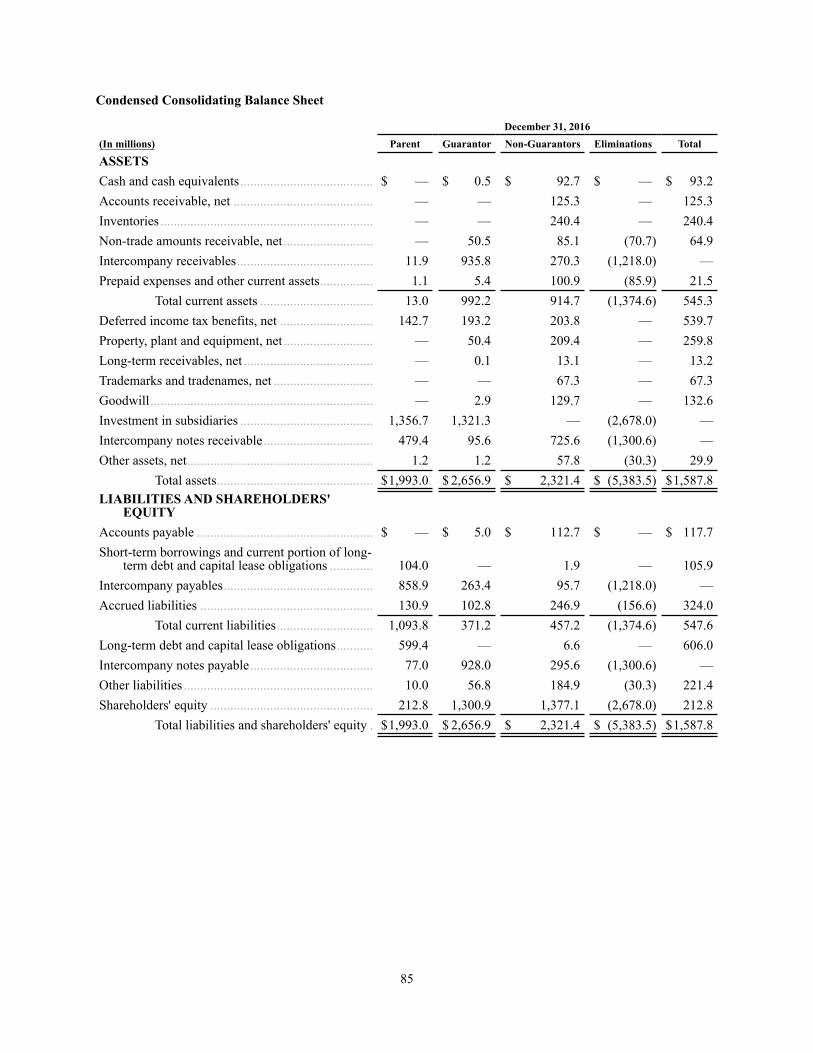
Condensed Consolidating Balance Sheet
December 31, 2016(In millions) Parent Guarantor Non-Guarantors Eliminations Total
ASSETSCash and cash equivalents........................................ $ — $ 0.5 $ 92.7 $ — $ 93.2Accounts receivable, net .......................................... — — 125.3 — 125.3Inventories ................................................................ — — 240.4 — 240.4Non-trade amounts receivable, net........................... — 50.5 85.1 (70.7) 64.9Intercompany receivables......................................... 11.9 935.8 270.3 (1,218.0) —Prepaid expenses and other current assets................ 1.1 5.4 100.9 (85.9) 21.5
Total current assets .................................. 13.0 992.2 914.7 (1,374.6) 545.3Deferred income tax benefits, net ............................ 142.7 193.2 203.8 — 539.7Property, plant and equipment, net........................... — 50.4 209.4 — 259.8Long-term receivables, net ....................................... — 0.1 13.1 — 13.2Trademarks and tradenames, net .............................. — — 67.3 — 67.3Goodwill................................................................... — 2.9 129.7 — 132.6Investment in subsidiaries ........................................ 1,356.7 1,321.3 — (2,678.0) —Intercompany notes receivable................................. 479.4 95.6 725.6 (1,300.6) —Other assets, net........................................................ 1.2 1.2 57.8 (30.3) 29.9
Total assets............................................... $1,993.0 $ 2,656.9 $ 2,321.4 $ (5,383.5) $1,587.8LIABILITIES AND SHAREHOLDERS'
EQUITYAccounts payable ..................................................... $ — $ 5.0 $ 112.7 $ — $ 117.7Short-term borrowings and current portion of long-
term debt and capital lease obligations ............. 104.0 — 1.9 — 105.9Intercompany payables............................................. 858.9 263.4 95.7 (1,218.0) —Accrued liabilities .................................................... 130.9 102.8 246.9 (156.6) 324.0
Total current liabilities............................. 1,093.8 371.2 457.2 (1,374.6) 547.6Long-term debt and capital lease obligations........... 599.4 — 6.6 — 606.0Intercompany notes payable..................................... 77.0 928.0 295.6 (1,300.6) —Other liabilities ......................................................... 10.0 56.8 184.9 (30.3) 221.4Shareholders' equity ................................................. 212.8 1,300.9 1,377.1 (2,678.0) 212.8
Total liabilities and shareholders' equity . $1,993.0 $ 2,656.9 $ 2,321.4 $ (5,383.5) $1,587.8
85
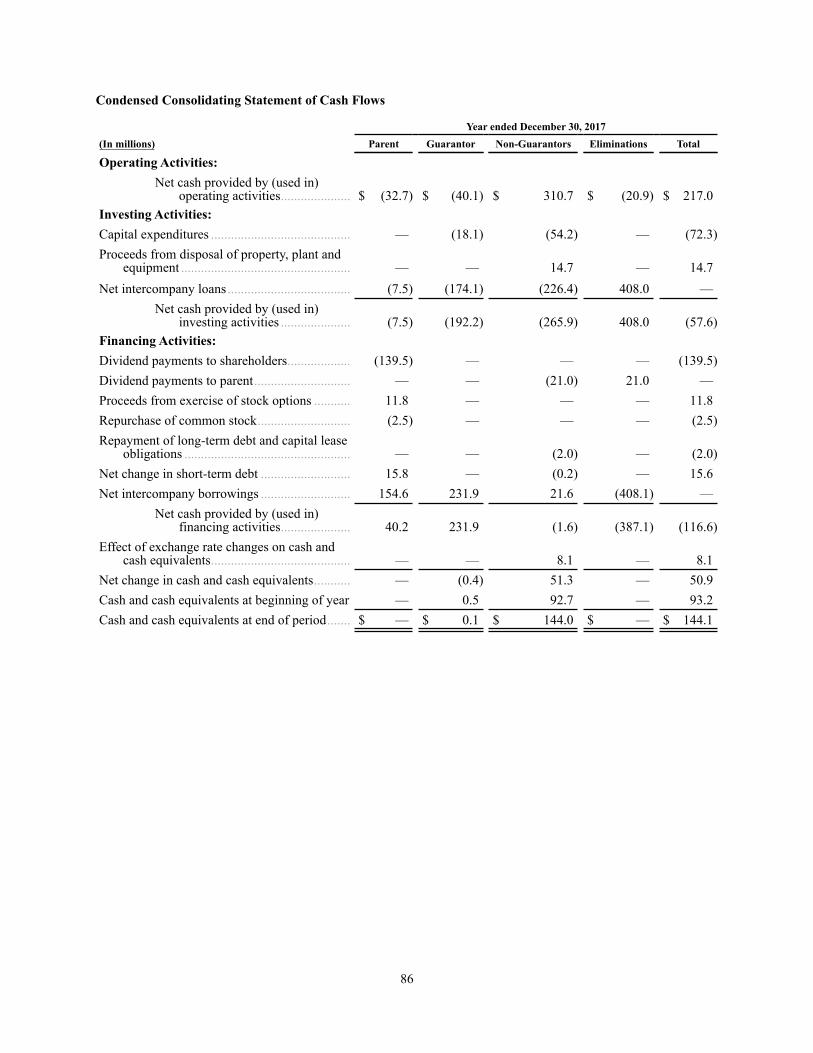
Condensed Consolidating Statement of Cash Flows
Year ended December 30, 2017(In millions) Parent Guarantor Non-Guarantors Eliminations Total
Operating Activities:Net cash provided by (used in)
operating activities..................... $ (32.7) $ (40.1) $ 310.7 $ (20.9) $ 217.0Investing Activities:Capital expenditures .......................................... — (18.1) (54.2) — (72.3)Proceeds from disposal of property, plant and
equipment ................................................... — — 14.7 — 14.7Net intercompany loans..................................... (7.5) (174.1) (226.4) 408.0 —
Net cash provided by (used in)investing activities ..................... (7.5) (192.2) (265.9) 408.0 (57.6)
Financing Activities:Dividend payments to shareholders................... (139.5) — — — (139.5)Dividend payments to parent............................. — — (21.0) 21.0 —Proceeds from exercise of stock options ........... 11.8 — — — 11.8Repurchase of common stock............................ (2.5) — — — (2.5)Repayment of long-term debt and capital lease
obligations .................................................. — — (2.0) — (2.0)Net change in short-term debt ........................... 15.8 — (0.2) — 15.6Net intercompany borrowings ........................... 154.6 231.9 21.6 (408.1) —
Net cash provided by (used in)financing activities..................... 40.2 231.9 (1.6) (387.1) (116.6)
Effect of exchange rate changes on cash andcash equivalents.......................................... — — 8.1 — 8.1
Net change in cash and cash equivalents........... — (0.4) 51.3 — 50.9Cash and cash equivalents at beginning of year — 0.5 92.7 — 93.2Cash and cash equivalents at end of period....... $ — $ 0.1 $ 144.0 $ — $ 144.1
86
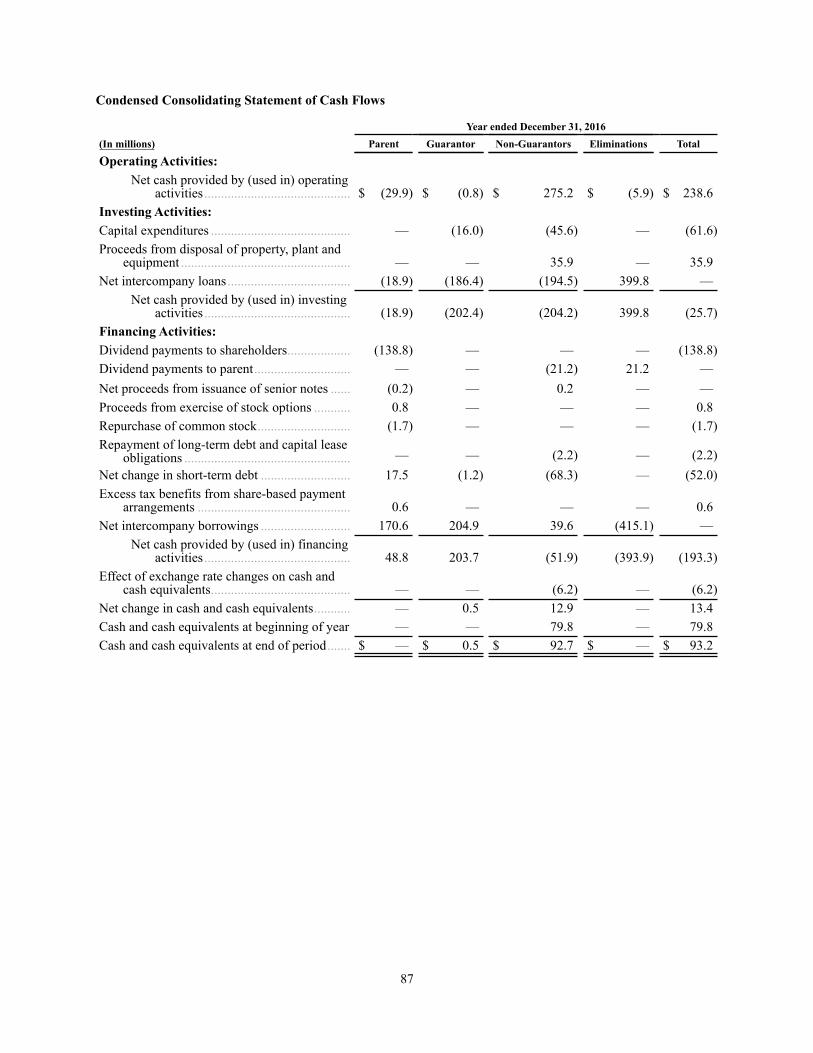
Condensed Consolidating Statement of Cash Flows
Year ended December 31, 2016(In millions) Parent Guarantor Non-Guarantors Eliminations Total
Operating Activities:Net cash provided by (used in) operating
activities............................................ $ (29.9) $ (0.8) $ 275.2 $ (5.9) $ 238.6Investing Activities:Capital expenditures .......................................... — (16.0) (45.6) — (61.6)Proceeds from disposal of property, plant and
equipment ................................................... — — 35.9 — 35.9Net intercompany loans..................................... (18.9) (186.4) (194.5) 399.8 —
Net cash provided by (used in) investingactivities............................................ (18.9) (202.4) (204.2) 399.8 (25.7)
Financing Activities:Dividend payments to shareholders................... (138.8) — — — (138.8)Dividend payments to parent............................. — — (21.2) 21.2 —Net proceeds from issuance of senior notes ...... (0.2) — 0.2 — —Proceeds from exercise of stock options ........... 0.8 — — — 0.8Repurchase of common stock............................ (1.7) — — — (1.7)Repayment of long-term debt and capital lease
obligations .................................................. — — (2.2) — (2.2)Net change in short-term debt ........................... 17.5 (1.2) (68.3) — (52.0)Excess tax benefits from share-based payment
arrangements .............................................. 0.6 — — — 0.6Net intercompany borrowings ........................... 170.6 204.9 39.6 (415.1) —
Net cash provided by (used in) financingactivities............................................ 48.8 203.7 (51.9) (393.9) (193.3)
Effect of exchange rate changes on cash andcash equivalents.......................................... — — (6.2) — (6.2)
Net change in cash and cash equivalents........... — 0.5 12.9 — 13.4Cash and cash equivalents at beginning of year — — 79.8 — 79.8Cash and cash equivalents at end of period....... $ — $ 0.5 $ 92.7 $ — $ 93.2
87
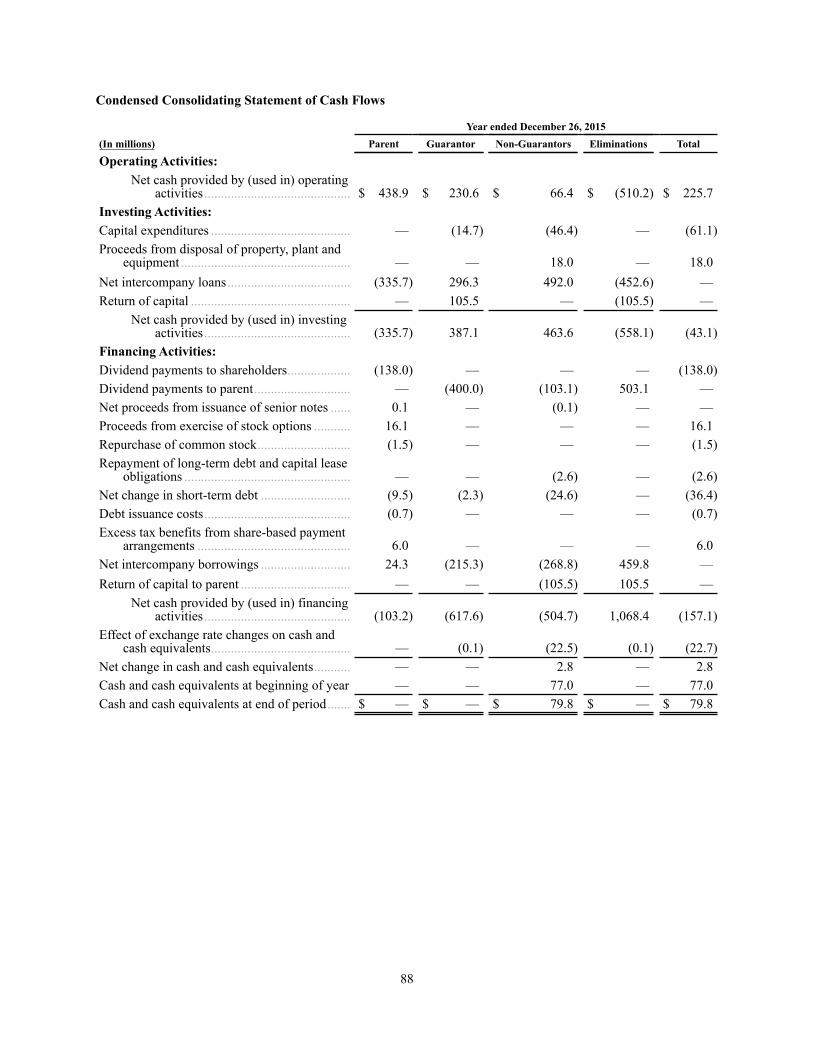
Condensed Consolidating Statement of Cash Flows
Year ended December 26, 2015(In millions) Parent Guarantor Non-Guarantors Eliminations Total
Operating Activities:Net cash provided by (used in) operating
activities............................................ $ 438.9 $ 230.6 $ 66.4 $ (510.2) $ 225.7Investing Activities:Capital expenditures .......................................... — (14.7) (46.4) — (61.1)Proceeds from disposal of property, plant and
equipment ................................................... — — 18.0 — 18.0Net intercompany loans..................................... (335.7) 296.3 492.0 (452.6) —Return of capital ................................................ — 105.5 — (105.5) —
Net cash provided by (used in) investingactivities............................................ (335.7) 387.1 463.6 (558.1) (43.1)
Financing Activities:Dividend payments to shareholders................... (138.0) — — — (138.0)Dividend payments to parent............................. — (400.0) (103.1) 503.1 —Net proceeds from issuance of senior notes ...... 0.1 — (0.1) — —Proceeds from exercise of stock options ........... 16.1 — — — 16.1Repurchase of common stock............................ (1.5) — — — (1.5)Repayment of long-term debt and capital lease
obligations .................................................. — — (2.6) — (2.6)Net change in short-term debt ........................... (9.5) (2.3) (24.6) — (36.4)Debt issuance costs............................................ (0.7) — — — (0.7)Excess tax benefits from share-based payment
arrangements .............................................. 6.0 — — — 6.0Net intercompany borrowings ........................... 24.3 (215.3) (268.8) 459.8 —Return of capital to parent ................................. — — (105.5) 105.5 —
Net cash provided by (used in) financingactivities............................................ (103.2) (617.6) (504.7) 1,068.4 (157.1)
Effect of exchange rate changes on cash andcash equivalents.......................................... — (0.1) (22.5) (0.1) (22.7)
Net change in cash and cash equivalents........... — — 2.8 — 2.8Cash and cash equivalents at beginning of year — — 77.0 — 77.0Cash and cash equivalents at end of period....... $ — $ — $ 79.8 $ — $ 79.8
88
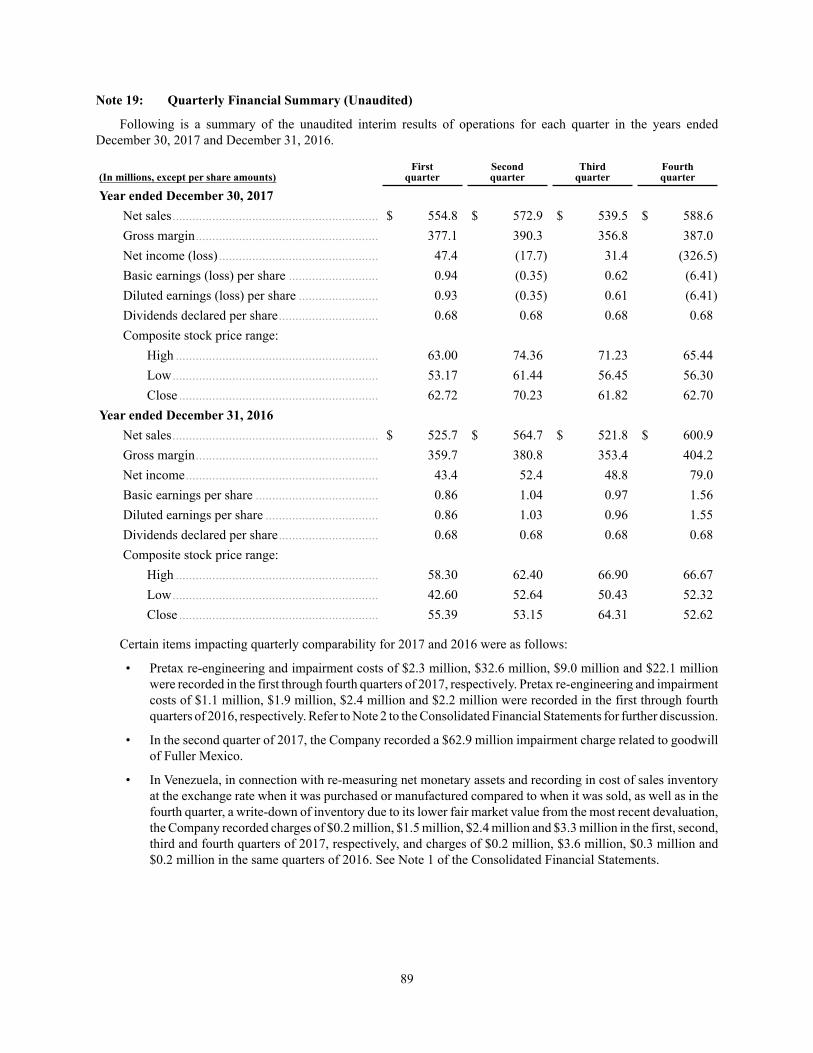
Note 19: Quarterly Financial Summary (Unaudited)
Following is a summary of the unaudited interim results of operations for each quarter in the years endedDecember 30, 2017 and December 31, 2016.
(In millions, except per share amounts)First
quarterSecondquarter
Thirdquarter
Fourthquarter
Year ended December 30, 2017Net sales.............................................................. $ 554.8 $ 572.9 $ 539.5 $ 588.6Gross margin....................................................... 377.1 390.3 356.8 387.0Net income (loss)................................................ 47.4 (17.7) 31.4 (326.5)Basic earnings (loss) per share ........................... 0.94 (0.35) 0.62 (6.41)Diluted earnings (loss) per share ........................ 0.93 (0.35) 0.61 (6.41)Dividends declared per share.............................. 0.68 0.68 0.68 0.68Composite stock price range:
High ............................................................. 63.00 74.36 71.23 65.44Low.............................................................. 53.17 61.44 56.45 56.30Close ............................................................ 62.72 70.23 61.82 62.70
Year ended December 31, 2016Net sales.............................................................. $ 525.7 $ 564.7 $ 521.8 $ 600.9Gross margin....................................................... 359.7 380.8 353.4 404.2Net income.......................................................... 43.4 52.4 48.8 79.0Basic earnings per share ..................................... 0.86 1.04 0.97 1.56Diluted earnings per share .................................. 0.86 1.03 0.96 1.55Dividends declared per share.............................. 0.68 0.68 0.68 0.68Composite stock price range:
High ............................................................. 58.30 62.40 66.90 66.67Low.............................................................. 42.60 52.64 50.43 52.32Close ............................................................ 55.39 53.15 64.31 52.62
Certain items impacting quarterly comparability for 2017 and 2016 were as follows:
• Pretax re-engineering and impairment costs of $2.3 million, $32.6 million, $9.0 million and $22.1 millionwere recorded in the first through fourth quarters of 2017, respectively. Pretax re-engineering and impairmentcosts of $1.1 million, $1.9 million, $2.4 million and $2.2 million were recorded in the first through fourthquarters of 2016, respectively. Refer to Note 2 to the Consolidated Financial Statements for further discussion.
• In the second quarter of 2017, the Company recorded a $62.9 million impairment charge related to goodwillof Fuller Mexico.
• In Venezuela, in connection with re-measuring net monetary assets and recording in cost of sales inventoryat the exchange rate when it was purchased or manufactured compared to when it was sold, as well as in thefourth quarter, a write-down of inventory due to its lower fair market value from the most recent devaluation,the Company recorded charges of $0.2 million, $1.5 million, $2.4 million and $3.3 million in the first, second,third and fourth quarters of 2017, respectively, and charges of $0.2 million, $3.6 million, $0.3 million and$0.2 million in the same quarters of 2016. See Note 1 of the Consolidated Financial Statements.
89
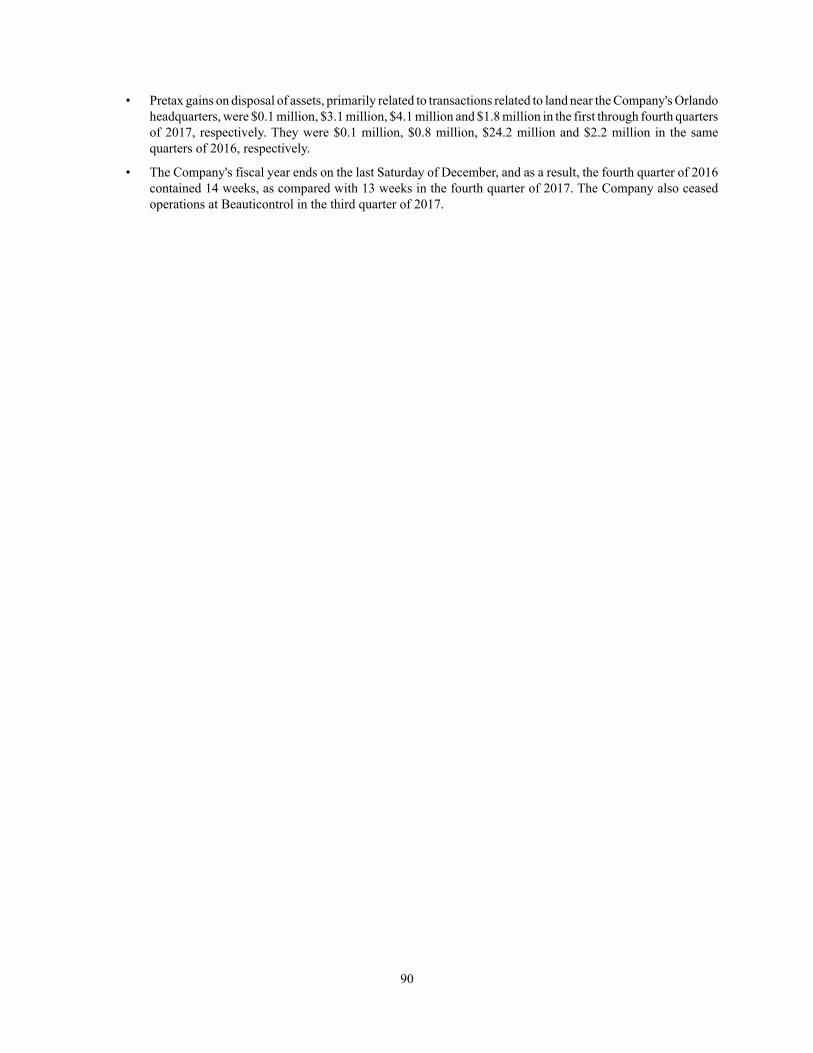
• Pretax gains on disposal of assets, primarily related to transactions related to land near the Company's Orlandoheadquarters, were $0.1 million, $3.1 million, $4.1 million and $1.8 million in the first through fourth quartersof 2017, respectively. They were $0.1 million, $0.8 million, $24.2 million and $2.2 million in the samequarters of 2016, respectively.
• The Company's fiscal year ends on the last Saturday of December, and as a result, the fourth quarter of 2016contained 14 weeks, as compared with 13 weeks in the fourth quarter of 2017. The Company also ceasedoperations at Beauticontrol in the third quarter of 2017.
90
Report of Independent Registered Public Accounting Firm
To the Board of Directors and Shareholders of Tupperware Brands Corporation
Opinions on the Financial Statements and Internal Control over Financial Reporting
We have audited the accompanying consolidated balance sheets of Tupperware Brands Corporation and itssubsidiaries as of December 30, 2017 and December 31, 2016 and the related consolidated statements of income,comprehensive income, shareholders’ equity and cash flow for each of the three years in the period ended December 30,2017, including the related notes and schedule of valuation and qualifying accounts for each of the three years in theperiod ended December 30, 2017 appearing on page 98 (collectively referred to as the “consolidated financialstatements”). We also have audited the Company's internal control over financial reporting as of December 30, 2017,based on criteria established in Internal Control - Integrated Framework (2013) issued by the Committee of SponsoringOrganizations of the Treadway Commission (COSO).
In our opinion, the consolidated financial statements referred to above present fairly, in all material respects, thefinancial position of the Company as of December 30, 2017 and December 31, 2016, and the results of their operationsand their cash flows for each of the three years in the period ended December 30, 2017 in conformity with accountingprinciples generally accepted in the United States of America. Also in our opinion, the Company maintained, in allmaterial respects, effective internal control over financial reporting as of December 30, 2017, based on criteriaestablished in Internal Control - Integrated Framework (2013) issued by the COSO.
Basis for Opinions
The Company's management is responsible for these consolidated financial statements, for maintaining effectiveinternal control over financial reporting, and for its assessment of the effectiveness of internal control over financialreporting, included in Management's Report on Internal Control over Financial Reporting appearing under Item 9A.Our responsibility is to express opinions on the Company’s consolidated financial statements and on the Company'sinternal control over financial reporting based on our audits. We are a public accounting firm registered with the PublicCompany Accounting Oversight Board (United States) ("PCAOB") and are required to be independent with respect tothe Company in accordance with the U.S. federal securities laws and the applicable rules and regulations of the Securitiesand Exchange Commission and the PCAOB.
We conducted our audits in accordance with the standards of the PCAOB. Those standards require that we planand perform the audits to obtain reasonable assurance about whether the consolidated financial statements are free ofmaterial misstatement, whether due to error or fraud, and whether effective internal control over financial reportingwas maintained in all material respects.
Our audits of the consolidated financial statements included performing procedures to assess the risks of materialmisstatement of the consolidated financial statements, whether due to error or fraud, and performing procedures thatrespond to those risks. Such procedures included examining, on a test basis, evidence regarding the amounts anddisclosures in the consolidated financial statements. Our audits also included evaluating the accounting principles usedand significant estimates made by management, as well as evaluating the overall presentation of the consolidatedfinancial statements. Our audit of internal control over financial reporting included obtaining an understanding ofinternal control over financial reporting, assessing the risk that a material weakness exists, and testing and evaluatingthe design and operating effectiveness of internal control based on the assessed risk. Our audits also included performingsuch other procedures as we considered necessary in the circumstances. We believe that our audits provide a reasonablebasis for our opinions.
91
Definition and Limitations of Internal Control over Financial Reporting
A company’s internal control over financial reporting is a process designed to provide reasonable assuranceregarding the reliability of financial reporting and the preparation of financial statements for external purposes inaccordance with generally accepted accounting principles. A company’s internal control over financial reportingincludes those policies and procedures that (i) pertain to the maintenance of records that, in reasonable detail, accuratelyand fairly reflect the transactions and dispositions of the assets of the company; (ii) provide reasonable assurance thattransactions are recorded as necessary to permit preparation of financial statements in accordance with generallyaccepted accounting principles, and that receipts and expenditures of the company are being made only in accordancewith authorizations of management and directors of the company; and (iii) provide reasonable assurance regardingprevention or timely detection of unauthorized acquisition, use, or disposition of the company’s assets that could havea material effect on the financial statements.
Because of its inherent limitations, internal control over financial reporting may not prevent or detect misstatements.Also, projections of any evaluation of effectiveness to future periods are subject to the risk that controls may becomeinadequate because of changes in conditions, or that the degree of compliance with the policies or procedures maydeteriorate.
/s/ PricewaterhouseCoopers LLP
PricewaterhouseCoopers LLPCertified Public AccountantsOrlando, FloridaFebruary 27, 2018
We have served as the Company’s auditor since 1995.
92
Item 9. Changes in and Disagreements With Accountants on Accounting and Financial Disclosure.
None.
93
Item 9A. Controls and Procedures.
Evaluation of Disclosure Controls and Procedures
The Company maintains disclosure controls and procedures (as defined in Exchange Act Rules 13a-15(e) and 15(d)-15(e)) that are designed to ensure that information required to be disclosed in the Company's reports filed or submittedunder the Exchange Act is recorded, processed, summarized and reported within the time periods specified in theSecurities and Exchange Commission's rules and forms, and that such information is accumulated and communicatedto the Company's management, including the Chief Executive Officer and the Chief Financial Officer, as appropriateto allow timely decisions regarding required disclosure. In designing and evaluating the disclosure controls andprocedures, management recognized that controls and procedures, no matter how well designed and operated, canprovide only reasonable assurance of achieving the desired control objectives.
As of the end of the period covered by this report, management, under the supervision of the Company's ChiefExecutive Officer and Chief Financial Officer, evaluated the effectiveness of the design and operation of the Company'sdisclosure controls and procedures. Based upon that evaluation, the Chief Executive Officer and Chief Financial Officerconcluded that the disclosure controls and procedures were effective as of December 30, 2017.
Management's Report on Internal Control Over Financial Reporting
The Company's management is also responsible for establishing and maintaining adequate internal control overfinancial reporting as defined in Exchange Act Rule 13a-15(f). As of the end of the period covered by this report,management, under the supervision of the Company's Chief Executive Officer and Chief Financial Officer, evaluatedthe effectiveness of the Company's internal control over financial reporting based on the framework in Internal Control-Integrated Framework (2013) issued by the Committee of Sponsoring Organizations of the Treadway Commission.Based upon that evaluation, the Chief Executive Officer and Chief Financial Officer concluded that the Company'sinternal control over financial reporting was effective as of the end of the period covered by this report. The effectivenessof the Company's internal control over financial reporting as of December 30, 2017 has been audited byPricewaterhouseCoopers LLP, an independent registered certified public accounting firm, as stated in its report whichis included herein.
Changes in Internal Controls
There have been no significant changes in the Company's internal control over financial reporting during theCompany's fourth quarter that have materially affected or are reasonably likely to materially affect its internal controlover financial reporting, as defined in Rule 13a-15(f) promulgated under the Securities Exchange Act of 1934, asamended.
Item 9B. Other Information.
None.
PART III
94
Item 10. Directors, Executive Officers and Corporate Governance.
Certain information with regard to the directors of the Registrant as required by Item 401 of Regulation S-K is setforth under the sub-caption “Board of Directors” appearing under the caption “Election of Directors” in the ProxyStatement related to the 2018 Annual Meeting of Shareholders to be held on May 9, 2018 and is incorporated hereinby reference.
The information as to the executive officers of the Registrant is included in Part I, Item 1 of this Report under thecaption “Executive Officers of the Registrant” in reliance upon General Instruction G to Form 10-K and Instruction 3to Item 401(b) of Regulation S-K.
The section entitled “Section 16(a) Beneficial Ownership Reporting Compliance” appearing in the Registrant'sProxy Statement for the 2018 Annual Meeting of Shareholders to be held on May 9, 2018 sets forth certain informationas required by Item 405 of Regulation S-K and is incorporated herein by reference.
The section entitled “Corporate Governance” appearing in the Registrant's Proxy Statement for the 2018 AnnualMeeting of Shareholders to be held on May 9, 2018 sets forth certain information with respect to the Registrant's codeof conduct and ethics as required by Item 406 of Regulation S-K and is incorporated herein by reference.
There were no material changes to the procedures by which security holders may recommend nominees to theregistrant's board of directors during 2017, as set forth by Item 407(c)(3) of Regulation S-K.
The sections entitled “Corporate Governance” and “Board Committees” appearing in the Registrant's ProxyStatement for the 2018 Annual Meeting of Shareholders to be held on May 9, 2018 sets forth certain informationregarding the Audit, Finance and Corporate Responsibility Committee, including the members of the Committee andthe financial experts, as set forth by Item 407(d)(4) and (d)(5) of Regulation S-K and is incorporated herein by reference.
Item 11. Executive Compensation.
The information set forth under the caption “Compensation of Directors and Executive Officers” of the ProxyStatement relating to the 2018 Annual Meeting of Shareholders to be held on May 9, 2018, and the information in suchProxy Statement relating to executive officers' and directors' compensation is incorporated herein by reference.
The information set forth under the captions “Board Committees” and “Compensation and ManagementDevelopment Committee Report” of the Proxy Statement relating to the 2018 Annual Meeting of Shareholders to beheld on May 9, 2018 sets forth certain information as required by Item 407(e)(4) and Item 407(e)(5) of Regulation S-K and is incorporated herein by reference.
Item 12. Security Ownership of Certain Beneficial Owners and Management and Related StockholderMatters.
The information set forth under the captions “Security Ownership of Certain Beneficial Owners”, “SecurityOwnership of Management” and “Equity Compensation Plan Information” in the Proxy Statement relating to the 2018Annual Meeting of Shareholders to be held on May 9, 2018, is incorporated herein by reference.
Item 13. Certain Relationships and Related Transactions and Director Independence.
The information set forth under the captions “Transactions with Related Persons” and “Corporate Governance”appearing in the Registrant's Proxy Statement for the 2018 Annual Meeting of Shareholders to be held on May 9, 2018is incorporated herein by reference.
Item 14. Principal Accounting Fees and Services.
The information set forth under the captions “Audit Fees,” “Audit-Related Fees,” “Tax Fees,” “All Other Fees,”and “Approval of Services” in the Proxy Statement related to the 2018 Annual Meeting of Shareholders to be held onMay 9, 2018 is incorporated herein by reference.
PART IV
95
Item 15. Exhibits, Financial Statement Schedules.
(a) (1) List of Financial Statements
The following Consolidated Financial Statements of Tupperware Brands Corporation and Report of IndependentRegistered Public Accounting Firm are included in this Report under part II, Item 8:
Consolidated Statements of Income, Comprehensive Income, Shareholders' Equity and Cash Flows- Years ended December 30, 2017, December 31, 2016 and December 26, 2015;
Consolidated Balance Sheets - December 30, 2017 and December 31, 2016;
Notes to the Consolidated Financial Statements; and
Report of Independent Registered Certified Public Accounting Firm.
(a) (2) List of Financial Statement Schedules
The following Consolidated Financial Statement Schedule (numbered in accordance with Regulation S-X) ofTupperware Brands Corporation is included in this Report:
Schedule II-Valuation and Qualifying Accounts for each of the three years ended December 30, 2017.
All other schedules for which provision is made in the applicable accounting regulations of the Securities andExchange Commission (SEC or the Commission) are not required under the related instructions, are inapplicable orthe information called for therein is included elsewhere in the financial statements or related notes contained orincorporated by reference herein.
(a) (3) List of Exhibits: (numbered in accordance with Item 601 of Regulation S-K)
ExhibitNumber Description
*3.1 Restated Certificate of Incorporation of the Registrant (Attached as Exhibit 3.1 to Form 10-Q, filed withthe Commission on August 5, 2008 and incorporated herein by reference).
*3.2 Amended and Restated By-laws of the Registrant as amended August 28, 2008 (Attached as Exhibit 3.2to Form 8-K, filed with the Commission on August 28, 2008 and incorporated herein by reference).
*4 Indenture dated June 2, 2011 (Attached as Exhibit 4.1 to Form 8-K, filed with the Commission on June 7,2011 and incorporated herein by reference).
*10.1 2006 Incentive Plan as amended through January 26, 2009 (Attached as Exhibit 10.12 to Form 10-K,filed with the Commission on February 25, 2009 and incorporated herein by reference).
*10.2 Directors' Stock Plan as amended through January 26, 2009 (Attached as Exhibit 10.2 to Form 10-K,filed with the Commission on February 25, 2009 and incorporated herein by reference).
*10.3 2010 Incentive Plan (Attached as Exhibit 4.3 to Form S-8, filed with the Commission on November 3,2010 and incorporated herein by reference).
*10.4 2016 Incentive Plan (Attached as Exhibit 10.1 to Form 8-K, filed with the Commission on May 26, 2016and incorporated herein by reference).
*10.5 Amendment No. 1 to 2016 Incentive Plan (Attached as Exhibit 10.1 to Form 10-Q, filed with theCommission on August 01, 2017 and incorporated herein by reference).
*10.6 Forms of stock option, restricted stock and restricted stock unit agreements utilized with the Registrant'sofficers and directors under certain stock-based incentive plans (Attached as Exhibit 10.6 to Form 10-K,filed with the Commission on February 25, 2009 and incorporated herein by reference).
*10.7 2010 Incentive Plan Restricted Stock Agreement (Attached as Exhibit 4.4 to Form S-8, filed with theCommission on November 3, 2010 and incorporated herein by reference).
*10.8 2016 Incentive Plan Restricted Stock Unit Agreement (Attached as Exhibit 10.8 to Form 10-K, filed withthe Commission on February 28, 2017 and incorporated herein by reference).
*10.9 2016 Incentive Plan Non-Qualified Stock Option Grant Agreement (Attached as Exhibit 10.9 to Form 10-K, filed with the Commission on February 28, 2017 and incorporated herein by reference).
*10.10 Form of Change of Control Employment Agreement (Attached as Exhibit 10.3 for Form 10-K, filed withthe Commission on February 25, 2009 and incorporated herein by reference).
*10.11 Form of Change of Control Employment Agreement, amended May 24, 2017 - filed with this document.*10.12 Chief Executive Officer Severance Agreement between the Registrant and E.V. Goings amended and
restated effective February 17, 2010 (Attached as Exhibit 10.8 to Form 10-K, filed with the Commissionon February 23, 2010 and incorporated herein by reference).
96
ExhibitNumber Description
*10.13 Supplemental Executive Retirement Plan, amended and restated effective February 2, 2010 (Attached asExhibit 10.9 to Form 10-K, filed with the Commission on February 23, 2010 and incorporated herein byreference).
*10.14 Amendment to Supplemental Executive Retirement Plan, dated February 21, 2018 (Attached as Exhibit10.1 to Form 8-K, filed with the Commission on February 21, 2018 and incorporated herein by reference).
*10.15 Supplemental Plan, amended and restated effective January 1, 2009 (Attached as Exhibit 10.11 to Form10-K, filed with the Commission on February 25, 2009 and incorporated herein by reference).
*10.16 Securities and Asset Purchase Agreement between the Registrant and Sara Lee Corporation (now knownas Hillshire Brands Co.) dated as of August 10, 2005 (Attached as Exhibit 10.01 to Form 8-K/A, filedwith the Commission on August 15, 2005 and incorporated herein by reference).
*10.17 Credit Agreement, as amended through June 9, 2015 (Attached as Exhibit 10.1 to Form 10-Q and Exhibit10.2 to Form 10-Q, filed with the Commission on August 5, 2014 and as Exhibit 10.1 to Form 8-K asfiled with the Commission on June 12, 2015 and incorporated herein by reference).
21** Subsidiaries of Tupperware Brands Corporation as of February 27, 2018.23** Consent of Independent Registered Certified Public Accounting Firm.24** Powers of Attorney.31.1** Rule 13a-14(a)/15d-14(a) Certification of the Chief Executive Officer.31.2** Rule 13a-14(a)/15d-14(a) Certification of the Chief Financial Officer.32.1*** Certification Pursuant to Section 1350 of Chapter 63 of Title 18 of the United States Code by the Chief
Executive Officer.32.2*** Certification Pursuant to Section 1350 of Chapter 63 of Title 18 of the United States Code by the Chief
Financial Officer.101** The following financial statements from Tupperware Brands Corporation's Annual Report on Form 10-K
for the year ended December 30, 2017, formatted in XBRL (eXtensible Business Reporting Language):(i) Consolidated Statements of Income, (ii) Consolidated Statements of Comprehensive Income, (iii)Consolidated Balance Sheets, (iv) Consolidated Statements of Shareholders' Equity, (v) ConsolidatedStatements of Cash Flows, (vi) Notes to the Consolidated Financial Statements, tagged in detail, and (vii)Schedule II. Valuation and Qualifying Accounts.
* Management contract or compensatory plan or arrangement.** Filed herewith.*** Furnished herewith.
The Registrant agrees to furnish, upon request of the SEC, a copy of all constituent instruments defining therights of holders of long-term debt of the Registrant and its consolidated subsidiaries.
97
Item 16. Form 10-K Summary.
None.
98
TUPPERWARE BRANDS CORPORATION SCHEDULE II-VALUATION AND QUALIFYING ACCOUNTS
FOR THE THREE YEARS ENDED DECEMBER 30, 2017 (In millions)
Col. A Col. B Col. C Col. D Col. EAdditions
Balance atBeginningof Period
Charged toCosts andExpenses
Chargedto OtherAccounts Deductions
Balanceat End
of Period
Allowance for doubtful accounts, current and longterm:Year ended December 30, 2017................................ $ 44.9 $ 16.8 $ — $ (9.0) /F1 $ 55.9
3.2 /F2Year ended December 31, 2016................................ 45.2 11.1 — (9.0) /F1 44.9
(2.4) /F2Year ended December 26, 2015................................ 48.4 12.8 — (8.0) /F1 45.2
(8.0) /F2Valuation allowance for deferred tax assets:
Year ended December 30, 2017................................ $ 24.8 $ 209.8 $ — $ 0.9 /F2 $ 235.5Year ended December 31, 2016................................ 23.1 — — 1.8 /F2 24.8
(0.1) /F3Year ended December 26, 2015................................ 40.2 — — (7.1) /F2 23.1
(10.0) /F3____________________
F1 Represents write-offs, less recoveries. F2 Foreign currency translation adjustment.F3 Represents write-offs of net operating losses for which a valuation allowance was already recorded. See Note 12
to the consolidated financial statements for additional information.
SIGNATURES
Pursuant to the requirements of Section 13 or 15(d) of the Securities Exchange Act of 1934, the Registrant hasduly caused this Report to be signed on its behalf by the undersigned, thereunto duly authorized.
TUPPERWARE BRANDS CORPORATION(Registrant)
By: /S/ E.V. GOINGSE.V. Goings
Chairman and Chief Executive Officer
February 27, 2018
Pursuant to the requirements of the Securities Exchange Act of 1934, this Report has been signed below by thefollowing persons on behalf of the Registrant and in the capacities and on the date indicated.
Signature Title
/s/ E.V. GOINGS Chairman and Chief Executive Officer and Director(Principal Executive Officer)E.V. Goings
/s/ MICHAEL S. POTESHMAN Executive Vice President and Chief Financial Officer(Principal Financial Officer)Michael S. Poteshman
/s/ NICHOLAS K. POUCHER Senior Vice President and Controller (PrincipalAccounting Officer)Nicholas K. Poucher
* DirectorCatherine A. Bertini
* DirectorSusan M. Cameron
* DirectorKriss Cloninger III
* DirectorMeg Crofton
* DirectorAngel R. Martinez
* DirectorAntonio Monteiro de Castro
99
* DirectorDavid R. Parker
* DirectorRichard T. Riley
* DirectorJoyce M. Roche
* DirectorM. Anne Szostak
By: /s/ KAREN M. SHEEHANKaren M. Sheehan
Attorney-in-fact
February 27, 2018
100