Embed Size (px)
Citation preview
Commission on Government Forecastingand Accountability
MONTHLY BRIEFING AUGUST 2005
http://www.ilga.gov/commission/cgfa/cgfa_home.html
SENATE
Jeffrey Schoenberg, Co-Chairman Don Harmon
Christine Radogno Steven Rauschenberger
David Syverson Donne Trotter
HOUSE
Terry Parke, Co-Chairman Mark H. Beaubien, Jr.
Frank J. Mautino Robert Molaro Richard Myers Elaine Nekritz
EXECUTIVE DIRECTOR
Dan R. Long
DEPUTY DIRECTOR Trevor J. Clatfelter
INSIDE THIS ISSUE
PAGE 1 - ECONOMY: Soft Patch or Something Much Worse PAGE 3: Illinois Economic Indicators PAGE 3: Sales Tax Revenue from Motor Fuel PAGE 7: Update on the Streamlined Sales Tax Project PAGE 8: Revised FY 2006 Estimate PAGE 13 - REVENUE: Revenues Continue Mixed PAGE 15-18: Revenue Tables PAGE 19 - PENSIONS:
703 Stratton Ofc. Bldg. Springfield, IL 62706
ECONOMY: Soft Patch or Something Much Worse Edward H. Boss, Jr., Chief Economist
he pace of real economic activity for the second quarter of the year in a revised report at month’s end held basically
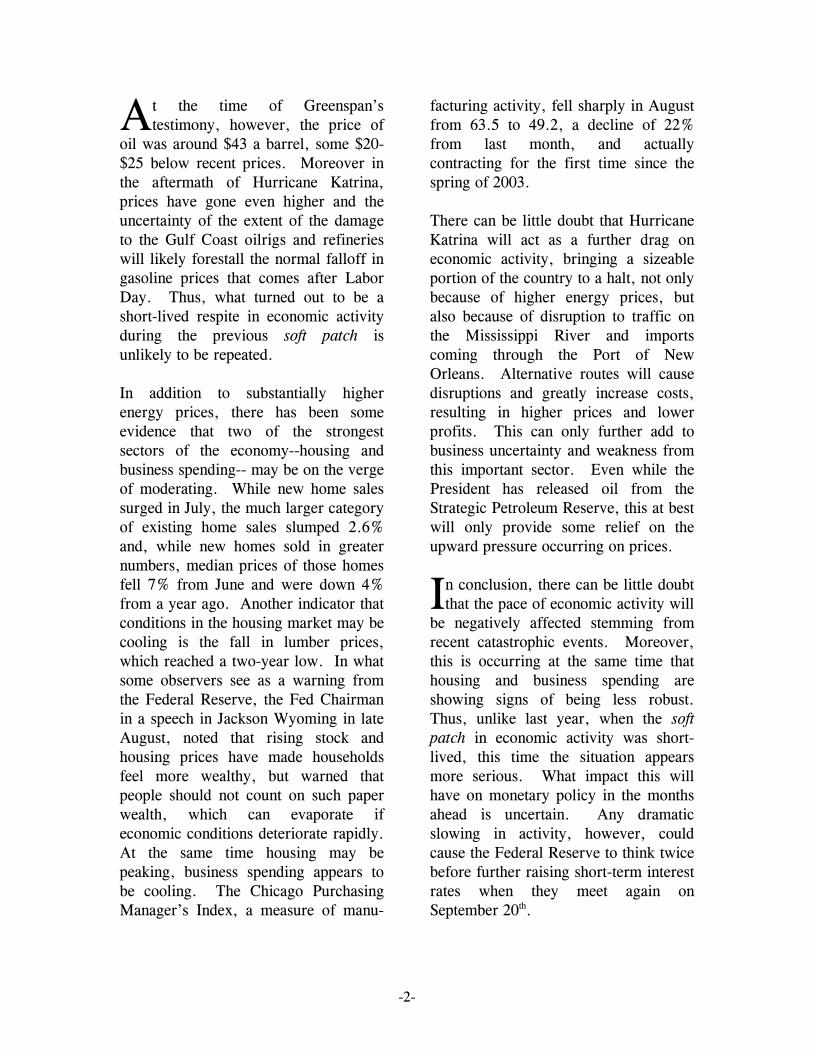
unchanged at a 3.3% annual rate from an initial report issued a month earlier. Still, as shown in the graph, real final sales - - gross domestic product less the change in inventories - - rose at a substantial 5.4% rate. Because of the falloff in inventories last quarter, growth in the current quarter should be uplifted as inventory stocks are replenished. Even with the release of this data, however, concerns of the economy hitting a soft patch have returned. This is reminiscent of conditions last year when fears of an economic slowdown surfaced.
CHANGE IN REAL GDP & FINAL SALESFISCAL YEARS
1
2
3
4
1
2
3
4
1
2
3
4
1
2
3
4
1
2
3
4
02
03
04
05
06
0
2
4
6
8
-2
PERCENT
GDP FINAL SALES
CHART 1
CGFA
Indeed, it was just a little over a year ago (September 8, 2004) that Federal Reserve Chairman Alan Greenspan in testimony before the Committee on the Budget, stated …” As you know, economic activity hit a soft patch in late spring…that softness in activity no doubt is related, in large measure, to this year’s steep increase in energy prices. The most recent data suggest that, on the whole, the expansion has regained some traction.”
T
-2-
t the time of Greenspan’s testimony, however, the price of
oil was around $43 a barrel, some $20-$25 below recent prices. Moreover in the aftermath of Hurricane Katrina, prices have gone even higher and the uncertainty of the extent of the damage to the Gulf Coast oilrigs and refineries will likely forestall the normal falloff in gasoline prices that comes after Labor Day. Thus, what turned out to be a short-lived respite in economic activity during the previous soft patch is unlikely to be repeated. In addition to substantially higher energy prices, there has been some evidence that two of the strongest sectors of the economy--housing and business spending-- may be on the verge of moderating. While new home sales surged in July, the much larger category of existing home sales slumped 2.6% and, while new homes sold in greater numbers, median prices of those homes fell 7% from June and were down 4% from a year ago. Another indicator that conditions in the housing market may be cooling is the fall in lumber prices, which reached a two-year low. In what some observers see as a warning from the Federal Reserve, the Fed Chairman in a speech in Jackson Wyoming in late August, noted that rising stock and housing prices have made households feel more wealthy, but warned that people should not count on such paper wealth, which can evaporate if economic conditions deteriorate rapidly. At the same time housing may be peaking, business spending appears to be cooling. The Chicago Purchasing Manager’s Index, a measure of manu-
facturing activity, fell sharply in August from 63.5 to 49.2, a decline of 22% from last month, and actually contracting for the first time since the spring of 2003. There can be little doubt that Hurricane Katrina will act as a further drag on economic activity, bringing a sizeable portion of the country to a halt, not only because of higher energy prices, but also because of disruption to traffic on the Mississippi River and imports coming through the Port of New Orleans. Alternative routes will cause disruptions and greatly increase costs, resulting in higher prices and lower profits. This can only further add to business uncertainty and weakness from this important sector. Even while the President has released oil from the Strategic Petroleum Reserve, this at best will only provide some relief on the upward pressure occurring on prices.
n conclusion, there can be little doubt that the pace of economic activity will
be negatively affected stemming from recent catastrophic events. Moreover, this is occurring at the same time that housing and business spending are showing signs of being less robust. Thus, unlike last year, when the soft patch in economic activity was short-lived, this time the situation appears more serious. What impact this will have on monetary policy in the months ahead is uncertain. Any dramatic slowing in activity, however, could cause the Federal Reserve to think twice before further raising short-term interest rates when they meet again on September 20th.
A
I
-3-
INDICATORS OF ILLINOIS ECONOMIC ACTIVITY
INDICATORS JULY 2005 JUNE 2005 JULY 2004
Unemployment Rate (Average) 6.0% 6.0% 6.2% Annual Rate of Inflation (Chicago) 1.2% 4.3% 2.6%
LATEST MONTH
% CHANGE OVER PRIOR
MONTH
% CHANGE OVER A
YEAR AGO
Civilian Labor Force (thousands) (July) 6,431 -0.2% 0.4% Employment (thousands) (July) 6,044 -0.2% 0.6% New Car & Truck Registration (July) 50,330 -23.7% -13.6% Single Family Housing Permits (July) 4,789 -2.4% 8.5% Total Exports ($ mil) (June) 3,159 0.5% 34.4% Chicago Purchasing Managers Index (August) 49.2 -22.5% -14.7%
Sales Tax Revenue from Motor Fuel
Eric Noggle, Sr. Revenue Analyst
ver the last several months, the price of motor fuel has been on a
steady increase. At the end of August, Illinois’ average price for a gallon of regular unleaded reached $2.72, according to the AAA Motor Club. Nationwide, average gasoline prices have gained 44 percent in the last year. Prices for crude oil are also up sharply and are currently hovering near record highs just under $70 a barrel. There is now fear that the recent tragedies associated with Hurricane Katrina will cause the price to increase even further. A CNN.com article states that a representative from the Oil Price Information Service believes that the cost of gasoline could hit $4 a gallon in the near future.
Because of the attention that these high motor fuel prices have received, the Commission has received numerous
requests for information relating to Illinois’ taxing structure. Specifically, most requests are for the amount of sales tax revenue that has been generated from motor fuel sales and the revenue increase that has and will occur because of these higher prices. Because the State motor fuel tax is a flat per gallon rate, revenue from the motor fuel tax is not affected by fluctuations in the base price of motor fuel (unless consumption levels change). On the other hand, revenue from the State sales tax is directly affected by fluctuations in motor fuel prices. In response, the Commission has formulated a fact sheet (shown on page 6), which provides a history of motor fuel prices in Illinois and the estimated amount of State sales tax revenue that has been generated over the last five years, as well as the amount of revenue anticipated if prices stayed at current levels for the remainder of the fiscal year. Highlights of the fact sheet are provided on the following page.
O
-4-
• There are many different taxes on the sale of motor fuel including various federal, State, and local motor fuel taxes, as well as various sales taxes. The State taxes include the flat $0.19 per gallon motor fuel tax on gasoline/gasohol ($0.21 for diesel), the $0.011 per gallon in environmental fees, and the State sales tax of 5% of motor fuel sales (imposed on the price before the inclusion of the State motor fuel tax). By State law, only 80% of the price of gasohol is subject to the State sales tax.
• A total of 6.3 billion gallons of motor fuel were reported by the Department of Revenue to be used in Illinois in FY 2005. This included 1.1 billion gallons of gasoline, 4.1 billion gallons of gasohol, and 1.1 billion gallons of diesel fuel. While gasohol gallon-age has increased dramatically over the last couple of years, the total amount of motor fuel consumed in Illinois has remained relatively stagnant over the same time frame.
• In FY 2002, when the average price
of gasoline was $1.34, the applicable State sales tax per gallon was approximately 5.2 cents per gallon. In FY 2005, at an average price of $1.97 per gallon, the applicable State sales tax per gallon was approximately 8.2 cents per gallon. At the retail price of $2.72 per gallon (current price as of 8/31/05), the State sales tax per gallon is approximately 11.7 cents.
• Between FY 2004 and FY 2005, the average retail price for gasoline (regular unleaded), increased from $1.66 per gallon to $1.97 per gallon. Similarly, the price of diesel rose from $1.67 to $2.16 per gallon.
• The Commission estimates that approximately $439 million in sales tax revenue was generated from motor fuel in FY 2005, which was approximately $80 million higher than what was collected in FY 2004. If prices in FY 2006 remained at the current level of $2.72, approxi-mately $615 million in motor fuel related sales tax revenue would be generated, an increase of $175 million over FY 2005.
• In FY 2005, Illinois generated $6.595 billion from the State sales tax. Therefore, the FY 2005 estimated amount of $439 million in sales tax revenue from motor fuel made up approximately 6.7% of all State sales tax revenue in FY 2005.
• Between the period July 2000 thru December 2000, Illinois suspended the State sales tax on motor fuel. The Commission estimated that approximately $157 million in motor fuel sales tax revenue was lost due to this tax suspension. The average retail price during this time period (FY 2001) was $1.56 per gallon.
• It should be noted that the
revenue increases from sales taxes
-5-
on motor fuel do not necessarily equate to an equivalent increase in overall sales tax revenues. This is because more money spent on motor fuel due to higher prices means there is likely less money spent in other areas.
hen Hurricane Katrina slammed into Louisiana and Mississippi on
August 29, 2005, it halted crude oil production in the Gulf of Mexico and damaged deep-water oil facilities. According to CNN.com, some 95 per-cent of the Gulf of Mexico's oil output
and more than 88 percent of natural gas production were shut as of August 30th. This region reportedly produces more than 1.4 million barrels a day of oil for U.S. consumption, equal to about 7 percent of the country's demand. As a result of these production concerns, President Bush announced that he plans on tapping the nation's Strategic Petroleum Reserve to help refiners hurt by Hurricane Katrina. At this point, it is too early to tell how this decision will affect future motor fuel prices in Illinois, and thus, the amount of tax revenue the State will receive from motor fuel.
W

-6-
FY 2006 if atFY 2001 FY 2002 FY 2003 FY 2004 FY 2005 Current Price*
Average Retail Price**: $1.56 $1.34 $1.49 $1.66 $1.97 $2.72Removing State Motor Fuel and other motor fuel taxes: 0.21 0.21 0.21 0.21 0.21 0.21
$1.35 $1.13 $1.28 $1.45 $1.76 $2.51Divided by Sales Tax (including local sales taxes): 1.075 1.075 1.075 1.075 1.075 1.075
Amount to which Sales Tax was Applied: $1.26 $1.05 $1.19 $1.35 $1.64 $2.345% State Sales Tax: 5.0% 5.0% 5.0% 5.0% 5.0% 5.0%
Est. State Sales Tax per Gallon on Gasoline: $0.063 $0.052 $0.059 $0.068 $0.082 $0.117Est. State Sales Tax per Gallon on Gasohol***: $0.044 $0.037 $0.042 $0.054 $0.065 $0.094
Gasoline Gallonage: 2,404,159,956 1,869,854,393 2,002,947,643 1,176,502,664 1,109,804,812 1,109,804,812 Est. Gallonage to Tax Exempt Organizations (approx. 5%): 120,207,998 93,492,720 100,147,382 58,825,133 55,490,241 55,490,241
Taxable Gasoline Gallonage: 2,283,951,958 1,776,361,673 1,902,800,261 1,117,677,531 1,054,314,572 1,054,314,572
Applicable Sales Tax per Gallon: $0.063 $0.052 $0.059 $0.068 $0.082 $0.117Sales Tax Revenue Generated from Gasoline: $143,539,299 $93,011,123 $113,091,237 $75,486,554 $86,241,297 $123,232,210
Gasohol Gallonage: 2,778,565,095 3,189,804,072 3,230,892,832 4,113,925,062 4,141,879,326 4,141,879,326 Est. Gallonage to Tax Exempt Organizations (approx. 5%): 138,928,255 159,490,204 161,544,642 205,696,253 207,093,966 207,093,966
Taxable Gasohol Gallonage: 2,639,636,840 3,030,313,868 3,069,348,190 3,908,228,809 3,934,785,359 3,934,785,359
Applicable Sales Tax per Gallon: $0.044 $0.037 $0.042 $0.054 $0.065 $0.094Sales Tax Revenue Generated from Gasohol: $116,125,093 $111,068,051 $127,696,781 $211,165,541 $257,487,474 $367,929,883
Est. Total Amount of State Sales Tax from Motor Fuel: $259,664,392 $204,079,174 $240,788,019 $286,652,095 $343,728,771 $491,162,093
Difference from Previous Year: -$55,585,218 $36,708,845 $45,864,077 $57,076,676 $147,433,322
Note: This does not include diesel gallonage.
FY 2006 if atFY 2001 FY 2002 FY 2003 FY 2004 FY 2005 Current Price*
Average Price**: $1.62 $1.45 $1.58 $1.67 $2.16 $2.72Removing State Motor Fuel and other motor fuel taxes: 0.235 0.235 0.235 0.235 0.235 0.235
$1.38 $1.22 $1.34 $1.44 $1.92 $2.49Divided by Sales Tax (including local sales taxes): 1.075 1.075 1.075 1.075 1.075 1.075
Taxable Amount: $1.28 $1.13 $1.25 $1.34 $1.79 $2.315% State Sales Tax: 5.0% 5.0% 5.0% 5.0% 5.0% 5.0%
Est. State Sales Tax per Gallon: $0.064 $0.057 $0.062 $0.067 $0.089 $0.116
Diesel Gallonage: 1,061,333,056 1,033,927,899 1,068,762,622 1,140,030,043 1,124,704,867 $1,124,704,867Est. Gallonage to Tax Exempt Organizations (approx. 5%): 53,066,653 51,696,395 53,438,131 57,001,502 56,235,243 56,235,243
Taxable Diesel Gallonage: 1,008,266,403 982,231,504 1,015,324,491 1,083,028,541 1,068,469,624 1,068,469,624
Applicable Sales Tax per Gallon: $0.064 $0.057 $0.062 $0.067 $0.089 $0.116
Sales Tax Revenue Generated from Diesel: $64,755,714 $55,526,537 $63,371,203 $72,390,803 $95,553,487 $123,544,906
Difference from Previous Year: -$9,229,178 $7,844,666 $9,019,600 $23,162,684 $27,991,419
Total Sales Taxes from Motor Fuels: $324,420,106 $259,605,711 $304,159,221 $359,042,898 $439,282,258 $614,707,000Approx. Reduction due to 6-mo tax Suspension****: $157,000,000 $0 $0 $0 $0 $0Total Sales Tax Revenue from Motor Fuel Received: $167,420,106 $259,605,711 $304,159,221 $359,042,898 $439,282,258 $614,707,000
Difference from Previous Year: $92,185,604 $44,553,511 $54,883,677 $80,239,360 $175,424,742
* Current Price as of 8/31/05 according to AAA Motor Club's website: www.fuelgaugereport.com.** Average Price comes from the Oil Price Information Service (OPIS), provided to the Commission by the Department of Revenue.*** As of July 1, 2003, 80% of sales of gasohol are subject to sales tax. Prior to July 1, 2003, only 70% of sales of gasohol were subject to sales tax.
Motor Fuel Price Factsheet
Estimated Amount of State Sales Tax Revenue from Unleaded Gasoline/Gasohol
Estimated Amount of State Sales Tax Revenue from Diesel
**** The Sales tax on motor fuel was suspended for the period July 2000 thru December 2000. As a result, approximately $157 million of the total provided was not received by the State, and thus the reason for the reduced amount shown.
-7-
Update on the Streamlined Sales Tax Project
Lynnae Kapp, Bond Analyst
he issue of sales and use taxes on remote sales is basically one of
collection. Past Supreme Court cases allow remote sellers to opt out of collecting the sales and use tax on goods bought by customers in a state where the seller does not have a physical presence. The reason this is allowed is due to what the Courts called an undue burden on the seller to track all of the taxing districts in every state. The tax is still owed by the consumer, yet it is very difficult for a state to collect if not done at the time of sale. In March 2000, the Streamlined Sales Tax Project (SSTP) was established to simplify and modernize sales and use tax collection and administration. Forty-two states either participated in or observed the proceedings. [Five states do not have sales taxes (Arkansas, Delaware, Montana, New Hampshire, and Oregon), and three states did not participate (Colorado, New Mexico and Hawaii)]. Out of this project came the Streamlined Sales and Use Tax Agreement, approved by 31 of the 35 implementing states at a meeting in Chicago, November 12, 2002. This document allows for states and retailers to voluntarily join the agreement, which benefits retailers by giving them simplified tax collection and other benefits in return for collecting sales tax revenues owed to the signatory states. Starting February 1, 2003, eight major retailers began collecting sales taxes on their web-based sales throughout the 50 states as part of their agreement with states involved in the Streamlined Sales
and Use Tax Agreement. Included in this group are Toys R Us Inc., Target Corp. and Wal-Mart Stores Inc. who will be given amnesty for past uncollected taxes on the Internet. Software has been developed that will automatically calculate correct sales and use taxes per item per state. States involved are willing to offer businesses a yearlong amnesty from back collection of taxes if they register and start collecting taxes in FY 2005.
he new agreement will affect only the retailers and states that are
signatory, and is to take effect once 10 states, with 20% of the population of the 45 states who collect sales and use taxes, have changed their laws to be in compliance with the tax-simplification agreement, but not before July 1, 2003. In their Report on Streamlined Sales Tax Implementing States and its Conforming States Committee (9/2004), NCSL says that as of August 2004, 18 states, with a total of 24.5% of the sales tax population had passed amendments to their laws sufficient to be in substantial compliance with the Agreement. The National Governor’s Association, National Association of Counties, National League of Cities and National Conference of State Legislatures all back the Streamlined Sales Tax Project. Illinois has not passed legislation to become a Streamlined Sales Tax implementing and conforming state. Those involved with the SSTP say that if this burden were removed, then the Supreme Court decisions would no longer apply. With the system created through the interstate agreement, the SSTP says they would not necessarily need a federal law to allow for tax
T
T

-8-
collection, although they may seek approval since the U.S. Congress regulates interstate commerce. The federal Internet tax moratorium only applied to “multiple” and “discriminatory” taxes on Internet-based transactions, and bans taxing access to the Internet. The moratorium did not address sales tax on the Internet, although much legislation has been offered on this topic. Federal legislation has been introduced to uphold the Streamlined Sales and Use Tax Agreement, but has yet to pass Congress.
While the IRS is considering taxing income derived from the sale of goods on sites such as EBay, Illinois’ Department of Revenue is cracking down on purchases of cigarettes over the Internet, in cases where Illinois buyers did not pay State sales or use taxes. According to an August 23, 2005 article in the State Journal-Register, The Department sent bills to 5,000 taxpayers in January 2005, to collect approximately $2.1 million in unpaid taxes, interest, and related penalties. Approximately $500,000 in back taxes has been recovered.
REVISED FY 2006 ESTIMATE Jim Muschinske, Revenue Manager
The table on page 11 details the Commission’s updated forecast for FY 2006 which was presented at the August 23rd Commission meeting. The estimate reflects actual FY 2005 base figures and incorporates new refund percentages as well as other legislative changes used to craft the FY 2006 budget. As shown, base FY 2006 revenues are estimated to be $26.740 billion, which represents an increase of $600 million or 2.3% over the previous fiscal year.
In essence, most of the economically related sources are expected to have another good year, although rates of growth are expected to moderate from last year’s levels. Unfortunately, a significant amount of growth will be offset by decreases related to changes that took place last year and will not be repeated such as the temporary
cigarette tax distribution change and higher funds sweeps. In addition, the reduction in the IGT will also have a significant impact on the year over year growth rate. Highlights of FY 2006 Estimate The following section briefly discusses the Commission’s estimates of the larger sources and/or other significant changes: Personal income tax- Gross personal
income taxes are estimated at $9.217 billion in FY 2006. That figure assumes base receipts will rise 5.0%, but due to the impact of the Voluntary Compliance Program (VCP) in FY 2005, the effective rate of growth is a lower 3.9%, which translates into an increase of $344 million. The estimate also incorporates the newly established refund percentage of 9.75%, down
-9-
slightly from last year’s 10.0% rate. As a result, on a net of refund basis, personal income tax receipts are expected to increase $339 million or 4.2%.
Corporate income tax- Gross
corporate income taxes are estimated at $1.614 billion. That forecast assumes base growth of 7.0%, but due to the impact of the VCP, the effective rate of growth is a lower 4.3%, which represents an increase of $66 million. The estimate incorporates the new refund percentage of 20.0%, down from last year’s 24.0% rate. As a result, on a net of refund basis, corporate income tax receipts are expected to increase $119 million or 10.2%.
Sales tax receipts- Sales tax receipts
are estimated to be $6.890 billion, or 4.5% higher than last year’s actuals. The forecast assumes growth similar to what was experienced in the prior year.
Public utility tax- Public utility tax
receipts are forecast to be $1.072 million in FY 2006. The estimate represents a modest increase of $16 million or 1.5%.
Cigarette tax- The estimate of
cigarette tax is $405 million and represents a $45 million decline from last year. The drop off is due to the temporary change in cigarette tax distribution that took place last year (worth $50 million). Slightly
offsetting that decline is an expected $5 million from a new distribution change ordered under P.A. 94-91.
Liquor gallonage tax- The estimate of liquor tax is $150 million or a $3 million increase over FY 2005. While last year enjoyed a $20 million increase due to the elimination of an earlier tax protest, receipts growth should once again flatten.
Inheritance tax- Inheritance tax is expected to dip slightly to $300 million in FY 2006. A number of large estate settlements experienced last fiscal year cannot be relied on to be repeated. In addition, the decoupling from the federal phase-out has now been fully annualized and will no longer increase revenues.
Insurance taxes and fees- The estimate of insurance taxes and fees is $342 million, reflecting no growth over the previous fiscal year. Last year, insurance receipts fell approximately 5.5% due to higher regular income tax payments (allowed as a deduction against owed insurance taxes). FY 2006 should once again see good regular income tax payments, which should serve to retard any growth from this source.
Corporate franchise taxes and fees- The forecast is $185 million and reflects a modest increase of $4 million or 2.2% over the previous fiscal year.

-10-
Interest income- Last year interest earnings increased nearly 33% as interest rates continually improved. Similar growth is expected in FY 2006 as rates of return continue to improve. The forecast assumes growth of $23 million or 31.5%.
Cook County Intergovernmental
Transfer- The IGT is expected to begin falling over the coming fiscal years due to the federal government phasing out the “hyper-payments” that are currently used under this funding mechanism. As a result, the transfer is expected to decrease by $93 million in FY 2006.
Other sources- The revenue from other sources to the general funds is expected to fall $22 million in FY 2006. The decline is anticipated due to lower Build Illinois general reserve account transfers as well as an anticipated drop in commercial distribution fee revenue stemming from P.A. 93-1033.
Lottery transfers- Lottery transfers are expected to rise $11 million to $625 million in FY 2006. Some
growth is expected due to increased lottery drawings and additional retailers.
Riverboat transfers and direct
receipts- Revenues from riverboat gaming are forecast to dip slightly by $11 million. Essentially, while the graduated tax rates were allowed to decrease per current law, SB 316 institutes a hold harmless provision that will mitigate any loss associated with the rate change. The slight decrease is anticipated because SB 316 also reduces the admissions tax, and that component is not under the hold harmless provision.
Other transfers- In FY 2006, other transfers to the general funds are expected to fall $129 million from the prior fiscal year, primarily reflecting lower statutory funds sweeps and anticipated fund chargebacks.
Federal Sources- Federal sources are estimated to increase a modest 2.1% or $100 million, reflecting appropriations and anticipated spending.

-11-
CGFAFY 2006 ACTUAL $ %
Revenue Sources Estimate Aug-05 FY 2005 Difference DifferenceState Taxes Personal Income Tax $9,217 $8,873 $344 3.9% Corporate Income Tax $1,614 $1,548 $66 4.3% Sales Taxes $6,890 $6,595 $295 4.5% Public Utility (regular) $1,072 $1,056 $16 1.5% Cigarette Tax $405 $450 ($45) -10.0% Liquor Gallonage Taxes $150 $147 $3 2.0% Vehicle Use Tax $32 $32 $0 0.0% Inheritance Tax (gross) $300 $310 ($10) -3.2% Insurance Taxes & Fees $342 $342 $0 0.0% Corporate Franchise Tax & Fees $185 $181 $4 2.2% Interest on State Funds & Investments $96 $73 $23 31.5% Cook County Intergovernmental Transfer $340 $433 ($93) -21.5% Other Sources $445 $467 ($22) -4.7% Subtotal $21,088 $20,507 $581 2.8%
Transfers
Lottery $625 $614 $11 1.8% Riverboat Transfers & Receipts $688 $699 ($11) -1.6% Other $770 $899 ($129) -14.3% Total State Sources $23,171 $22,719 $452 2.0%
Federal Sources $4,791 $4,691 $100 2.1%
Total Federal & State Sources $27,962 $27,410 $552 2.0%
Nongeneral Funds Distribution:
Refund Fund* Personal Income Tax ($899) ($894) ($5) 0.6% Corporate Income Tax ($323) ($376) $53 -14.1%
Subtotal General Funds $26,740 $26,140 $600 2.3%Short-Term Borrowing $0 $765 ($765) -100.0%HPF and HHSMTF Transfer $0 $1,002 ($1,002) -100.0%Budget Stabilization Fund Transfer $276 $276 $0 0.0%Total General Funds $27,016 $28,183 ($1,167) -4.1%
CGFA
FY 2006 CGFA ESTIMATE & FY 2005 ACTUALS(millions)
*The FY 2006 estimate includes the refund percentages at 9.75% for PIT and 20% for CIT. In addition, it is assumed that $276 million in Budget Stabilization Fund transfers will be utilized in FY 2006 for cash flow purposes.
-12-
CGFA vs. COMB COMPARISON
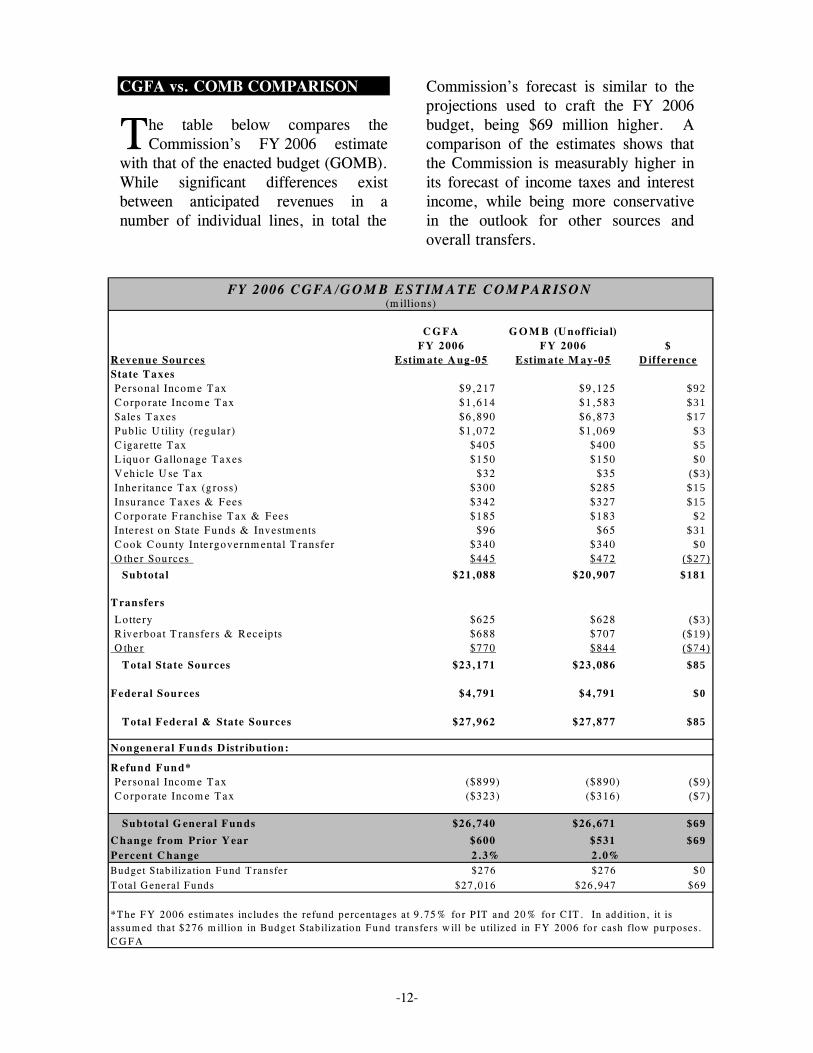
he table below compares the Commission’s FY 2006 estimate
with that of the enacted budget (GOMB). While significant differences exist between anticipated revenues in a number of individual lines, in total the
Commission’s forecast is similar to the projections used to craft the FY 2006 budget, being $69 million higher. A comparison of the estimates shows that the Commission is measurably higher in its forecast of income taxes and interest income, while being more conservative in the outlook for other sources and overall transfers.
CG FA G O M B (Unofficia l)FY 2006 FY 2006 $
Revenue Sources Estim ate A ug-05 Estim ate M ay-05 D ifferenceState Taxes Personal Incom e Tax $9,217 $9,125 $92 Corporate Incom e Tax $1,614 $1,583 $31 Sales Taxes $6,890 $6,873 $17 Public U tility (regular) $1,072 $1,069 $3 C igarette Tax $405 $400 $5 L iquor Gallonage Taxes $150 $150 $0 V ehicle U se Tax $32 $35 ($3) Inheritance Tax (gross) $300 $285 $15 Insurance Taxes & Fees $342 $327 $15 Corporate Franchise Tax & Fees $185 $183 $2 In terest on State Funds & Investm ents $96 $65 $31 Cook County In tergovernm ental T ransfer $340 $340 $0 O ther Sources $445 $472 ($27) Subtotal $21,088 $20,907 $181
Transfers
Lottery $625 $628 ($3) R iverboat T ransfers & Receipts $688 $707 ($19) O ther $770 $844 ($74) Total State Sources $23,171 $23,086 $85
Federal Sources $4,791 $4,791 $0
Total Federal & State Sources $27,962 $27,877 $85
Nongeneral Funds D istribution:
Refund Fund* Personal Incom e Tax ($899) ($890) ($9) Corporate Incom e Tax ($323) ($316) ($7)
Subtota l G eneral Funds $26,740 $26,671 $69Change from Prior Year $600 $531 $69Percent Change 2.3% 2.0%Budget S tab ilization Fund Transfer $276 $276 $0Total G eneral Funds $27,016 $26,947 $69
CGFA
FY 2006 CGFA/GOM B ESTIM ATE COM PARISON(m illions)
*The FY 2006 estim ates includes the refund percentages at 9.75% for PIT and 20% for C IT . In addition, it is assum ed that $276 m illion in Budget Stabilization Fund transfers w ill be utilized in FY 2006 for cash flow purposes.
T
-13-
REVENUE Revenues Continue Mixed
Jim Muschinske, Revenue Manager
August general revenue receipts increased $55 million, excluding Budget Stabilization Fund transfers. While a modest gain was made overall, approximately half of the revenue sources experienced monthly declines from the same month last year. The overall gain would have been lower but for an extra receipting day this August, which helped contribute to the increase.
f the revenue lines experiencing growth, sales tax receipts
performed the strongest with receipts up $49 million, in part due to higher fuel prices. [See earlier section on sales of motor fuel]. Public utility taxes rose by $36 million as a poor month last year coupled with an extra receipting day this August likely accounted for the gain. Gross personal income tax receipts increased by $24 million, or $23 million net of refunds. Interest income jumped by $8 million, while corporate taxes and fees added $4 million to the monthly advance. Finally, vehicle use tax managed to increase $2 million. Despite the overall increase in revenues, a number of sources experienced losses during August. Other sources fell $24 million due to the timing of receipts, while gross corporate income tax revenue dropped by $13 million, or $9 million net of refunds. Both cigarette tax receipts and inheritance tax receipts fell $12 million for the month. Insurance tax revenue dipped by $2 million and the liquor tax had a $1 million loss.
Overall transfers decreased by $96 million in August. Other transfers dropped $127 million due to last year’s statutory fund sweeps, while riverboat taxes dipped by $1 million. Offsetting some of those losses was a $32 million increase in lottery transfers. Federal sources experienced a good month with receipts increasing $89 million.
Year to Date Through the first two months of the fiscal year, excluding Budget Stabilization transfers, general revenues are down $148 million. The loss is due to the timing and magnitude of fund sweeps as well as last year’s significant jump in federal sources related to earlier short-term borrowing. Absent those items, for the most part revenues have performed fairly well.
ales tax receipts are up $109 million through August, no doubt in part due
to higher fuel prices. Gross personal income tax receipts have gained $66 million thus far, or $69 million net of refunds. Public utility taxes, aided by a strong August, are up $35 million year to date. Interest income continues to perform well as rates of return continue to rise, with receipts gaining $14 million over the first two months. A number of sources are down in comparison to the same period of a year ago. Both inheritance tax revenues and the Cook County Intergovernmental Transfer are down $14 million. Early last year, inheritance tax posted unexpected gains so it’s not surprising to see a slowing. Likewise, a decrease in the IGT is expected this year as the
O
S
-14-
federal government curtails the use of “hyper-rates” that is enjoyed under this funding mechanism. Cigarette taxes are down $12 million due to a temporary tax distribution change made last fiscal year. Gross corporate income tax is down $6 million, although on a net of refund basis is actually up $2 million. Overall transfers are down $85 million year to date due to a $99 million falloff
in other transfers stemming from less statutory fund sweeps and a $7 million drop in riverboat transfers. Partially offsetting those declines is a $21 million increase in lottery transfers. Federal sources are down by $255 million and is due to a $434 million transfer in July 2004 to the general funds stemming from short-term borrowing used to pay down the backlog in Medicaid bills.

-15-
GENERAL FUNDS RECEIPTS: AUGUSTFY 2006 vs. FY 2005
($ million)
AUG. AUG. $ %Revenue Sources FY 2006 FY 2005 CHANGE CHANGEState Taxes Personal Income Tax $638 $614 $24 3.9% Corporate Income Tax (regular) 15 28 ($13) -46.4% Sales Taxes 588 539 $49 9.1% Public Utility Taxes (regular) 100 64 $36 56.3% Cigarette Tax 34 46 ($12) -26.1% Liquor Gallonage Taxes 11 12 ($1) -8.3% Vehicle Use Tax 5 3 $2 66.7% Inheritance Tax (Gross) 19 31 ($12) -38.7% Insurance Taxes and Fees 16 18 ($2) -11.1% Corporate Franchise Tax & Fees 17 13 $4 30.8% Interest on State Funds & Investments 11 3 $8 266.7% Cook County IGT 0 0 $0 n/a Other Sources 41 65 ($24) -36.9% Subtotal $1,495 $1,436 $59 4.1%
Transfers Lottery 64 32 $32 100.0% Riverboat transfers & receipts 60 61 ($1) -1.6% Other 21 148 ($127) -85.8% Total State Sources $1,640 $1,677 ($37) -2.2%
Federal Sources $505 $416 $89 21.4% Total Federal & State Sources $2,145 $2,093 $52 2.5%
Nongeneral Funds Distribution:
Refund Fund Personal Income Tax ($62) ($61) ($1) 1.6% Corporate Income Tax ($3) (7) $4 -57.1%
Subtotal General Funds $2,080 $2,025 $55 2.7%Short-Term Borrowing $0 $0 $0 N/AHPF and HHSMTF Transfers $0 $0 $0 N/ABudget Stabilization Fund Transfer $276 $0 $276 N/A Total General Funds $2,356 $2,025 $331 16.3%
CGFA SOURCE: Office of the Comptroller: Some totals may not equal, due to rounding 2-Sep-05

-16-
GENERAL FUNDS RECEIPTS: YEAR TO DATEFY 2006 vs. FY 2005
($ million)
CHANGEFROM %
Revenue Sources FY 2006 FY 2005 FY 2005 CHANGEState Taxes Personal Income Tax $1,218 $1,152 $66 5.7% Corporate Income Tax (regular) 57 63 ($6) -9.5% Sales Taxes 1,210 1,101 $109 9.9% Public Utility Taxes (regular) 178 143 $35 24.5% Cigarette Tax 68 80 ($12) -15.0% Liquor Gallonage Taxes 27 26 $1 3.8% Vehicle Use Tax 7 6 $1 16.7% Inheritance Tax (Gross) 37 51 ($14) -27.5% Insurance Taxes and Fees 20 20 $0 0.0% Corporate Franchise Tax & Fees 27 25 $2 8.0% Interest on State Funds & Investments 21 7 $14 200.0% Cook County IGT 40 54 ($14) -25.9% Other Sources 88 89 ($1) -1.1% Subtotal $2,998 $2,817 $181 6.4%
Transfers Lottery 114 93 $21 22.6% Riverboat transfers & receipts 109 116 ($7) -6.0% Other 82 181 ($99) -54.7% Total State Sources $3,303 $3,207 $96 3.0%Federal Sources $783 $1,038 ($255) -24.6% Total Federal & State Sources $4,086 $4,245 ($159) -3.7%
Nongeneral Funds Distribution:Refund Fund Personal Income Tax ($119) ($122) $3 -2.5% Corporate Income Tax ($11) ($19) $8 -42.1%
Subtotal General Funds $3,956 $4,104 ($148) -3.6%
Short-Term Borrowing $0 $0 $0 N/A
HPF and HHSMTF Transfers $0 $0 $0 N/A
Budget Stabilization Fund Transfer $276 $0 $276 N/A Total General Funds $4,232 $4,104 $128 3.1%SOURCE: Office of the Comptroller, State of Illinois: Some totals may not equal, due to rounding.CGFA 2-Sep-05

-17-
GENERAL FUNDS GROWTH NEEDED TO MEET ESTIMATEFY 2006 ESTIMATE vs. FY 2005 ACTUAL
($ million)
AUG-05 AMOUNTESTIMATE FYTD NEEDED FYTD GROWTH %
Revenue Sources FY 2006 2006 FY 2006 EST. 2005 NEEDED CHANGE
State Taxes Personal Income Tax $9,217 $1,218 $7,999 $1,152 $278 3.6% Corporate Income Tax (regular) 1,614 57 $1,557 63 $72 4.8% Sales Taxes 6,890 1,210 $5,680 1,101 $186 3.4% Public Utility Taxes (regular) 1,072 178 $894 143 ($19) -2.1% Cigarette Tax 405 68 $337 80 ($33) -8.9% Liquor Gallonage Taxes 150 27 $123 26 $2 1.7% Vehicle Use Tax 32 7 $25 6 ($1) -3.8% Inheritance Tax (Gross) 300 37 $263 51 $4 1.5% Insurance Taxes and Fees 342 20 $322 20 $0 0.0% Corporate Franchise Tax & Fees 185 27 $158 25 $2 1.3% Interest on State Funds & Investments 96 21 $75 7 $9 13.6% Cook County IGT 340 40 $300 54 ($79) -20.8% Other Sources 445 88 $357 89 ($21) -5.6%
Subtotal $21,088 $2,998 $18,090 $2,817 $400 2.3%
Transfers Lottery 625 114 $511 93 ($10) -1.9% Riverboat transfers & receipts 688 109 $579 116 ($4) -0.7% Other 770 82 $688 181 ($30) -4.2%
Total State Sources $23,171 $3,303 $19,868 $3,207 $356 1.8%
Federal Sources $4,791 $783 $4,008 $1,038 $355 9.7%
Total Federal & State Sources $27,962 $4,086 $23,876 $4,245 $711 3.1%
Nongeneral Funds Distribution:
Refund Fund Personal Income Tax ($899) ($119) ($780) ($122) ($8) 1.0% Corporate Income Tax (323) ($11) ($312) (19) $45 -12.6%
Subtotal General Funds $26,740 $3,956 $22,784 $4,104 $748 3.4%Short-Term Borrowing $0 $0 $0 $0 ($765) N/AHPF and HHSMTF Transfer $0 $0 $0 $0 ($1,002) N/A
Budget Stabilization Fund Transfer $276 $276 $0 $0 ($276) N/A
Total General Funds $27,016 $4,232 $22,784 $4,104 ($1,295) -5.4%CGFA 2-Sep-05

-18-
GENERAL FUNDS PERFORMANCE TO DATEGOVERNOR'S OFFICE OF MANANGEMENT AND BUDGET
FY 2006 ESTIMATE vs. FY 2005 ACTUALS($ million)
GOMBMAY-05 AMOUNTEstimate FYTD NEEDED FYTD GROWTH %
Revenue Sources FY 2006 2006 FY 2006 Est. 2005 NEEDED CHANGEState Taxes
Personal Income Tax $9,125 $1,218 $7,907 $1,152 $186 2.4%
Corporate Income Tax (regular) 1,583 57 $1,526 63 $41 2.8%
Sales Taxes 6,873 1,210 $5,663 1,101 $169 3.1%
Public Utility Taxes (regular) 1,069 178 $891 143 ($22) -2.4%
Cigarette Tax 400 68 $332 80 ($38) -10.3%
Liquor Gallonage Taxes 150 27 $123 26 $2 1.7%
Vehicle Use Tax 35 7 $28 6 $2 7.7%
Inheritance Tax (Gross) 285 37 $248 51 ($11) -4.2%
Insurance Taxes and Fees 327 20 $307 20 ($15) -4.7%
Corporate Franchise Tax & Fees 183 27 $156 25 $0 0.0%
Interest on State Funds & Investments 65 21 $44 7 ($22) -33.3%
Cook County IGT 340 40 $300 54 ($79) -20.8%
Other Sources 472 88 $384 89 $6 1.6%
Subtotal $20,907 $2,998 $17,909 $2,817 $219 1.2%
Transfers Lottery 628 114 $514 93 ($7) -1.3% Gaming Fund Transfer 707 109 $598 116 $15 2.6% Other 844 82 $762 181 $44 6.1%
Total State Sources $23,086 $3,303 $19,783 $3,207 $271 1.4%
Federal Sources $4,791 $783 $4,008 $1,038 $355 9.7%$
Total Federal & State Sources $27,877 $4,086 $23,791 $4,245 $626 2.7%
Nongeneral Funds Distribution:
Refund Fund Personal Income Tax ($890) ($119) ($771) ($122) $1 -0.1% Corporate Income Tax (316) (11) ($305) (19) $52 -14.6%
Subtotal General Funds $26,671 $3,956 $22,715 $4,104 $679 3.1%
Short-Term Borrowing $0 $0 $0 $0 ($765) N/A
HPF and HHSMTF Transfer $0 $0 $0 $0 ($1,002) N/A
Budget Stabilization Fund Transfer $276 $276 $0 $0 ($276) N/A
Total General Funds $26,947 $4,232 $22,715 $4,104 ($1,364) -5.7%
CGFA 2-Sep-05
-19-
PENSIONS Preliminary Estimate of the Impact
of Public Act 94-0004 (SB 0027) Tim Blair, Pension Manager
SB 0027 passed both chambers of the General Assembly and became Public Act 94-0004 upon signature by Governor Blagojevich on June 1, 2005. The Act makes several changes to the Illinois Pension Code, including a reduction in the required FY 2006 and FY 2007 State contributions to the State-funded retirement systems. In addition, the Act makes various changes in the Downstate Teachers’, State Universities, State Employees’ and the Chicago Teachers’ Articles of the Pension Code.
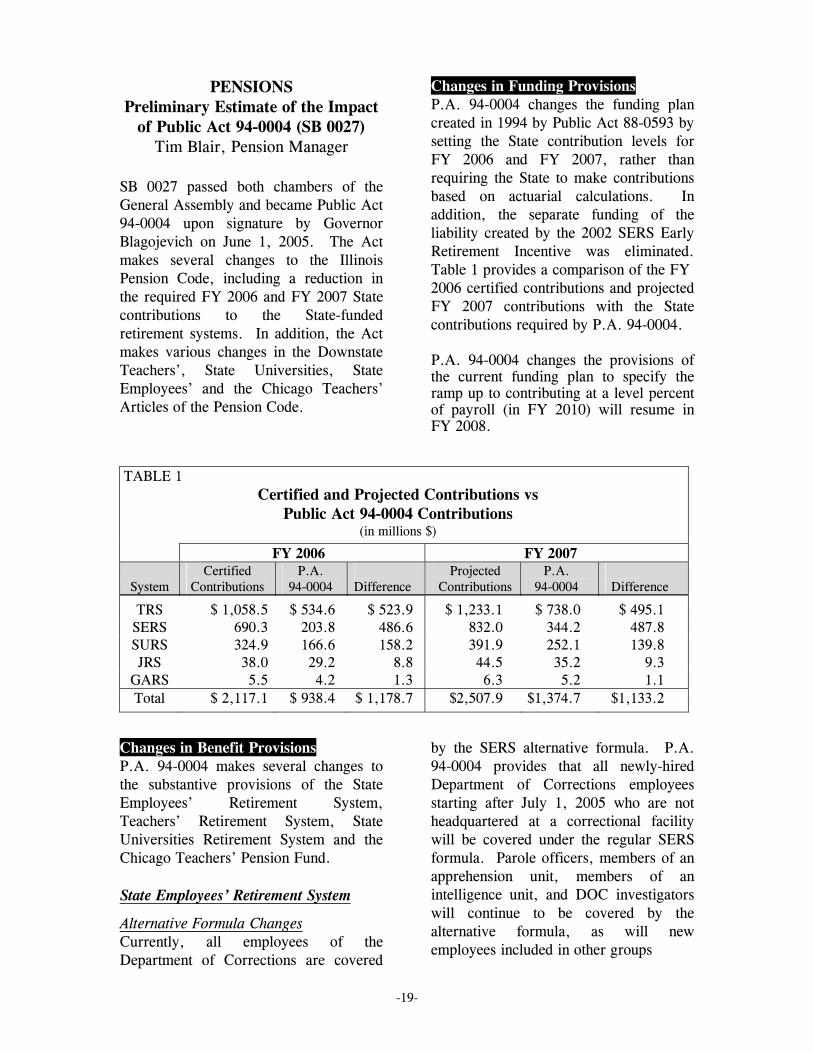
Changes in Funding Provisions P.A. 94-0004 changes the funding plan created in 1994 by Public Act 88-0593 by setting the State contribution levels for FY 2006 and FY 2007, rather than requiring the State to make contributions based on actuarial calculations. In addition, the separate funding of the liability created by the 2002 SERS Early Retirement Incentive was eliminated. Table 1 provides a comparison of the FY 2006 certified contributions and projected FY 2007 contributions with the State contributions required by P.A. 94-0004. P.A. 94-0004 changes the provisions of the current funding plan to specify the ramp up to contributing at a level percent of payroll (in FY 2010) will resume in FY 2008.
TABLE 1 Certified and Projected Contributions vs
Public Act 94-0004 Contributions (in millions $)
FY 2006 FY 2007
System Certified
Contributions P.A.
94-0004
Difference Projected
Contributions P.A.
94-0004
Difference
TRS $ 1,058.5 $ 534.6 $ 523.9 $ 1,233.1 $ 738.0 $ 495.1 SERS 690.3 203.8 486.6 832.0 344.2 487.8 SURS 324.9 166.6 158.2 391.9 252.1 139.8 JRS 38.0 29.2 8.8 44.5 35.2 9.3
GARS 5.5 4.2 1.3 6.3 5.2 1.1 Total $ 2,117.1 $ 938.4 $ 1,178.7 $2,507.9 $1,374.7 $1,133.2
Changes in Benefit Provisions P.A. 94-0004 makes several changes to the substantive provisions of the State Employees’ Retirement System, Teachers’ Retirement System, State Universities Retirement System and the Chicago Teachers’ Pension Fund. State Employees’ Retirement System
Alternative Formula Changes Currently, all employees of the Department of Corrections are covered
by the SERS alternative formula. P.A. 94-0004 provides that all newly-hired Department of Corrections employees starting after July 1, 2005 who are not headquartered at a correctional facility will be covered under the regular SERS formula. Parole officers, members of an apprehension unit, members of an intelligence unit, and DOC investigators will continue to be covered by the alternative formula, as will new employees included in other groups
-20-
currently covered by the alternative formula, such as state troopers and other sworn police officers. State Universities Retirement System
Money Purchase Retirement Option Changes P.A. 94-0004 eliminates the money purchase formula for employees who become members of SURS after July 1, 2005. Beginning in FY 2006, the Act requires the Comptroller (rather than the SURS Board of Trustees) to determine the interest rate to be used when crediting interest to the accounts of current employees. On August 31, 2005 the Comptroller set the SURS money purchase interest rate at 8.5% for 2006 (September 1, 2005 through August 31, 2006) and 8.0% for 2007 (September 1, 2006 through August 31, 2007). Salary Increase Payments P.A. 94-0004 provides a mechanism by which the liability associated with salary increases above a certain level may be shifted to the universities providing those salary increases. The Act provides that during the years used to determine final average salary, the employer must pay to SURS an amount equal to the present value of the increase in benefits resulting from salary increases above 6%. The employer contribution required by P.A. 94-0004 may be paid in a lump sum within 30 days of the receipt of the bill from SURS. The Act specifies that SURS must calculate the contribution amount using the same actuarial assumptions and tables used for the most recent actuarial valuation. P.A. 94-0004 applies to salaries paid under contracts or collective bargaining agreements entered into, amended, or renewed after the effective date of the Amendatory Act.
Teachers’ Retirement System Salary Increase Payments P.A. 94-0004 provides a mechanism by which the liability associated with salary increases above a certain level may be shifted to the school districts providing those salary increases. The Act provides that during the years used to determine final average salary, the employer must pay to TRS an amount equal to the present value of the increase in benefits resulting from salary increases above 6%. The employer contribution required by P.A. 94-0004 may be paid in a lump sum within 30 days of the receipt of the bill from SURS. The Act specifies that TRS must calculate the contribution amount using the same actuarial assumptions and tables used for the most recent actuarial valuation. P.A. 94-0004 applies to salaries paid under contracts or collective bargaining agreements entered into, amended, or renewed after the effective date of the Amendatory Act. Money Purchase Retirement Option Changes P.A. 94-0004 eliminates the money purchase formula for employees who become members of TRS after July 1, 2005. Sick Leave Service Credit Currently, members of TRS may establish up to 2 years of service credit for unused and uncompensated sick leave without making contributions. P.A. 94-0004 provides that if days granted by an employer are in excess of the normal annual sick leave allotment, the employer is required to contribute to TRS the normal cost of the benefits which are based on this excess sick leave.
-21-
Extension of Current Early Retirement Option (“Pipeline ERO”) An Early Retirement Option for members of TRS was created in 1980 and has been extended every 5 years since its inception. Most recently, Public Act 91-0017 extended the TRS ERO option until June 30, 2005. If an employee exercises the ERO option (i.e. retires before age 60 with less than 34 years of service) employee and employer contributions are required to avoid discount. The employee contribution is 7% of salary for each year less than age 60 or 35 years of service (whichever is less) and the employer contribution is 20% of salary for each year less than age 60. Public Act 92-0582 removed the employee contribution for members with 34 years of service and Public Act 91-0017 removed the employer contribution requirement for employees who retire with 34 years of service. P.A. 94-0004 allows TRS members to participate in the current ERO if the member retires between June 30, 2005 and July 1, 2007. The member must have notified his or her employer of the intent to participate in the ERO prior to June 1, 2005 (the effective date of the Amendatory Act) under the terms of a contract or collective bargaining agreement in effect prior to the June 1, 2005. A member’s employer is required to provide to TRS a copy of the member’s notification, an affidavit signed by the member and employer verifying the notification, and any additional documentation that TRS may require. New Early Retirement Option P.A. 94-0004 creates a new ERO effective July 1, 2005. If an employee exercises the new ERO option (retires
before age 60) employee and employer contributions are required to avoid discount. The employee contribution is 11.5% of salary for each year less than age 60 or 35 years of service (whichever is less) and the employer contribution is 23.5% of salary for each year less than age 60. In addition, all active TRS members are required to contribute 0.4% of salary towards the cost of ERO. This contribution would be refunded, without interest, if the member does not utilize the ERO, if the member takes a refund from TRS, if the member dies, or if the ERO is terminated. By June 30, 2012 (and every 5 years thereafter), TRS is required to review the System’s ERO experience to determine if the required contributions adequately fund the ERO. The TRS Board of Trustees must submit the results to the Commission on Government Forecasting and Accountability, who must then recommend to the General Assembly (by February 1st) if the required ERO contributions should be adjusted. If the General Assembly does not adjust the required contributions as recommended, the ERO would be terminated at the end of that fiscal year. Chicago Teachers’ Pension Fund
Extension of Current Early Retirement Option Public Act 91-0017 extended the Early Retirement Option in the Chicago Teachers’ Pension Fund until June 30, 2005. If an employee exercises that option by retiring before age 60 with less than 34 years of service, employee and employer contributions are required to avoid a reduction in annuity. The employee contribution is 7% of salary for each month less than age 60 or 35
-22-
years of service (whichever is less), and the employer contribution is 20% of salary for each year less than age 60. No employee or employer contributions are required for members with 34 years of service. Currently, each employer has the authority to determine whether it should provide an ERO for its employees. P.A. 94-0004 extends the ERO option to June 30, 2010 and specifies that the employer may not limit the number of ERO participants to less than 200 (rather than 30% of eligible members). The Act also allows the employer and collective bargaining agent to agree to set the limit higher than 200, and to base the allocation for participation on a basis other than seniority. Application of New Benefits P.A. 94-0004 requires every new benefit increase to identify and provide for additional funding at least sufficient to fund the resulting annual increase in cost as it accrues to the System. The Commission on Government Forecasting and Accountability is required to analyze and determine if adequate additional funding has been provided for the benefit increase and report that analysis to the Public Pension Division of the Department of Financial and Professional Regulation. The Division is required to report any funding inadequacies to the Governor and State Comptroller. Unless the funding inadequacy is corrected by the General Assembly, the benefit increase would expire at the end of the fiscal year. In addition, P.A. 94-0004 provides that all benefit increases will expire 5 years after the effective date of the increase, unless an earlier date is specified in the legislation that provides the benefit increase.
Advisory Task Force on Pension Benefits P.A. 94-0004 creates an Advisory Task Force on Pension Benefits for New Employees. The Task Force would consist of 15 members, 8 of whom will be appointed by the Governor. Four of the Governor’s appointees must be members of labor organizations, with 2 representing primarily teachers and 2 representing primarily State employees. In addition, each legislative leader is allowed to appoint 1 member of the Task Force. The Executive Directors of TRS, SERS and SURS are also members of the Task Force. The Task Force is allowed to request actuarial data from any of the State-funded retirement systems. It is charged with making recommendations on changing age and service requirements, automatic annual increases and employee contribution rates for future members of the retirement systems. These recommendations must be submitted to the Governor and General Assembly by November 1, 2005. FISCAL IMPACT OF P.A. 94-0004 The Act reduced the required State contributions to the retirement systems by $1,178.7 million in FY 2006 and $1,133.2 in FY 2007. Generally, reducing contributions in the early years of a funding plan increases the contributions that will be required in later years. But, the Act also makes changes to the Pension Code which may reduce the growth in accrued liabilities. The State-funded retirement systems and the Commission on Government Forecasting and Accountability have prepared preliminary estimates of the possible effect of P.A. 94-0004 on the required contributions to the State-funded retirement systems.
-23-
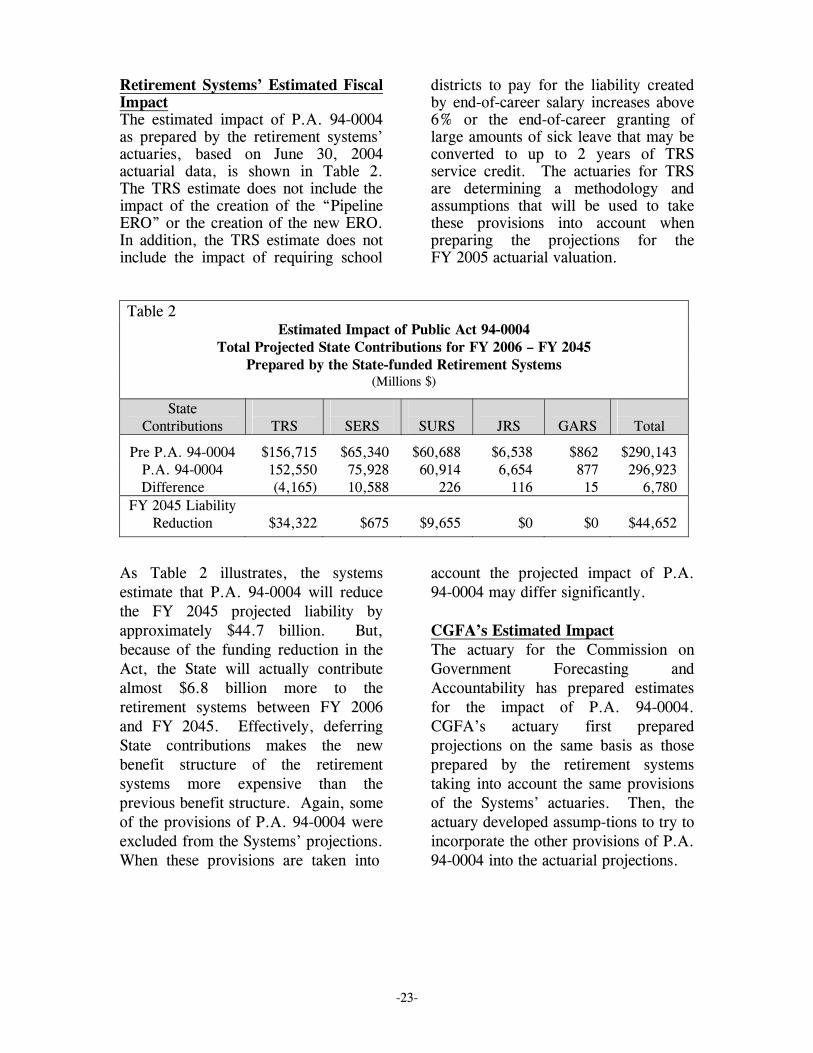
Retirement Systems’ Estimated Fiscal Impact The estimated impact of P.A. 94-0004 as prepared by the retirement systems’ actuaries, based on June 30, 2004 actuarial data, is shown in Table 2. The TRS estimate does not include the impact of the creation of the “Pipeline ERO” or the creation of the new ERO. In addition, the TRS estimate does not include the impact of requiring school
districts to pay for the liability created by end-of-career salary increases above 6% or the end-of-career granting of large amounts of sick leave that may be converted to up to 2 years of TRS service credit. The actuaries for TRS are determining a methodology and assumptions that will be used to take these provisions into account when preparing the projections for the FY 2005 actuarial valuation.
Table 2
Estimated Impact of Public Act 94-0004 Total Projected State Contributions for FY 2006 – FY 2045
Prepared by the State-funded Retirement Systems (Millions $)
State Contributions
TRS
SERS
SURS
JRS
GARS
Total
Pre P.A. 94-0004 $156,715 $65,340 $60,688 $6,538 $862 $290,143 P.A. 94-0004 152,550 75,928 60,914 6,654 877 296,923
Difference (4,165) 10,588 226 116 15 6,780 FY 2045 Liability
Reduction
$34,322
$675
$9,655
$0
$0
$44,652
As Table 2 illustrates, the systems estimate that P.A. 94-0004 will reduce the FY 2045 projected liability by approximately $44.7 billion. But, because of the funding reduction in the Act, the State will actually contribute almost $6.8 billion more to the retirement systems between FY 2006 and FY 2045. Effectively, deferring State contributions makes the new benefit structure of the retirement systems more expensive than the previous benefit structure. Again, some of the provisions of P.A. 94-0004 were excluded from the Systems’ projections. When these provisions are taken into
account the projected impact of P.A. 94-0004 may differ significantly. CGFA’s Estimated Impact The actuary for the Commission on Government Forecasting and Accountability has prepared estimates for the impact of P.A. 94-0004. CGFA’s actuary first prepared projections on the same basis as those prepared by the retirement systems taking into account the same provisions of the Systems’ actuaries. Then, the actuary developed assump-tions to try to incorporate the other provisions of P.A. 94-0004 into the actuarial projections.

-24-
Estimated Impact – Same Provisions and Assumptions as Retirement Systems CGFA’s actuary has prepared projections on the same basis as those
prepared by the retirement systems, taking into account the same provisions as the systems’ actuaries. Those results are shown in Table 3.
Table 3 Estimated Impact of Public Act 94-0004
Total Projected State Contributions for FY 2006 – FY 2045 Prepared by CGFA - Retirement System Assumptions
(Millions $)
State Contributions
TRS
SERS
SURS
JRS
GARS
Total
Pre P.A. 94-0004 $160,302 $68,065 $61,184 $6,538 $862 $296,951 P.A. 94-0004 155,507 78,068 60,531 6,654 877 301,637
Difference (4,795) 10,003 (653) 116 15 4,686 FY 2045 Liability
Reduction
$26,265
$667
$11,690
$0
$0
$38,622
The results shown in Table 3 are similar to those calculated by the Systems’ actuaries. CGFA’s actuary has estimated the FY 2045 liability will be lower by approximately $38.6 billion after implementation of P.A. 94-0004. But, due to the change in the funding provisions, the State is expected to contribute almost $4.7 billion more over the remainder of the funding plan. Estimated Impact – Additional P.A. 94-0004 Provisions for TRS (CGFA Assumptions) The staff and actuary for the Commission have prepared projections that incorporate some of the additional provisions of P.A. 94-0004, which were excluded from the projections prepared by the retirement systems. Specifically, CGFA incorporated the impact of the “Pipeline ERO” and the new ERO (through FY 2012) for TRS.
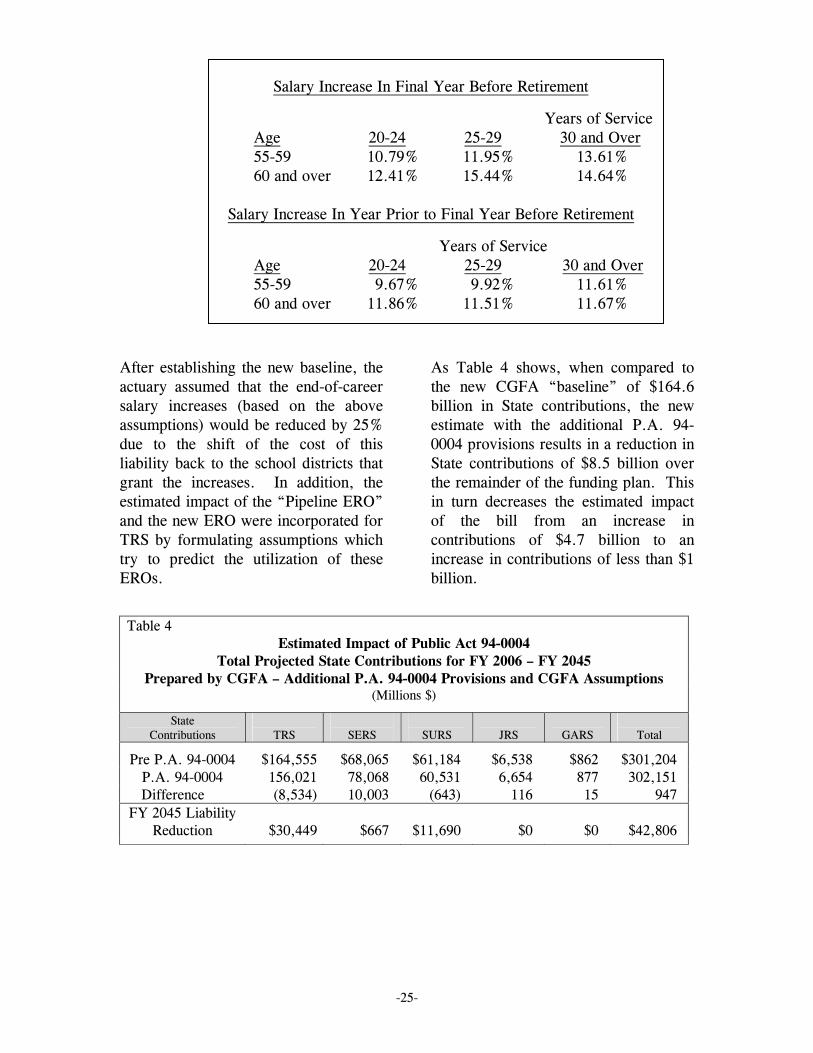
In addition, CGFA attempted to incorporate the impact of shifting the cost for the liability created by end-of-career salary increases above 6% to the school districts that grant those increases. In order to incorporate the impact of shifting certain salary increase costs to school districts, the Commission’s actuary first established a new TRS “baseline” projection, or the pre-P.A. 94-0004 projection for TRS shown in Table 4. The new “baseline” was established by replacing the TRS end-of-career salary increase assumption (the severance payment assumption) with an end-of career salary increase assumption based on an experience analysis performed by the Commission’s actuary. The CGFA end-of-career salary increase assumption follows.
-25-
Salary Increase In Final Year Before Retirement
Years of Service Age 20-24 25-29 30 and Over 55-59 10.79% 11.95% 13.61% 60 and over 12.41% 15.44% 14.64% Salary Increase In Year Prior to Final Year Before Retirement
Years of Service Age 20-24 25-29 30 and Over 55-59 9.67% 9.92% 11.61% 60 and over 11.86% 11.51% 11.67%
After establishing the new baseline, the actuary assumed that the end-of-career salary increases (based on the above assumptions) would be reduced by 25% due to the shift of the cost of this liability back to the school districts that grant the increases. In addition, the estimated impact of the “Pipeline ERO” and the new ERO were incorporated for TRS by formulating assumptions which try to predict the utilization of these EROs.
As Table 4 shows, when compared to the new CGFA “baseline” of $164.6 billion in State contributions, the new estimate with the additional P.A. 94-0004 provisions results in a reduction in State contributions of $8.5 billion over the remainder of the funding plan. This in turn decreases the estimated impact of the bill from an increase in contributions of $4.7 billion to an increase in contributions of less than $1 billion.
Table 4
Estimated Impact of Public Act 94-0004 Total Projected State Contributions for FY 2006 – FY 2045
Prepared by CGFA – Additional P.A. 94-0004 Provisions and CGFA Assumptions (Millions $)
State Contributions
TRS
SERS
SURS
JRS
GARS
Total
Pre P.A. 94-0004 $164,555 $68,065 $61,184 $6,538 $862 $301,204 P.A. 94-0004 156,021 78,068 60,531 6,654 877 302,151
Difference (8,534) 10,003 (643) 116 15 947 FY 2045 Liability
Reduction
$30,449
$667
$11,690
$0
$0
$42,806
-26-
The Estimated Impact of the SURS Money Purchase Interest Rate At the August 23, 2005 meeting of the Commission on Government Fore-casting and Accountability, the Commission presented SURS estimates based on a money purchase interest rate of 9.0%, 7.5% and 6.0% in order to provide a range for the impact of allowing the State Comptroller to set the money purchase interest rate, rather than allowing the SURS Board of Trustees to set the interest rate. The current money purchase interest rate assumption used by SURS’ actuary is 9%, while the statutory rate for the TRS money purchase option is 6%. The 7.5% rate was used to provide an example of the impact of 1.5% drop from the current assumption and is also the midpoint between the current SURS money purchase interest rate assumption and the statutory TRS rate. If the 7.5% money purchase interest rate is used in the SURS projections, the Commission’s actuary estimates that required State contributions to SURS would decrease by an estimated $4.66 billion over the life of the funding plan, rather than the $653 million decrease (from Table 1) when a 9% money purchase interest rate is used. When the 6% money purchase interest rate is used, the required State contributions to
SURS decrease by an estimated $8.0 billion. On August 31, 2005 the Comptroller set the SURS money purchase interest rate at 8.5% for 2006 (September 1, 2005 through August 31, 2006) and 8.0% for 2007 (September 1, 2006 through August 31, 2007). If the interest rate assumption is changed during an SURS experience analysis, the impact of P.A. 94-0004 will also change significantly. For every ½% drop in the money purchase interest rate assumption, the required State contributions to SURS will drop by approximately $1.3 billion over the life of the funding plan (FY 2006 through FY 2045). The next SURS experience analysis will be in FY 2007. The FY 2005 Actuarial Valuations The five State-funded retirement systems will release the FY 2005 actuarial valuations in November of 2005. The Commission on Government Forecasting and Accountability will compile the systems’ information and request or prepare any additional information that may be useful in the analysis of the long-term impact of Public Act 94-0004. The Commission hopes to release a comprehensive report on Public Act 94-0004 and the overall condition of the State-funded retirement systems before the end of calendar year 2005.