Embed Size (px)
Citation preview
Commission on Local Government
Regular MeetingNovember 4, 2021 11:00 A.M.
Henrico County Economic Development Authority
& Virtually through Google Meet
Standard Meeting Rules: (1) this meeting is being recorded, (2) please state your name before speaking, and (3) please mute yourself when not speaking (Ctrl + D on your keyboard or *6 on phones)
Roll Call Vote of Members of the CommissionDr. Davis
Standard Meeting Rules: (1) this meeting is being recorded, (2) please state your name before speaking, and (3) please mute yourself when not speaking (Ctrl + D on your keyboard or *6 on phones)
Approval of the Draft AgendaDr. Davis
This item requires Commission approval.
Standard Meeting Rules: (1) this meeting is being recorded, (2) please state your name before speaking, and (3) please mute yourself when not speaking (Ctrl + D on your keyboard or *6 on phones)
Approval of Minutes from the Special Meeting on October 15, 2021Dr. Davis
This item requires Commission approval.
Standard Meeting Rules: (1) this meeting is being recorded, (2) please state your name before speaking, and (3) please mute yourself when not speaking (Ctrl + D on your keyboard or *6 on phones)
Public Comment PeriodDr. Davis
Standard Meeting Rules: (1) this meeting is being recorded, (2) please state your name before speaking, and (3) please mute yourself when not speaking (Ctrl + D on your keyboard or *6 on phones)

Policy Administrator’s ReportMr. Conmy
Standard Meeting Rules: (1) this meeting is being recorded, (2) please state your name before speaking, and (3) please mute yourself when not speaking (Ctrl + D on your keyboard or *6 on phones)

Mandatory Property Tax Exemption StudyStaff Presentation of Draft ReportAll Staff
Standard Meeting Rules: (1) this meeting is being recorded, (2) please state your name before speaking, and (3) please mute yourself when not speaking (Ctrl + D on your keyboard or *6 on phones)
Partners for Better Communities
Mandatory Property Tax Exemption Study
November 4th, 2021
Partners for Better Communities
SCOPE OF STUDY:
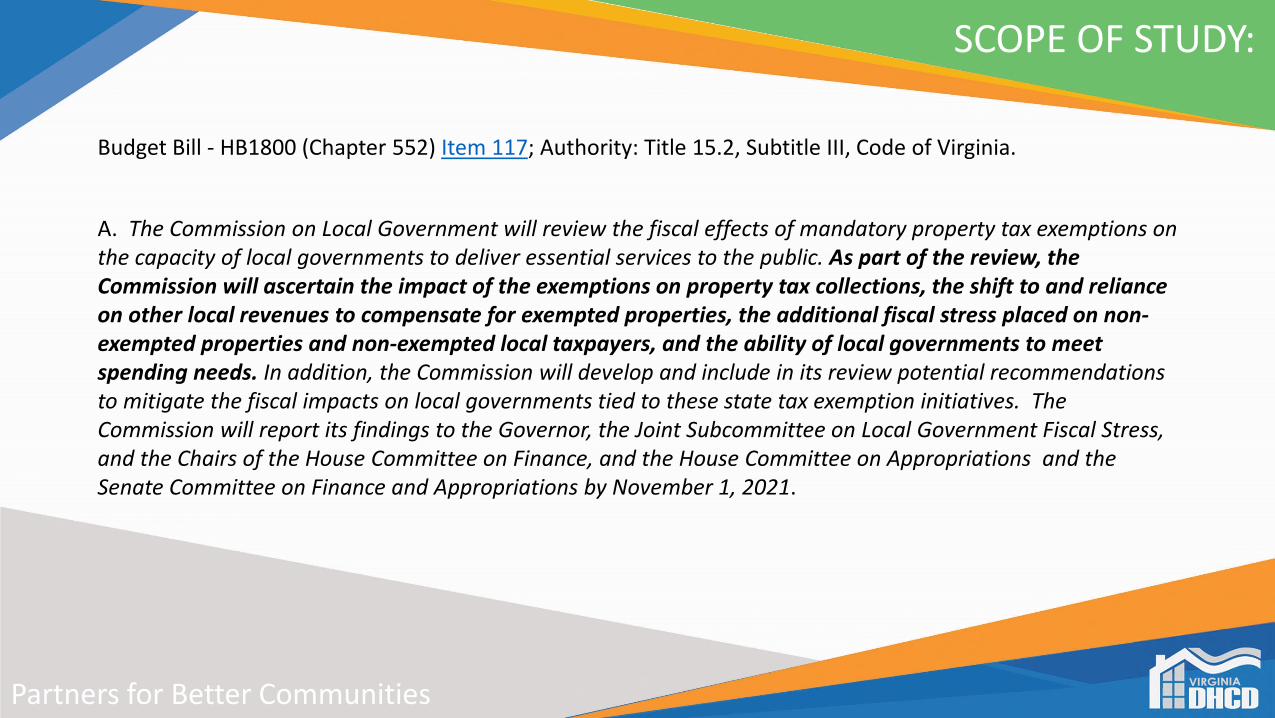
Budget Bill - HB1800 (Chapter 552) Item 117; Authority: Title 15.2, Subtitle III, Code of Virginia.
A. The Commission on Local Government will review the fiscal effects of mandatory property tax exemptions on the capacity of local governments to deliver essential services to the public. As part of the review, the Commission will ascertain the impact of the exemptions on property tax collections, the shift to and reliance on other local revenues to compensate for exempted properties, the additional fiscal stress placed on non-exempted properties and non-exempted local taxpayers, and the ability of local governments to meet spending needs. In addition, the Commission will develop and include in its review potential recommendations to mitigate the fiscal impacts on local governments tied to these state tax exemption initiatives. The Commission will report its findings to the Governor, the Joint Subcommittee on Local Government Fiscal Stress, and the Chairs of the House Committee on Finance, and the House Committee on Appropriations and the Senate Committee on Finance and Appropriations by November 1, 2021.
Partners for Better Communities
SCOPE OF STUDY
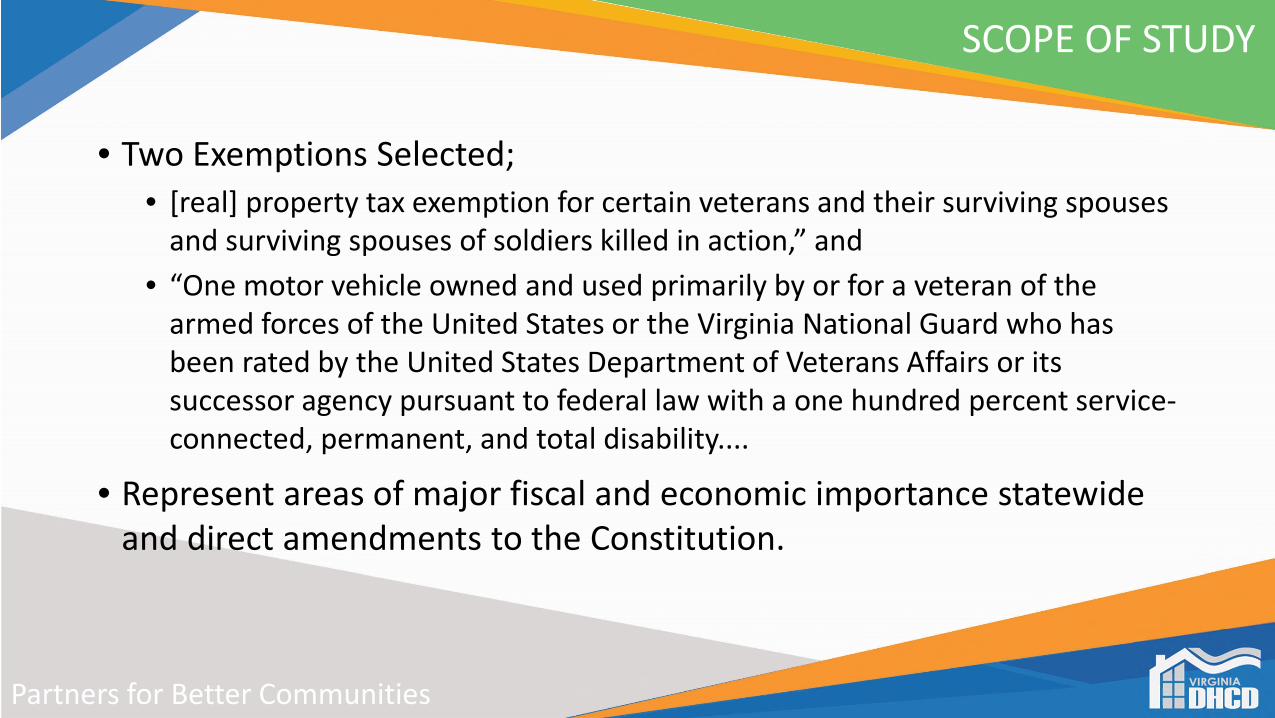
• Two Exemptions Selected;• [real] property tax exemption for certain veterans and their surviving spouses
and surviving spouses of soldiers killed in action,” and
• “One motor vehicle owned and used primarily by or for a veteran of the armed forces of the United States or the Virginia National Guard who has been rated by the United States Department of Veterans Affairs or its successor agency pursuant to federal law with a one hundred percent service-connected, permanent, and total disability....
• Represent areas of major fiscal and economic importance statewide and direct amendments to the Constitution.
Partners for Better Communities
SCOPE OF STUDY
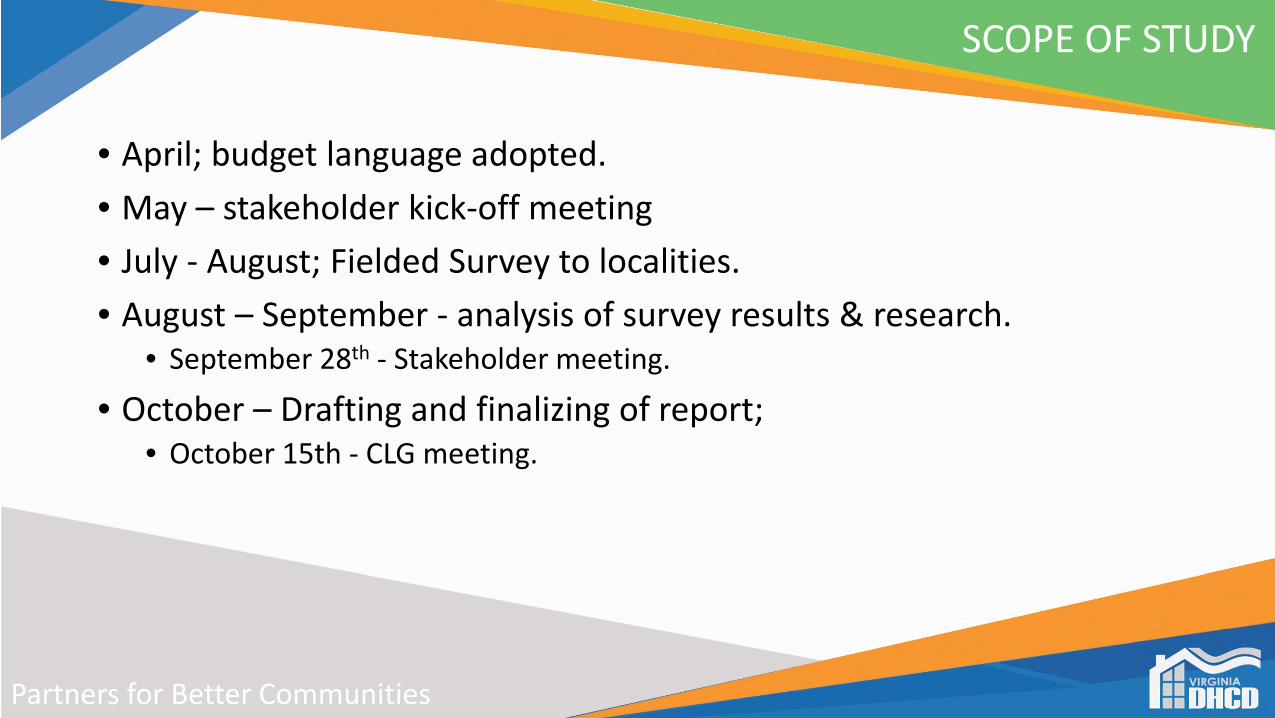
• April; budget language adopted.
• May – stakeholder kick-off meeting
• July - August; Fielded Survey to localities.
• August – September - analysis of survey results & research. • September 28th - Stakeholder meeting.
• October – Drafting and finalizing of report; • October 15th - CLG meeting.
Partners for Better Communities
DATA ANALYSIS
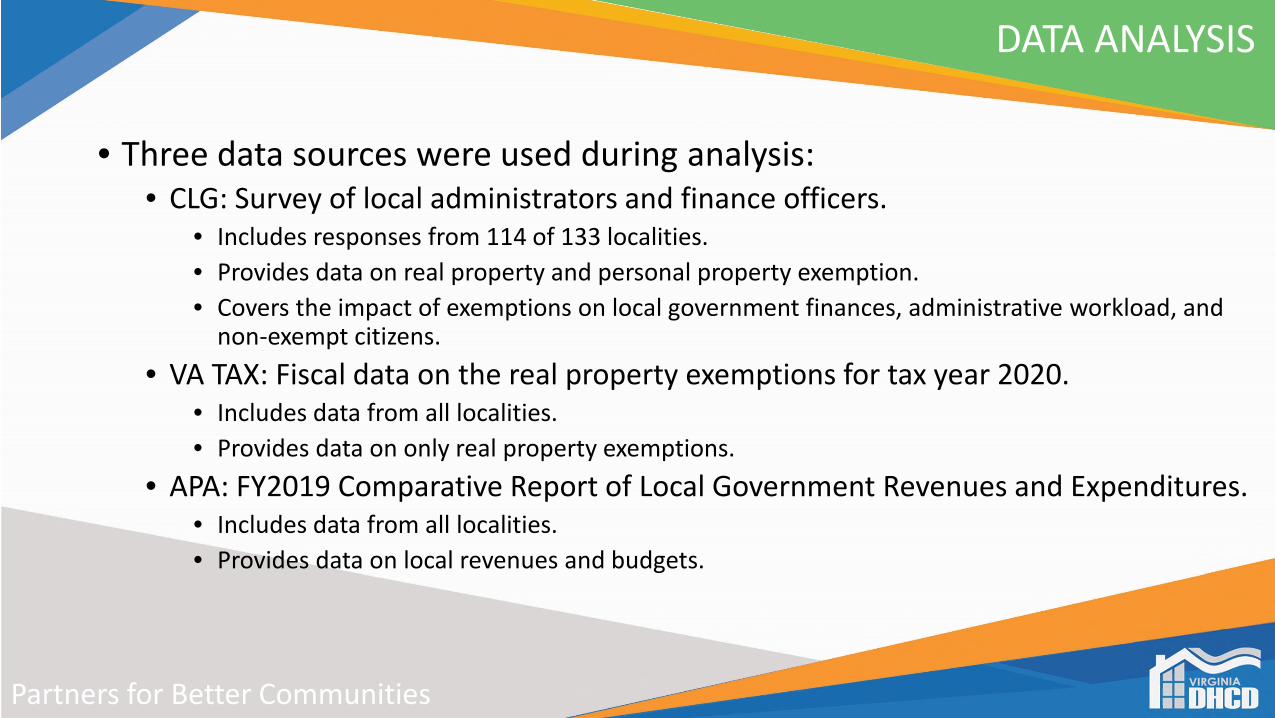
• Three data sources were used during analysis:• CLG: Survey of local administrators and finance officers.
• Includes responses from 114 of 133 localities.
• Provides data on real property and personal property exemption.
• Covers the impact of exemptions on local government finances, administrative workload, and non-exempt citizens.
• VA TAX: Fiscal data on the real property exemptions for tax year 2020. • Includes data from all localities.
• Provides data on only real property exemptions.
• APA: FY2019 Comparative Report of Local Government Revenues and Expenditures.• Includes data from all localities.
• Provides data on local revenues and budgets.
Partners for Better Communities
ANALYSIS PARAMETERS
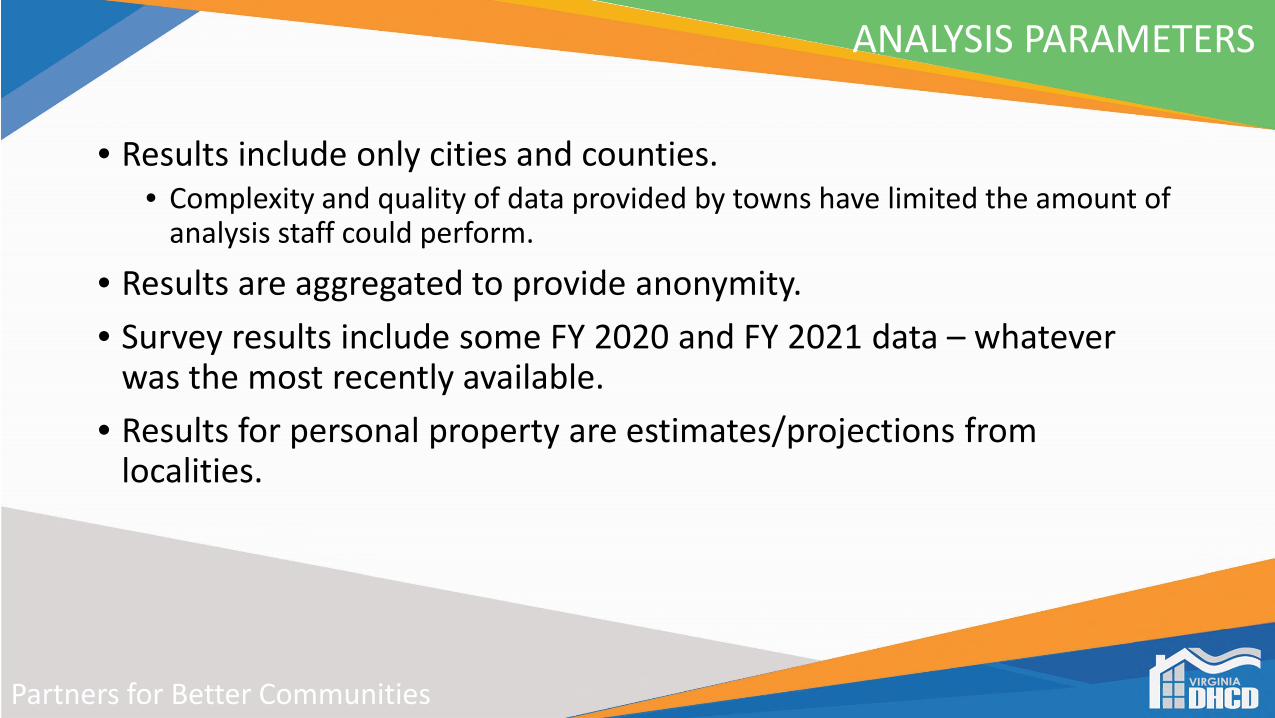
• Results include only cities and counties.• Complexity and quality of data provided by towns have limited the amount of
analysis staff could perform.
• Results are aggregated to provide anonymity.
• Survey results include some FY 2020 and FY 2021 data – whatever was the most recently available.
• Results for personal property are estimates/projections from localities.
Partners for Better Communities
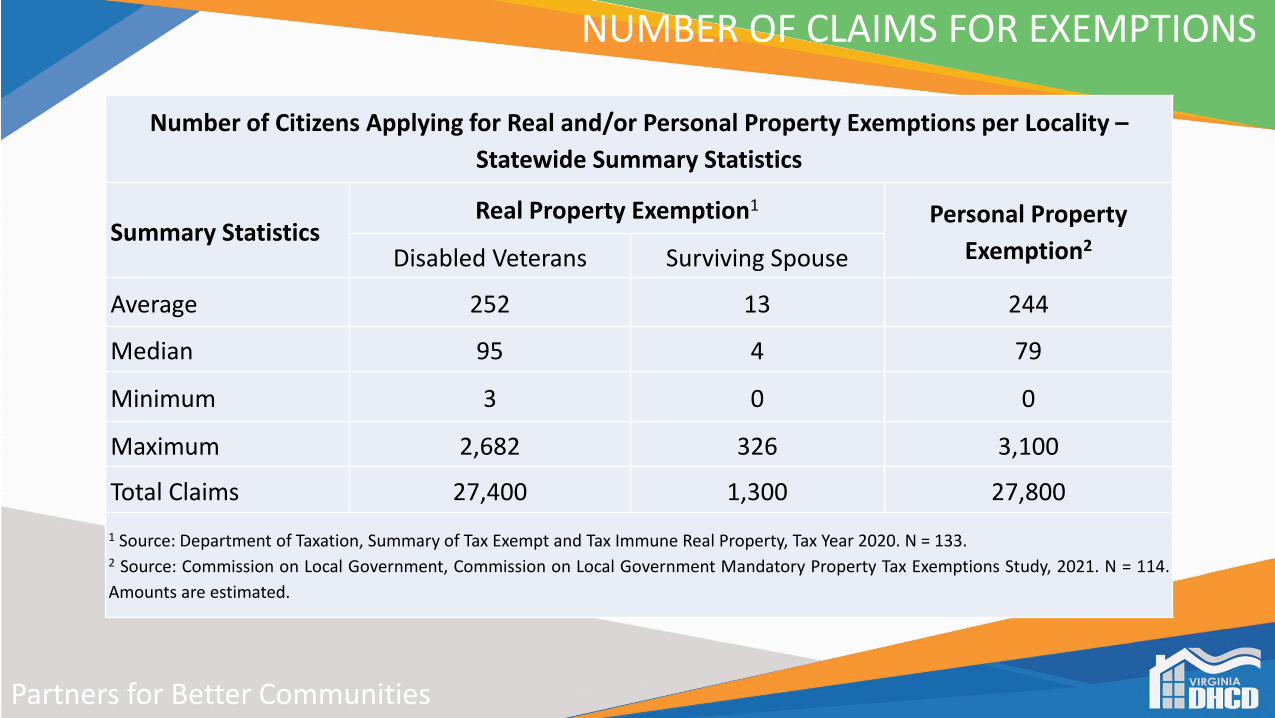
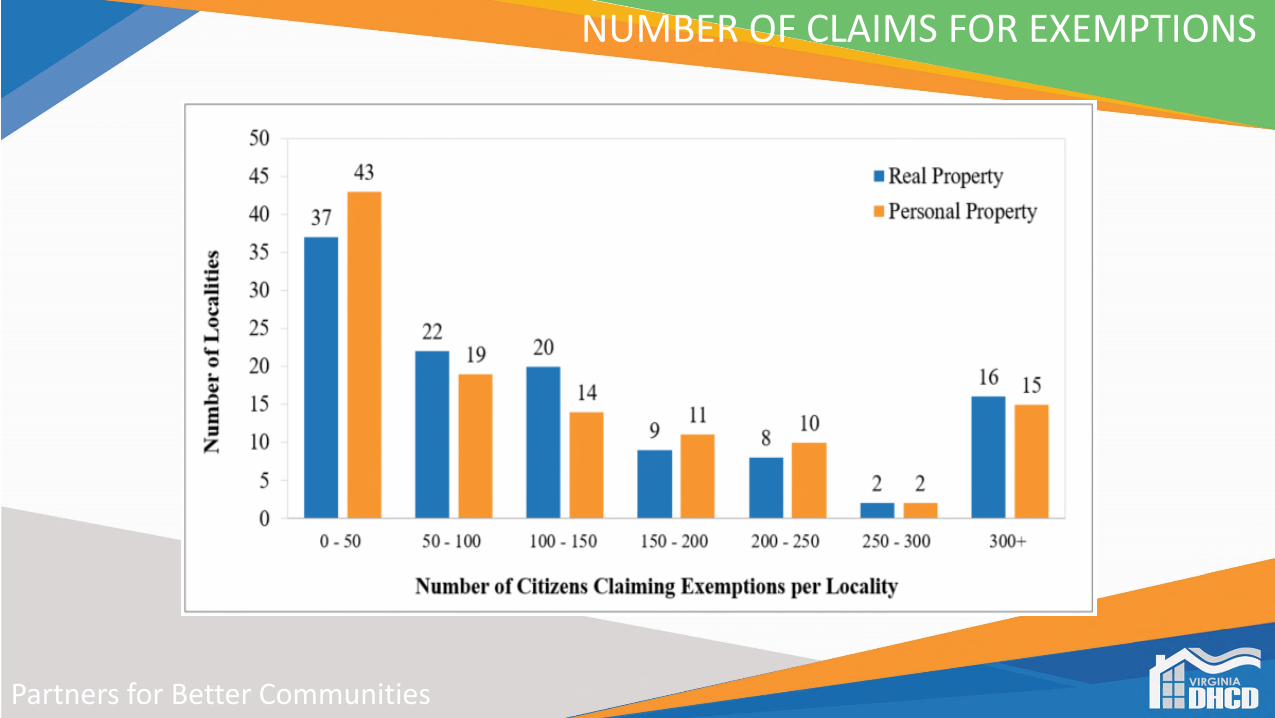
NUMBER OF CLAIMS FOR EXEMPTIONS
Number of Citizens Applying for Real and/or Personal Property Exemptions per Locality –
Statewide Summary Statistics
Summary StatisticsReal Property Exemption1 Personal Property
Exemption2Disabled Veterans Surviving Spouse
Average 252 13 244
Median 95 4 79
Minimum 3 0 0
Maximum 2,682 326 3,100
Total Claims 27,400 1,300 27,800
1 Source: Department of Taxation, Summary of Tax Exempt and Tax Immune Real Property, Tax Year 2020. N = 133.2 Source: Commission on Local Government, Commission on Local Government Mandatory Property Tax Exemptions Study, 2021. N = 114.
Amounts are estimated.
Partners for Better Communities
NUMBER OF CLAIMS FOR EXEMPTIONS
Partners for Better Communities
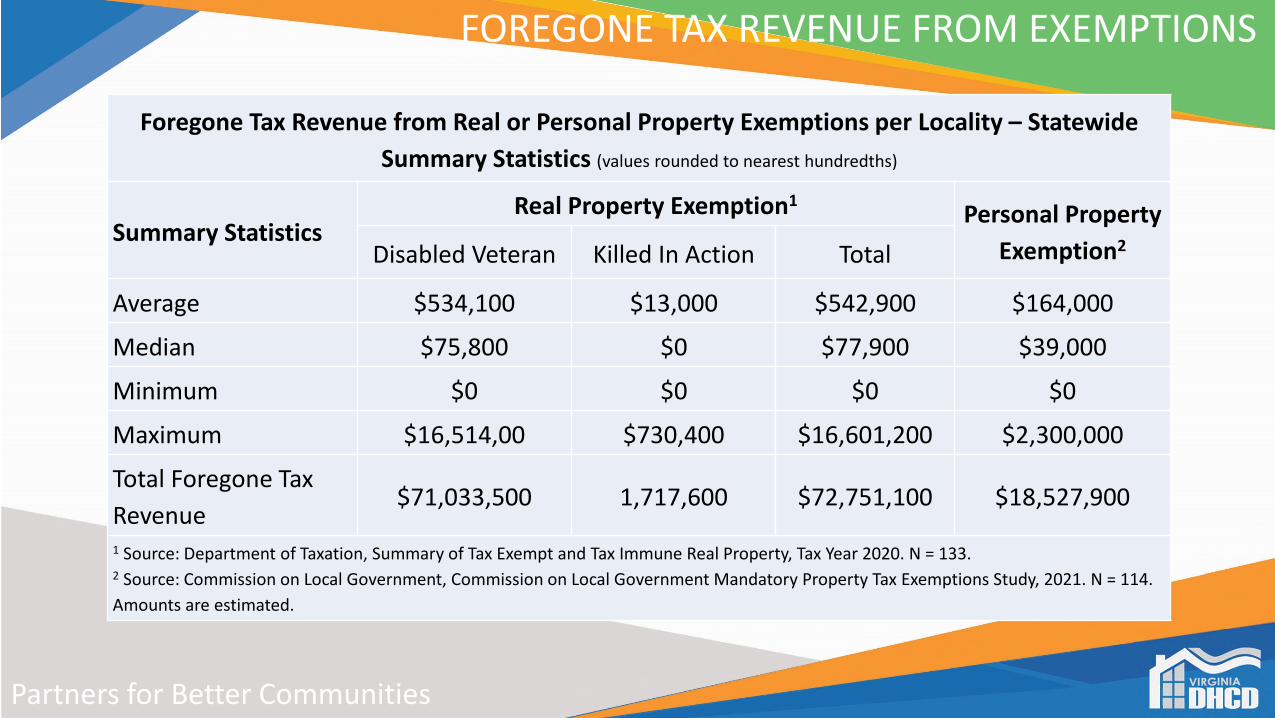
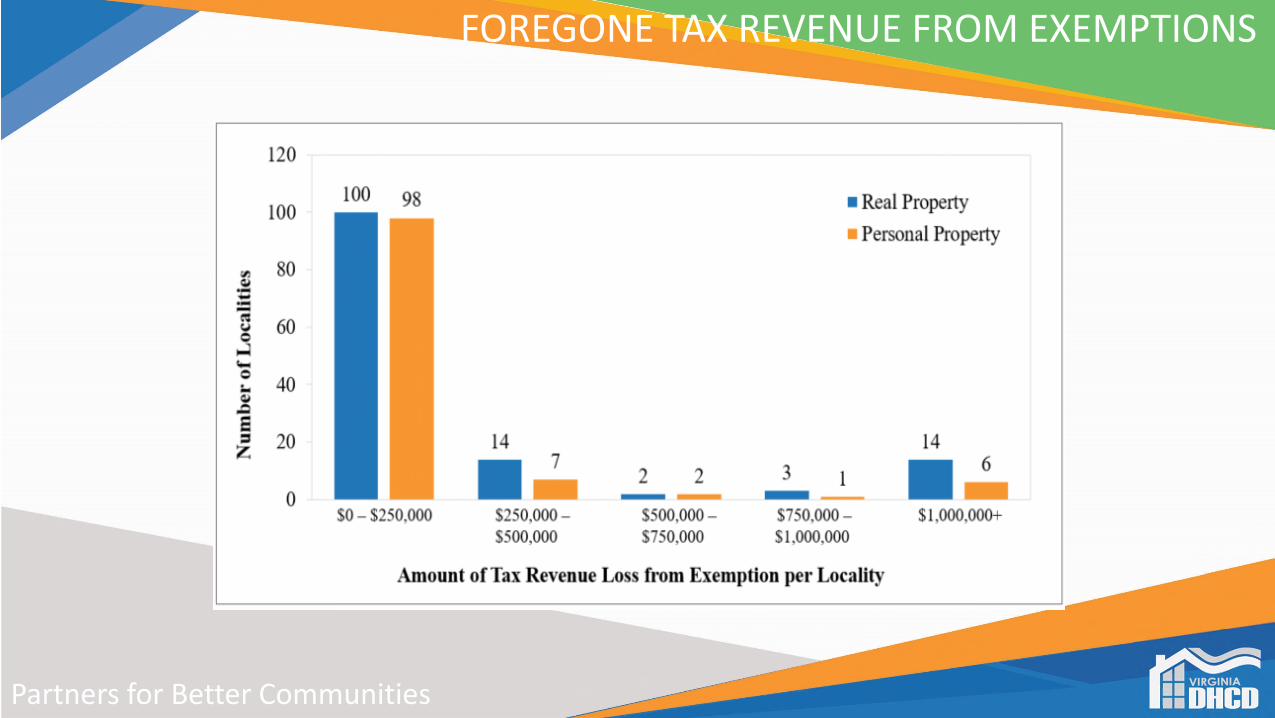
FOREGONE TAX REVENUE FROM EXEMPTIONS
Foregone Tax Revenue from Real or Personal Property Exemptions per Locality – Statewide
Summary Statistics (values rounded to nearest hundredths)
Summary StatisticsReal Property Exemption1
Personal Property
Exemption2Disabled Veteran Killed In Action Total
Average $534,100 $13,000 $542,900 $164,000
Median $75,800 $0 $77,900 $39,000
Minimum $0 $0 $0 $0
Maximum $16,514,00 $730,400 $16,601,200 $2,300,000
Total Foregone Tax
Revenue $71,033,500 1,717,600 $72,751,100 $18,527,900
1 Source: Department of Taxation, Summary of Tax Exempt and Tax Immune Real Property, Tax Year 2020. N = 133.2 Source: Commission on Local Government, Commission on Local Government Mandatory Property Tax Exemptions Study, 2021. N = 114.
Amounts are estimated.
Partners for Better Communities
FOREGONE TAX REVENUE FROM EXEMPTIONS
Partners for Better Communities
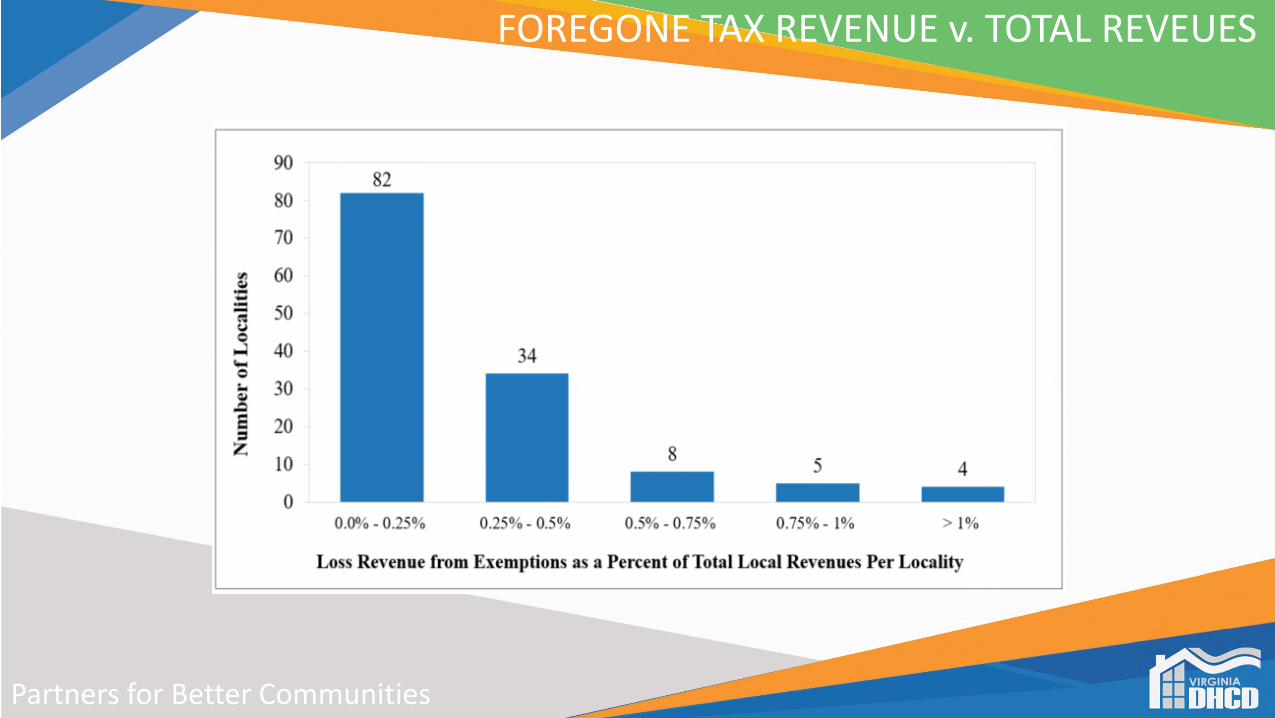
FOREGONE TAX REVENUE v. TOTAL REVEUES
Partners for Better Communities
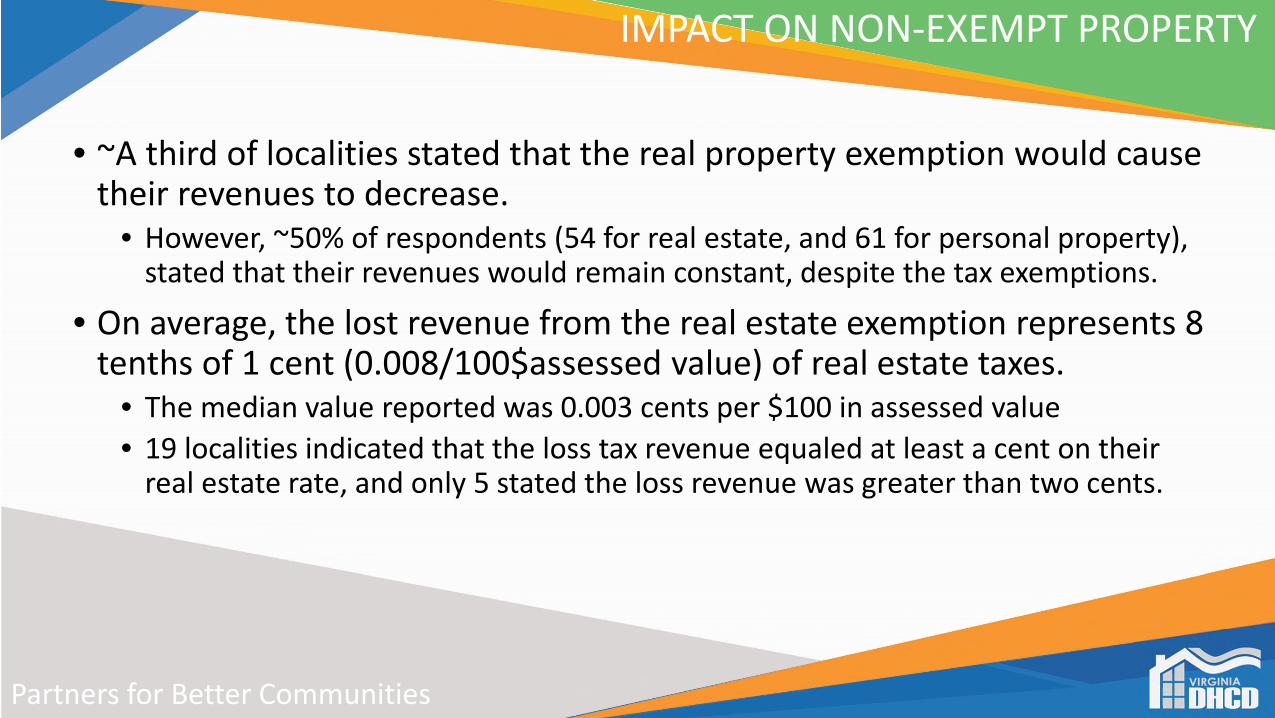
IMPACT ON NON-EXEMPT PROPERTY
• ~A third of localities stated that the real property exemption would cause their revenues to decrease.
• However, ~50% of respondents (54 for real estate, and 61 for personal property), stated that their revenues would remain constant, despite the tax exemptions.
• On average, the lost revenue from the real estate exemption represents 8 tenths of 1 cent (0.008/100$assessed value) of real estate taxes.
• The median value reported was 0.003 cents per $100 in assessed value
• 19 localities indicated that the loss tax revenue equaled at least a cent on their real estate rate, and only 5 stated the loss revenue was greater than two cents.
Partners for Better Communities
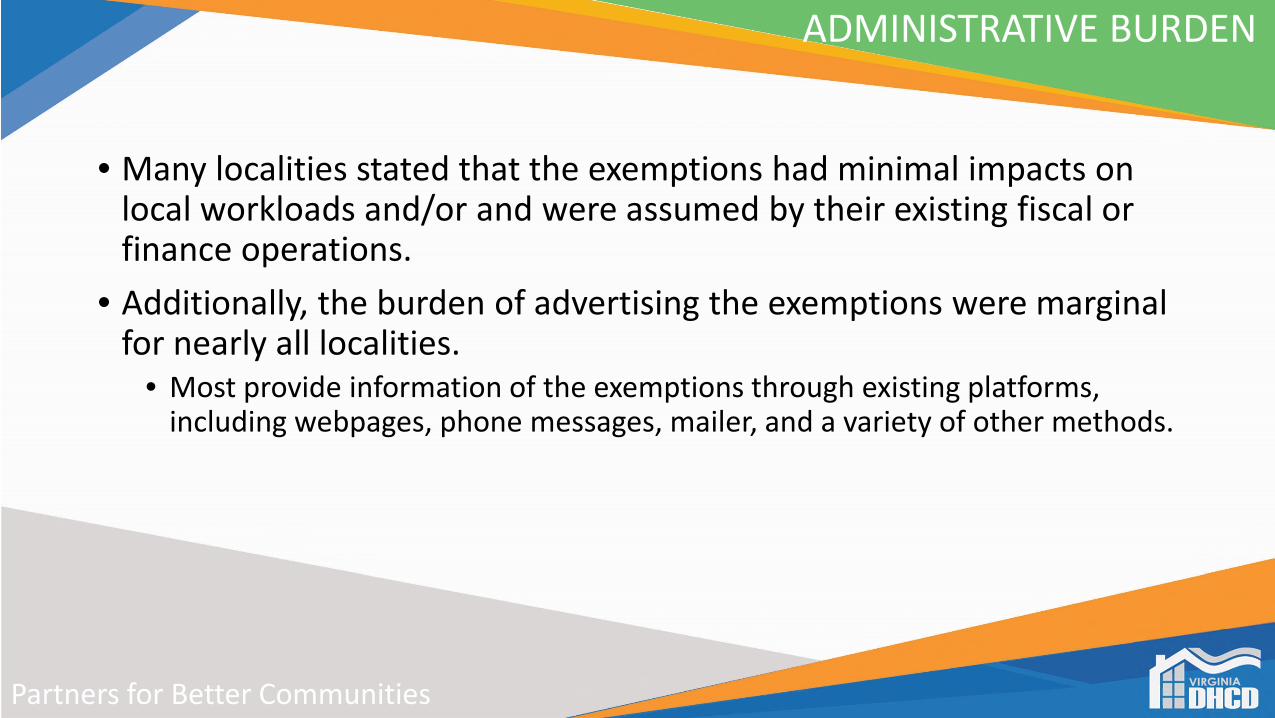
ADMINISTRATIVE BURDEN
• Many localities stated that the exemptions had minimal impacts on local workloads and/or and were assumed by their existing fiscal or finance operations.
• Additionally, the burden of advertising the exemptions were marginal for nearly all localities.
• Most provide information of the exemptions through existing platforms, including webpages, phone messages, mailer, and a variety of other methods.
Partners for Better Communities
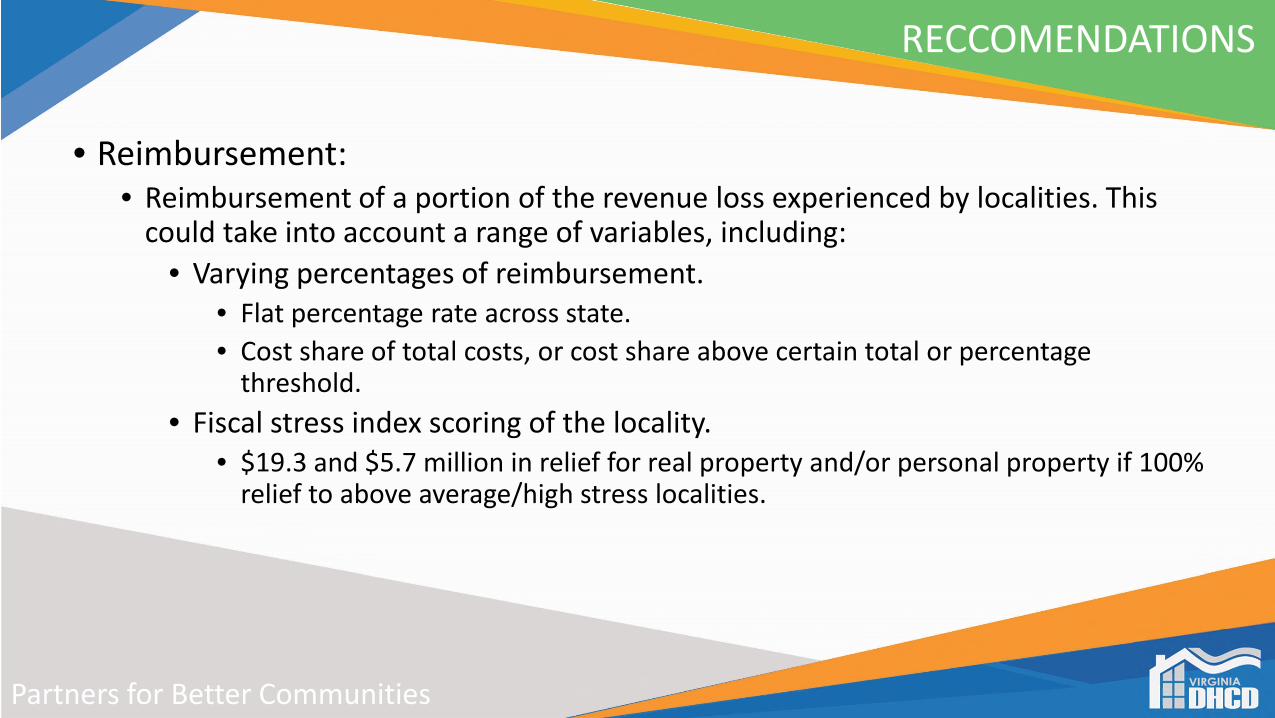
RECCOMENDATIONS
• Reimbursement:• Reimbursement of a portion of the revenue loss experienced by localities. This
could take into account a range of variables, including:
• Varying percentages of reimbursement. • Flat percentage rate across state.
• Cost share of total costs, or cost share above certain total or percentage threshold.
• Fiscal stress index scoring of the locality.• $19.3 and $5.7 million in relief for real property and/or personal property if 100%
relief to above average/high stress localities.
Partners for Better Communities
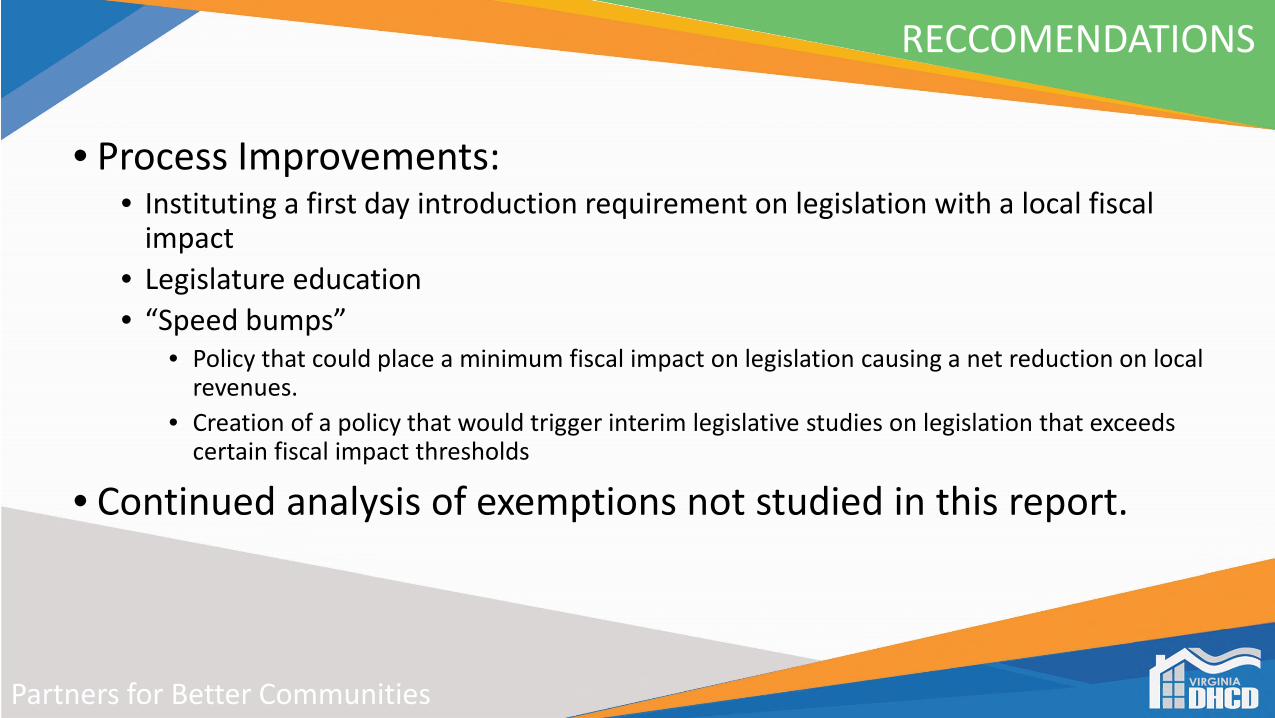
RECCOMENDATIONS
• Process Improvements: • Instituting a first day introduction requirement on legislation with a local fiscal
impact
• Legislature education
• “Speed bumps” • Policy that could place a minimum fiscal impact on legislation causing a net reduction on local
revenues.
• Creation of a policy that would trigger interim legislative studies on legislation that exceeds certain fiscal impact thresholds
• Continued analysis of exemptions not studied in this report.
Mandatory Property Tax Exemption StudyCommission Deliberation and ActionDr. Davis
This item requires Commission approval.
Standard Meeting Rules: (1) this meeting is being recorded, (2) please state your name before speaking, and (3) please mute yourself when not speaking (Ctrl + D on your keyboard or *6 on phones)
2021 Cash Proffer Survey and ReportStaff PresentationMr. Anderson
Standard Meeting Rules: (1) this meeting is being recorded, (2) please state your name before speaking, and (3) please mute yourself when not speaking (Ctrl + D on your keyboard or *6 on phones)

Cody Anderson
Policy Analyst
Virginia Department of Housing and Community Development
26
DEFINITIONS
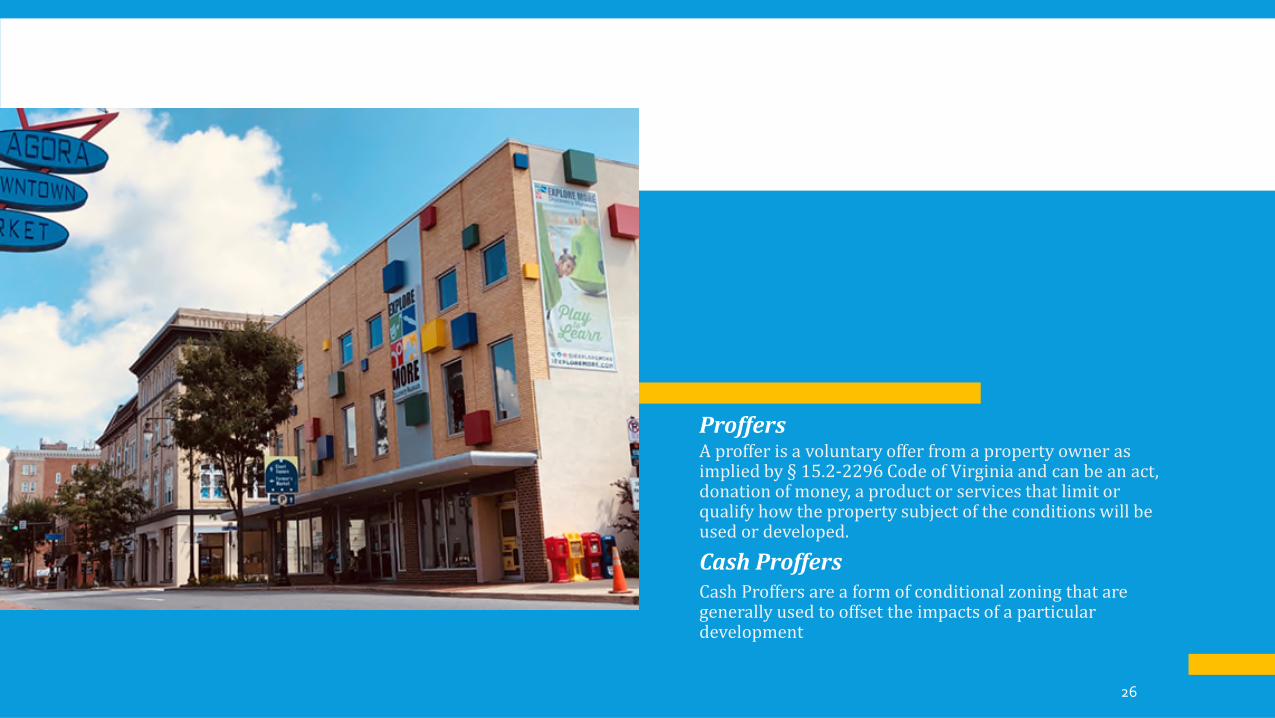
ProffersA proffer is a voluntary offer from a property owner as implied by § 15.2-2296 Code of Virginia and can be an act, donation of money, a product or services that limit or qualify how the property subject of the conditions will be used or developed.
Cash ProffersCash Proffers are a form of conditional zoning that are generally used to offset the impacts of a particular development
27
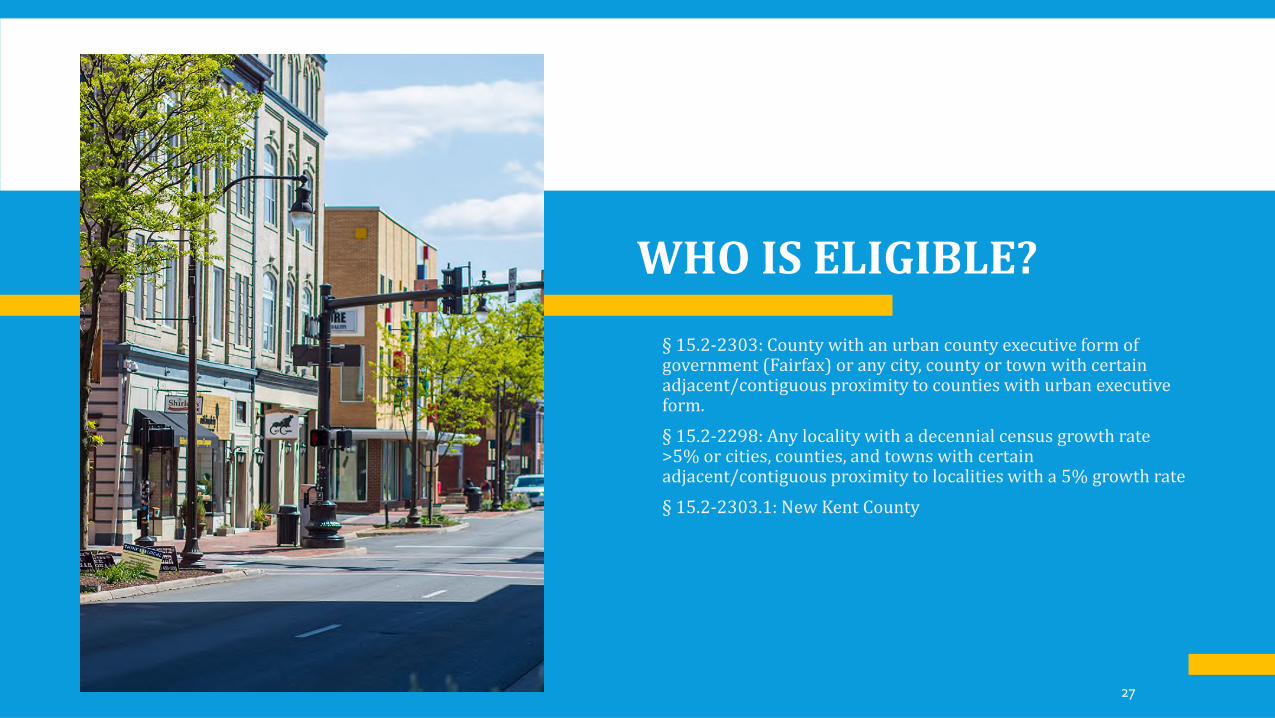
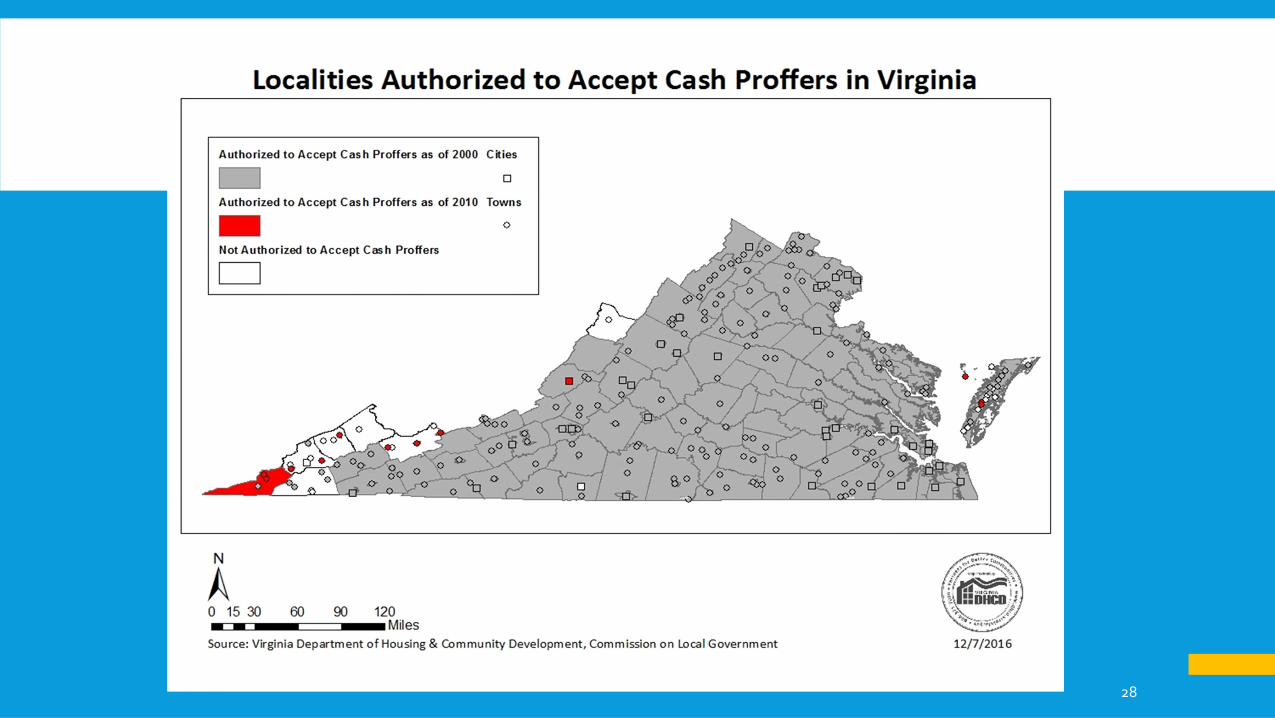
WHO IS ELIGIBLE?
§ 15.2-2303: County with an urban county executive form of government (Fairfax) or any city, county or town with certain adjacent/contiguous proximity to counties with urban executive form.
§ 15.2-2298: Any locality with a decennial census growth rate >5% or cities, counties, and towns with certain adjacent/contiguous proximity to localities with a 5% growth rate
§ 15.2-2303.1: New Kent County
28
PROFFERS
Definition
29
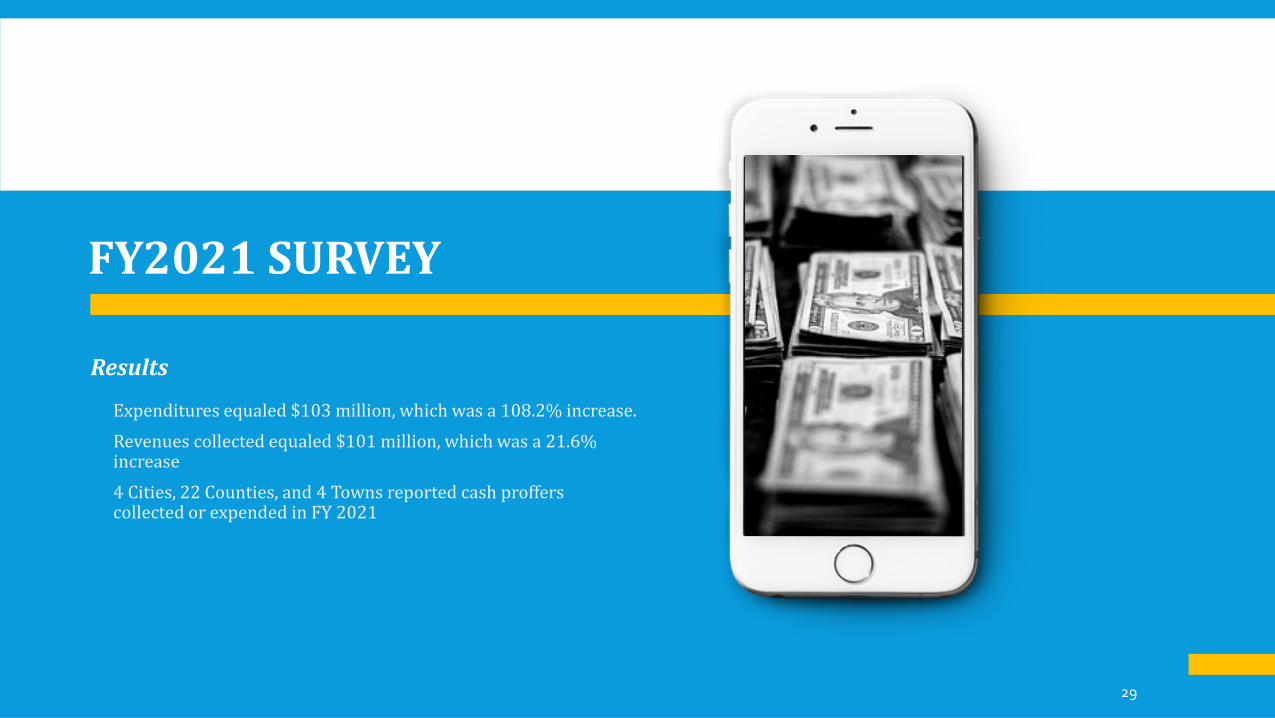
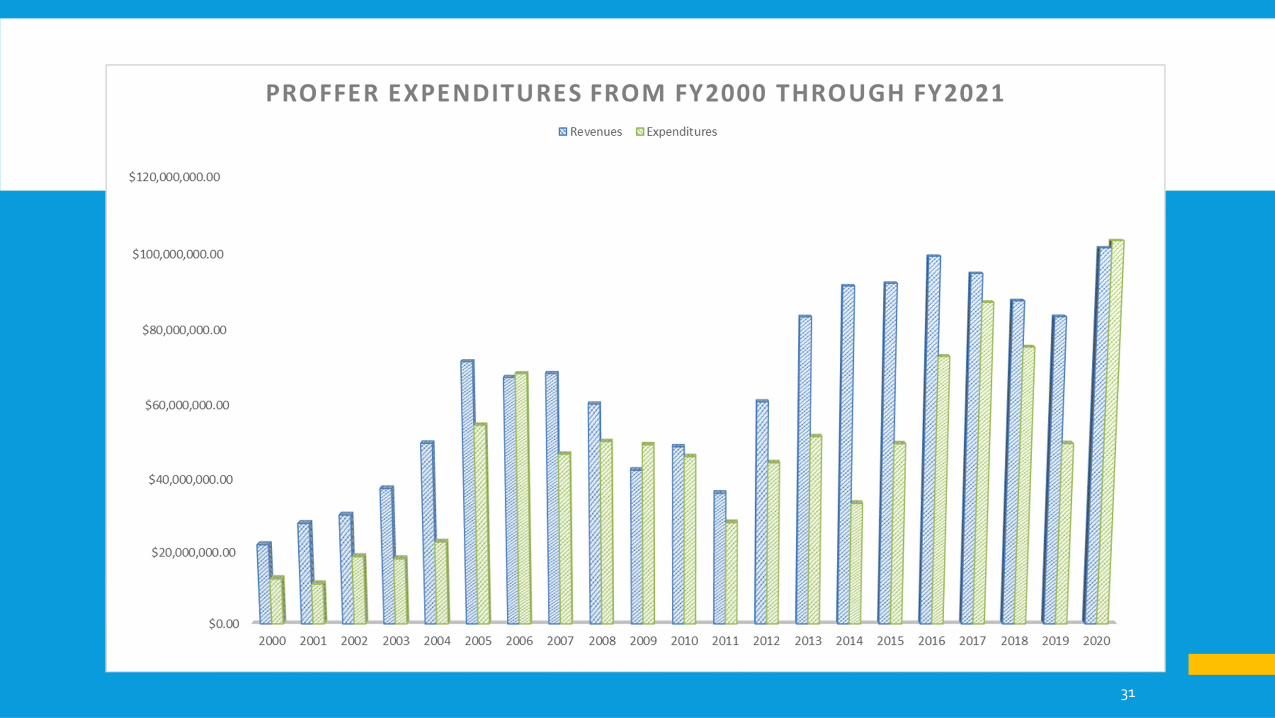
Results
Expenditures equaled $103 million, which was a 108.2% increase.
Revenues collected equaled $101 million, which was a 21.6% increase
4 Cities, 22 Counties, and 4 Towns reported cash proffers collected or expended in FY 2021
FY2021 SURVEY
30
PROFFERS
Definition
31
PROFFERS
Definition
32
PROFFERS
Definition
33
PROFFERS
Definition
34
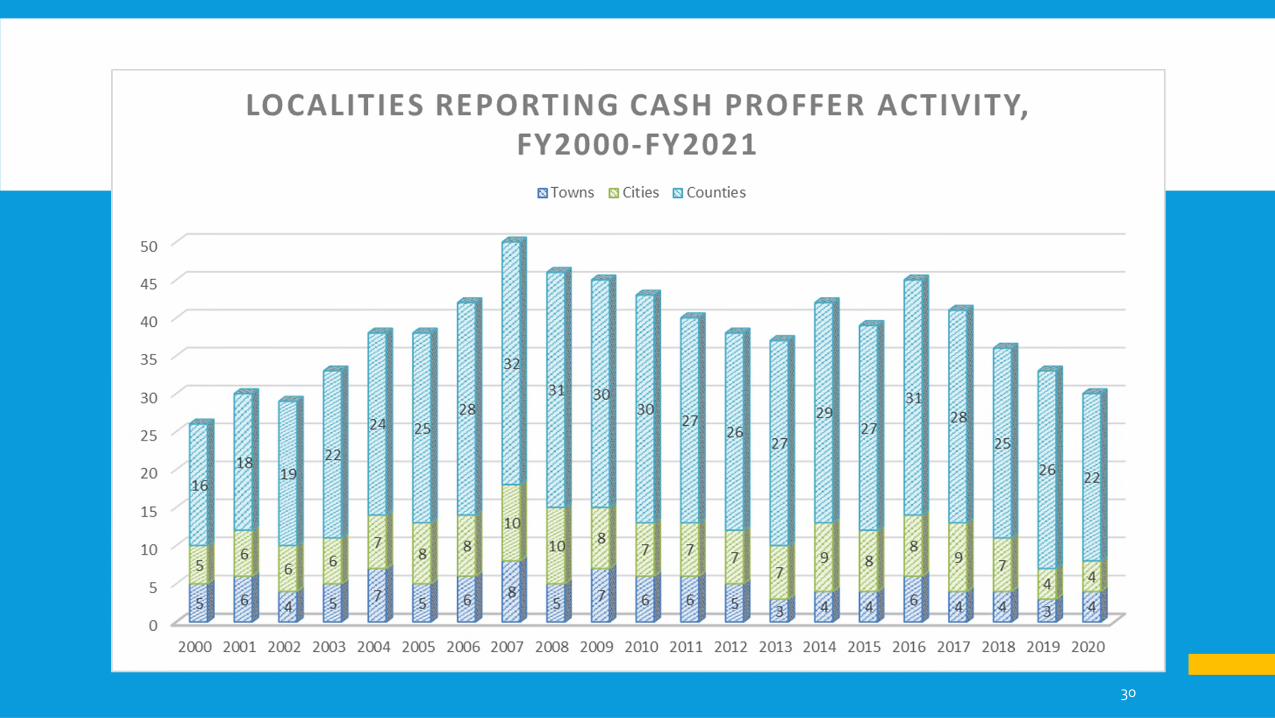
Effects of the 2019 legislation are yet to be determined. While slightly less localities utilized cash proffer collection, revenues rose substantially. It should also be noted that three localities that traditionally accepted proffers failed to complete the survey, and had they reported, the number of loclaities collecting proffers would have remained constant.
TRENDS
2019 Legislation
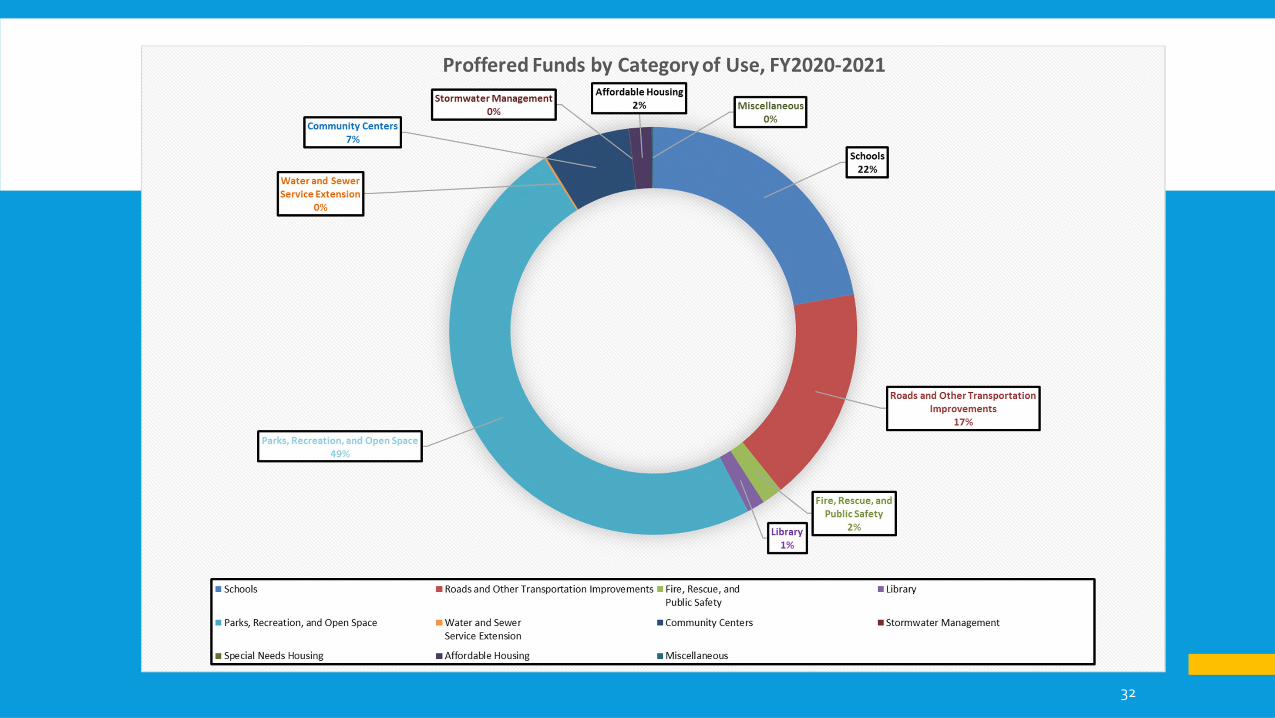
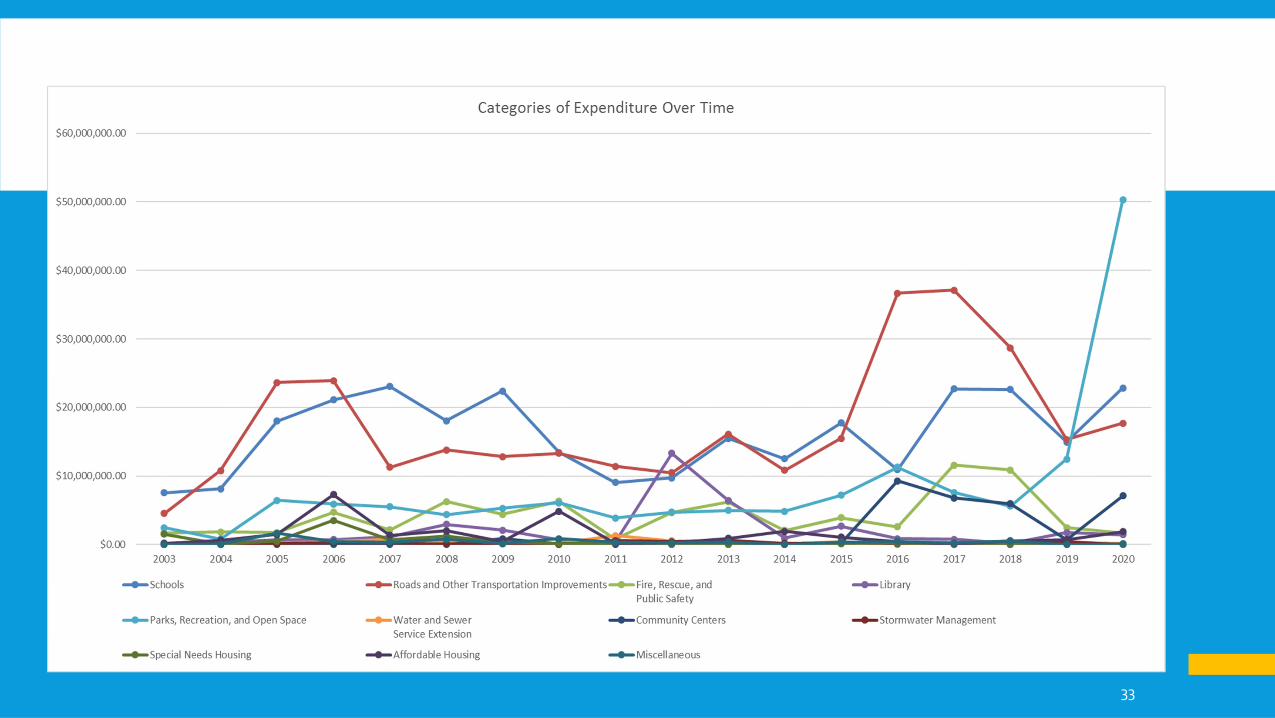
As a result of the 2016 legislative change that limited the categories which proffers may be collected for (transportation improvements, schools, public safety, and parks and recreation), three of those categories are the highest categories of expenditures. Localities have 12 years to expend collected proffers. It is also worth noting that those categories may continue to be utilized for proffers but only for commercial rezoning purposes.
Compliance
Consistent with the FY2020 data, both revenues and expenditures grew in FY2021. There was an extreme jump in expenditures, however this can be attributed to an outlier where a single locality expended over $45 million on parks, recreation, and open space. This was a dramatic climb of 48.74% in that category due to a single locality.
Revenue & Expenditures

2021 Cash Proffer Survey and ReportCommission Deliberation and ActionDr. Davis
This item requires Commission approval.
Standard Meeting Rules: (1) this meeting is being recorded, (2) please state your name before speaking, and (3) please mute yourself when not speaking (Ctrl + D on your keyboard or *6 on phones)
FY2019 Fiscal Stress ReportStaff PresentationMs. Wheaton
Standard Meeting Rules: (1) this meeting is being recorded, (2) please state your name before speaking, and (3) please mute yourself when not speaking (Ctrl + D on your keyboard or *6 on phones)
Partners for Better Communities
Fiscal Stress Report FY 2019November 4th, 2021
Partners for Better Communities
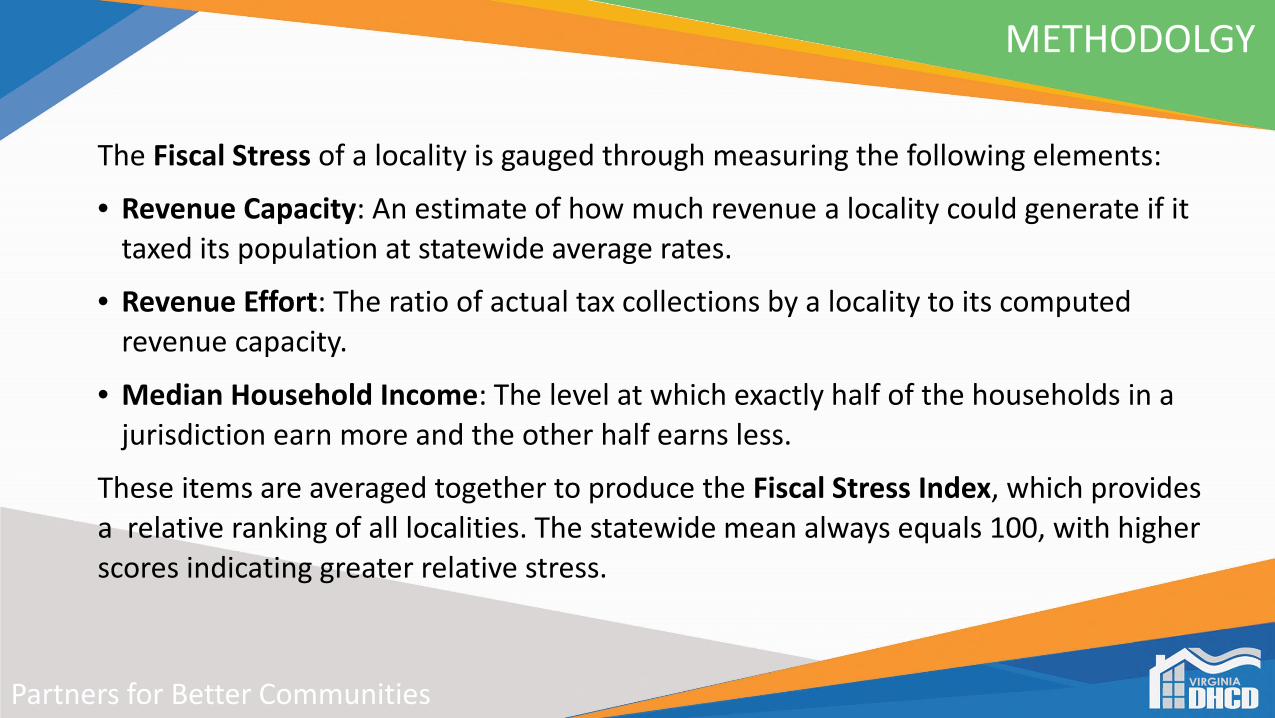
METHODOLGY
The Fiscal Stress of a locality is gauged through measuring the following elements:
• Revenue Capacity: An estimate of how much revenue a locality could generate if it taxed its population at statewide average rates.
• Revenue Effort: The ratio of actual tax collections by a locality to its computed revenue capacity.
• Median Household Income: The level at which exactly half of the households in a jurisdiction earn more and the other half earns less.
These items are averaged together to produce the Fiscal Stress Index, which provides a relative ranking of all localities. The statewide mean always equals 100, with higher scores indicating greater relative stress.
Partners for Better Communities
NOTES
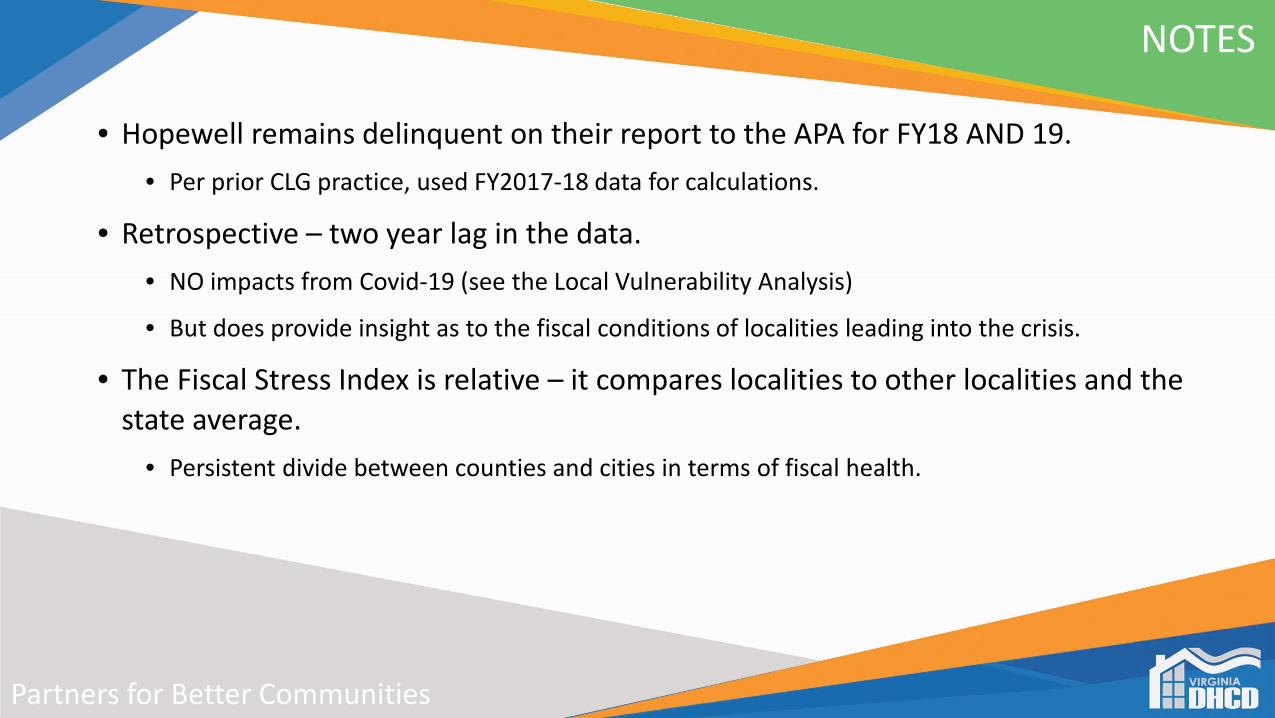
• Hopewell remains delinquent on their report to the APA for FY18 AND 19.
• Per prior CLG practice, used FY2017-18 data for calculations.
• Retrospective – two year lag in the data.
• NO impacts from Covid-19 (see the Local Vulnerability Analysis)
• But does provide insight as to the fiscal conditions of localities leading into the crisis.
• The Fiscal Stress Index is relative – it compares localities to other localities and the state average.
• Persistent divide between counties and cities in terms of fiscal health.
Partners for Better Communities
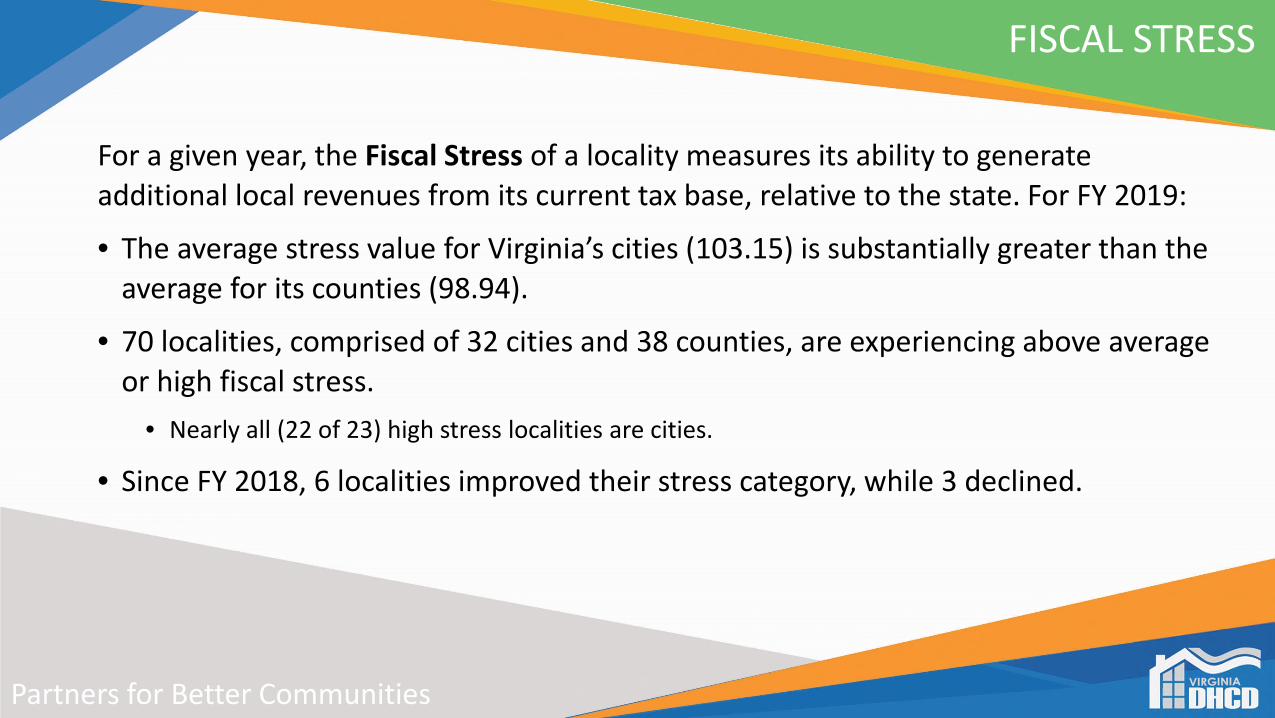
FISCAL STRESS
For a given year, the Fiscal Stress of a locality measures its ability to generate additional local revenues from its current tax base, relative to the state. For FY 2019:
• The average stress value for Virginia’s cities (103.15) is substantially greater than the average for its counties (98.94).
• 70 localities, comprised of 32 cities and 38 counties, are experiencing above average or high fiscal stress.
• Nearly all (22 of 23) high stress localities are cities.
• Since FY 2018, 6 localities improved their stress category, while 3 declined.
Partners for Better Communities
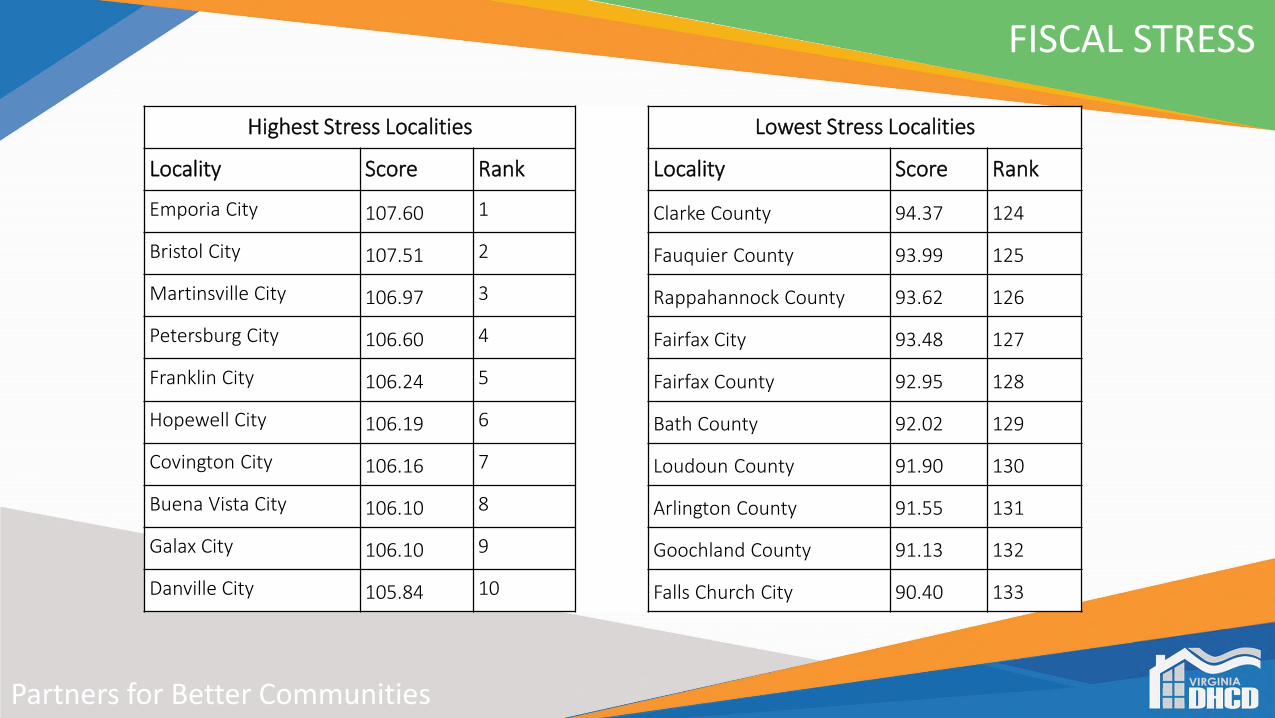
Highest Stress Localities Lowest Stress Localities
Locality Score Rank Locality Score Rank
Emporia City 107.60 1 Clarke County 94.37 124
Bristol City 107.51 2 Fauquier County 93.99 125
Martinsville City 106.97 3 Rappahannock County 93.62 126
Petersburg City 106.60 4 Fairfax City 93.48 127
Franklin City 106.24 5 Fairfax County 92.95 128
Hopewell City 106.19 6 Bath County 92.02 129
Covington City 106.16 7 Loudoun County 91.90 130
Buena Vista City 106.10 8 Arlington County 91.55 131
Galax City 106.10 9 Goochland County 91.13 132
Danville City 105.84 10 Falls Church City 90.40 133
FISCAL STRESS
Partners for Better Communities
FISCAL STRESS
Partners for Better Communities
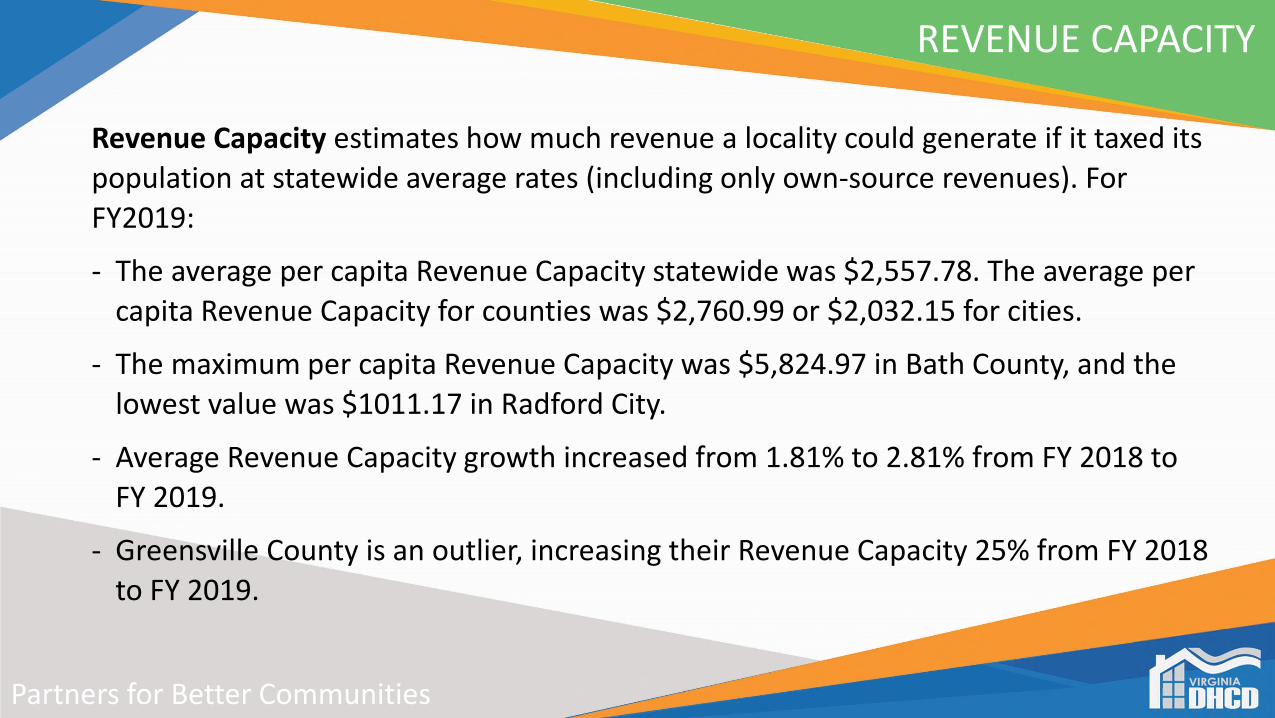
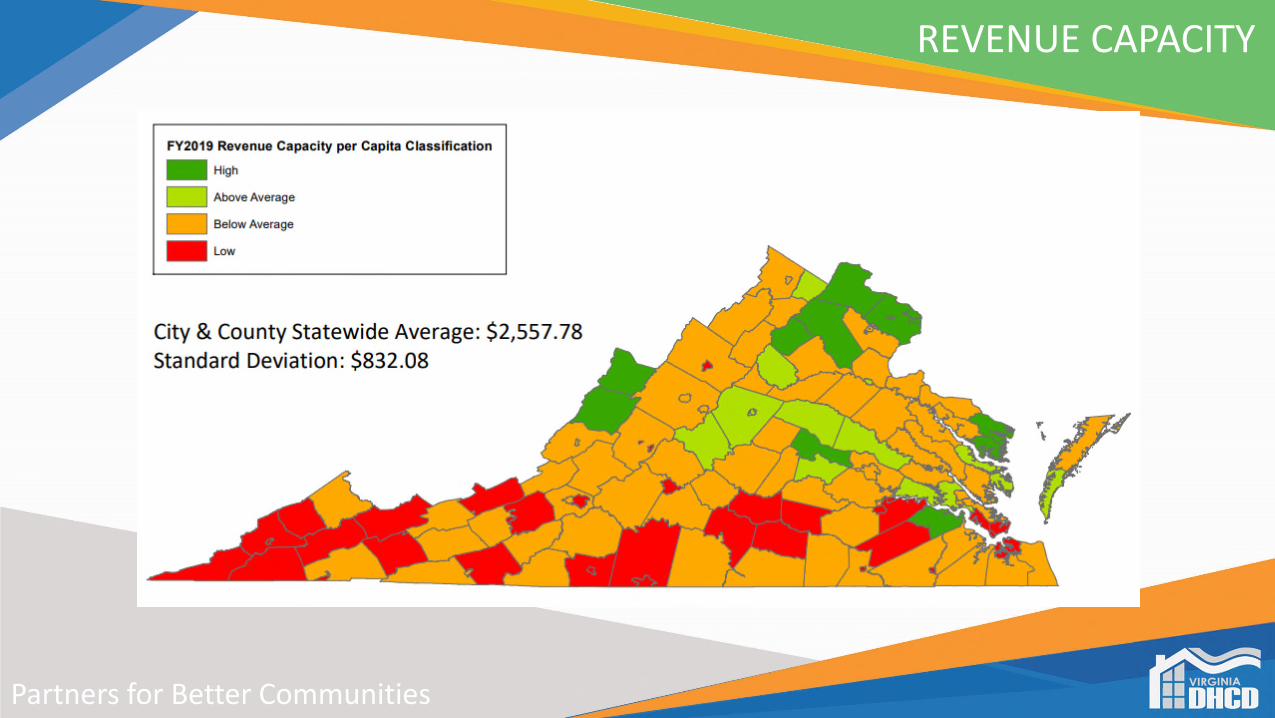
REVENUE CAPACITY
Revenue Capacity estimates how much revenue a locality could generate if it taxed its population at statewide average rates (including only own-source revenues). For FY2019:
- The average per capita Revenue Capacity statewide was $2,557.78. The average per capita Revenue Capacity for counties was $2,760.99 or $2,032.15 for cities.
- The maximum per capita Revenue Capacity was $5,824.97 in Bath County, and the lowest value was $1011.17 in Radford City.
- Average Revenue Capacity growth increased from 1.81% to 2.81% from FY 2018 to FY 2019.
- Greensville County is an outlier, increasing their Revenue Capacity 25% from FY 2018 to FY 2019.
Partners for Better Communities
REVENUE CAPACITY
Partners for Better Communities
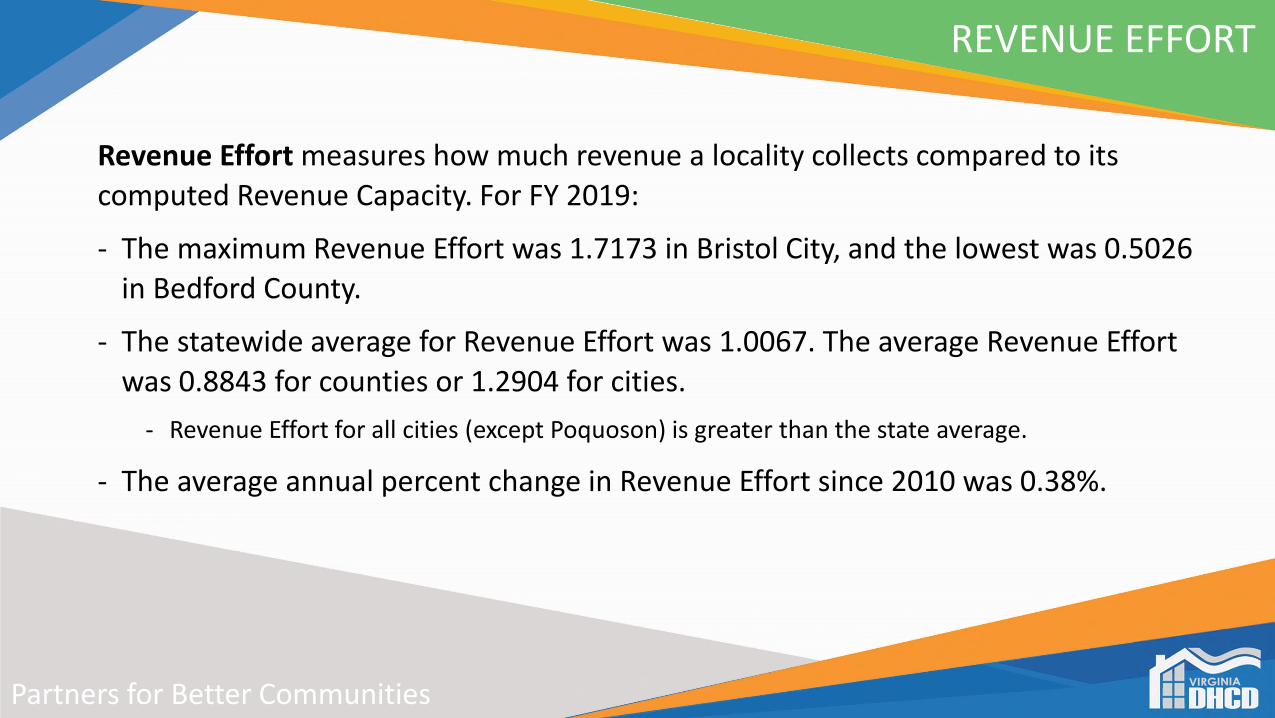
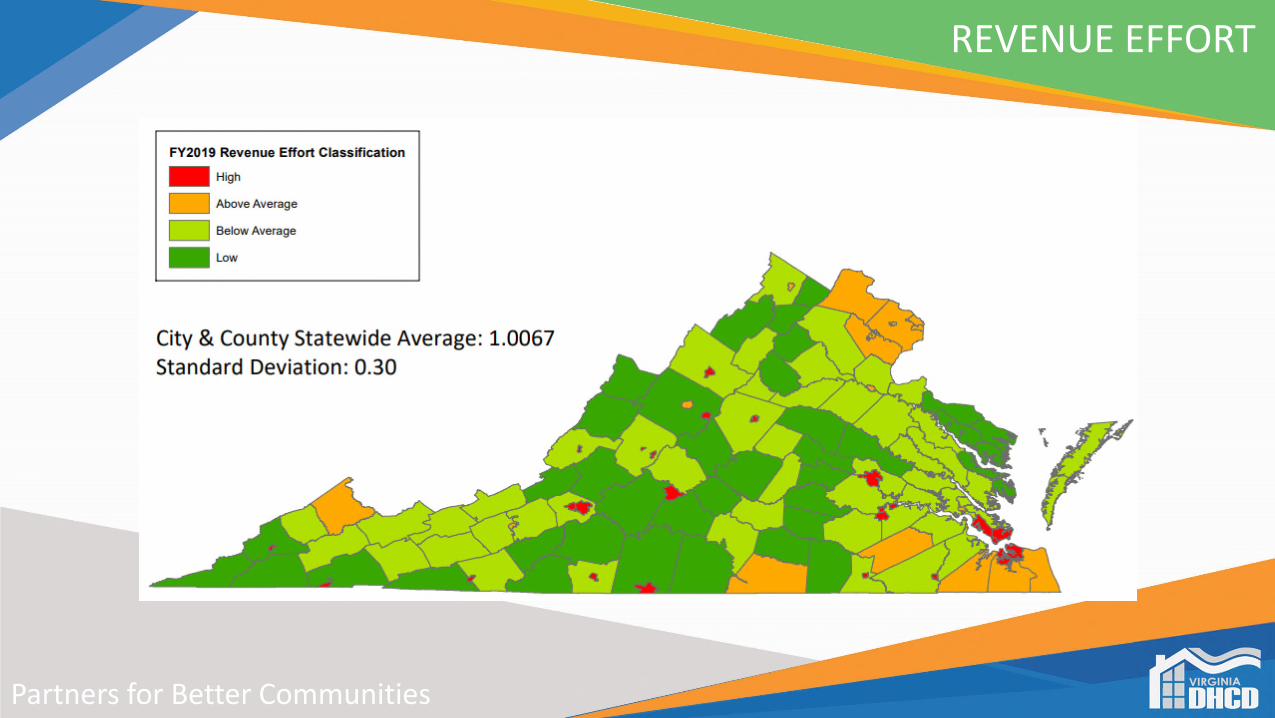
REVENUE EFFORT
Revenue Effort measures how much revenue a locality collects compared to its computed Revenue Capacity. For FY 2019:
- The maximum Revenue Effort was 1.7173 in Bristol City, and the lowest was 0.5026 in Bedford County.
- The statewide average for Revenue Effort was 1.0067. The average Revenue Effort was 0.8843 for counties or 1.2904 for cities.
- Revenue Effort for all cities (except Poquoson) is greater than the state average.
- The average annual percent change in Revenue Effort since 2010 was 0.38%.
Partners for Better Communities
REVENUE EFFORT
Partners for Better Communities
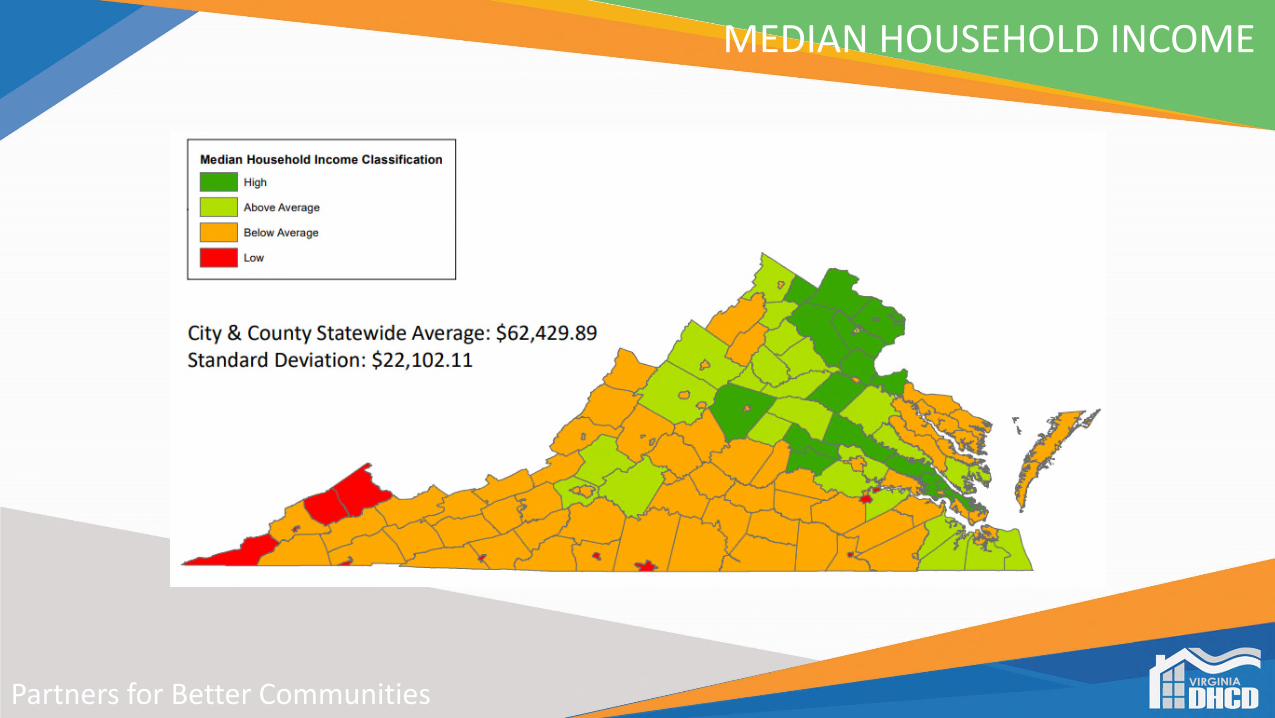
MEDIAN HOUSEHOLD INCOME
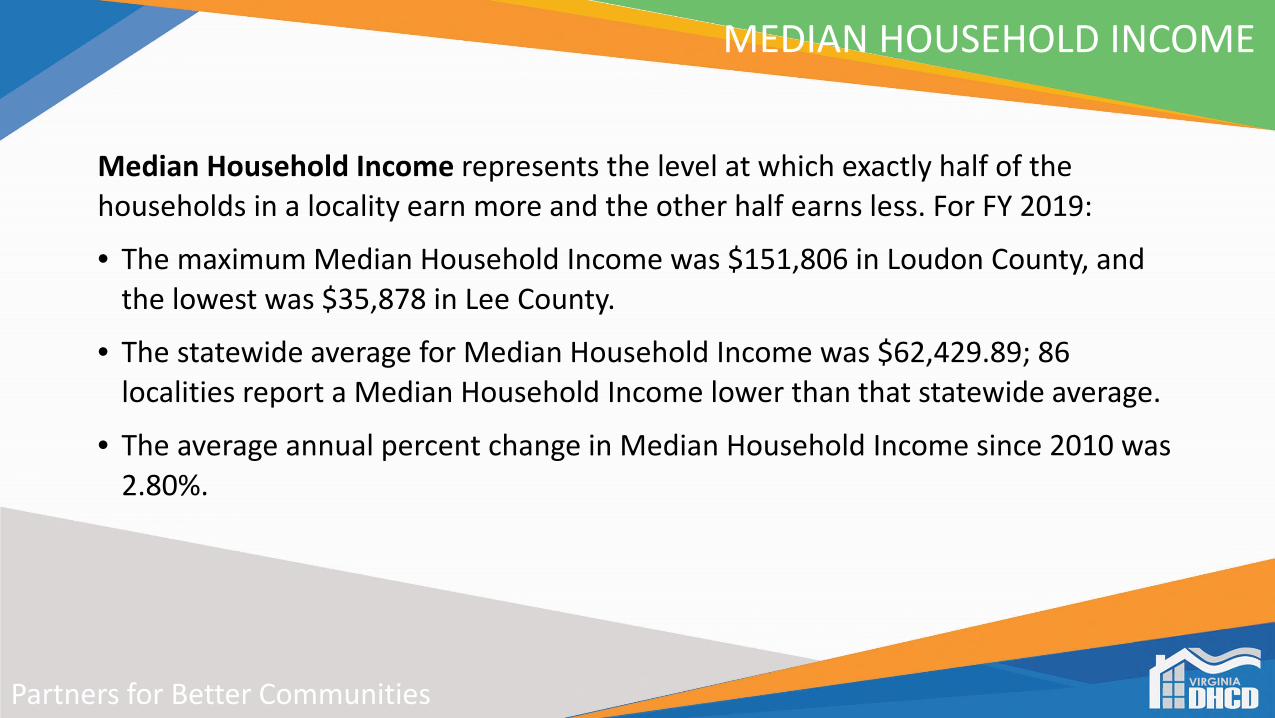
Median Household Income represents the level at which exactly half of the households in a locality earn more and the other half earns less. For FY 2019:
• The maximum Median Household Income was $151,806 in Loudon County, and the lowest was $35,878 in Lee County.
• The statewide average for Median Household Income was $62,429.89; 86 localities report a Median Household Income lower than that statewide average.
• The average annual percent change in Median Household Income since 2010 was 2.80%.
Partners for Better Communities
MEDIAN HOUSEHOLD INCOME
Partners for Better Communities
FISCAL STRESS: SUMMARY
Many of the elements of the Fiscal Stress Report remain similar year to year.
• The difference between city and county stress levels, revenue capacity, and revenue effort are persistent themes.
• However, there are a few changes year to year worth consideration, such as Greensville County.
Looking forward . . .
• FY 2020 will include the first quarter with COVID-19 data.
• This report will provide valuable information as to which localities were impacted the greatest by the pandemic.
• Impacts of reversion on scores.
Municipal Utility Data ReportsStaff PresentationMr. Anderson
Standard Meeting Rules: (1) this meeting is being recorded, (2) please state your name before speaking, and (3) please mute yourself when not speaking (Ctrl + D on your keyboard or *6 on phones)
Fall 2021 Utility ReportsFall 2021 Utility Reports
Cody Anderson, Policy AnalystCody Anderson, Policy Analyst
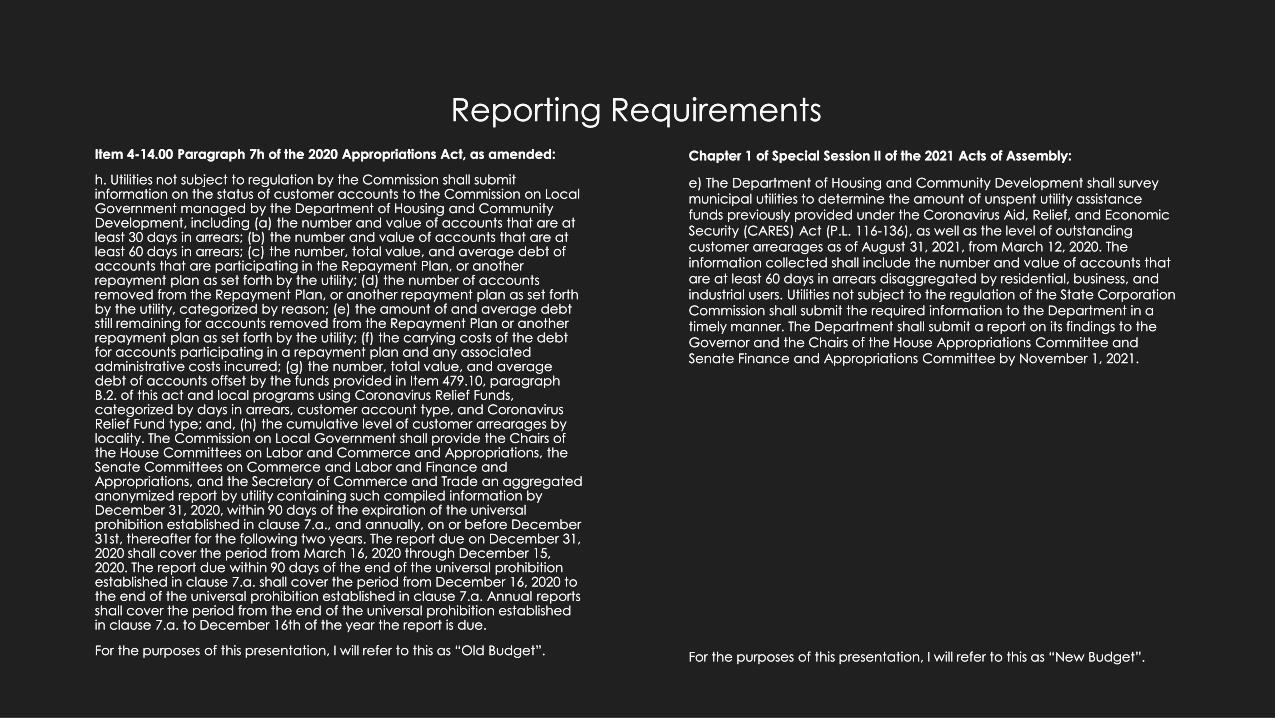
Reporting RequirementsReporting RequirementsItem 4-14.00 Paragraph 7h of the 2020 Appropriations Act, as amended:
h. Utilities not subject to regulation by the Commission shall submit information on the status of customer accounts to the Commission on Local Government managed by the Department of Housing and Community Development, including (a) the number and value of accounts that are at least 30 days in arrears; (b) the number and value of accounts that are at least 60 days in arrears; (c) the number, total value, and average debt of accounts that are participating in the Repayment Plan, or another repayment plan as set forth by the utility; (d) the number of accounts removed from the Repayment Plan, or another repayment plan as set forth by the utility, categorized by reason; (e) the amount of and average debt still remaining for accounts removed from the Repayment Plan or another repayment plan as set forth by the utility; (f) the carrying costs of the debt for accounts participating in a repayment plan and any associated administrative costs incurred; (g) the number, total value, and average debt of accounts offset by the funds provided in Item 479.10, paragraph B.2. of this act and local programs using Coronavirus Relief Funds, categorized by days in arrears, customer account type, and Coronavirus Relief Fund type; and, (h) the cumulative level of customer arrearages by locality. The Commission on Local Government shall provide the Chairs of the House Committees on Labor and Commerce and Appropriations, the Senate Committees on Commerce and Labor and Finance and Appropriations, and the Secretary of Commerce and Trade an aggregated anonymized report by utility containing such compiled information by December 31, 2020, within 90 days of the expiration of the universal prohibition established in clause 7.a., and annually, on or before December 31st, thereafter for the following two years. The report due on December 31, 2020 shall cover the period from March 16, 2020 through December 15, 2020. The report due within 90 days of the end of the universal prohibition established in clause 7.a. shall cover the period from December 16, 2020 to the end of the universal prohibition established in clause 7.a. Annual reports shall cover the period from the end of the universal prohibition established in clause 7.a. to December 16th of the year the report is due.
For the purposes of this presentation, I will refer to this as “Old Budget”.
Item 4-14.00 Paragraph 7h of the 2020 Appropriations Act, as amended:
h. Utilities not subject to regulation by the Commission shall submit information on the status of customer accounts to the Commission on Local Government managed by the Department of Housing and Community Development, including (a) the number and value of accounts that are at least 30 days in arrears; (b) the number and value of accounts that are at least 60 days in arrears; (c) the number, total value, and average debt of accounts that are participating in the Repayment Plan, or another repayment plan as set forth by the utility; (d) the number of accounts removed from the Repayment Plan, or another repayment plan as set forth by the utility, categorized by reason; (e) the amount of and average debt still remaining for accounts removed from the Repayment Plan or another repayment plan as set forth by the utility; (f) the carrying costs of the debt for accounts participating in a repayment plan and any associated administrative costs incurred; (g) the number, total value, and average debt of accounts offset by the funds provided in Item 479.10, paragraph B.2. of this act and local programs using Coronavirus Relief Funds, categorized by days in arrears, customer account type, and Coronavirus Relief Fund type; and, (h) the cumulative level of customer arrearages by locality. The Commission on Local Government shall provide the Chairs of the House Committees on Labor and Commerce and Appropriations, the Senate Committees on Commerce and Labor and Finance and Appropriations, and the Secretary of Commerce and Trade an aggregated anonymized report by utility containing such compiled information by December 31, 2020, within 90 days of the expiration of the universal prohibition established in clause 7.a., and annually, on or before December 31st, thereafter for the following two years. The report due on December 31, 2020 shall cover the period from March 16, 2020 through December 15, 2020. The report due within 90 days of the end of the universal prohibition established in clause 7.a. shall cover the period from December 16, 2020 to the end of the universal prohibition established in clause 7.a. Annual reports shall cover the period from the end of the universal prohibition established in clause 7.a. to December 16th of the year the report is due.
For the purposes of this presentation, I will refer to this as “Old Budget”.
Chapter 1 of Special Session II of the 2021 Acts of Assembly:
e) The Department of Housing and Community Development shall survey municipal utilities to determine the amount of unspent utility assistance funds previously provided under the Coronavirus Aid, Relief, and Economic Security (CARES) Act (P.L. 116-136), as well as the level of outstanding customer arrearages as of August 31, 2021, from March 12, 2020. The information collected shall include the number and value of accounts that are at least 60 days in arrears disaggregated by residential, business, and industrial users. Utilities not subject to the regulation of the State Corporation Commission shall submit the required information to the Department in a timely manner. The Department shall submit a report on its findings to the Governor and the Chairs of the House Appropriations Committee and Senate Finance and Appropriations Committee by November 1, 2021.
For the purposes of this presentation, I will refer to this as “New Budget”.
Old Budget DataOld Budget Data
December 16, 2020, through the end of the Moratorium on Disconnection of Utilities (August 31, 2021) December 16, 2020, through the end of the Moratorium on Disconnection of Utilities (August 31, 2021)
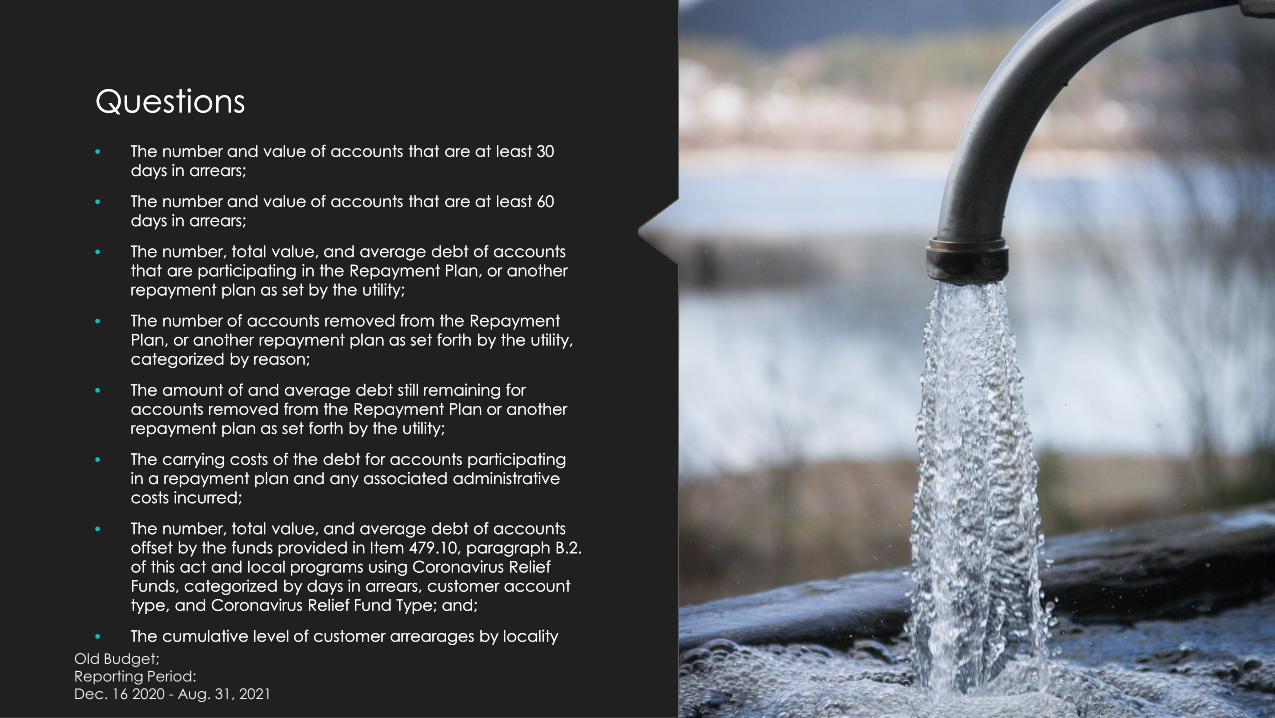
QuestionsQuestions
• The number and value of accounts that are at least 30 days in arrears;
• The number and value of accounts that are at least 60 days in arrears;
• The number, total value, and average debt of accounts that are participating in the Repayment Plan, or another repayment plan as set by the utility;
• The number of accounts removed from the Repayment Plan, or another repayment plan as set forth by the utility, categorized by reason;
• The amount of and average debt still remaining for accounts removed from the Repayment Plan or another repayment plan as set forth by the utility;
• The carrying costs of the debt for accounts participating in a repayment plan and any associated administrative costs incurred;
• The number, total value, and average debt of accounts offset by the funds provided in Item 479.10, paragraph B.2. of this act and local programs using Coronavirus Relief Funds, categorized by days in arrears, customer account type, and Coronavirus Relief Fund Type; and;
• The cumulative level of customer arrearages by locality
Old Budget; Reporting Period:Dec. 16 2020 - Aug. 31, 2021

General Accounts DataGeneral Accounts Data
Number of AccountsNumber of Accounts Value of AccountsValue of Accounts
Old Budget; Reporting Period:Dec. 16 2020 - Aug. 31, 2021
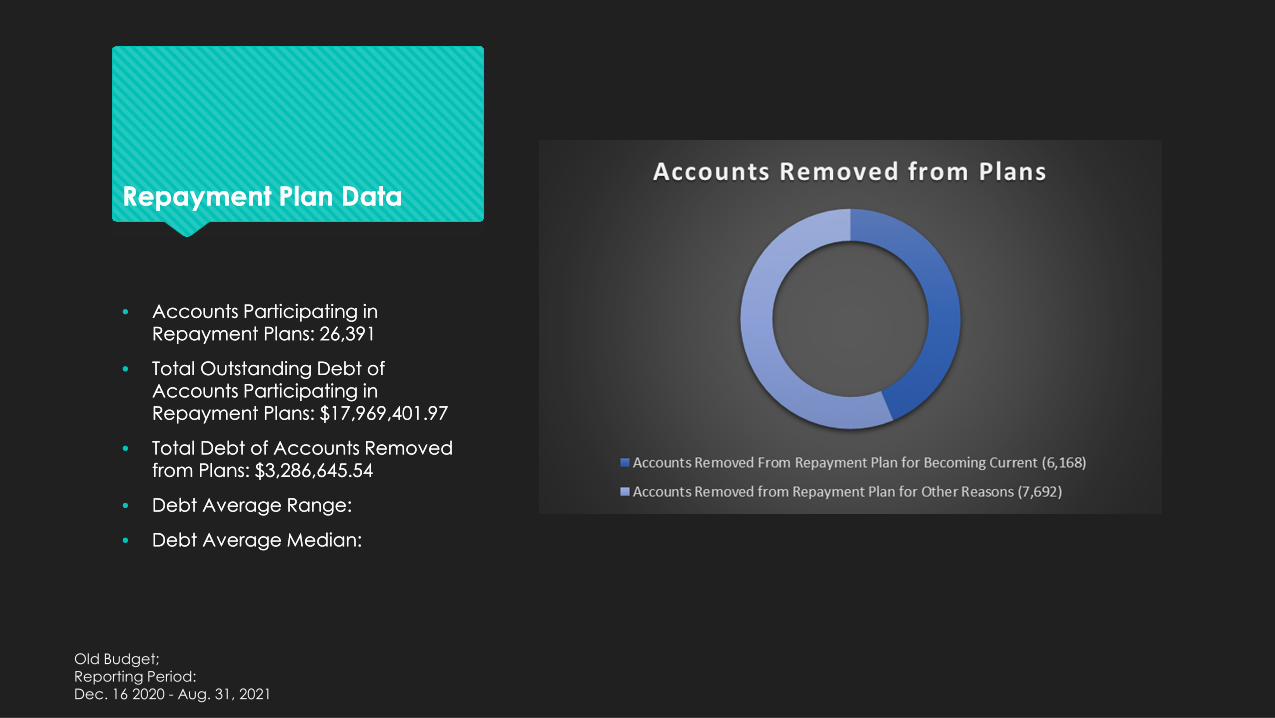
Repayment Plan DataRepayment Plan Data
• Accounts Participating in Repayment Plans: 26,391
• Total Outstanding Debt of Accounts Participating in Repayment Plans: $17,969,401.97
• Total Debt of Accounts Removed from Plans: $3,286,645.54
• Debt Average Range:
• Debt Average Median:
• Accounts Participating in Repayment Plans: 26,391
• Total Outstanding Debt of Accounts Participating in Repayment Plans: $17,969,401.97
• Total Debt of Accounts Removed from Plans: $3,286,645.54
• Debt Average Range:
• Debt Average Median:
Old Budget; Reporting Period:Dec. 16 2020 - Aug. 31, 2021
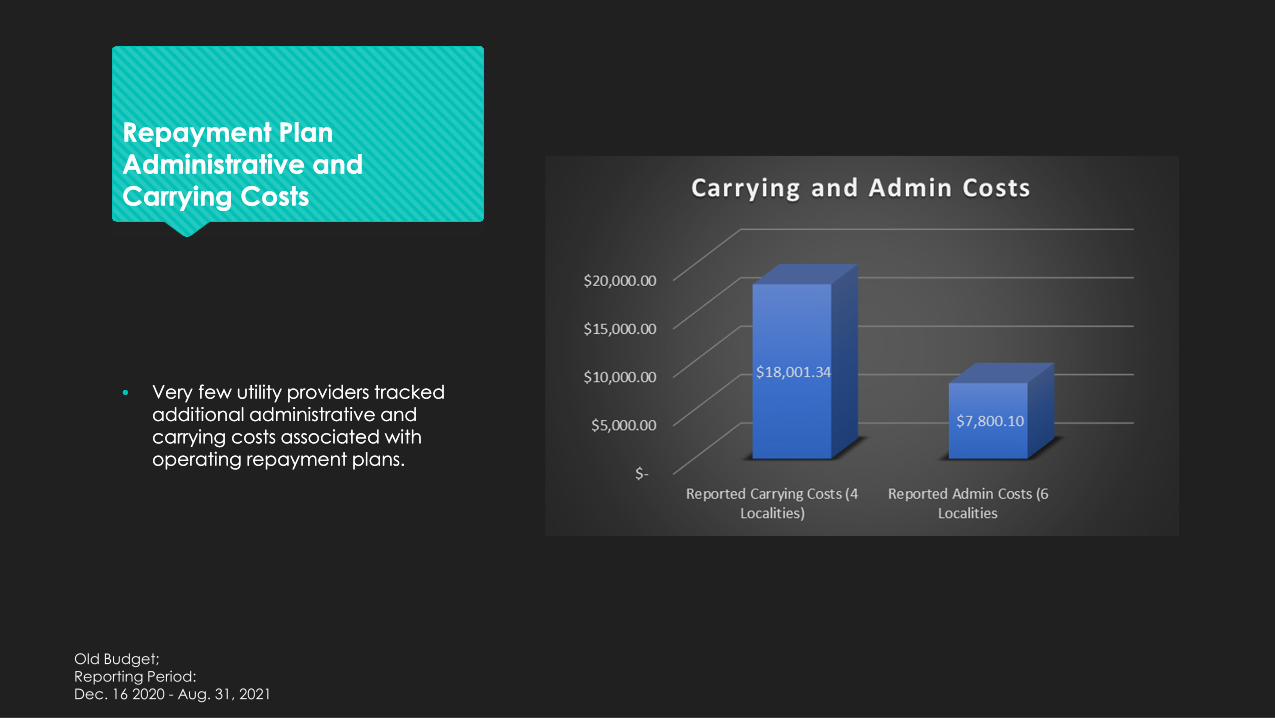
Repayment Plan Administrative and Carrying Costs
Repayment Plan Administrative and Carrying Costs
• Very few utility providers tracked additional administrative and carrying costs associated with operating repayment plans.
• Very few utility providers tracked additional administrative and carrying costs associated with operating repayment plans.
Old Budget; Reporting Period:Dec. 16 2020 - Aug. 31, 2021

Residential Accounts 30 or More Days in Arrears Offset by Various Funding MethodsResidential Accounts 30 or More Days in Arrears Offset by Various Funding Methods
Number of AccountsNumber of Accounts Value of AccountsValue of Accounts
Old Budget; Reporting Period:Dec. 16 2020 - Aug. 31, 2021
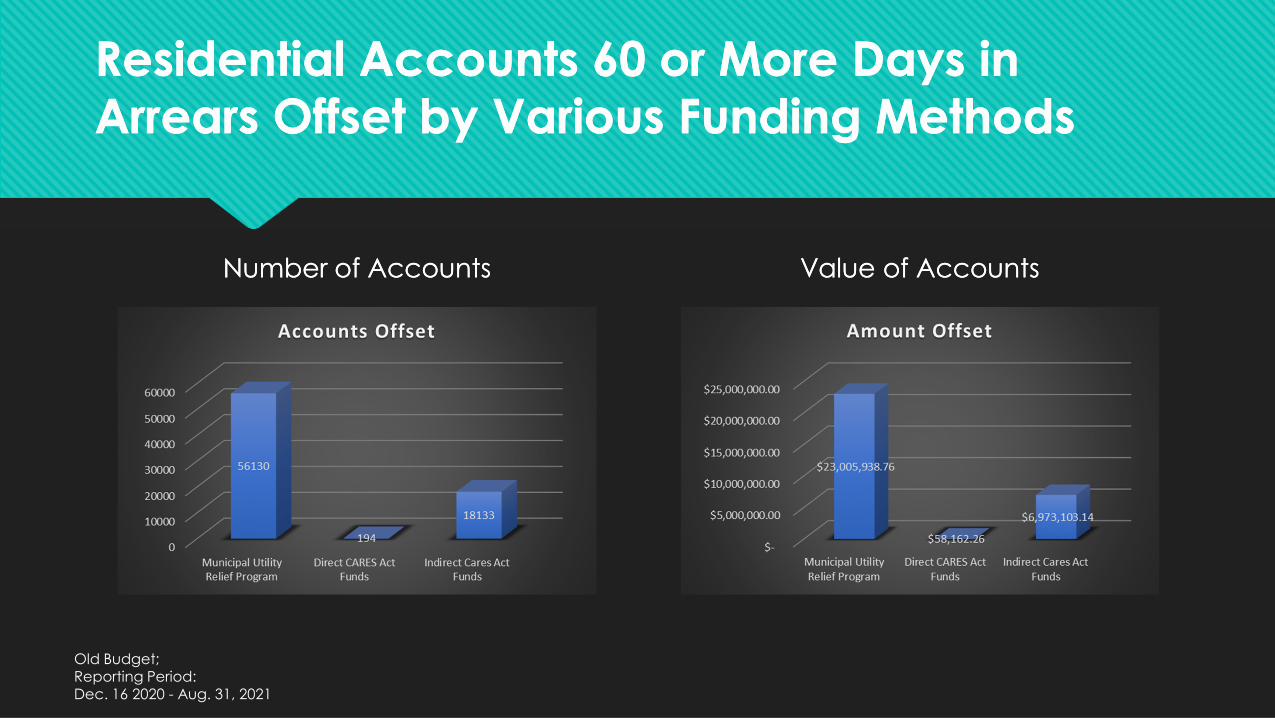
Residential Accounts 60 or More Days in Arrears Offset by Various Funding MethodsResidential Accounts 60 or More Days in Arrears Offset by Various Funding Methods
Number of AccountsNumber of Accounts Value of AccountsValue of Accounts
Old Budget; Reporting Period:Dec. 16 2020 - Aug. 31, 2021
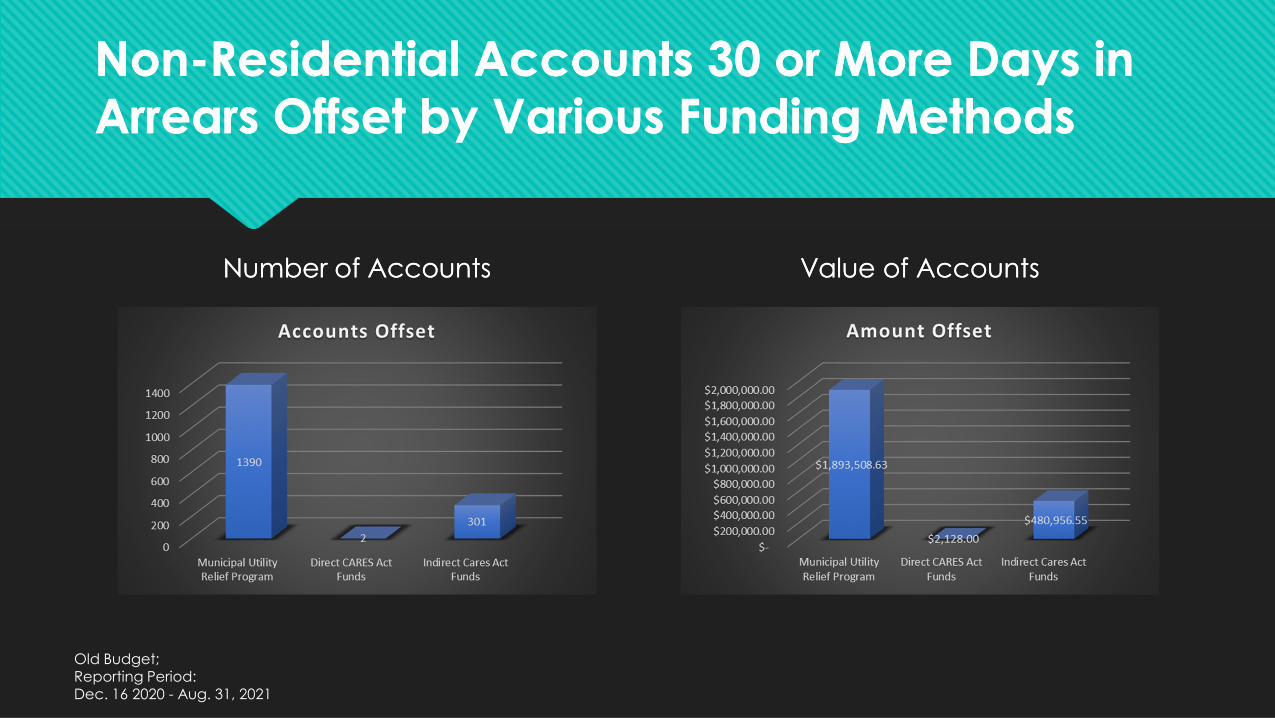
Non-Residential Accounts 30 or More Days in Arrears Offset by Various Funding MethodsNon-Residential Accounts 30 or More Days in Arrears Offset by Various Funding Methods
Number of AccountsNumber of Accounts Value of AccountsValue of Accounts
Old Budget; Reporting Period:Dec. 16 2020 - Aug. 31, 2021
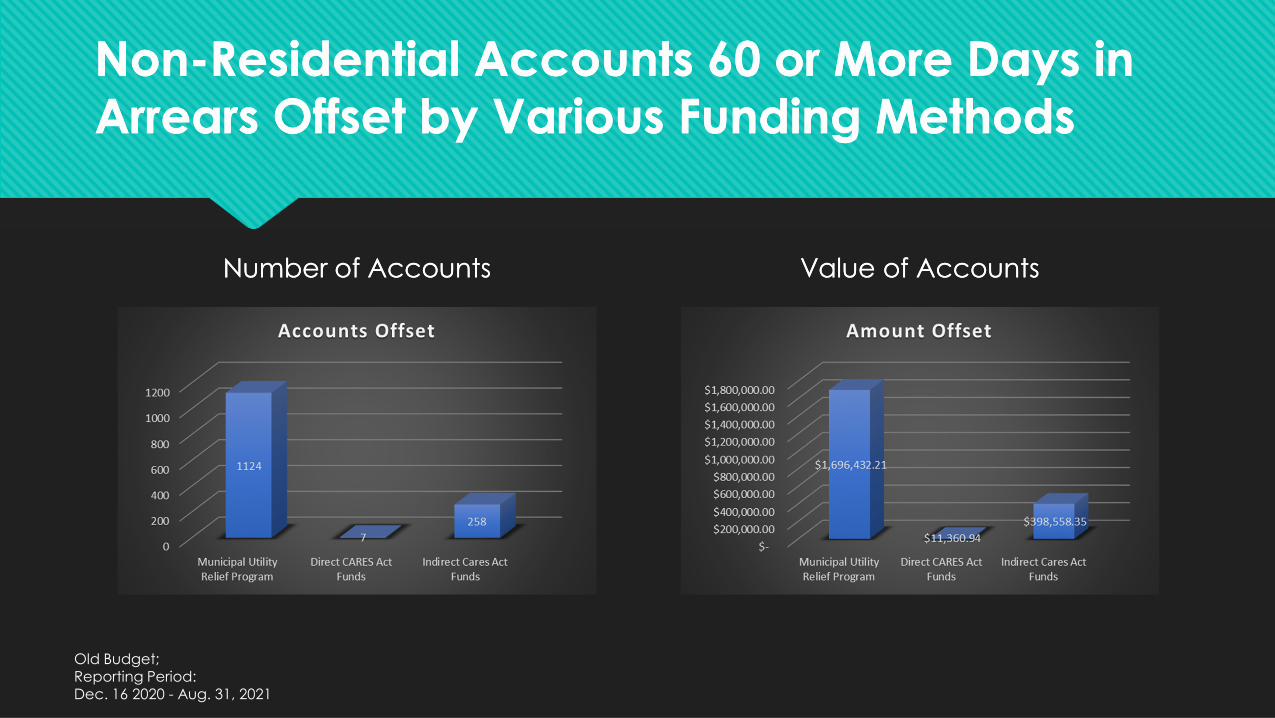
Non-Residential Accounts 60 or More Days in Arrears Offset by Various Funding MethodsNon-Residential Accounts 60 or More Days in Arrears Offset by Various Funding Methods
Number of AccountsNumber of Accounts Value of AccountsValue of Accounts
Old Budget; Reporting Period:Dec. 16 2020 - Aug. 31, 2021
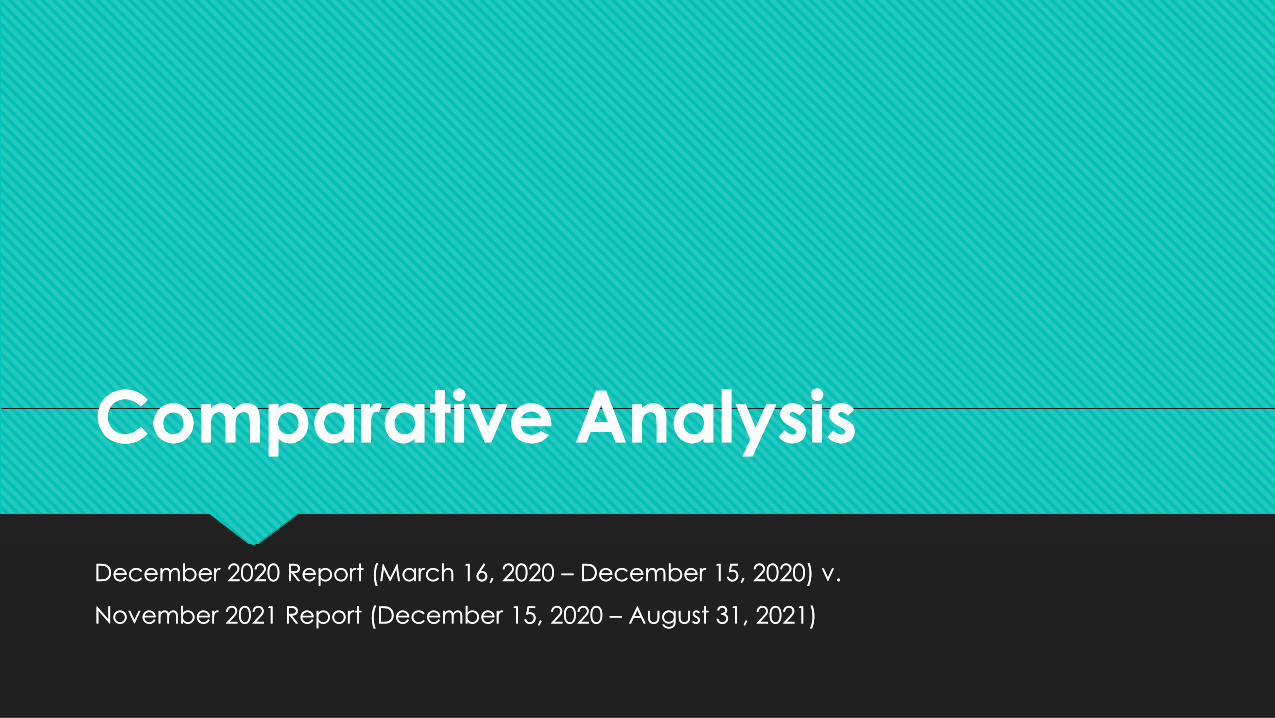
Comparative AnalysisComparative Analysis
December 2020 Report (March 16, 2020 – December 15, 2020) v.
November 2021 Report (December 15, 2020 – August 31, 2021)
December 2020 Report (March 16, 2020 – December 15, 2020) v.
November 2021 Report (December 15, 2020 – August 31, 2021)
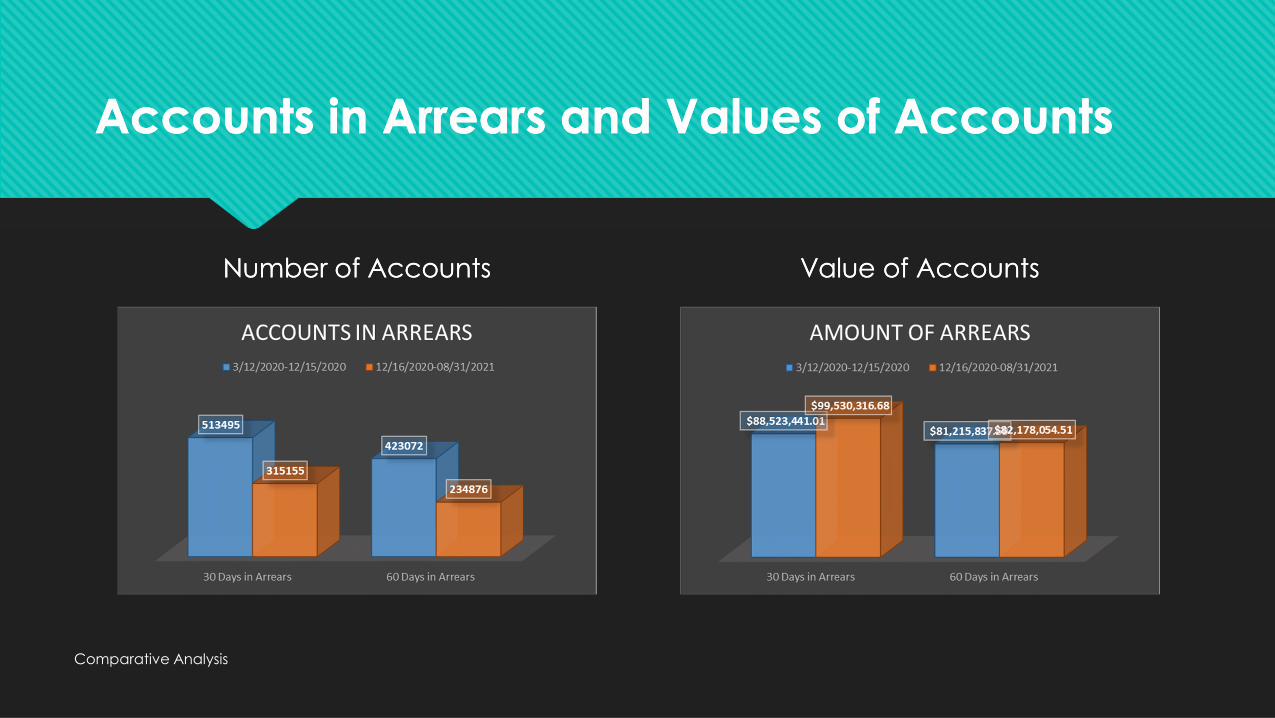
Accounts in Arrears and Values of AccountsAccounts in Arrears and Values of Accounts
Number of AccountsNumber of Accounts Value of AccountsValue of Accounts
Comparative Analysis
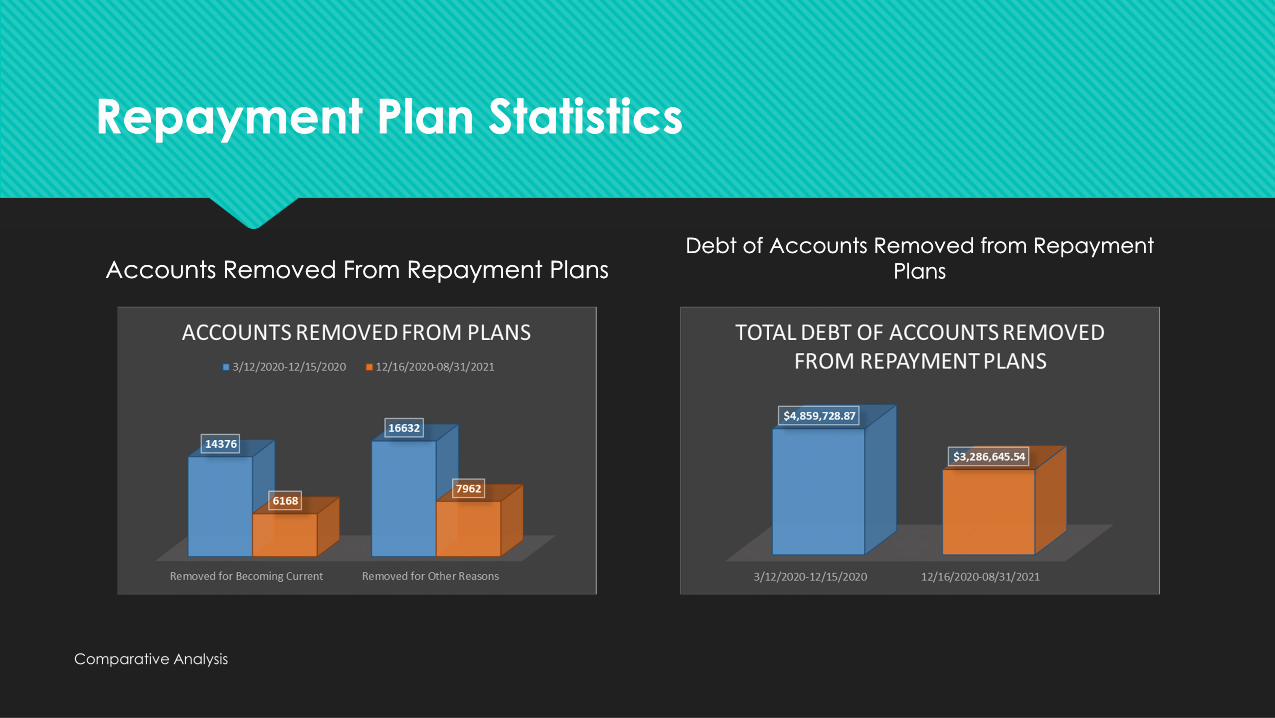
Repayment Plan StatisticsRepayment Plan Statistics
Accounts Removed From Repayment PlansAccounts Removed From Repayment PlansDebt of Accounts Removed from Repayment
PlansDebt of Accounts Removed from Repayment
Plans
Comparative Analysis
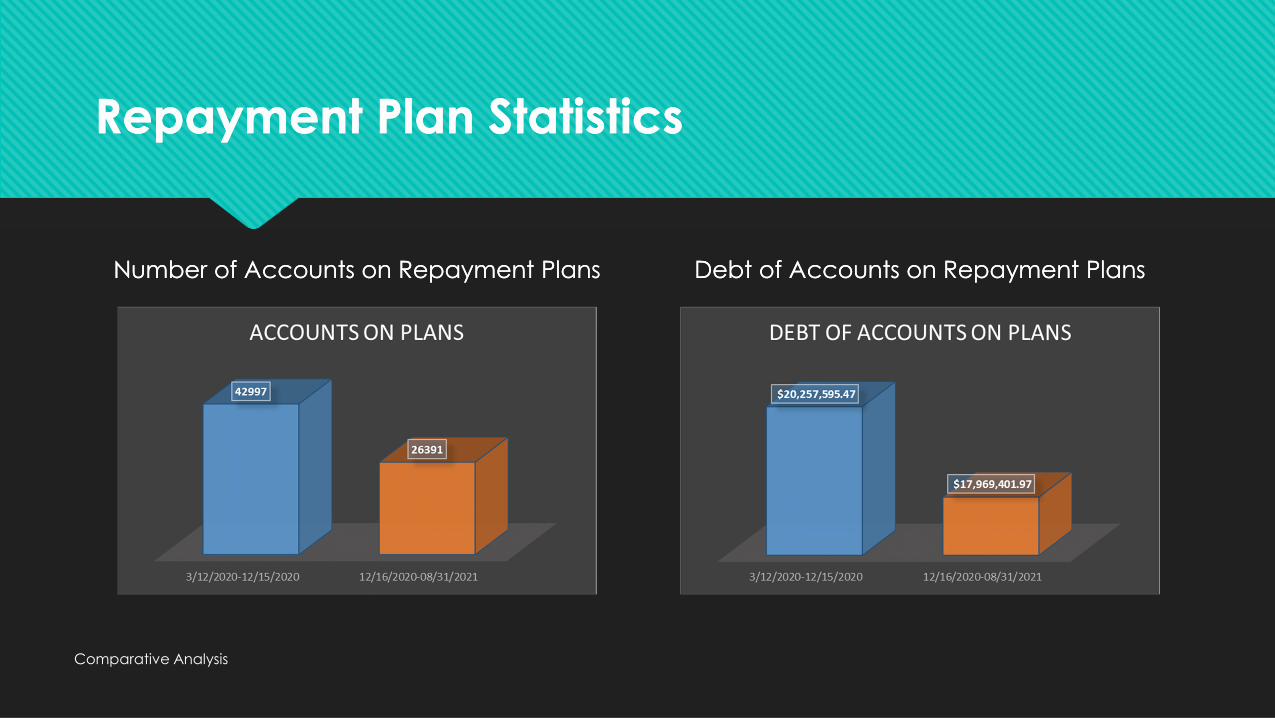
Repayment Plan StatisticsRepayment Plan Statistics
Number of Accounts on Repayment PlansNumber of Accounts on Repayment Plans Debt of Accounts on Repayment PlansDebt of Accounts on Repayment Plans
Comparative Analysis
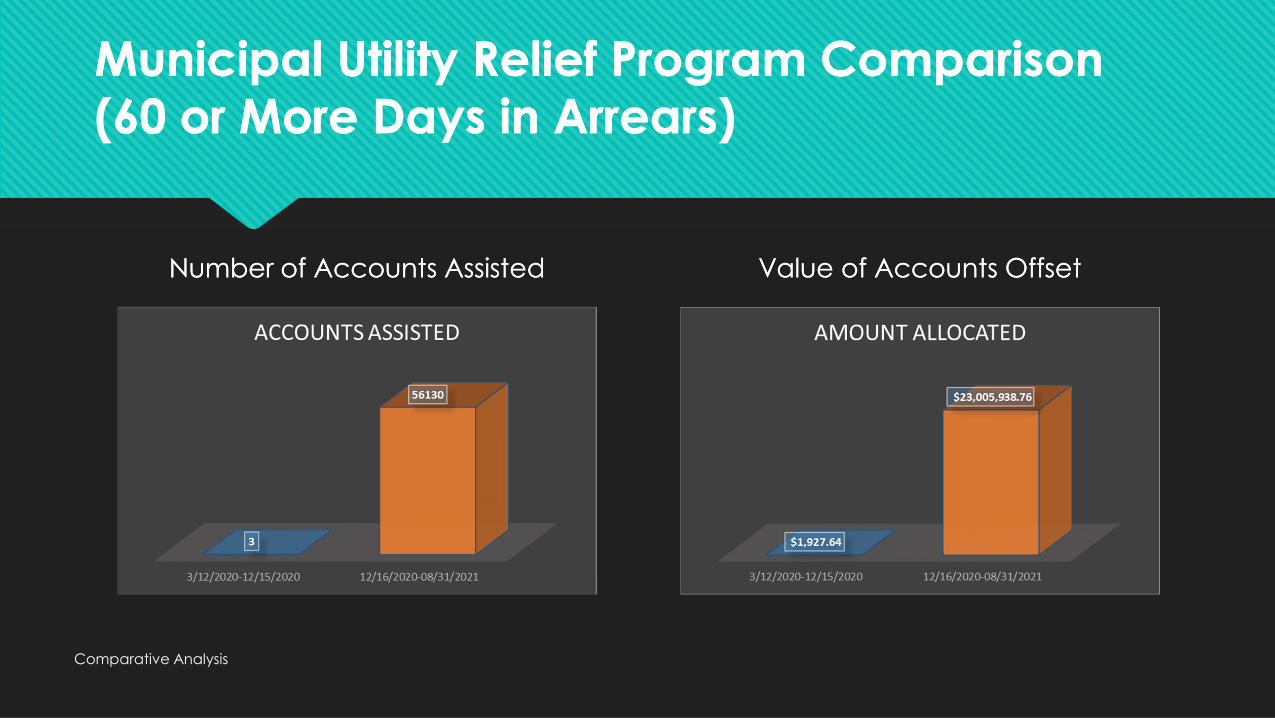
Municipal Utility Relief Program Comparison (60 or More Days in Arrears)Municipal Utility Relief Program Comparison (60 or More Days in Arrears)
Number of Accounts AssistedNumber of Accounts Assisted Value of Accounts OffsetValue of Accounts Offset
Comparative Analysis
New Budget DataNew Budget Data
March 12, 2020, through August 31, 2021March 12, 2020, through August 31, 2021
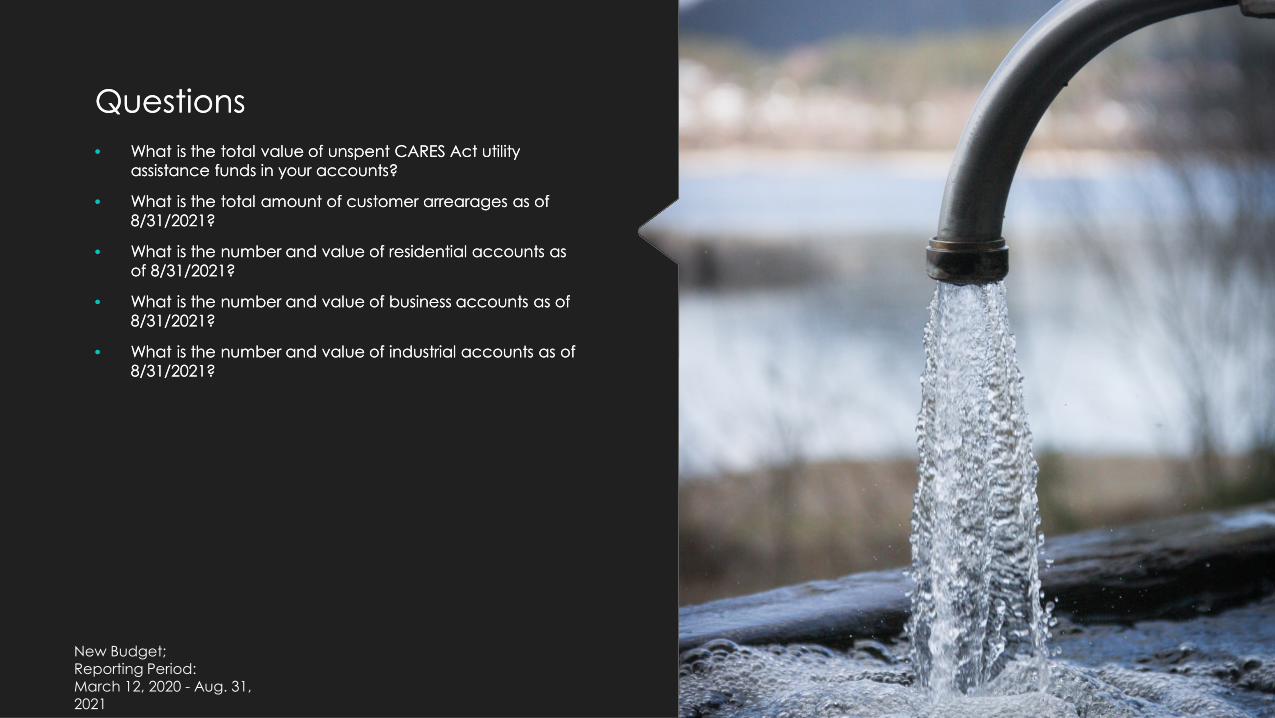
QuestionsQuestions
• What is the total value of unspent CARES Act utility assistance funds in your accounts?
• What is the total amount of customer arrearages as of 8/31/2021?
• What is the number and value of residential accounts as of 8/31/2021?
• What is the number and value of business accounts as of 8/31/2021?
• What is the number and value of industrial accounts as of 8/31/2021?
New Budget; Reporting Period:March 12, 2020 - Aug. 31, 2021
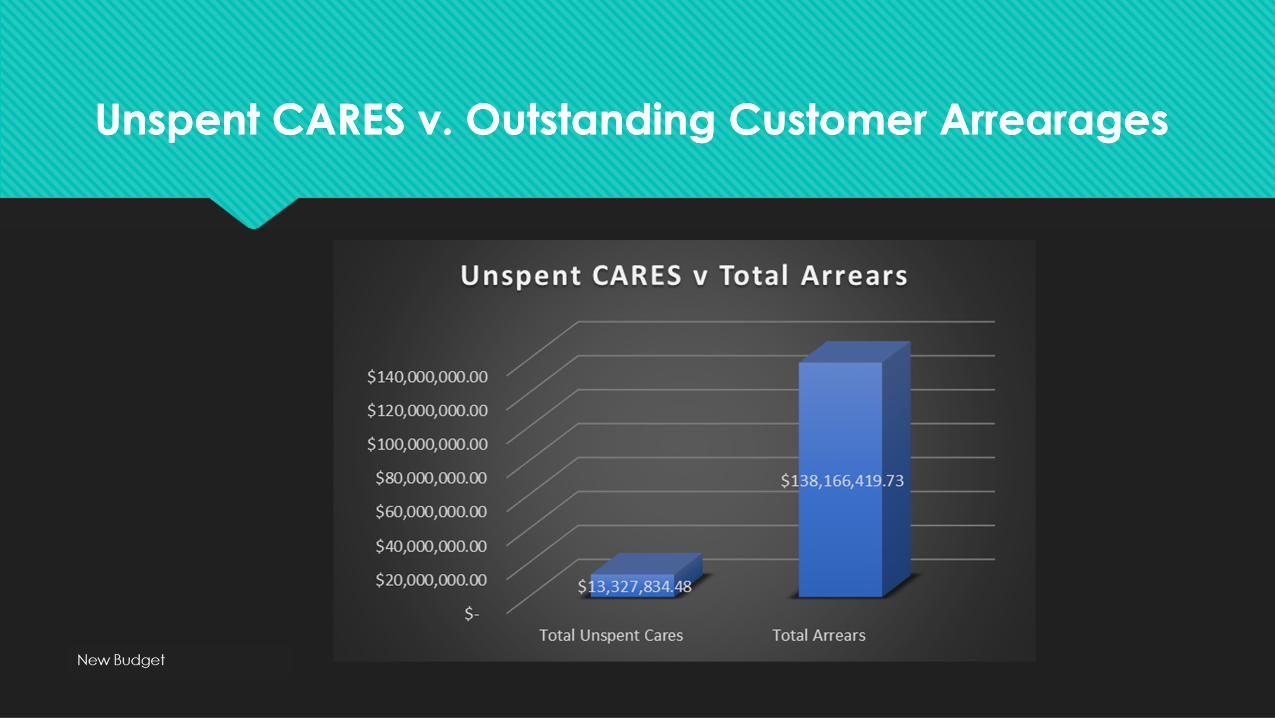
Unspent CARES v. Outstanding Customer ArrearagesUnspent CARES v. Outstanding Customer Arrearages
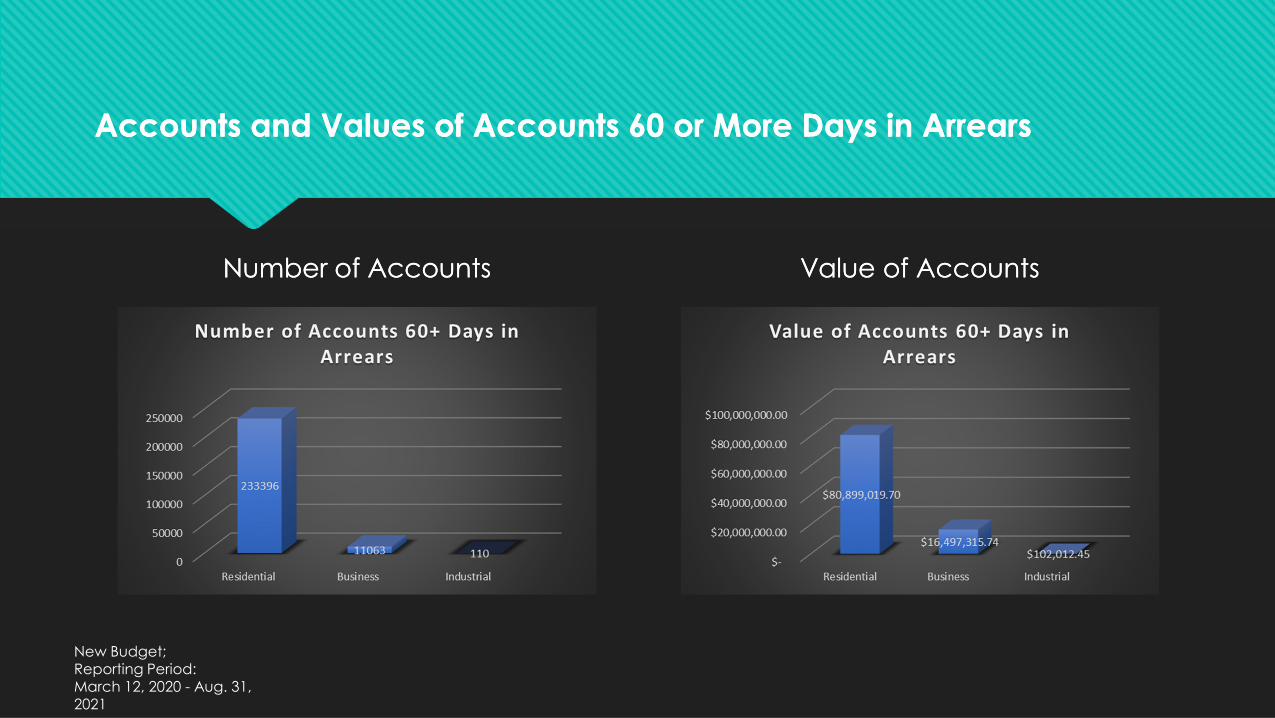
Accounts and Values of Accounts 60 or More Days in ArrearsAccounts and Values of Accounts 60 or More Days in Arrears
Number of AccountsNumber of Accounts Value of AccountsValue of Accounts
New Budget; Reporting Period:March 12, 2020 - Aug. 31, 2021
Municipal Utility Data ReportsCommission Deliberation and ActionDr. Davis
This item requires Commission approval.
Standard Meeting Rules: (1) this meeting is being recorded, (2) please state your name before speaking, and (3) please mute yourself when not speaking (Ctrl + D on your keyboard or *6 on phones)
Schedule of Regular Meetings: Proposed 2022 ScheduleStaff PresentationMr. Anderson
Standard Meeting Rules: (1) this meeting is being recorded, (2) please state your name before speaking, and (3) please mute yourself when not speaking (Ctrl + D on your keyboard or *6 on phones)

Schedule of Regular Meetings:Proposed 2022 Schedule
Based on 2021 Commission Meeting Cycle: 2nd Thursdays in odd-numbered months
Thursday, January 13, 2022
Martin Luther King, Jr., Day: Monday, January 17, 2022
2nd day of 2022 General Assembly Session (tentative)
Consider Thursday, January 6, 2022, as an alternative
Thursday, March 10, 2022
Thursday, May 12, 2022
Mother’s Day: Sunday, May 8, 2022
Thursday, July 14, 2022
Independence Day: Monday, July 4, 2022
Thursday, September 8, 2022
Labor Day: Monday, September 5, 2022
Thursday, November 10, 2022
Election Day: Tuesday, November 8, 2022
Veterans Day: Friday, November 11, 2022
2022 Virginia Governor’s Housing Conference: usually week before Thanksgiving (November 24, 2022)
Consider Thursday November 3, 2022, as an alternative
Proposed Meeting Location
Henrico County EDA
Others?Standard Meeting Rules: (1) this meeting is being recorded, (2) please state your name before speaking, and (3) please mute yourself when not speaking (Ctrl + D on your keyboard or *6 on phones)
Schedule of Regular Meetings: Proposed 2022 ScheduleCommission Deliberation and ActionDr. Davis
This item requires Commission approval.
Standard Meeting Rules: (1) this meeting is being recorded, (2) please state your name before speaking, and (3) please mute yourself when not speaking (Ctrl + D on your keyboard or *6 on phones)

Upcoming Events of InterestMr. Anderson
Standard Meeting Rules: (1) this meeting is being recorded, (2) please state your name before speaking, and (3) please mute yourself when not speaking (Ctrl + D on your keyboard or *6 on phones)
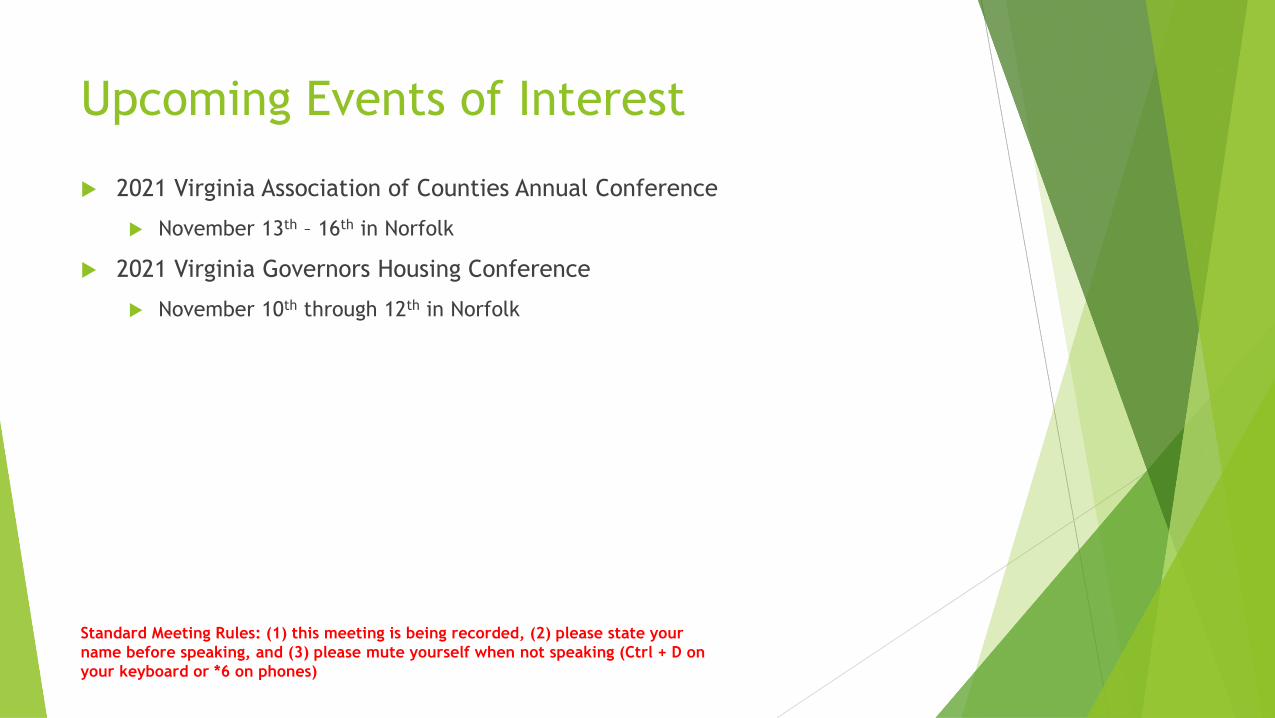
Upcoming Events of Interest
2021 Virginia Association of Counties Annual Conference
November 13th – 16th in Norfolk
2021 Virginia Governors Housing Conference
November 10th through 12th in Norfolk
Standard Meeting Rules: (1) this meeting is being recorded, (2) please state your name before speaking, and (3) please mute yourself when not speaking (Ctrl + D on your keyboard or *6 on phones)

Other Items?Dr. Davis
Standard Meeting Rules: (1) this meeting is being recorded, (2) please state your name before speaking, and (3) please mute yourself when not speaking (Ctrl + D on your keyboard or *6 on phones)
AdjournmentDr. Davis
Standard Meeting Rules: (1) this meeting is being recorded, (2) please state your name before speaking, and (3) please mute yourself when not speaking (Ctrl + D on your keyboard or *6 on phones)