Embed Size (px)
Citation preview

Acta Polytechnica Hungarica Vol. 16, No. 7, 2019
– 133 –
Commissioning Integrated Process at Industrial
Plants
Gloria Maria Alves Ney, Marcio Zamboti Fortes*
MPMI, Engineering School, Fluminense Federal University, Passo da Patria St.,
156, E-431 Room, 24210-240, Niteroi, RJ, Brazil
E-mail: [email protected]; [email protected]
Abstract: This paper is a case study about the gasification system commissioning. After
collecting data and information about this system analysis were made, related to TEXACO,
SHELL, LURGI and E-GAS, then a flowchart was created. Simulations were made in the
ARENA software for verification of commissioning performance. The results showed the
importance of commissioning management in a standard commissioning process and other
integrated proposed were compared.
Keywords: Commissioning; Gasification Process; Flowchart; ARENA Software
1 Introduction
Commissioning is a challenge for companies, because less time and warranty that
all technical issues attended is the target, which will transform the enterprise in a
competitive one. The results of enterprise’s competitiveness is cost reduction,
increase profits and improve the process. An industrial plant commissioning is
very important to verify equipment’s functionality which is part of systems inside
the plant. If the commissioning were planned correctly, it is possible mitigate
problems with main benefit cost and works reduction.
It is required to verify the activities of all involved disciplines. Sometimes it can
be very hard to define which are those activities without rework, excessive
duration, exceeding cost and a good relationship between disciplines. Bendiksen
and Young [1] says that during commissioning phase erection problems show up
and will be necessary increase the cost and time to repair those problems. So,
changes and upgrades will be done in commissioning activities at the same time
that they occur.
The gasification process is getting more attention in the last decades because of
the high demand in clean fuels and the reduction in fossil fuels use [2] and the
high demand of renewable fuels because of petroleum crises [3]. Gasification is a
G. M. A. Ney et al. Commissioning Integrated Process at Industrial Plants
– 134 –
flexible, a safe process and a commercial technology that contributes to reducing
the use of petroleum and natural gas, being a clean alternative to energy
generation, fertilizers industry, and fuel and chemical industry. This process can
convert any material that has high levels of carbon in syngas [4].
In order to understand the process will be presented a flowchart, which will allow
customizing system, as project needs. Shafiee [5] says that configuration systems
can support the decision process and show the product alternatives.
This paper aims to present and evaluate a gasification process flowchart that will
reduce the time of the commissioning phase.
2 Background
Brito et al. [6] says that commissioning is a process that certify units. Equipments
are tested, installed, designed and operated as client’s installation operational
requirements. Commissioning can be applied to new or existent plant.
Enterprises have general or particular procedures to attend each discipline process.
At PG-25-SEQUIETCM/CEND from PETROBRAS [7] is shown remembrances
to personal qualification, which will work in the commissioning phase. This
document presents commissioning as a group that contains knowledge, practices,
procedures and skills to become a unit operational according to desired
performance requirements. This transfer needs to be done fast, ordered and safe,
being certified in terms of performance, reliability and tracking information.
There is a possibility to deduce that commissioning practices have the main target
to ensure the system operation and the Project requirements were attended in order
to enable project’s start up. This is the concept that is used in this paper. PMKB
[8] divide commissioning in five phases, which are:
• Planning and Engineering: analyses of contract’s requirements, engineering
design and suppliers documents are done;
• Pre-commissioning: in this moment is verified equipment, systems and
subsystems conformity, through inspections and unload tests;
• Commissioning: tests are executed as equipment/system operation;
• Start up: systems start up, maintenance, initial operations and performance
tests are realized;
• Assisted Operation: operation team is trained, pendencies are solved and the
unit is delivered to client.
These information are important to understand the process and to plan correctly.
A flowchart is composite with many stages that has a free time between them.

Acta Polytechnica Hungarica Vol. 16, No. 7, 2019
– 135 –
A process is composed by activities sorted with start and finish well defined. So, a
process is a mix of resources that brings value or results to the company.
To identify the flowchart is positive in order to establish priorities and to help
decision-making in priority processes, those processes cause more impact and are
complex [9]. Process management is required to ensure that processes reach their
targets and be efficient. It is important to get view of the whole project and to have
performance indicators to evaluate the flowchart according to enterprise
objectives. Mapping processes gives support in identifies wastes and decisions
making are done in visible flows, according Gomes and Souza [10].
This paper will present a flowchart of gasification process. Breault et al. [11] says
that gasification is a technology that transforms any material with high level of
carbon in syngas. ThyssenKrupp Uhde [12] presents gasification as partial
oxidation process in high temperature to convert materials with high level of
carbon in syngas, which contains carbon monoxides and hydrogen.
Chiu et al. [13] says that should be considered the life cycle of a product and how
this production will affect the environmental. This sustainable product can be
categorized in: reduction of product quantity, expansion service, reduction of
energy consumption, improvement of resource sustainability and reduction of the
environmental damage risk. According to U.S. Department of Energy [14] the
benefit of gasification to environment are the low emissions of oxides and
particulates from burning coal, because of the treatment after burning fuel. It is
also possible the use of garbage the energy generation with two processes,
incineration and gasification. Transform the uses of non-recycle materials in
electricity reduce the amount of waste in landfill in order to prevent is and water
contamination [15].
After all these information’s about gasification, it will be presented the processes
that were studied in order to create a flowchart.
In TEXACO gasification process petroleum and steam are mixed inside the boiler.
This blend goes into the gasifier together with oxygen. The syngas with impurities
goes through two scrubbers until leaves the process as a clean syngas [16]. The
Figure 1 shows a simplified diagram of this process.
The second process is from SHELL. The Shell Gasification Process (SGP) has the
advantage to convert different materials in syngas, including heavy and viscous oil
and with high level of sulfur [17]. In Figure 2 is presented SPG Diagram.
Higman and Burgt [16] say that the gasifier from SHELL is vertical and contains
many intermediate burners. This process reuses the heat which would be lost, first
is used in syngas cooling and later in boiler feed water. The gas partly rusty when
it leaves the gasifier a small amount of free carbon. This carbon is removed with
ashes in two stages of washing with water. After this process, the syngas leaves
with a temperature of 40oC.

G. M. A. Ney et al. Commissioning Integrated Process at Industrial Plants
– 136 –
Figure 1
TEXACO’s Simplified Diagram
Figure 2
SGP Diagram
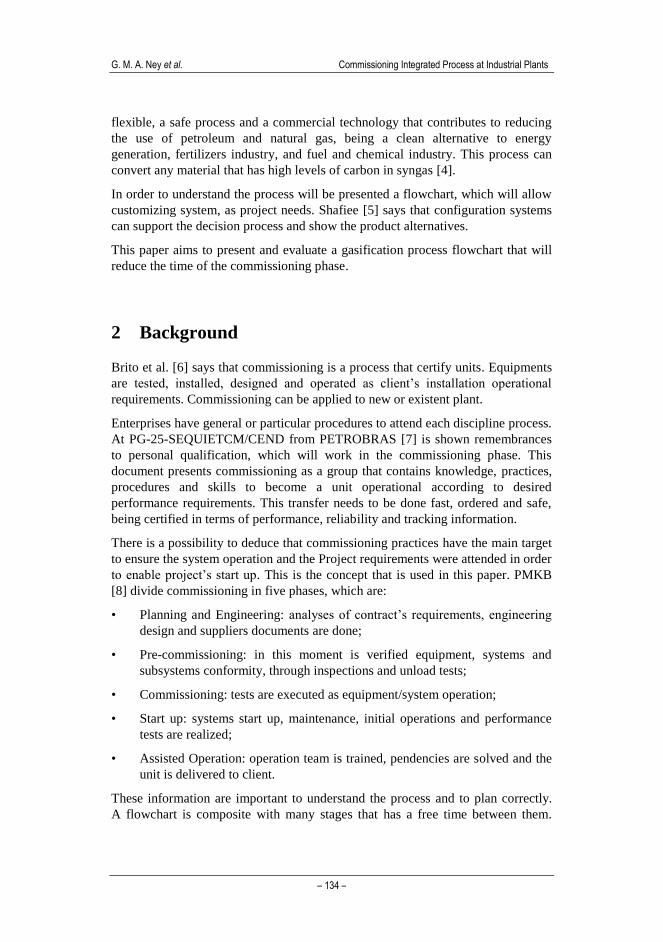
The third process is from LURGI. In this process is possible to be done with
natural gas or recycle gases, which are preheated before entering the reactor.
Oxygen is also preheated using a small amount of high-pressure steam that comes
from the heat recovery boiler. A purification water tower removes traces of soot,
hydrocyanic acid and ammonia. In this process, the soot formation in process is
extremely low, not requiring extra filtration [18].
In Figures 3 and 4 are presented possible diagram to this process, because
LURGI’s gasification can be done in two different options according the cooling
system chosen.

Acta Polytechnica Hungarica Vol. 16, No. 7, 2019
– 137 –
Figure 3
LURGI Process with Water Cooling System
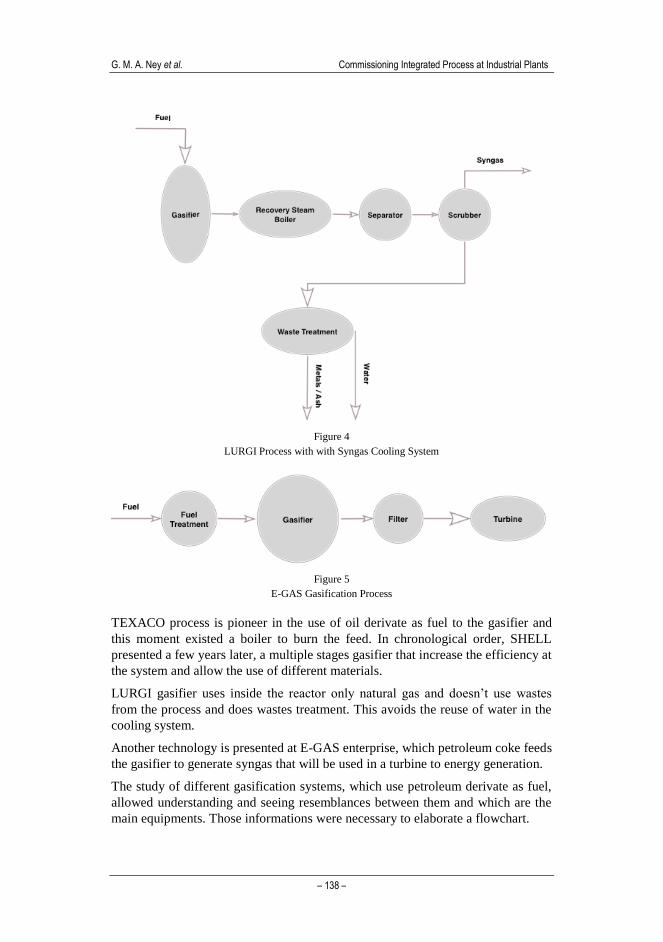
The last process that will be presented in this paper is from E-GAS. The first stage
is the treatment of the fuel before gets inside the gasifier. The fuel can be
petroleum coke or coal, which are smashed and mixed with water and transform
this in slurry. The E-GAS gasifier is multiple stages; this will increase the
efficiency of the process and reduce oxygen consumption. When syngas leaves the
gasifier, it is quenched and the heat is recovered and high pressure steam is
produced. The gas is filtrated in order to remove all the ashes. These ashes are
recycle and returned to the gasifier. In the end of the process, the hydrogen with
high level of syngas is burned inside a turbine to energy generation [8]. E-GAS
diagram is shown in Figure 5.
G. M. A. Ney et al. Commissioning Integrated Process at Industrial Plants
– 138 –
Figure 4
LURGI Process with with Syngas Cooling System
Figure 5
E-GAS Gasification Process
TEXACO process is pioneer in the use of oil derivate as fuel to the gasifier and
this moment existed a boiler to burn the feed. In chronological order, SHELL
presented a few years later, a multiple stages gasifier that increase the efficiency at
the system and allow the use of different materials.
LURGI gasifier uses inside the reactor only natural gas and doesn’t use wastes
from the process and does wastes treatment. This avoids the reuse of water in the
cooling system.
Another technology is presented at E-GAS enterprise, which petroleum coke feeds
the gasifier to generate syngas that will be used in a turbine to energy generation.
The study of different gasification systems, which use petroleum derivate as fuel,
allowed understanding and seeing resemblances between them and which are the
main equipments. Those informations were necessary to elaborate a flowchart.

Acta Polytechnica Hungarica Vol. 16, No. 7, 2019
– 139 –
3 Flowchart
To map the gasification process is relevant, because it is possible to understand
and to allow a global view of the project [9]. Mapping activities is to search for
operational excellence and to create an improvement continuous cycle, according
to Carmo [9]. Aleu and Aken [20] say that continuous improvement is a planned,
organized and systematic approach that increases the organization performance.
To model is to do a deep analysis to reach a target. This paper aims to optimize
the gasification process commissioning. When the process mapping is done, it is
possible to know the positive and the negative points of the process. Knowing
these points allows to reduce costs, failures, to get simple and optimized process.
The application of product configuration system is possible to obtain these
benefits, according to Hvam [21]:
• Lead time is the time between the beginning of specification process until it
be finished;
• On-time delivery is the percentage of how many specifications were
completed in the agreed time;
• Resource consumption for making specifications is the analysis made with
the aim to reveal the resources consumption;
• Quality of specifications can be the evaluation of the client that is difficult of
measure or this can be the quantity of errors in the specification;
• Optimization of products and services in specification processes occurs when
configuration system is used to optimize products according to customer
requirements.
After the processes analysis, it is possible to perceive a resemblance between
processes. With those information’s, an abridgment of the biggest flows is made
with concept of flowchart and minimizes stages. In Figure 6 is presented a
diagram with main equipment’s.
Figure 6
Gasification Process Diagram
This flowchart allows to adapt the gasification process and to customize it
according project needs. Bonev et al. [22] explains that this customization aims to
use configuration systems, adjustable products, flexible process and adaptive
organizations. Another point presented by Bonev et al. [22] is that common
platforms provide an alternative to standardization strategy of traditional
construction.

G. M. A. Ney et al. Commissioning Integrated Process at Industrial Plants
– 140 –
4 Results
The simulation resorts a flowchart to model’s methodology base, the system
identification becames easier to identify. An analysis was done with entrance data,
which cross the system using available resources [23].
Two simulations were made; the first one is to compare two-studied process
(SHELL and TEXACO) in order to get in touch with the behavior in time and
resources use of complexes processes. These two were chosen because they have
necessary data to accomplish the simulation and better activities descriptions. The
second simulation was made comparing SHELL process with the flowchart
presented in Section 4, the objective is to measure the behavior of the flowchart
created and compare it with a real process.
The simulations were made considering 8 hours of labor per day and total duration
of 120 hours, this time was important to bring forth enough data to a statistic
analysis.
At Figure 7 is presented the model based at SHELL process. This model counts
with three entrance data (oxygen, residue and steam) and these are mixed inside
the gasifier. To simulate was necessary the volume data that enter in the gasifier.
The volume required to each process were presented at Higman & Burgt [16]. The
fuel leaves the gasifier and passes by cooling process and ashes treatment to
delivered syngas.
Figure 7
SHELL Gasification Process Model
The Figure 8 shows the TEXACO gasification process model. This process uses,
also, the same three entrance data and the volume is shown at Table 1. In this
process steam and residue enter in the boiler and this mixture gets into the gasifier
with oxygen, then it goes to a scrubber process and leaves as syngas.

Acta Polytechnica Hungarica Vol. 16, No. 7, 2019
– 141 –
Figure 8
SHELL TEXACO Gasification Process Model
At Tables 1 and 2, it is presented the time required to fuels cross the system, since
the beginning of the process until it leaves as syngas.
Comparing both models, it is possible to realize an increase of 37% in the oxygen
that remains inside the process, 0.2% in the residue that remains and 1% in the
steam that remains. These results show that there is not a meaningful difference of
time between processes, it happens a balance in process duration and in the time
that oxygen crosses the process.
Table 1
SHELL Model Results (units in hours)
SHELL
Fuel Average Minimum Value Maximum Value
Oxygen 5.527 3.529 7.380
Residue 5.924 4.046 8.111
Steam 5.812 3.957 8.072
Table 2
SHELL TEXACO Model Results (units in hours)
TEXACO
Fuel Average Minimum Value Maximum Value
Oxygen 4.011 2.278 6.304
Residue 5.913 3.441 8.757
Steam 5.875 3.632 7.841
It was also done a simulation to evaluate the using of resources. It was considered
engineers and technicians of four disciplines – mechanical, electrical, process and
instrumentation & control. As it is a general evaluation, it was considered that the
four disciplines work a the same amount of time in each equipment, if it were a
real Project it would be a rare situation, but in this studied it is a limit for do not
need to quantify and rating differences between disciplines. The quantities of
amount hours occupied and requested were generated by ARENA, based on each
equipment’s interaction.

G. M. A. Ney et al. Commissioning Integrated Process at Industrial Plants
– 142 –
In the Tables 3 and 4 are presented the results about the using of resources, in
other words, the amount requested.
Table 3
Amount Requested - SHELL Model
Resources Amount Resource Requested
Mechanical Engineer 1,658
Electrical Engineer 1,658
Process Engineer 1,658
Instrumentation & Control Engineer 1,658
Mechanical Technician 1,658
Electrical Technician 1,658
Process Technician 1,658
Instrumentation & Control Technician 1,658
Table 4
Amount Requested - TEXACO Model
Resources Amount Resource Requested
Mechanical Engineer 1,926
Electrical Engineer 1,926
Process Engineer 1,926
Instrumentation & Control Engineer 1,926
Mechanical Technician 1,926
Electrical Technician 1,926
Process Technician 1,926
Instrumentation & Control Technician 1,926
The TEXACO model requests more resources, perhaps in this process exists one
extra equipment (boiler), which is absent at SHELL process. This equipment
requires more resources to verify and to calibrate. Beside these informations, the
SHELL process was chosen to do the comparison with the integrated flowchart.
In Figure 9 is presented the integrated model, which is composed by the minimum
stages of gasification process. There is only one entrance data, which will be
called slurry, because it was considered that the fuel was treated before the
entrance into the gasifier. This step can be modified according to project/system
needs.
Figure 9
Integrated Gasification Process Model

Acta Polytechnica Hungarica Vol. 16, No. 7, 2019
– 143 –
The time that fuel takes to the beginning of the process until it leaves as syngas is
described in Table 5. The results present the average, the minimum and maximum
duration.
Table 5
Gasification Integrated Process Model Results (units in hours)
Gasification Integrated Model
Fuel Average Minimum Value Maximum Value
Slurry 4.512 3.064 6.189
Analyzing the SHELL model (Table 1) and the integrated one (Table 5), the
difference of duration was 1.412 hours, in other words the integrated model
corresponds to 76.2% of the duration of SHELL model. This duration is smaller,
because there are less input data, steps and interactions.
In Table 6 are shown the differences between input and output data that shows
fuel losses during the processes.
Table 6
Process Losses
SHELL Model
Fuel Entrance Output Losses
Oxygen 2,010 1,929 -81
Residue 207 202 -5
Steam 605 585 -20
Integrated Model
Fuel Entrance Output Losses
Slurry 490 478 -12
Total fuel losses in SHELL model were 106 units and in integrated model were 12
units lost, it is a reduction of 88.7%. In this simulation, ARENA foreseen a
reduction in the amount of fuel consumed, which indicates a possible cost
reduction with raw materials.
It was also made a simulation with possible needed resources. Engineers and
technicians of four disciplines were considered. To compute the value of each
engineer worked/hour, it was considered that the commissioning professional has
experience of five years and his salary is the double of the one determined by
CREA-RJ [24] and the technician salary was considered the one determined by
CREA-RJ [24]. At Table 7 is presented the value of each work/hour.
Table 7
Engineer and Technician Cost per Hour
Salary Cost per Hour
Commissioning Engineer (R$) 14,960 85
Technician (R$) 6,600 37.50

G. M. A. Ney et al. Commissioning Integrated Process at Industrial Plants
– 144 –
The simulation was made for SHELL and integrated model. In the Table 8 shows
worked hours to each resource in SHELL model.
Table 8
Worked Hours – SHELL Model
Worked Hours
Resource Average Minimum Value Maximum Value
Mechanical Engineer 25,073 0 32
Electrical Engineer 25,073 0 32
Process Engineer 25,073 0 32
Instrumentation & Control Engineer 25,073 0 32
Mechanical Technician 25,073 0 32
Electrical Technician 25,073 0 32
Process Technician 25,073 0 32
Instrumentation & Control Technician 25,073 0 32
Tables 9 and 10 present the quantity of hours worked and the amount of resource
requested for the integrated model.
Table 9
Worked Hours – Worked Hours – Integrated Model
Worked Hours
Resource Resource Resource Resource
Mechanical Engineer 4,552 0 12
Electrical Engineer 4,552 0 12
Process Engineer 4,552 0 12
Instrumentation & Control Engineer 4,552 0 12
Mechanical Technician 4,552 0 12
Electrical Technician 4,552 0 12
Process Technician 4,552 0 12
Instrumentation & Control Technician 4,552 0 12
Table 10
Amount Requested – Integrated Model
Resource Amount Resource Requested
Mechanical Engineer 487
Electrical Engineer 487
Process Engineer 487
Instrumentation & Control Engineer 487
Mechanical Technician 487
Electrical Technician 487
Process Technician 487
Instrumentation & Control Technician 487

Acta Polytechnica Hungarica Vol. 16, No. 7, 2019
– 145 –
The results show that more input data and more activities result in a bigger
number of interactions and a greater need of resources. The founded values
allowed evaluating the cost of labor work in both models. In the Tables 11 and 12
are presented the cost to SHELL model and integrated model.
Table 11
Each Engineer and Technician Cost – SHELL Model
Hour Cost Amount Used Total Cost
Each Engineer Cost R$ 85 41.570,21 R$ 3,533,467.43
Each Technician Cost R$ 37.50 41.570,21 R$ 1,558,882.69
Table 12
Each Engineer and Technician Cost – Integrated Model
Hour Cost Amount Used Total Cost
Each Engineer Cost R$ 85 2216,824 R$ 188,430.04
Each Technician Cost R$ 37.50 2216,824 R$ 83,130.90
Therefore the cost of the four disciplines in SHELL model would be
R$20,369,400.45 and in the integrated model it would be R$1,086,243.76. This is
a difference of R$19,283,156.69 and the cost of the integrated model would
correspond a 5.3% of SHELL model.
This difference shows that excessive amount of activities represents a cost
increase, in other words, when the project has more activities, more input data that
will be required it spends more money to attend the resources needed. Thus have
the knowledge of gasification system and to do an integrated commissioning
permits reducing the cost at the end of the project. It is important to remember that
according to gasification process chosen this cost difference cannot be so
meaningful, because the integrated process has the minimum stages quantity and
depending of process complexity can exits more stages, which will increase the
cost.
In this section were presented the results founded at ARENA simulation, the
object of this was evaluate the commissioning duration comparing processes. The
differences founded represent the bigger number of items and by consequence this
increases in commissioning hours and final cost.
Conclusion
An integrated commissioning is an excellent option to reduce cost and time. It is
very common to introduce a commissioning team only at the final project’s steps
before plant startup. This practice leaves commissioning oversized, because many
hours are used to understand and evaluation of the process by commissioning
team.
This study comes up with a minimum team that works in the project since the
beginning, this team can support basic and detail engineering and when

G. M. A. Ney et al. Commissioning Integrated Process at Industrial Plants
– 146 –
commissioning officially starts, this group already has information to do the
integrated commissioning, which processes are grouped and the commissioning
activities are focused only in power up and start up the plant.
Gasification is a flexible process, which can be used in different kinds of industry,
like energy generation, chemical industry, products fabrication, etc.
Through flowchart could be noticed the importance of prepare and choose feed
fuel of the gasifier. It needs to be analyzed each case to understand each project’s
peculiarities. Doing a fuel treatment adequate, there is a reduction in entrance data
that results time, the using of resources and volume of fuel required. These
reductions were noticed at software ARENA simulation. It is also very important
turn the attention in waste generated in the gasifier.
At ARENA simulation, it could be noticed that the use of the flowchart brought a
reduction of commissioning time, which shows how important is to analyze an
industrial process and commission the main equipment. It allows also perceiving
the difference in time and cost when there is a model with excessive amount of
activities and multiple input data. It shows that depending on gasification system
can have an overkill of activities that requires more time and professionals, for
consequence the commissioning will spend more resources and time.
References
[1] Bendiksen T, Young G (2015) Commissioning of Offshore Oil and Gas
Projects: The Manager’s Handbook. AuthorHouse. 177 p.
[2] Materazzi M, Lettieri P, Taylor R, Chapman C (2016) Performance
analysis of RDF gasification in a two stage fluidized bed–plasma process,
Waste Management 47-V: 256-266.doi: 10.1016/j.wasman.2015.06.016.
[3] Lazarinos JGC (2007) Tratamento de Revestimentos Gastos de Cuba
Eletrolítica da Indústria de Alumínio. Master Dissertation,Pontifícia
Universidade Católica do Rio de Janeiro, Brazil. Available from:
https://www.maxwell.vrac.puc-rio.br/10023/10023_1.PDF [accessed
2018.1.12]
[4] Available from: http://www.gasification-syngas.org/technology/the-
gasification-process/ [accessed 2016.11.11]
[5] Shafiee S, Hvam, L.; Bonev, M. (2014) How to Scope a Product
Configuration Project in an Engineering Company. In: 6th International
Conference on Mass Customization and Personalization in Central Europe.
Available from:
http://orbit.dtu.dk/files/100481481/How_to_scope_a_product.pdf,
[accessed 2017.8.17]

Acta Polytechnica Hungarica Vol. 16, No. 7, 2019
– 147 –
[6] Brito AS, Ribeiro H, Matos LM (2010) Comissionamento em Sistemas de
Tubulações de Utilidades: Aplicação do Comissionamento a um Sistema de
Resfriamento. Final Engineering Course Project, Instituto SENAI de
Educação Superior, Brazil, 195 p.
[7] Petrobras (2010) Manual de Gestão da Engenharia: Volume 2:
Implementação de Empreendimentos. Available from:
http://docslide.com.br/documents/01-magescapitulo15-
comissionamentoh.html, [accessed 2017.5.14]
[8] Project Management Knowledge Base (2015) Requisitos básicos de
Comissionamento. Available from:
http://pmkb.com.br/download/requisitos-basicos-de-comissionamento/,
[accessed 2017.6.13]
[9] Carmo JP (2016) Modelagem de Processos. Final Engineering Course
Project, Instituto Federal do Espírito Santo, Brazil, 42 p.
[10] Gomes DR, Souza SDC (2010) Mapeamento do Processo de Produção Em
Uma Fábrica Do Pólo de Cerâmica Vermelha Do Norte Fluminense. In:
XXX Encontro Nacional De Engenharia De Produção, Associação
Brasileira de Engenharia de Produção. ABEPRO
[11] Breault RW (2010) Gasification Processes Old and New: A Basic Review
of the Major Technologies. Energies 3(2):216-240. doi: 10.3390/en3020216
[12] Thyssenkrupp UHDE (2012) Gasification Technologies. Available from:
http://www.thyssenkrupp-industrial-
solutions.com/fileadmin/documents/brochures/gasification_technologies.pd
f, [accesed 2018.5.13]
[13] Chiu MC, Chang CH, Yu-Ting C,Jr-Yi C, Yi-Jie C (2015) Redesign for
Sustainability and Assemblability Using Particle Swarm Optimization
Method. Journal of Industrial and Production Engineering 33(2):103-113.
doi: 10.1080/21681015.2015.1111264
[14] U. S. Department Of Energy (2016) Gasification. Available from:
http://energy.gov/fe/science-innovation/clean-coal-research/gasification,
[accessed 2018.4.24]
[15] Klein A (2002) Gasification: An Alternative Process for Energy Recovery
and Disposal of Municipal Solid Wastes. Columbia University, 50 p.
[16] Higman C, Burgt MVD (2011) Gasification. Gulf Professional Publishing,
456 p.
G. M. A. Ney et al. Commissioning Integrated Process at Industrial Plants
– 148 –
[17] Shell Global Solutions (2014) Residue Gasification: Converting the Bottom
of the Barrel into Valuable Products. Available from:
http://www.shell.com/business-customers/global-solutions/gasification-
licensing/residue-
gasification/_jcr_content/par/textimage_330759342.stream/1444052720177
/a5e92982dafaa7c1aca6dea89fc596d705c8c08a32cae05a531e3a7ab368021
e/residue-gasification-factsheet-v2-screen.pdf, [accessed 2018.1.18]
[18] Liebner W, Ulber D (2000) MPG – Lurgi Multi Purpose Gasification:
Application in “Gas-Gasification”. In: 2000 Gasification Technologies
Conference, Gasification & Syngas Technologies Council, 1-10. Available
from: https://www.globalsyngas.org/uploads/eventLibrary/Gtc00340.pdf,
[accessed 2018.1.12]
[19] Available from: http://www.cbi.com/technologies/e-gas-process-overview
[accessed 2016.12.12]
[20] Aleu FG, Aken EMV (2016) Systematic Literature Review of Critical
Success Factors for Continuous Improvement Projects. International
Journal of Lean Six Sigma 7(3):214-232. doi: 10.1108/IJLSS-06-2015-
0025
[21] Hvam L, Haug A, Mortensen NH, Thuesen C (2013) Observed Benefits
from Product Configuration Systems. The International Journal of
Industrial Engineering: Theory, Applications and Practice 20(5-6):329-338
[22] Bonev M, Wörösch M, Hvam L (2014) Utilizing Platforms in Industrialized
Construction: A Case Study of a Precast Manufacturer. Construction
Innovation 15(1) 84-106. doi: 10.1108/CI-04-2014-0023
[23] Brahmadeep ST (2014) A Simulation Based Comparison: Manual and
Automatic Distribution Setup in a Textile Yarn Rewinding Unit of a Yarn
Dyeing Factory. Simulation Modeling Practice and Theory 45:80-90. doi:
10.1016/j.simpat.2014.04.002
[24] Available from: https://www.crea-rj.org.br/documentos-e-
formularios/salario-minimo-profissional/