Embed Size (px)
Citation preview
COMMITMENTS UNDER THE WTO AGREEMENT ON
AGRICULTURE AND THE DOHA DRAFT MODALITIES:
HOW DO THEY COMPARE TO CURRENT POLICY?
Lars Brink
Independent Advisor
This paper has been prepared as a background document for the
OECD Global Forum on Agriculture:
Issues in Agricultural Trade Policy
2 December 2014, Paris
2
TABLE OF CONTENTS
COMMITMENTS UNDER THE WTO AGREEMENT ON AGRICULTURE AND THE DOHA
DRAFT MODALITIES: HOW DO THEY COMPARE TO CURRENT POLICY? ..................................... 5
1. Introduction .......................................................................................................................................... 5 2. Background .......................................................................................................................................... 6
2.1. Timeline towards the draft modalities and Bali .......................................................................... 6 2.2 Context for examining countries’ positioning ............................................................................. 8
3. Market access ....................................................................................................................................... 8 3.1. Agreement on Agriculture .......................................................................................................... 8 3.2. Draft modalities........................................................................................................................... 9
3.2.1. General .................................................................................................................................... 9 3.2.2. Specifics on tariffs .................................................................................................................. 9 3.2.3. Sensitive products and tariff rate quotas ............................................................................... 10 3.2.4. Special products, tariff escalation, tariff simplification ........................................................ 11 3.2.5. Special agricultural safeguard, tropical products, preferences .............................................. 12 3.2.6. Special safeguard mechanism ............................................................................................... 12
3.3. Bali decision .............................................................................................................................. 12 3.4. Market access situation ............................................................................................................. 13
3.4.1. Changes in bindings .............................................................................................................. 13 3.4.2. Tariff profiles ........................................................................................................................ 13 3.4.3. Extent of tariff reductions under the draft modalities ........................................................... 16 3.4.4. Country-specific discussion for selected countries ............................................................... 16 3.4.5. Recent developments in tariff settings .................................................................................. 18
3.5. Market access digest ................................................................................................................. 19 4. Export competition ............................................................................................................................. 20
4.1. Export subsidies ........................................................................................................................ 20 4.1.1. Agreement on Agriculture .................................................................................................... 20 4.1.2. Draft modalities..................................................................................................................... 21 4.1.3. Bali declaration ..................................................................................................................... 21 4.1.4. Export subsidies: Situation .................................................................................................... 21 4.1.5. Summary of export subsidy situation .................................................................................... 26 4.1.6. Assessment ............................................................................................................................ 26
4.2. Export financing support ........................................................................................................... 27 4.2.1. Agreement on Agriculture .................................................................................................... 27 4.2.2. Draft modalities..................................................................................................................... 27 4.2.3. Export financing support: situation ....................................................................................... 27 4.2.4. Assessment ............................................................................................................................ 28
4.3. Exporting agricultural state trading enterprises ........................................................................ 28 4.3.1. Agreement on Agriculture .................................................................................................... 28 4.3.2. Draft modalities..................................................................................................................... 28 4.3.3. Exporting agricultural state trading enterprises: situation..................................................... 29 4.3.4. Assessment ............................................................................................................................ 32
4.4. International food aid ................................................................................................................ 32 4.4.1. Agreement on Agriculture .................................................................................................... 32 4.4.2. Draft modalities..................................................................................................................... 32 4.4.3. International food aid: situation ............................................................................................ 32
4.5 Assessment ................................................................................................................................ 35 4.6. Export competition digest ......................................................................................................... 35
5. Domestic support ............................................................................................................................... 35 5.1. Agreement on Agriculture ........................................................................................................ 35
5.1.1. Exempt and non-exempt support .......................................................................................... 35
3
5.1.2. AMSs, de minimis, and Total AMS ...................................................................................... 36 5.2. Draft modalities......................................................................................................................... 36
5.2.1. Bound Total AMS and de minimis ....................................................................................... 36 5.2.2. Product-specific AMSs ......................................................................................................... 38 5.2.3. Total blue box payments and product-specific blue box payments ...................................... 40 5.2.4. Overall Trade-Distorting Support ......................................................................................... 41
5.3 Bali decisions ............................................................................................................................ 42 5.4 Information from notifications .................................................................................................. 44
5.4.1. AMSs, de minimis, Current Total AMS and Bound Total AMS: situation .......................... 44 5.4.2. Caps on product-specific AMSs: situation ............................................................................ 50 5.4.3. Blue box payments: situation ................................................................................................ 51 5.4.4. Overall Trade-Distorting Support: situation ......................................................................... 52 5.4.5. Assessment: Current Total AMS .......................................................................................... 53 5.4.6. Assessment: Product-specific AMSs, blue box payments, OTDS ........................................ 55
5.5. Domestic support digest ............................................................................................................ 55 6. Discussion .......................................................................................................................................... 56
6.1. Country-specific situations ...................................................................................................... 56 6.2. Public stock acquisition and administered prices ...................................................................... 57
6.2.1. Food security, green box expenditures and AMS ................................................................. 57 6.2.2. Penalty for acquiring at administered prices ......................................................................... 58 6.2.3. Why penalize the use of administered prices? ...................................................................... 58
6.3. Change policy or change the rules? .......................................................................................... 59 6.3.1. Agriculture Agreement as the driver of policy reform .......................................................... 59 6.3.2. Established policy as the driver of changing the rules .......................................................... 60 6.3.3. Economic analysis................................................................................................................. 60
6.4. Emerging issues ........................................................................................................................ 61 6.4.1. General .................................................................................................................................. 61 6.4.2. Export prohibitions and restrictions ...................................................................................... 61
6.5. Need for long-term perspective ................................................................................................. 61 7. Conclusion ......................................................................................................................................... 62
REFERENCES ............................................................................................................................................. 64
APPENDIX A. WTO TARIFF PROFILES ................................................................................................. 69
APPENDIX B. EVOLUTION OF NON-GREEN-BOX SUPPORT 1995-2012 ......................................... 89
Tables
Table 1. Attributes of studied countries ........................................................................................................... 7
Table 2. Tariff cuts under harmonizing tiered formula for developed countries ........................................... 10
Table 3. Tariff cuts under harmonizing tiered formula for developing countries .......................................... 10
Table 4. Selected elements of tariff profiles in agriculture ............................................................................ 15
Table 5. Tariff profiles before and after Rev.4 reductions ............................................................................. 17
Table 6. Export subsidy commitments and notifications ............................................................................... 23
Table 7. Export subsidy outlays and subsidized quantities as percentage of commitments .......................... 24
Table 8. Export financing support: selected data ........................................................................................... 29
Table 9. Features of agricultural exporting state trading enterprises (STEs) of six countries ....................... 31
Table 10. Overview of countries' food aid programs ..................................................................................... 34
Table 11. Bound Total AMS before and after any Rev.4 reduction .............................................................. 37
Table 12. De minimis percentages ................................................................................................................. 39
Table 13. Total blue box limits ...................................................................................................................... 41
Table 14. Calculation of Base OTDS and Bound OTDS ............................................................................... 43
Table 15. Assessment of Rev.4 reductions in Bound Total AMS and de minimis percentage ...................... 46
Table 16. Calculation of Current OTDS ........................................................................................................ 54
Appendix Table 1 Argentina .......................................................................................................................... 70
4
Appendix Table 2 Brazil ................................................................................................................................ 71
Appendix Table 3 Canada .............................................................................................................................. 72
Appendix Table 4 China ................................................................................................................................ 73
Appendix Table 5 European Union ............................................................................................................... 74
Appendix Table 6 India ................................................................................................................................. 75
Appendix Table 7 Indonesia .......................................................................................................................... 76
Appendix Table 8 Japan ................................................................................................................................. 77
Appendix Table 9 Korea ................................................................................................................................ 78
Appendix Table 10 Mexico ........................................................................................................................... 79
Appendix Table 11 Norway ........................................................................................................................... 80
Appendix Table 12 Philippines ...................................................................................................................... 81
Appendix Table 13 Russia ............................................................................................................................. 82
Appendix Table 14 South Africa ................................................................................................................... 83
Appendix Table 15 Switzerland ..................................................................................................................... 84
Appendix Table 16 Thailand ......................................................................................................................... 85
Appendix Table 17 Turkey ............................................................................................................................ 86
Appendix Table 18 United States .................................................................................................................. 87
Appendix Table 19 Viet Nam ........................................................................................................................ 88
5
COMMITMENTS UNDER THE WTO AGREEMENT ON
AGRICULTURE AND THE DOHA DRAFT MODALITIES:
HOW DO THEY COMPARE TO CURRENT POLICY?1
1. Introduction
1. It is of interest to review the agriculture and trade policies of a selected number of countries
in 2014 or recent earlier years in relation to actual or potential rules and commitments under the
World Trade Organization (WTO). This paper specifically considers what is allowed or required
under the rules and commitments of the Agreement on Agriculture (AoA) of the WTO and what could
be allowed or required under the rules and commitments of an agreement corresponding to the draft
modalities arrived at in 2008 under the Doha Development Agenda (DDA) of the WTO.2 The paper
also discusses some issues not addressed in the Agreement on Agriculture or the draft modalities but
which have come to the fore in the years since, such as at the 2013 WTO Ministerial conference. The
purpose is to help to assess the pertinence of the draft modalities for the continued negotiations in
agriculture.
2. The paper proceeds by reviewing in turn each of the three “pillars” in the AoA and Rev.4,
i.e. market access, export competition and domestic support. It summarizes the major provisions
under each pillar, and then reviews the status of the policy settings in each of a number of countries in
comparison to what the rules and commitments of Rev.4 would require. This is followed by a
discussion of several related issues, including the one of acquiring food stocks at administered prices
that was prominent in the 2013 Ministerial conference.
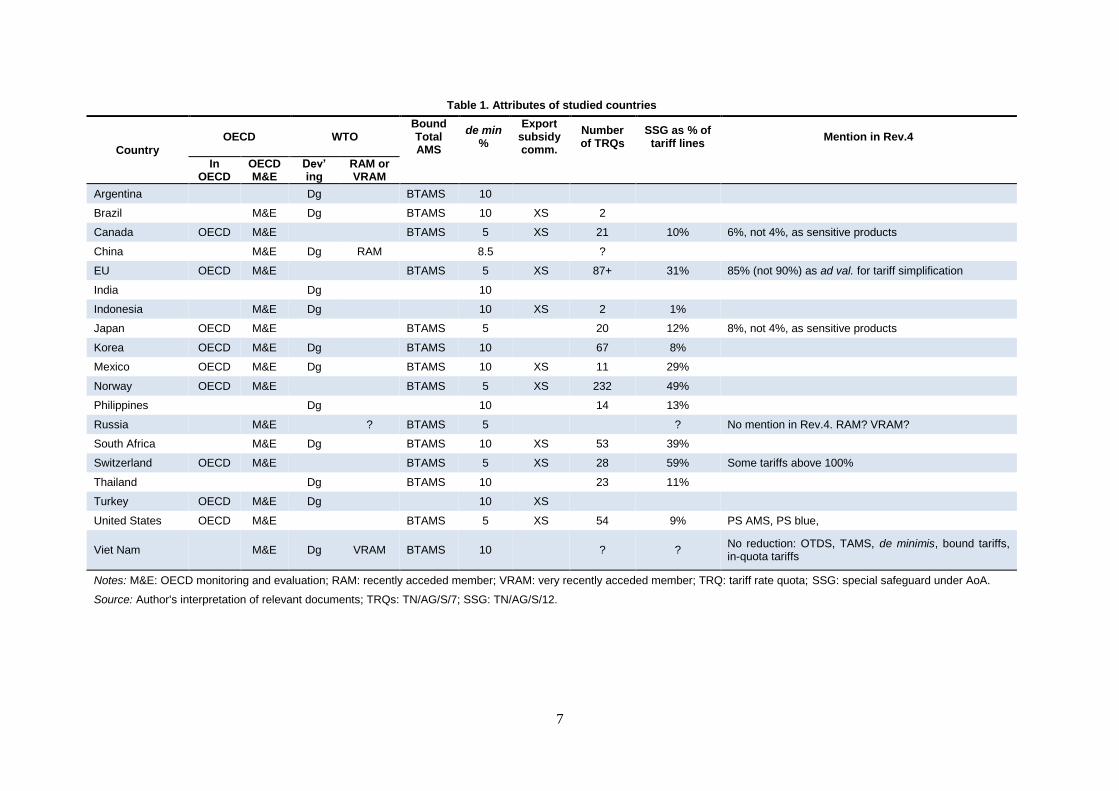
3. The paper examines 19 countries, some with less depth than the others.3 The varying depth
depends to some extent on the varying availability of relevant data for a country. The 19 countries are
Argentina, Brazil, Canada, China, the European Union (EU), India, Indonesia, Japan, Korea, Mexico,
Norway, the Philippines, Russia, South Africa, Switzerland, Thailand, Turkey, the United States (US),
and Viet Nam.4 Some of the characteristics of these countries in the context of reviewing WTO rules
and commitments are shown in Table 1 (terms and abbreviations are explained later in this paper).
4. In the AoA and the agriculture negotiations a distinction is made between developed and
developing countries. The WTO does not define which countries fall in which category. In agriculture
the following twelve countries are considered to be among the developing countries: Argentina,
1. This paper has been prepared for the OECD Trade and Agriculture Directorate. The views expressed
are those of the author and do not necessarily reflect those of the OECD or OECD member country
governments.
2. The draft modalities of interest here are those contained in the WTO document TN/AG/W/4/Rev.4
(WTO 2008a). They are therefore referred to as Rev.4.
3. Contrary to WTO practice, this study refers to WTO Members as countries. The scheduled
commitments in agriculture of the 28 European Union (EU) member states are overridden by the
scheduled commitments of the EU, itself a WTO Member. Switzerland and Liechtenstein, both WTO
Members, are subject to the commitments of the single schedule of Switzerland-Liechtenstein, here
referred to as Switzerland.
4. China refers to the People’s Republic of China, the EU to the European Union with the number of
member states varying by the year of reference, Korea to the Republic of Korea, and Russia to the
Russian Federation.
6
Brazil, China, India, Indonesia, Korea, Mexico, the Philippines, South Africa, Thailand, Turkey, and
Viet Nam. The following seven countries are considered to be among the developed countries:
Canada, EU, Japan, Norway, Russia, Switzerland, and the United States. The WTO recognizes as
least-developed countries (LDCs) those countries that have been designated as such by the United
Nations. None of the 19 countries in this study is an LDC.
5. Many of the provisions in Rev.4 are worded in an unclear or ambiguous way. This is of
course necessary in a negotiating document but opens the door to countries interpreting the provisions
differently. Legal expertise would be required to convert Rev.4 provisions into a legally binding
agreement. This so far missing step reduces to some extent the confidence attaching to any review of
countries’ positioning in relation to Rev.4 rules and commitments.
2. Background
2.1. Timeline towards the draft modalities and Bali
6. What is referred to here as policy is in reality a number of policy settings, such as the rules,
constraints, or parameters imposed by governments under legislation, regulations, decree,
administrative practice, etc. This may fall under the labels of a country’s agricultural policy or trade
policy or some other policy label. The policy settings of interest are those that are governed by the
Agreement on Agriculture and would be governed by a new agreement incorporating the specifics of
the draft modalities. Some policy settings are as simple to compare to a commitment as an applied
tariff relative to a bound tariff commitment. The complexity in this case comes from the large number
of tariff lines. Other policy settings are not so directly governed by WTO commitments: in domestic
support the commitments operate on calculated applied support of a certain kind, and there are usually
many policy settings working together to generate the support that is subject to a limit.
7. The Uruguay Round (UR) of trade negotiations resulted in a number of trade agreements
and the establishment of the WTO in 1995. The AoA sets rules for trade and domestic policies in
agriculture or for their effects. WTO members implemented their legally binding AoA commitments
in market access, export competition and domestic support over the period 1995-2000 (developed
countries) and 1995-2004 (developing countries). The 2000 or 2004 levels, respectively, have since
remained as members’ final bound commitments, inscribed in each member’s WTO schedule of
concessions and commitments. Members that have acceded to the WTO from 1995 onwards have
bound commitments in place from the year of accession, in some cases reaching the final bound level
a few years after the year of accession.
8. The AoA required negotiations to begin in 1999 on continuing the process of “substantial
progressive reductions in support and protection resulting in fundamental reform” in agriculture
(WTO 1995, Article 20). Those negotiations were then incorporated in the Doha Round of wider trade
negotiations, or DDA, which was launched in 2001. By December 2008 the DDA had produced a set
of so-called draft modalities in agriculture (WTO 2008a). The WTO Secretariat explains that the draft
modalities “contain formulas for cutting tariffs and trade-distorting subsidies and related provisions”
and that they are the “chairperson’s judgement of what members might be able to agree”, based on
what they had proposed and debated in the negotiations (WTO 2008e).
9. The 2008 draft modalities are just that – they are not only a draft, they are also only
modalities. They give rules for how a country is to arrive at its new commitments but they do not give
the resulting commitments themselves. This means that the draft modalities need to be interpreted in
order to estimate what the corresponding commitments would be. The interpretation has to be made
on the basis of only partial information and is both subjective and imperfect. Moreover, everything in
the draft modalities “is conditional in the deepest sense” and “[c]ertain things are manifestly not yet
agreed” (WTO 2008a).
7
Table 1. Attributes of studied countries
Country
OECD WTO Bound Total AMS
de min %
Export subsidy comm.
Number of TRQs
SSG as % of tariff lines
Mention in Rev.4
In OECD
OECD M&E
Dev’ ing
RAM or VRAM
Argentina Dg BTAMS 10
Brazil M&E Dg BTAMS 10 XS 2
Canada OECD M&E BTAMS 5 XS 21 10% 6%, not 4%, as sensitive products
China M&E Dg RAM 8.5 ?
EU OECD M&E BTAMS 5 XS 87+ 31% 85% (not 90%) as ad val. for tariff simplification
India Dg 10
Indonesia M&E Dg 10 XS 2 1%
Japan OECD M&E BTAMS 5 20 12% 8%, not 4%, as sensitive products
Korea OECD M&E Dg BTAMS 10 67 8%
Mexico OECD M&E Dg BTAMS 10 XS 11 29%
Norway OECD M&E BTAMS 5 XS 232 49%
Philippines Dg 10 14 13%
Russia M&E ? BTAMS 5 ? No mention in Rev.4. RAM? VRAM?
South Africa M&E Dg BTAMS 10 XS 53 39%
Switzerland OECD M&E BTAMS 5 XS 28 59% Some tariffs above 100%
Thailand Dg BTAMS 10 23 11%
Turkey OECD M&E Dg 10 XS
United States OECD M&E BTAMS 5 XS 54 9% PS AMS, PS blue,
Viet Nam M&E Dg VRAM BTAMS 10 ? ? No reduction: OTDS, TAMS, de minimis, bound tariffs, in-quota tariffs
Notes: M&E: OECD monitoring and evaluation; RAM: recently acceded member; VRAM: very recently acceded member; TRQ: tariff rate quota; SSG: special safeguard under AoA.
Source: Author's interpretation of relevant documents; TRQs: TN/AG/S/7; SSG: TN/AG/S/12.
8
10. With the DDA negotiations having reached an impasse after 2008, Ministers agreed at the
WTO Ministerial Conference in 2011 to advance the negotiations by focussing on certain issues on
which Ministers agreed progress could be achieved. At the subsequent Ministerial Conference in
December 2013 in Bali, Indonesia, Ministers adopted DDA decisions on four issues under the heading
of agriculture: general services, public stockholding for food security purposes, tariff rate quota
administration, and export competition. These decisions, along with several other decisions outside of
agriculture, are seen as the key to unlocking the DDA impasse. Outside of agriculture, the role of
progress on trade facilitation has been highlighted by later developments.
2.2 Context for examining countries’ positioning
11. With the passage of time both since the entry into force of most WTO members’
commitments in 2000 or 2004 and since the drafting of the 2008 draft modalities, international
agricultural markets and countries’ agricultural and trade policies have changed, in some cases
significantly (OECD 2014a, 2014b). These developments motivate an examination of how countries
are currently positioned in terms of their policy settings relative to the AoA commitments and to the
commitments that would result if the provisions of the 2008 draft modalities were implemented. This
examination also encompasses a discussion of the implications of the Bali decisions in agriculture.
12. The examination perforce works with numerous hypothetical or artificial variables.
Although information on countries’ policy settings relates to situations several years prior to 2014, it
is assumed that it adequately represents the situation in 2014. If agreement on the draft modalities of
Rev.4 had been reached in 2014, time would be needed to translate the modalities of Rev.4 into a new
agreement to replace or amend the AoA. That process would perhaps allow a new or amended
agreement to enter into force only in 2016 at the earliest. Many of the new commitments specified in
Rev.4 would then be phased in over several years, reaching their final bound levels only after three,
five, ten or even more years. The examination nevertheless treats the final bound levels as if they were
to apply in 2014.
3. Market access
3.1. Agreement on Agriculture
13. Under the AoA countries replaced non-tariff border measures on imports with tariffs.
Access opportunities are in some cases ensured by tariff rate quotas (TRQs): imports up to the given
quota quantity can enter with a low or zero tariff rate and imports above the quota quantity enter with
a higher tariff rate. For many products where tariffs replaced non-tariff measures, a number of
countries have the right to use a “special safeguard” in agriculture to impose an additional tariff if
certain conditions are met regarding import volumes or prices. Some countries saw the ability to
invoke the special safeguard as a necessary part of replacing non-tariff measures with tariffs.
14. Special rules for the imports of rice applied to Japan and Korea (also Israel for sheepmeat
and certain dairy products) for a certain period and continue to apply for the Philippines. The rules
include provisions for progressively increasing import quotas. Japan does not apply the special rules
since 1999, Korea is poised to cease application at the end of 2014, and the Philippines has negotiated
a timeline to end on 30 June 2017 (WTO 2014h). The Philippines has increased the quota on rice
imports and is reducing the in-quota tariff (WTO 2014i).5 Its country-specific quotas are allocated to
China, India, Thailand and Viet Nam, among others. The quotas available to Thailand and Viet Nam
are several times larger than those of other suppliers. At the expiration of the special rules, the
Philippines will apply ordinary customs duties to imports of rice.
5. The quota volume, more than double the volume applying between 2005 and 2012, is fixed from
2014. The in-quota tariff rate of 40% in 2014 is reduced to 35% in 2015.
9
3.2. Draft modalities
3.2.1. General
15. The Rev.4 provisions on market access concern tariffs and TRQs. Many countries would
reduce bound tariffs, expand TRQs or introduce additional TRQs. Developing countries would
generally be allowed lesser or fewer tariff reductions and TRQ expansions. Different groups of
products would be subject to provisions differing from the general ones, such as sensitive products,
special products, commodities, tropical and diversification products, products subject to tariff
escalation provisions, and products identified under long-standing preferences and preference erosion.
Different groups of countries would enjoy different and usually less onerous treatment than the
general rule, such as recently acceded countries, very recently acceded countries, small vulnerable
economies, and least-developed countries. The latter two groups do not overlap with the set of
countries in this report. Some countries are identified by name for particular treatment, while
particular treatment is also provided for countries not identified by name but meeting certain
characteristics. Rev.4 would apply specific procedures to certain issues, such as tariff simplification,
and it would introduce rules for, e.g. a special safeguard mechanism different from the one in the AoA
and available only to developing countries.6
16. Altogether it is impossible to specify the full effects of the market access provisions for the
commitments that individual countries would take. This is partly because of the complexity and
overlapping nature of the market access provisions themselves, partly because of the menu of choices
offered for some provisions and for which a country’s behaviour cannot be predicted, and partly
because the outcome of the application of some provisions depends on data which countries have
submitted but which is not publicly available. Countries are usually not forthcoming about what
commitments they would enter into under rules that are still subject to negotiation and agreement,
although at least some countries have worked out what commitments they themselves would take
under different negotiating outcomes and in many cases also the commitments they expect on the part
of major trading partners. The following draws on a selection of publications that help shed light on
some of the commitments individual countries may take under rules that are more or less similar to
those of Rev.4.
3.2.2. Specifics on tariffs
17. The average of all the tariff cuts a developed country would make is at least 54%. This
would be achieved as the combined result of harmonizing tariff cuts according to a tiered formula,
where tariffs in a higher tier are cut by more than tariffs in a lower tier, treatment of sensitive
products, cuts relating to tariff escalation and tropical products, and any additional cuts needed to
reach the 54% target. The average of all the tariff cuts a developing country would make is no more
than 36%. If the combined result of harmonizing tariff cuts according to the tiered formula and the
treatment of sensitive products implies an average cut of more than 36%, a developing country may
apply lesser reductions proportionately across the tiers of the formula. Different rules apply to small
vulnerable economies and to some other developing countries.
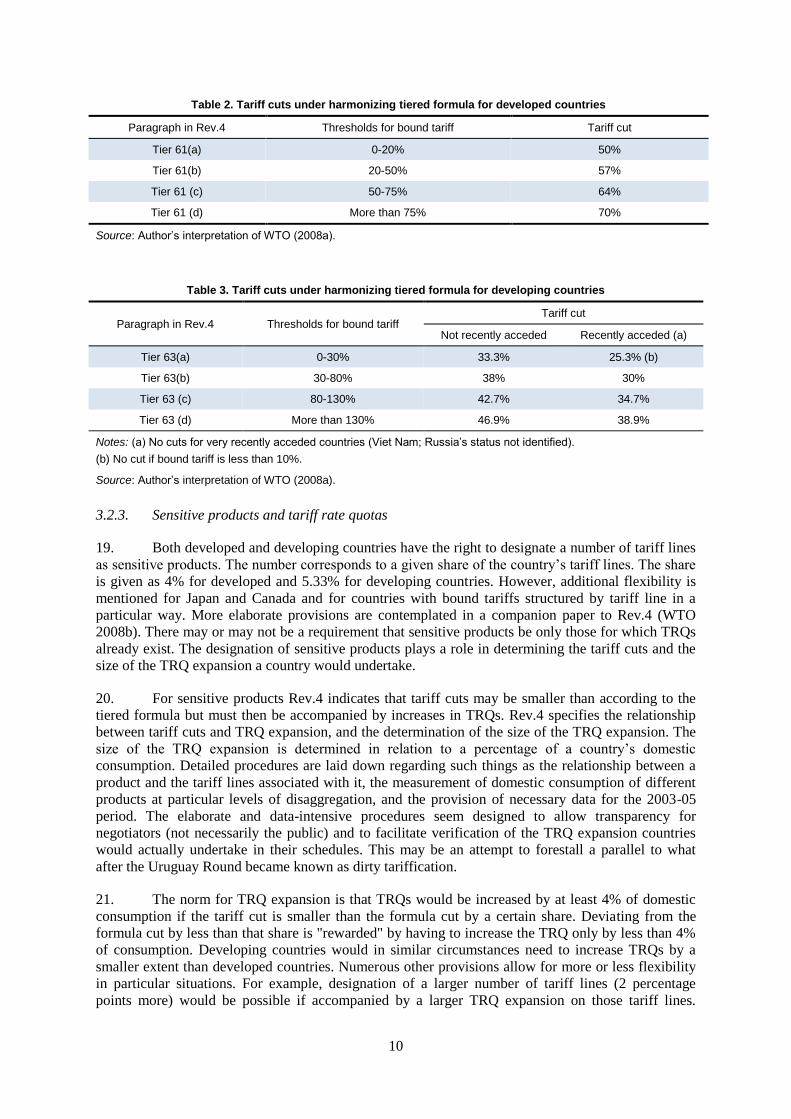
18. The harmonizing tariff cuts under the tiered formula for developed countries range from
50% to 70%, depending on the level of the bound tariff being cut (Table 2). The top tier of tariffs,
which face cuts by 70%, includes tariffs from 75% and up. The corresponding cuts for developing
countries range from 33.3% to 46.9%. The top tier of tariffs to be cut by 46.9% includes tariffs from
130% and up (Table 3). A given bound tariff, such as 100%, will thus be placed in the highest tier for
cuts by developed countries but only in the second highest tier for developing countries. Gentler tariff
cuts would be required from developing countries that are recently acceded countries, and very
recently acceded countries would not cut tariffs at all.
6. The special agricultural safeguard in the AoA is usually referred to as SSG, as entered in countries’
schedules, while the mechanism in Rev.4 is called SSM.
10
Table 2. Tariff cuts under harmonizing tiered formula for developed countries
Paragraph in Rev.4 Thresholds for bound tariff Tariff cut
Tier 61(a) 0-20% 50%
Tier 61(b) 20-50% 57%
Tier 61 (c) 50-75% 64%
Tier 61 (d) More than 75% 70%
Source: Author’s interpretation of WTO (2008a).
Table 3. Tariff cuts under harmonizing tiered formula for developing countries
Paragraph in Rev.4 Thresholds for bound tariff Tariff cut
Not recently acceded Recently acceded (a)
Tier 63(a) 0-30% 33.3% 25.3% (b)
Tier 63(b) 30-80% 38% 30%
Tier 63 (c) 80-130% 42.7% 34.7%
Tier 63 (d) More than 130% 46.9% 38.9%
Notes: (a) No cuts for very recently acceded countries (Viet Nam; Russia’s status not identified).
(b) No cut if bound tariff is less than 10%.
Source: Author’s interpretation of WTO (2008a).
3.2.3. Sensitive products and tariff rate quotas
19. Both developed and developing countries have the right to designate a number of tariff lines
as sensitive products. The number corresponds to a given share of the country’s tariff lines. The share
is given as 4% for developed and 5.33% for developing countries. However, additional flexibility is
mentioned for Japan and Canada and for countries with bound tariffs structured by tariff line in a
particular way. More elaborate provisions are contemplated in a companion paper to Rev.4 (WTO
2008b). There may or may not be a requirement that sensitive products be only those for which TRQs
already exist. The designation of sensitive products plays a role in determining the tariff cuts and the
size of the TRQ expansion a country would undertake.
20. For sensitive products Rev.4 indicates that tariff cuts may be smaller than according to the
tiered formula but must then be accompanied by increases in TRQs. Rev.4 specifies the relationship
between tariff cuts and TRQ expansion, and the determination of the size of the TRQ expansion. The
size of the TRQ expansion is determined in relation to a percentage of a country’s domestic
consumption. Detailed procedures are laid down regarding such things as the relationship between a
product and the tariff lines associated with it, the measurement of domestic consumption of different
products at particular levels of disaggregation, and the provision of necessary data for the 2003-05
period. The elaborate and data-intensive procedures seem designed to allow transparency for
negotiators (not necessarily the public) and to facilitate verification of the TRQ expansion countries
would actually undertake in their schedules. This may be an attempt to forestall a parallel to what
after the Uruguay Round became known as dirty tariffication.
21. The norm for TRQ expansion is that TRQs would be increased by at least 4% of domestic
consumption if the tariff cut is smaller than the formula cut by a certain share. Deviating from the
formula cut by less than that share is "rewarded" by having to increase the TRQ only by less than 4%
of consumption. Developing countries would in similar circumstances need to increase TRQs by a
smaller extent than developed countries. Numerous other provisions allow for more or less flexibility
in particular situations. For example, designation of a larger number of tariff lines (2 percentage
points more) would be possible if accompanied by a larger TRQ expansion on those tariff lines.
11
Moreover, Japan, Norway and Switzerland may be allowed a larger number of sensitive products than
otherwise would be the case in exchange for a larger TRQ expansion or deeper or faster tariff cuts.7
Also, a country with some tariffs above 100% (developed) or 150% (developing) after reduction
would not be able to keep the tariff at that level unless it was the tariff of a sensitive product and a
particular TRQ expansion was undertaken.
22. Rev.4 specifies two alternative rules regarding the products that could be designated as
sensitive and have a TRQ: either only those that have a TRQ pre-Rev.4 or any product. A companion
paper to Rev.4 elaborates on this issue and outlines some constrained flexibility for the creation of
new TRQs (WTO 2008c). Special rules would apply for Norway.
23. Developed countries would reduce certain bound in-quota tariff rates by 50% or to 10%
(some extra flexibility for Switzerland). Low in-quota rates would be cut to zero. Developing
countries would reduce bound in-quota rates by 15%. The corresponding reduction for recently
acceded countries would be 5%, and very recently acceded countries would not reduce in-quota tariff
rates at all.
3.2.4. Special products, tariff escalation, tariff simplification
24. Developing countries would be able to designate certain products as special products (the
special products designation is different from the sensitive product designation). In the general case
up to 12% of the country’s tariff lines could be so designated, based on twelve specified criteria for
food security, livelihood security and rural development. The tariff cuts on these products would
average 11%. A percentage of products would see no tariff cuts. Recently acceded countries could
designate a slightly larger share of tariff lines as special products and would cut tariffs by slightly less.
The twelve criteria for food security, livelihood and rural development include a wide variety of
indicators, such as whether the product is a staple food in some way, or accounts for a large share of
domestic consumption, production, employment, income, or expenditure, or it was notified as
receiving certain kinds of domestic support by any WTO member and the product was exported by
that member in any year between 1995 and 2001.8
25. Developed countries and perhaps some developing countries would cut tariffs by more than
the formula cut on certain products identified in Rev.4 as being subject to tariff escalation treatment.
Processed products with tariffs higher than the corresponding primary product would in many cases
take the tariff cut of the tier above the tier where it belongs. Some moderating rules apply to this
treatment. Moreover, this tariff escalation treatment does not apply to sensitive products. In cases
where formula cuts and tariff escalation treatment do not eliminate tariff escalation, Rev.4 requires
countries to engage with commodity-dependent producing countries to ensure satisfactory solutions.
26. Some countries express their tariffs on some products in other forms than ad valorem. Rev.4
requires the conversion of tariffs into ad valorem tariffs, subject to given methodological terms and
conditions. Either all of a country’s tariffs would be converted, or 90% of its tariffs would first be
converted, followed by a review and a later decision on how to thereafter convert the remainder. The
EU would be able to retain 5% of tariffs as compound or mixed tariffs. Rev.4 foresees that some
complex forms of bound tariffs (composition matrices) can be converted to specific tariffs. These
tariff simplification provisions are thought to be aimed particularly at the EU, which uses composition
matrices for its tariffs on some products to a greater extent than most other countries. The method for
converting tariffs to ad valorem tariffs depends on the use of import unit values from 1999-2001 and
7. These provisions for Japan, Norway and Switzerland are in square brackets, signifying perhaps an
even greater tentativeness and difference of opinion than for the rest of the text. See also WTO
(2008b).
8. This refers to domestic support classified as AMS or blue box support; see later section on domestic
support.
12
follows detailed procedures that were first circulated in 2005. The specificity of the procedures and
the data are thought to be designed so as to ensure that all countries use the same data and procedures,
which increases everyone’s confidence in the results. A verification procedure is nevertheless built
into the tariff simplification process. Even if a country does not convert all its non-ad valorem tariffs
to ad valorem form, an ad valorem expression is needed in order to place the tariff in the appropriate
tier for reduction.
3.2.5. Special agricultural safeguard, tropical products, preferences
27. Among the 19 countries in this study, 15 have commitments on a total of 668 tariff rate
quotas in agriculture.9 Most or perhaps all of the tariff lines with TRQs can apply the special
agricultural safeguard (SSG) against imports. Rev.4 foresees first reducing the share of tariff lines
eligible for the SSG to 1% of tariff lines for developed countries and then eliminating the SSG.
Developing countries would reduce the share to 2.5% of tariff lines but would not need to eliminate
the SSG.
28. Rev.4 identifies numerous tropical and diversification products. Developed countries would
undertake tariff cuts for these products under one of two alternative provisions, in either case over and
above the tariff cuts resulting from the formula cuts. For products with tariffs below 25% or 10%,
depending on the alternative, the tariff would be reduced to zero. For products with the highest tariffs,
the percentage cuts would be greater than those corresponding to the highest tariff tier in the tiered
formula.
29. Rev.4 identifies about 54 products at the six-digit tariff line level under the heading long-
standing preferences and preference erosion. It specifies that the tariff cuts for these products would
be delayed by a certain number of years and/or implemented more slowly than otherwise would be the
case.
3.2.6. Special safeguard mechanism
30. Rev.4 provides for a new “special safeguard mechanism” (SSM) to be available to
developing countries only (the conditional nature of Rev.4 may apply particularly to its SSM
provisions). It would use volume triggers for increases in the tariff by a given percentage or a given
number of percentage points. The allowed increases would be larger the larger the import volume
above a given threshold. It would use price triggers for increases in the tariff by 85% of the difference
between the trigger price and the import price. Some conditions and limitations would apply on the
use of the SSM. A Rev.4 companion paper provides additional specificity on some aspects of SSM
(WTO 2008d). Some of the issues discussed in the negotiations concern how long the SSM tariff
could be applied and how it would relate to the pre-Rev.4 tariff binding. This latter issue is
particularly relevant where all or some of a country’s tariffs are not reduced under Rev.4 – applying
the SSM could raise the applied tariff above its pre-Rev.4 bound level.
3.3. Bali decision
31. At the conference in 2013 Ministers decided on an understanding on TRQ administration
provisions in agriculture (WTO 2013e). In many cases a country’s imports under the TRQ regime for
a product are consistently much below the quota quantity – there is underfill. Reasons for this include
low supply of the product from exporters and a large domestic supply in the country applying the
9. Canada (21), China (10), EU (128), India (4), Indonesia (2), Japan (20), Korea (67), Mexico (11),
Norway (232), Philippines (14), South Africa (53), Switzerland (26), Thailand (23), United States
(54) and Viet Nam (3), drawing on WTO (2014g). Russia also has TRQs. The WTO indicates that 37
members have a total of 1,374 TRQs, which likely includes those in the schedules of individual EU
member states. http://www.wto.org/english/tratop_e/agric_e/ag_intro02_access_e.htm.
13
TRQ. It is also thought that the way the quota is administered can be a barrier to imports and result in
underfill.
32. Under the TRQ decision, in a situation of persistent underfill and where information-sharing
and consultations have proven fruitless, the importing country would have to provide unencumbered
access up to the quota limit through one of two prescribed methods (a developing country may also
keep its existing method). In the process leading to this step, a fill rate threshold of 65% plays an
important role. Several countries, including the United States, have opted out of applying the decision.
3.4. Market access situation
3.4.1. Changes in bindings
33. Countries’ tariff bindings in recent years are in most cases the same as in 2000 for
developed countries and 2004 for developing countries, i.e. the years by which the final bound
commitment levels of the Uruguay Round were reached. In some situations the bindings today (2014)
are different from those in 2000 or 2004. This is the case where countries have renegotiated some of
their bindings under the rules of the WTO, such as those relating to customs unions and free trade
areas and to modification of schedules.10
Other examples of tariff bindings changing over time are the
following.
The EU as a customs union has added member states since 2000, and some EU tariff or
TRQ bindings in agriculture have likely been renegotiated in that context.
The EU is reducing tariffs on some imports of bananas as part of the resolution of a WTO
dispute.
Japan and Korea abandoned quantitative import restrictions on rice only some years after the
usual 1995 tariffication by other countries.
Canada negotiated the introduction in 2009 of a TRQ regime for certain milk protein
substances.
India negotiated the introduction of TRQs for several product groups and products in
agriculture.
Countries that have acceded to the WTO since 2000 or 2004 often have tariff bindings that
have been or are being phased down to their final bound level.
China, having acceded in 2001, completed its tariff reductions before 2014.
Viet Nam, having acceded in 2007, completed most of its tariff reductions by 2014.
Russia, having acceded in 2012, implements some tariff reductions over several years.
34. For all these reasons, a country’s recent profile of tariff bindings is in many cases not
identical to the profile in 2000 or 2004, but overall the differences are likely only minor.
3.4.2. Tariff profiles
35. While the bound tariffs are important in describing the market access conditions a country
must offer under WTO rules, most countries apply lower tariffs on at least some tariff lines. Some
countries apply tariffs below the bound tariffs on many products in agriculture. Keeping these
circumstances in mind, the following picture of countries’ bound and applied tariffs is developed on
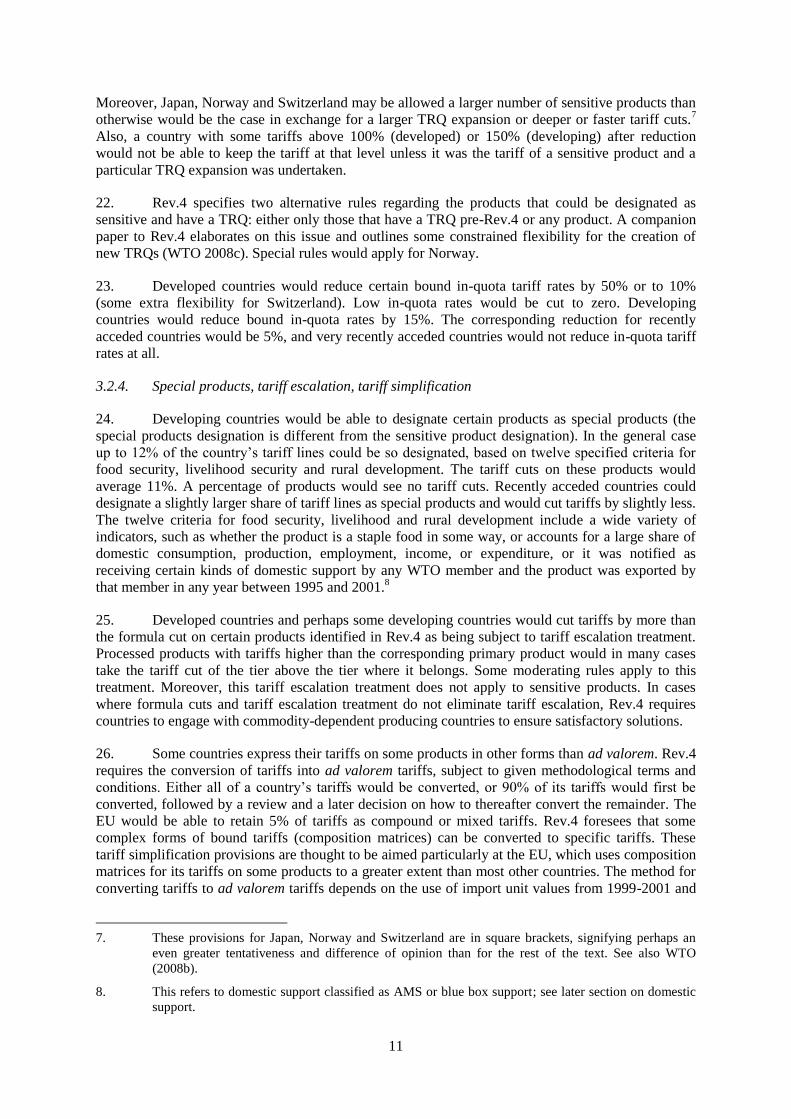
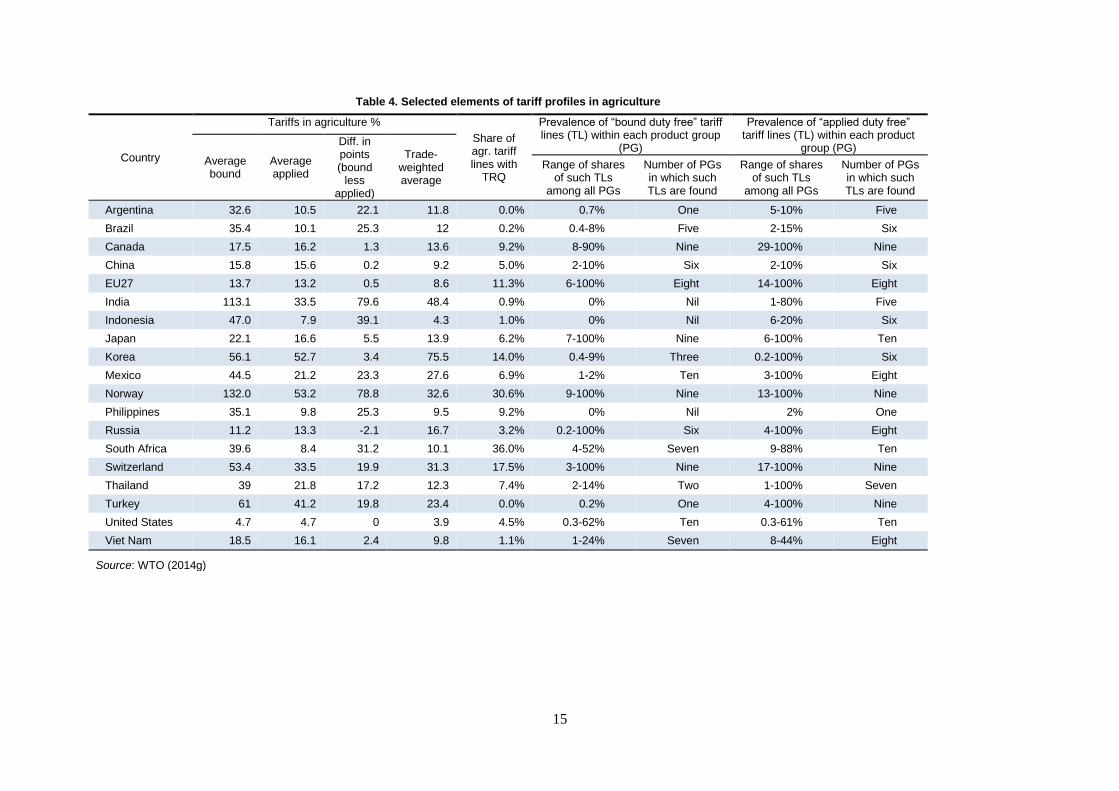
the basis of the WTO Tariff Profiles (WTO 2014g). Table 4 summarizes the Tariff Profile data for the
countries in this study. The applied tariffs are in most cases those of 2012. While a full-fledged
analysis would review data on individual tariff lines, the present analysis in some situations looks at
10. These rules are in Articles XXIV and XXVIII of the GATT of 1994.
14
the average tariff in each of ten product groups in agriculture. Tables with data from the WTO Tariff
Profiles are in an appendix to this report.
36. In implementing the tariff cuts under Rev.4, countries would reduce their bound tariffs over
a number of years. Almost all countries in the study have at least some tariff lines on which they
apply a lower tariff than the tariff bound in their WTO schedule. The extent of such “binding
overhang” varies from country to country. The US tariff profile shows the same bound and applied
rates in agriculture, i.e. no overhang. Among those countries with a difference, China shows the
smallest difference (0.2 percentage points) between bound and applied tariffs in agriculture and India
shows the largest difference (79.6 percentage points).11
The size of the difference matters. A country
may see itself affected by a cut in a bound tariff because it would reduce its flexibility to raise the
applied tariff in the future. A more direct effect arises when the cut in the bound tariff would be large
enough to force a reduction also in the applied tariff.12
For a given percentage reduction in the bound
tariff, this is obviously more likely to occur when the difference between the bound and the applied
tariffs is small, as for the United States and China, and to some extent also for Canada, the EU and
Korea.
37. The tariff profiles of all the countries in this study, except Argentina and Turkey, show the
presence of TRQs in agriculture to a varying extent. In some situations a product with a TRQ also
enjoys a high over-quota tariff, but this is not always the case. Depending on how countries select
their sensitive and special products under Rev.4, TRQs would need to be expanded and in-quota
tariffs reduced. The countries for which the rules about TRQs matter the most, because they have
TRQs on a large share of their tariff lines, include South Africa (36% of tariff lines in agriculture),
Norway (31%), Switzerland (18%), Korea (14%) and the EU (11%).
38. At the same time, some countries with TRQs on a smaller share of tariff lines may be
particularly reliant on those TRQs for import protection in a given product sector and would thus be
particularly affected by a TRQ expansion or a reduction of the in-quota tariff. This may be the case
for Canada, which has during the DDA vigorously resisted a weakening of its import protection in
certain sectors, such as dairy.
11. The negative difference between the average bound and the 2012 applied tariffs of Russia is likely
due to the process of tariff reductions having been just initiated with Russia’s WTO accession in
2012.
12. Laborde et al. (2011) point out that this so-called “pain” a country experiences in cutting tariffs is
accompanied by a less easily observed “gain” that the country experiences as a result of other
countries cutting their tariffs.
15
Table 4. Selected elements of tariff profiles in agriculture
Country
Tariffs in agriculture %
Share of agr. tariff lines with
TRQ
Prevalence of “bound duty free” tariff lines (TL) within each product group
(PG)
Prevalence of “applied duty free” tariff lines (TL) within each product
group (PG) Average bound
Average applied
Diff. in points (bound
less applied)
Trade-weighted average
Range of shares of such TLs
among all PGs
Number of PGs in which such TLs are found
Range of shares of such TLs
among all PGs
Number of PGs in which such TLs are found
Argentina 32.6 10.5 22.1 11.8 0.0% 0.7% One 5-10% Five
Brazil 35.4 10.1 25.3 12 0.2% 0.4-8% Five 2-15% Six
Canada 17.5 16.2 1.3 13.6 9.2% 8-90% Nine 29-100% Nine
China 15.8 15.6 0.2 9.2 5.0% 2-10% Six 2-10% Six
EU27 13.7 13.2 0.5 8.6 11.3% 6-100% Eight 14-100% Eight
India 113.1 33.5 79.6 48.4 0.9% 0% Nil 1-80% Five
Indonesia 47.0 7.9 39.1 4.3 1.0% 0% Nil 6-20% Six
Japan 22.1 16.6 5.5 13.9 6.2% 7-100% Nine 6-100% Ten
Korea 56.1 52.7 3.4 75.5 14.0% 0.4-9% Three 0.2-100% Six
Mexico 44.5 21.2 23.3 27.6 6.9% 1-2% Ten 3-100% Eight
Norway 132.0 53.2 78.8 32.6 30.6% 9-100% Nine 13-100% Nine
Philippines 35.1 9.8 25.3 9.5 9.2% 0% Nil 2% One
Russia 11.2 13.3 -2.1 16.7 3.2% 0.2-100% Six 4-100% Eight
South Africa 39.6 8.4 31.2 10.1 36.0% 4-52% Seven 9-88% Ten
Switzerland 53.4 33.5 19.9 31.3 17.5% 3-100% Nine 17-100% Nine
Thailand 39 21.8 17.2 12.3 7.4% 2-14% Two 1-100% Seven
Turkey 61 41.2 19.8 23.4 0.0% 0.2% One 4-100% Nine
United States 4.7 4.7 0 3.9 4.5% 0.3-62% Ten 0.3-61% Ten
Viet Nam 18.5 16.1 2.4 9.8 1.1% 1-24% Seven 8-44% Eight
Source: WTO (2014g)
16
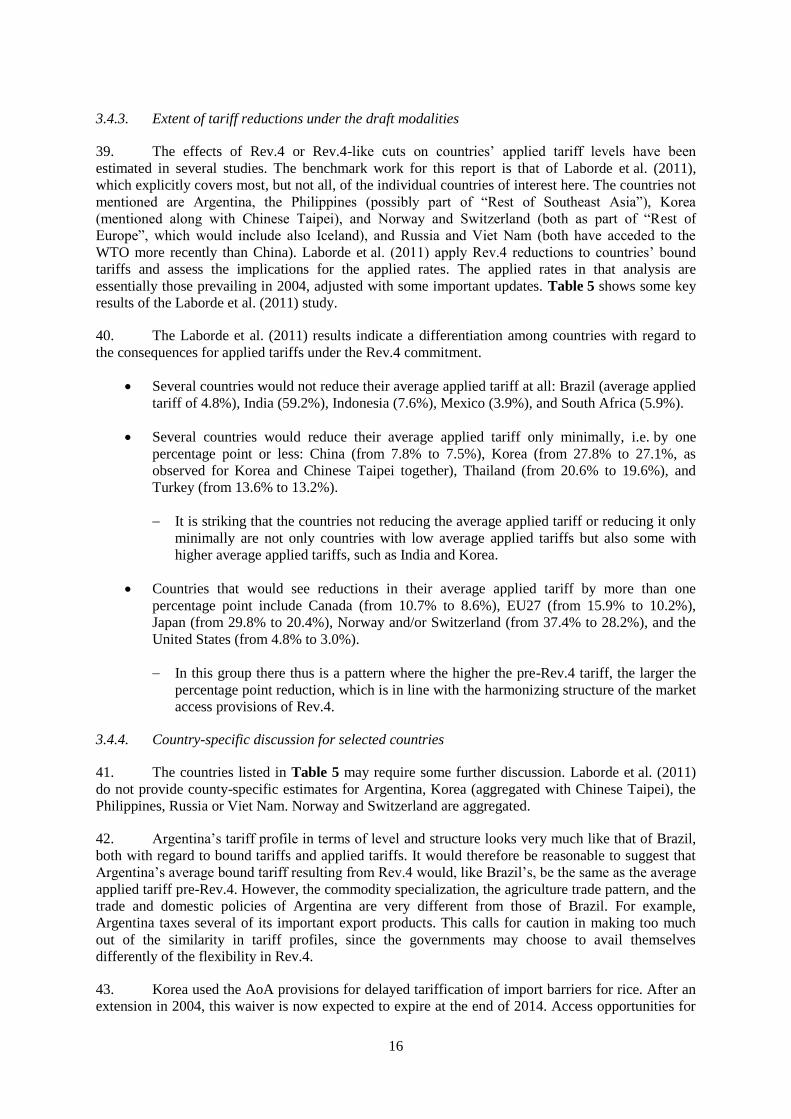
3.4.3. Extent of tariff reductions under the draft modalities
39. The effects of Rev.4 or Rev.4-like cuts on countries’ applied tariff levels have been
estimated in several studies. The benchmark work for this report is that of Laborde et al. (2011),
which explicitly covers most, but not all, of the individual countries of interest here. The countries not
mentioned are Argentina, the Philippines (possibly part of “Rest of Southeast Asia”), Korea
(mentioned along with Chinese Taipei), and Norway and Switzerland (both as part of “Rest of
Europe”, which would include also Iceland), and Russia and Viet Nam (both have acceded to the
WTO more recently than China). Laborde et al. (2011) apply Rev.4 reductions to countries’ bound
tariffs and assess the implications for the applied rates. The applied rates in that analysis are
essentially those prevailing in 2004, adjusted with some important updates. Table 5 shows some key
results of the Laborde et al. (2011) study.
40. The Laborde et al. (2011) results indicate a differentiation among countries with regard to
the consequences for applied tariffs under the Rev.4 commitment.
Several countries would not reduce their average applied tariff at all: Brazil (average applied
tariff of 4.8%), India (59.2%), Indonesia (7.6%), Mexico (3.9%), and South Africa (5.9%).
Several countries would reduce their average applied tariff only minimally, i.e. by one
percentage point or less: China (from 7.8% to 7.5%), Korea (from 27.8% to 27.1%, as
observed for Korea and Chinese Taipei together), Thailand (from 20.6% to 19.6%), and
Turkey (from 13.6% to 13.2%).
It is striking that the countries not reducing the average applied tariff or reducing it only
minimally are not only countries with low average applied tariffs but also some with
higher average applied tariffs, such as India and Korea.
Countries that would see reductions in their average applied tariff by more than one
percentage point include Canada (from 10.7% to 8.6%), EU27 (from 15.9% to 10.2%),
Japan (from 29.8% to 20.4%), Norway and/or Switzerland (from 37.4% to 28.2%), and the
United States (from 4.8% to 3.0%).
In this group there thus is a pattern where the higher the pre-Rev.4 tariff, the larger the
percentage point reduction, which is in line with the harmonizing structure of the market
access provisions of Rev.4.
3.4.4. Country-specific discussion for selected countries
41. The countries listed in Table 5 may require some further discussion. Laborde et al. (2011)
do not provide county-specific estimates for Argentina, Korea (aggregated with Chinese Taipei), the
Philippines, Russia or Viet Nam. Norway and Switzerland are aggregated.
42. Argentina’s tariff profile in terms of level and structure looks very much like that of Brazil,
both with regard to bound tariffs and applied tariffs. It would therefore be reasonable to suggest that
Argentina’s average bound tariff resulting from Rev.4 would, like Brazil’s, be the same as the average
applied tariff pre-Rev.4. However, the commodity specialization, the agriculture trade pattern, and the
trade and domestic policies of Argentina are very different from those of Brazil. For example,
Argentina taxes several of its important export products. This calls for caution in making too much
out of the similarity in tariff profiles, since the governments may choose to avail themselves
differently of the flexibility in Rev.4.
43. Korea used the AoA provisions for delayed tariffication of import barriers for rice. After an
extension in 2004, this waiver is now expected to expire at the end of 2014. Access opportunities for
17
imports of rice have increased considerably since 2005, reaching 8% of domestic consumption in
2014 (WTO 2012a). Media reports suggest that the tariff replacing the quantitative restriction on rice
imports from 1 January 2015 would be 513% (Korea Herald 2014).
44. Norway and Switzerland are aggregated (along with Iceland) by Laborde et al. (2011).
There is some rationale for this, since both countries support their agriculture through import barriers
and there are other similarities as well, such as the structure of agriculture. However, the WTO Tariff
Profiles show that Norway has a higher average bound tariff and a higher average applied tariff, as
well as a considerably larger share of tariff lines with TRQs. Blandford et al. (2009) indicate Norway
might select 81 tariff lines as sensitive products, consisting of all principal Norwegian products, such
as grain, meat and milk products. All these products would see a reduction in bound tariffs and an
increase in TRQs. It has not been possible to identify any studies on the changes in market access
Switzerland might make in complying with Rev.4 commitments.
Table 5. Tariff profiles before and after Rev.4 reductions
Country Before Rev.4 reduction After Rev.4 reduction
Average applied Without flexibility With flexibility
Argentina Brazil 4.8 4.7 4.8
Canada 10.7 5.1 8.6
China 7.8 5.3 7.5
EU27 15.9 6.6 10.2
India 59.2 54.6 59.2
Indonesia 7.6 7.0 7.6
Japan 29.8 14.0 20.4
Korea 27.8 18.5 27.1
Mexico 3.9 3.3 3.9
Norway 37.4 19.5 28.2
Philippines Russia South Africa 5.9 5.3 5.9
Switzerland Thailand 20.6 15.3 19.6
Turkey 13.6 10.9 13.2
United States 4.8 2.1 3.0
Viet Nam Notes: Analysis based mainly on 2004 data, with important updates. Flexibility refers to Rev.4 provisions other than
reductions under the harmonizing formula.
Source: Laborde et al. (2011).
45. The Philippines applies tariffs in agriculture much below their bound levels. This by itself
suggests that the Rev.4 reductions and new bindings would affect the presently applied levels little, if
at all. However, the situation with regard to rice imports – the continued use of quantitative import
restrictions instead of tariffs until 30 June 2017 – complicates the interpretation of tariff averages, as
does the low binding coverage of only 67% of the tariff lines in agriculture.
46. Russia acceded to the WTO in 2012, reducing tariffs immediately on 60% of agricultural
tariff lines (OECD 2013; Kiselev and Romashkin 2012). Some tariffs are being reduced to final bound
levels by 2017. The average final bound rate in agriculture would be 10.8%, down from 13.2% before
accession. Some products will have final bound tariffs at zero level. TRQs are in effect for certain
pork products until 2020, when a bound tariff will apply. TRQs also apply to imports of beef and
18
poultry. Not having been party to the development of Rev.4 prior to its accession, Russia may or may
not be considered a recently acceded country. Although its accession is more recent than those of the
countries explicitly identified in Rev.4 as very recently acceded countries, Russia is of course not so
identified. If Russia were a recently acceded country, it would reduce final bound tariffs, starting one
year after the tariff reaches its final bound level after accession. However, the reduction would apply
only to tariffs larger than 10%, of which Russia has only relatively few. In-quota tariffs of no more
than 15% would not need to be reduced (the in-quota tariff for poultry is 25%). If it were a very
recently acceded country, Russia would not reduce its final bound tariffs in agriculture. Thus,
depending on Russia’s status under Rev.4 classifications, its applied tariffs in agriculture would be
only minimally affected or not at all by Rev.4 commitments on bound tariffs.
47. Viet Nam acceded to the WTO in 2007. Named as a very recently acceded country in Rev.4,
it need not undertake any reductions in final bound tariffs, including in-quota tariffs, in agriculture. Its
applied tariffs would therefore not be affected by the Rev.4 commitments on bound tariffs.
3.4.5. Recent developments in tariff settings
48. The developments in international market prices for agricultural products in 2007 and later
years prompted many countries to reduce their applied tariffs from their 2004 level, even setting some
to zero. This makes a difference for the interpretation of the Laborde et al. (2011) results, which were
based essentially on 2004 levels. In general the lowering of applied tariffs in 2007, 2008 and 2009
from their 2004 levels increased the margin between applied and bound tariffs, making it less likely
that a Rev.4 reduction in a bound tariff would force a reduction also in the applied tariff. In other
words, Rev.4 reductions in bound tariffs would be easier for countries to make when applied tariffs
anyway were set at relatively low levels.
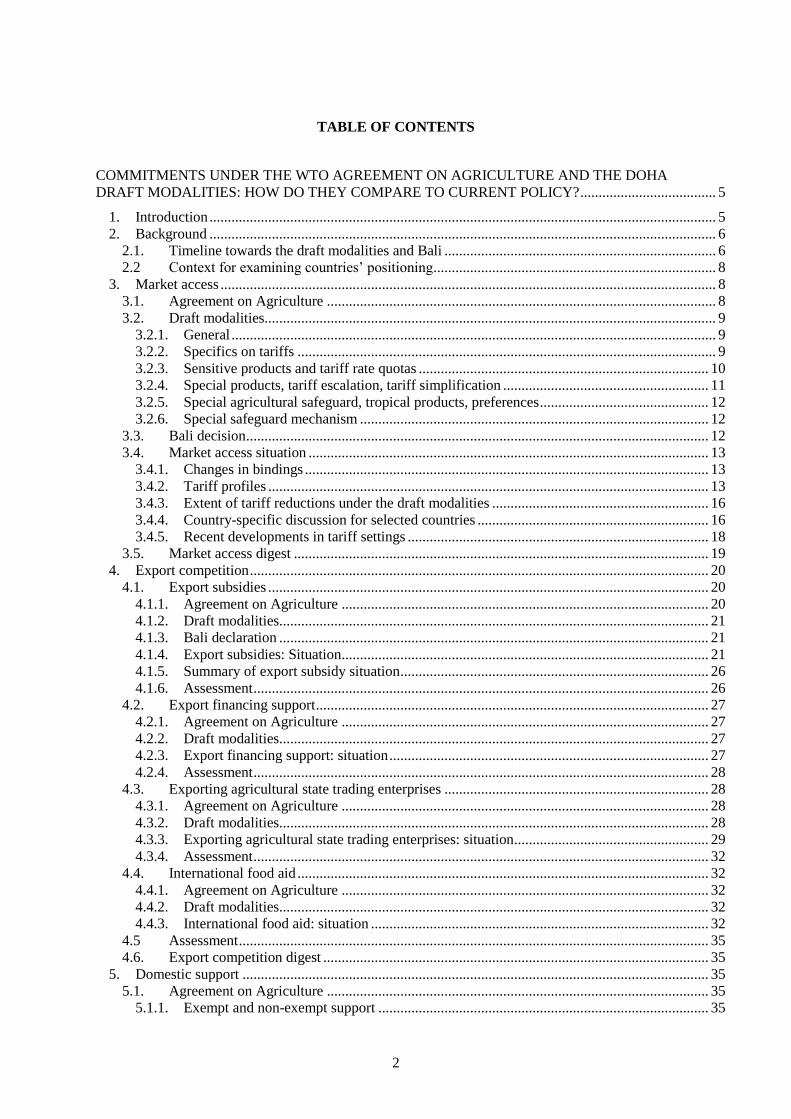
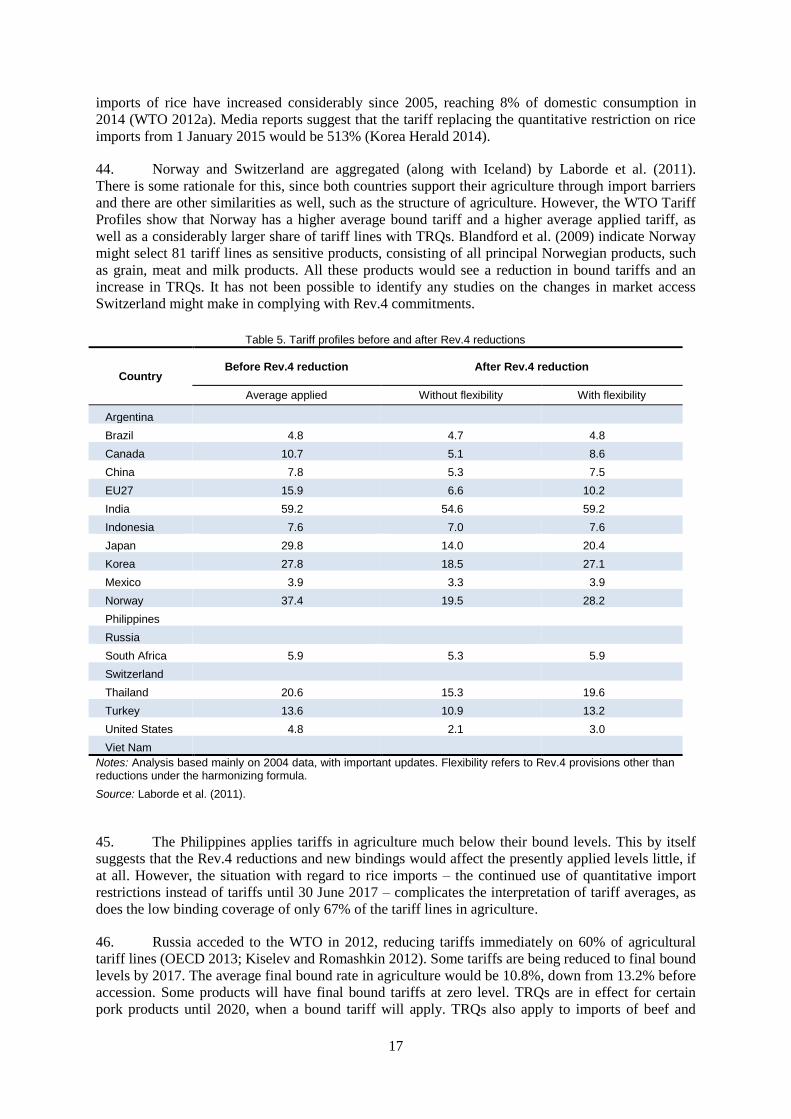
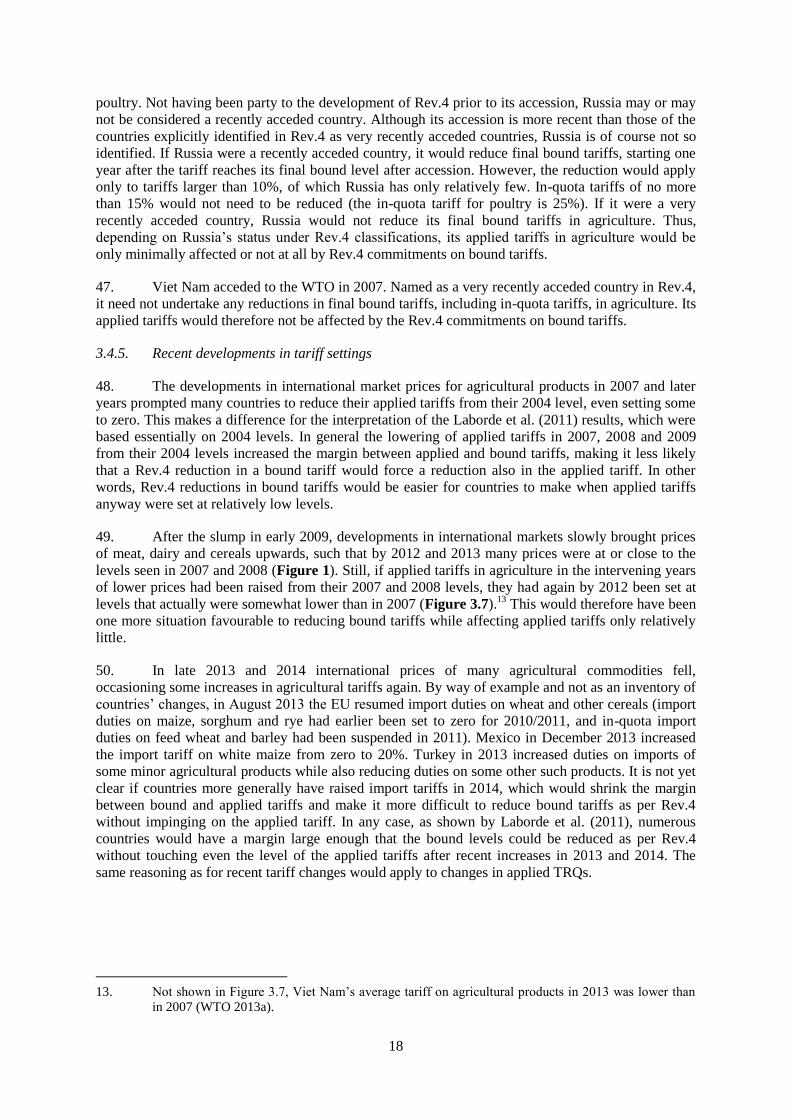
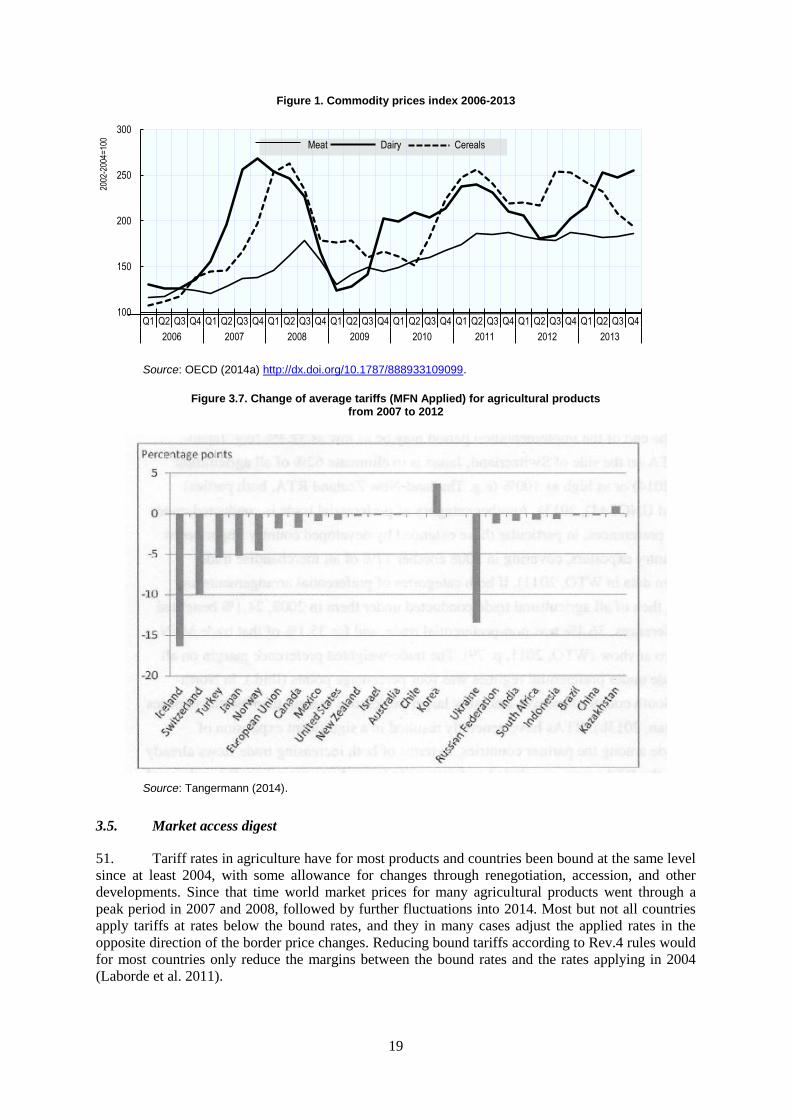
49. After the slump in early 2009, developments in international markets slowly brought prices
of meat, dairy and cereals upwards, such that by 2012 and 2013 many prices were at or close to the
levels seen in 2007 and 2008 (Figure 1). Still, if applied tariffs in agriculture in the intervening years
of lower prices had been raised from their 2007 and 2008 levels, they had again by 2012 been set at
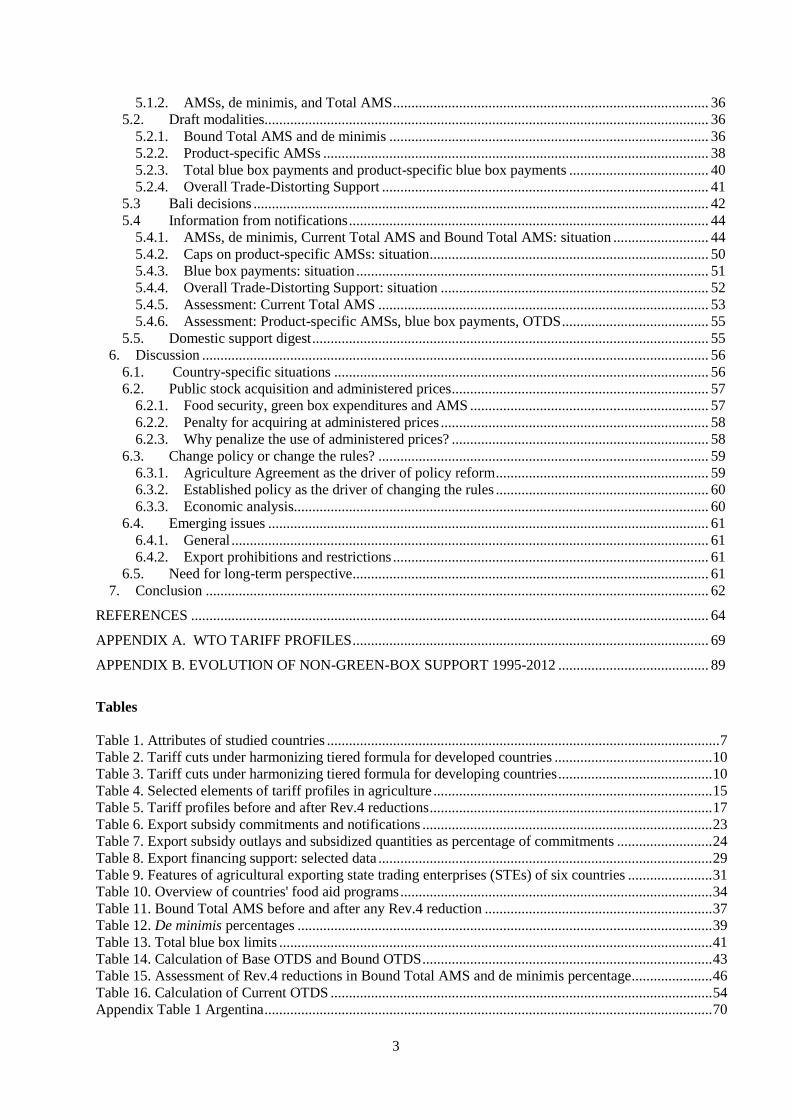
levels that actually were somewhat lower than in 2007 (Figure 3.7).13
This would therefore have been
one more situation favourable to reducing bound tariffs while affecting applied tariffs only relatively
little.
50. In late 2013 and 2014 international prices of many agricultural commodities fell,
occasioning some increases in agricultural tariffs again. By way of example and not as an inventory of
countries’ changes, in August 2013 the EU resumed import duties on wheat and other cereals (import
duties on maize, sorghum and rye had earlier been set to zero for 2010/2011, and in-quota import
duties on feed wheat and barley had been suspended in 2011). Mexico in December 2013 increased
the import tariff on white maize from zero to 20%. Turkey in 2013 increased duties on imports of
some minor agricultural products while also reducing duties on some other such products. It is not yet
clear if countries more generally have raised import tariffs in 2014, which would shrink the margin
between bound and applied tariffs and make it more difficult to reduce bound tariffs as per Rev.4
without impinging on the applied tariff. In any case, as shown by Laborde et al. (2011), numerous
countries would have a margin large enough that the bound levels could be reduced as per Rev.4
without touching even the level of the applied tariffs after recent increases in 2013 and 2014. The
same reasoning as for recent tariff changes would apply to changes in applied TRQs.
13. Not shown in Figure 3.7, Viet Nam’s average tariff on agricultural products in 2013 was lower than
in 2007 (WTO 2013a).
19
Figure 1. Commodity prices index 2006-2013
Source: OECD (2014a) http://dx.doi.org/10.1787/888933109099.
Figure 3.7. Change of average tariffs (MFN Applied) for agricultural products from 2007 to 2012
Source: Tangermann (2014).
3.5. Market access digest
51. Tariff rates in agriculture have for most products and countries been bound at the same level
since at least 2004, with some allowance for changes through renegotiation, accession, and other
developments. Since that time world market prices for many agricultural products went through a
peak period in 2007 and 2008, followed by further fluctuations into 2014. Most but not all countries
apply tariffs at rates below the bound rates, and they in many cases adjust the applied rates in the
opposite direction of the border price changes. Reducing bound tariffs according to Rev.4 rules would
for most countries only reduce the margins between the bound rates and the rates applying in 2004
(Laborde et al. 2011).
100
150
200
250
300
Q1 Q2 Q3 Q4 Q1 Q2 Q3 Q4 Q1 Q2 Q3 Q4 Q1 Q2 Q3 Q4 Q1 Q2 Q3 Q4 Q1 Q2 Q3 Q4 Q1 Q2 Q3 Q4 Q1 Q2 Q3 Q4
2006 2007 2008 2009 2010 2011 2012 2013
2002
-200
4=10
0
Meat Dairy Cereals
20
52. It can be argued that, to the extent applied rates actually have been changed, they had been
lowered between 2004 and 2007 (or 2008). Data on the difference in agricultural tariffs between 2007
and 2012 then actually indicate a further slight lowering of applied tariffs or at least not a general
reversal of any 2004-07 reductions. As international prices of many agricultural products have fallen
since 2012 and 2013, there could at present be a general tendency, in case of changes in applied
tariffs, towards increasing them.
53. According to Laborde et al. (2011) the margins between bound tariffs and applied tariffs at
the 2004 rates were large enough to allow the bound rates after Rev.4 reductions to remain larger than
the applied rates for several countries. For other countries the Rev.4 reduction in the bound rates
required reductions also in the applied rates, although the reductions in the applied rates were for
several countries quite small. This would suggest that in general the Rev.4 tariff reductions, if they
were implemented in 2014, would not require large changes in countries’ actual tariff settings.
However, this hypothetical reasoning would need to be anchored in actual analysis of countries’ tariff
settings in 2014. The same would apply to countries’ TRQ settings. There are also cases where the
reasoning based on tariff averages for country masks the particular concerns a country faces in
reducing tariffs for just a few products. To some extent such situations have been addressed through
the numerous special rules in Rev.4, but there may be situations where alternative solutions involving
policy change might be considered.
54. The AMIS Market Monitor reports monthly on selected policy developments, including
measures affecting imports and exports of wheat, corn, rice and soybeans (Market Monitor 2013 and
2014). Between March 2013 and July 2014 the Market Monitor reported some lowering of an import
barrier for one or more of these crops in Brazil, Indonesia, Korea, the Philippines, and Russia. This
took a variety of forms, including removal of a small import duty on grains, increasing import quotas
and waiving of tariffs, and applying temporary duty-free import quotas. However, over the same
period there were numerous measures taken to impede imports, although numbers of course say
nothing about the significance or impacts of the measures taken. While it is thus difficult to identify a
trend in either direction, the observations do suggest that many countries actively manage the level of
applied import protection within their bound tariffs and TRQs.
4. Export competition
55. The declaration of Ministers on export competition at the Bali conference in 2013 stated that
they are committed to enhancing transparency and improving monitoring in relation to all forms of
export subsidies and all export measures with equivalent effect. This would include holding annual
discussions in the WTO Committee on Agriculture to examine developments in the field of export
competition. The WTO Secretariat has accordingly compiled information from notifications and a
2014 questionnaire. The information covers export subsidies, export credits, export credit guarantees
or insurance programs, international food aid and agricultural exporting state trading enterprises
(WTO 2014a). The following draws to some extent on the information so compiled, discussed under
the headings export subsidies, export financing support, international food aid, and exporting state
trading enterprises.
4.1. Export subsidies
4.1.1. Agreement on Agriculture
56. The schedules of 18 countries include reduction commitments on export subsidies (counting
the EU28 schedule as one and counting none of its member states’ schedules). In the set of countries
in this report, the following do not have scheduled export subsidy commitments: Argentina, China,
India, Japan, Korea, Philippines, Russia, Thailand, and Viet Nam.
57. A country’s export subsidy schedule shows ceiling commitment levels on budgetary outlays
and quantities, disaggregated by a fairly standard set of commodity groups. Some countries’ schedules
21
show the set of tariff lines making up the commodity group. The commitment levels derive from
countries’ data on export subsidies in 1986-90, which they submitted in the Uruguay Round
negotiations. The final bound outlay commitments and the final bound quantity commitments
represent reductions from their average 1986-90 levels by certain percentages, which were smaller for
developing countries. Developed countries reached their final bound commitment levels on export
subsidization (outlays and quantities) in 2000 and developing countries in 2004.
4.1.2. Draft modalities
58. Rev.4 foresees the gradual elimination of export subsidy commitments and other
entitlements to provide export subsidies in agriculture. The phased elimination would see developed
countries’ commitments go to zero by 2013, with the phasing rules differing somewhat between those
applying to outlay commitments and those applying to quantity commitments. The specific mention
of the year 2013 relates to that year having been specified in the declaration of the WTO Ministerial
Conference in Hong Kong in 2005. Developing countries would phase out their outlay and quantity
commitments by 2016. Certain other export subsidy provisions for developing countries face an end
date of 2021.14
4.1.3. Bali declaration
59. In their declaration on export competition at the 2013 Ministerial conference in Bali,
Ministers expressed regret that it had not been possible by then to achieve the elimination of export
subsidies that was envisaged in 2005 (WTO 2013f). The Bali declaration did not establish a new
timetable for the elimination of export subsidies but is clear about achieving it as soon as possible. In
the meantime Ministers undertook to the maximum extent possible to keep the level of export
subsidies significantly below their commitment levels. Ministers recognized that the use of export
subsidies has decreased.
4.1.4. Export subsidies: Situation
60. Countries are required to notify their use of export subsidies to the Committee on
Agriculture. Countries with export subsidy commitments submit Table ES:1 notifications, indicating
the budgetary outlays and the quantities subsidized. Countries without export subsidy commitments
need to indicate annually that they have not provided export subsidies. Some countries without export
subsidy commitments need, however, to submit Supporting Table ES:2 notifications. This notification
reports the export subsidies the country has provided with reference to Article 9.4 of the AoA. The
article allows developing countries, under certain conditions, to provide subsidies to reduce the costs
of marketing exports of agricultural products and internal transport and freight charges to export
shipments. This article is available to any developing country, whether it has export subsidy
commitments or not. Article 9.4 treatment applies only in the “implementation period”, which the
AoA defines as “the six-year period commencing in the year 1995”, i.e. ending in 2000. Some
developing countries take the view, however, that Article 9.4 still applies and continue to provide the
export subsidies in question in more recent years.15
The effect in terms of interpreting the pattern of
14. The export subsidy provisions thus differ from market access and domestic support, where Rev.4
does not specify particular years for full implementation.
15. See, for example, questions and answers regarding Mexico (Ag-IMS ID 61066) and India (Ag-IMS
ID 67055, 68044) and information regarding Korea (WTO (2012a), III(3)(iii), para. 128). Some
countries suggest that the Ministerial declaration in Hong Kong in 2005 authorizes the continued use
of Article 9.4. The declaration says “Developing country Members will continue to benefit from the
provisions of Article 9.4 of the Agreement on Agriculture for five years after the end-date for
elimination of all forms of export subsidies.” The interpretation of this sentence is unclear, especially
in view of the fact that countries have not yet agreed on such an end date. It is also unclear what is the
legal authority of a Ministerial declaration, relative to that of the AoA.
22
notified export subsidies is that it cannot be taken for granted that developing countries without export
subsidy commitments always notify nil export subsidies.
61. Among the countries in this report, the following developed countries have export subsidy
commitments: Canada, EU, Norway, Switzerland, and the United States (Table 6). The developing
countries with export subsidy commitments are Brazil, Indonesia, Mexico, South Africa and Turkey.
In other words, 10 of the 19 countries studied have export subsidy commitments, with an even split
between developed and developing countries. Among the 32 countries that have acceded to the WTO
between 1995 and 2014, only Bulgaria and Panama have export subsidy commitments, i.e. neither
China, Russia nor Viet Nam.
62. There is a wide variation among countries in how up to date are their export subsidy
notifications (Table 6 – the table reports on notifications from 2008 onwards, not the full time series).
Some have notified up through 2013, while others lag behind by many years. Turkey’s latest
notification is for the year 2000. Most of the countries without export subsidy commitments have
reported that they did not provide any export subsidies either in 2008 or later years. This is the case
for Argentina, China, Japan, Philippines, Russia, Thailand and Viet Nam. Also some countries with
export subsidy commitments have reported that they did not provide such subsidies: Brazil, Indonesia
and South Africa. On the other hand, some countries without export subsidy commitments reported
export subsidies in some years from 2008 onwards: India and Korea. In doing so they invoke
Article 9.4 as mentioned above. Mexico likewise refers to that article in reporting export subsidies in
excess of its commitments.
63. While the absence of notifications for recent years for some countries weakens what can be
said generally about the whole group of countries, a couple of patterns in Table 6 stand out. One is
that countries that do not provide export subsidies, whether they have export subsidy commitments or
not, maintain that stance for several years.16
Likewise, countries invoking Article 9.4 (Supporting
Table ES:2 notifications) do so for several years.
64. Only a handful of products have been selected here, mainly corresponding to products that
are important in world trade.17
The products are actually groups of products, defined by each country
at the tariff line level in the data underlying its scheduled commitments. There is some variation
across countries in what they call the products entitled to export subsidies. Table 7 thus gives an
impressionistic overview of how countries’ export subsidies relate to their commitment levels, short
of a complete analysis of all products.
16. The ES:1 notifications for some countries with export subsidy commitments indicate nil export
subsidies for individual products (Brazil, Indonesia, South Africa). Table 1 shows them as “No XS”
in the same way as for those countries without export subsidy commitments, which simply state that
they did not provide any export subsidies.
17. The Committee on Agriculture requires countries that are significant exporters of certain products or
groups of products to submit annual notifications of their volume of exports of those products. The
updating of which countries are significant exporters has proven contentious in the Committee. It is
nevertheless not an issue in Rev.4 and is therefore not discussed further here.
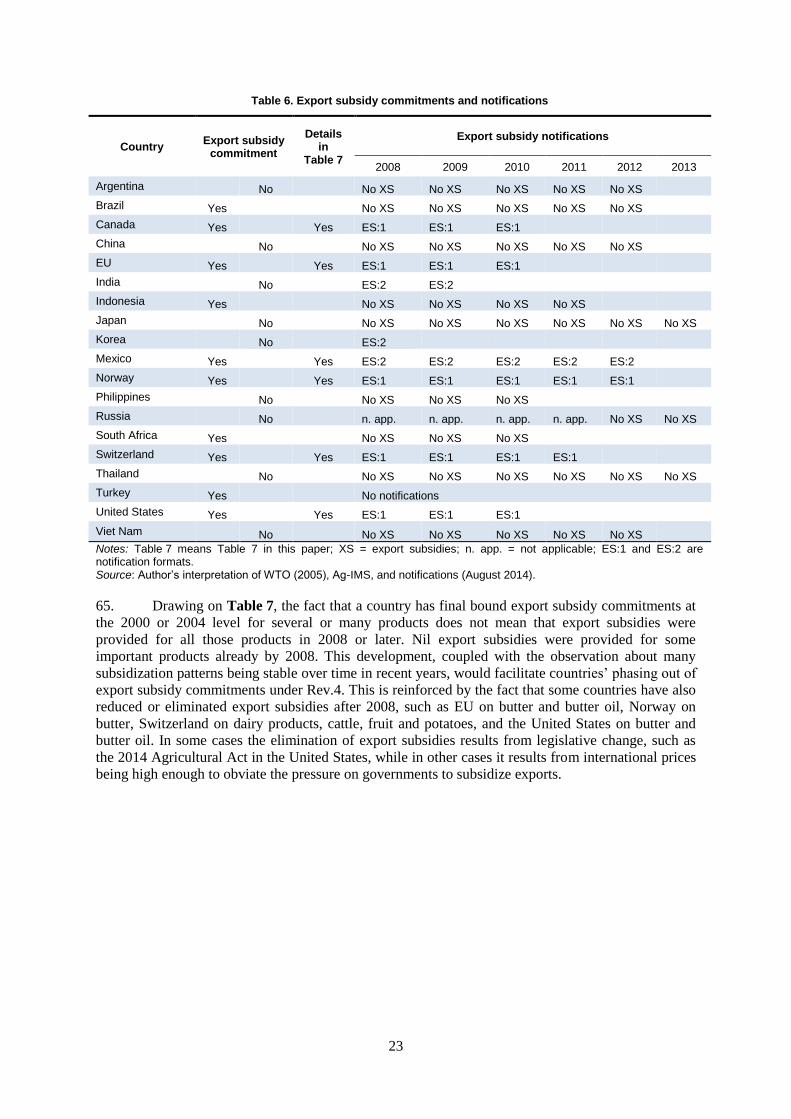
23
Table 6. Export subsidy commitments and notifications
Country Export subsidy
commitment
Details in
Table 7
Export subsidy notifications
2008 2009 2010 2011 2012 2013
Argentina
No
No XS No XS No XS No XS No XS
Brazil Yes
No XS No XS No XS No XS No XS Canada Yes
Yes ES:1 ES:1 ES:1
China
No
No XS No XS No XS No XS No XS
EU Yes
Yes ES:1 ES:1 ES:1 India
No
ES:2 ES:2
Indonesia Yes
No XS No XS No XS No XS Japan
No
No XS No XS No XS No XS No XS No XS
Korea
No
ES:2
Mexico Yes
Yes ES:2 ES:2 ES:2 ES:2 ES:2 Norway Yes
Yes ES:1 ES:1 ES:1 ES:1 ES:1
Philippines
No
No XS No XS No XS
Russia
No
n. app. n. app. n. app. n. app. No XS No XS
South Africa Yes
No XS No XS No XS Switzerland Yes
Yes ES:1 ES:1 ES:1 ES:1
Thailand
No
No XS No XS No XS No XS No XS No XS
Turkey Yes
No notifications
United States Yes
Yes ES:1 ES:1 ES:1 Viet Nam
No
No XS No XS No XS No XS No XS
Notes: Table 7 means Table 7 in this paper; XS = export subsidies; n. app. = not applicable; ES:1 and ES:2 are notification formats. Source: Author’s interpretation of WTO (2005), Ag-IMS, and notifications (August 2014).
65. Drawing on Table 7, the fact that a country has final bound export subsidy commitments at
the 2000 or 2004 level for several or many products does not mean that export subsidies were
provided for all those products in 2008 or later. Nil export subsidies were provided for some
important products already by 2008. This development, coupled with the observation about many
subsidization patterns being stable over time in recent years, would facilitate countries’ phasing out of
export subsidy commitments under Rev.4. This is reinforced by the fact that some countries have also
reduced or eliminated export subsidies after 2008, such as EU on butter and butter oil, Norway on
butter, Switzerland on dairy products, cattle, fruit and potatoes, and the United States on butter and
butter oil. In some cases the elimination of export subsidies results from legislative change, such as
the 2014 Agricultural Act in the United States, while in other cases it results from international prices
being high enough to obviate the pressure on governments to subsidize exports.
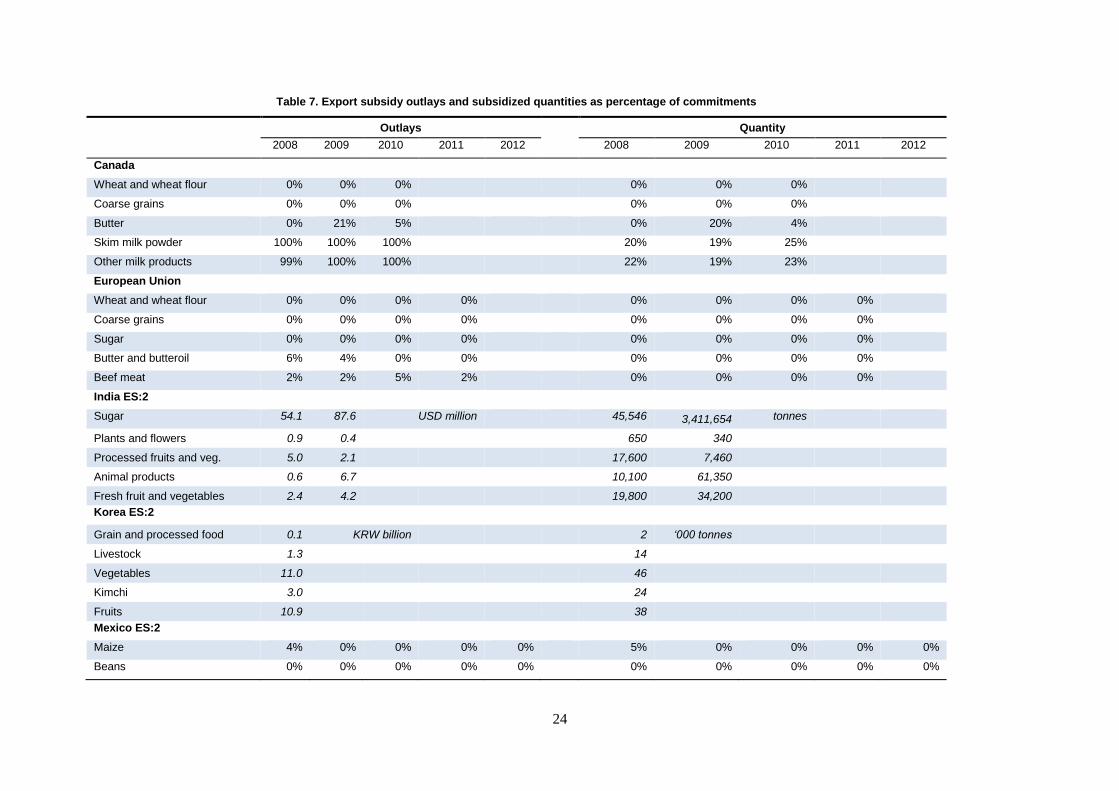
24
Table 7. Export subsidy outlays and subsidized quantities as percentage of commitments
Outlays Quantity
2008 2009 2010 2011 2012 2008 2009 2010 2011 2012
Canada
Wheat and wheat flour 0% 0% 0% 0% 0% 0%
Coarse grains 0% 0% 0% 0% 0% 0%
Butter 0% 21% 5% 0% 20% 4%
Skim milk powder 100% 100% 100% 20% 19% 25%
Other milk products 99% 100% 100% 22% 19% 23%
European Union
Wheat and wheat flour 0% 0% 0% 0% 0% 0% 0% 0%
Coarse grains 0% 0% 0% 0% 0% 0% 0% 0%
Sugar 0% 0% 0% 0% 0% 0% 0% 0%
Butter and butteroil 6% 4% 0% 0% 0% 0% 0% 0%
Beef meat 2% 2% 5% 2% 0% 0% 0% 0%
India ES:2
Sugar 54.1 87.6 USD million 45,546 3,411,654 tonnes
Plants and flowers 0.9 0.4 650 340
Processed fruits and veg. 5.0 2.1 17,600 7,460
Animal products 0.6 6.7 10,100 61,350
Fresh fruit and vegetables 2.4 4.2 19,800 34,200
Korea ES:2
Grain and processed food 0.1 KRW billion 2 ‘000 tonnes
Livestock 1.3 14
Vegetables 11.0 46
Kimchi 3.0 24
Fruits 10.9 38
Mexico ES:2
Maize 4% 0% 0% 0% 0% 5% 0% 0% 0% 0%
Beans 0% 0% 0% 0% 0% 0% 0% 0% 0% 0%
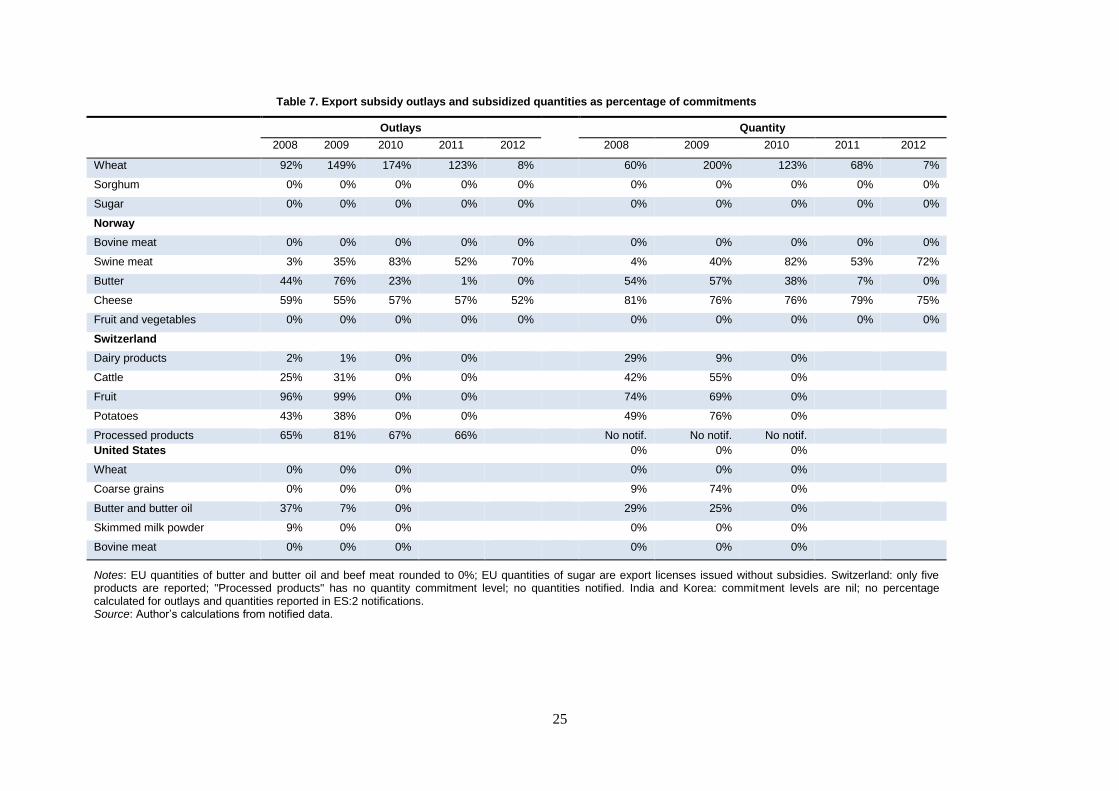
25
Table 7. Export subsidy outlays and subsidized quantities as percentage of commitments
Outlays Quantity
2008 2009 2010 2011 2012 2008 2009 2010 2011 2012
Wheat 92% 149% 174% 123% 8% 60% 200% 123% 68% 7%
Sorghum 0% 0% 0% 0% 0% 0% 0% 0% 0% 0%
Sugar 0% 0% 0% 0% 0% 0% 0% 0% 0% 0%
Norway
Bovine meat 0% 0% 0% 0% 0% 0% 0% 0% 0% 0%
Swine meat 3% 35% 83% 52% 70% 4% 40% 82% 53% 72%
Butter 44% 76% 23% 1% 0% 54% 57% 38% 7% 0%
Cheese 59% 55% 57% 57% 52% 81% 76% 76% 79% 75%
Fruit and vegetables 0% 0% 0% 0% 0% 0% 0% 0% 0% 0%
Switzerland
Dairy products 2% 1% 0% 0% 29% 9% 0%
Cattle 25% 31% 0% 0% 42% 55% 0%
Fruit 96% 99% 0% 0% 74% 69% 0%
Potatoes 43% 38% 0% 0% 49% 76% 0%
Processed products 65% 81% 67% 66% No notif. No notif. No notif.
United States 0% 0% 0%
Wheat 0% 0% 0% 0% 0% 0%
Coarse grains 0% 0% 0% 9% 74% 0%
Butter and butter oil 37% 7% 0% 29% 25% 0%
Skimmed milk powder 9% 0% 0% 0% 0% 0%
Bovine meat 0% 0% 0% 0% 0% 0%
Notes: EU quantities of butter and butter oil and beef meat rounded to 0%; EU quantities of sugar are export licenses issued without subsidies. Switzerland: only five products are reported; "Processed products" has no quantity commitment level; no quantities notified. India and Korea: commitment levels are nil; no percentage calculated for outlays and quantities reported in ES:2 notifications. Source: Author’s calculations from notified data.
26
4.1.5. Summary of export subsidy situation
66. The picture across countries and products is thus varied. There seems to be a general
tendency towards less use of export subsidies, judging from this incomplete sample, but it is also
marked by particular situations of ongoing or increasing subsidization for some products in some
countries. Part of the tendency towards less subsidization is obviously the result of higher world
prices, which simply reduce the pressure to subsidize exports or reduce the outlays involved.
However, some of the tendency is the result of countries’ policy changes in the direction of reducing
or eliminating export subsidies. For example, Switzerland eliminated export subsidies on basic
agricultural goods in 2009 (WTO (2013b), 3.2.5, para. 3.65) and suspended or abolished export
subsidies on some products in 2012 (WTO (2013b), 4.1.3, para. 4.12). Successive reforms in the EU,
historically the largest user of export subsidies, have also resulted in export subsidies no longer being
provided.18
Indeed, the EU indicated in responding to the WTO questionnaire in 2014 that the
Common Agricultural Policy adopted in 2013 provides that export subsidies cannot be used other than
as an exceptional measure (WTO 2014a, page 27).19
In contrast, media speculated in August 2014 that
the EU might consider re-introducing export subsidies as part of its approach to dealing with trade
difficulties with Russia (Agra Europe 2014).
67. On the other hand, the sustained or increased use of export subsidies for some products in a
few countries identifies situations where countries would need to undertake policy reform in order to
meet the Rev.4 obligation eventually to eliminate all export subsidies. With the 2013 deadline having
passed, a new deadline would need to be identified for the elimination for developed countries.
Developing countries with export subsidy commitments might be able to enjoy a later deadline (three
years later in Rev.4). Developing countries invoking Article 9.4 might enjoy a further reprieve before
having to eliminate also export subsidies in the form of subsidies to reduce the costs of marketing
exports of agricultural products and internal transport and freight charges to export shipments (five
further years later in Rev.4, i.e. eight years after the deadline for developed countries). Thus, if an
Agreement with updated Rev.4 provisions were to take effect in 2014 (six years after 2008), the
respective deadlines corresponding to those in Rev.4 would be 2019, 2022 and 2027.
4.1.6. Assessment
68. Export subsidization in agriculture is no longer as prevalent as it was at the time of
negotiating the AoA in the 1990s, starting the DDA in 2001, or even drafting Rev.4 in 2008. While
export subsidies were not eliminated by 2013 as had been envisioned eight years earlier, their use was
much reduced by 2013. Indeed, in some of the intervening years countries favoured export restrictions
over export subsidies. Not using export subsidies is different, however, from committing not to use
them. A country with export subsidy commitments in agriculture would seek to obtain something in
return for giving up that right to subsidize exports in the future.20
At the same time, the continued use
of export subsidies remains a crucial element of some countries’ support policies for certain products,
as exemplified by Canada’s complete use of its export subsidization entitlements on dairy products.
Nevertheless, the generally much reduced export subsidization in recent years would seem to facilitate
the taking of commitments to eliminate export subsidies over time, including those under Article 9.4.
18. The zeroes in Table 7 for EU sugar in recent years mask export subsidies small enough to result in
percentages rounded to zero.
19. The EU clarifies “exceptional” as meaning “Which is only available to the extent and for the time
necessary to address threats of market disturbance caused by significant price rises or falls on internal
or external markets or other events and circumstances significantly disturbing or threatening to
disturb the market.” (WTO (2014a), page 27).
20. This is the mercantilistic view. An economics-based view would see the abolition of export subsidy
entitlements as desirable in itself and would not see a trade-off as being necessary.
27
69. Reaching such commitments could be most feasible in a context where adequate balances
could be found among different negotiating interests. This nevertheless relatively sanguine view
would need to be tempered with a recognition that there are situations where the elimination of export
subsidies in a particular sector would be predicated on several other policy changes also being made
in the sector by the country concerned. The challenge would be to ensure that the need to address such
situations did not become an obstacle to agreeing to eliminate export subsidies and also committing to
do so.
4.2. Export financing support
4.2.1. Agreement on Agriculture
70. The AoA addresses export credits, export credit guarantees or insurance programs under the
heading “Prevention of circumvention of export subsidy commitments”. It does not, however, lay
down rules for export financing support but expresses members’ undertaking to work towards the
development of internationally agreed disciplines to govern the programs (Article 10.2). This
effectively leaves the discipline on such programs to the rules of the Agreement on Subsidies and
Countervailing Measures. One effort towards the development of internationally agreed disciplines is
reported in OECD (no date), an effort resulting in the issue having been passed on to the WTO for
consideration in the DDA.
4.2.2. Draft modalities
71. Rev.4 refers to export credits, export credit guarantees or insurance programs as export
financing support. It presents a set of provisions as a possible new article to replace the AoA Article
10.2. In 1998, a few years after the entry into force of the AoA, the United States provided 88% of the
subsidies accounted for under export credit in agriculture, the EU 7%, Canada 4% and Australia 1%
(OECD 2001a). The credits of the United States had the highest subsidy component. It is therefore to
be expected that the Rev.4 annex on export financing support particularly addresses the offensive
interests of many countries with regard to such support being provided by the United States and the
corresponding defensive interests of the United States.
72. Rev.4 identifies the forms of export financing support and the kind of institutions providing
it. The two elements of the discipline concern maximum repayment terms and self-financing. The
maximum repayment term allowed is 180 days (some countries’ programs have had repayment terms
measured in years, in at least one case up to ten years). Insurance or guarantee type programs must be
self-financing, which means that the premiums charged over a rolling four-year period (six years for
developing countries) must be large enough to cover the operating costs and losses of the program in
that period. Rev.4 indicates both 2010 and 2013 as possible start dates for these provisions but, with
both of these years now being in the past, Rev.4’s alternative starting dates for the maximum
repayment terms might apply: the first day of implementing the new agreement (developed countries)
or four years later (developing countries). Longer repayment terms would apply for credits to least-
developed countries and net food-importing developing countries for the acquisition of basic
foodstuffs.
4.2.3. Export financing support: situation
73. Five export credit guarantee programs operated under the United States 2002 farm act:
GSM-102, GSM-103, the Supplier Credit Guarantee Program, the Facilities Financing Guarantee
Program, and the Facility Guarantee Program (this paragraph draws on OECD (2011) and Schnepf
(2014a)). GSM-102 accounted for about 90% of the value of exports covered under these programs.
As an outcome of the Brazil-driven WTO dispute United States – Upland Cotton and for other
reasons, the United States suspended GSM-103 and the Supplier Credit Guarantee Program in 2006.
The 2008 farm act eliminated GSM-103 and the Supplier Credit Guarantee Program and removed the
cap on the fee charged on GSM-102 transactions. In addition, the credit subsidy under GSM-102 was
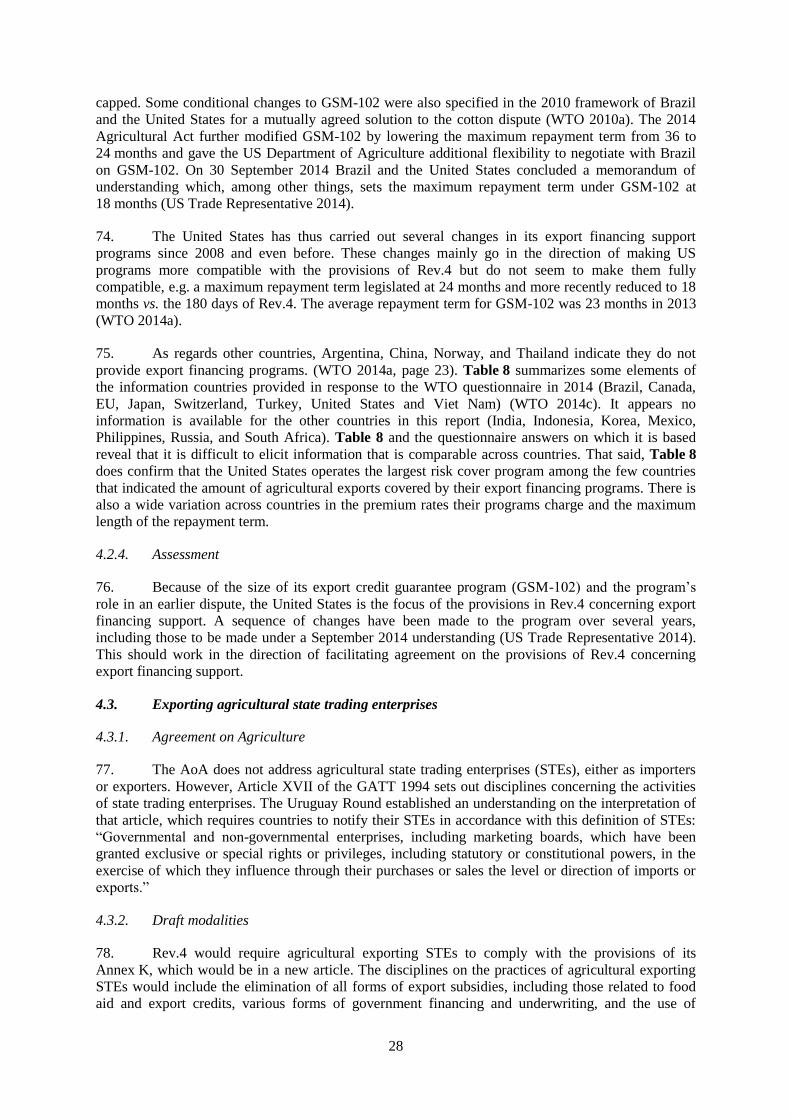
28
capped. Some conditional changes to GSM-102 were also specified in the 2010 framework of Brazil
and the United States for a mutually agreed solution to the cotton dispute (WTO 2010a). The 2014
Agricultural Act further modified GSM-102 by lowering the maximum repayment term from 36 to
24 months and gave the US Department of Agriculture additional flexibility to negotiate with Brazil
on GSM-102. On 30 September 2014 Brazil and the United States concluded a memorandum of
understanding which, among other things, sets the maximum repayment term under GSM-102 at
18 months (US Trade Representative 2014).
74. The United States has thus carried out several changes in its export financing support
programs since 2008 and even before. These changes mainly go in the direction of making US
programs more compatible with the provisions of Rev.4 but do not seem to make them fully
compatible, e.g. a maximum repayment term legislated at 24 months and more recently reduced to 18
months vs. the 180 days of Rev.4. The average repayment term for GSM-102 was 23 months in 2013
(WTO 2014a).
75. As regards other countries, Argentina, China, Norway, and Thailand indicate they do not
provide export financing programs. (WTO 2014a, page 23). Table 8 summarizes some elements of
the information countries provided in response to the WTO questionnaire in 2014 (Brazil, Canada,
EU, Japan, Switzerland, Turkey, United States and Viet Nam) (WTO 2014c). It appears no
information is available for the other countries in this report (India, Indonesia, Korea, Mexico,
Philippines, Russia, and South Africa). Table 8 and the questionnaire answers on which it is based
reveal that it is difficult to elicit information that is comparable across countries. That said, Table 8
does confirm that the United States operates the largest risk cover program among the few countries
that indicated the amount of agricultural exports covered by their export financing programs. There is
also a wide variation across countries in the premium rates their programs charge and the maximum
length of the repayment term.
4.2.4. Assessment
76. Because of the size of its export credit guarantee program (GSM-102) and the program’s
role in an earlier dispute, the United States is the focus of the provisions in Rev.4 concerning export
financing support. A sequence of changes have been made to the program over several years,
including those to be made under a September 2014 understanding (US Trade Representative 2014).
This should work in the direction of facilitating agreement on the provisions of Rev.4 concerning
export financing support.
4.3. Exporting agricultural state trading enterprises
4.3.1. Agreement on Agriculture
77. The AoA does not address agricultural state trading enterprises (STEs), either as importers
or exporters. However, Article XVII of the GATT 1994 sets out disciplines concerning the activities
of state trading enterprises. The Uruguay Round established an understanding on the interpretation of
that article, which requires countries to notify their STEs in accordance with this definition of STEs:
“Governmental and non-governmental enterprises, including marketing boards, which have been
granted exclusive or special rights or privileges, including statutory or constitutional powers, in the
exercise of which they influence through their purchases or sales the level or direction of imports or
exports.”
4.3.2. Draft modalities
78. Rev.4 would require agricultural exporting STEs to comply with the provisions of its
Annex K, which would be in a new article. The disciplines on the practices of agricultural exporting
STEs would include the elimination of all forms of export subsidies, including those related to food
aid and export credits, various forms of government financing and underwriting, and the use of
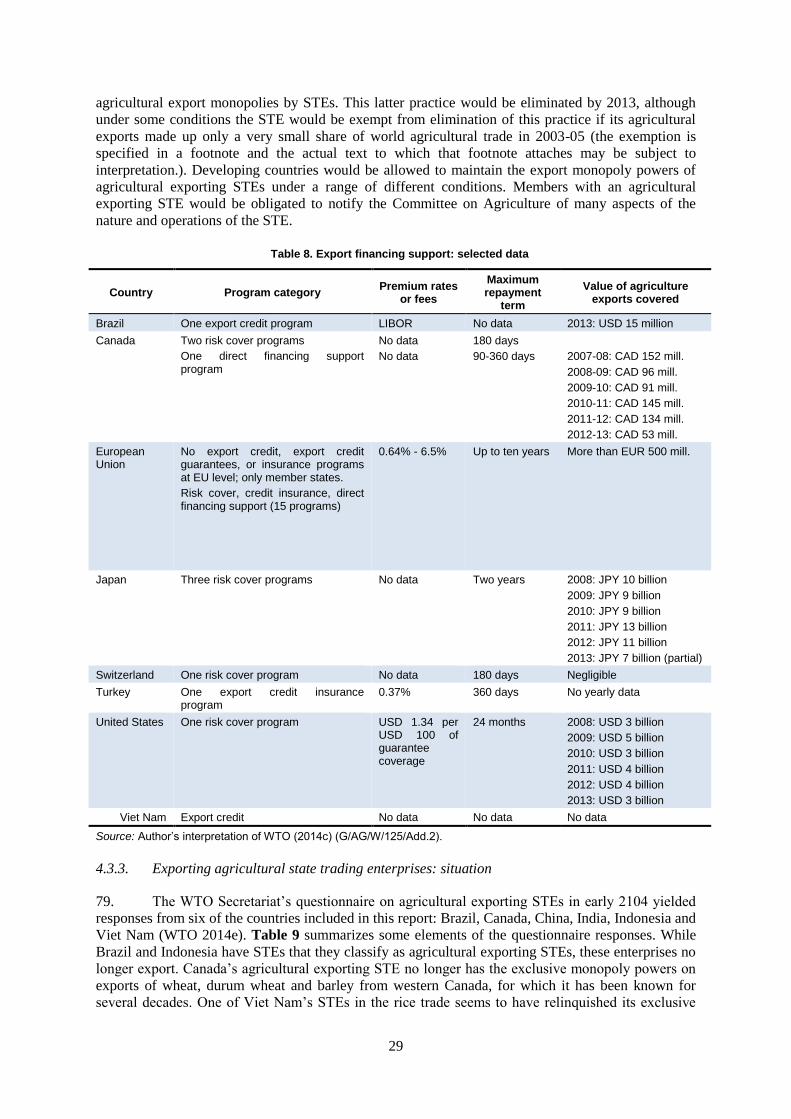
29
agricultural export monopolies by STEs. This latter practice would be eliminated by 2013, although
under some conditions the STE would be exempt from elimination of this practice if its agricultural
exports made up only a very small share of world agricultural trade in 2003-05 (the exemption is
specified in a footnote and the actual text to which that footnote attaches may be subject to
interpretation.). Developing countries would be allowed to maintain the export monopoly powers of
agricultural exporting STEs under a range of different conditions. Members with an agricultural
exporting STE would be obligated to notify the Committee on Agriculture of many aspects of the
nature and operations of the STE.
Table 8. Export financing support: selected data
Country Program category Premium rates
or fees
Maximum repayment
term
Value of agriculture exports covered
Brazil One export credit program LIBOR No data 2013: USD 15 million
Canada Two risk cover programs
One direct financing support program
No data
No data
180 days
90-360 days
2007-08: CAD 152 mill.
2008-09: CAD 96 mill.
2009-10: CAD 91 mill.
2010-11: CAD 145 mill.
2011-12: CAD 134 mill.
2012-13: CAD 53 mill.
European Union
No export credit, export credit guarantees, or insurance programs at EU level; only member states.
Risk cover, credit insurance, direct financing support (15 programs)
0.64% - 6.5% Up to ten years More than EUR 500 mill.
Japan Three risk cover programs No data Two years
2008: JPY 10 billion
2009: JPY 9 billion
2010: JPY 9 billion
2011: JPY 13 billion
2012: JPY 11 billion
2013: JPY 7 billion (partial)
Switzerland One risk cover program No data 180 days Negligible
Turkey One export credit insurance program
0.37% 360 days No yearly data
United States One risk cover program USD 1.34 per USD 100 of guarantee coverage
24 months 2008: USD 3 billion
2009: USD 5 billion
2010: USD 3 billion
2011: USD 4 billion
2012: USD 4 billion
2013: USD 3 billion
Viet Nam Export credit No data No data No data
Source: Author’s interpretation of WTO (2014c) (G/AG/W/125/Add.2).
4.3.3. Exporting agricultural state trading enterprises: situation
79. The WTO Secretariat’s questionnaire on agricultural exporting STEs in early 2104 yielded
responses from six of the countries included in this report: Brazil, Canada, China, India, Indonesia and
Viet Nam (WTO 2014e). Table 9 summarizes some elements of the questionnaire responses. While
Brazil and Indonesia have STEs that they classify as agricultural exporting STEs, these enterprises no
longer export. Canada’s agricultural exporting STE no longer has the exclusive monopoly powers on
exports of wheat, durum wheat and barley from western Canada, for which it has been known for
several decades. One of Viet Nam’s STEs in the rice trade seems to have relinquished its exclusive
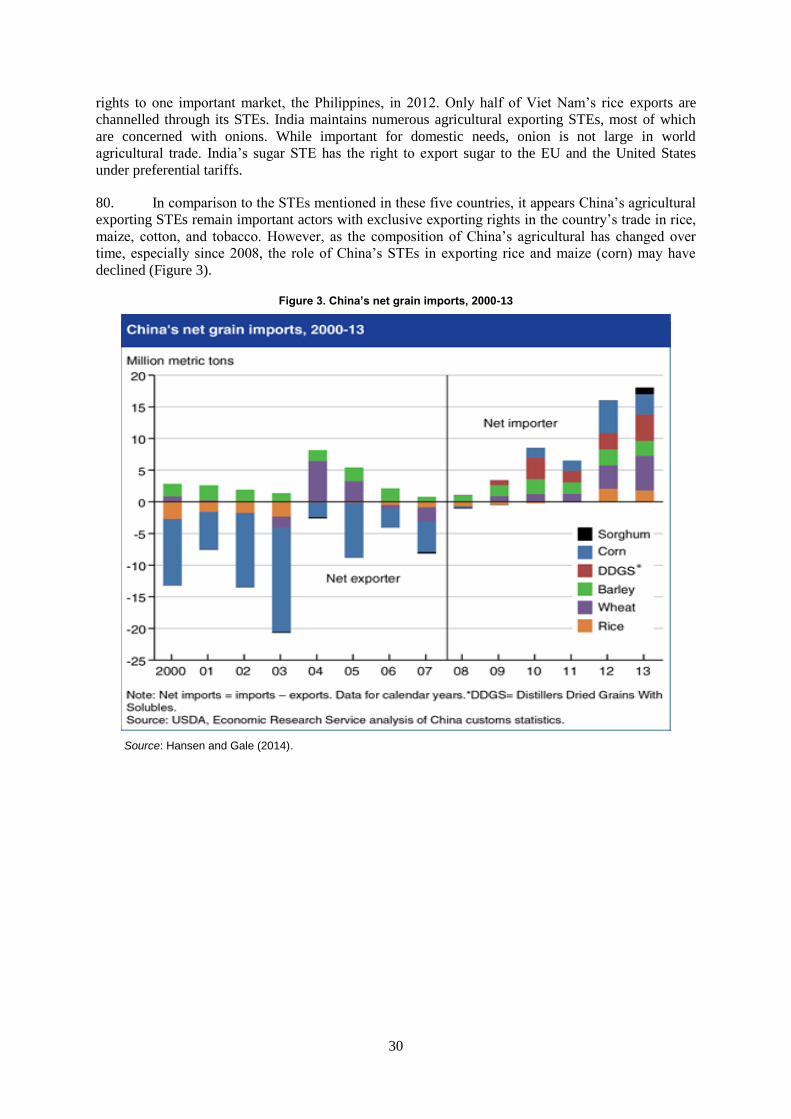
30
rights to one important market, the Philippines, in 2012. Only half of Viet Nam’s rice exports are
channelled through its STEs. India maintains numerous agricultural exporting STEs, most of which
are concerned with onions. While important for domestic needs, onion is not large in world
agricultural trade. India’s sugar STE has the right to export sugar to the EU and the United States
under preferential tariffs.
80. In comparison to the STEs mentioned in these five countries, it appears China’s agricultural
exporting STEs remain important actors with exclusive exporting rights in the country’s trade in rice,
maize, cotton, and tobacco. However, as the composition of China’s agricultural has changed over
time, especially since 2008, the role of China’s STEs in exporting rice and maize (corn) may have
declined (Figure 3).
Figure 3. China’s net grain imports, 2000-13
Source: Hansen and Gale (2014).
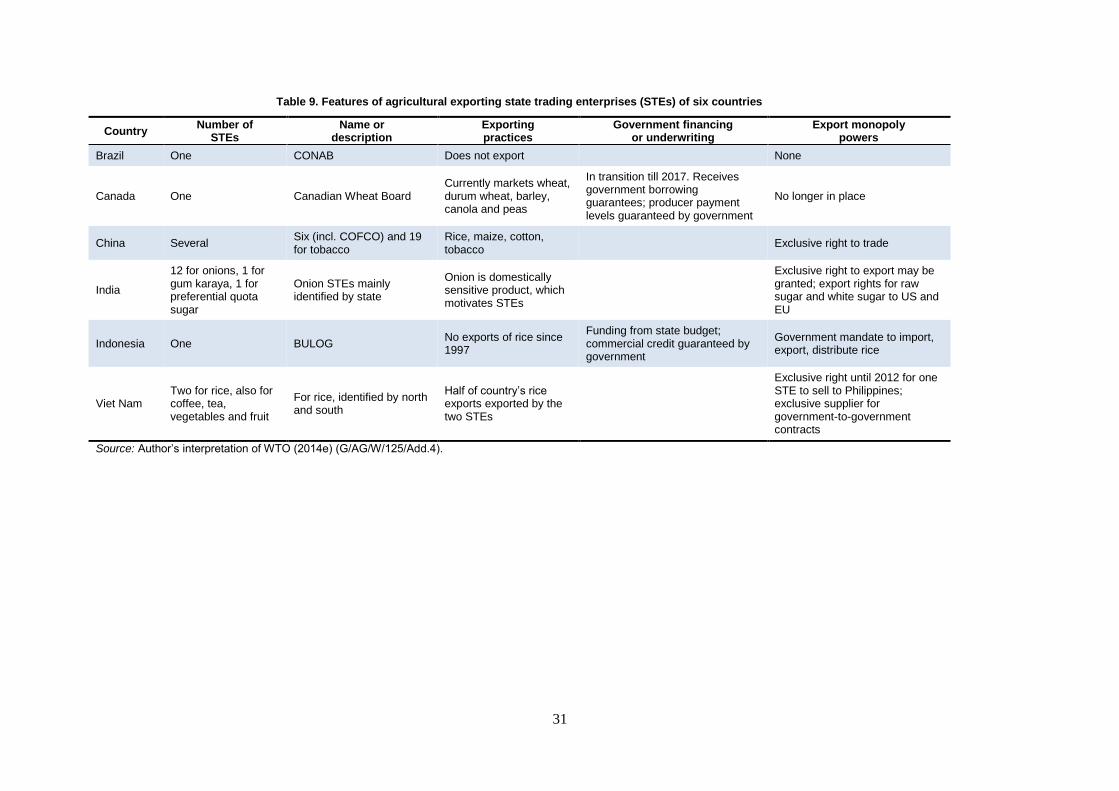
31
Table 9. Features of agricultural exporting state trading enterprises (STEs) of six countries
Country Number of
STEs Name or
description Exporting practices
Government financing or underwriting
Export monopoly powers
Brazil One CONAB Does not export None
Canada One Canadian Wheat Board Currently markets wheat, durum wheat, barley, canola and peas
In transition till 2017. Receives government borrowing guarantees; producer payment levels guaranteed by government
No longer in place
China Several Six (incl. COFCO) and 19 for tobacco
Rice, maize, cotton, tobacco
Exclusive right to trade
India
12 for onions, 1 for gum karaya, 1 for preferential quota sugar
Onion STEs mainly identified by state
Onion is domestically sensitive product, which motivates STEs
Exclusive right to export may be granted; export rights for raw sugar and white sugar to US and EU
Indonesia One BULOG No exports of rice since 1997
Funding from state budget; commercial credit guaranteed by government
Government mandate to import, export, distribute rice
Viet Nam Two for rice, also for coffee, tea, vegetables and fruit
For rice, identified by north and south
Half of country’s rice exports exported by the two STEs
Exclusive right until 2012 for one STE to sell to Philippines; exclusive supplier for government-to-government contracts
Source: Author’s interpretation of WTO (2014e) (G/AG/W/125/Add.4).
32
4.3.4. Assessment
81. The role of exporting STEs in several countries has shrunk over a number of years. Some
such enterprises have ceased to export and some have given up the special rights or powers with
which they had been endowed. These developments would seem to facilitate reaching agreement on
the provisions in Rev.4 on submitting agricultural exporting STEs to additional disciplines, especially
those of developed countries. The anticipated entry into force of one of those disciplines by 2013
under Rev.4 would obviously require updating.
4.4. International food aid
4.4.1. Agreement on Agriculture
82. The AoA addresses international food aid under the heading “Prevention of circumvention
of export subsidy commitments”. It requires countries to ensure that their food aid is not tied to
commercial exports to the recipient countries, that food aid transactions are carried out in accordance
with the official principles of the Food and Agriculture Organization of the United Nations (FAO),
and that food aid is to the extent possible provided in fully grant form or on terms that are at least as
concessional as those of the Food Aid Convention (Article 10.4).21
The notification requirements of
the Committee on Agriculture require notification within given time frames of the quantity of food aid
provided.
4.4.2. Draft modalities
83. Rev.4 requires international food aid to comply with the provisions of a possible new article
to replace Article 10.4 of the AoA. The new article would reaffirm countries’ commitment to maintain
an adequate level of international food aid while making clear that the objective of the rules is to
prevent commercial displacement. The disciplines applicable to all food aid transactions include that
food aid be needs-driven, be in fully grant form, be not tied to commercial exports, be not linked to
market development objectives, and products must not, in most situations, be exported. Countries
would commit to moving “increasingly towards more untied cash-based food aid”.
84. Rev.4 includes disciplines for food aid transactions in emergency situations to ensure that
the provision of food aid in such situations is not unintentionally impeded. They include rules for
recognizing an emergency and they prohibit monetization, except for certain purposes in least-
developed countries. The rules for non-emergency situations refer to assessing need, targeting food
insecure groups and preventing or minimizing commercial displacement. Monetization would be
prohibited except in certain situations. International food aid would need to be notified annually.
4.4.3. International food aid: situation
85. Several countries indicated in response to the WTO questionnaire in 2014 that they do not
provide food aid, including Argentina and Norway (WTO 2014a, page 24). No information was
provided on Korea, Mexico, India, Indonesia, Philippines, or Turkey. The Cairns Group reviewed the
information on food aid presented in WTO (2014d) (a precursor to WTO (2014j)) and prepared a
partial summary of selected elements in table form (WTO 2014f). That table is reproduced below as
Table 10.
86. The Cairns Group considered that, among the 14 countries reporting details on current food
aid programs (these 14 countries overlap with but are not contained within the 19 in this report), the
21. The Food Aid Convention expired in 2012 (http://www.foodaidconvention.org/en/Default.aspx). The
Food Assistance Convention entered into force on 1 January 2013
(http://www.foodassistanceconvention.org/en/about_fac/about.aspx).
33
programmes of just over half already appear to be broadly consistent with the food aid annex
(Annex L) in Rev.4. At least six Members (Australia, Canada, the EU, New Zealand, Switzerland and
the United States) provide untied cash based food aid (Annex L, paragraph 4). In the sample, the
majority of food aid provided is cash based. Where countries provide in-kind food aid most of the
countries in the sample (Brazil, China, Japan, South Africa, Thailand and the United States) have
provided aid to the World Food Programme or in response to emergency situations (Annex L,
paragraphs 3 and 6). Three countries (China, Japan and the United States) explicitly permit
monetization of food aid in circumstances that are not emergency situations or where the beneficiary
is not a least-developed country (Annex L, paragraph 8).
87. The Cairns Group stops short of analysing countries’ compliance with the provisions of
AoA as well as those of Rev.4, referring to the incompleteness of the available information. The
group highlights the need for more information on the practice of monetization, including the
circumstances in which it is permitted, and what if any disciplines a country imposes on its use. The
group also highlights the need for more information on the circumstances surrounding the provision
of in-kind food aid, including information on occasions when it is not provided to an international
organisation such as the World Food Programme in response to an emergency and whether or not any
conditions are put on such aid.
88. Among the five main programs distributing US international food aid, the so-called Section
416(b) has been inactive since 2007. The other four programs were re-authorized by the Agricultural
Act of 2014. It is reported that the 2014 act places greater emphasis on improving the nutritional
quality of food aid products and on ensuring that sales of food aid commodities do not disrupt local
markets. The act also modified some of the ceilings and floors on US food aid program activities and
created a small new local and regional purchase program. While the new law thus made some modest
changes to existing US food aid programs, the US Administration had actually proposed some more
sweeping reforms, such as eliminating monetization, providing greater flexibility to procure
commodities in local or regional markets overseas, and reducing the volume of commodities subject
to US cargo preferences.22
Such proposals remain in play in the US budget discussions in 2014.
22. At least 50% of government-impelled agricultural cargoes, which include food aid commodities, must
be carried on US-flagged vessels. Until 2012 the share was 75% (Schnepf 2014b). Lentz and Barrett
(2014) mention an initiative in 2014 to increase this cargo preference to 75%.
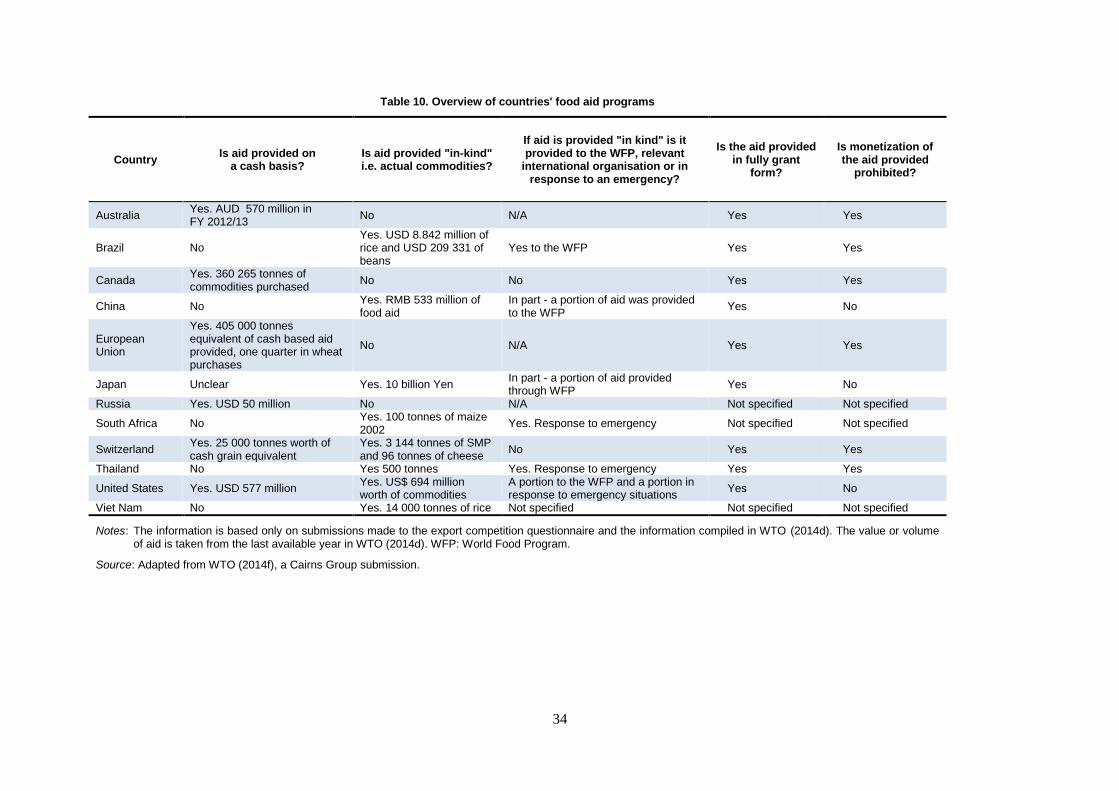
34
Table 10. Overview of countries' food aid programs
Country Is aid provided on
a cash basis? Is aid provided "in-kind" i.e. actual commodities?
If aid is provided "in kind" is it provided to the WFP, relevant
international organisation or in response to an emergency?
Is the aid provided in fully grant
form?
Is monetization of the aid provided
prohibited?
Australia Yes. AUD 570 million in FY 2012/13
No N/A Yes Yes
Brazil No Yes. USD 8.842 million of rice and USD 209 331 of beans
Yes to the WFP Yes Yes
Canada Yes. 360 265 tonnes of commodities purchased
No No Yes Yes
China No Yes. RMB 533 million of food aid
In part - a portion of aid was provided to the WFP
Yes No
European Union
Yes. 405 000 tonnes equivalent of cash based aid provided, one quarter in wheat purchases
No N/A Yes Yes
Japan Unclear Yes. 10 billion Yen In part - a portion of aid provided through WFP
Yes No
Russia Yes. USD 50 million No N/A Not specified Not specified
South Africa No Yes. 100 tonnes of maize 2002
Yes. Response to emergency Not specified Not specified
Switzerland Yes. 25 000 tonnes worth of cash grain equivalent
Yes. 3 144 tonnes of SMP and 96 tonnes of cheese
No Yes Yes
Thailand No Yes 500 tonnes Yes. Response to emergency Yes Yes
United States Yes. USD 577 million Yes. US$ 694 million worth of commodities
A portion to the WFP and a portion in response to emergency situations
Yes No
Viet Nam No Yes. 14 000 tonnes of rice Not specified Not specified Not specified
Notes: The information is based only on submissions made to the export competition questionnaire and the information compiled in WTO (2014d). The value or volume of aid is taken from the last available year in WTO (2014d). WFP: World Food Program.
Source: Adapted from WTO (2014f), a Cairns Group submission.
35
4.5 Assessment
89. The food aid programs of the United States continue to attract international attention with
regard to concerns about how they affect local markets in recipient countries and the market
opportunities of commercial exporters. The changes in the rules for food aid expressed in Rev.4 are
far from revolutionary, and the same can be said about the changes to US food aid program in the
2014 farm act. That nevertheless leaves a gap between the reform ambitions of Rev.4 and the modest
changes introduced into the US food aid program in 2014. In other words, the steps taken in US food
aid policy – the programs that matter the most internationally because of their size – may fall short of
meeting the requirements of Rev.4. To confirm or refute such a hypothesis would require a
comprehensive examination of US programs in relation to the rules of Rev.4. That said, the food aid
programs of other countries might also need to be examined to assess their compatibility with the
rules of Rev.4.
4.6. Export competition digest
90. Rules and commitments on export competition fall into the four categories of export
subsidies, export financing support, agricultural exporting state trading enterprises, and international
food aid. In Bali in 2013 Ministers recognized that the use of export subsidies had declined and
expressed their desire to achieve the elimination of export subsidies as soon as possible. The much
reduced use of export subsidies would seem to make it possible for countries also to commit not to
use them in the future. Some phase-in periods and delayed application as indicated in Rev.4 might be
part of such commitments. In the few situations where a country relies particularly on export subsidies
in supporting a product sector, such commitments might be facilitated if part of a larger package of
reforms. With regard to export financing support, the changes have been made in a major US program
over several years and further changes may emerge. This should help to reach agreement on the
provisions at issue in Rev.4. On agricultural exporting STEs, the reduction in their roles over recent
years would seem to make it easier to reach agreement on the Rev.4 rules for their future activities.
Also on international food aid there have been some changes in US policy in the direction of aligning
more with the rules of Rev.4. Those steps may fall short of what would be needed for an agreement.
Analysis of international food aid programs in terms of their compatibility with the rules of Rev.4
would be needed for a more solid assessment of the potential for reaching agreement on the Rev.4
provisions at issue.
5. Domestic support
5.1. Agreement on Agriculture
5.1.1. Exempt and non-exempt support
91. The AoA domestic support pillar concerns measures that do not operate at the border, such
as producer payments and the use of administered prices, and imposes limits on some of the support
provided through such measures. The criteria in the domestic support pillar allow countries to classify
some of their domestic support measures under three major headings and to exempt the support under
these measures from being counted towards the limits. The three headings are those of Annex 2 (often
called the green box), Article 6.5 (often called the blue box), and Article 6.2 (often called the
development box).23
A set of criteria is specified under each of the three headings. Annex 2 measures
must meet (a) the fundamental requirement that they have no, or at most minimal, trade-distorting
effects or effects on production, (b) two basic criteria, essentially that the support be provided through
publicly funded programs and that the support not have the effect of providing price support to
producers, and (c) sets of policy-specific criteria and conditions set out in Annex 2. Article 6.5
23. The “development box” also has other meanings, referring sometimes to special and differential
treatment for developing countries more generally than just Article 6.2 of the AoA.
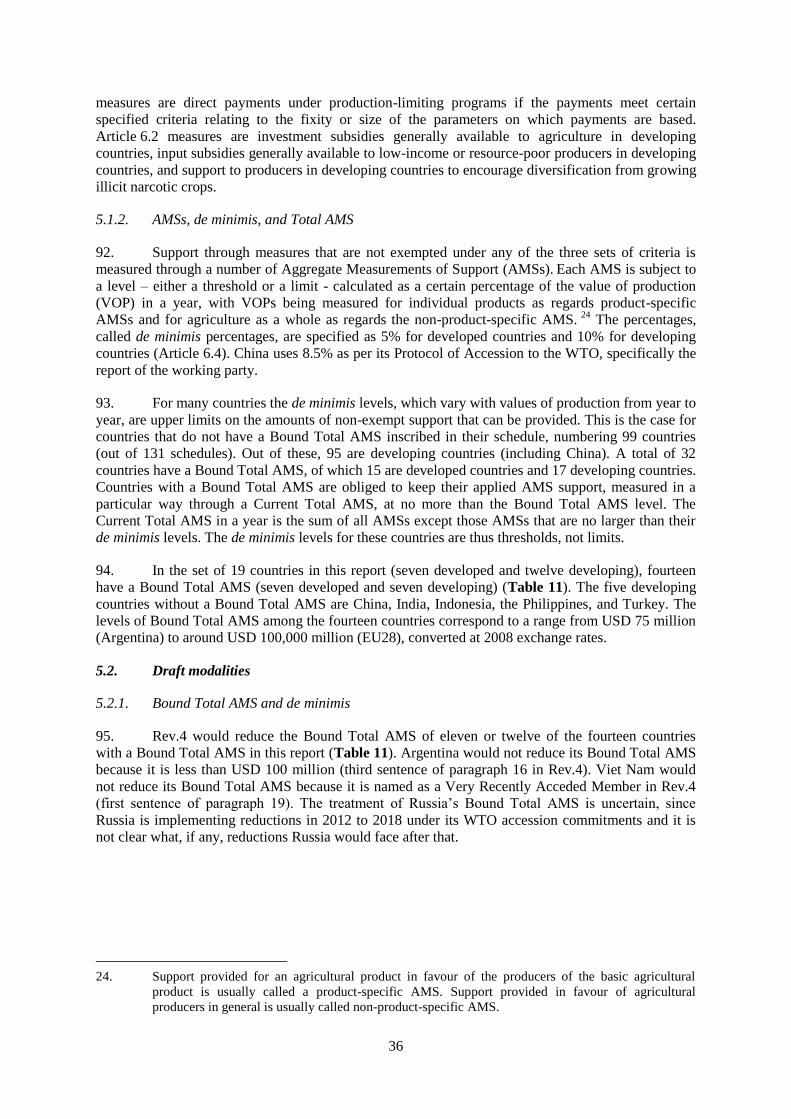
36
measures are direct payments under production-limiting programs if the payments meet certain
specified criteria relating to the fixity or size of the parameters on which payments are based.
Article 6.2 measures are investment subsidies generally available to agriculture in developing
countries, input subsidies generally available to low-income or resource-poor producers in developing
countries, and support to producers in developing countries to encourage diversification from growing
illicit narcotic crops.
5.1.2. AMSs, de minimis, and Total AMS
92. Support through measures that are not exempted under any of the three sets of criteria is
measured through a number of Aggregate Measurements of Support (AMSs). Each AMS is subject to
a level – either a threshold or a limit - calculated as a certain percentage of the value of production
(VOP) in a year, with VOPs being measured for individual products as regards product-specific
AMSs and for agriculture as a whole as regards the non-product-specific AMS. 24
The percentages,
called de minimis percentages, are specified as 5% for developed countries and 10% for developing
countries (Article 6.4). China uses 8.5% as per its Protocol of Accession to the WTO, specifically the
report of the working party.
93. For many countries the de minimis levels, which vary with values of production from year to
year, are upper limits on the amounts of non-exempt support that can be provided. This is the case for
countries that do not have a Bound Total AMS inscribed in their schedule, numbering 99 countries
(out of 131 schedules). Out of these, 95 are developing countries (including China). A total of 32
countries have a Bound Total AMS, of which 15 are developed countries and 17 developing countries.
Countries with a Bound Total AMS are obliged to keep their applied AMS support, measured in a
particular way through a Current Total AMS, at no more than the Bound Total AMS level. The
Current Total AMS in a year is the sum of all AMSs except those AMSs that are no larger than their
de minimis levels. The de minimis levels for these countries are thus thresholds, not limits.
94. In the set of 19 countries in this report (seven developed and twelve developing), fourteen
have a Bound Total AMS (seven developed and seven developing) (Table 11). The five developing
countries without a Bound Total AMS are China, India, Indonesia, the Philippines, and Turkey. The
levels of Bound Total AMS among the fourteen countries correspond to a range from USD 75 million
(Argentina) to around USD 100,000 million (EU28), converted at 2008 exchange rates.
5.2. Draft modalities
5.2.1. Bound Total AMS and de minimis
95. Rev.4 would reduce the Bound Total AMS of eleven or twelve of the fourteen countries
with a Bound Total AMS in this report (Table 11). Argentina would not reduce its Bound Total AMS
because it is less than USD 100 million (third sentence of paragraph 16 in Rev.4). Viet Nam would
not reduce its Bound Total AMS because it is named as a Very Recently Acceded Member in Rev.4
(first sentence of paragraph 19). The treatment of Russia’s Bound Total AMS is uncertain, since
Russia is implementing reductions in 2012 to 2018 under its WTO accession commitments and it is
not clear what, if any, reductions Russia would face after that.
24. Support provided for an agricultural product in favour of the producers of the basic agricultural
product is usually called a product-specific AMS. Support provided in favour of agricultural
producers in general is usually called non-product-specific AMS.
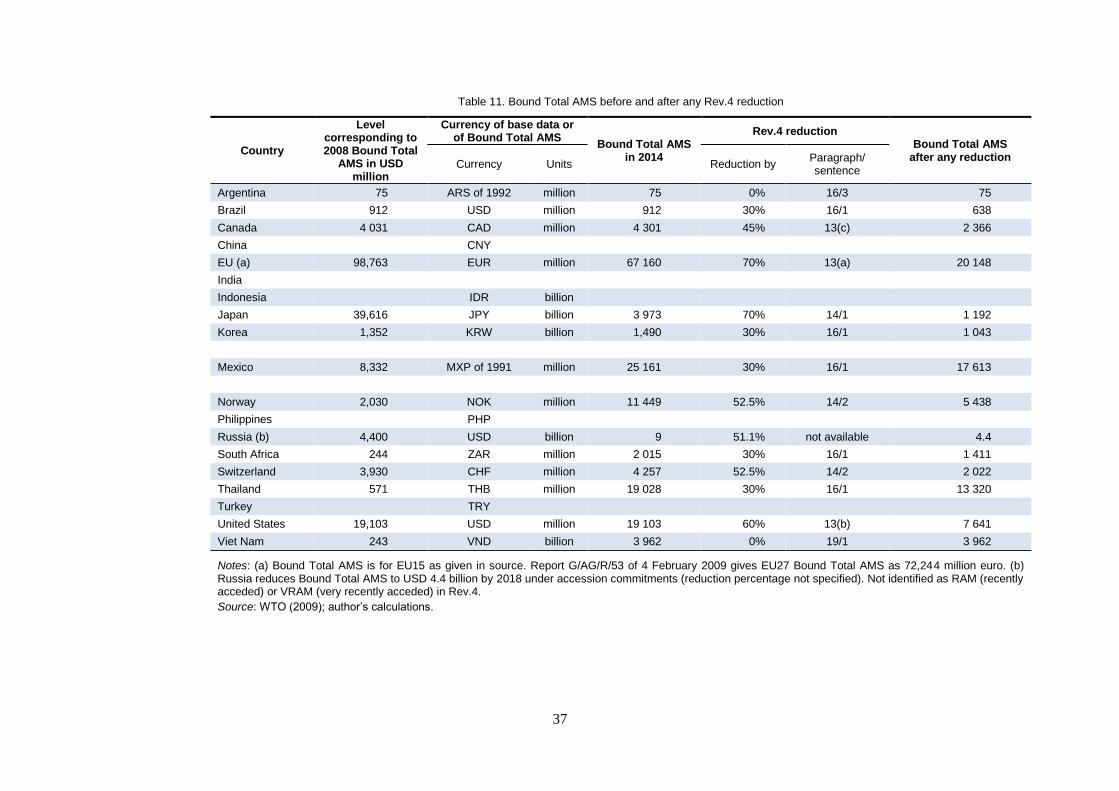
37
Table 11. Bound Total AMS before and after any Rev.4 reduction
Country
Level corresponding to 2008 Bound Total
AMS in USD million
Currency of base data or of Bound Total AMS
Bound Total AMS in 2014
Rev.4 reduction Bound Total AMS
after any reduction Currency Units Reduction by
Paragraph/ sentence
Argentina 75 ARS of 1992 million 75 0% 16/3 75
Brazil 912 USD million 912 30% 16/1 638
Canada 4 031 CAD million 4 301 45% 13(c) 2 366
China CNY
EU (a) 98,763 EUR million 67 160 70% 13(a) 20 148
India
Indonesia IDR billion
Japan 39,616 JPY billion 3 973 70% 14/1 1 192
Korea 1,352 KRW billion 1,490 30% 16/1 1 043
Mexico 8,332 MXP of 1991 million 25 161 30% 16/1 17 613
Norway 2,030 NOK million 11 449 52.5% 14/2 5 438
Philippines PHP
Russia (b) 4,400 USD billion 9 51.1% not available 4.4
South Africa 244 ZAR million 2 015 30% 16/1 1 411
Switzerland 3,930 CHF million 4 257 52.5% 14/2 2 022
Thailand 571 THB million 19 028 30% 16/1 13 320
Turkey TRY
United States 19,103 USD million 19 103 60% 13(b) 7 641
Viet Nam 243 VND billion 3 962 0% 19/1 3 962
Notes: (a) Bound Total AMS is for EU15 as given in source. Report G/AG/R/53 of 4 February 2009 gives EU27 Bound Total AMS as 72,244 million euro. (b) Russia reduces Bound Total AMS to USD 4.4 billion by 2018 under accession commitments (reduction percentage not specified). Not identified as RAM (recently acceded) or VRAM (very recently acceded) in Rev.4.
Source: WTO (2009); author’s calculations.
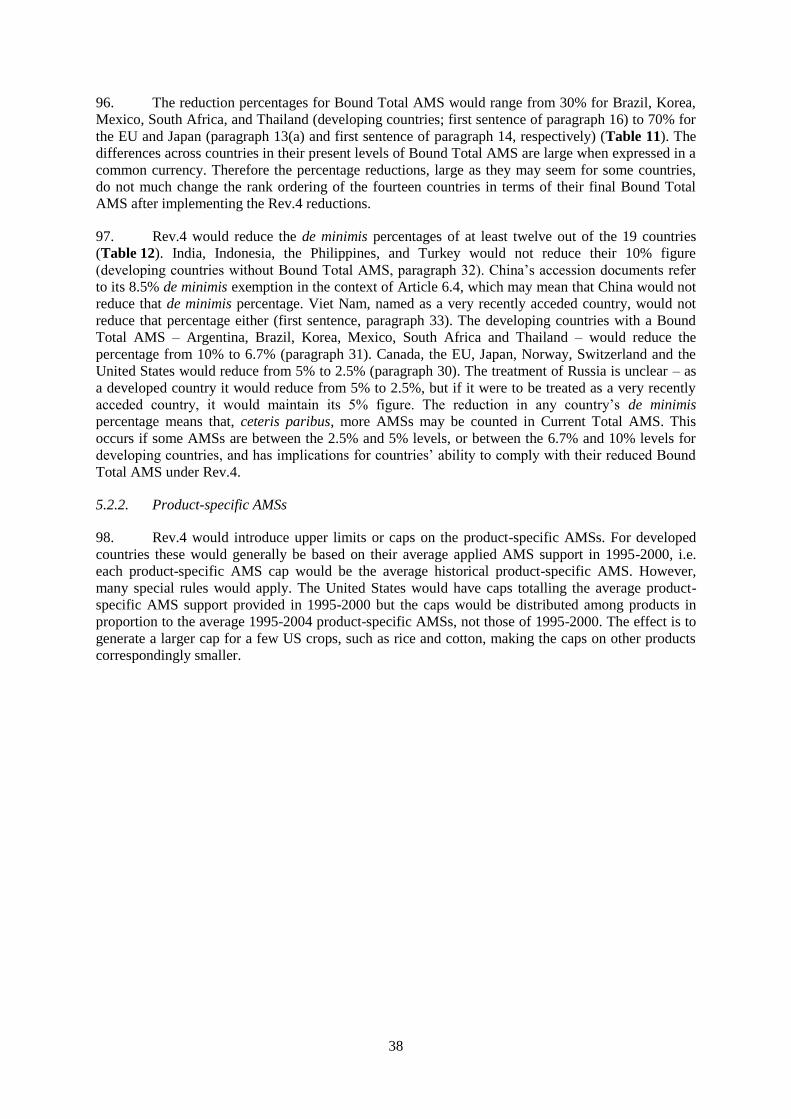
38
96. The reduction percentages for Bound Total AMS would range from 30% for Brazil, Korea,
Mexico, South Africa, and Thailand (developing countries; first sentence of paragraph 16) to 70% for
the EU and Japan (paragraph 13(a) and first sentence of paragraph 14, respectively) (Table 11). The
differences across countries in their present levels of Bound Total AMS are large when expressed in a
common currency. Therefore the percentage reductions, large as they may seem for some countries,
do not much change the rank ordering of the fourteen countries in terms of their final Bound Total
AMS after implementing the Rev.4 reductions.
97. Rev.4 would reduce the de minimis percentages of at least twelve out of the 19 countries
(Table 12). India, Indonesia, the Philippines, and Turkey would not reduce their 10% figure
(developing countries without Bound Total AMS, paragraph 32). China’s accession documents refer
to its 8.5% de minimis exemption in the context of Article 6.4, which may mean that China would not
reduce that de minimis percentage. Viet Nam, named as a very recently acceded country, would not
reduce that percentage either (first sentence, paragraph 33). The developing countries with a Bound
Total AMS – Argentina, Brazil, Korea, Mexico, South Africa and Thailand – would reduce the
percentage from 10% to 6.7% (paragraph 31). Canada, the EU, Japan, Norway, Switzerland and the
United States would reduce from 5% to 2.5% (paragraph 30). The treatment of Russia is unclear – as
a developed country it would reduce from 5% to 2.5%, but if it were to be treated as a very recently
acceded country, it would maintain its 5% figure. The reduction in any country’s de minimis
percentage means that, ceteris paribus, more AMSs may be counted in Current Total AMS. This
occurs if some AMSs are between the 2.5% and 5% levels, or between the 6.7% and 10% levels for
developing countries, and has implications for countries’ ability to comply with their reduced Bound
Total AMS under Rev.4.
5.2.2. Product-specific AMSs
98. Rev.4 would introduce upper limits or caps on the product-specific AMSs. For developed
countries these would generally be based on their average applied AMS support in 1995-2000, i.e.
each product-specific AMS cap would be the average historical product-specific AMS. However,
many special rules would apply. The United States would have caps totalling the average product-
specific AMS support provided in 1995-2000 but the caps would be distributed among products in
proportion to the average 1995-2004 product-specific AMSs, not those of 1995-2000. The effect is to
generate a larger cap for a few US crops, such as rice and cotton, making the caps on other products
correspondingly smaller.
39
Table 12. De minimis percentages
Country De minimis percentage
before Rev.4
Rev.4 reduction De minimis percentage after
any reduction Reduction by Paragraph in Rev.4
Argentina 10% 33.3% 31 6.7%
Brazil 10% 33.3% 31 6.7%
Canada 5% 50% 30 2.5%
China 8.5% 0% See notes 8.5%
EU 5% 50% 30 2.5%
India 10% 0% 32 10%
Indonesia 10% 0% 32 10%
Japan 5% 50% 30 2.5%
Korea 10% 33.3% 31 6.7%
Mexico 10% 33.3% 31 6.7%
Norway 5% 50% 30 2.5%
Philippines 10% 0% 32 10%
Russia 5% ? See notes ?
South Africa 10% 33.3% 31 6.7%
Switzerland 5% 50% 30 2.5%
Thailand 10% 33.3% 31 6.7%
Turkey 10% 0% 32 10%
United States 5% 50% 30 2.5%
Viet Nam 10% 0% 33 10%
Notes: China: paragraph 31 refers to Article 6.4, which mentions 5% and 10% only, not 8.5% of China; assume China (developing country without BTAMS) does not reduce de minimis percentage; Rev.4 does not mention Russia.
Sources: De minimis percentage: AGST, notifications, accession documents; author’s calculations.
99. For developing countries the caps would be set in accordance with a variety of rules
designed to give considerable flexibility to those countries that did not have large product-specific
AMSs in a base period. A choice among three methods is offered. Method 1 makes the caps equal to
the average product-specific AMSs in 1995-2000 or 1995-2004. Method 2 makes the caps equal to
20% of the products’ average values of production in 1995-2000 or 1995-2004 (depending on the
interpretation of Rev.4, China might under this method use 17%). Method 3 makes the caps equal to
20% of the annual Bound Total AMS in the “relevant” year of the period when Rev.4 commitments
are being implemented. Developed countries and developing countries using Method 1 would have
access to further provisions for setting the caps if they had no or only small product-specific AMSs in
the years on which their caps otherwise would be based.
100. The caps on product-specific AMSs are thus established from a menu of choices, using
country-specific data at a disaggregated level. This makes it impossible to generalize about the
resulting patterns of caps as well as establishing with confidence what caps any particular country
would choose. The extant analysis usually assumes that larger caps are seen by any country as more
desirable for itself than are lower caps. Some analysis assumes that a developing country without a
Bound Total AMS would not be subject to limits on product-specific AMSs, other than the yearly de
minimis limits under Articles 6.4 applied as under Article 7.2(b). Other readings of Rev.4 could find
that once these de minimis limits grow over time to become larger than the product-specific limits
established under paragraphs 27(a) or 27(b) of Rev.4, these latter smaller limits would be the effective
limits.
101. Few studies calculate the caps that would apply to a country’s product-specific AMSs under
Rev.4 and even fewer put the projected product-specific AMSs in the context of such caps. It is easy
to calculate the average 1995-2000 or 1995-2004 product-specific AMSs. It is somewhat more
complicated or at least laborious to determine the caps for products that had no or low product-
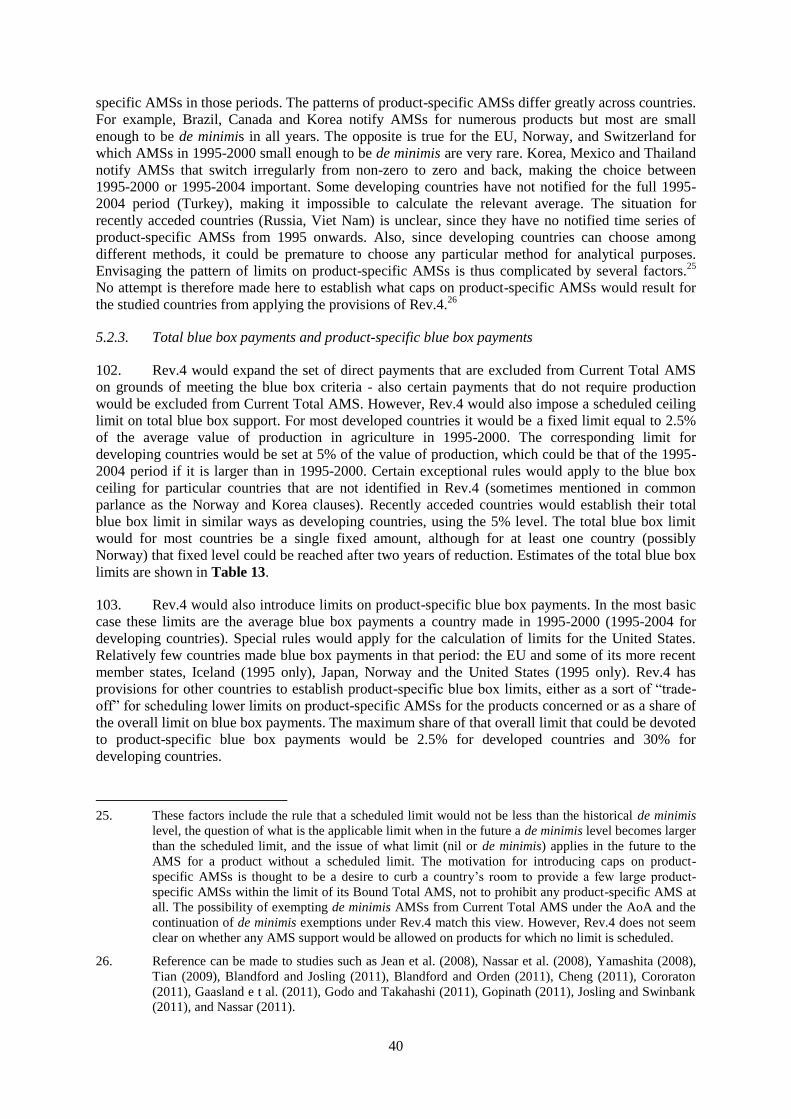
40
specific AMSs in those periods. The patterns of product-specific AMSs differ greatly across countries.
For example, Brazil, Canada and Korea notify AMSs for numerous products but most are small
enough to be de minimis in all years. The opposite is true for the EU, Norway, and Switzerland for
which AMSs in 1995-2000 small enough to be de minimis are very rare. Korea, Mexico and Thailand
notify AMSs that switch irregularly from non-zero to zero and back, making the choice between
1995-2000 or 1995-2004 important. Some developing countries have not notified for the full 1995-
2004 period (Turkey), making it impossible to calculate the relevant average. The situation for
recently acceded countries (Russia, Viet Nam) is unclear, since they have no notified time series of
product-specific AMSs from 1995 onwards. Also, since developing countries can choose among
different methods, it could be premature to choose any particular method for analytical purposes.
Envisaging the pattern of limits on product-specific AMSs is thus complicated by several factors.25
No attempt is therefore made here to establish what caps on product-specific AMSs would result for
the studied countries from applying the provisions of Rev.4.26
5.2.3. Total blue box payments and product-specific blue box payments
102. Rev.4 would expand the set of direct payments that are excluded from Current Total AMS
on grounds of meeting the blue box criteria - also certain payments that do not require production
would be excluded from Current Total AMS. However, Rev.4 would also impose a scheduled ceiling
limit on total blue box support. For most developed countries it would be a fixed limit equal to 2.5%
of the average value of production in agriculture in 1995-2000. The corresponding limit for
developing countries would be set at 5% of the value of production, which could be that of the 1995-
2004 period if it is larger than in 1995-2000. Certain exceptional rules would apply to the blue box
ceiling for particular countries that are not identified in Rev.4 (sometimes mentioned in common
parlance as the Norway and Korea clauses). Recently acceded countries would establish their total
blue box limit in similar ways as developing countries, using the 5% level. The total blue box limit
would for most countries be a single fixed amount, although for at least one country (possibly
Norway) that fixed level could be reached after two years of reduction. Estimates of the total blue box
limits are shown in Table 13.
103. Rev.4 would also introduce limits on product-specific blue box payments. In the most basic
case these limits are the average blue box payments a country made in 1995-2000 (1995-2004 for
developing countries). Special rules would apply for the calculation of limits for the United States.
Relatively few countries made blue box payments in that period: the EU and some of its more recent
member states, Iceland (1995 only), Japan, Norway and the United States (1995 only). Rev.4 has
provisions for other countries to establish product-specific blue box limits, either as a sort of “trade-
off” for scheduling lower limits on product-specific AMSs for the products concerned or as a share of
the overall limit on blue box payments. The maximum share of that overall limit that could be devoted
to product-specific blue box payments would be 2.5% for developed countries and 30% for
developing countries.
25. These factors include the rule that a scheduled limit would not be less than the historical de minimis
level, the question of what is the applicable limit when in the future a de minimis level becomes larger
than the scheduled limit, and the issue of what limit (nil or de minimis) applies in the future to the
AMS for a product without a scheduled limit. The motivation for introducing caps on product-
specific AMSs is thought to be a desire to curb a country’s room to provide a few large product-
specific AMSs within the limit of its Bound Total AMS, not to prohibit any product-specific AMS at
all. The possibility of exempting de minimis AMSs from Current Total AMS under the AoA and the
continuation of de minimis exemptions under Rev.4 match this view. However, Rev.4 does not seem
clear on whether any AMS support would be allowed on products for which no limit is scheduled.
26. Reference can be made to studies such as Jean et al. (2008), Nassar et al. (2008), Yamashita (2008),
Tian (2009), Blandford and Josling (2011), Blandford and Orden (2011), Cheng (2011), Cororaton
(2011), Gaasland e t al. (2011), Godo and Takahashi (2011), Gopinath (2011), Josling and Swinbank
(2011), and Nassar (2011).
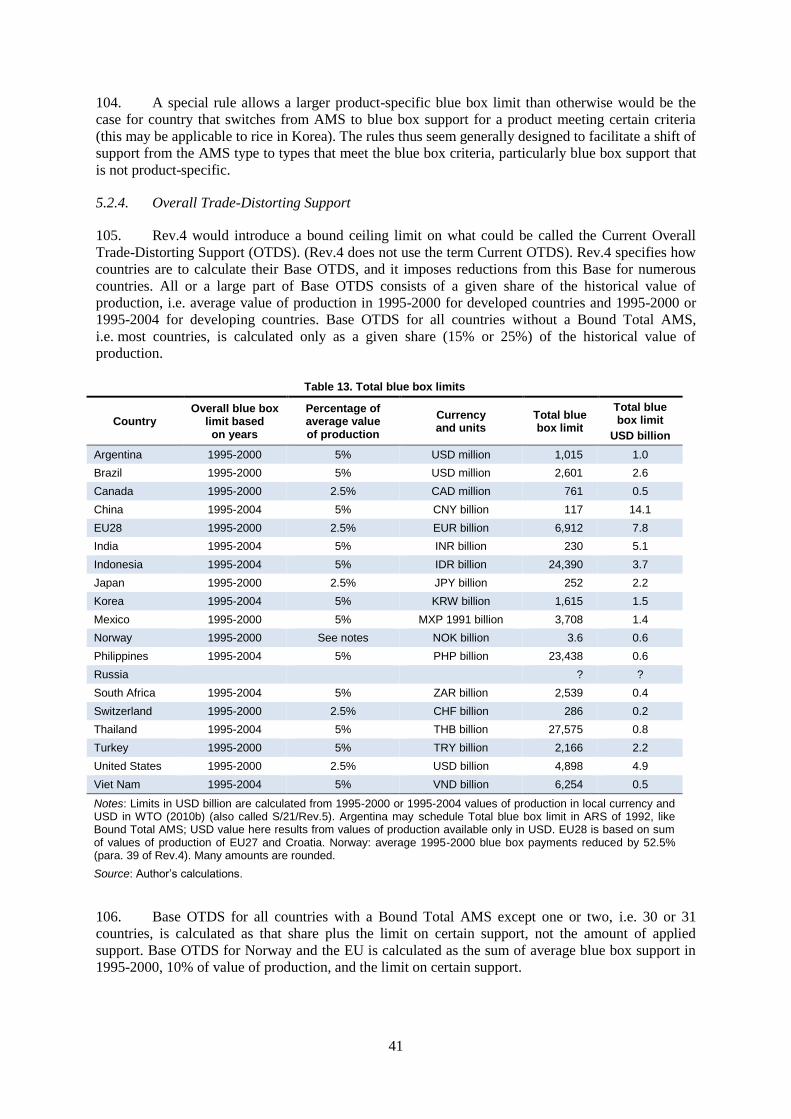
41
104. A special rule allows a larger product-specific blue box limit than otherwise would be the
case for country that switches from AMS to blue box support for a product meeting certain criteria
(this may be applicable to rice in Korea). The rules thus seem generally designed to facilitate a shift of
support from the AMS type to types that meet the blue box criteria, particularly blue box support that
is not product-specific.
5.2.4. Overall Trade-Distorting Support
105. Rev.4 would introduce a bound ceiling limit on what could be called the Current Overall
Trade-Distorting Support (OTDS). (Rev.4 does not use the term Current OTDS). Rev.4 specifies how
countries are to calculate their Base OTDS, and it imposes reductions from this Base for numerous
countries. All or a large part of Base OTDS consists of a given share of the historical value of
production, i.e. average value of production in 1995-2000 for developed countries and 1995-2000 or
1995-2004 for developing countries. Base OTDS for all countries without a Bound Total AMS,
i.e. most countries, is calculated only as a given share (15% or 25%) of the historical value of
production.
Table 13. Total blue box limits
Country Overall blue box
limit based on years
Percentage of average value of production
Currency and units
Total blue box limit
Total blue box limit
USD billion
Argentina 1995-2000 5% USD million 1,015 1.0
Brazil 1995-2000 5% USD million 2,601 2.6
Canada 1995-2000 2.5% CAD million 761 0.5
China 1995-2004 5% CNY billion 117 14.1
EU28 1995-2000 2.5% EUR billion 6,912 7.8
India 1995-2004 5% INR billion 230 5.1
Indonesia 1995-2004 5% IDR billion 24,390 3.7
Japan 1995-2000 2.5% JPY billion 252 2.2
Korea 1995-2004 5% KRW billion 1,615 1.5
Mexico 1995-2000 5% MXP 1991 billion 3,708 1.4
Norway 1995-2000 See notes NOK billion 3.6 0.6
Philippines 1995-2004 5% PHP billion 23,438 0.6
Russia ? ?
South Africa 1995-2004 5% ZAR billion 2,539 0.4
Switzerland 1995-2000 2.5% CHF billion 286 0.2
Thailand 1995-2004 5% THB billion 27,575 0.8
Turkey 1995-2000 5% TRY billion 2,166 2.2
United States 1995-2000 2.5% USD billion 4,898 4.9
Viet Nam 1995-2004 5% VND billion 6,254 0.5
Notes: Limits in USD billion are calculated from 1995-2000 or 1995-2004 values of production in local currency and USD in WTO (2010b) (also called S/21/Rev.5). Argentina may schedule Total blue box limit in ARS of 1992, like Bound Total AMS; USD value here results from values of production available only in USD. EU28 is based on sum of values of production of EU27 and Croatia. Norway: average 1995-2000 blue box payments reduced by 52.5% (para. 39 of Rev.4). Many amounts are rounded.
Source: Author’s calculations.
106. Base OTDS for all countries with a Bound Total AMS except one or two, i.e. 30 or 31
countries, is calculated as that share plus the limit on certain support, not the amount of applied
support. Base OTDS for Norway and the EU is calculated as the sum of average blue box support in
1995-2000, 10% of value of production, and the limit on certain support.
42
107. The Base OTDS would be reduced by different percentages for different countries or not at
all for some. Table 14 indicates the estimated Base OTDS levels, the percentage reductions and the
resulting Bound OTDS. As developing countries without a Bound Total AMS, the following countries
in this report would not reduce their Base OTDS: China, India, Indonesia, the Philippines, Turkey and
Viet Nam. It appears that their scheduled Bound OTDS would equal their Base OTDS (Rev.4 may be
open to alternative interpretations on this point). Other countries would schedule Base, Annual and
Final Bound OTDS entitlements.
108. Under Rev.4 commitments, each country would “ensure that the sum of the applied levels of
trade-distorting support under each OTDS component does not exceed” the Bound OTDS levels
(WTO 2008a, para. 11). In other words, Current OTDS must not exceed Bound OTDS, similar to the
existing obligation that Current Total AMS must not exceed Bound Total AMS. This can be open to
interpretation, since Rev.4 does not identify what trade-distorting support is. The Base OTDS is not
calculated from levels of applied support, as outlined above, which opens the door to several
interpretations of what constitutes the applied levels of trade-distorting support. For example, only the
green box provisions include a requirement that exempt measures have no, or at most minimal, trade-
distorting effects.
109. Other provisions in Rev.4 may also be open to interpretation. For example, it would allow
recently acceded countries, without identifying them, to provide AMS support in excess of their
OTDS commitment levels, if the AMSs are de minimis AMSs. There is no time limit on this
provision. As the agricultural values of production grow, the de minimis allowances also grow. When
they at some future point add up to more than the OTDS commitment level, that commitment level
will become inoperative as a constraint on AMS support. Depending on the criteria for being a
recently acceded country, this provision might be enjoyed by China, Viet Nam and Russia and others.
5.3 Bali decisions
110. At the conference in December 2013, Ministers took two decisions on domestic support.
One concerns certain programs that are not expressly mentioned in Annex 2 (green box) under the
heading General services. In particular, the decision means that many programs relating to land
reform and rural livelihood security explicitly could be considered as green box General services
programs, including land rehabilitation, soil conservation and resource management, drought
management and flood control, rural employment programs, issuance of property titles, and farmer
settlement programs. The other decision concerns issues under the green box heading Public
stockholding for food security purposes, specifically the condition for exempting expenditures when
stocks are acquired administered prices. This decision is discussed in more detail in Section 6.2
(Discussion) below.
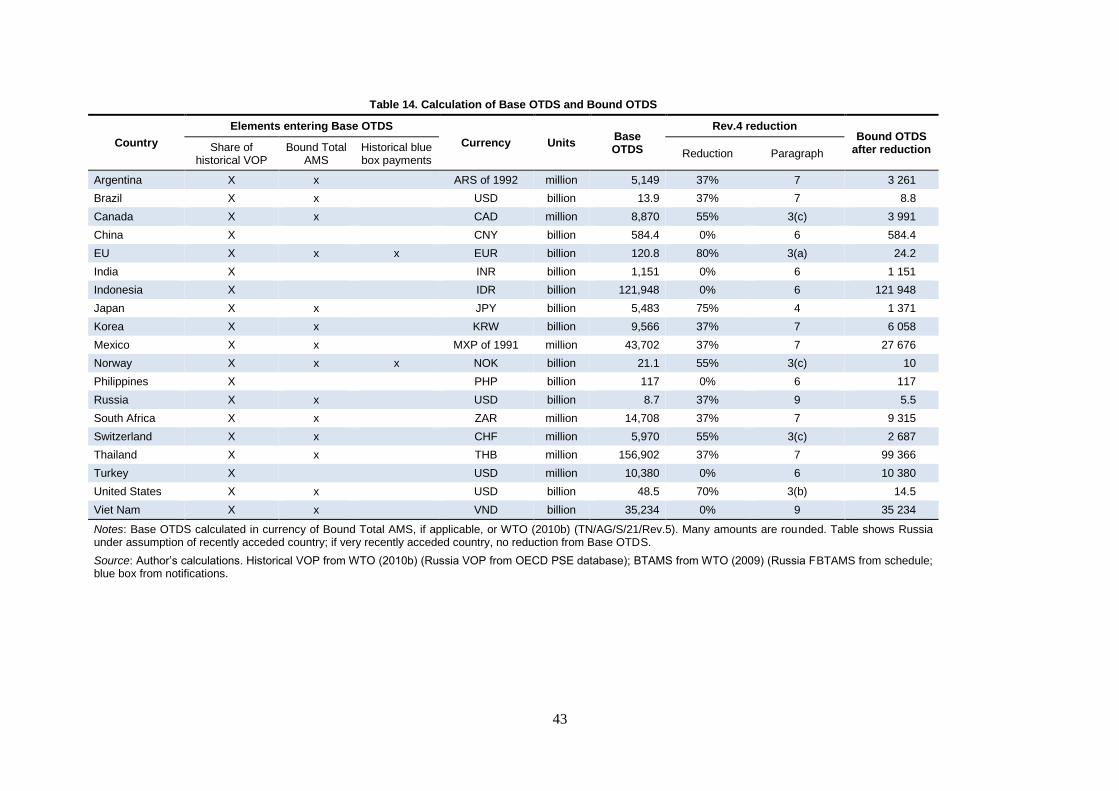
43
Table 14. Calculation of Base OTDS and Bound OTDS
Country
Elements entering Base OTDS
Currency Units Base OTDS
Rev.4 reduction Bound OTDS
after reduction Share of historical VOP
Bound Total AMS
Historical blue box payments
Reduction Paragraph
Argentina X x ARS of 1992 million 5,149 37% 7 3 261
Brazil X x USD billion 13.9 37% 7 8.8
Canada X x CAD million 8,870 55% 3(c) 3 991
China X CNY billion 584.4 0% 6 584.4
EU X x x EUR billion 120.8 80% 3(a) 24.2
India X INR billion 1,151 0% 6 1 151
Indonesia X IDR billion 121,948 0% 6 121 948
Japan X x JPY billion 5,483 75% 4 1 371
Korea X x KRW billion 9,566 37% 7 6 058
Mexico X x MXP of 1991 million 43,702 37% 7 27 676
Norway X x x NOK billion 21.1 55% 3(c) 10
Philippines X PHP billion 117 0% 6 117
Russia X x USD billion 8.7 37% 9 5.5
South Africa X x ZAR million 14,708 37% 7 9 315
Switzerland X x CHF million 5,970 55% 3(c) 2 687
Thailand X x THB million 156,902 37% 7 99 366
Turkey X USD million 10,380 0% 6 10 380
United States X x USD billion 48.5 70% 3(b) 14.5
Viet Nam X x VND billion 35,234 0% 9 35 234
Notes: Base OTDS calculated in currency of Bound Total AMS, if applicable, or WTO (2010b) (TN/AG/S/21/Rev.5). Many amounts are rounded. Table shows Russia under assumption of recently acceded country; if very recently acceded country, no reduction from Base OTDS.
Source: Author’s calculations. Historical VOP from WTO (2010b) (Russia VOP from OECD PSE database); BTAMS from WTO (2009) (Russia FBTAMS from schedule; blue box from notifications.
44
5.4 Information from notifications
111. The effects of countries’ policy settings with regard to domestic support are revealed in their
notifications to the WTO Committee on Agriculture. The Committee requires yearly notifications
from most countries (including all the countries in this study), while other countries are required to
notify only every other year. In a yearly notification a country shows how it classifies its domestic
support measures with regard to the criteria of Annex 2, Article 6.2, and Article 6.5 of the AoA,
i.e. the green, blue and development boxes. The country specifies the support provided under the
measures it claims meet these sets of criteria, i.e. the support exempt from limits. It reports the non-
exempt support measured in each of the product-specific AMSs and in the non-product-specific AMS.
It shows the calculation of Current Total AMS, if any, by distinguishing between the AMSs that
exceed the de minimis threshold and the AMSs that do not.
112. Countries differ in how they classify measures and measure support, i.e. in how they
interpret the AoA, and also in how transparent and comprehensive they make their notifications.
Moreover, although the Committee requires notifications to be submitted within a few months after
the end of the relevant year, most countries lag several years behind the agreed timetable for
notifications. The notified information consequently needs to be complemented with other
information to bring the picture more up to date. However, because of the particularities in how
measures are classified and support is measured in notifications, there is rarely a one-to-one
correspondence between information in, for example, OECD monitoring and evaluation reports and
what countries show in their notifications.27
113. A very brief synopsis is given in Table 15 of how countries’ applied domestic support in
recent years relates to commitments on Bound Total AMS and to the de minimis rules under the AoA
and Rev.4. The applied domestic support is the result of the particular policy settings used in the
notified year. The applied domestic support is thus a concept similar to an applied tariff, but the
concepts differ greatly in that the applied domestic support of a certain kind is the combined outcome
of many policy settings.
5.4.1. AMSs, de minimis, Current Total AMS and Bound Total AMS: situation
114. The nineteen countries in Table 15 have all reported that they are in compliance with the
existing rules and commitments under the AoA.28
Most of these countries would have no problem
fitting their recently applied AMS support within the confines resulting from Rev.4. Since Rev.4 in
many cases does not further constrain their AMS support, it simply follows that their applied AMS
support meets also their Rev.4 limits. This is the case for India, Indonesia, the Philippines, Turkey
and Viet Nam.29
These countries have no Bound Total AMS to be reduced and their de minimis
percentage is not reduced. A question may be raised with regard to Turkey, both because its latest
notification is only for 2001 and its reporting of a product-specific AMS (sugar beets) several times
larger than its de minimis limit seems not to be in line with what the Agreement requires.30
27. See, for example, Josling and Mittenzwei (2013) for a fairly optimistic view of the correspondence
between OECD data and WTO notifications for some countries and Brink (2014b) for a less sanguine
impression relating to a couple of other countries.
28. Because of the possible legal consequences of exceeding WTO limits, there may be disincentives
associated with reporting any excesses.
29. Regarding India, it has been suggested that alternative readings of the AoA than India’s would
generate AMSs in excess of the de minimis limits (Brink 2014a). This would be the case also under
Rev.4, since the limits are the same.
30. Article 7.2(b) obligates a country without a Bound Total AMS, such as Turkey, to keep each AMS at
a level not exceeding its de minimis limit.
45
115. Other countries are also found in a situation where recently applied AMS support seems to
fit within the rules of Rev.4, although this assessment is to some extent also based on judgment.
Argentina’s increases in support appear to have been modest enough that, if the support
were to be classified as AMS support, the resulting AMSs would remain de minimis even
under the reduced Rev.4 de minimis percentage. Bound Total AMS would not be reduced
under Rev.4.
For Brazil, even though the non-product-specific AMS is a large item among its AMSs, its
2011/12 level remains below the reduced de minimis threshold of 6.7% and Current Total
AMS is much below the reduced Bound Total AMS of Rev.4.
Likewise, the EU reports only few, if any, AMSs in the critical interval between the current
5% and the reduced level of 2.5% under Rev.4. The EU also reports a Current Total AMS in
2010/2011 that falls far short of the Bound Total AMS, even under Rev.4. This pattern of
EU support seems easily accommodated under Rev.4.
Japan is in a situation similar to that of the EU, with a 2012 Current Total AMS much
below both the present Bound Total AMS and the considerably reduced Bound Total AMS
of Rev.4.
Also Korea shows a Current Total AMS, albeit from as long ago as 2008, of only two or
three percent of the Bound Total AMS of the Agreement and as reduced under Rev.4. With
the de minimis AMSs well below the reduced 6.7% thresholds under Rev.4, Korea would
appear to be able to fit more AMS support into its de minimis AMSs, which could include
the reported increases in some kinds of support since 2008.
Mexico’s situation, although informed by a notification from 2007 only, appears to be very
similar to Korea’s. In addition, Mexico has the advantage of having a Bound Total AMS in
an inflation-proofed (indexed) currency, which allows for growing nominal non-de minimis
AMS support over time.
South Africa reported nil AMS support in 2010 and also in earlier years, i.e. there were no
AMSs, either de minimis or not. This makes for obvious compliance with both the
Agreement and Rev.4.
116. A few countries appear to face problems if domestic support under recent policy settings
were to be confronted with the rules and commitments of Rev.4.
Canada has no problem staying below the present Bound Total AMS and also that of Rev.4
as long as the de minimis percentage is not reduced. However, the cut in that percentage
even by very little, but particularly the cut under Rev.4 from 5% to 2.5%, would make the
2011 non-product-specific AMS exceed its de minimis threshold. Including the large non-
product-specific AMS, along with several smaller product-specific AMSs, makes Current
Total AMS go beyond the Rev.4 Bound Total AMS.
Norway’s Current Total AMS in 2011 was relatively close its Bound Total AMS but
amounts to 181% of its Bound Total AMS under Rev.4. Moreover, a couple of AMSs were
in the critical interval between 2.5% and 5% of value of production, i.e. they exceeded the
de minimis thresholds under Rev.4 and would further add to Current Total AMS under
Rev.4. While output-based support may have decreased since 2011, measured in economic
terms, most of Norway’s AMS support is concentrated in a few products benefitting from
applied administered prices. This makes it unlikely that the corresponding AMS support
would have declined enough to bring Current Total AMS to a level below the reduced
Bound Total AMS of Rev.4.31
31. The situation of Norway is also addressed below in the Discussion section.
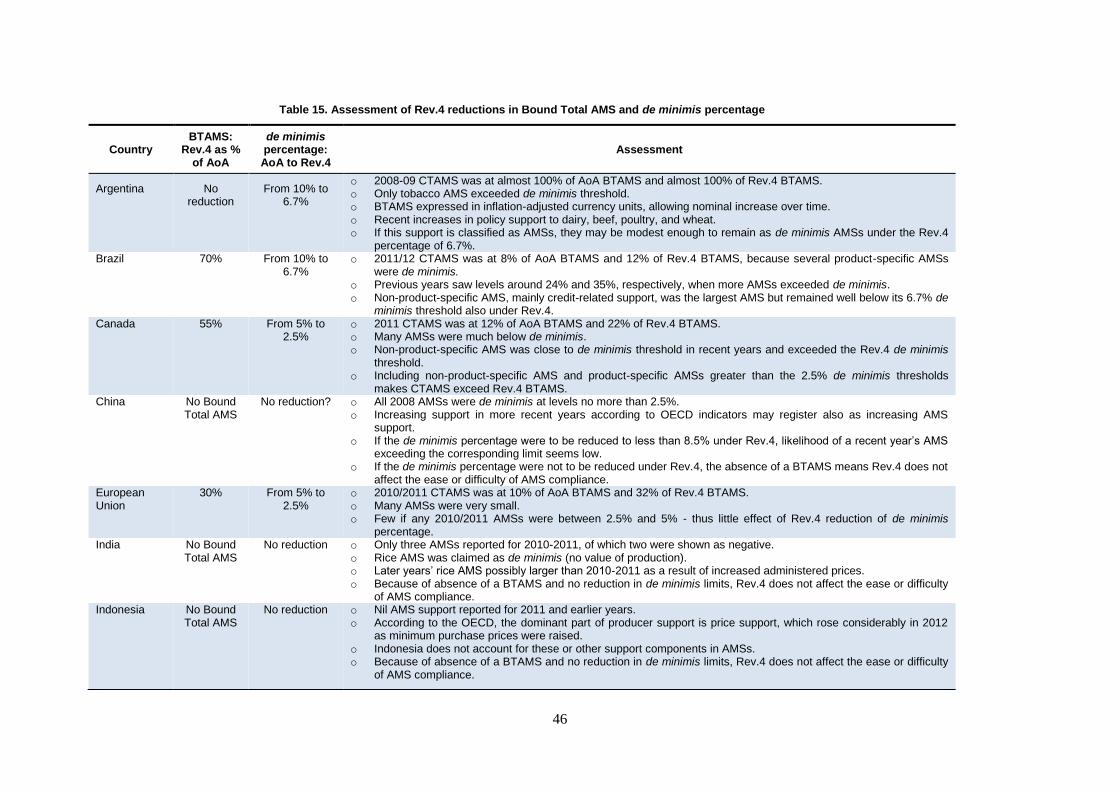
46
Table 15. Assessment of Rev.4 reductions in Bound Total AMS and de minimis percentage
Country BTAMS:
Rev.4 as % of AoA
de minimis percentage: AoA to Rev.4
Assessment
Argentina No reduction
From 10% to 6.7%
o 2008-09 CTAMS was at almost 100% of AoA BTAMS and almost 100% of Rev.4 BTAMS. o Only tobacco AMS exceeded de minimis threshold. o BTAMS expressed in inflation-adjusted currency units, allowing nominal increase over time. o Recent increases in policy support to dairy, beef, poultry, and wheat. o If this support is classified as AMSs, they may be modest enough to remain as de minimis AMSs under the Rev.4
percentage of 6.7%. Brazil 70% From 10% to
6.7% o 2011/12 CTAMS was at 8% of AoA BTAMS and 12% of Rev.4 BTAMS, because several product-specific AMSs
were de minimis. o Previous years saw levels around 24% and 35%, respectively, when more AMSs exceeded de minimis. o Non-product-specific AMS, mainly credit-related support, was the largest AMS but remained well below its 6.7% de
minimis threshold also under Rev.4. Canada 55% From 5% to
2.5% o 2011 CTAMS was at 12% of AoA BTAMS and 22% of Rev.4 BTAMS. o Many AMSs were much below de minimis. o Non-product-specific AMS was close to de minimis threshold in recent years and exceeded the Rev.4 de minimis
threshold. o Including non-product-specific AMS and product-specific AMSs greater than the 2.5% de minimis thresholds
makes CTAMS exceed Rev.4 BTAMS. China No Bound
Total AMS No reduction? o All 2008 AMSs were de minimis at levels no more than 2.5%.
o Increasing support in more recent years according to OECD indicators may register also as increasing AMS support.
o If the de minimis percentage were to be reduced to less than 8.5% under Rev.4, likelihood of a recent year’s AMS exceeding the corresponding limit seems low.
o If the de minimis percentage were not to be reduced under Rev.4, the absence of a BTAMS means Rev.4 does not affect the ease or difficulty of AMS compliance.
European Union
30% From 5% to 2.5%
o 2010/2011 CTAMS was at 10% of AoA BTAMS and 32% of Rev.4 BTAMS. o Many AMSs were very small. o Few if any 2010/2011 AMSs were between 2.5% and 5% - thus little effect of Rev.4 reduction of de minimis
percentage. India No Bound
Total AMS No reduction o Only three AMSs reported for 2010-2011, of which two were shown as negative.
o Rice AMS was claimed as de minimis (no value of production). o Later years’ rice AMS possibly larger than 2010-2011 as a result of increased administered prices. o Because of absence of a BTAMS and no reduction in de minimis limits, Rev.4 does not affect the ease or difficulty
of AMS compliance. Indonesia No Bound
Total AMS No reduction o Nil AMS support reported for 2011 and earlier years.
o According to the OECD, the dominant part of producer support is price support, which rose considerably in 2012 as minimum purchase prices were raised.
o Indonesia does not account for these or other support components in AMSs. o Because of absence of a BTAMS and no reduction in de minimis limits, Rev.4 does not affect the ease or difficulty
of AMS compliance.
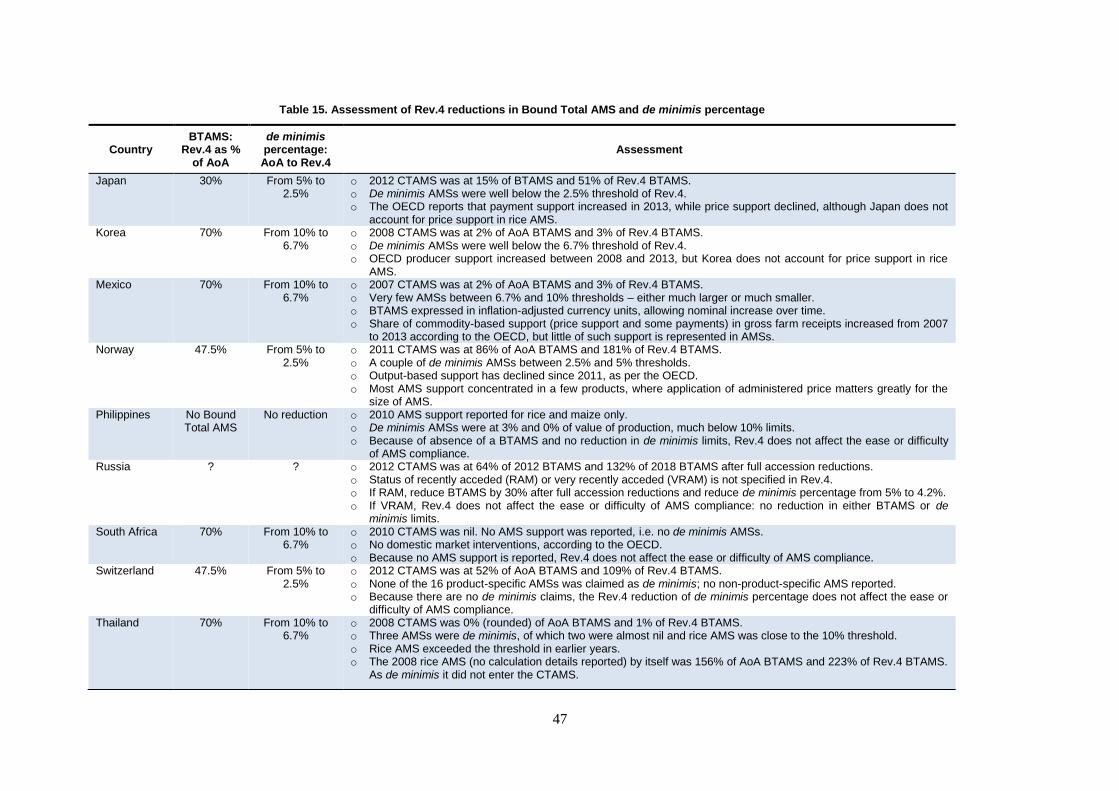
47
Table 15. Assessment of Rev.4 reductions in Bound Total AMS and de minimis percentage
Country BTAMS:
Rev.4 as % of AoA
de minimis percentage: AoA to Rev.4
Assessment
Japan 30% From 5% to 2.5%
o 2012 CTAMS was at 15% of BTAMS and 51% of Rev.4 BTAMS. o De minimis AMSs were well below the 2.5% threshold of Rev.4. o The OECD reports that payment support increased in 2013, while price support declined, although Japan does not
account for price support in rice AMS. Korea 70% From 10% to
6.7% o 2008 CTAMS was at 2% of AoA BTAMS and 3% of Rev.4 BTAMS. o De minimis AMSs were well below the 6.7% threshold of Rev.4. o OECD producer support increased between 2008 and 2013, but Korea does not account for price support in rice
AMS. Mexico 70% From 10% to
6.7% o 2007 CTAMS was at 2% of AoA BTAMS and 3% of Rev.4 BTAMS. o Very few AMSs between 6.7% and 10% thresholds – either much larger or much smaller. o BTAMS expressed in inflation-adjusted currency units, allowing nominal increase over time. o Share of commodity-based support (price support and some payments) in gross farm receipts increased from 2007
to 2013 according to the OECD, but little of such support is represented in AMSs. Norway 47.5% From 5% to
2.5% o 2011 CTAMS was at 86% of AoA BTAMS and 181% of Rev.4 BTAMS. o A couple of de minimis AMSs between 2.5% and 5% thresholds. o Output-based support has declined since 2011, as per the OECD. o Most AMS support concentrated in a few products, where application of administered price matters greatly for the
size of AMS. Philippines No Bound
Total AMS No reduction o 2010 AMS support reported for rice and maize only.
o De minimis AMSs were at 3% and 0% of value of production, much below 10% limits. o Because of absence of a BTAMS and no reduction in de minimis limits, Rev.4 does not affect the ease or difficulty
of AMS compliance. Russia ? ? o 2012 CTAMS was at 64% of 2012 BTAMS and 132% of 2018 BTAMS after full accession reductions.
o Status of recently acceded (RAM) or very recently acceded (VRAM) is not specified in Rev.4. o If RAM, reduce BTAMS by 30% after full accession reductions and reduce de minimis percentage from 5% to 4.2%. o If VRAM, Rev.4 does not affect the ease or difficulty of AMS compliance: no reduction in either BTAMS or de
minimis limits. South Africa 70% From 10% to
6.7% o 2010 CTAMS was nil. No AMS support was reported, i.e. no de minimis AMSs. o No domestic market interventions, according to the OECD. o Because no AMS support is reported, Rev.4 does not affect the ease or difficulty of AMS compliance.
Switzerland 47.5% From 5% to 2.5%
o 2012 CTAMS was at 52% of AoA BTAMS and 109% of Rev.4 BTAMS. o None of the 16 product-specific AMSs was claimed as de minimis; no non-product-specific AMS reported. o Because there are no de minimis claims, the Rev.4 reduction of de minimis percentage does not affect the ease or
difficulty of AMS compliance. Thailand 70% From 10% to
6.7% o 2008 CTAMS was 0% (rounded) of AoA BTAMS and 1% of Rev.4 BTAMS. o Three AMSs were de minimis, of which two were almost nil and rice AMS was close to the 10% threshold. o Rice AMS exceeded the threshold in earlier years. o The 2008 rice AMS (no calculation details reported) by itself was 156% of AoA BTAMS and 223% of Rev.4 BTAMS.
As de minimis it did not enter the CTAMS.
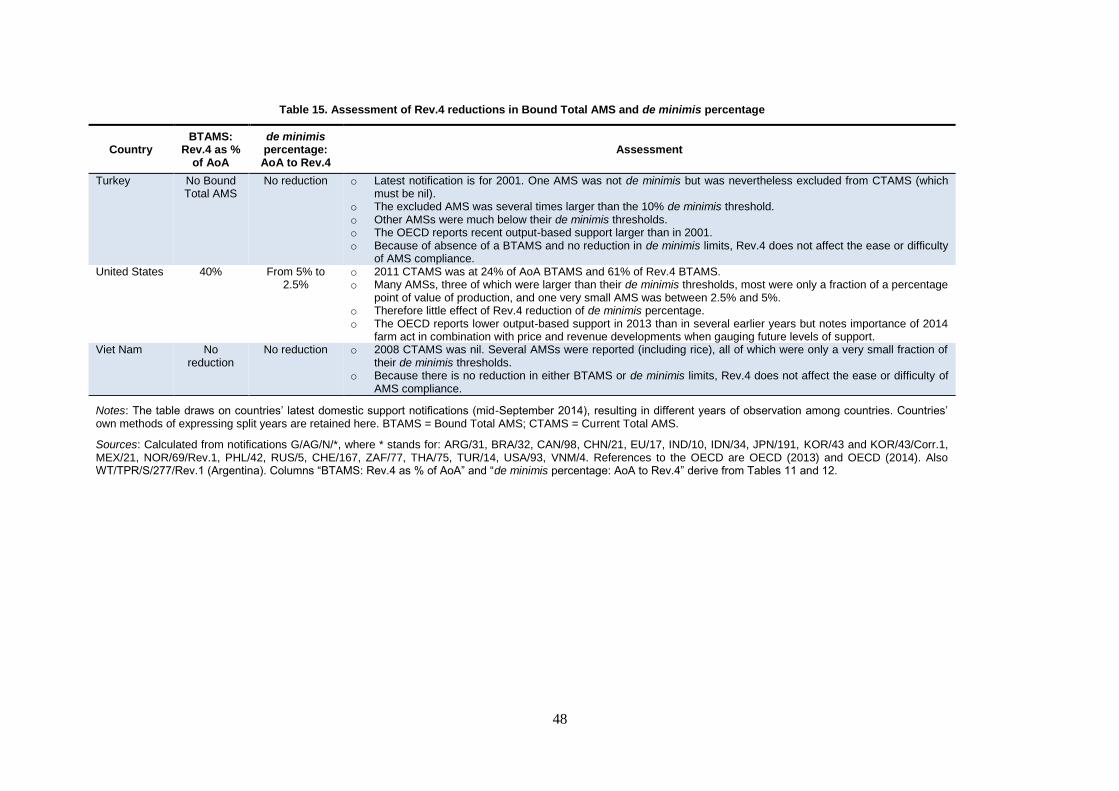
48
Table 15. Assessment of Rev.4 reductions in Bound Total AMS and de minimis percentage
Country BTAMS:
Rev.4 as % of AoA
de minimis percentage: AoA to Rev.4
Assessment
Turkey No Bound Total AMS
No reduction o Latest notification is for 2001. One AMS was not de minimis but was nevertheless excluded from CTAMS (which must be nil).
o The excluded AMS was several times larger than the 10% de minimis threshold. o Other AMSs were much below their de minimis thresholds. o The OECD reports recent output-based support larger than in 2001. o Because of absence of a BTAMS and no reduction in de minimis limits, Rev.4 does not affect the ease or difficulty
of AMS compliance. United States 40% From 5% to
2.5% o 2011 CTAMS was at 24% of AoA BTAMS and 61% of Rev.4 BTAMS. o Many AMSs, three of which were larger than their de minimis thresholds, most were only a fraction of a percentage
point of value of production, and one very small AMS was between 2.5% and 5%. o Therefore little effect of Rev.4 reduction of de minimis percentage. o The OECD reports lower output-based support in 2013 than in several earlier years but notes importance of 2014
farm act in combination with price and revenue developments when gauging future levels of support. Viet Nam No
reduction No reduction o 2008 CTAMS was nil. Several AMSs were reported (including rice), all of which were only a very small fraction of
their de minimis thresholds. o Because there is no reduction in either BTAMS or de minimis limits, Rev.4 does not affect the ease or difficulty of
AMS compliance.
Notes: The table draws on countries’ latest domestic support notifications (mid-September 2014), resulting in different years of observation among countries. Countries’ own methods of expressing split years are retained here. BTAMS = Bound Total AMS; CTAMS = Current Total AMS.
Sources: Calculated from notifications G/AG/N/*, where * stands for: ARG/31, BRA/32, CAN/98, CHN/21, EU/17, IND/10, IDN/34, JPN/191, KOR/43 and KOR/43/Corr.1, MEX/21, NOR/69/Rev.1, PHL/42, RUS/5, CHE/167, ZAF/77, THA/75, TUR/14, USA/93, VNM/4. References to the OECD are OECD (2013) and OECD (2014). Also WT/TPR/S/277/Rev.1 (Argentina). Columns “BTAMS: Rev.4 as % of AoA” and “de minimis percentage: AoA to Rev.4” derive from Tables 11 and 12.
49
Switzerland does not exempt any AMSs from Current Total AMS on de minimis grounds.
The Rev.4 reduction in the de minimis percentage is thus without consequence for
Switzerland. The reduction in Bound Total AMS is, however, of great consequence: the
2012 Current Total AMS exceeds the reduced Bound Total AMS of Rev.4. The margin of
excess is quite modest at 9% but is nevertheless a signal that the present policy support
pattern would need adjustment under Rev.4.
Thailand reports a Current Total AMS for 2008 that is 1% or less of its Bound Total AMS
and also of the reduced Bound Total AMS under Rev.4. This is, however, a precarious
situation, since it depends on rice AMS being de minimis. The 2008 rice AMS would not be
de minimis under the reduced 6.7 percentage of Rev.4. In fact, a 2008 rice AMS that is not
de minimis would by itself be more than double the reduced Bound Total AMS of Rev.4.
Depending on how Thailand manages its policy support for rice, it would be a challenge to
comply with the Rev.4 rules and commitments.
The 2011 Current Total AMS of the United States was well below its Bound Total AMS
(USD 19.1 billion) and also below its reduced Bound Total AMS under Rev.4 (USD 7.6
billion).32
Because hardly any AMS – not even the non-product-specific AMS - fell in the
critical interval between 2.5% and 5% of value of production in 2011, the Rev.4 reduction of
the de minimis percentage would be inconsequential. 33
However, in a policy change more
clearly demarcated than in many other countries, the applied policy support to be notified
for 2014-18 will be governed by many other settings than those of 2011. For example,
already in 2008 the United States changed its dairy policy in such a way that its reported
WTO market price support for dairy declined from USD 4.8 billion to USD 2.9 billion (even
less in more recent years). The 2014 farm act, by abolishing the administered prices for
dairy products, then eliminated the accounting of WTO market price support for dairy. Such
policy changes help to make the US Current Total AMS smaller than it would otherwise be.
However, large payments can be made under the 2014 farm act in case of large price or
revenue drops, and there is also a potential for dairy payments in some years. Media reports
in mid-September 2014 mooted the possibility of crop payments amounting to USD 9.6
billion for 2014 under two of the new programs (Hopkinson 2014). The accounting of
support under the new commodity programs in terms of product-specific or non-product-
specific AMS will matter greatly for the Current Total AMS, especially under the reduced
de minimis percentage of 2.5% under Rev.4 and also the reduced Bound Total AMS. The
exemption of some support under the Rev.4 rules on blue box programs might even be
contemplated, since those rules allow blue box exemption of certain direct payments that do
not require production.34
Because of the differences, some obvious, some subtle, between
the new and previous programs, it is impossible to predict with confidence what notification
choices the United States is likely to make, whether under the AoA or Rev.4.
117. For two countries, both of which have acceded to the WTO after 1995, the interpretation of
Rev.4 can make a large difference in the potential of recent domestic support to conform to the rules
and commitments of Rev.4.
32. Regarding the United States, the nature and levels of support, the limits under AoA and Rev.4 and the
periodic changes in policy are of interest to many analysts. This motivates a more detailed discussion
here than for other countries. The situation of the United States is also addressed below in the
Discussion section.
33. The United States changed its reporting of support under crop and revenue insurance from the 2009
notification, such that only premium subsidies to producers are reported as part of non-product-
specific AMS. In 2011 they amounted to USD 7.5 billion.
34. Production is generally not required for payments under two of the new programs in the 2014 farm
act (Agriculture Risk Coverage – County Coverage and Price Loss Coverage), while production is
required under Agriculture Risk Coverage – Individual Coverage (US Department of Agriculture
2014c).

50
China may or may not be required to reduce its de minimis percentage from 8.5%,
depending on the interpretation of Rev.4. If there is no reduction for China, its AMSs could
even find room to grow from 2008 as a result of increasing support of some types. They
were all less than 2.5% in 2008, which leaves a margin for growth up to 8.5% of value of
production. If the de minimis percentage were to be reduced from 8.5% to some unknown
level, there would likely still be room to increase AMS support up to that level.
Russia is not mentioned in the 2008 Rev.4 since it acceded only in 2012. Rev.4 recognizes
that there are recently acceded members (RAMs) without identifying them and it identifies
some members by name as very recently acceded members (VRAMs). On the one hand,
Russia acceded more recently than the named VRAMs. On the other hand, Rev.4 does not
identify Russia as a VRAM. As a RAM Russia would need to reduce its Bound Total AMS
by 30% and reduce its de minimis percentage from 5% to 4.2%. It is not clear on what
timetable the Bound Total AMS reduction would be implemented, since Russia is in the
process of reducing Bound Total AMS until 2018 under its WTO accession protocol.
Russia’s 2012 Current Total AMS was significantly larger than the hypothetical final Bound
Total AMS resulting from carrying out the Rev.4 reduction after the accession reduction. As
a VRAM Russia would face no reduction in either Bound Total AMS or de minimis
percentage. Thus, the challenge would simply be to ensure compliance with the 2018 final
Bound Total AMS.
118. Most of the nineteen countries in this study would thus face no or little difficulty in
complying with Bound Total AMS and de minimis provisions of Rev.4. Those that could face a
challenge in complying include Canada, Norway, Switzerland, Thailand and the United States, as well
as possibly Russia and China, depending on the interpretation of Rev,4. For some, such as
Switzerland, which has already significantly changed its policies, the challenge would be moderate,
compared to that faced by the other countries in this group.
5.4.2. Caps on product-specific AMSs: situation
119. Commitments under Rev.4 would include limits on each product’s AMS, although not on
the non-product-specific AMS. Assessing the compliance of support under developed countries’
recent policy settings would involve calculating average product-specific AMSs for 1995-2000, the
corresponding de minimis thresholds, and applying the decision rules of Rev.4 for choosing among
the options. Blandford and Orden (2011) present such calculations for the United States, i.e. they
calculate the US caps on product-specific AMSs. The US notification for 2011 shows only one
product-specific AMS (sugar) larger than its Rev.4 cap out of a total of 22 AMSs. Depending on the
evolution of prices and revenues, as well as the classification of policies and support, the policy
settings applying from 2014 onwards could generate some product-specific AMSs larger than their
caps. Josling and Swinbank (2011) consider that the caps on product-specific AMSs could prove
constraining for some commodities in the European Union, especially those where administered
prices are applied. The subsequent EU policy provisions in force from 2014 retain the application of
administered prices essentially the same as before. Godo and Takahashi (2011) consider that some of
Japan’s product-specific AMSs under the policy settings introduced in 2010 would exceed their caps.
Subsequent changes may have alleviated that concern for some products, although the AMSs for beef
and pork have increased over the last three notified years (2010-2012).
120. Developing countries establish their caps on product-specific AMSs under Rev,4 according
to one of three options, and the chosen option has to be applied to all products. This latter requirement
makes it less likely that developing countries choose option (a), where the cap is the product’s average
AMS in 1995-2000 or 1995-2004. Because developing countries generally did not provide large
product-specific AMSs in the periods mentioned, their caps would not be large or would be large only
for one or a few products. Option (b) is likely to establish more generous caps, equal to 20% of the
product’s average value of production in 1995-2000 or 1995-2004 (it is not clear whether China
would enjoy 20% or 17%). This is twice the size of the de minimis limits in the periods mentioned.
51
Those developing countries that have a Bound Total AMS (a total of 17) can use option (c) to
establish each cap as 20% of the country’s Bound Total AMS in each year after the Rev.4
commitments come into force.35
Among the countries in this study, option (c) is open to Argentina,
Brazil, Korea, Mexico, South Africa, Thailand, and Viet Nam. The developing countries with the
largest Bound Total AMS and thus obtaining the largest caps on product-specific AMSs under option
(c) are Mexico, Korea, and Brazil.
121. Further analysis would be needed to shed light on the pattern of caps on product-specific
AMSs that would emerge under each of the three options and the tightness of the limits on product-
specific AMSs. This would be particularly interesting with respect to rice. It enjoys large economic
support in many countries, as shown in OECD support measurements. At the same time, rice AMS is
reported only as de minimis or it is not reported at all by several countries among the 19 in this study
(India, Indonesia, Japan, Korea, the Philippines, Thailand, and Viet Nam). In some cases this has to
do with the absence of an administered price, while in other cases this seems insufficient as an
explanation. Yang and Blandford (2011) use option (b) for China and Korea, without indicating
whether 8.5% or 10% is used for China. They also calculate the cap on rice AMS for Japan on the
basis of historical de minimis thresholds.
122. Regardless of which option a country chooses, the caps on product-specific AMSs would be
established as fixed nominal amounts (possibly excepting Argentina and Mexico). As values of
production grow and the de minimis thresholds or limits also grow, they will at some point exceed the
caps fixed in nominal terms (values of production in Japan are shrinking, not growing). It is not clear
what would then, for a country without a Bound Total AMS, be the operative limit on a product’s
AMS – the smaller cap on the product’s AMS or the larger de minimis limit. One possibility is that the
scheduled cap on a product-specific AMS overrides the de minimis thresholds or limits under a Rev.4
agreement, which makes for progressively tighter limits on product-specific AMS even as values of
production grow. Another possibility is that the de minimis thresholds or limits give entitlements to
product-specific AMSs larger than their scheduled caps, which effectively makes the caps of a certain
size inoperative.
5.4.3. Blue box payments: situation
123. Rev.4 would establish a ceiling on the total amount of a country’s blue box support,
i.e. direct payments meeting certain criteria. The ceiling would in most cases correspond to a certain
percentage of historical value of production, with 2.5% applying to developed and 5% to developing
countries (Table 13 above). Special rules would apply to Norway, which provides a large share of its
domestic support in the form of blue box payments. In recent years blue box payments have been
notified by the EU, Japan, and Norway. While the notified blue box payments of the EU and Japan are
well below the Rev.4 ceiling, Norway reports blue box payments well above the Rev.4 ceiling.
Norway’s blue box payments have increased in size over several years.
124. Rev.4 would also impose caps on product-specific blue box payments. Several special rules
govern the size of these product-specific entitlements, both for developed and developing countries. In
general the caps on blue box payments for the EU, Japan, and Norway would be established in
relation to historical blue box payments, such as those reported in WTO (2010c). For the United
States these caps would be based on the amount of the ceiling on total blue box support, apportioned
to individual crops.
125. The EU notifies blue box payments in a somewhat aggregated form but may foresee
establishing caps on a truly product-specific basis, according to its data in WTO (2010c). This study
does not attempt to reconcile the EU notified blue box payments with the product-specific limits that
might be established on the basis of WTO (2010c). It should be noted, however, that EU blue box
35. Rev.4 refers to the “implementation period” without defining it and possibly leaving it without an end
date. In the AoA the implementation period is effectively defined as the period 1995-2000.
52
payments in recent years as a result of policy change have been much lower than in the 1995-2000
period represented in WTO (2010c).
126. While the United States has not for many years claimed any payments as exempt on blue
box grounds, the programs introduced with the 2014 farm act raise the possibility of payments being
claimed as blue box compliant under Rev.4. The payments under two of those programs do not
require production, which may meet the requirement of Rev.4 for “new blue box” programs.
Moreover, payments are made on 85% of a farm’s base acres, which might meet one of the criteria in
Rev.4. The payments may also meet the criterion about fixed and unchanging bases and yields. If so,
it would be easier for the United States to manage its crop payments within the combined confines of
Rev.4 on AMS support and blue box payments.
127. On the basis of WTO (2010c) Japan might establish a limit on product-specific blue box
payments to rice at JPY 79 billion. The notified amount of such payments in 2012 was much larger, at
JPY 155 billion. Norway also does not report blue box payments by individual products in its
notifications, which makes it difficult to assess how recent blue box payments compare to what the
caps might be if based on WTO (2010c). It should be noted, however, that even if Norway’s total blue
box payments have increased in recent years, they are still at a lower level than in the 1995-2000
period on which the product-specific caps would be based. Regarding rice-specific blue box limits,
Yang and Blandford (2011) calculate a limit for Japan in the same way as WTO (2010c).
128. A developing country can establish product-specific blue box limits without having
provided blue box payments in the past. Several special rules also apply. Yang and Blandford (2011)
calculate the rice-specific blue box limits for China and Korea on the basis of an interpretation of
Rev.4’s rules for shifting from AMS to blue box support. Cheng (2011) sets the limit at 10% of the
total blue box limit, as provided for in Rev.4. None of the developing countries in this study has
notified any blue box support.
5.4.4. Overall Trade-Distorting Support: situation
129. Rev.4 introduces a limit on “the sum of the applied levels of trade-distorting support under
each OTDS component”. The limit is established from a Base level, which for some countries stays
fixed and for some countries is reduced. The Base level, referred to as Base OTDS, where OTDS
stands for Overall Trade-Distorting Support (OTDS), is for most countries established as a given
percentage of the average historical values of production. For most of the 19 countries in this study
the Base OTDS also includes the Bound Total AMS, and for Norway and the EU it includes,
additionally, the average historical blue box payments (the given percentage of the average historical
values of production is in this case smaller). Table 14 above provides some details of the elements of
Base OTDS and the subsequent Bound OTDS after any reduction.
130. The Current OTDS is calculated in Table 16 on the basis of the latest notifications available.
The year of calculation ranges from 2007 for Mexico to 2012 for Japan, Russia and Switzerland. No
calculation is shown for Turkey, since its latest notification is for as long ago as 2001. The Current
OTDS is calculated under two assumptions. Current OTDS(1) is the sum of Current Total AMS, all
de minimis AMSs and all blue box payments. Current OTDS(2) is the sum of Current OTDS(1) and
all Article 6.2 support, i.e. certain investment and input subsidies in developing countries. The
rationale for including Article 6.2 support in the Current OTDS indicator is that such support does not
need to be provided through measures that meet the fundamental green box requirement of having no,
or at most minimal, trade-distorting effects or effects on production. As trade-distorting support it is
therefore included in “the sum of the applied levels of trade-distorting support under each OTDS
component”. 36
This argument is strengthened by analysis showing that certain input subsidies, based
36. However, a precursor to Rev.4, the 2004 Framework Agreement, mentions “all trade-distorting
domestic support, as measured by the Final Bound Total AMS plus permitted de minimis level and …
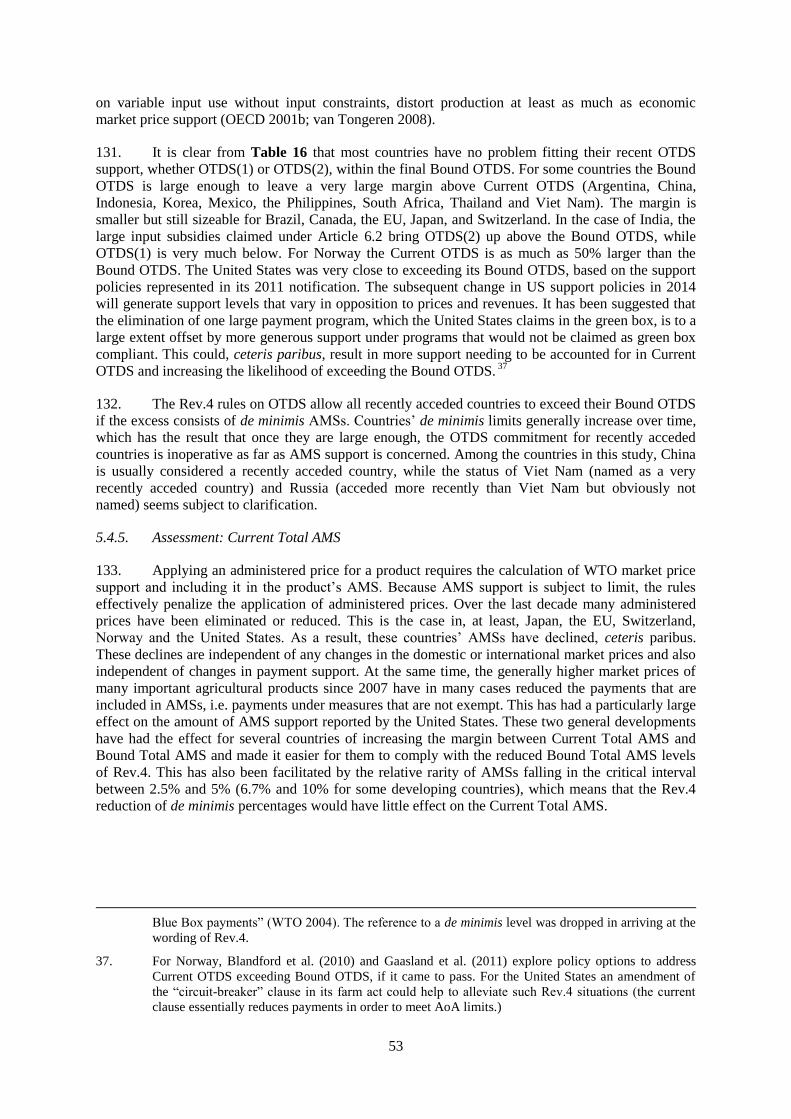
53
on variable input use without input constraints, distort production at least as much as economic
market price support (OECD 2001b; van Tongeren 2008).
131. It is clear from Table 16 that most countries have no problem fitting their recent OTDS
support, whether OTDS(1) or OTDS(2), within the final Bound OTDS. For some countries the Bound
OTDS is large enough to leave a very large margin above Current OTDS (Argentina, China,
Indonesia, Korea, Mexico, the Philippines, South Africa, Thailand and Viet Nam). The margin is
smaller but still sizeable for Brazil, Canada, the EU, Japan, and Switzerland. In the case of India, the
large input subsidies claimed under Article 6.2 bring OTDS(2) up above the Bound OTDS, while
OTDS(1) is very much below. For Norway the Current OTDS is as much as 50% larger than the
Bound OTDS. The United States was very close to exceeding its Bound OTDS, based on the support
policies represented in its 2011 notification. The subsequent change in US support policies in 2014
will generate support levels that vary in opposition to prices and revenues. It has been suggested that
the elimination of one large payment program, which the United States claims in the green box, is to a
large extent offset by more generous support under programs that would not be claimed as green box
compliant. This could, ceteris paribus, result in more support needing to be accounted for in Current
OTDS and increasing the likelihood of exceeding the Bound OTDS. 37
132. The Rev.4 rules on OTDS allow all recently acceded countries to exceed their Bound OTDS
if the excess consists of de minimis AMSs. Countries’ de minimis limits generally increase over time,
which has the result that once they are large enough, the OTDS commitment for recently acceded
countries is inoperative as far as AMS support is concerned. Among the countries in this study, China
is usually considered a recently acceded country, while the status of Viet Nam (named as a very
recently acceded country) and Russia (acceded more recently than Viet Nam but obviously not
named) seems subject to clarification.
5.4.5. Assessment: Current Total AMS
133. Applying an administered price for a product requires the calculation of WTO market price
support and including it in the product’s AMS. Because AMS support is subject to limit, the rules
effectively penalize the application of administered prices. Over the last decade many administered
prices have been eliminated or reduced. This is the case in, at least, Japan, the EU, Switzerland,
Norway and the United States. As a result, these countries’ AMSs have declined, ceteris paribus.
These declines are independent of any changes in the domestic or international market prices and also
independent of changes in payment support. At the same time, the generally higher market prices of
many important agricultural products since 2007 have in many cases reduced the payments that are
included in AMSs, i.e. payments under measures that are not exempt. This has had a particularly large
effect on the amount of AMS support reported by the United States. These two general developments
have had the effect for several countries of increasing the margin between Current Total AMS and
Bound Total AMS and made it easier for them to comply with the reduced Bound Total AMS levels
of Rev.4. This has also been facilitated by the relative rarity of AMSs falling in the critical interval
between 2.5% and 5% (6.7% and 10% for some developing countries), which means that the Rev.4
reduction of de minimis percentages would have little effect on the Current Total AMS.
Blue Box payments” (WTO 2004). The reference to a de minimis level was dropped in arriving at the
wording of Rev.4.
37. For Norway, Blandford et al. (2010) and Gaasland et al. (2011) explore policy options to address
Current OTDS exceeding Bound OTDS, if it came to pass. For the United States an amendment of
the “circuit-breaker” clause in its farm act could help to alleviate such Rev.4 situations (the current
clause essentially reduces payments in order to meet AoA limits.)
54
Table 16. Calculation of Current OTDS
Country Currency Units Bound
OTDS after reduction
Calculated applied trade-distorting support “Current OTDS”
Notified support Latest year
notified Current
Total AMS de minimis
AMSs Art. 6.5
blue Art. 6.2 With
Art. 6.2 Without Art. 6.2
Argentina ARS of 1992 million 3,261 82 82 74 7 2008/09
Brazil USD billion 8.8 4 3 0 3 1 2011/12
Canada CAD million 3,991 3,068 3,068 522 2,546 2011
China CNY billion 584.4 96 96 96 2008
EU28 EUR billion 24.2 11 11 7 1 3 2010/11
India INR billion 1,151 1,544 104 104 1,440 2010/11
Indonesia IDR billion 121,948 16,440 - 16,440 2011
Japan JPY billion 1,371 984 984 609 220 155 2012
Korea KRW billion 6,058 726 721 33 688 5 2008
Mexico MXP of 1991 million 27,676 3,247 1,882 589 1,293 1,365 2007
Norway NOK billion 9.5 15 15 10 0 4 2011
Philippines PHP billion 117 14 7 7 7 2010
Russia USD billion 5.5 7 7 6 1 2012
South Africa ZAR million 9,315 - - - - - 2008
Switzerland CHF million 2,687 2,212 2,212 2,212 2012
Thailand THB million 99,366 30,092 30,092 169 29,923 2008
Turkey USD million 10,380 Latest data is for 2001
United States USD billion 14.5 14 14 5 10 2011
Viet Nam VND billion 35,234 9,730 1,632 1,632 8,099 2008
Notes: Bound OTDS after reduction from Table 14. With and without Art. 6.2 refers to whether or not Article 6.2 support is included in applied trade-distorting support. Many amounts are rounded.
Source: Author’s calculations.
55
134. However, these general tendencies are offset by particular situations arising for several
individual countries. Canada runs a risk of its non-product-specific AMS exceeding the de minimis
level of Rev.4 and in so doing raising the Current Total AMS above the Bound Total AMS of Rev.4.
Norway would experience difficulty with the Rev.4 Bound Total AMS, both because there is little
margin to start with and because a couple of product-specific AMSs do fall in the critical interval of
de minimis percentages. Switzerland could also face difficulty with Bound Total AMS because the
Rev.4 reduction is sizeable enough to use up more than the recent margin. Thailand would be in a
situation where the AMS for rice not only would switch from being smaller than the de minimis
threshold to being larger than the Rev.4 threshold, but it would also be large enough to make Current
Total AMS exceed Bound Total AMS under Rev.4. The United States would seem able to fit support
under its past programs within the Rev.4 levels of Bound Total AMS and de minimis but faces the
possibility that support under the new payment programs from 2014 would be more difficult to fit
under the AMS limits.
135. Thus, it appears that most countries in this study are well placed to abide by their Rev.4
commitments on Bound Total AMS. This could apply to Argentina, Brazil, the EU, India, Indonesia,
Korea, Mexico, the Philippines, South Africa, Turkey and Viet Nam. Although some issues in
interpreting Rev.4 may affect the assessment for China and Russia, they could be similarly well
placed.
5.4.6. Assessment: Product-specific AMSs, blue box payments, OTDS
136. Regarding product-specific AMSs, there are several instances where analysis has shown a
likelihood of a country exceeding one or more of the caps introduced under Rev.4. Such analysis for
other countries might indicate additional instances where the caps would not accommodate recent
product-specific AMSs. In general, an increase in the administered price translates directly into a
larger product-specific AMS, and there are likely numerous instances of such increases in recent
years. For example, China and Indonesia are reported to have continued to raise their policy prices in
the years after their last notifications. However, the rules of Rev.4 with regard to the establishment of
caps on product-specific AMSs would allow the caps to be quite large, with the consequence that they
would not immediately be a constraint.
137. While all countries would establish a limit on total blue box payments, only the EU, Japan
and Norway have in recent years provided such payments. Among these, Norway’s recent total blue
box payments have been large enough to exceed the Rev.4 limit. Regarding limits on product-specific
blue box payments, Japan’s recent payments for rice have been larger than the possible Rev.4 limit. If
the United States were to classify some of its payments under the 2014 farm act as blue box payments,
it would need to ensure that such payments met the applicable limits under Rev.4, whether on total
box or on a product-specific basis.
138. On OTDS, the comparisons indicate that all the developing countries in the study have no
problem complying with their OTDS commitments, with one proviso. If Article 6.2 support is
included in Current OTDS, India would significantly exceed its Bound OTDS. Among the developed
countries, there is also in most cases a comfortable margin between the Current OTDS and Bound
OTDS. Norway stands out as facing a large overshoot. The United States could also find itself facing
overshoot situations, with the size of the excess possibly varying from year to year.
5.5. Domestic support digest
139. The AoA limits AMS support, i.e. support provided under programs that do not meet the
criteria for green box, blue box or development box exemption. Some countries have limits on
individual AMSs, defined by the de minimis percentage applied to the value of production. Other
countries have a limit on Current Total AMS, where AMSs below the de minimis threshold are
excluded from the calculation. Rev.4 would reduce the limit on Current Total AMS for some
countries and it would also for some countries reduce the de minimis percentage. Rev.4 would
56
introduce fixed limits on product-specific AMSs. It would also introduce a limit on total blue box
payments and limits on product-specific blue box payments. In addition, it would introduce a limit on
all trade-distorting support, effectively a limit on Current OTDS. It is not clear whether Current
OTDS includes or excludes Article 6.2 support, such as certain input subsidies.
140. Altogether, Rev.4 would thus introduce limits on additional measurements of support and
reduce the limits and thresholds under AoA. However, the reductions would not apply to all countries,
and when they apply they would apply differently to different countries. Likewise, the establishment
of new limits would apply different generosity to different countries. The outcome is a set of rules and
commitments that varies greatly among countries.
141. The general increase in agricultural product prices over the last decade has helped some
countries to make smaller payments. This, in combination with the elimination or reduction of
administered prices in several countries, has facilitated the accommodation of their recent or present
support levels within the limits of Rev.4. However, in some cases the continued increases in
administered prices of course work the opposite way, although only in few cases do the larger AMSs
or Current Total AMS exceed the country’s constraints under Rev.4. Maintaining an AMS at its
historical level has for some countries the consequence under Rev.4 of the AMS switching from being
exempt on de minimis grounds to having to be included in Current Total AMS and even bringing that
indicator up above the reduced Bound Total AMS under Rev.4.
142. Most countries – possibly all except one in this study - would have a comfortable margin
between applied trade-distorting support measured as OTDS and the new Bound OTDS under Rev.4.
The same can be said about the new limits on total and on product-specific blue box payments.
6. Discussion
6.1. Country-specific situations
143. In this examination of countries’ situation in relation to Rev.4 rules and commitments,
Norway and the United States are mentioned frequently as identified or thought to be identified in
Rev.4 in connection with a particular provision or as being in a situation where recent or current
policy settings would generate discord with Rev.4 rules and commitments, particularly in domestic
support. The United States also attracts attention because it is a large agricultural trader. Norway and
the United States are therefore discussed here with somewhat more depth than elsewhere in the study.
144. The frequent mention of Norway is seemingly no accident: even the WTO trade policy
review (TPR) of Norway puts its finger on this situation (WTO 2012b). It is highly unusual that a
TPR discusses the positioning of a country with regard to agriculture and a possible DDA outcome.
The relevant TPR paragraph is as follows.
“A new multilateral agreement in the WTO on further reductions in agricultural subsidies
could have major implications for Norway. Based on the state of play of the negotiations
in December 2008, the Norwegian Government estimated that Norway's new annual ceiling for
amber box, blue box, and present de minimis support would be around NKr 9.5 billion,
including a reduction in amber box support of just over 50% (to NKr 5,438 million), and a
ceiling for blue box support of NKr 3.56 billion. Expanded TRQs in combination with zero in-
quota import duties would also impose more serious challenges for Norway's market regulation
system than current WTO commitments. According to the authorities, these parameters would
be very close to what Norway would consider acceptable given its policy objectives for the
agriculture and food sector. However, despite the leeway for unilateral action and possible
future obligations, there are no signs yet that Norway has taken steps to prepare for a negotiated
outcome in the WTO, or advance reforms.” (WTO 2012b; footnote deleted).
57
145. While Norway of course would need to prepare for a negotiated outcome in the WTO only
on its own timetable, the issues identified in the TPR would seem more challenging than in most other
countries in this study. In this regard, Blandford et al. (2010) and Gaasland et al. (2011) explore some
options for policy change in Norway to comply with Rev.4 rules and commitments.
146. The United States emerges as generally well positioned in relation to Rev.4 rules and
commitments, excepting export financing support and international food aid and some parts of
domestic support. In domestic support, the new US Agricultural Act of 2014 maintains and perhaps
even increases the potential for large payments to be made when prices and revenues drop. Confident
estimates of payments under the different new programs are not yet available for the 2014 marketing
year onwards (September 2014). The possibility of large crop payments for 2014 has been mentioned,
such that several Rev.4 limits could be exceeded (Zulauf and Orden 2014)38
. Even though many crop
prices are anticipated to remain near their 2014 levels for several years or perhaps even rise a little,
some actual price and yield outcomes could generate larger payments than in 2014. While the new
dairy margin insurance program may make generous payments in some situations, it is not clear how
support under this program will be accounted for in AoA and Rev.4 terms. In any case, because of
large historical dairy support, the product-specific dairy AMS limit would be large. The United States
may under certain readings of Rev.4 be able to account for some crop payments as blue box support.
The United States could thus to some extent manage its classification of different payments such that
the instances of exceeding Rev. 4 limits would be avoided or minimized.
147. The US 2014 Agricultural Act, like earlier agricultural laws, includes provisions for
adjusting payments if needed to stay below the Bound Total AMS of the AoA (a “circuit-breaker”
clause). Such provisions might be introduced with regard to commitments in line with Rev.4 if an
agreement was reached.39
This means that situations identified as those where Rev.4 commitments
might be exceeded must not be seen as predictions. They only serve as elements in assessing the
broader picture of the position if the Rev. 4 rules and commitments were implemented today.
6.2. Public stock acquisition and administered prices
6.2.1. Food security, green box expenditures and AMS
148. Support to producers in the form of domestic support and border protection is often
motivated by a country’s stated desire to improve its food security by means of raising its self-
sufficiency rate.40
The OECD considers that the link between higher self-sufficiency ratio and
improved food security is weak and a number of measures unrelated to self-sufficiency ratios – such
as poverty reduction and social security schemes – can help to improve populations’ food security
status. Self-sufficiency targets often push countries towards higher market price support and other
policies directly stimulating higher farm production. Food security is also invoked in the WTO
38. Zulauf and Orden (2014) suggest that if Rev.4 rules and commitments had been in place in 2014, the
2014 farm bill would not have had the same program payment provisions as those actually enacted.
39. Other countries’ policy measures may have similar provisions. Even if they do not, a country can in
practice adjust its policy settings such that its support for a given year stays within the limits of the
WTO, whether in the AoA or Rev.4.
40. OECD (2013, page 25) reports on such efforts as follows. “Several countries maintain specific targets
for food self-sufficiency rates, motivated by concerns about food security for their consumers. China
maintains a 95% self-sufficiency target for grains, while Indonesia has set self-sufficiency targets for
rice, sugar, soybeans, maize and beef to be achieved by 2014. The new Basic Plan on Food,
Agriculture and Rural Area in Japan envisages an increase in the self-sufficiency ratio of its calorie
supply to 50% by 2020, compared to 41% in 2008. … A Doctrine on food security states minimum
self-sufficiency targets of at least 85-90% for a range of agricultural products in Russia, including
among others, grains, sugar, vegetable oil, meat and dairy products. … and increased agricultural
output in order to ensure food security is among the general objectives for agricultural policy in both
Brazil and Turkey.”
58
context, specifically in the major issue debated at the Bali Ministerial conference in 2013 and
subsequently in the WTO Committee on Agriculture. This is because the issue relates to AoA rules
under the heading “Public stockholding for food security purposes”, a heading in Annex 2, i.e. the
green box. However, as WTO (2014k) puts it, “Supplying cheap food to the poor is not an issue here:
it’s allowed without limit.”
149. The issue is rather one of using administered prices in acquiring stocks that are then released
at administered prices. A footnote in the mentioned green box paragraph allows a developing country
to exempt its expenditures on accumulating and holding food stocks for food security purposes at
administered prices from counting as AMS support, even if the acquisition at such a price has the
effect of providing price support to producers. This exemption is, however, available only in specific
circumstances and under given conditions. The circumstances include meeting rules on how the
program is operated, concerning such things as transparency and conduct in accordance with
published criteria and guidelines. They also include the requirement that stocks are released at
administered prices. The condition has to do with the possibility that the acquisition at an
administered price provides price support to producers. Exempting expenditures from being counted
in AMS is thus conditioned on a price gap being accounted for in AMS. This price gap is the
difference between the acquisition price and the external reference price.
6.2.2. Penalty for acquiring at administered prices
150. The idea of not counting certain price support as AMS support has been introduced
repeatedly in the DDA, most recently by the G-33 group of certain developing countries and
championed by India at the Bali conference (WTO 2014k). Part of the issue is that accounting for the
price gap in line with the rules of the AoA imposes a penalty on using an administered price, even if
that administered price is below the level of the current year’s international market price. Specifically,
the AoA gap is the difference between the applied administered price and a constant that is equal to
the external reference price in 1986-88. This generates a penalty that differs in size from the price
support calculated using economic methods, but the AoA calculation is nevertheless called market
price support, like the economic measurement of support. Moreover, while the economic
measurement multiplies the price gap by total production, the AoA penalty multiplies the gap between
the administered price and the constant by the production eligible to receive the applied administered
price, which some countries interpret to mean a quantity much smaller than total production.
151. In the case of India, administered prices for important crops such as rice and wheat have
been close to current international prices for many years, sometimes even below those prices. There
has thus been relatively little and in some years no economic support to producers. The rules of the
AoA would, under some readings, require India to calculate very large penalties for using
administered prices (Brink 2014a). India deviates from those rules in several ways and notifies AMSs
for rice and wheat and some other crops that remain below its de minimis limits of 10% of value of
production. Nevertheless, even using India’s own method for calculating the penalty, its AMS for rice
in 2011 and 2012 came quite close to its de minimis limit (it declined slightly in 2013) (Brink 2014a).
If India were to increase its administered price for rice by more than a certain extent, it could find
itself with a rice AMS in excess of its de minimis limit. This could thus happen even if India uses the
measurement methods, questioned in the Committee on Agriculture, that generate a relatively small
penalty.
6.2.3. Why penalize the use of administered prices?
152. The particular measurement methods for what the AoA calls market price support, harking
back to the economics-based antecedent, were not adopted by accident. They resulted from some
countries’ desire to take a legally binding commitment only on a variable over which the government
has control. This was not the case for the observed domestic market price nor for the international
market price or border price as a reference. The government does control the administered price – this
is what in the understanding of many makes it an administered price – and it does control the
59
production eligible to receive the administered price. The constant used to measure the size of the
penalty – based on 1986-88 prices – is not under government control but remains fixed.
153. There may also have been a motivation for wanting to penalize the use of administered
prices when negotiating the AoA. The provisions were primarily but not exclusively designed to rein
in the large economic market price support that what is now the European Union provided at the time.
The domestic market prices, maintained with the help of administered prices, were for many products
in the EU and elsewhere much higher than their international prices. Making it more difficult to
simply continue using administered prices, not just pursuing a reduction of them, may have been part
of the aim of some countries.41
154. This leads to the question of what role administered prices might have as countries pursue
“the long-term objective referred to in the Agreement to establish a fair and market-oriented trading
system through a programme of fundamental reform encompassing strengthened rules and specific
commitments on support and protection in order to correct and prevent restrictions and distortions in
world agricultural markets” and provide for special and differential treatment for developing countries
“so as to be operationally effective and to enable developing countries to effectively take account of
their development needs, including food security and rural development”, as expressed in the
Ministerial declaration launching the DDA (WTO 2001). Economic analysis may help to clarify the
effects and consequences of using administered prices, their effectiveness in achieving stated
objectives, and the alternative instruments that could be used to achieve those objectives.
6.3. Change policy or change the rules?
6.3.1. Agriculture Agreement as the driver of policy reform
155. How to address the issue of administered prices and the rules of the AoA has generated
many ideas. Some acknowledge that the rules of the AoA are written the way they are for a reason,
namely to make it difficult to use administered prices. In this view, the AoA and the outcome of DDA
are seen as tools to achieve the objectives they say they want to achieve. Following the agreement on
AoA and the establishment of the WTO, many analysts hailed the agreement and countries’
commitments under it as a good thing. There was now a legal framework in place to curb then
existing distorting policy practices and to make it more difficult to introduce new distorting policies.
Government policies in agriculture would finally be subject to international rules and commitments,
and the reductions that countries committed to making would in many cases drive policy reform. The
DDA was seen in the same light, i.e. making progress on a path towards less distortions in agricultural
trade. The internationally binding rules and reduction commitments would ensure that countries did
not continue applying or put in place policies that would make them exceed their WTO commitments.
156. Seeing WTO rules and commitments as governing what countries can do in terms of policies
that affect agricultural trade underpins the idea of switching from using administered prices to using
market prices when a government acquires stocks. This idea is noted by Brink (2014a) and
Tangermann (2014). It is of course in practice not simply a matter of switching from using one price
to another, since many rules, regulations, institutions, practices and interests are involved with
decades-old policy regimes. Nonetheless, the idea is that the internationally binding rules and
41. It may be tempting to seek to make a distinction between the use of administered prices for the
purpose of supporting prices by buying into intervention stocks and for the purpose of building stocks
for food security purposes. However, stated purposes are not easy to adhere to strictly over time, and
stated purposes are not necessarily the same as actual purposes (the term “mission creep” comes to
mind). The OECD’s policy monitoring addresses this problem by classifying policies according to
their implementation criteria, not their purpose, objective, goal, etc. The complex criteria and
conditions established for the treatment of acquisition at administered prices, both in footnote 5 of
paragraph of Annex 2 of AoA and in the Bali declaration on this topic, seem to be attempts to address
the fundamental problem arising from classifying policy measures by their stated objectives.
60
commitments of the AoA prevail over the interest of a government to maintain policy settings with
effects that conflict with the AoA. Under this view, there would be no need and no scope for
amending the AoA so as to facilitate the continued use of administered prices. Economic analysis of
the use of administered prices could lend support for or against this view.
157. It might be argued that developing countries or countries selected in some other way should
not, for whatever reason, need to adjust their policies because of WTO rules and commitments. Such a
view would need to be reconciled with the view that distorting support distorts, regardless of where it
is provided.
6.3.2. Established policy as the driver of changing the rules
158. The alternative view is that the interest of some governments in continuing to use
administered prices motivates revising the AoA rules if they block such continued use. Instead of
international commitments shaping policy, desired policy would shape international commitments.
Numerous ideas have been elaborated for how the AoA rules might be changed to accommodate the
continued use of administered prices. Some of these ideas are based on making the measurement of
what is called market price support in the AoA more similar to economics-based market price support.
Some of them include provisions to limit to some extent the use of administered prices or to limit the
effects of using them. Ideas in this vein have been suggested or mentioned by, for example, Diaz-
Bonilla (2014), Konandreas and Mermigkas (2014), Matthews (2014a, 2014b), and Montemayor
(2014).
159. A third line of thought exists on the topic of administered prices. Josling et al. (1996)
questioned the inclusion of what is called market price support in AMS, i.e. they questioned the
inclusion of what here is called a penalty on the use administered prices. That view is restated by
Tangermann (2014). It is based on the fact that a gap between the domestic and the border price can
only be maintained with the help of border measures. Since border measures are constrained by the
market access and export subsidy disciplines of the AoA, there would be no need to subject also the
domestic pricing to the domestic support discipline. It is not entirely clear whether Uruguay Round
negotiators ignored this aspect of domestic pricing or they recognized it but chose to effectively
subject such pricing to more than one discipline.
160. A fourth line of thought is what Ministers adopted at Bali (WTO 2013d). No change was
introduced in the rules of the AoA regarding the exemption of expenditures from AMS when using
administered prices to acquire stocks and needing to account for a price gap in the AMS. However,
under the Bali decision, when in a developing country a product’s AMS exceeds its de minimis limit
and if the country satisfies the criteria of the green box and the rules of the AMS calculation,
including the use of the 1986-88 reference price, other countries shall under certain conditions refrain
from challenging that violation through the WTO dispute settlement mechanism. This also applies
when a developing country in the same circumstances exceeds its Bound Total AMS. The availability
of this carte blanche is circumscribed and conditioned in several ways, so as to alleviate other
countries’ concerns about the negative effects they might face as a result of a country’s use of
administered prices to acquire stocks.
6.3.3. Economic analysis
161. Thus, in investigating the economics of administered prices, it could be useful to develop a
better understanding of what constitutes an administered price, what desirable and undesirable
consequences their use may entail, what unintended consequences may emerge, and what alternatives
might exist to achieve the same objectives without using administered prices. If the preponderance of
economic evidence points at the benefits of using administered prices outweighing the costs, what are
the alternatives in designing WTO rules to make them more usable?
61
6.4. Emerging issues
6.4.1. General
162. Since the time of drafting Rev.4 in 2008 and earlier years several issues affecting
agricultural trade have emerged or have gained importance. They may not have had much or any
influence on the contents of Rev.4 but they may nevertheless influence how countries today evaluate
their positions in relation to the rules and commitments of Rev.4. Among such issues are those
discussed by Bureau and Jean (2013a, 2013b) and McMahon and Desta (2012). They include new
macro-economic conditions, biofuels, the environment, food security, right to food, development,
plant intellectual property, genetically modified organisms, regional and bilateral trade agreements,
sanitary and phytosanitary measures, technical barriers to trade, private standards, climate change,
biofuels, and multifunctionality. Such topics are not addressed at all in Rev.4, since it hews closely to
the structure of the AoA.
6.4.2. Export prohibitions and restrictions
163. However, one emerging issue is to some extent addressed in Rev.4 and AoA, viz, the
increasing and decreasing use of export restrictions of different kinds in the years since Rev.4 was
drafted. The AoA has an article entitled “Disciplines on export prohibitions and restrictions”, but the
provisions are generally considered weak. For example, there are no commitments not to use certain
measures or to use them only to a certain extent. Countries that rely on imports of agricultural
products may thus feel insecure about the reliability of import flows, which can be factor in many
countries seeking to increase self-sufficiency, as mentioned above.
164. Rev.4 would to some extent strengthen the disciplines of AoA on export prohibitions and
restrictions. Rev.4 would, for example, require the elimination of certain existing export prohibitions
and restrictions in foodstuffs and would provide for the possibility of time limits applying to new such
prohibitions and restrictions. It is not clear whether any recent or current policy settings in this area
would contravene the rules of Rev.4.
165. The use of various forms of export restrictions in agriculture has been the subject of keen
analysis.42
Anania (2013) reviews much of the analysis and discusses several options for
strengthening the disciplines in the form of a WTO agreement. They range from options that are more
modest than those of Rev.4 to options more ambitious in terms of their capacity to limit the ability of
exporting countries to hold back or discourage exports of agricultural products.
6.5. Need for long-term perspective
166. Some policy settings are changed frequently, sometimes within the year. Others remain in
place for periods of several years, such as the five, six, or seven year periods for which agricultural
policies are authorized in some countries. Others are even more long-lasting. Still, commitments
under the AoA remain in place for even longer. The Uruguay Round started in 1986 and was
concluded only in 1994. The AoA came into effect in 1995. The DDA started in 2001 (effectively in
2000 for agriculture) and was not yet concluded in 2014. Over time spans such as these, the world of
agricultural trade changes considerably. That speaks for taking a very long time perspective as the
context when looking at current policy settings.
42. Export restrictions may mean only quantitative export restrictions or quantitative export restrictions
and export taxes. This distinction matters greatly for a country like Argentina, which taxes exports of
many important agricultural products. In early 2014 its export taxes stood at 20% for corn and barley,
23% for wheat, and 5-10% for soybeans. Wheat and corn exports are administered through quotas
and export authorization. Export taxes on oilseeds and products were 5% (peanut oil), 23.5%
(peanuts), 30% (sunflowerseed meal and oil), 32% (sunflowerseed, soybean meal, soybean oil), and
35% (soybeans) (US Department of Agriculture 2014a, 2014b).
62
167. Diaz-Bonilla (2014, Table 2) illustrates the changing rank order of agricultural exporters
since the 1990s. In the 1990s only one developing country was in the top five net agricultural
exporters; altogether three were in the top ten. By 2010-11 there were three developing countries
among the top five, and five out of the top ten were developing countries. The increasing share of
developing countries in world trade of food and agriculture is similarly illustrated by Bureau (2013b,
Figure 1).
168. In terms of domestic support to agriculture, the world is changing. The four largest
developed country agricultural producers (EU, United States, Japan, Russia) exhibit a downward trend
or a stable low level of WTO support not qualifying for the green box since 1995 (Brink 2014c). Four
of the largest developing country agricultural producers (Brazil, China, India, Indonesia) show a
rising trend of support not qualifying for the green box, which includes Article 6.2 support for some
of them.43
These trends using WTO indicators more or less match the tendencies revealed through the
OECD’s Producer Support Estimates, which account for more policy measures than just domestic
support measures in the AoA sense.
169. Pictures of past trends such as those mentioned say nothing about future developments. It is
still worth considering the long-term implications of the trends if they were to continue. Just
projecting the trends would describe a world where major agricultural producing and trading countries
are heavy users of support that does not meet the green box criteria. Many of the large producers and
traders in the future may be countries enjoying the flexibility that the AoA and perhaps Rev.4 accords
developing countries. This is not to say that all developing countries in the future will take advantage
of such flexibility and provide large amounts of support. It may mean that the interests of future low-
support and future high-support developing countries diverge. Among the 19 countries in this study
there may be some in each group. Assessing which ones are in which group would, however, be
highly speculative.
7. Conclusion
170. The examination of the policy settings of twelve developing and seven developed countries
finds that few countries would need to change their settings very much if at all in order to conform
with the rules and commitments of an agreement corresponding to Rev.4, if implemented
immediately. This is the combined result of policy settings having already been changed since the
drafting of Rev.4, the rules and commitments of Rev.4 being generous enough and/or tailored to
accommodate the situations of individual countries, and international prices of many agricultural
products generally having increased since the time of drafting Rev.4. Some situations would arise
where policy change would be needed to meet the Rev.4 requirements regarding a part of one of the
three pillars, i.e. market access, export competition, and domestic support, or for a particular product
or set of products. Overall the situation in 2014 thus looked more conducive even than in 2008 to
achieving the “gain” of agreeing on Rev.4 rules and commitments while incurring relatively low
“pain”.
171. Rev.4 is written to include a plethora of provisions to accommodate the needs of particular
countries or groups of countries as they have expressed them in the negotiations. These provisions of
course reduce the trade liberalizing effect of the agreement as a whole but serve to make agreement
possible where otherwise it would not have been possible. At the most primary level these provisions
distinguish between developed and developing countries but they also go far beyond that important
self-selection by countries. They are in some cases designed to harmonize the commitments by which
various countries would need to abide, i.e. they would reduce the differences across countries. Most of
these provisions are written in a sort of code, where identifying the country or countries benefitting
from the provision requires analysis of data external to Rev.4. This is further complicated by
43. Among the ten largest agricultural producers, Nigeria notified that no domestic support was provided
and Turkey has not notified since 2001 (the OECD indicates economic support at a level higher than
the average among OECD countries).
63
provisions that offer a menu of choices, some with trade-offs between tighter and looser constraints of
different kinds, some without such trade-offs. This complexity to some extent reduces the confidence
of any assessment of how countries are positioned in relation to Rev.4 rules and commitments.
172. A common perception is that the reason the DDA in agriculture stalled in 2008 was the
inability of India and the United States to agree on the rules for the SSM, or special safeguard
mechanism. This would especially involve the question of whether, once SSM was triggered for a
product, its applied tariff could exceed not only the Rev.4 bound tariff but also the pre-Rev.4 bound
tariff. Under this narrative countries would, if only SSM was agreed, have entered into commitments
in line with those resulting from Rev.4. A more nuanced narrative recognizes the threshold nature of
the SSM question but sees its resolution only as a necessary but not sufficient condition for countries
agreeing to enter into Rev.4 commitments on agriculture. More issues in agriculture remained
unresolved at the time of failing to agree on SSM, although progress was being made in negotiating
their resolution. Developments in international markets and in countries’ policy settings since 2008
have eliminated some but not all of the points on which further negotiations at that time were needed.
Some new policy settings may even have made an agreement more difficult to reach. Agreeing on
SSM could have facilitated, and could have provided an impetus towards, countries reaching
resolution also on those outstanding issues, especially those concerning market access and those
concerning developing countries. The resulting modalities, the subsequent legal text, and countries’
eventual commitments would not have been identical to those envisaged under Rev.4 but would have
resembled them.
173. In the intervening years since the drafting of Rev.4 numerous issues have arisen in the area
of agricultural trade and policy writ large. They were generally not addressed in depth in the three
pillars of the AoA and consequently they did not garner much if any attention in Rev.4. They
nevertheless affect the trading environment and hence they define the context for further multilateral
negotiations. Increasing market access under bilateral and regional trade agreements is one important
part of that context: countries have changed and are changing their border measures although not on a
multilateral basis. Market access is being improved for some countries into some countries. The
context is also changing through the shifting roles of developing and developed countries in
agricultural trade and changes in how and how much they support their producers, increasing attention
to what is often called food security and in many cases involves trade policy moves to increase self-
sufficiency ratios or contain domestic price rises, greater policy attention to the roles – positive and
negative - of agriculture in climate change and environmental quality, and many more. Countries’
desire or lack of desire to address such issues through agricultural trade policy may play a greater role
in conditioning the WTO negotiating climate than will the extent to which commitments on market
access, export competition and domestic support are now more easily entered into than in 2008.
64
REFERENCES
Agra Europe (2014) Russian food import bans – how can the EU react? 11 August. https://www.agra-
net.net/agra/agra-europe/policy-and-legislation/eu/russian-food-import-bans-how-can-the-eu-
react-450258.htm (viewed 20 August 2014)
Anania, G. (2013) Agricultural export restrictions and the WTO – What options do policy-makers
have for promoting food security? Issue Paper No. 50, International Centre for Trade and
Sustainable Development.
Blandford, D., I. Gaasland, R. Garcia and E. Vårdal (2010) How effective are WTO disciplines on
domestic support and market access for agriculture? The World Economy 33(11) pp. 1470 –
1485.
Blandford, D. and T. Josling (2011) The WTO agricultural modalities proposals and their impact on
domestic support in the EU and the United States. In W. Martin and A. Mattoo (eds) Unfinished
Business? The WTO’s Doha Agenda. Washington, DC: CEPR and the World Bank.
Blandford, D. and D. Orden (2011) United States. In D. Orden, D. Blandford and T. Josling (eds)
WTO Disciplines on Agricultural Support – Seeking a Fair Basis for Trade. Cambridge:
Cambridge University Press.
Brink, L. (2014a) Support to agriculture in India in 1995-2013 and the rules of the WTO. Working
Paper #14-01, International Agricultural Trade Research Consortium.
Brink, L. (2014b forthcoming) Farm support in Ukraine and Russia under the rules of the WTO. In
Transition to Agricultural Market Economies: The Future of Kazakhstan, Russia, and Ukraine,
ed. A. Schmitz and W. Meyers. Cambridge, USA and Wallingford, UK: CABI.
Brink, L. (2014c forthcoming) Evolution of trade-distorting domestic support. In Tackling Agriculture
in the Post-Bali Context. Geneva: International Centre for Trade and Sustainable Development.
E-book.
Bureau, J.-C. and S. Jean (2013a) International agricultural trade and negotiations: Coping with a new
landscape. FOODSECURE Working Paper No. 08, March.
Bureau, J.-C. and S. Jean (2013b) Do yesterday’s disciplines fit today’s farm trade? In Strengthening
the Multilateral Trading System, Proposals and Analysis, Agriculture and Food Security Group,
The E15 Initiative, International Centre for Trade and Sustainable Development and the
International Food & Agricultural Trade Policy Council. http://e15initiative.org/wp-
content/uploads/2014/03/AG_Proposals_Analysis.pdf
Cheng, F. (2011) China. In D. Orden, D. Blandford and T. Josling (eds) WTO Disciplines on
Agricultural Support – Seeking a Fair Basis for Trade. Cambridge: Cambridge University
Press.
Cororaton, C. (2011). Philippines. In D. Orden, D. Blandford and T. Josling (eds) WTO Disciplines on
Agricultural Support – Seeking a Fair Basis for Trade. Cambridge: Cambridge University
Press.
Diaz-Bonilla, E. (2014) On food security stocks, peace clauses, and permanent solutions after Bali.
Working Paper, International Food Policy Research Institute, June.
http://ebrary.ifpri.org/cdm/singleitem/collection/p15738coll2/id/128209/rec/3.
Gaasland, I, R. Garcia and E. Vårdal (2011) Norway. In D. Orden, D. Blandford and T. Josling (eds)
WTO Disciplines on Agricultural Support – Seeking a Fair Basis for Trade. Cambridge:
Cambridge University Press.
65
Godo, Y. and D. Takahashi (2011) Japan. In D. Orden, D. Blandford and T. Josling (eds) WTO
Disciplines on Agricultural Support – Seeking a Fair Basis for Trade. Cambridge: Cambridge
University Press.
Gopinath, M. (2011) India. In D. Orden, D. Blandford and T. Josling (eds) WTO Disciplines on
Agricultural Support – Seeking a Fair Basis for Trade. Cambridge: Cambridge University
Press.
Hansen, J. and F. Gale (2014) China in the next decade: Rising meat demand and growing imports of
feed. Amber Waves, Economic Research Service, U.S. Department of Agriculture, 7 April.
Hopkinson, J. (2014) Farm bill crop payouts bigger than expected. Politico Morning Agriculture,
17 September.
http://www.politico.com/morningagriculture/0914/morningagriculture15328.html (viewed
18 September 2014)
Jean, S., T. Josling and D. Laborde (2008) Implications for Brazil of the May 2008 draft agricultural
modalities. International Centre for Trade and Sustainable Development, Geneva.
Josling, T., S. Tangermann, and T.K. Warley (1996) Agriculture in the GATT. Houndmills, London
and New York: Macmillann Press.
Josling, T. and K. Mittenzwei (2013) Transparency and timeliness: The monitoring of agricultural
policies in the WTO using OECD data. World Trade Review 12, pp. 533–547. doi:
10.1017/S1474745612000535
Josling, T. and A. Swinbank (2011) European Union. In D. Orden, D. Blandford and T. Josling (eds)
WTO Disciplines on Agricultural Support – Seeking a Fair Basis for Trade. Cambridge:
Cambridge University Press.
Kiselev, S. and R. Romashkin (2012) Possible effects of Russia’s WTO accession on agricultural
trade and production. Issue Paper No. 40, International Centre for Trade and Sustainable
Development, Geneva.
Konandreas, P. and G. Mermigkas (2014) WTO domestic support disciplines: Options for alleviating
constraints to stockholding in developing countries in the follow-up to Bali. Research Working
Paper No. 45, FAO Commodity and Trade Policy.
Korea Herald (2014) S. Korea notifies WTO of plan to liberalize rice market via tarriffication.
30 September. http://www.koreaherald.com/view.php?ud=20140930001045 (viewed
20 October 2014)
Laborde, D., W. Martin and D. van der Mensbrugghe (2011). Implications of the Doha market access
proposals for developing countries. Policy Research Working Paper WPS5679, World Bank,
June.
Lentz, E. and C. Barrett (2014) The negligible welfare effects of the international food aid provisions
in the 2014 farm bill. Choices, 3rd Quarter. http://www.choicesmagazine.org/choices-
magazine/theme-articles/3rd-quarter-2014/the-negligible-welfare-effects-of-the-international-
food-aid-provisions-in-the-2014-farm-bill (viewed 17 September 2014)
Market Monitor (2013 and 2014) Policy developments. Agricultural Market Information System,
various issues. http://www.amis-outlook.org/amis-monitoring/monthly-report/en/ (viewed
28 September 2014)
Matthews, A. (2011) The impact of WTO agricultural trade rules on food security and development:
an examination of proposed additional flexibilities for developing countries. IIIS Discussion
Paper No. 371, Institute for International Integration Studies, August.
Matthews, A. (2014a) Food security and WTO domestic support disciplines post-Bali. Issue paper
No. 53, International Centre for Trade and Sustainable Development, Geneva.
66
Matthews, A. (2014b) Trade rules, food security and the multilateral trade negotiations. European
Review of Agricultural Economics 41(3) pp. 511-535.
McMahon, J. and M. Desta (eds.) (2012) Research Handbook on the WTO Agriculture Agreement –
New and Emerging Issues in International Agricultural Trade Law. Cheltenham: Edward Elgar
Publishing, Inc.
Montemayor, R. (2014) Public stockholding for food security purposes: Scenarios and options for a
permanent solution. Issue Paper 51, International Centre for Trade and Sustainable
Development, June.
Nassar, A. (2011) Brazil. In D. Orden, D. Blandford and T. Josling (eds) WTO Disciplines on
Agricultural Support – Seeking a Fair Basis for Trade. Cambridge: Cambridge University
Press.
Nassar, A., C. Cabral da Costa, and L. Chiodi (2008) Implications for Brazil of the July 2008 draft
agricultural modalities. International Centre for Trade and Sustainable Development, Geneva.
OECD (2001a) An analysis of officially supported export credits in agriculture. Paris.
http://www.oecd.org/trade/agricultural-trade/1911035.pdf
OECD (2001b) Market Effects of Crop Support Measures. Paris.
OECD (2011) Evaluation of Agricultural Policy Reforms in the United States. OECD Publishing. doi
10.1787/9789264096721-en
OECD (2013) Agricultural Policy Monitoring and Evaluation 2013 – OECD Countries and Emerging
Economies. OECD Publishing. doi 10.1787/agr_pol-2013-en.
OECD (2014a) Agricultural Policy Monitoring and Evaluation 2014 – OECD Countries. OECD
Publishing. doi 10.1787/agr_pol-2014-en
OECD-FAO (2014b) OECD-FAO Agricultural Outlook 2014-2023. OECD Publishing.
OECD (no date) The Export Credits Arrangement 1978-2008: Achievements and Challenges –
Continued! Paris. http://www.oecd.org/tad/xcred/40594872.pdf
Orden, D., D. Blandford and T. Josling (eds) (2014) WTO Disciplines on Agricultural Support –
Seeking a Fair Basis for Trade. Cambridge: Cambridge University Press.
Schnepf, R. (2014a) Status of the WTO Brazil – U.S. cotton case. CRS Report R43336, Congressional
Research Service, 21 February. http://nationalaglawcenter.org/wp-
content/uploads/assets/crs/R43336.pdf
Schnepf, R. (2014b) International food aid programs: Background and issues. CRS Report R41072,
Congressional Research Service, 23 June. http://nationalaglawcenter.org/wp-
content/uploads/assets/crs/R41072.pdf
Tangermann, S. (2014) Post-Bali issues in agricultural trade: A synthesis. DRAFT Report for the
OECD, September.
Tian, Z. (2009) Implications for China of the December 2008 draft agricultural modalities.
International Centre for Trade and Sustainable Development, Geneva.
US Department of Agriculture (2014a) Argentina – Grain and feed annual 2014. GAIN Report
Number (no number), Foreign Agricultural Service.
US Department of Agriculture (2014b) Argentina – Oilseeds and products annual 2014. GAIN Report
Number (no number), Foreign Agricultural Service.
US Department of Agriculture (2014c) Agricultural Act of 2014 (2014 Farm Bill), Title I information
about the Agriculture Risk Coverage (ARC) and Price Loss Coverage (PLC) programs. Notice
ARCPLC-4, Farm Service Agency.
https://www.fsa.usda.gov/Internet/FSA_Notice/arcplc_4.pdf (viewed 17 September 2014)
67
US Trade Representative (2014) United States and Brazil reach agreement to end WTO cotton
dispute. http://www.ustr.gov/sites/default/files/20141001201606893.pdf (viewed 1 October
2014)
Van Tongeren, F. (2008) Agricultural policy design and implementation: A synthesis. OECD Food,
Agriculture and Fisheries Working Papers, No.7, OECD Publishing. doi:
10.1787/243786286663
WTO (2001) Ministerial declaration. WT/MIN/(01)/DEC/1, Adopted on 14 November 2001,
Ministerial Conference, Fourth Session, Doha, 20 November.
WTO (2004) Decision adopted by the General Council on 1 August 2004. WT/L/579, 2 August.
WTO (2005) Export subsidy commitments. TN/AG/S/8/Rev.1, Committee on Agriculture, Special
Session, 2 February.
WTO (2008a) Revised draft modalities for agriculture. TN/AG/W/4/Rev.4, Committee on
Agriculture, Special Session, 6 December.
WTO (2008b) Revised draft modalities for agriculture – sensitive products: designation. TN/AG/W/5,
Committee on Agriculture, Special Session, 6 December.
WTO (2008c) Revised draft modalities for agriculture – sensitive products: tariff quota creation.
TN/AG/W/6, Committee on Agriculture, Special Session, 6 December.
WTO (2008d) Revised draft modalities for agriculture – special safeguard mechanism. TN/AG/W/7,
Committee on Agriculture, Special Session, 6 December.
WTO (2008e) Chairperson’s texts 2008. Agriculture: negotiations.
http://www.wto.org/english/tratop_e/agric_e/chair_texts08_e.htm
WTO (2009) Total Aggregate Measurement of Support. Revision. TN/AG/S/13/Add.3/Rev.1,
Committee on Agriculture, Special Session, 23 November.
WTO (2010a) Joint communication from Brazil and the United States. WT/DS267/45, 31 August.
WTO (2010b) Total value of agricultural production. TN/AG/S/21/Rev.5, Committee on Agriculture,
Special Session, 25 October.
WTO (2010c) Supporting data to calculate product-specific blue box limits. TN/AG/S/25, Committee
on Agriculture, Special Session, 9 November.
WTO (2012a) Republic of Korea. WT/TPR/S/268/Rev.1, Trade Policy Review, Report by the
Secretariat, Trade Policy Review Body, 8 November.
WTO (2012b) Norway. WT/TPR/S/269/Rev.1, Trade Policy Review, Report by the Secretariat, Trade
Policy Review Body, 13 November.
WTO (2013a) Viet Nam. WT/TPR/S/287/Rev.1, Trade Policy Review, Report by the Secretariat,
Trade Policy Review Body, 4 November.
WTO (2013b) Switzerland and Liechtenstein. WT/TPR/S/280/Rev.1, Trade Policy Review, Report by
the Secretariat, Trade Policy Review Body, 16 August.
WTO (2013c) General services. WT/MIN(13)/37 and WT/L/912, Ministerial Conference, Ninth
Session, Bali, 3-6 December.
WTO (2013d) Public stockholding for food security purposes. WT/MIN(13)/38 and WT/L/913,
Ministerial Conference, Ninth Session, Bali, 3-6 December.
WTO (2013e) Understanding on tariff rate quota administration provisions of agricultural products, as
defined in Article 2 of the Agreement on Agriculture. WT/MIN(13)/39 and WT/L/914,
Ministerial Conference, Ninth Session, Bali, 3-6 December.
WTO (2013f) Export competition. WT/MIN(13)/40 and WT/L/915, Ministerial Conference, Ninth
Session, Bali, 3-6 December.
68
WTO (2014a) Export subsidies, export credits, export credit guarantees or insurance programmes,
international food aid and agricultural exporting state trading enterprises. Background
document by the Secretariat, G/AG/W/125, Committee on Agriculture, World Trade
Organization, 21 May.
WTO (2014b) Export subsidies – Addendum. G/AG/W/125/Add.1, Committee on Agriculture, World
Trade Organization, 21 May.
WTO (2014c) Export credits, export credit guarantees or insurance programmes – Addendum.
G/AG/W/125/Add.2, Committee on Agriculture, World Trade Organization, 21 May.
WTO (2014d) Food aid – Addendum. G/AG/W/125/Add.3, Committee on Agriculture, World Trade
Organization, 21 May.
WTO (2014e) State Trading Enterprises – Addendum. G/AG/W/125/Add.4, Committee on
Agriculture, World Trade Organization, 21 May.
WTO (2014f) Annual export competition review. Submission from the Cairns Group to the 74th
meeting of the Committee on Agriculture (COA) in June 2014. G/AG/W/129, Committee on
Agriculture, World Trade Organization, 2 June.
WTO (2014g) Tariff profiles.
http://stat.wto.org/TariffProfile/WSDBTariffPFHome.aspx?Language=E 18 August 2014.
WTO (2014h) Goods Council approves Philippine waiver request for rice. Council for Trade in
Goods. http://www.wto.org/english/news_e/news14_e/good_24jun14_e.htm
WTO (2014i) Request for waiver relating to special treatment for rice of the Philippines.
G/C/W/665/Rev.4, Council for Trade in Goods, 27 March.
WTO (2014j) Food aid – Revision. G/AG/W/125/Add.3/Rev.1, Committee on Agriculture, World
Trade Organization, 16 September.
Yamashita, K. (2008) Implications for Japan of the July 2008 draft agricultural modalities.
International Centre for Trade and Sustainable Development, Geneva.
Yang, M.-H. and D. Blandford (2011) Asian rice policies and WTO commitments on domestic
support under existing and proposed Doha Round provisions. Presented at joint annual meeting
of the Agricultural and Applied Economics Association and the Northeastern Agricultural and
Resource Economics Association, Pittsburgh, Pennsylvania, 24-26 July.
http://ageconsearch.umn.edu/bitstream/103665/2/Yang_and_Blandford.pdf (viewed 15 August
2014)
Zulauf, C. and D. Orden (2014 forthcoming) The U.S. Agricultural Act of 2014: Overview and
analysis. IFPRI Discussion Paper, International Food Policy Research Institute, September.
69
Appendix A.
WTO Tariff Profiles
The following 19 tables reproduce part of the WTO Tariff Profiles (WTO 2014g). Rows for non-
agricultural products have been deleted from Part A of the profiles, as have all of Part B (Exports to
major trading partners and duties faced).
List of Appendix Tables
Appendix Table 1 Argentina ................................................................................................................. 70 Appendix Table 2 Brazil ....................................................................................................................... 71 Appendix Table 3 Canada ..................................................................................................................... 72 Appendix Table 4 China ....................................................................................................................... 73 Appendix Table 5 European Union ...................................................................................................... 74 Appendix Table 6 India ........................................................................................................................ 75 Appendix Table 7 Indonesia ................................................................................................................. 76 Appendix Table 8 Japan ........................................................................................................................ 77 Appendix Table 9 Korea ....................................................................................................................... 78 Appendix Table 10 Mexico .................................................................................................................. 79 Appendix Table 11 Norway .................................................................................................................. 80 Appendix Table 12 Philippines ............................................................................................................. 81 Appendix Table 13 Russia .................................................................................................................... 82 Appendix Table 14 South Africa .......................................................................................................... 83 Appendix Table 15 Switzerland ............................................................................................................ 84 Appendix Table 16 Thailand ................................................................................................................ 85 Appendix Table 17 Turkey ................................................................................................................... 86 Appendix Table 18 United States ......................................................................................................... 87 Appendix Table 19 Viet Nam ............................................................................................................... 88
List of Appendix Figures page 89
Appendix Figure 1. Non-green-box support in the EU, Japan, Russia and the US
Appendix Figure 2. Non-green-box support in Brazil, China, India and Indonesia
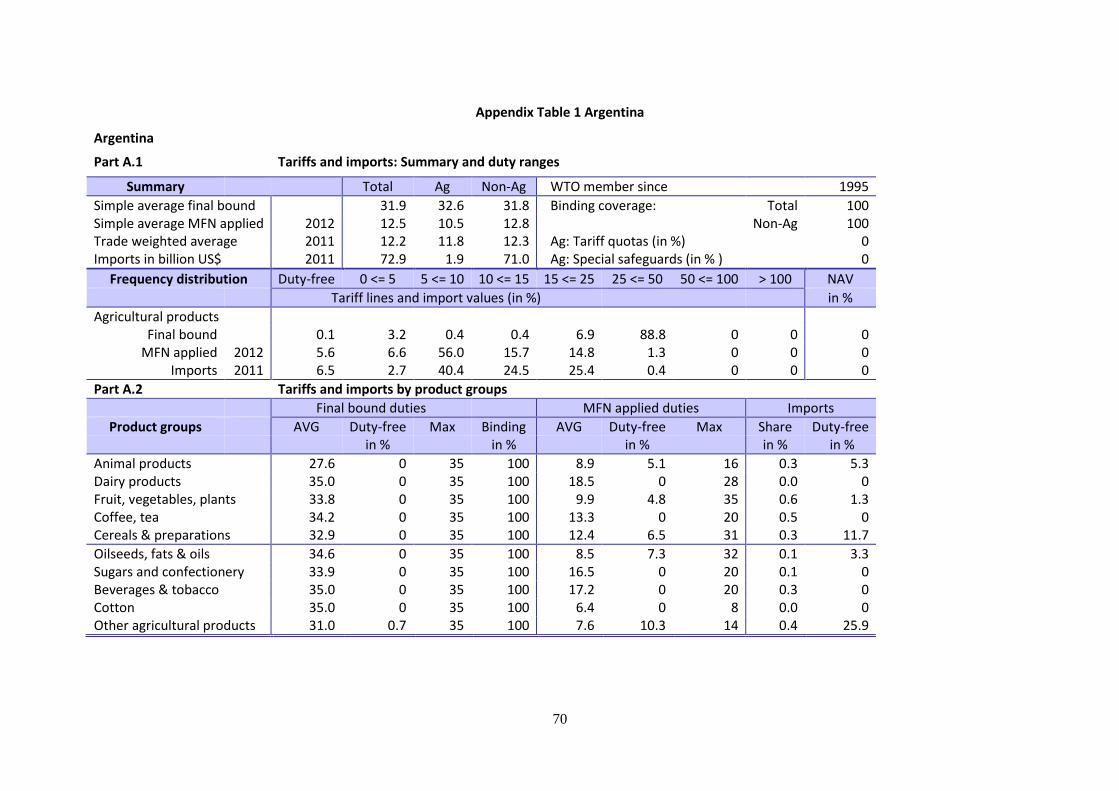
70
Appendix Table 1 Argentina
Argentina
Part A.1 Tariffs and imports: Summary and duty ranges
Summary Total Ag Non-Ag WTO member since 1995
Simple average final bound 31.9 32.6 31.8 Binding coverage: Total 100 Simple average MFN applied 2012 12.5 10.5 12.8 Non-Ag 100 Trade weighted average 2011 12.2 11.8 12.3 Ag: Tariff quotas (in %) 0 Imports in billion US$ 2011 72.9 1.9 71.0 Ag: Special safeguards (in % ) 0
Frequency distribution Duty-free 0 <= 5 5 <= 10 10 <= 15 15 <= 25 25 <= 50 50 <= 100 > 100 NAV
Tariff lines and import values (in %) in %
Agricultural products Final bound 0.1 3.2 0.4 0.4 6.9 88.8 0 0 0
MFN applied 2012 5.6 6.6 56.0 15.7 14.8 1.3 0 0 0 Imports 2011 6.5 2.7 40.4 24.5 25.4 0.4 0 0 0
Part A.2 Tariffs and imports by product groups
Final bound duties MFN applied duties Imports
Product groups AVG Duty-free Max Binding AVG Duty-free Max Share Duty-free in % in % in % in % in %
Animal products 27.6 0 35 100 8.9 5.1 16 0.3 5.3 Dairy products 35.0 0 35 100 18.5 0 28 0.0 0 Fruit, vegetables, plants 33.8 0 35 100 9.9 4.8 35 0.6 1.3 Coffee, tea 34.2 0 35 100 13.3 0 20 0.5 0 Cereals & preparations 32.9 0 35 100 12.4 6.5 31 0.3 11.7
Oilseeds, fats & oils 34.6 0 35 100 8.5 7.3 32 0.1 3.3 Sugars and confectionery 33.9 0 35 100 16.5 0 20 0.1 0 Beverages & tobacco 35.0 0 35 100 17.2 0 20 0.3 0 Cotton 35.0 0 35 100 6.4 0 8 0.0 0 Other agricultural products 31.0 0.7 35 100 7.6 10.3 14 0.4 25.9
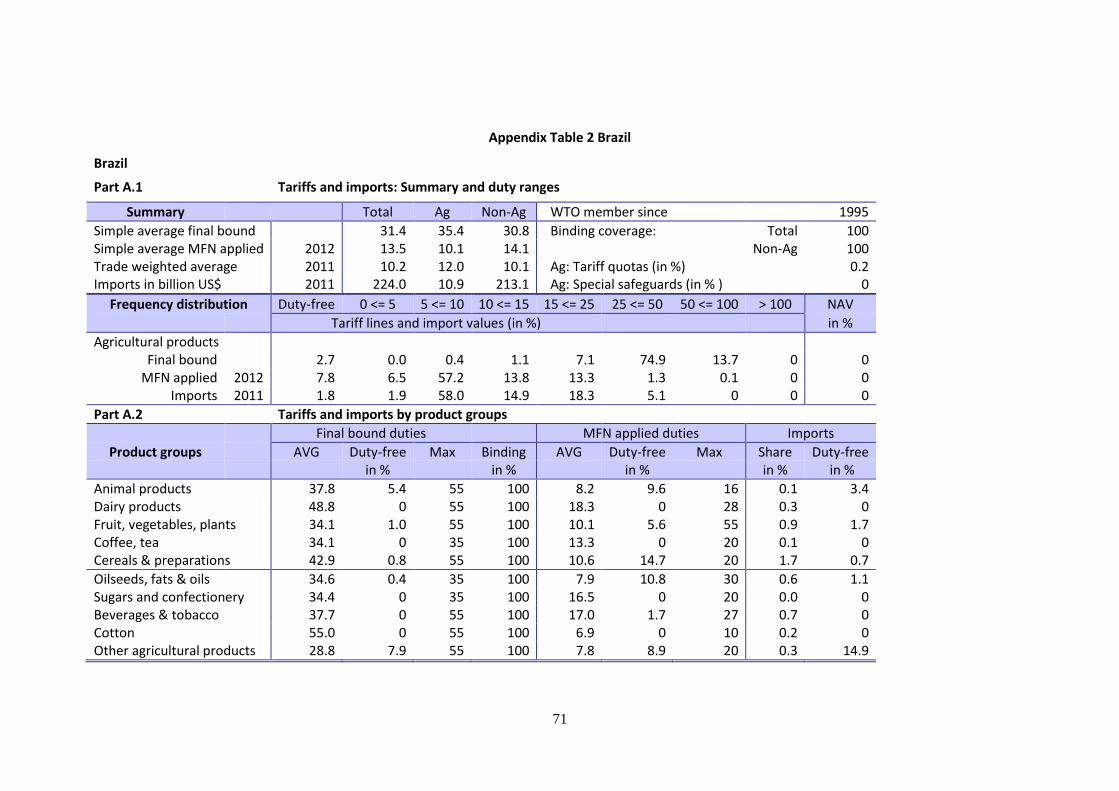
71
Appendix Table 2 Brazil
Brazil
Part A.1 Tariffs and imports: Summary and duty ranges
Summary Total Ag Non-Ag WTO member since 1995
Simple average final bound 31.4 35.4 30.8 Binding coverage: Total 100 Simple average MFN applied 2012 13.5 10.1 14.1 Non-Ag 100 Trade weighted average 2011 10.2 12.0 10.1 Ag: Tariff quotas (in %) 0.2 Imports in billion US$ 2011 224.0 10.9 213.1 Ag: Special safeguards (in % ) 0
Frequency distribution Duty-free 0 <= 5 5 <= 10 10 <= 15 15 <= 25 25 <= 50 50 <= 100 > 100 NAV
Tariff lines and import values (in %) in %
Agricultural products Final bound 2.7 0.0 0.4 1.1 7.1 74.9 13.7 0 0
MFN applied 2012 7.8 6.5 57.2 13.8 13.3 1.3 0.1 0 0 Imports 2011 1.8 1.9 58.0 14.9 18.3 5.1 0 0 0
Part A.2 Tariffs and imports by product groups
Final bound duties MFN applied duties Imports
Product groups AVG Duty-free Max Binding AVG Duty-free Max Share Duty-free in % in % in % in % in %
Animal products 37.8 5.4 55 100 8.2 9.6 16 0.1 3.4 Dairy products 48.8 0 55 100 18.3 0 28 0.3 0 Fruit, vegetables, plants 34.1 1.0 55 100 10.1 5.6 55 0.9 1.7 Coffee, tea 34.1 0 35 100 13.3 0 20 0.1 0 Cereals & preparations 42.9 0.8 55 100 10.6 14.7 20 1.7 0.7
Oilseeds, fats & oils 34.6 0.4 35 100 7.9 10.8 30 0.6 1.1 Sugars and confectionery 34.4 0 35 100 16.5 0 20 0.0 0 Beverages & tobacco 37.7 0 55 100 17.0 1.7 27 0.7 0 Cotton 55.0 0 55 100 6.9 0 10 0.2 0 Other agricultural products 28.8 7.9 55 100 7.8 8.9 20 0.3 14.9
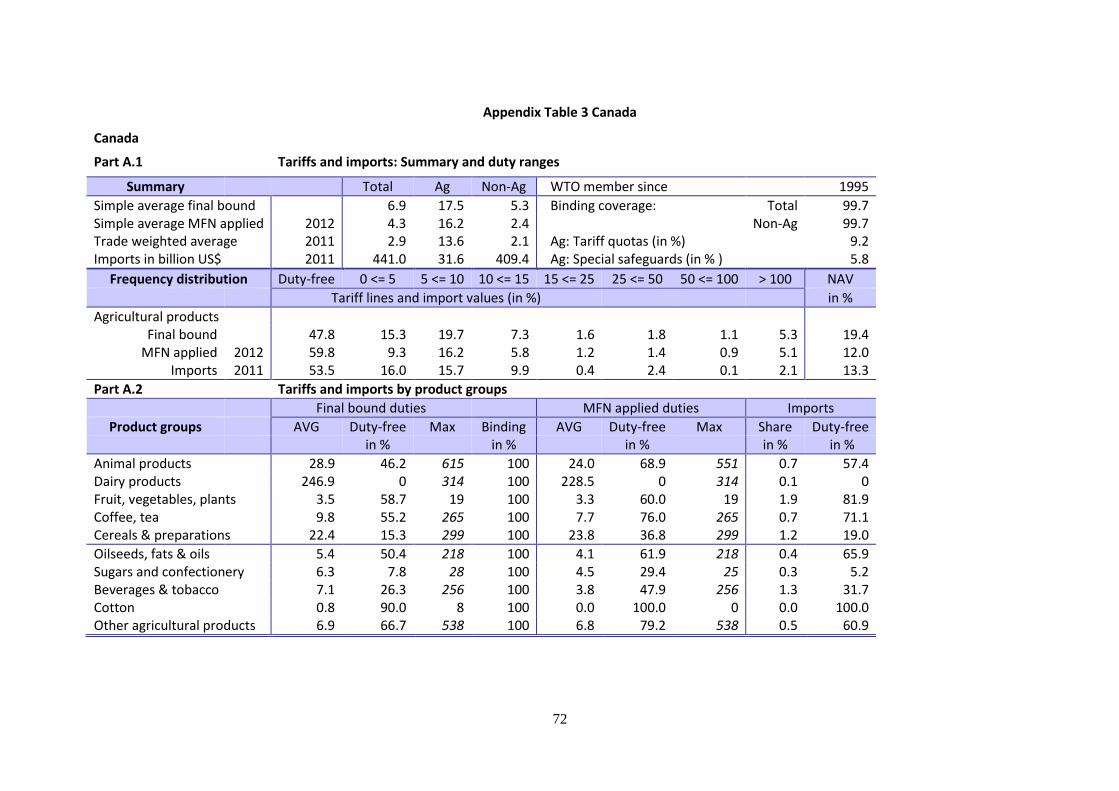
72
Appendix Table 3 Canada
Canada
Part A.1 Tariffs and imports: Summary and duty ranges
Summary Total Ag Non-Ag WTO member since 1995
Simple average final bound 6.9 17.5 5.3 Binding coverage: Total 99.7 Simple average MFN applied 2012 4.3 16.2 2.4 Non-Ag 99.7 Trade weighted average 2011 2.9 13.6 2.1 Ag: Tariff quotas (in %) 9.2 Imports in billion US$ 2011 441.0 31.6 409.4 Ag: Special safeguards (in % ) 5.8
Frequency distribution Duty-free 0 <= 5 5 <= 10 10 <= 15 15 <= 25 25 <= 50 50 <= 100 > 100 NAV
Tariff lines and import values (in %) in %
Agricultural products Final bound 47.8 15.3 19.7 7.3 1.6 1.8 1.1 5.3 19.4
MFN applied 2012 59.8 9.3 16.2 5.8 1.2 1.4 0.9 5.1 12.0 Imports 2011 53.5 16.0 15.7 9.9 0.4 2.4 0.1 2.1 13.3
Part A.2 Tariffs and imports by product groups
Final bound duties MFN applied duties Imports
Product groups AVG Duty-free Max Binding AVG Duty-free Max Share Duty-free in % in % in % in % in %
Animal products 28.9 46.2 615 100 24.0 68.9 551 0.7 57.4 Dairy products 246.9 0 314 100 228.5 0 314 0.1 0 Fruit, vegetables, plants 3.5 58.7 19 100 3.3 60.0 19 1.9 81.9 Coffee, tea 9.8 55.2 265 100 7.7 76.0 265 0.7 71.1 Cereals & preparations 22.4 15.3 299 100 23.8 36.8 299 1.2 19.0
Oilseeds, fats & oils 5.4 50.4 218 100 4.1 61.9 218 0.4 65.9 Sugars and confectionery 6.3 7.8 28 100 4.5 29.4 25 0.3 5.2 Beverages & tobacco 7.1 26.3 256 100 3.8 47.9 256 1.3 31.7 Cotton 0.8 90.0 8 100 0.0 100.0 0 0.0 100.0 Other agricultural products 6.9 66.7 538 100 6.8 79.2 538 0.5 60.9
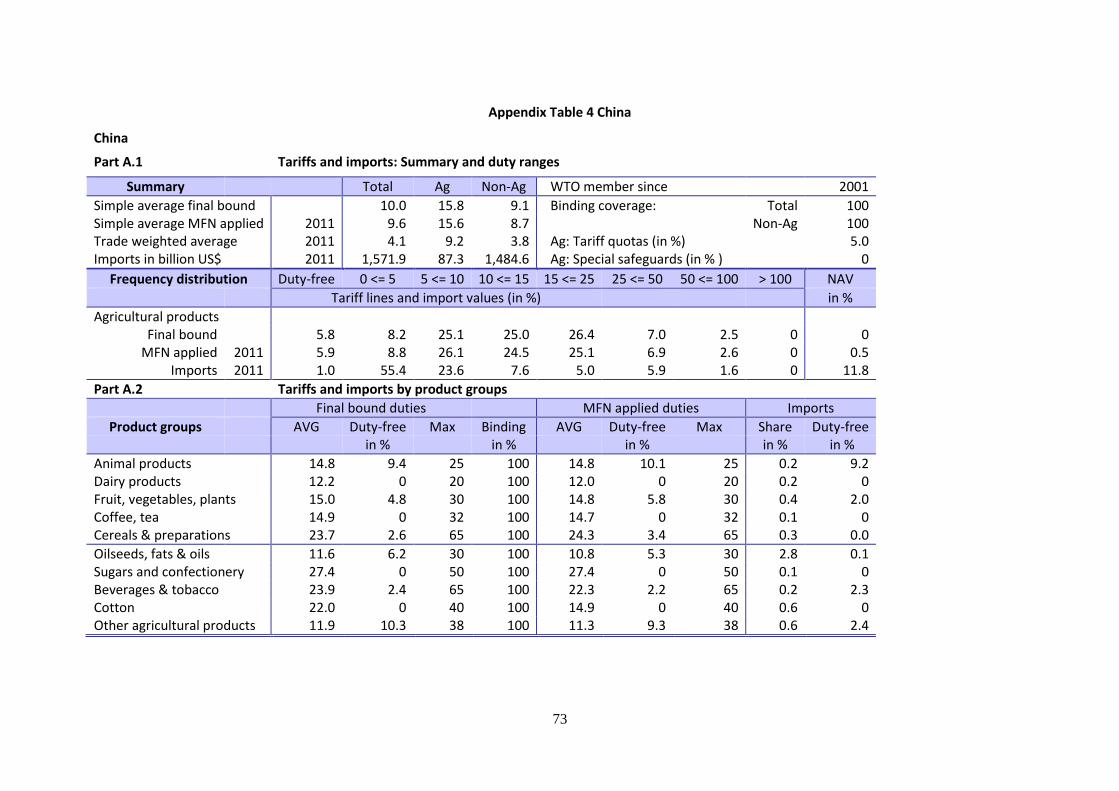
73
Appendix Table 4 China
China
Part A.1 Tariffs and imports: Summary and duty ranges
Summary Total Ag Non-Ag WTO member since 2001
Simple average final bound 10.0 15.8 9.1 Binding coverage: Total 100 Simple average MFN applied 2011 9.6 15.6 8.7 Non-Ag 100 Trade weighted average 2011 4.1 9.2 3.8 Ag: Tariff quotas (in %) 5.0 Imports in billion US$ 2011 1,571.9 87.3 1,484.6 Ag: Special safeguards (in % ) 0
Frequency distribution Duty-free 0 <= 5 5 <= 10 10 <= 15 15 <= 25 25 <= 50 50 <= 100 > 100 NAV
Tariff lines and import values (in %) in %
Agricultural products Final bound 5.8 8.2 25.1 25.0 26.4 7.0 2.5 0 0
MFN applied 2011 5.9 8.8 26.1 24.5 25.1 6.9 2.6 0 0.5 Imports 2011 1.0 55.4 23.6 7.6 5.0 5.9 1.6 0 11.8
Part A.2 Tariffs and imports by product groups
Final bound duties MFN applied duties Imports
Product groups AVG Duty-free Max Binding AVG Duty-free Max Share Duty-free in % in % in % in % in %
Animal products 14.8 9.4 25 100 14.8 10.1 25 0.2 9.2 Dairy products 12.2 0 20 100 12.0 0 20 0.2 0 Fruit, vegetables, plants 15.0 4.8 30 100 14.8 5.8 30 0.4 2.0 Coffee, tea 14.9 0 32 100 14.7 0 32 0.1 0 Cereals & preparations 23.7 2.6 65 100 24.3 3.4 65 0.3 0.0
Oilseeds, fats & oils 11.6 6.2 30 100 10.8 5.3 30 2.8 0.1 Sugars and confectionery 27.4 0 50 100 27.4 0 50 0.1 0 Beverages & tobacco 23.9 2.4 65 100 22.3 2.2 65 0.2 2.3 Cotton 22.0 0 40 100 14.9 0 40 0.6 0 Other agricultural products 11.9 10.3 38 100 11.3 9.3 38 0.6 2.4
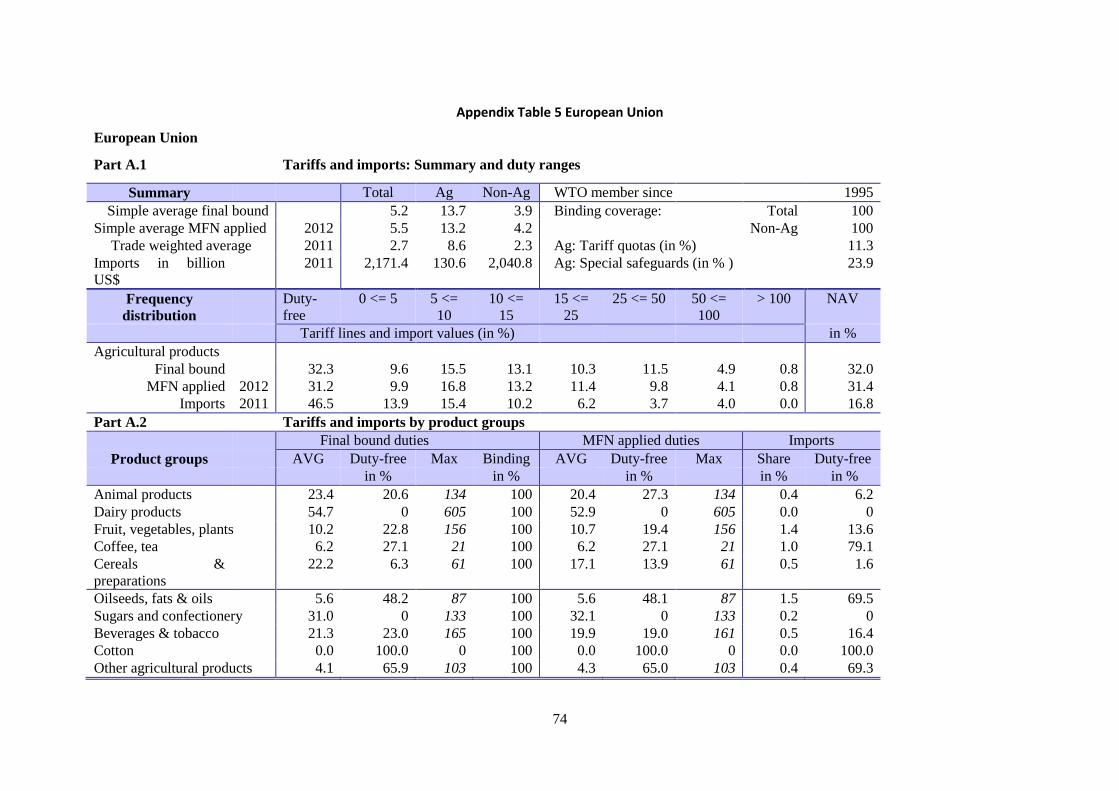
74
Appendix Table 5 European Union
European Union
Part A.1 Tariffs and imports: Summary and duty ranges
Summary Total Ag Non-Ag WTO member since 1995
Simple average final bound 5.2 13.7 3.9 Binding coverage: Total 100
Simple average MFN applied 2012 5.5 13.2 4.2 Non-Ag 100
Trade weighted average 2011 2.7 8.6 2.3 Ag: Tariff quotas (in %) 11.3
Imports in billion
US$
2011 2,171.4 130.6 2,040.8 Ag: Special safeguards (in % ) 23.9
Frequency
distribution
Duty-
free
0 <= 5 5 <=
10
10 <=
15
15 <=
25
25 <= 50 50 <=
100
> 100 NAV
Tariff lines and import values (in %) in %
Agricultural products
Final bound 32.3 9.6 15.5 13.1 10.3 11.5 4.9 0.8 32.0
MFN applied 2012 31.2 9.9 16.8 13.2 11.4 9.8 4.1 0.8 31.4
Imports 2011 46.5 13.9 15.4 10.2 6.2 3.7 4.0 0.0 16.8
Part A.2 Tariffs and imports by product groups
Final bound duties MFN applied duties Imports
Product groups AVG Duty-free Max Binding AVG Duty-free Max Share Duty-free
in % in % in % in % in %
Animal products 23.4 20.6 134 100 20.4 27.3 134 0.4 6.2
Dairy products 54.7 0 605 100 52.9 0 605 0.0 0
Fruit, vegetables, plants 10.2 22.8 156 100 10.7 19.4 156 1.4 13.6
Coffee, tea 6.2 27.1 21 100 6.2 27.1 21 1.0 79.1
Cereals &
preparations
22.2 6.3 61 100 17.1 13.9 61 0.5 1.6
Oilseeds, fats & oils 5.6 48.2 87 100 5.6 48.1 87 1.5 69.5
Sugars and confectionery 31.0 0 133 100 32.1 0 133 0.2 0
Beverages & tobacco 21.3 23.0 165 100 19.9 19.0 161 0.5 16.4
Cotton 0.0 100.0 0 100 0.0 100.0 0 0.0 100.0
Other agricultural products 4.1 65.9 103 100 4.3 65.0 103 0.4 69.3
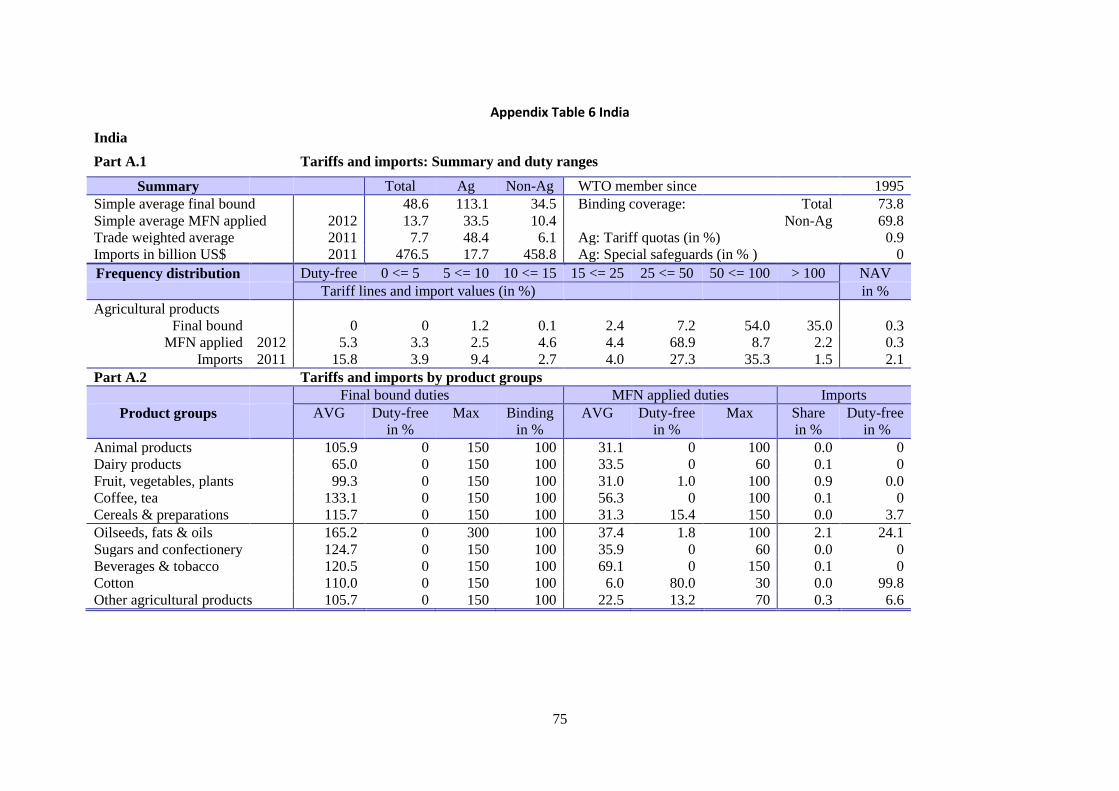
75
Appendix Table 6 India
India
Part A.1 Tariffs and imports: Summary and duty ranges
Summary Total Ag Non-Ag WTO member since 1995
Simple average final bound 48.6 113.1 34.5 Binding coverage: Total 73.8
Simple average MFN applied 2012 13.7 33.5 10.4 Non-Ag 69.8
Trade weighted average 2011 7.7 48.4 6.1 Ag: Tariff quotas (in %) 0.9
Imports in billion US$ 2011 476.5 17.7 458.8 Ag: Special safeguards (in % ) 0
Frequency distribution Duty-free 0 <= 5 5 <= 10 10 <= 15 15 <= 25 25 <= 50 50 <= 100 > 100 NAV
Tariff lines and import values (in %) in %
Agricultural products
Final bound 0 0 1.2 0.1 2.4 7.2 54.0 35.0 0.3
MFN applied 2012 5.3 3.3 2.5 4.6 4.4 68.9 8.7 2.2 0.3
Imports 2011 15.8 3.9 9.4 2.7 4.0 27.3 35.3 1.5 2.1
Part A.2 Tariffs and imports by product groups
Final bound duties MFN applied duties Imports
Product groups AVG Duty-free Max Binding AVG Duty-free Max Share Duty-free
in % in % in % in % in %
Animal products 105.9 0 150 100 31.1 0 100 0.0 0
Dairy products 65.0 0 150 100 33.5 0 60 0.1 0
Fruit, vegetables, plants 99.3 0 150 100 31.0 1.0 100 0.9 0.0
Coffee, tea 133.1 0 150 100 56.3 0 100 0.1 0
Cereals & preparations 115.7 0 150 100 31.3 15.4 150 0.0 3.7
Oilseeds, fats & oils 165.2 0 300 100 37.4 1.8 100 2.1 24.1
Sugars and confectionery 124.7 0 150 100 35.9 0 60 0.0 0
Beverages & tobacco 120.5 0 150 100 69.1 0 150 0.1 0
Cotton 110.0 0 150 100 6.0 80.0 30 0.0 99.8
Other agricultural products 105.7 0 150 100 22.5 13.2 70 0.3 6.6
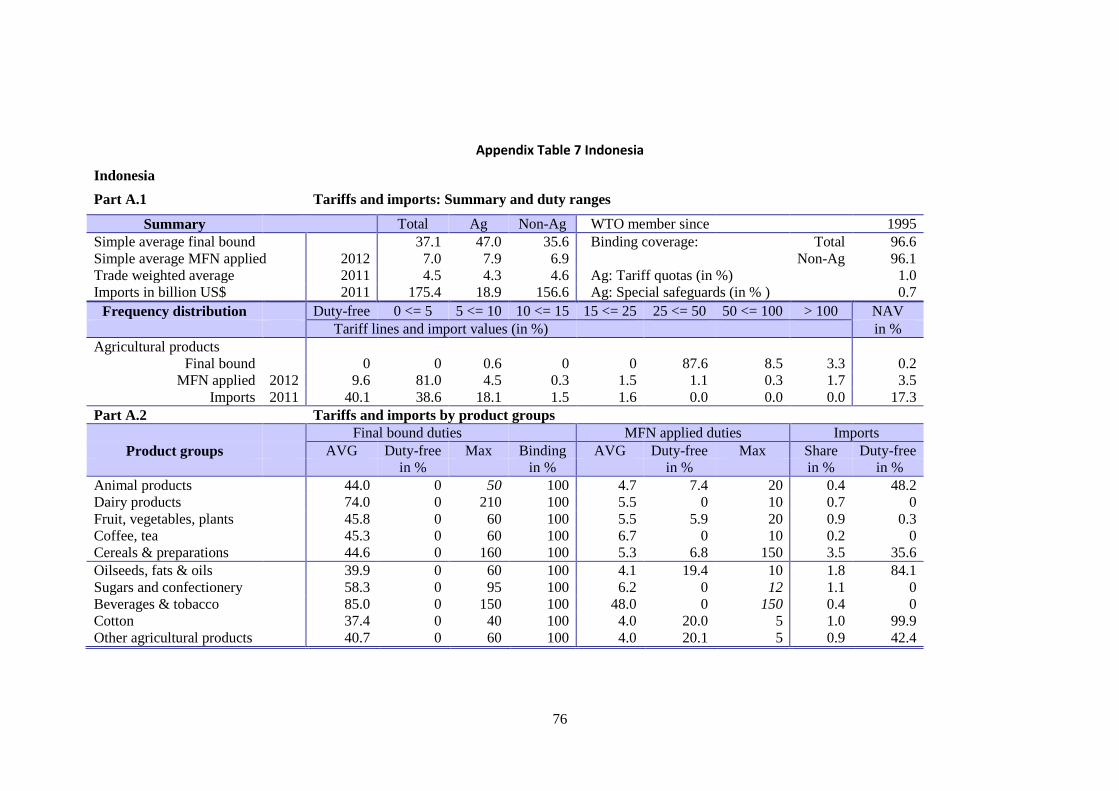
76
Appendix Table 7 Indonesia
Indonesia
Part A.1 Tariffs and imports: Summary and duty ranges
Summary Total Ag Non-Ag WTO member since 1995
Simple average final bound 37.1 47.0 35.6 Binding coverage: Total 96.6
Simple average MFN applied 2012 7.0 7.9 6.9 Non-Ag 96.1
Trade weighted average 2011 4.5 4.3 4.6 Ag: Tariff quotas (in %) 1.0
Imports in billion US$ 2011 175.4 18.9 156.6 Ag: Special safeguards (in % ) 0.7
Frequency distribution Duty-free 0 <= 5 5 <= 10 10 <= 15 15 <= 25 25 <= 50 50 <= 100 > 100 NAV
Tariff lines and import values (in %) in %
Agricultural products
Final bound 0 0 0.6 0 0 87.6 8.5 3.3 0.2
MFN applied 2012 9.6 81.0 4.5 0.3 1.5 1.1 0.3 1.7 3.5
Imports 2011 40.1 38.6 18.1 1.5 1.6 0.0 0.0 0.0 17.3
Part A.2 Tariffs and imports by product groups
Final bound duties MFN applied duties Imports
Product groups AVG Duty-free Max Binding AVG Duty-free Max Share Duty-free
in % in % in % in % in %
Animal products 44.0 0 50 100 4.7 7.4 20 0.4 48.2
Dairy products 74.0 0 210 100 5.5 0 10 0.7 0
Fruit, vegetables, plants 45.8 0 60 100 5.5 5.9 20 0.9 0.3
Coffee, tea 45.3 0 60 100 6.7 0 10 0.2 0
Cereals & preparations 44.6 0 160 100 5.3 6.8 150 3.5 35.6
Oilseeds, fats & oils 39.9 0 60 100 4.1 19.4 10 1.8 84.1
Sugars and confectionery 58.3 0 95 100 6.2 0 12 1.1 0
Beverages & tobacco 85.0 0 150 100 48.0 0 150 0.4 0
Cotton 37.4 0 40 100 4.0 20.0 5 1.0 99.9
Other agricultural products 40.7 0 60 100 4.0 20.1 5 0.9 42.4
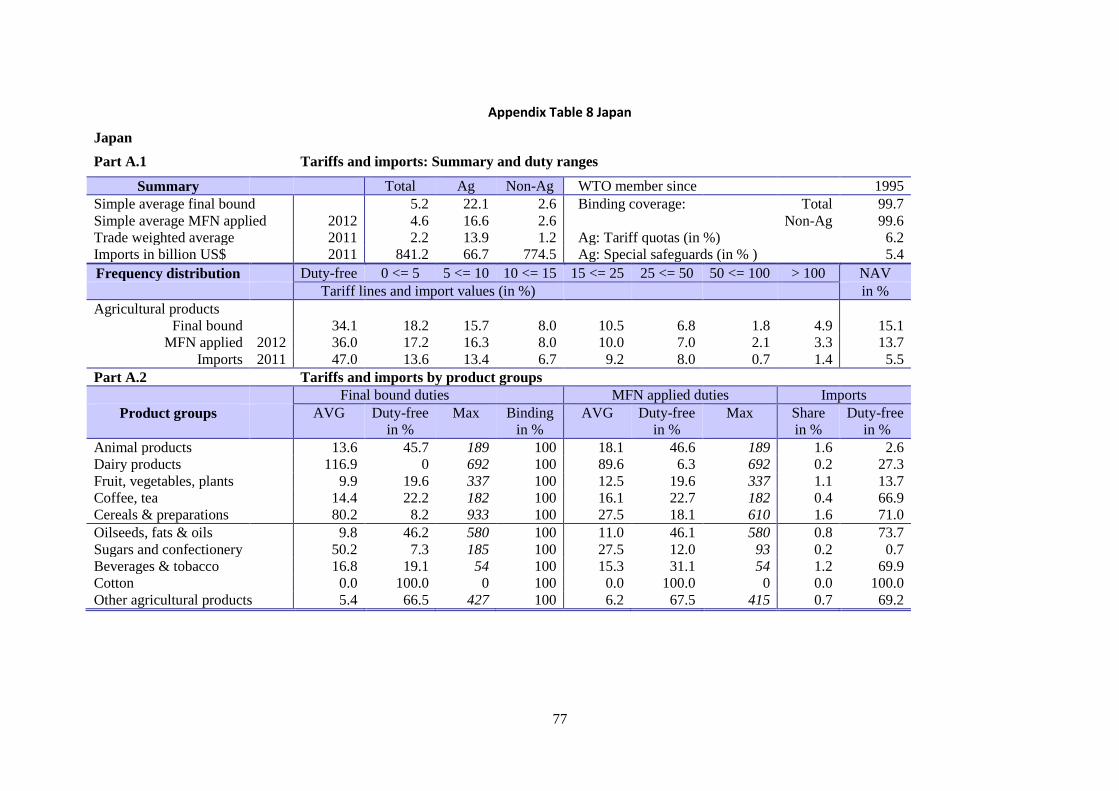
77
Appendix Table 8 Japan
Japan
Part A.1 Tariffs and imports: Summary and duty ranges
Summary Total Ag Non-Ag WTO member since 1995
Simple average final bound 5.2 22.1 2.6 Binding coverage: Total 99.7
Simple average MFN applied 2012 4.6 16.6 2.6 Non-Ag 99.6
Trade weighted average 2011 2.2 13.9 1.2 Ag: Tariff quotas (in %) 6.2
Imports in billion US$ 2011 841.2 66.7 774.5 Ag: Special safeguards (in % ) 5.4
Frequency distribution Duty-free 0 <= 5 5 <= 10 10 <= 15 15 <= 25 25 <= 50 50 <= 100 > 100 NAV
Tariff lines and import values (in %) in %
Agricultural products
Final bound 34.1 18.2 15.7 8.0 10.5 6.8 1.8 4.9 15.1
MFN applied 2012 36.0 17.2 16.3 8.0 10.0 7.0 2.1 3.3 13.7
Imports 2011 47.0 13.6 13.4 6.7 9.2 8.0 0.7 1.4 5.5
Part A.2 Tariffs and imports by product groups
Final bound duties MFN applied duties Imports
Product groups AVG Duty-free Max Binding AVG Duty-free Max Share Duty-free
in % in % in % in % in %
Animal products 13.6 45.7 189 100 18.1 46.6 189 1.6 2.6
Dairy products 116.9 0 692 100 89.6 6.3 692 0.2 27.3
Fruit, vegetables, plants 9.9 19.6 337 100 12.5 19.6 337 1.1 13.7
Coffee, tea 14.4 22.2 182 100 16.1 22.7 182 0.4 66.9
Cereals & preparations 80.2 8.2 933 100 27.5 18.1 610 1.6 71.0
Oilseeds, fats & oils 9.8 46.2 580 100 11.0 46.1 580 0.8 73.7
Sugars and confectionery 50.2 7.3 185 100 27.5 12.0 93 0.2 0.7
Beverages & tobacco 16.8 19.1 54 100 15.3 31.1 54 1.2 69.9
Cotton 0.0 100.0 0 100 0.0 100.0 0 0.0 100.0
Other agricultural products 5.4 66.5 427 100 6.2 67.5 415 0.7 69.2

78
Appendix Table 9 Korea
Korea
Part A.1 Tariffs and imports: Summary and duty ranges
Summary Total Ag Non-Ag WTO member since 1995
Simple average final bound 16.6 56.1 10.2 Binding coverage: Total 94.6
Simple average MFN applied 2012 13.3 52.7 6.8 Non-Ag 93.8
Trade weighted average 2011 6.8 75.5 3.5 Ag: Tariff quotas (in %) 14.0
Imports in billion US$ 2011 518.4 24.4 494.0 Ag: Special safeguards (in % ) 6.3
Frequency distribution Duty-free 0 <= 5 5 <= 10 10 <= 15 15 <= 25 25 <= 50 50 <= 100 > 100 NAV
Tariff lines and import values (in %) in %
Agricultural products
Final bound 2.2 5.7 9.1 8.7 23.1 31.9 10.1 8.1 5.2
MFN applied 2012 5.6 18.4 22.3 1.1 13.0 28.5 2.0 9.0 3.2
Imports 2011 10.3 24.8 16.6 0.8 11.9 19.6 1.1 14.8 1.8
Part A.2 Tariffs and imports by product groups
Final bound duties MFN applied duties Imports
Product groups AVG Duty-free Max Binding AVG Duty-free Max Share Duty-free
in % in % in % in % in %
Animal products 26.1 0.4 89 100 21.7 3.0 89 0.7 0.4
Dairy products 69.8 0 176 100 66.0 0 176 0.1 0
Fruit, vegetables, plants 63.6 0 887 100 58.7 0.2 887 0.5 0.0
Coffee, tea 74.1 0 514 100 53.9 0 514 0.2 0
Cereals & preparations 161.1 0 800 100 153.6 0.2 800 1.2 10.0
Oilseeds, fats & oils 44.1 2.6 630 100 40.7 3.6 630 0.7 2.2
Sugars and confectionery 32.2 0 243 100 15.7 0 243 0.3 0
Beverages & tobacco 42.5 0 270 100 32.2 0 270 0.2 0
Cotton 2.0 0 2 100 0.0 100.0 0 0.2 100.0
Other agricultural products 21.1 9.4 754 100 20.4 21.6 754 0.5 33.2

79
Appendix Table 10 Mexico
Mexico
Part A.1 Tariffs and imports: Summary and duty ranges
Summary Total Ag Non-Ag WTO member since 1995
Simple average final bound 36.1 44.5 34.8 Binding coverage: Total 100
Simple average MFN applied 2012 7.8 21.2 5.8 Non-Ag 100
Trade weighted average 2011 5.4 27.6 3.6 Ag: Tariff quotas (in %) 6.9
Imports in billion US$ 2011 343.5 26.4 317.1 Ag: Special safeguards (in % ) 33.2
Frequency distribution Duty-free 0 <= 5 5 <= 10 10 <= 15 15 <= 25 25 <= 50 50 <= 100 > 100 NAV
Tariff lines and import values (in %) in %
Agricultural products
Final bound 0.4 0.2 3.9 0 12.4 75.4 1.9 5.8 7.0
MFN applied 2012 17.9 2.3 26.3 10.1 32.7 5.2 1.3 4.0 5.1
Imports 2011 41.4 3.3 9.7 5.0 21.9 5.8 4.5 8.3 7.1
Part A.2 Tariffs and imports by product groups
Final bound duties MFN applied duties Imports
Product groups AVG Duty-free Max Binding AVG Duty-free Max Share Duty-free
in % in % in % in % in %
Animal products 61.7 0 254 100 41.2 5.2 254 1.1 2.3
Dairy products 63.0 0 156 100 35.2 2.5 125 0.5 8.9
Fruit, vegetables, plants 37.4 0 245 100 17.6 5.8 245 0.6 5.0
Coffee, tea 64.6 0 156 100 35.6 4.2 140 0.2 4.6
Cereals & preparations 46.3 0 194 100 19.6 8.1 158 2.2 67.6
Oilseeds, fats & oils 44.1 1.9 254 100 15.0 35.1 254 1.6 60.8
Sugars and confectionery 119.4 0 210 100 56.0 0 210 0.3 0
Beverages & tobacco 42.6 0 68 100 27.2 0 67 0.3 0
Cotton 39.4 0 45 100 0.0 100.0 0 0.2 100.0
Other agricultural products 28.1 1.0 45 100 6.0 51.6 36 0.6 60.3
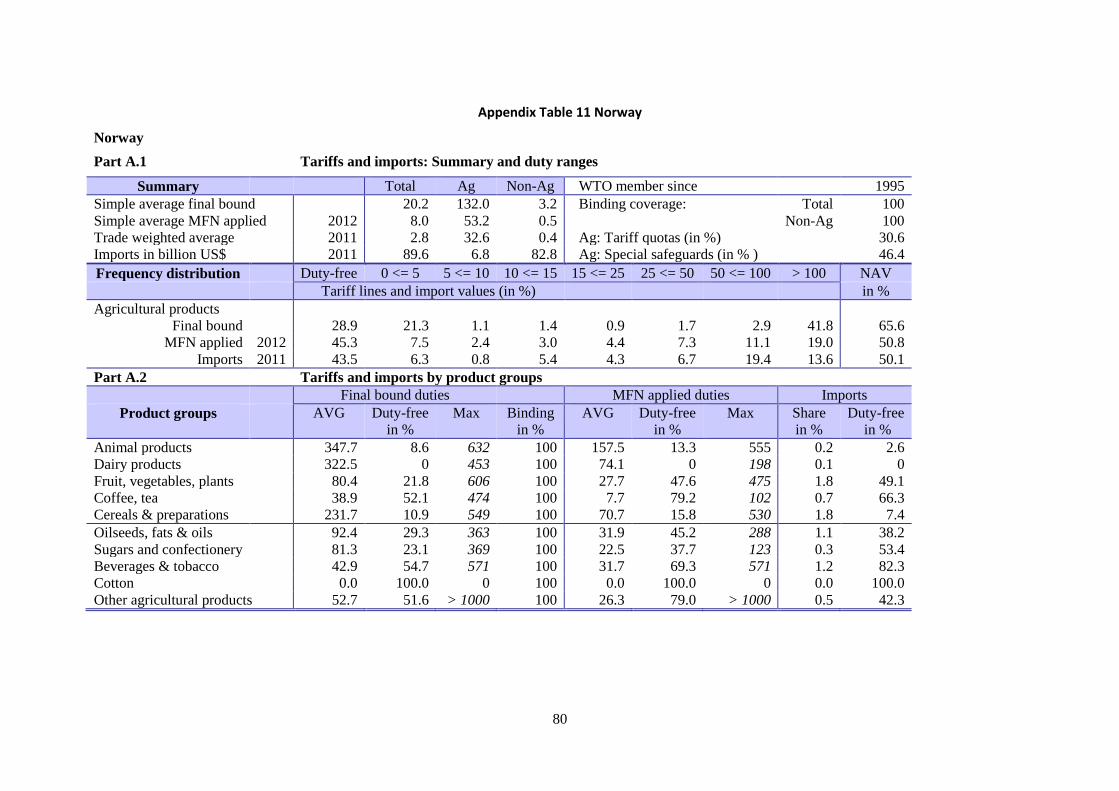
80
Appendix Table 11 Norway
Norway
Part A.1 Tariffs and imports: Summary and duty ranges
Summary Total Ag Non-Ag WTO member since 1995
Simple average final bound 20.2 132.0 3.2 Binding coverage: Total 100
Simple average MFN applied 2012 8.0 53.2 0.5 Non-Ag 100
Trade weighted average 2011 2.8 32.6 0.4 Ag: Tariff quotas (in %) 30.6
Imports in billion US$ 2011 89.6 6.8 82.8 Ag: Special safeguards (in % ) 46.4
Frequency distribution Duty-free 0 <= 5 5 <= 10 10 <= 15 15 <= 25 25 <= 50 50 <= 100 > 100 NAV
Tariff lines and import values (in %) in %
Agricultural products
Final bound 28.9 21.3 1.1 1.4 0.9 1.7 2.9 41.8 65.6
MFN applied 2012 45.3 7.5 2.4 3.0 4.4 7.3 11.1 19.0 50.8
Imports 2011 43.5 6.3 0.8 5.4 4.3 6.7 19.4 13.6 50.1
Part A.2 Tariffs and imports by product groups
Final bound duties MFN applied duties Imports
Product groups AVG Duty-free Max Binding AVG Duty-free Max Share Duty-free
in % in % in % in % in %
Animal products 347.7 8.6 632 100 157.5 13.3 555 0.2 2.6
Dairy products 322.5 0 453 100 74.1 0 198 0.1 0
Fruit, vegetables, plants 80.4 21.8 606 100 27.7 47.6 475 1.8 49.1
Coffee, tea 38.9 52.1 474 100 7.7 79.2 102 0.7 66.3
Cereals & preparations 231.7 10.9 549 100 70.7 15.8 530 1.8 7.4
Oilseeds, fats & oils 92.4 29.3 363 100 31.9 45.2 288 1.1 38.2
Sugars and confectionery 81.3 23.1 369 100 22.5 37.7 123 0.3 53.4
Beverages & tobacco 42.9 54.7 571 100 31.7 69.3 571 1.2 82.3
Cotton 0.0 100.0 0 100 0.0 100.0 0 0.0 100.0
Other agricultural products 52.7 51.6 > 1000 100 26.3 79.0 > 1000 0.5 42.3
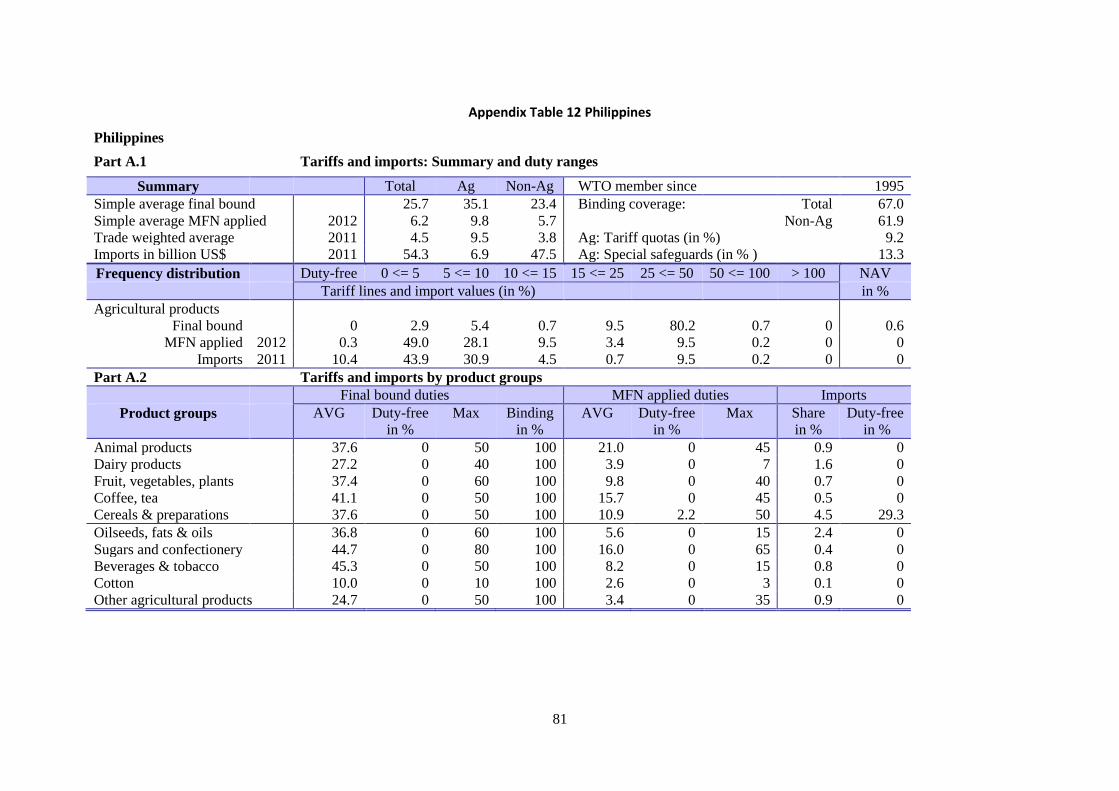
81
Appendix Table 12 Philippines
Philippines
Part A.1 Tariffs and imports: Summary and duty ranges
Summary Total Ag Non-Ag WTO member since 1995
Simple average final bound 25.7 35.1 23.4 Binding coverage: Total 67.0
Simple average MFN applied 2012 6.2 9.8 5.7 Non-Ag 61.9
Trade weighted average 2011 4.5 9.5 3.8 Ag: Tariff quotas (in %) 9.2
Imports in billion US$ 2011 54.3 6.9 47.5 Ag: Special safeguards (in % ) 13.3
Frequency distribution Duty-free 0 <= 5 5 <= 10 10 <= 15 15 <= 25 25 <= 50 50 <= 100 > 100 NAV
Tariff lines and import values (in %) in %
Agricultural products
Final bound 0 2.9 5.4 0.7 9.5 80.2 0.7 0 0.6
MFN applied 2012 0.3 49.0 28.1 9.5 3.4 9.5 0.2 0 0
Imports 2011 10.4 43.9 30.9 4.5 0.7 9.5 0.2 0 0
Part A.2 Tariffs and imports by product groups
Final bound duties MFN applied duties Imports
Product groups AVG Duty-free Max Binding AVG Duty-free Max Share Duty-free
in % in % in % in % in %
Animal products 37.6 0 50 100 21.0 0 45 0.9 0
Dairy products 27.2 0 40 100 3.9 0 7 1.6 0
Fruit, vegetables, plants 37.4 0 60 100 9.8 0 40 0.7 0
Coffee, tea 41.1 0 50 100 15.7 0 45 0.5 0
Cereals & preparations 37.6 0 50 100 10.9 2.2 50 4.5 29.3
Oilseeds, fats & oils 36.8 0 60 100 5.6 0 15 2.4 0
Sugars and confectionery 44.7 0 80 100 16.0 0 65 0.4 0
Beverages & tobacco 45.3 0 50 100 8.2 0 15 0.8 0
Cotton 10.0 0 10 100 2.6 0 3 0.1 0
Other agricultural products 24.7 0 50 100 3.4 0 35 0.9 0
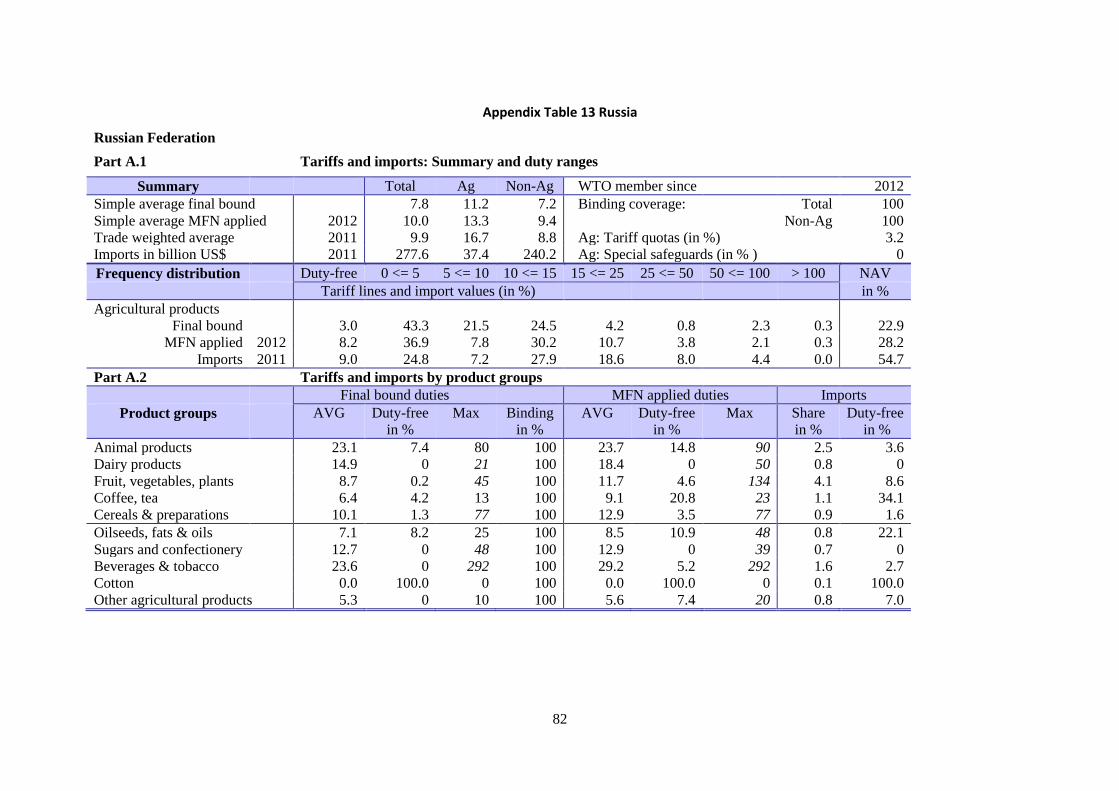
82
Appendix Table 13 Russia
Russian Federation
Part A.1 Tariffs and imports: Summary and duty ranges
Summary Total Ag Non-Ag WTO member since 2012
Simple average final bound 7.8 11.2 7.2 Binding coverage: Total 100
Simple average MFN applied 2012 10.0 13.3 9.4 Non-Ag 100
Trade weighted average 2011 9.9 16.7 8.8 Ag: Tariff quotas (in %) 3.2
Imports in billion US$ 2011 277.6 37.4 240.2 Ag: Special safeguards (in % ) 0
Frequency distribution Duty-free 0 <= 5 5 <= 10 10 <= 15 15 <= 25 25 <= 50 50 <= 100 > 100 NAV
Tariff lines and import values (in %) in %
Agricultural products
Final bound 3.0 43.3 21.5 24.5 4.2 0.8 2.3 0.3 22.9
MFN applied 2012 8.2 36.9 7.8 30.2 10.7 3.8 2.1 0.3 28.2
Imports 2011 9.0 24.8 7.2 27.9 18.6 8.0 4.4 0.0 54.7
Part A.2 Tariffs and imports by product groups
Final bound duties MFN applied duties Imports
Product groups AVG Duty-free Max Binding AVG Duty-free Max Share Duty-free
in % in % in % in % in %
Animal products 23.1 7.4 80 100 23.7 14.8 90 2.5 3.6
Dairy products 14.9 0 21 100 18.4 0 50 0.8 0
Fruit, vegetables, plants 8.7 0.2 45 100 11.7 4.6 134 4.1 8.6
Coffee, tea 6.4 4.2 13 100 9.1 20.8 23 1.1 34.1
Cereals & preparations 10.1 1.3 77 100 12.9 3.5 77 0.9 1.6
Oilseeds, fats & oils 7.1 8.2 25 100 8.5 10.9 48 0.8 22.1
Sugars and confectionery 12.7 0 48 100 12.9 0 39 0.7 0
Beverages & tobacco 23.6 0 292 100 29.2 5.2 292 1.6 2.7
Cotton 0.0 100.0 0 100 0.0 100.0 0 0.1 100.0
Other agricultural products 5.3 0 10 100 5.6 7.4 20 0.8 7.0
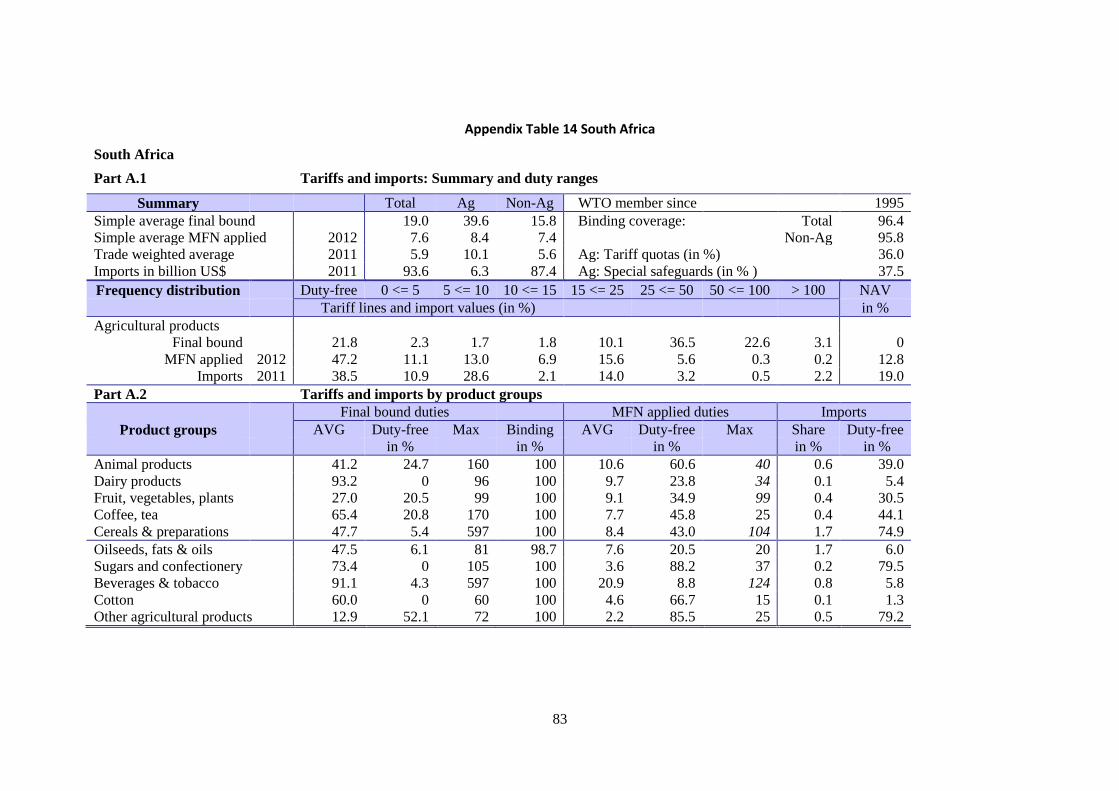
83
Appendix Table 14 South Africa
South Africa
Part A.1 Tariffs and imports: Summary and duty ranges
Summary Total Ag Non-Ag WTO member since 1995
Simple average final bound 19.0 39.6 15.8 Binding coverage: Total 96.4
Simple average MFN applied 2012 7.6 8.4 7.4 Non-Ag 95.8
Trade weighted average 2011 5.9 10.1 5.6 Ag: Tariff quotas (in %) 36.0
Imports in billion US$ 2011 93.6 6.3 87.4 Ag: Special safeguards (in % ) 37.5
Frequency distribution Duty-free 0 <= 5 5 <= 10 10 <= 15 15 <= 25 25 <= 50 50 <= 100 > 100 NAV
Tariff lines and import values (in %) in %
Agricultural products
Final bound 21.8 2.3 1.7 1.8 10.1 36.5 22.6 3.1 0
MFN applied 2012 47.2 11.1 13.0 6.9 15.6 5.6 0.3 0.2 12.8
Imports 2011 38.5 10.9 28.6 2.1 14.0 3.2 0.5 2.2 19.0
Part A.2 Tariffs and imports by product groups
Final bound duties MFN applied duties Imports
Product groups AVG Duty-free Max Binding AVG Duty-free Max Share Duty-free
in % in % in % in % in %
Animal products 41.2 24.7 160 100 10.6 60.6 40 0.6 39.0
Dairy products 93.2 0 96 100 9.7 23.8 34 0.1 5.4
Fruit, vegetables, plants 27.0 20.5 99 100 9.1 34.9 99 0.4 30.5
Coffee, tea 65.4 20.8 170 100 7.7 45.8 25 0.4 44.1
Cereals & preparations 47.7 5.4 597 100 8.4 43.0 104 1.7 74.9
Oilseeds, fats & oils 47.5 6.1 81 98.7 7.6 20.5 20 1.7 6.0
Sugars and confectionery 73.4 0 105 100 3.6 88.2 37 0.2 79.5
Beverages & tobacco 91.1 4.3 597 100 20.9 8.8 124 0.8 5.8
Cotton 60.0 0 60 100 4.6 66.7 15 0.1 1.3
Other agricultural products 12.9 52.1 72 100 2.2 85.5 25 0.5 79.2
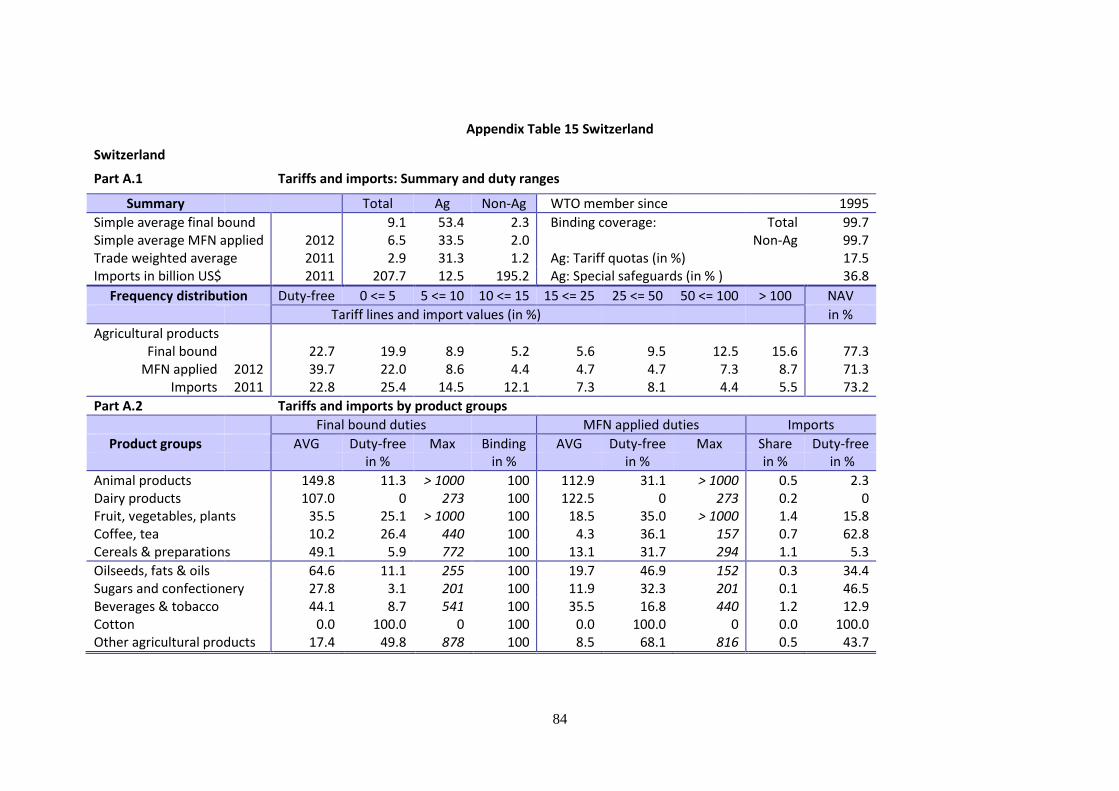
84
Appendix Table 15 Switzerland
Switzerland
Part A.1 Tariffs and imports: Summary and duty ranges
Summary Total Ag Non-Ag WTO member since 1995
Simple average final bound 9.1 53.4 2.3 Binding coverage: Total 99.7 Simple average MFN applied 2012 6.5 33.5 2.0 Non-Ag 99.7 Trade weighted average 2011 2.9 31.3 1.2 Ag: Tariff quotas (in %) 17.5 Imports in billion US$ 2011 207.7 12.5 195.2 Ag: Special safeguards (in % ) 36.8
Frequency distribution Duty-free 0 <= 5 5 <= 10 10 <= 15 15 <= 25 25 <= 50 50 <= 100 > 100 NAV
Tariff lines and import values (in %) in %
Agricultural products Final bound 22.7 19.9 8.9 5.2 5.6 9.5 12.5 15.6 77.3
MFN applied 2012 39.7 22.0 8.6 4.4 4.7 4.7 7.3 8.7 71.3 Imports 2011 22.8 25.4 14.5 12.1 7.3 8.1 4.4 5.5 73.2
Part A.2 Tariffs and imports by product groups
Final bound duties MFN applied duties Imports
Product groups AVG Duty-free Max Binding AVG Duty-free Max Share Duty-free in % in % in % in % in %
Animal products 149.8 11.3 > 1000 100 112.9 31.1 > 1000 0.5 2.3 Dairy products 107.0 0 273 100 122.5 0 273 0.2 0 Fruit, vegetables, plants 35.5 25.1 > 1000 100 18.5 35.0 > 1000 1.4 15.8 Coffee, tea 10.2 26.4 440 100 4.3 36.1 157 0.7 62.8 Cereals & preparations 49.1 5.9 772 100 13.1 31.7 294 1.1 5.3
Oilseeds, fats & oils 64.6 11.1 255 100 19.7 46.9 152 0.3 34.4 Sugars and confectionery 27.8 3.1 201 100 11.9 32.3 201 0.1 46.5 Beverages & tobacco 44.1 8.7 541 100 35.5 16.8 440 1.2 12.9 Cotton 0.0 100.0 0 100 0.0 100.0 0 0.0 100.0 Other agricultural products 17.4 49.8 878 100 8.5 68.1 816 0.5 43.7
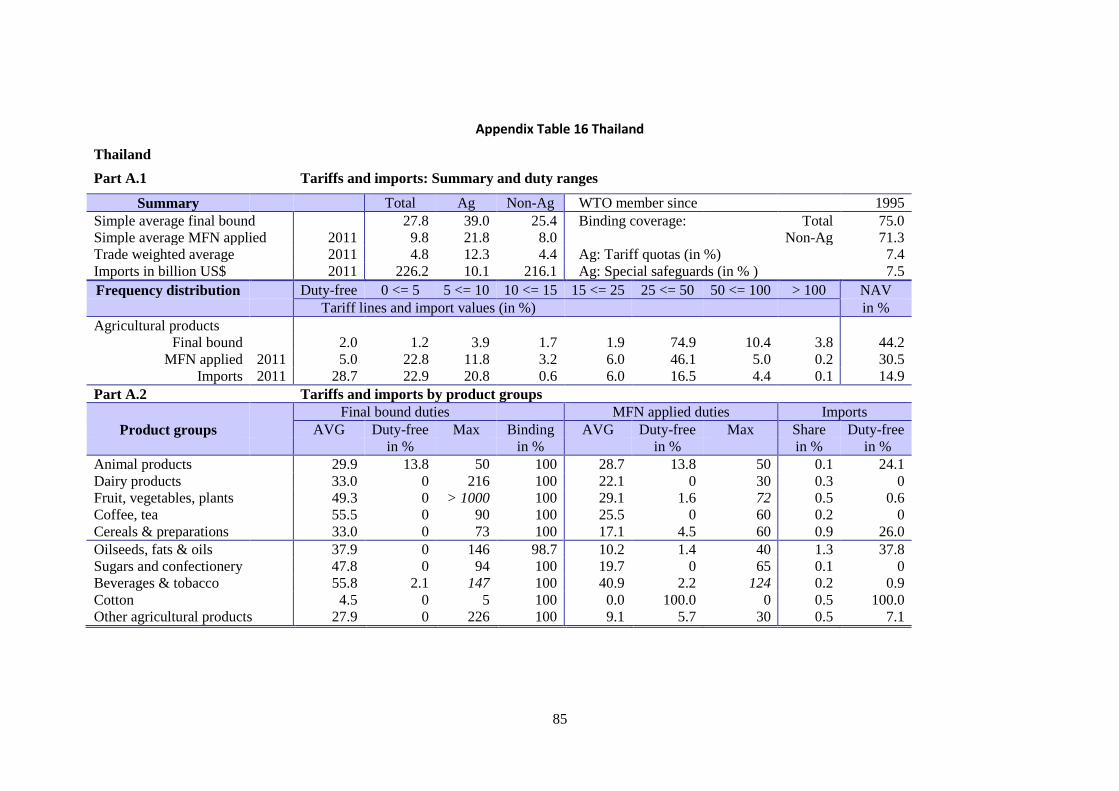
85
Appendix Table 16 Thailand
Thailand
Part A.1 Tariffs and imports: Summary and duty ranges
Summary Total Ag Non-Ag WTO member since 1995
Simple average final bound 27.8 39.0 25.4 Binding coverage: Total 75.0
Simple average MFN applied 2011 9.8 21.8 8.0 Non-Ag 71.3
Trade weighted average 2011 4.8 12.3 4.4 Ag: Tariff quotas (in %) 7.4
Imports in billion US$ 2011 226.2 10.1 216.1 Ag: Special safeguards (in % ) 7.5
Frequency distribution Duty-free 0 <= 5 5 <= 10 10 <= 15 15 <= 25 25 <= 50 50 <= 100 > 100 NAV
Tariff lines and import values (in %) in %
Agricultural products
Final bound 2.0 1.2 3.9 1.7 1.9 74.9 10.4 3.8 44.2
MFN applied 2011 5.0 22.8 11.8 3.2 6.0 46.1 5.0 0.2 30.5
Imports 2011 28.7 22.9 20.8 0.6 6.0 16.5 4.4 0.1 14.9
Part A.2 Tariffs and imports by product groups
Final bound duties MFN applied duties Imports
Product groups AVG Duty-free Max Binding AVG Duty-free Max Share Duty-free
in % in % in % in % in %
Animal products 29.9 13.8 50 100 28.7 13.8 50 0.1 24.1
Dairy products 33.0 0 216 100 22.1 0 30 0.3 0
Fruit, vegetables, plants 49.3 0 > 1000 100 29.1 1.6 72 0.5 0.6
Coffee, tea 55.5 0 90 100 25.5 0 60 0.2 0
Cereals & preparations 33.0 0 73 100 17.1 4.5 60 0.9 26.0
Oilseeds, fats & oils 37.9 0 146 98.7 10.2 1.4 40 1.3 37.8
Sugars and confectionery 47.8 0 94 100 19.7 0 65 0.1 0
Beverages & tobacco 55.8 2.1 147 100 40.9 2.2 124 0.2 0.9
Cotton 4.5 0 5 100 0.0 100.0 0 0.5 100.0
Other agricultural products 27.9 0 226 100 9.1 5.7 30 0.5 7.1

86
Appendix Table 17 Turkey
Turkey
Part A.1 Tariffs and imports: Summary and duty ranges
Summary Total Ag Non-Ag WTO member since 1995
Simple average final bound 28.6 61.0 17.0 Binding coverage: Total 50.3
Simple average MFN applied 2011 9.6 41.2 4.8 Non-Ag 42.7
Trade weighted average 2011 4.8 23.4 3.5 Ag: Tariff quotas (in %) 0
Imports in billion US$ 2011 204.4 13.3 191.1 Ag: Special safeguards (in % ) 0
Frequency distribution Duty-free 0 <= 5 5 <= 10 10 <= 15 15 <= 25 25 <= 50 50 <= 100 > 100 NAV
Tariff lines and import values (in %) in %
Agricultural products
Final bound 0.0 3.2 3.7 5.8 21.3 24.8 22.8 18.4 0
MFN applied 2011 16.3 6.3 10.8 4.5 14.6 22.5 12.5 12.6 0.6
Imports 2011 29.7 3.1 11.4 5.9 9.8 23.9 0.9 15.2 1.3
Part A.2 Tariffs and imports by product groups
Final bound duties MFN applied duties Imports
Product groups AVG Duty-free Max Binding AVG Duty-free Max Share Duty-free
in % in % in % in % in %
Animal products 132.8 0 225 100 110.0 7.5 225 0.8 37.2
Dairy products 169.8 0 180 100 129.3 0 180 0.0 0
Fruit, vegetables, plants 38.8 0 146 100 33.1 9.0 146 0.5 17.0
Coffee, tea 80.3 0 168 100 31.6 8.3 145 0.3 40.0
Cereals & preparations 68.6 0 180 100 32.4 7.4 130 1.3 2.5
Oilseeds, fats & oils 24.4 0 68 100 14.8 17.0 50 1.8 7.6
Sugars and confectionery 107.3 0 135 100 81.9 4.3 135 0.0 14.8
Beverages & tobacco 79.6 0 167 100 35.6 20.1 75 0.3 14.9
Cotton 10.9 0 13 100 0.0 100.0 0 0.9 100.0
Other agricultural products 30.8 0.2 75 100 10.2 39.6 75 0.6 42.7
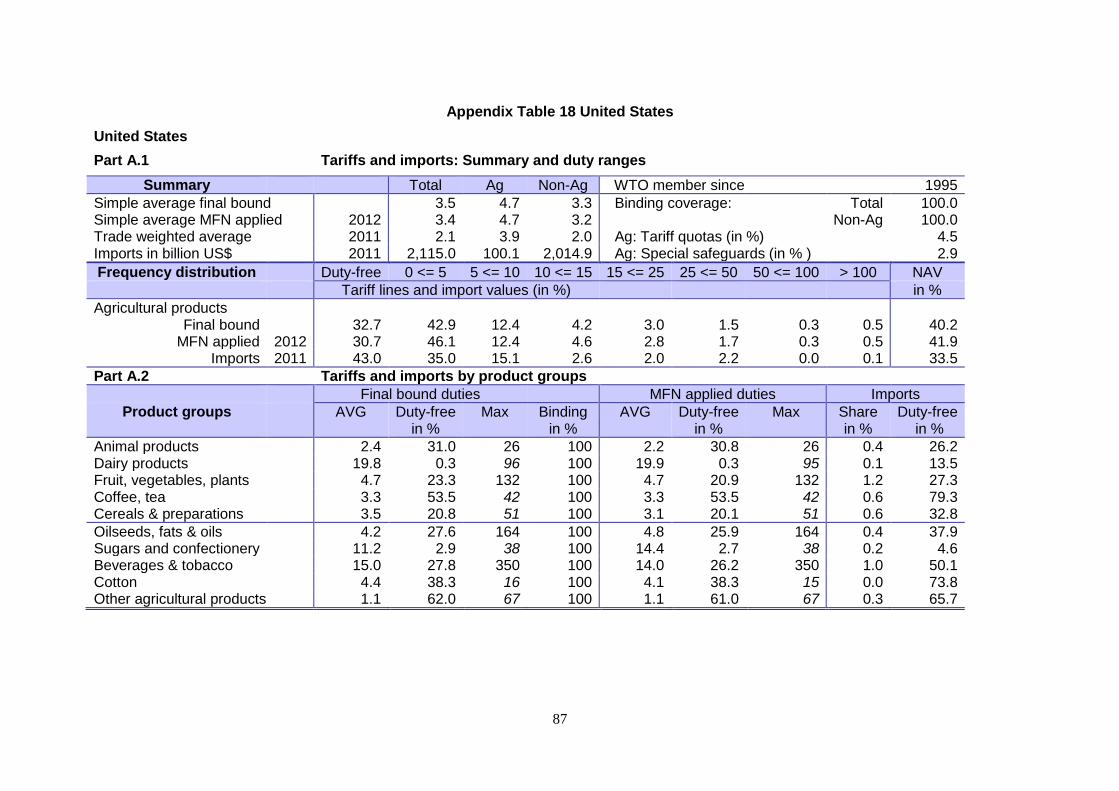
87
Appendix Table 18 United States
United States
Part A.1 Tariffs and imports: Summary and duty ranges
Summary Total Ag Non-Ag WTO member since 1995
Simple average final bound 3.5 4.7 3.3 Binding coverage: Total 100.0 Simple average MFN applied 2012 3.4 4.7 3.2 Non-Ag 100.0 Trade weighted average 2011 2.1 3.9 2.0 Ag: Tariff quotas (in %) 4.5 Imports in billion US$ 2011 2,115.0 100.1 2,014.9 Ag: Special safeguards (in % ) 2.9
Frequency distribution Duty-free 0 <= 5 5 <= 10 10 <= 15 15 <= 25 25 <= 50 50 <= 100 > 100 NAV
Tariff lines and import values (in %) in %
Agricultural products Final bound 32.7 42.9 12.4 4.2 3.0 1.5 0.3 0.5 40.2
MFN applied 2012 30.7 46.1 12.4 4.6 2.8 1.7 0.3 0.5 41.9 Imports 2011 43.0 35.0 15.1 2.6 2.0 2.2 0.0 0.1 33.5
Part A.2 Tariffs and imports by product groups
Final bound duties MFN applied duties Imports
Product groups AVG Duty-free Max Binding AVG Duty-free Max Share Duty-free in % in % in % in % in %
Animal products 2.4 31.0 26 100 2.2 30.8 26 0.4 26.2 Dairy products 19.8 0.3 96 100 19.9 0.3 95 0.1 13.5 Fruit, vegetables, plants 4.7 23.3 132 100 4.7 20.9 132 1.2 27.3 Coffee, tea 3.3 53.5 42 100 3.3 53.5 42 0.6 79.3 Cereals & preparations 3.5 20.8 51 100 3.1 20.1 51 0.6 32.8
Oilseeds, fats & oils 4.2 27.6 164 100 4.8 25.9 164 0.4 37.9 Sugars and confectionery 11.2 2.9 38 100 14.4 2.7 38 0.2 4.6 Beverages & tobacco 15.0 27.8 350 100 14.0 26.2 350 1.0 50.1 Cotton 4.4 38.3 16 100 4.1 38.3 15 0.0 73.8 Other agricultural products 1.1 62.0 67 100 1.1 61.0 67 0.3 65.7
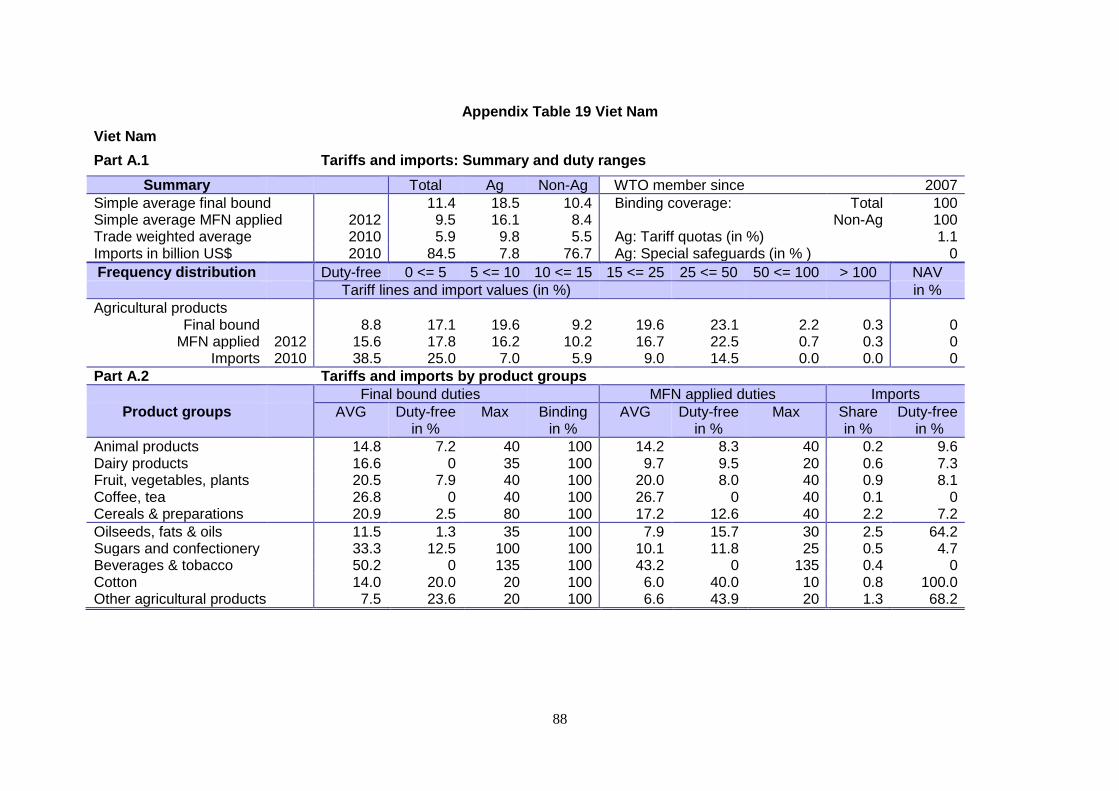
88
Appendix Table 19 Viet Nam
Viet Nam
Part A.1 Tariffs and imports: Summary and duty ranges
Summary Total Ag Non-Ag WTO member since 2007
Simple average final bound 11.4 18.5 10.4 Binding coverage: Total 100 Simple average MFN applied 2012 9.5 16.1 8.4 Non-Ag 100 Trade weighted average 2010 5.9 9.8 5.5 Ag: Tariff quotas (in %) 1.1 Imports in billion US$ 2010 84.5 7.8 76.7 Ag: Special safeguards (in % ) 0
Frequency distribution Duty-free 0 <= 5 5 <= 10 10 <= 15 15 <= 25 25 <= 50 50 <= 100 > 100 NAV
Tariff lines and import values (in %) in %
Agricultural products Final bound 8.8 17.1 19.6 9.2 19.6 23.1 2.2 0.3 0
MFN applied 2012 15.6 17.8 16.2 10.2 16.7 22.5 0.7 0.3 0 Imports 2010 38.5 25.0 7.0 5.9 9.0 14.5 0.0 0.0 0
Part A.2 Tariffs and imports by product groups
Final bound duties MFN applied duties Imports
Product groups AVG Duty-free Max Binding AVG Duty-free Max Share Duty-free in % in % in % in % in %
Animal products 14.8 7.2 40 100 14.2 8.3 40 0.2 9.6 Dairy products 16.6 0 35 100 9.7 9.5 20 0.6 7.3 Fruit, vegetables, plants 20.5 7.9 40 100 20.0 8.0 40 0.9 8.1 Coffee, tea 26.8 0 40 100 26.7 0 40 0.1 0 Cereals & preparations 20.9 2.5 80 100 17.2 12.6 40 2.2 7.2
Oilseeds, fats & oils 11.5 1.3 35 100 7.9 15.7 30 2.5 64.2 Sugars and confectionery 33.3 12.5 100 100 10.1 11.8 25 0.5 4.7 Beverages & tobacco 50.2 0 135 100 43.2 0 135 0.4 0 Cotton 14.0 20.0 20 100 6.0 40.0 10 0.8 100.0 Other agricultural products 7.5 23.6 20 100 6.6 43.9 20 1.3 68.2
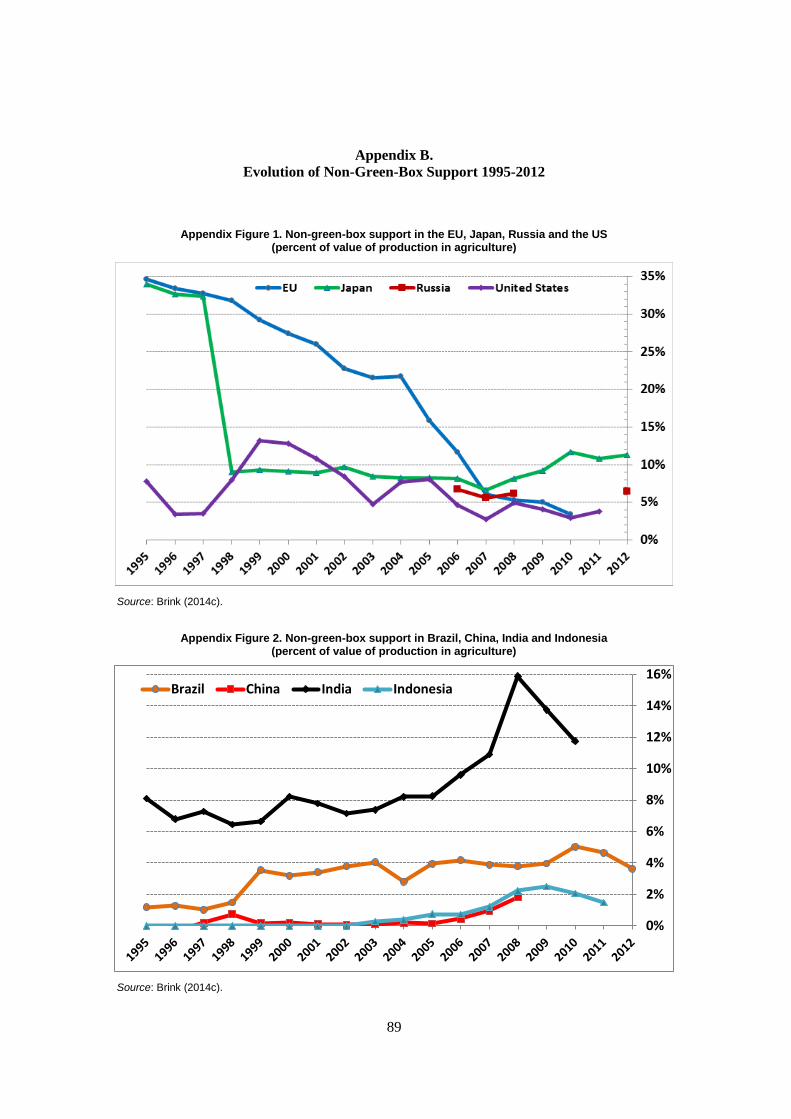
89
Appendix B.
Evolution of Non-Green-Box Support 1995-2012
Appendix Figure 1. Non-green-box support in the EU, Japan, Russia and the US (percent of value of production in agriculture)
Source: Brink (2014c).
Appendix Figure 2. Non-green-box support in Brazil, China, India and Indonesia (percent of value of production in agriculture)
Source: Brink (2014c).
0%
2%
4%
6%
8%
10%
12%
14%
16%Brazil China India Indonesia