Embed Size (px)
Citation preview
COMMITTED TO THOSE LINKED TO THE LAND
Deere & CompanyOne John Deere PlaceMoline, Illinois 61265(309) 765-8000www.JohnDeere.com
“I will never put my nameon a product that does not have in it
the best that is in me.”— John Deere
Medallion created to celebratethe company’s centennial in 1937.
Deere & Company Annual Report 2011
DEERE &
COM
PANY AN
NU
AL REPORT 2011
30409 2011 AR Covers.indd 1 12/21/11 5:46 PM
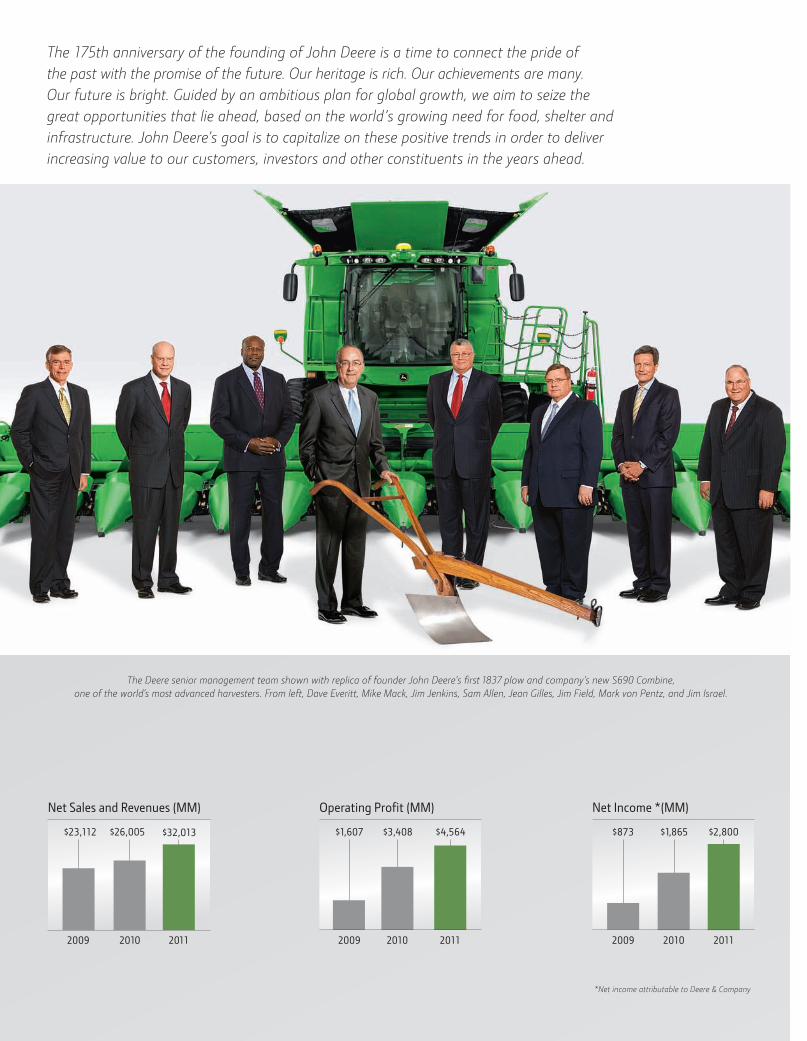
Net Sales and Revenues (MM)
2009 2010 2011
$23,112 $26,005 $32,013
Operating Profit (MM)
2009 2010 2011
$1,607 $3,408 $4,564
Net Income *(MM)
2009 2010 2011
$873 $1,865 $2,800
*Net income attributable to Deere & Company
The Deere senior management team shown with replica of founder John Deere’s first 1837 plow and company’s new S690 Combine, one of the world’s most advanced harvesters. From left, Dave Everitt, Mike Mack, Jim Jenkins, Sam Allen, Jean Gilles, Jim Field, Mark von Pentz, and Jim Israel.
The 175th anniversary of the founding of John Deere is a time to connect the pride of the past with the promise of the future. Our heritage is rich. Our achievements are many. Our future is bright. Guided by an ambitious plan for global growth, we aim to seize the great opportunities that lie ahead, based on the world’s growing need for food, shelter and infrastructure. John Deere’s goal is to capitalize on these positive trends in order to deliver increasing value to our customers, investors and other constituents in the years ahead.
SAMUEL R. ALLEN (2)Chairman and Chief Executive Officer Deere & Company
CRANDALL C. BOWLES (15)Chairman, Springs Industries, Inc. Chairman, The Springs Company home furnishings
VANCE D. COFFMAN (7)Retired ChairmanLockheed Martin Corporationaerospace, defense and information technology
CHARLES O. HOLLIDAY, JR. (4) Chairman of the BoardBank of America Corporationbanking, investing and asset management
DIPAK C. JAIN (9)Dean, INSEADbusiness education
CLAYTON M. JONES (4)Chairman, President and Chief Executive OfficerRockwell Collins, Inc.aviation electronics and communications
JOACHIM MILBERG (8)Chairman, Supervisory BoardBayerische Motoren Werke (BMW) AGmotor vehicles
RICHARD B. MYERS (5)Retired Chairman, Joint Chiefs of Staff Retired General, United States Air Forceprincipal military advisor to the President, the Secretary of Defense, and the National Security Council
From left: David B. Speer, Aulana L. Peters, Thomas H. Patrick, Richard B. Myers, Joachim Milberg, Samuel R. Allen, Clayton M. Jones, Dipak C. Jain, Charles O. Holliday, Jr., Vance D. Coffman and Crandall C. Bowles; shown at the John Deere Pavilion, Moline, Illinois, with a sculpture of a John Deere combine made of canned and packaged foods that were later donated to area food pantries.
BOARD OF DIRECTORS
THOMAS H. PATRICK (11)ChairmanNew Vernon Capital, LLCprivate equity fund
AULANA L. PETERS (9)Retired PartnerGibson, Dunn & Crutcher LLPlaw firm
DAVID B. SPEER (3)Chairman and Chief Executive OfficerIllinois Tool Works Inc.engineered components, industrial systems and consumables
(Not pictured: Elected 12/7/11)SHERRY M. SMITHExecutive Vice President and Chief Financial OfficerSUPERVALU INC. grocery
Figures in parentheses represent complete years of board service through 12/31/11 and positions as of that date.
30409 2011 AR Covers.indd 2 1/3/12 10:11 AM
3
2011 Marks Year of Exceptional Achievementfor John DeereJohn Deere prepares to observe its 175th anniversary after concluding a year of exceptional achievement. Our company has been noted for outstanding performance since its beginnings. Yet in many respects, that performance reached new levels in 2011.
maintained our conservative capital structure, and introduced more products than ever before. We also strengthened our commitment to responsible corporate citizenship and made further strides in being a highly regarded employer.
As a result, the company remains well-positioned to capitalize on
broad economic trends that hold great promise for the future.
previous highs by a wide margin. Income was up 50 percent on a
plans, which center on operating consistency and a disciplined approach to asset and cost management. Rigorous execution
These dollars helped us fuel major capital projects, pay out a record amount in dividends to investors, and continue with share
continued to be conservatively capitalized. At year-end, Deere
CHAIRMAN’S MESSAGE
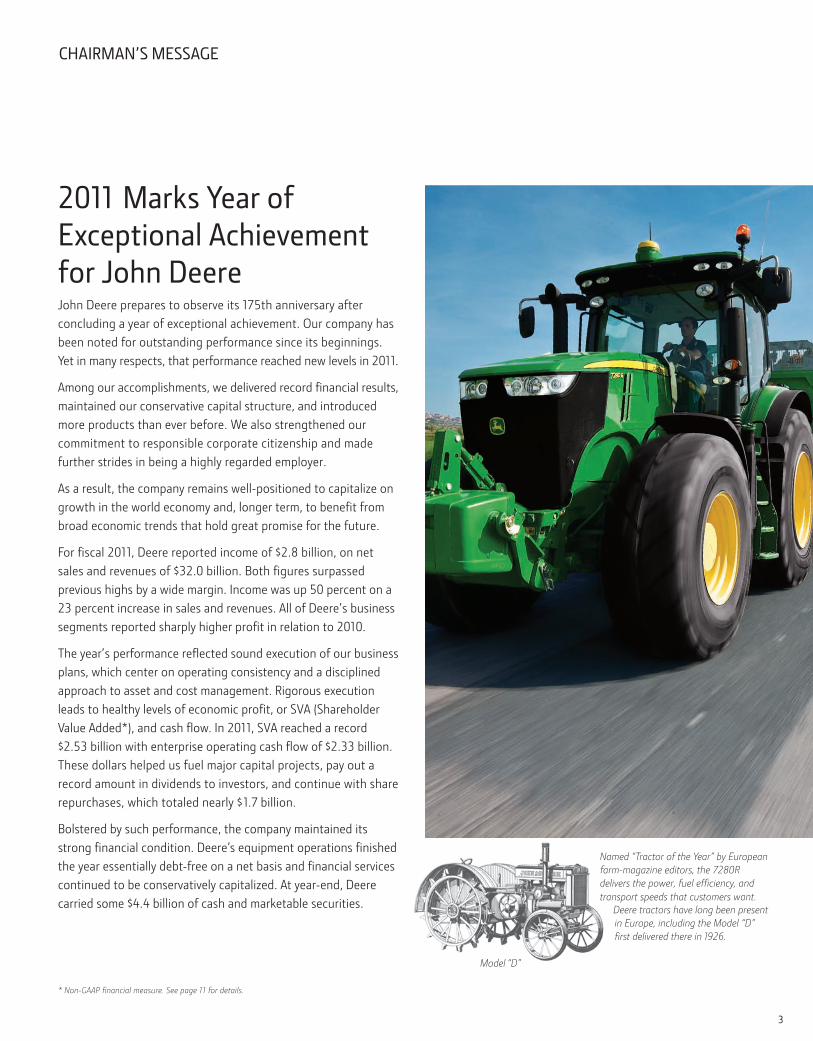
Model “D”
Named “Tractor of the Year” by European
Deere tractors have long been present in Europe, including the Model “D”
30409 2011_AR.indd 3 12/21/11 7:08 PM
transport speeds that customers want.
farm-magazine editors, the 7280R

4
Largest Division Sets PaceOur performance was led by the Agriculture & Turf division (A&T), which had yet another standout year. Sales increased by $4.2 billion, one of the largest single-year gains ever.
market an unprecedented number of new products and broadened its customer base.
A&T results were aided by positive farm conditions and strong sales of large equipment, particularly in the United States and Canada. Sales in key markets such as Western and Central Europe,
In other parts of our business, Construction & Forestry (C&F)
than tripling on a sales increase of 45 percent. C&F introduced advanced products, expanded into new geographies, and picked up market share in key categories. Even with the year’s strong growth – which has seen division sales more than double in just two years – sales remained well below what traditionally has been thought of as a normal level.
Further contributing to our results was John Deere Financial,
customers. Financial Services’ earnings jumped 26 percent, largely as a result of nearly $3 billion of portfolio growth. Credit quality remained quite strong, with the provision for loss declining to a mere $4 for each $10,000 of average portfolio value.
Powerful Tailwinds Shape PlansPowerful trends sweeping the world are lending support to our current performance and future prospects. Global population continues to grow, surpassing 7 billion during the year. Of equal importance, rising prosperity, particularly in developing economies such as Brazil, Russia, India and China, is leading to a greater need for food and energy. As a result, worldwide stocks of key farm commodities have remained near historic lows in relation to use. Grain prices and farm incomes have risen sharply in response.
Listening to earthmoving contractors and road builders helped the company design the Deere 850K Dozer. Its 205-hp, IT4 engine and dual-path hydrostatic transmission match power and speed to load. Innovative cooling makes the 850K highly productive on big job sites. Customer input drove design even for Deere’s earlier machines like the 40C introduced in 1953.
40C Crawler
30409 2011_AR.indd 4 12/21/11 6:03 PM
5
Many experts believe agricultural output will need to double by mid-century to satisfy demand and do so from essentially the same amount of land and with even less water. Production gains on this scale are not without precedent. However, as in the past, they will require further advances in farming mechanization and productivity to achieve.
At the same time, people are migrating to cities from rural areas in great numbers. This furthers the need for roads, bridges, and buildings – and for the equipment required to construct them.
These trends, which appear to have considerable resilience, are positive for John Deere. In our view, they should support demand for innovative farm, construction, forestry and turf-care equipment and related solutions well into the future.
Expanding our Global Market PresenceFavorable tailwinds are one thing; pursuing aggressive plans to capture them is another. To that point, John Deere is moving ahead with a far-reaching operating strategy aimed at expanding our global presence in a major way. The plan’s centerpiece – a mid-cycle sales goal of $50 billion by 2018 – requires substantial investments in additional capacity, distribution, credit and after-market support.
Over the last year, Deere announced plans to build seven factories in markets critical to our growth. These investments build on
marketing presence worldwide.
Of the new facilities, three are in China, for construction equipment, engines and large farm machinery; two are in Brazil, both for construction equipment; and one is located in India,
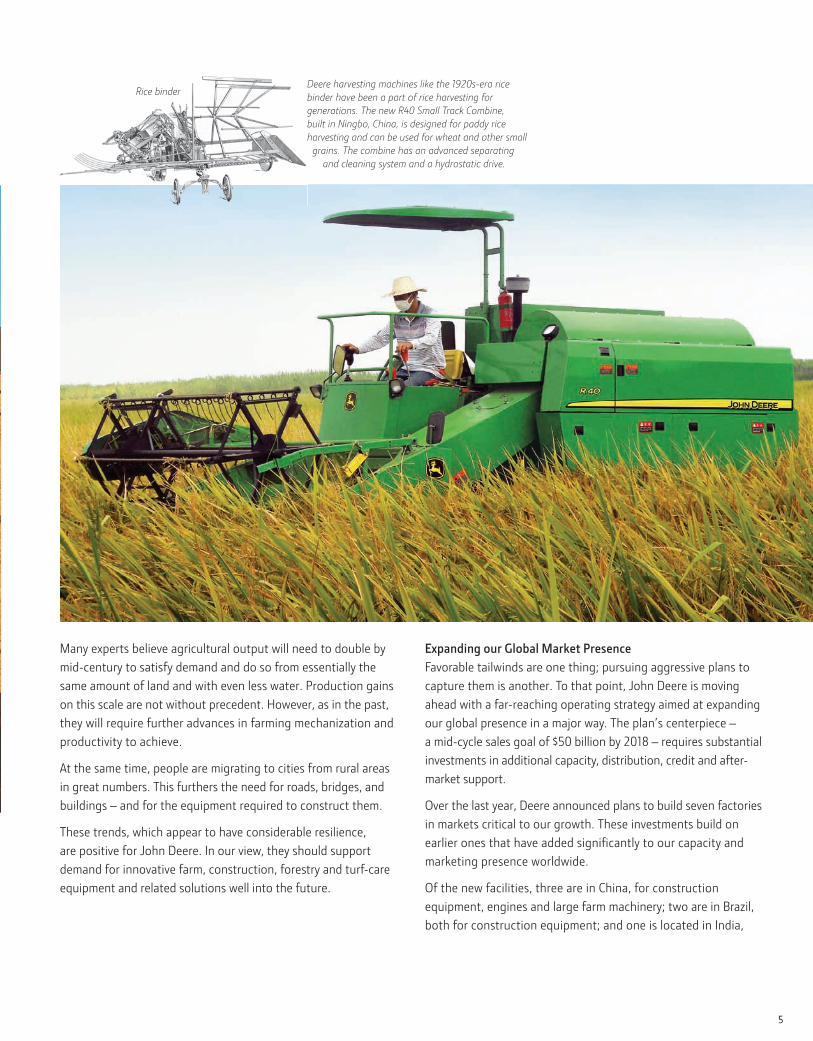
Rice binderDeere harvesting machines like the 1920s-era rice binder have been a part of rice harvesting for generations. The new R40 Small Track Combine, built in Ningbo, China, is designed for paddy rice harvesting and can be used for wheat and other small grains. The combine has an advanced separating and cleaning system and a hydrostatic drive.
30409 2011_AR.indd 5 12/22/11 4:26 PM
6
for the manufacture of farm tractors. Only last month plans were disclosed to construct a facility in Russia for seeding, tillage and application equipment.
In addition, new or expanded parts centers were opened during the year in Germany, Sweden, Canada and Russia. Finance operations were launched in China and are being planned in Russia.
At the same time, we continued a pattern of making substantial investments in our U.S. manufacturing base. In 2011, major upgrades moved forward for our facilities in Davenport, Des Moines and Waterloo. The company added some 2,500 employees to its U.S. workforce as well.
Even as we expand our global footprint, we continue to stress the vital importance of the U.S. and Canadian markets. Last year, the region accounted for 60 percent of our revenues, about
spending on capital programs.
The John Deere of the future will be more global in scale and more international in nature. Yet we fully intend to achieve
ways to serve those customers who remain a cornerstone of our success.
Record Year for New ProductsExpanding our product range and entering attractive portions of
John Deere introduced a record number of products, most of which feature improvements in power, comfort and performance. Many include John Deere engine technology that dramatically reduces emissions while meeting customer requirements for
New products include premium combines that set standards for capacity and productivity, as well as the most powerful line of John Deere tractors ever made. Other products new to the market are our largest-ever self-propelled sprayers, one of which has a
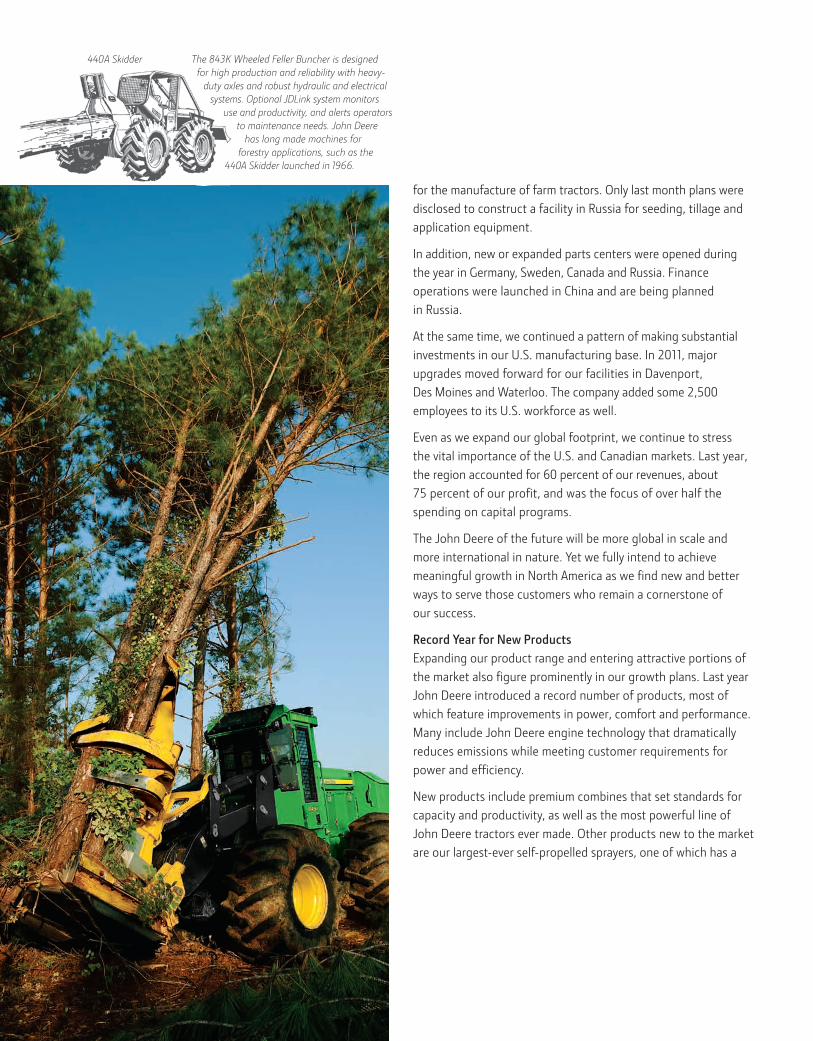
440A Skidder The 843K Wheeled Feller Buncher is designed for high production and reliability with heavy-
duty axles and robust hydraulic and electrical systems. Optional JDLink system monitors
use and productivity, and alerts operators to maintenance needs. John Deere
has long made machines for forestry applications, such as the
440A Skidder launched in 1966.
30409 2011_AR.indd 6 12/27/11 10:57 AM
7
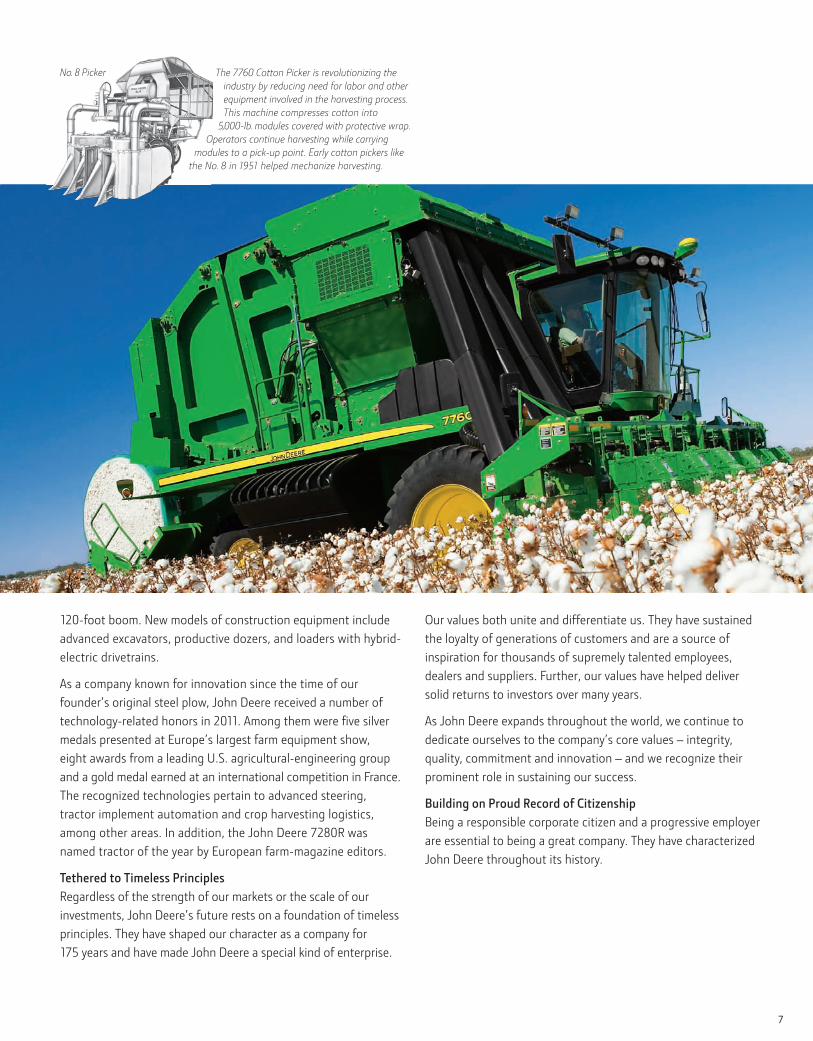
120-foot boom. New models of construction equipment include advanced excavators, productive dozers, and loaders with hybrid-electric drivetrains.
As a company known for innovation since the time of our founder’s original steel plow, John Deere received a number of
medals presented at Europe’s largest farm equipment show, eight awards from a leading U.S. agricultural-engineering group and a gold medal earned at an international competition in France. The recognized technologies pertain to advanced steering, tractor implement automation and crop harvesting logistics, among other areas. In addition, the John Deere 7280R was named tractor of the year by European farm-magazine editors.
Tethered to Timeless PrinciplesRegardless of the strength of our markets or the scale of our investments, John Deere’s future rests on a foundation of timeless principles. They have shaped our character as a company for 175 years and have made John Deere a special kind of enterprise.
Our values both unite and differentiate us. They have sustained the loyalty of generations of customers and are a source of inspiration for thousands of supremely talented employees, dealers and suppliers. Further, our values have helped deliver solid returns to investors over many years.
As John Deere expands throughout the world, we continue to dedicate ourselves to the company’s core values – integrity, quality, commitment and innovation – and we recognize their prominent role in sustaining our success.
Building on Proud Record of CitizenshipBeing a responsible corporate citizen and a progressive employer are essential to being a great company. They have characterized John Deere throughout its history.
No. 8 Picker The 7760 Cotton Picker is revolutionizing the industry by reducing need for labor and other equipment involved in the harvesting process. This machine compresses cotton into
5,000-lb. modules covered with protective wrap. Operators continue harvesting while carrying
modules to a pick-up point. Early cotton pickers like the No. 8 in 1951 helped mechanize harvesting.
30409 2011_AR.indd 7 12/21/11 6:03 PM
8
In addition, the John Deere Foundation continued its support
agriculture, science, technology, engineering and business. Through a partnership with a leading German university, the foundation helped sponsor an agricultural-development training
concern and respect shown for our employees. As an example,
this exceptional record got even better in 2011. The rate of
line with historic lows. More than half of our locations did not have a single lost-time incident during the year.
In other milestones, the company’s leadership development
During the year, the John Deere Foundation provided continued
practices in developing countries. Along these lines, Opportunity
farmers in Africa, remained a major recipient of foundation support.
As well, John Deere employees are helping enrich their communities through extensive volunteer efforts. In launching the company’s formal volunteerism initiative in 2011, a group of 20 John Deere leaders including me spent several days in India
a foundation grant to help these farmers grow more food and increase their incomes.
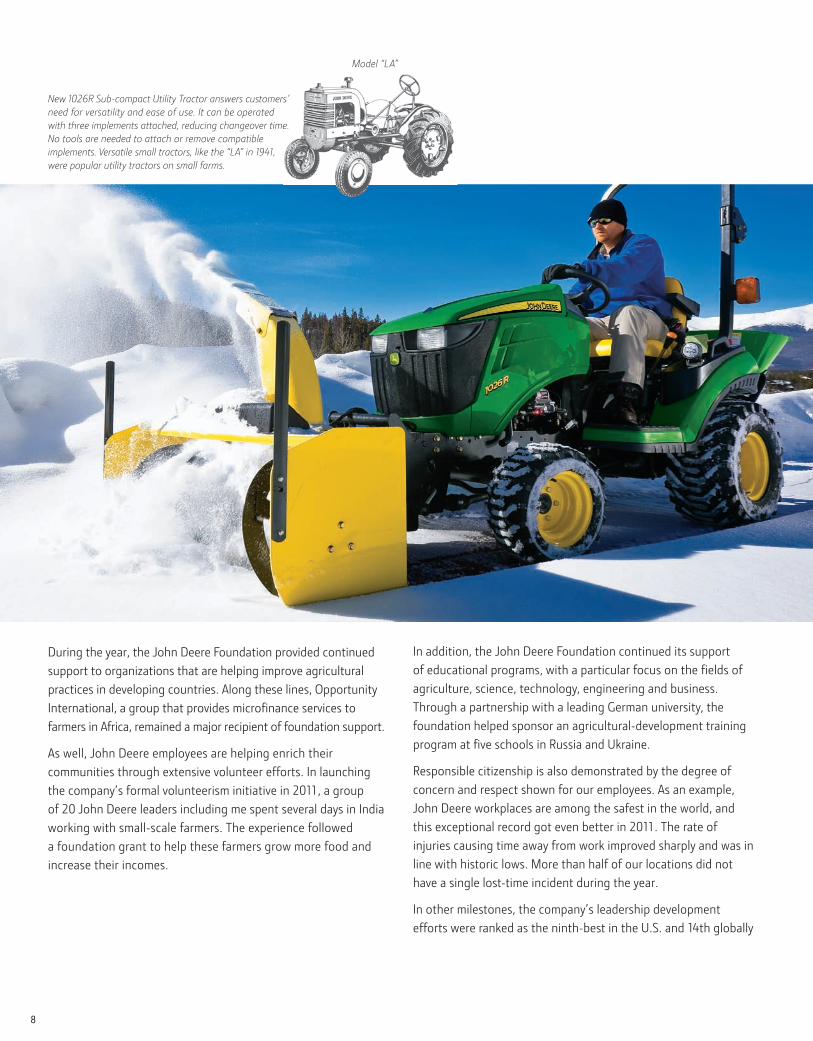
Model “LA”
New 1026R Sub-compact Utility Tractor answers customers’ need for versatility and ease of use. It can be operated with three implements attached, reducing changeover time. No tools are needed to attach or remove compatible implements. Versatile small tractors, like the “LA” in 1941, were popular utility tractors on small farms.
30409 2011_AR.indd 8 12/21/11 7:09 PM

9
by Fortune magazine. Deere also was named one of the best companies to work for in Brazil by a top survey. These are important acknowledgements of our ability to identify, nurture and develop top talent.
175 Years of Building for the FutureJohn Deere is poised for growth and future success. Building on our strong performance in 2011, the company remains well-positioned to capitalize on the broad economic trends that have large-scale potential.
Thanks to the tireless efforts of John Deere employees, dealers and suppliers throughout the world, our plans for helping meet the world’s growing need for advanced agricultural and construction equipment are on track and moving ahead at an
about the company’s prospects and our ability to deliver
For 175 years, John Deere has been setting standards of achievement. Throughout this time, we have been building for the future, a future which in our view has never held a greater measure of promise or opportunity for those with a stake in our success.
That’s why we say with pride and conviction there has never been a better time to be associated with John Deere! To all who share our passion for serving those linked to the land and our optimism for meeting the challenges that lie ahead, we express our thanks for your encouragement and support.
On behalf of the John Deere team, December 19, 2011
Samuel R. Allen
9
DEERE ENTERPRISE SVA (MM)
2011 HIGHLIGHTS
– Aided by healthy globalfarm conditions and skillful execution, earnings increase 50% to $2.8 billion. Sales and revenues rise by 23%.
–and continued asset discipline propel SVA (Shareholder Value Added) to $2.5 billion,well above previous record set in 2010.
– Providing basis for further growth, capital expenditures reach nearly $1.1 billion;
in engine-emissions technology and new products.
– With goal of providing value directly to shareholders, company boosts quarterly dividend rate by 17% and repurchases 20.8 million shares.
– Deere listed among 50 most-admired companies by Fortunemagazine and ranked as one of 100 best global brands by a
EQUIPMENT OPERATIONS SVA (MM)–
and focus on managing assets.
increases to $3.839 billion on 25% sales increase.
–conditions and strong execution, operating margins rise to 13%; OROA (Operating Return on Operating Assets) nears 30%, with inventories valued at standard cost.
– Showing emphasis on global growth, sales outside the U.S. and Canada jump 38% – and exceed 40% of the company total.
– Increasing its presence in high-growth regions, company begins work on engine plant in China to supply John Deere agricultural and construction equipment factories in Asia.
– John Deere Technology Center – India installs virtual reality
and lower costs.
– John Deere Power Systems engines receive U.S. EPA Interim
2009 2010 2011
$64 $1,650 $2,294
2009 2010 2011
$2,527
-$84
$1,714
30409 2011_AR.indd 9 12/27/11 1:26 PM
1010
2009 2010 2011
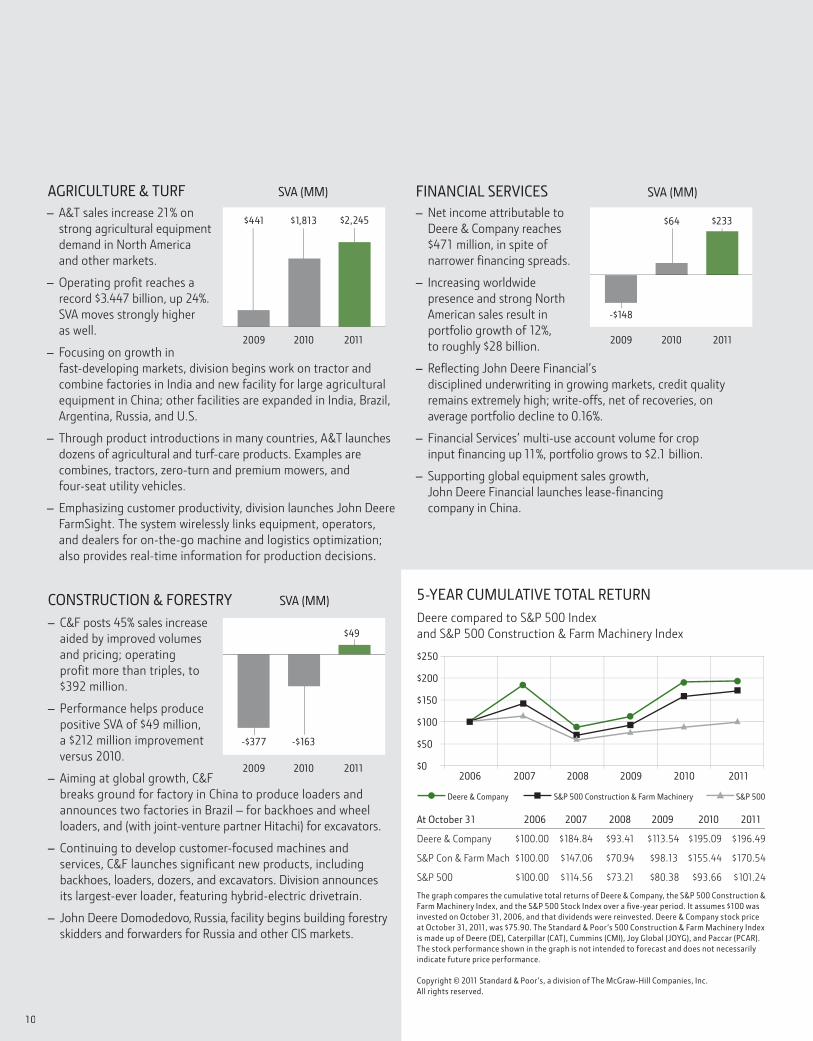
$441 $1,813 $2,245
FINANCIAL SERVICES SVA (MM)
– Net income attributable to Deere & Company reaches $471 million, in spite of
–
American sales result in
–
–
–
AGRICULTURE & TURF SVA (MM)
–
–
–
–
–
–
–
–
–
–
The graph compares the cumulative total returns of Deere & Company, the S&P 500 Construction &
$250
$200
$150
$100
$50
$0
Deere & Company S&P 500 Construction & Farm Machinery S&P 500
2009 2010 2011
$49
2009 2010 2011
$233$64
CONSTRUCTION & FORESTRY SVA (MM)
30409 2011_AR.indd 10 1/3/12 10:09 AM
11
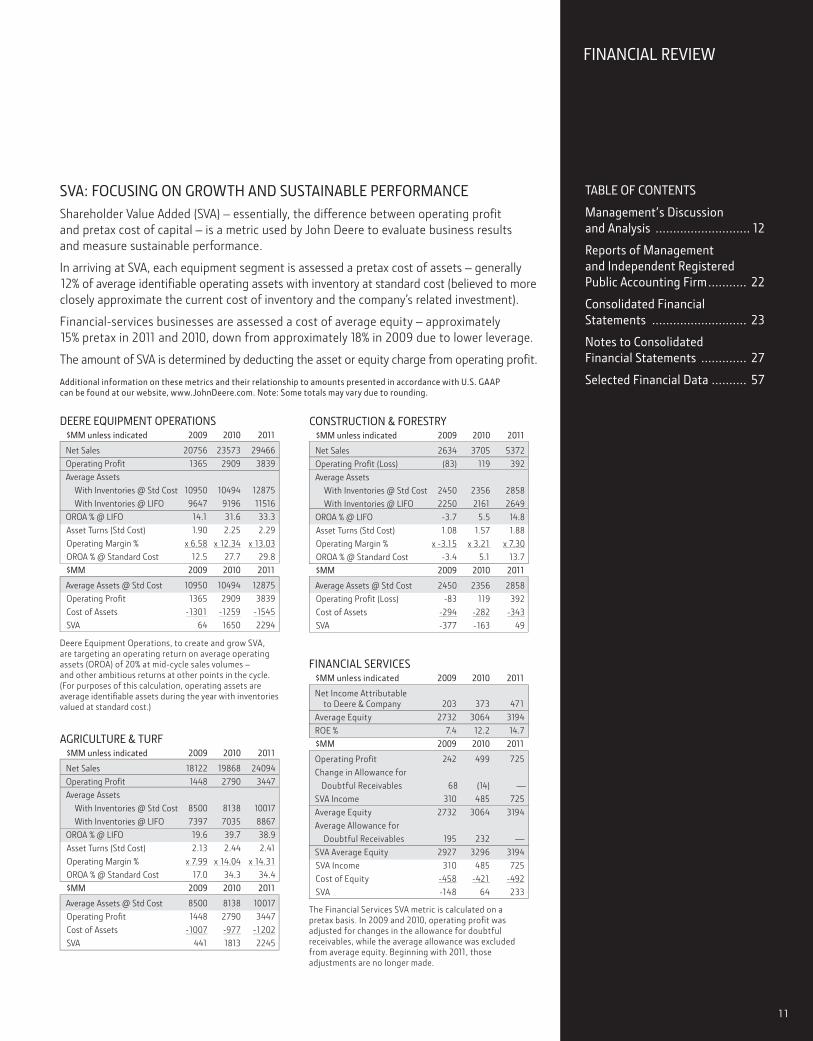
DEERE EQUIPMENT OPERATIONS$MM unless indicated 2009 2010 2011
Net Sales 20756 23573 29466
Average Assets
Operating Margin % x x
$MM 2009 2010 2011
Cost of Assets - - 259 - 545
TABLE OF CONTENTS
Management’s Discussion and Analysis ........................... 12
Reports of Managementand Independent RegisteredPublic Accounting Firm........... 22
Consolidated Financial Statements ........................... 23
Notes to Consolidated Financial Statements ............. 27
Selected Financial Data .......... 57
SVA: FOCUSING ON GROWTH AND SUSTAINABLE PERFORMANCE
and pretax cost of capital – is a metric used by John Deere to evaluate business results
In arriving at SVA, each equipment segment is assessed a pretax cost of assets – generally
Financial-services businesses are assessed a cost of average equity – approximately
Additional information on these metrics and their relationship to amounts presented in accordance with U.S. GAAP can be found at our website, www.JohnDeere.com. Note: Some totals may vary due to rounding.
FINANCIAL REVIEW
Deere Equipment Operations, to create and grow SVA, are targeting an operating return on average operating assets (OROA) of 20% at mid-cycle sales volumes –
(For purposes of this calculation, operating assets are
AGRICULTURE & TURF$MM unless indicated 2009 2010 2011
Average Assets
Operating Margin % x 7 x x
$MM 2009 2010 2011
Cost of Assets - 007 -977
CONSTRUCTION & FORESTRY $MM unless indicated 2009 2010 2011
Net Sales 2634 3705 5372
Average Assets
Operating Margin % x -3 2 x 7
$MM 2009 2010 2011
Cost of Assets -294 -343
The Financial Services SVA metric is calculated on a
adjusted for changes in the allowance for doubtful receivables, while the average allowance was excluded
FINANCIAL SERVICES$MM unless indicated 2009 2010 2011
Net Income Attributable
$MM 2009 2010 2011
Change in Allowance for
Average Allowance for
Cost of Equity -492
11
30409 2011_AR.indd 11 12/21/11 6:04 PM
MANAGEMENT’S DISCUSSION AND ANALYSIS
RESULTS OF OPERATIONS FOR THE YEARS ENDED OCTOBER 31, 2011, 2010 AND 2009
OVERVIEW
OrganizationThe company’s equipment operations generate revenues and cash primarily from the sale of equipment to John Deere dealers and distributors. The equipment operations manufacture and distribute a full line of agricultural equipment; a variety of commercial, consumer and landscapes equipment and products; and a broad range of equipment for construction and forestry. The company’s financial services primarily provide credit services, which mainly finance sales and leases of equipment by John Deere dealers and trade receivables purchased from the equipment operations. In addition, financial services offer crop risk mitigation products and extended equipment warranties. The information in the following discussion is presented in a format that includes information grouped as consolidated, equipment operations and financial services. The company’s operating segments consist of agriculture and turf, construction and forestry, and financial services. The previous credit segment and the “Other” segment were combined into the financial services segment at the beginning of the first quarter of 2011 (see Note 28). The “Other” segment consisted of an insurance business related to extended warranty policies for equipment that did not meet the materiality threshold of reporting. The following discussions of operating segment results and liquidity ratios have been revised to conform to the current segments.
Trends and Economic ConditionsIndustry farm machinery sales in the U.S. and Canada for 2012 are forecast to be up approximately 5 to 10 percent, compared to 2011. Industry sales in the EU 27 nations of Western and Central Europe are forecast to be about the same in 2012, while sales in the Commonwealth of Independent States are expected to be moderately higher. Sales in Asia are forecast to increase strongly again in 2012. South American industry sales are projected to be approximately the same as 2011. Industry sales of turf and utility equipment in the U.S. and Canada are expected to increase slightly. The company’s agriculture and turf equipment sales increased 21 percent in 2011 and are forecast to increase by about 15 percent for 2012. Construction equipment markets are forecast to slightly improve, while global forestry markets are expected to be about the same in 2012. The compa-ny’s construction and forestry sales increased 45 percent in 2011 and are forecast to increase by about 16 percent in 2012. Net income of the company’s financial services operations attributable to Deere & Company in 2012 is forecast to be approximately $450 million.
Items of concern include the uncertainty of the global economic recovery, the impact of sovereign and state debt, capital market disruptions, the availability of credit for the company’s customers and suppliers, the effectiveness of governmental actions in respect to monetary policies, general economic conditions and financial regulatory reform. Significant volatility in the price of many commodities could also impact the company’s results, while the availability of
certain components that could impact the company’s ability to meet production schedules continues to be monitored. Designing and producing products with engines that continue to meet high performance standards and increasingly stringent emissions regulations is one of the company’s major priorities.
Supported by record 2011 performance, the company remains well positioned to implement its growth plans and capitalize on positive long-term economic trends. The company’s strong levels of cash flow are funding growth throughout the world and are being shared with investors in the form of dividends and share repurchases.
2011 COMPARED WITH 2010
CONSOLIDATED RESULTSWorldwide net income attributable to Deere & Company in 2011 was $2,800 million, or $6.63 per share diluted ($6.71 basic), compared with $1,865 million, or $4.35 per share diluted ($4.40 basic), in 2010. Net sales and revenues increased 23 percent to $32,013 million in 2011, compared with $26,005 million in 2010. Net sales of the equipment operations increased 25 percent in 2011 to $29,466 million from $23,573 million last year. The sales increase, which was primarily due to higher shipment volumes, also included a favorable effect for foreign currency translation of 3 percent and price realization of 3 percent. Net sales in the U.S. and Canada increased 17 percent in 2011. Net sales outside the U.S. and Canada increased by 38 percent in 2011, which included a favorable effect of 7 percent for foreign currency translation.
Worldwide equipment operations had an operating profit of $3,839 million in 2011, compared with $2,909 million in 2010. The higher operating profit was primarily due to higher shipment volumes and improved price realization, partially offset by increased raw material costs, higher manufacturing overhead costs related to new products, higher selling, administrative and general expenses and increased research and development expenses.
The equipment operations’ net income was $2,329 million in 2011, compared with $1,492 million in 2010. The same operating factors mentioned above and a lower effective tax rate in 2011 affected these results.
Net income of the financial services operations attribut-able to Deere & Company in 2011 increased to $471 million, compared with $373 million in 2010. The increase was primarily a result of growth in the credit portfolio and a lower provision for credit losses. Additional information is presented in the following discussion of the “Worldwide Financial Services Operations.”
The cost of sales to net sales ratio for 2011 was 74.4 percent, compared with 73.8 percent last year. The increase was primarily due to increased raw material costs and higher manufacturing overhead costs related to new products, partially offset by improved price realization.
Finance and interest income increased this year due to a larger average credit portfolio, partially offset by lower financing rates. Other income increased primarily as a result of higher insurance premiums and fees earned on crop insurance, largely offset by lower service revenues due to the sale of the wind
12
30409 Deere 2011.indd 2 12/16/11 3:32 PM
energy business (see Note 4). Research and development expenses increased primarily as a result of increased spending in support of new products and Interim and Final Tier 4 emission requirements. Selling, administrative and general expenses increased primarily due to growth and higher sales commissions. Interest expense decreased due to lower average borrowing rates, partially offset by higher average borrowings. Other operating expenses decreased primarily due to lower depreciation expenses this year due to the sale of the wind energy business and the write-down of the related assets held for sale at the end of last year, partially offset by higher crop insurance claims and expenses this year. The effective tax rate for the provision for income taxes was lower this year primarily due to the effect of the tax expense related to the enactment of health care legislation in 2010 (see Note 8).
The company has several defined benefit pension plans and defined benefit health care and life insurance plans. The company’s postretirement benefit costs for these plans in 2011 were $603 million, compared with $658 million in 2010. The long-term expected return on plan assets, which is reflected in these costs, was an expected gain of 8.0 percent in 2011 and 8.2 percent in 2010, or $906 million in 2011 and $883 million in 2010. The actual return was a gain of $695 million in 2011 and $1,273 million in 2010. In 2012, the expected return will be approximately 8.0 percent. The company expects postretirement benefit costs in 2012 to be approximately the same as 2011. The company makes any required contributions to the plan assets under applicable regulations and voluntary contributions from time to time based on the company’s liquidity and ability to make tax-deductible contributions. Total company contributions to the plans were $122 million in 2011 and $836 million in 2010, which include direct benefit payments for unfunded plans. These contributions also included voluntary contributions to plan assets of $650 million in 2010. Total company contributions in 2012 are expected to be approximately $466 million, which include direct benefit payments. The company has no required significant contributions to pension plan assets in 2012 under applicable funding regulations. See the following discussion of “Critical Accounting Policies” for more information about postretirement benefit obligations.BUSINESS SEGMENT AND GEOGRAPHIC AREA RESULTSThe following discussion relates to operating results by reportable segment and geographic area. Operating profit is income before certain external interest expense, certain foreign exchange gains or losses, income taxes and corporate expenses. However, operating profit of the financial services segment includes the effect of interest expense and foreign currency exchange gains or losses.
Worldwide Agriculture and Turf OperationsThe agriculture and turf segment had an operating profit of $3,447 million in 2011, compared with $2,790 million in 2010.Net sales increased 21 percent this year primarily due to higher shipment volumes. Sales also increased due to improved price realization and foreign currency translation. The increase in operating profit was largely due to increased shipment volumes
and improved price realization, partially offset by increased raw material costs, higher manufacturing overhead costs related to new products, higher selling, administrative and general expenses and increased research and development expenses.
Worldwide Construction and Forestry OperationsThe construction and forestry segment had an operating profit of $392 million in 2011, compared with $119 million in 2010. Net sales increased 45 percent for the year primarily due to higher shipment volumes. Sales also increased due to improved price realization. The operating profit improvement in 2011 was primarily due to higher shipment and production volumes and improved price realization, partially offset by increased raw material costs, higher selling, administrative and general expenses and increased research and development expenses.
Worldwide Financial Services OperationsThe operating profit of the financial services segment was $725 million in 2011, compared with $499 million in 2010. The increase in operating profit was primarily due to growth in the credit portfolio and a lower provision for credit losses, partially offset by narrower financing spreads. Last year’s results were also affected by the write-down of wind energy assets that were held for sale (see Note 4). Total revenues of the financial services operations, including intercompany revenues, increased 3 percent in 2011, primarily reflecting the larger portfolio. The average balance of receivables and leases financed was 13 percent higher in 2011, compared with 2010. Interest expense decreased 7 percent in 2011 as a result of lower average borrowing rates, partially offset by higher average borrowings. The financial services operations’ ratio of earnings to fixed charges was 2.22 to 1 in 2011, compared with 1.77 to 1 in 2010.
Equipment Operations in U.S. and CanadaThe equipment operations in the U.S. and Canada had an operating profit of $2,898 million in 2011, compared with $2,302 million in 2010. The increase was due to higher shipment volumes and improved price realization, partially offset by increased raw material costs, higher manufacturing overhead costs related to new products, increased selling, administrative and general expenses and higher research and development expenses. Net sales increased 17 percent primarily due to higher shipment volumes and improved price realization. The physical volume of sales increased 12 percent, compared with 2010.
Equipment Operations outside U.S. and CanadaThe equipment operations outside the U.S. and Canada had an operating profit of $941 million in 2011, compared with $607 million in 2010. The increase was primarily due to the effects of higher shipment volumes and improved price realization, partially offset by higher raw material costs, higher manufacturing overhead costs related to new products, increased selling, administrative and general expenses and higher research and development costs. Net sales were 38 percent higher primarily reflecting increased volumes and the effect of foreign currency translation. The physical volume of sales increased 30 percent, compared with 2010.
13
30409 Deere 2011.indd 3 12/16/11 2:50 PM
MARKET CONDITIONS AND OUTLOOKIn spite of an unsettled global economy, demand for the company’s products is expected to experience substantial growth in fiscal year 2012 and the company is forecasting further increases in sales and earnings as a result. Company equipment sales are projected to increase about 15 percent for the year and 16 to 18 percent for the first quarter, compared with the same periods of 2011. Included is a favorable currency transla-tion impact of about 3 percent for the first quarter and about 1 percent for the year. Net income attributable to Deere & Company for the year is anticipated to be approxi-mately $3.2 billion.Agriculture and Turf. Worldwide sales of the company’s agriculture and turf segment are forecast to increase by about 15 percent for fiscal year 2012, with a favorable currency translation impact of about 1 percent. Farmers in the world’s major markets are continuing to experience favorable incomes due to strong demand for agricultural commodities. The company’s sales are expected to benefit as well from advanced new products being launched throughout the world and major expansion projects such as those in emerging markets.
Industry farm machinery sales in the U.S. and Canada are forecast to increase 5 to 10 percent in 2012, following an increase in 2011. Overall conditions remain positive and demand continues to be strong, especially for high horsepower equipment.
Industry sales in the EU 27 nations of Western and Central Europe are forecast to be approximately the same for 2012 as a result of general economic concerns in the region. Sales in the Commonwealth of Independent States are expected to be moderately higher, after rising substantially in 2011. Sales in Asia are forecast to increase strongly again in 2012. In South America, industry sales for the year are projected to be about the same as the strong levels of 2011.
Industry sales of turf and utility equipment in the U.S. and Canada are expected to increase slightly in 2012.Construction and Forestry. Worldwide sales of the company’s construction and forestry equipment are forecast to grow by about 16 percent for fiscal year 2012, with a favorable currency translation impact of about 1 percent. The increase reflects slightly improved market conditions and improved activity outside of the U.S., including strength in Canada. Construction equipment sales to independent rental companies are expected to see further gains. The company’s sales also are expected to be supported by a range of advanced new products and by geographic expansion. After considerable growth in 2011, world forestry markets are projected to be about the same in 2012 due to weaker economic conditions in Europe.Financial Services. Fiscal year 2012 net income attributable to Deere & Company for the financial services operations is expected to be approximately $450 million. The forecast decline from 2011 is primarily due to an increase in the provision for credit losses, which is anticipated to return to a more typical level, as well as higher selling, administrative and general expenses in support of enterprise growth initiatives. Partially offsetting these items is expected growth in the credit portfolio.
SAFE HARBOR STATEMENTSafe Harbor Statement under the Private Securities Litigation Reform Act of 1995: Statements under “Overview,” “Market Conditions and Outlook” and other forward-looking statements herein that relate to future events, expectations, trends and operating periods involve certain factors that are subject to change, and important risks and uncertainties that could cause actual results to differ materially. Some of these risks and uncertainties could affect particular lines of business, while others could affect all of the company’s businesses.
The company’s agricultural equipment business is subject to a number of uncertainties including the many interrelated factors that affect farmers’ confidence. These factors include worldwide economic conditions, demand for agricultural products, world grain stocks, weather conditions (including its effects on timely planting and harvesting), soil conditions, harvest yields, prices for commodities and livestock, crop and livestock production expenses, availability of transport for crops, the growth of non-food uses for some crops (including ethanol and biodiesel production), real estate values, available acreage for farming, the land ownership policies of various govern-ments, changes in government farm programs and policies (including those in Argentina, Brazil, China, Russia and the U.S.), international reaction to such programs, global trade agreements, animal diseases and their effects on poultry, beef and pork consumption and prices, crop pests and diseases, and the level of farm product exports (including concerns about genetically modified organisms).
Factors affecting the outlook for the company’s turf and utility equipment include general economic conditions, consumer confidence, weather conditions, customer profitabil-ity, consumer borrowing patterns, consumer purchasing preferences, housing starts, infrastructure investment, spending by municipalities and golf courses, and consumable input costs.
General economic conditions, consumer spending patterns, real estate and housing prices, the number of housing starts and interest rates are especially important to sales of the company’s construction and forestry equipment. The levels of public and non-residential construction also impact the results of the company’s construction and forestry segment. Prices for pulp, paper, lumber and structural panels are important to sales of forestry equipment.
All of the company’s businesses and its reported results are affected by general economic conditions in the global markets in which the company operates, especially material changes in economic activity in these markets; customer confidence in general economic conditions; foreign currency exchange rates and their volatility, especially fluctuations in the value of the U.S. dollar; interest rates; and inflation and deflation rates. General economic conditions can affect demand for the company’s equipment as well.
Customer and company operations and results could be affected by changes in weather patterns (including the effects of dry weather in parts of the U.S. and wet weather in parts of Eastern and Western Europe); the political and social stability of the global markets in which the company operates; the effects
14
30409 Deere 2011.indd 4 12/15/11 10:24 AM
of, or response to, terrorism and security threats; wars and other conflicts and the threat thereof; and the spread of major epidemics.
Significant changes in market liquidity conditions and any failure to comply with financial covenants in credit agreements could impact access to funding and funding costs, which could reduce the company’s earnings and cash flows. Financial market conditions could also negatively impact customer access to capital for purchases of the company’s products and customer confidence and purchase decisions; borrowing and repayment practices; and the number and size of customer loan delinquen-cies and defaults. The sovereign debt crisis, in Europe or elsewhere, could negatively impact currencies, global financial markets, social and political stability, funding sources and costs, customers, and company operations and results. State debt crises also could negatively impact customers, suppliers, demand for equipment, and company operations and results. The company’s investment management activities could be impaired by changes in the equity and bond markets, which would negatively affect earnings.
Additional factors that could materially affect the company’s operations, access to capital, expenses and results include changes in and the impact of governmental trade, banking, monetary and fiscal policies, including financial regulatory reform and its effects on the consumer finance industry, derivatives, funding costs and other areas, and governmental programs in particular jurisdictions or for the benefit of certain industries or sectors (including protectionist policies and trade and licensing restrictions that could disrupt international commerce); actions by the U.S. Federal Reserve Board and other central banks; actions by the U.S. Securities and Exchange Commission (SEC), the U.S. Commodity Futures Trading Commission and other financial regulators; actions by environmental, health and safety regulatory agencies, including those related to engine emissions (in particular Interim Tier 4 and Final Tier 4 emission require-ments), carbon emissions, noise and the risk of climate change; changes in labor regulations; changes to accounting standards; changes in tax rates, estimates, and regulations; compliance with U.S. and foreign laws when expanding to new markets; and actions by other regulatory bodies including changes in laws and regulations affecting the sectors in which the company operates. Customer and company operations and results also could be affected by changes to GPS radio frequency bands or their permitted uses.
Other factors that could materially affect results include production, design and technological innovations and difficul-ties, including capacity and supply constraints and prices; the availability and prices of strategically sourced materials, components and whole goods; delays or disruptions in the company’s supply chain due to weather, natural disasters or financial hardship or the loss of liquidity by suppliers; start-up of new plants and new products; the success of new product initiatives and customer acceptance of new products; changes in customer product preferences and sales mix whether as a result of changes in equipment design to meet government regulations or for other reasons; oil and energy prices and supplies; the
availability and cost of freight; actions of competitors in the various industries in which the company competes, particularly price discounting; dealer practices especially as to levels of new and used field inventories; labor relations; acquisitions and divestitures of businesses, the integration of new businesses; the implementation of organizational changes; difficulties related to the conversion and implementation of enterprise resource planning systems that disrupt business, negatively impact supply or distribution relationships or create higher than expected costs; changes in company declared dividends and common stock issuances and repurchases.
Company results are also affected by changes in the level and funding of employee retirement benefits, changes in market values of investment assets and the level of interest rates, which impact retirement benefit costs, and significant changes in health care costs including those which may result from governmental action.
The liquidity and ongoing profitability of John Deere Capital Corporation (Capital Corporation) and other credit subsidiaries depend largely on timely access to capital to meet future cash flow requirements and fund operations and the costs associated with engaging in diversified funding activities and to fund purchases of the company’s products. If market uncertainty increases and general economic conditions worsen, funding could be unavailable or insufficient. Additionally, customer confidence levels may result in declines in credit applications and increases in delinquencies and default rates, which could materially impact write-offs and provisions for credit losses.
The company’s outlook is based upon assumptions relating to the factors described above, which are sometimes based upon estimates and data prepared by government agencies. Such estimates and data are often revised. The company, except as required by law, undertakes no obligation to update or revise its outlook, whether as a result of new developments or otherwise. Further information concerning the company and its businesses, including factors that potentially could materially affect the company’s financial results, is included in other filings with the SEC.
2010 COMPARED WITH 2009
CONSOLIDATED RESULTSWorldwide net income attributable to Deere & Company in 2010 was $1,865 million, or $4.35 per share diluted ($4.40 basic), compared with $873 million, or $2.06 per share diluted ($2.07 basic), in 2009. Included in net income for 2009 were charges of $381 million pretax ($332 million after-tax), or $.78 per share diluted and basic, related to impairment of goodwill and voluntary employee separation expenses (see Note 5). Net sales and revenues increased 13 percent to $26,005 million in 2010, compared with $23,112 million in 2009. Net sales of the equipment operations increased 14 percent in 2010 to $23,573 million from $20,756 million in 2009. The sales increase was primarily due to higher shipment volumes. The increase also included a favorable effect for foreign currency translation of 3 percent and a price increase of 2 percent. Net sales in the U.S. and Canada increased 14 percent in 2010.
15
30409 Deere 2011.indd 5 12/15/11 10:24 AM
Net sales outside the U.S. and Canada increased by 14 percent in 2010, which included a favorable effect of 5 percent for foreign currency translation.
Worldwide equipment operations had an operating profit of $2,909 million in 2010, compared with $1,365 million in 2009. The higher operating profit was primarily due to higher shipment and production volumes, improved price realization, the favorable effects of foreign currency exchange and lower raw material costs, partially offset by increased postretirement costs and higher incentive compensation expenses. The results in 2009 were also affected by a goodwill impairment charge and voluntary employee separation expenses.
The equipment operations’ net income was $1,492 million in 2010, compared with $677 million in 2009. The same operating factors mentioned above affected these results.
Net income of the company’s financial services operations attributable to Deere & Company in 2010 increased to $373 million, compared with $203 million in 2009. The increase was primarily a result of improved financing spreads and a lower provision for credit losses. Additional information is presented in the following discussion of the “Worldwide Financial Services Operations.”
The cost of sales to net sales ratio for 2010 was 73.8 percent, compared with 78.3 percent in 2009. The decrease was primarily due to higher shipment and production volumes, improved price realization, favorable effects of foreign currency exchange and lower raw material costs. A larger goodwill impairment charge and voluntary employee separation expenses affected the ratio in 2009.
Finance and interest income decreased in 2010 due to lower financing rates, partially offset by a larger average portfolio. Other income increased primarily as a result of an increase in wind energy income, higher commissions from crop insurance and higher service revenues. Research and development expenses increased primarily as a result of increased spending in support of new products including designing and producing products with engines to meet more stringent emissions regulations. Selling, administrative and general expenses increased primarily due to increased incentive compensation expenses, higher postretirement benefit costs and the effect of foreign currency translation. Interest expense decreased due to lower average borrowing rates and lower average borrowings. Other operating expenses increased primarily due to the write-down of wind energy assets classified as held for sale in 2010 (see Note 4). The equity in income of unconsolidated affiliates increased as a result of higher income from construc-tion equipment manufacturing affiliates due to increased levels of construction activity.
The company has several defined benefit pension plans and defined benefit health care and life insurance plans. The company’s postretirement benefit costs for these plans in 2010 were $658 million, compared with $312 million in 2009, primarily due to a decrease in discount rates. The long-term expected return on plan assets, which is reflected in these costs, was an expected gain of 8.2 percent in 2010 and 2009, or $883 million in 2010 and $857 million in 2009. The actual
return was a gain of $1,273 million in 2010 and $1,142 million in 2009. Total company contributions to the plans were $836 million in 2010 and $358 million in 2009, which include direct benefit payments for unfunded plans. These contributions also included voluntary contributions to total plan assets of approxi-mately $650 million in 2010 and $150 million in 2009.
BUSINESS SEGMENT AND GEOGRAPHIC AREA RESULTS
Worldwide Agriculture and Turf OperationsThe agriculture and turf segment had an operating profit of $2,790 million in 2010, compared with $1,448 million in 2009.Net sales increased 10 percent in 2010 primarily due to higher production and shipment volumes. Sales also increased due to foreign currency translation and improved price realization. The increase in operating profit was due to increased shipment and production volumes, improved price realization, the favorable effects of foreign currency exchange and lower raw material costs, partially offset by higher postretirement benefit costs and increased incentive compensation expenses. The results in 2009 were affected by a goodwill impairment charge and voluntary employee separation expenses.
Worldwide Construction and Forestry OperationsThe construction and forestry segment had an operating profit of $119 million in 2010, compared with a loss of $83 million in 2009. Net sales increased 41 percent in 2010 due to higher shipment and production volumes. The operating profit improvement in 2010 was primarily due to higher shipment and production volumes, partially offset by higher postretirement benefit costs and increased incentive compensation expenses.
Worldwide Financial Services OperationsThe operating profit of the financial services segment was $499 million in 2010, compared with $242 million in 2009. The increase in operating profit was primarily due to improved financing spreads and a lower provision for credit losses. Total revenues of the financial services operations, including intercompany revenues, increased 1 percent in 2010, primarily reflecting the larger portfolio. The average balance of receiv-ables and leases financed was 5 percent higher in 2010, compared with 2009. Interest expense decreased 28 percent in 2010 as a result of lower borrowing rates and lower average borrowings. The financial services operations’ ratio of earnings to fixed charges was 1.77 to 1 in 2010, compared with 1.26 to 1 in 2009.
Equipment Operations in U.S. and CanadaThe equipment operations in the U.S. and Canada had an operating profit of $2,302 million in 2010, compared with $1,129 million in 2009. The increase was due to higher shipment and production volumes, improved price realization and lower raw material costs, partially offset by increased postretirement benefit costs and higher incentive compensation expenses. The operating profit in 2009 was affected by a goodwill impairment charge and voluntary employee separation expenses. Net sales increased 14 percent primarily due to higher volumes and improved price realization. The physical volume increased 10 percent, compared with 2009.
16
30409 Deere 2011.indd 6 12/15/11 10:24 AM
Equipment Operations outside U.S. and CanadaThe equipment operations outside the U.S. and Canada had an operating profit of $607 million in 2010, compared with $236 million in 2009. The increase was primarily due to the effects of higher shipment and production volumes, the favorable effects of foreign currency exchange rates, improved price realization and decreases in raw material costs, partially offset by higher incentive compensation expenses. Net sales were 14 percent higher primarily reflecting increased volumes and the effect of foreign currency translation. The physical volume increased 8 percent, compared with 2009.
CAPITAL RESOURCES AND LIQUIDITY
The discussion of capital resources and liquidity has been organized to review separately, where appropriate, the company’s consolidated totals, equipment operations and financial services operations.CONSOLIDATEDPositive cash flows from consolidated operating activities in 2011 were $2,326 million. This resulted primarily from net income adjusted for non-cash provisions, an increase in accounts payable and accrued expenses and an increase in the net retirement benefits liability, which were partially offset by an increase in inventories and trade receivables. Cash outflows from investing activities were $2,621 million in 2011, primarily due to the cost of receivables (excluding receivables related to sales) and equipment on operating leases exceeding the collec-tions of receivables and the proceeds from sales of equipment on operating leases by $1,746 million, purchases of property and equipment of $1,057 million and purchases exceeding maturities and sales of marketable securities by $555 million, partially offset by proceeds from the sales of businesses of $911 million (see Note 4). Cash inflows from financing activities were $140 million in 2011 primarily due to an increase in borrowings of $2,208 million and proceeds from issuance of common stock of $170 million (resulting from the exercise of stock options), partially offset by repurchases of common stock of $1,667 million and dividends paid of $593 million. Cash and cash equivalents decreased $143 million during 2011.
Over the last three years, operating activities have provided an aggregate of $6,593 million in cash. In addition, increases in borrowings were $2,977 million, proceeds from sales of businesses were $946 million, proceeds from issuance of common stock were $316 million and proceeds from maturities and sales of marketable securities exceeded purchases by $216 million. The aggregate amount of these cash flows was used mainly to acquire receivables (excluding receivables related to sales) and equipment on operating leases that exceeded collections and the proceeds from sales of equipment on operating leases by $3,029 million, purchase property and equipment of $2,725 million, repurchase common stock of $2,029 million, pay dividends to stockholders of $1,550 million and acquire businesses for $156 million. Cash and cash equiva-lents increased $1,436 million over the three-year period.
Given the continued uncertainty in the global economy, there has been a reduction in liquidity in some global markets that continues to affect the funding activities of the company.
However, the company has access to most global markets at a reasonable cost and expects to have sufficient sources of global funding and liquidity to meet its funding needs. Sources of liquidity for the company include cash and cash equivalents, marketable securities, funds from operations, the issuance of commercial paper and term debt, the securitization of retail notes (both public and private markets) and committed and uncommitted bank lines of credit. The company’s commercial paper outstanding at October 31, 2011 and 2010 was $1,279 million and $2,028 million, respectively, while the total cash and cash equivalents and marketable securities position was $4,435 million and $4,019 million, respectively. The amount of the total cash and cash equivalents and marketable securities held by foreign subsidiaries, in which earnings are considered indefinitely reinvested, was $720 million and $611 million at October 31, 2011 and 2010, respectively.
Lines of Credit. The company also has access to bank lines of credit with various banks throughout the world. Worldwide lines of credit totaled $5,080 million at October 31, 2011, $3,721 million of which were unused. For the purpose of computing unused credit lines, commercial paper and short-term bank borrowings, excluding secured borrowings and the current portion of long-term borrowings, were primarily considered to constitute utilization. Included in the total credit lines at October 31, 2011 was a long-term credit facility agreement of $2,750 million, expiring in April 2015, and a long-term credit facility agreement of $1,500 million, expiring in April 2013. These credit agreements require Capital Corporation to maintain its consolidated ratio of earnings to fixed charges at not less than 1.05 to 1 for each fiscal quarter and the ratio of senior debt, excluding securitization indebtedness, to capital base (total subordinated debt and stockholder’s equity excluding accumulated other comprehensive income (loss)) at not more than 11 to 1 at the end of any fiscal quarter. The credit agree-ments also require the equipment operations to maintain a ratio of total debt to total capital (total debt and stockholders’ equity excluding accumulated other comprehensive income (loss)) of 65 percent or less at the end of each fiscal quarter. Under this provision, the company’s excess equity capacity and retained earnings balance free of restriction at October 31, 2011 was $8,503 million. Alternatively under this provision, the equip-ment operations had the capacity to incur additional debt of $15,791 million at October 31, 2011. All of these requirements of the credit agreements have been met during the periods included in the consolidated financial statements.
Debt Ratings. To access public debt capital markets, the company relies on credit rating agencies to assign short-term and long-term credit ratings to the company’s securities as an indicator of credit quality for fixed income investors. A security rating is not a recommendation by the rating agency to buy, sell or hold company securities. A credit rating agency may change or withdraw company ratings based on its assessment of the company’s current and future ability to meet interest and principal repayment obligations. Each agency’s rating should be evaluated independently of any other rating. Lower credit ratings generally result in higher borrowing costs, including costs of derivative transactions, and reduced access to debt
17
30409 Deere 2011.indd 7 12/15/11 10:24 AM
capital markets. The senior long-term and short-term debt ratings and outlook currently assigned to unsecured company securities by the rating agencies engaged by the company are as follows: Senior Long-Term Short-Term Outlook
Moody’s Investors Service, Inc. ......................... A2 Prime-1 StableStandard & Poor’s .................. A A-1 Stable
Trade accounts and notes receivable primarily arise from sales of goods to independent dealers. Trade receivables decreased by $170 million in 2011. The ratio of trade accounts and notes receivable at October 31 to fiscal year net sales was 11 percent in 2011 and 15 percent in 2010. Total worldwide agriculture and turf receivables decreased $311 million and construction and forestry receivables increased $141 million. The collection period for trade receivables averages less than 12 months. The percentage of trade receivables outstanding for a period exceeding 12 months was 3 percent at October 31, 2011 and 2010.
Deere & Company’s stockholders’ equity was $6,800 million at October 31, 2011, compared with $6,290 million at October 31, 2010. The increase of $510 million resulted primarily from net income attributable to Deere & Company of $2,800 million and an increase in common stock of $145 million, which were partially offset by an increase in treasury stock of $1,503 million, dividends declared of $634 million and a change in the retirement benefits adjustment of $338 million.EQUIPMENT OPERATIONSThe company’s equipment businesses are capital intensive and are subject to seasonal variations in financing requirements for inventories and certain receivables from dealers. The equipment operations sell a significant portion of their trade receivables to financial services. To the extent necessary, funds provided from operations are supplemented by external financing sources.
Cash provided by operating activities of the equipment operations during 2011, including intercompany cash flows, was $2,998 million primarily due to net income adjusted for non-cash provisions, an increase in accounts payable and accrued expenses and an increase in the net retirement benefits liability, partially offset by an increase in inventories and trade receivables.
Over the last three years, these operating activities, including intercompany cash flows, have provided an aggregate of $6,968 million in cash.
Trade receivables held by the equipment operations increased by $94 million during 2011. The equipment opera-tions sell a significant portion of their trade receivables to financial services (see previous consolidated discussion).
Inventories increased by $1,308 million in 2011 primarily reflecting the increase in production and sales. Most of these inventories are valued on the last-in, first-out (LIFO) method. The ratios of inventories on a first-in, first-out (FIFO) basis (see Note 15), which approximates current cost, to fiscal year cost of sales were 27 percent and 26 percent at October 31, 2011 and 2010, respectively.
Total interest-bearing debt of the equipment operations was $3,696 million at the end of 2011, compared with $3,414 million at the end of 2010 and $3,563 million at the end of 2009. The ratio of total debt to total capital (total interest-bearing debt and stockholders’ equity) at the end of 2011, 2010 and 2009 was 35 percent, 35 percent and 43 percent, respectively.
Property and equipment cash expenditures for the equipment operations in 2011 were $1,054 million, compared with $736 million in 2010. Capital expenditures in 2012 are estimated to be $1,200 million to $1,300 million.FINANCIAL SERVICESThe financial services operations rely on their ability to raise substantial amounts of funds to finance their receivable and lease portfolios. Their primary sources of funds for this purpose are a combination of commercial paper, term debt, securitization of retail notes, equity capital and from time to time borrowings from Deere & Company.
The cash provided by operating activities and financing activities was used for investing activities. Cash flows from the financial services’ operating activities, including intercompany cash flows, were $1,065 million in 2011. Cash used by investing activities totaled $3,231 million in 2011, primarily due to the cost of receivables (excluding trade and wholesale) and cost of equipment on operating leases exceeding collections of these receivables and the proceeds from sales of equipment on operating leases by $2,580 million and an increase in trade receivables and wholesale notes of $562 million. Cash provided by financing activities totaled $2,170 million in 2011, representing primarily an increase in external borrowings of $1,920 million and borrowings from Deere & Company of $553 million, partially offset by $340 million of dividends paid to Deere & Company. Cash and cash equivalents increased $17 million.
Over the last three years, the financial services operating activities, including intercompany cash flows, have provided $3,236 million in cash. In addition, an increase in total borrowings of $2,798 million and capital investment from Deere & Company of $173 million provided cash inflows. These amounts have been used mainly to fund receivables (excluding trade and wholesale) and equipment on operating lease acquisitions, which exceeded collections and the proceeds from sales of equipment on operating leases by $4,564 million, fund an increase in trade receivables and wholesale notes of $1,552 million, pay dividends to Deere & Company of $557 million and fund purchases of property and equipment of $147 million. Cash and cash equivalents decreased $717 million over the three-year period.
Receivables and equipment on operating leases increased by $2,945 million in 2011, compared with 2010. Total acquisi-tion volumes of receivables (excluding trade and wholesale notes) and cost of equipment on operating leases increased 12 percent in 2011, compared with 2010. The volumes of financing leases, retail notes, operating leases and revolving charge accounts increased approximately 20 percent, 14 percent, 12 percent, and 10 percent, respectively, while operating loans decreased 9 percent. The amount of wholesale notes increased 33 percent and trade receivables decreased 6 percent during 2011.
18
30409 Deere 2011.indd 8 12/15/11 10:24 AM
At October 31, 2011 and 2010, net receivables and leases administered, which include receivables administered but not owned, were $27,918 million and $25,029 million, respectively.
Total external interest-bearing debt of the financial services operations was $22,894 million at the end of 2011, compared with $20,935 million at the end of 2010 and $20,988 million at the end of 2009. Total external borrowings have changed generally corresponding with the level of the receivable and lease portfolio, the level of cash and cash equivalents and the change in payables owed to Deere & Company. The financial services operations’ ratio of total interest-bearing debt to total stockholder’s equity was 7.5 to 1 at the end of 2011, 7.1 to 1 at the end of 2010 and 7.2 to 1 at the end of 2009.
At October 31, 2011, Capital Corporation had a revolving credit agreement to utilize bank conduit facilities to securitize retail notes with a total capacity, or “financing limit,” of up to $2,000 million of secured financings at any time. After a three-year revolving period, unless the banks and Capital Corporation agree to renew, Capital Corporation would liquidate the secured borrowings over time as payments on the retail notes are collected. At October 31, 2011, $1,384 million of secured short-term borrowings was outstanding under the agreement. During November 2011, the agreement was renewed and the capacity of the agreement was increased to $2,750 million.
In April 2011, the financial services operations entered into a $1,106 million public retail note securitization transac-tion. During 2011, the financial services operations also issued $5,586 million and retired $3,209 million of long-term borrowings, which were primarily medium-term notes.
OFF-BALANCE-SHEET ARRANGEMENTS
At October 31, 2011, the company had approximately $230 million of guarantees issued primarily to banks outside the U.S. related to third-party receivables for the retail financing of John Deere equipment. The company may recover a portion of any required payments incurred under these agreements from repossession of the equipment collateralizing the receivables. The maximum remaining term of the receivables guaranteed at October 31, 2011 was approximately five years.
AGGREGATE CONTRACTUAL OBLIGATIONS
The payment schedule for the company’s contractual obligations at October 31, 2011 in millions of dollars is as follows:
Less More than 2&3 4&5 than Total 1 year years years 5 years
On-balance-sheetDebt* Equipment operations ..... $ 3,666 $ 528 $ 990 $ 42 $ 2,106 Financial services** ....... 22,478 7,720 8,500 3,073 3,185
Total ......................... 26,144 8,248 9,490 3,115 5,291Interest relating to debt ...... 3,740 748 798 590 1,604Accounts payable .............. 2,942 2,819 83 36 4Capital leases .................... 30 5 8 3 14
(continued)
Less More than 2&3 4&5 than Total 1 year years years 5 years
Off-balance-sheetPurchase obligations .......... $ 3,703 $ 3,672 $ 21 $ 10 Operating leases ................ 435 139 164 73 $ 59
Total ................................ $ 36,994 $ 15,631 $ 10,564 $ 3,827 $ 6,972
* Principal payments.** Notes payable of $2,777 million classified as short-term on the balance sheet
related to the securitization of retail notes are included in this table based on the expected payment schedule (see Note 18).
The previous table does not include unrecognized tax benefit liabilities of approximately $199 million at October 31, 2011 since the timing of future payments is not reasonably estimable at this time (see Note 8). For additional information regarding pension and other postretirement employee benefit obligations, short-term borrowings, long-term borrowings and lease obligations, see Notes 7, 18, 20 and 21, respectively.
CRITICAL ACCOUNTING POLICIES
The preparation of the company’s consolidated financial statements in conformity with accounting principles generally accepted in the U.S. requires management to make estimates and assumptions that affect reported amounts of assets, liabilities, revenues and expenses. Changes in these estimates and assump-tions could have a significant effect on the financial statements. The accounting policies below are those management believes are the most critical to the preparation of the company’s financial statements and require the most difficult, subjective or complex judgments. The company’s other accounting policies are described in the Notes to the Consolidated Financial Statements.
Sales IncentivesAt the time a sale to a dealer is recognized, the company records an estimate of the future sales incentive costs for allowances and financing programs that will be due when the dealer sells the equipment to a retail customer. The estimate is based on historical data, announced incentive programs, field inventory levels and retail sales volumes. The final cost of these programs and the amount of accrual required for a specific sale are fully determined when the dealer sells the equipment to the retail customer. This is due to numerous programs available at any particular time and new programs that may be announced after the company records the sale. Changes in the mix and types of programs affect these estimates, which are reviewed quarterly.
The sales incentive accruals at October 31, 2011, 2010 and 2009 were $1,122 million, $879 million and $806 million, respectively. The increases in 2011 and 2010 were primarily due to higher sales volumes.
The estimation of the sales incentive accrual is impacted by many assumptions. One of the key assumptions is the historical percent of sales incentive costs to retail sales from dealers. Over the last five fiscal years, this percent has varied by an average of approximately plus or minus .6 percent, compared to the average sales incentive costs to retail sales percent during that period. Holding other assumptions constant,
19
30409 Deere 2011.indd 9 12/16/11 2:50 PM
if this estimated cost experience percent were to increase or decrease .6 percent, the sales incentive accrual at October 31, 2011 would increase or decrease by approximately $35 million.
Product WarrantiesAt the time a sale to a dealer is recognized, the company records the estimated future warranty costs. The company generally determines its total warranty liability by applying historical claims rate experience to the estimated amount of equipment that has been sold and is still under warranty based on dealer inventories and retail sales. The historical claims rate is primarily determined by a review of five-year claims costs and consideration of current quality developments. Variances in claims experience and the type of warranty programs affect these estimates, which are reviewed quarterly.
The product warranty accruals, excluding extended warranty unamortized premiums, at October 31, 2011, 2010 and 2009 were $662 million, $559 million and $513 million, respectively. The changes were primarily due to higher sales volumes in 2011 and 2010.
Estimates used to determine the product warranty accruals are significantly affected by the historical percent of warranty claims costs to sales. Over the last five fiscal years, this percent has varied by an average of approximately plus or minus .05 percent, compared to the average warranty costs to sales percent during that period. Holding other assumptions constant, if this estimated cost experience percent were to increase or decrease .05 percent, the warranty accrual at October 31, 2011 would increase or decrease by approximately $20 million.
Postretirement Benefit ObligationsPension obligations and other postretirement employee benefit (OPEB) obligations are based on various assumptions used by the company’s actuaries in calculating these amounts. These assumptions include discount rates, health care cost trend rates, expected return on plan assets, compensation increases, retirement rates, mortality rates and other factors. Actual results that differ from the assumptions and changes in assumptions affect future expenses and obligations.
The pension liabilities, net of pension assets, recognized on the balance sheet at October 31, 2011, 2010 and 2009 were $1,373 million, $693 million and $1,307 million, respectively. The OPEB liabilities, net of OPEB assets, on these same dates were $5,193 million, $4,830 million and $4,652 million, respectively. The increase in pension net liabilities in 2011 was primarily due to a decrease in discount rates, partially offset by the return on plan assets. The decrease in the pension net liabilities in 2010 was primarily due to the return on plan assets and company contributions, partially offset by a decrease in discount rates. The increases in the OPEB net liabilities in 2011 and 2010 were primarily due to the decreases in discount rates.
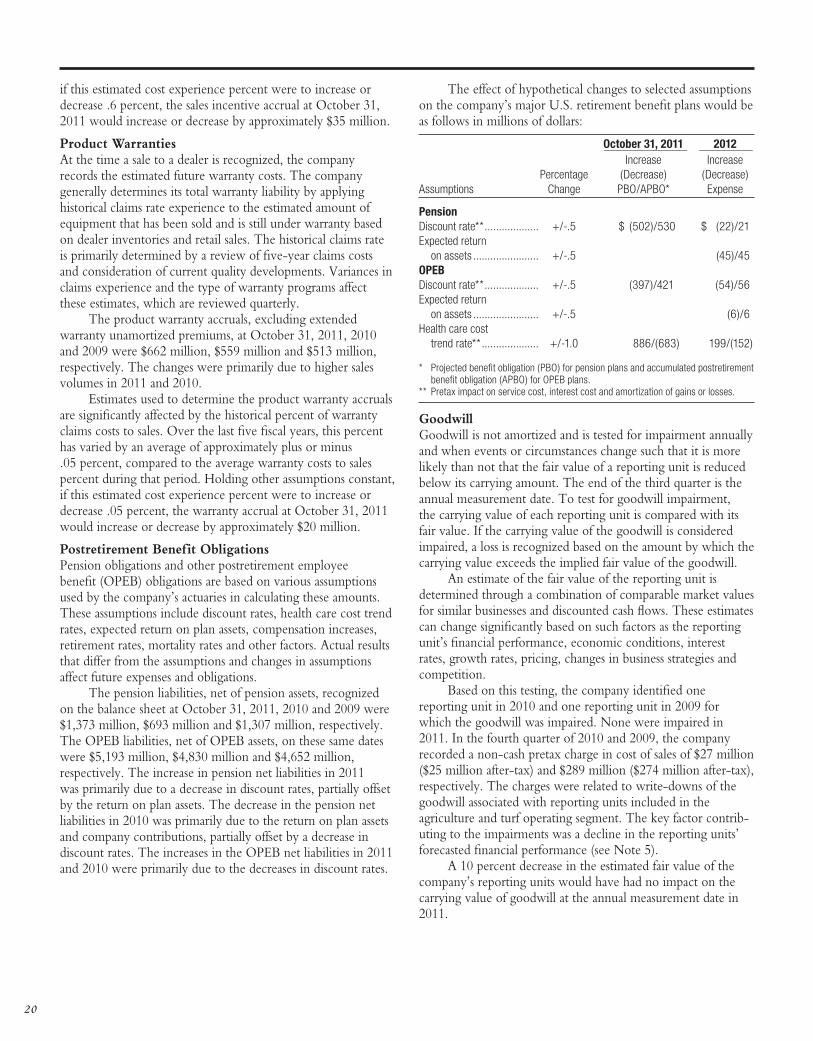
The effect of hypothetical changes to selected assumptions on the company’s major U.S. retirement benefit plans would be as follows in millions of dollars:
October 31, 2011 2012 ______________ _________ Increase Increase Percentage (Decrease) (Decrease)Assumptions Change PBO/APBO* Expense
PensionDiscount rate** ................... +/-.5 $ (502)/530 $ (22)/21Expected return on assets ....................... +/-.5 (45)/45OPEBDiscount rate** ................... +/-.5 (397)/421 (54)/56Expected return on assets ....................... +/-.5 (6)/6Health care cost trend rate** .................... +/-1.0 886/(683) 199/(152)
* Projected benefit obligation (PBO) for pension plans and accumulated postretirement benefit obligation (APBO) for OPEB plans.
** Pretax impact on service cost, interest cost and amortization of gains or losses.
GoodwillGoodwill is not amortized and is tested for impairment annually and when events or circumstances change such that it is more likely than not that the fair value of a reporting unit is reduced below its carrying amount. The end of the third quarter is the annual measurement date. To test for goodwill impairment, the carrying value of each reporting unit is compared with its fair value. If the carrying value of the goodwill is considered impaired, a loss is recognized based on the amount by which the carrying value exceeds the implied fair value of the goodwill.
An estimate of the fair value of the reporting unit is determined through a combination of comparable market values for similar businesses and discounted cash flows. These estimates can change significantly based on such factors as the reporting unit’s financial performance, economic conditions, interest rates, growth rates, pricing, changes in business strategies and competition.
Based on this testing, the company identified one reporting unit in 2010 and one reporting unit in 2009 for which the goodwill was impaired. None were impaired in 2011. In the fourth quarter of 2010 and 2009, the company recorded a non-cash pretax charge in cost of sales of $27 million ($25 million after-tax) and $289 million ($274 million after-tax), respectively. The charges were related to write-downs of the goodwill associated with reporting units included in the agriculture and turf operating segment. The key factor contrib-uting to the impairments was a decline in the reporting units’ forecasted financial performance (see Note 5).
A 10 percent decrease in the estimated fair value of the company’s reporting units would have had no impact on the carrying value of goodwill at the annual measurement date in 2011.
20
30409 Deere 2011.indd 10 12/15/11 10:24 AM
creating speculative positions or trading. The company’s financial services manage the relationship of the types and amounts of their funding sources to their receivable and lease portfolio in an effort to diminish risk due to interest rate and foreign currency fluctuations, while responding to favorable financing opportunities. Accordingly, from time to time, these operations enter into interest rate swap agreements to manage their interest rate exposure. The company also has foreign currency exposures at some of its foreign and domestic opera-tions related to buying, selling and financing in currencies other than the local currencies. The company has entered into agreements related to the management of these foreign currency transaction risks.Interest Rate RiskQuarterly, the company uses a combination of cash flow models to assess the sensitivity of its financial instruments with interest rate exposure to changes in market interest rates. The models calculate the effect of adjusting interest rates as follows. Cash flows for financing receivables are discounted at the current prevailing rate for each receivable portfolio. Cash flows for marketable securities are primarily discounted at the applicable benchmark yield curve plus market credit spreads. Cash flows for unsecured borrowings are discounted at the applicable benchmark yield curve plus market credit spreads for similarly rated borrowers. Cash flows for securitized borrowings are discounted at the swap yield curve plus a market credit spread for similarly rated borrowers. Cash flows for interest rate swaps are projected and discounted using forward rates from the swap yield curve at the repricing dates. The net loss in these financial instruments’ fair values which would be caused by increasing the interest rates by 10 percent from the market rates at October 31, 2011 would have been approximately $42 million. The net loss from decreasing the interest rates by 10 percent at October 31, 2010 would have been approximately $3 million.
Foreign Currency RiskIn the equipment operations, the company’s practice is to hedge significant currency exposures. Worldwide foreign currency exposures are reviewed quarterly. Based on the equipment operations’ anticipated and committed foreign currency cash inflows, outflows and hedging policy for the next twelve months, the company estimates that a hypothetical 10 percent strengthening of the U.S. dollar relative to other currencies through 2012 would decrease the 2012 expected net cash inflows by $19 million. At October 31, 2010, a hypothetical 10 percent weakening of the U.S. dollar under similar assump-tions and calculations indicated a potential $15 million adverse effect on the 2011 net cash inflows.
In the financial services operations, the company’s policy is to hedge the foreign currency risk if the currency of the borrowings does not match the currency of the receivable portfolio. As a result, a hypothetical 10 percent adverse change in the value of the U.S. dollar relative to all other foreign currencies would not have a material effect on the financial services cash flows.
Allowance for Credit LossesThe allowance for credit losses represents an estimate of the losses expected from the company’s receivable portfolio. The level of the allowance is based on many quantitative and qualitative factors, including historical loss experience by product category, portfolio duration, delinquency trends, economic conditions and credit risk quality. The adequacy of the allowance is assessed quarterly. Different assumptions or changes in economic conditions would result in changes to the allowance for credit losses and the provision for credit losses.
The total allowance for credit losses at October 31, 2011, 2010 and 2009 was $269 million, $296 million and $316 million, respectively. The decreases in 2011 and 2010 were primarily due to decreases in loss experience.
The assumptions used in evaluating the company’s exposure to credit losses involve estimates and significant judgment. The historical loss experience on the receivable portfolio represents one of the key assumptions involved in determining the allowance for credit losses. Over the last five fiscal years, this percent has varied by an average of approxi-mately plus or minus .18 percent, compared to the average loss experience percent during that period. Holding other assumptions constant, if this estimated loss experience on the receivable portfolio were to increase or decrease .18 percent, the allowance for credit losses at October 31, 2011 would increase or decrease by approximately $50 million.
Operating Lease Residual ValuesThe carrying value of equipment on operating leases is affected by the estimated fair values of the equipment at the end of the lease (residual values). Upon termination of the lease, the equipment is either purchased by the lessee or sold to a third party, in which case the company may record a gain or a loss for the difference between the estimated residual value and the sales price. The residual values are dependent on current economic conditions and are reviewed quarterly. Changes in residual value assumptions would affect the amount of deprecia-tion expense and the amount of investment in equipment on operating leases.
The total operating lease residual values at October 31, 2011, 2010 and 2009 were $1,425 million, $1,276 million and $1,128 million, respectively. The changes in 2011 and 2010 were primarily due to the increasing levels of operating leases.
Estimates used in determining end of lease market values for equipment on operating leases significantly impact the amount and timing of depreciation expense. If future market values for this equipment were to decrease 10 percent from the company’s present estimates, the total impact would be to increase the company’s annual depreciation for equipment on operating leases by approximately $50 million.
FINANCIAL INSTRUMENT MARKET RISK INFORMATION
The company is naturally exposed to various interest rate and foreign currency risks. As a result, the company enters into derivative transactions to manage certain of these exposures that arise in the normal course of business and not for the purpose of
21
30409 Deere 2011.indd 11 12/15/11 10:24 AM
MANAGEMENT’S REPORT ON INTERNAL CONTROL OVER FINANCIAL REPORTINGThe management of Deere & Company is responsible for establishing and maintaining adequate internal control over financial reporting. Deere & Company’s internal control system was designed to provide reasonable assurance regarding the preparation and fair presentation of published financial statements in accordance with generally accepted accounting principles.
All internal control systems, no matter how well designed, have inherent limitations. Therefore, even those systems determined to be effective can provide only reasonable assurance with respect to financial statement preparation and presentation in accordance with generally accepted accounting principles.
Management assessed the effectiveness of the company’s internal control over financial reporting as of October 31, 2011, using the criteria set forth in Internal Control – Integrated Framework issued by the Committee of Sponsoring Organizations of the Treadway Commission. Based on that assessment, management believes that, as of October 31, 2011, the company’s internal control over financial reporting was effective.
The company’s independent registered public accounting firm has issued an audit report on the effectiveness of the company’s internal control over financial reporting. This report appears below.
December 19, 2011
REPORT OF INDEPENDENT REGISTERED PUBLIC ACCOUNTING FIRMDeere & Company:We have audited the accompanying consolidated balance sheets of Deere & Company and subsidiaries (the “Company”) as of October 31, 2011 and 2010, and the related statements of consolidated income, changes in consolidated stockholders’ equity, and consolidated cash flows for each of the three years in the period ended October 31, 2011. We also have audited the Company’s internal control over financial reporting as of October 31, 2011, based on criteria established in Internal Control - Integrated Framework issued by the Committee of Sponsoring Organizations of the Treadway Commission. The Company’s management is responsible for these financial statements, for maintaining effective internal control over financial reporting, and for its assessment of the effectiveness of internal control over financial reporting, included in the accompanying Management’s Report on Internal Control Over Financial Reporting. Our responsibility is to express an opinion on these financial statements and an opinion on the Company’s internal control over financial reporting based on our audits.
We conducted our audits in accordance with the standards of the Public Company Accounting Oversight Board (United States). Those standards require that we plan and perform the audit to obtain reasonable assurance about whether the financial statements are free of material misstatement and whether effective internal control over financial reporting was maintained in all material respects. Our audits of the financial statements included examining, on a test basis, evidence supporting the amounts and disclosures in the financial state-ments, assessing the accounting principles used and significant estimates made by management, and evaluating the overall financial statement presentation. Our audit of internal control over financial reporting included obtaining an understanding
of internal control over financial reporting, assessing the risk that a material weakness exists, and testing and evaluating the design and operating effectiveness of internal control based on the assessed risk. Our audits also included performing such other procedures as we considered necessary in the circumstances. We believe that our audits provide a reasonable basis for our opinions.
A company’s internal control over financial reporting is a process designed by, or under the supervision of, the company’s principal executive and principal financial officers, or persons performing similar functions, and effected by the company’s board of directors, management, and other personnel to provide reasonable assurance regarding the reliability of financial reporting and the preparation of financial statements for external purposes in accordance with generally accepted accounting principles. A company’s internal control over financial reporting includes those policies and procedures that (1) pertain to the maintenance of records that, in reasonable detail, accurately and fairly reflect the transactions and dispositions of the assets of the company; (2) provide reasonable assurance that transactions are recorded as necessary to permit preparation of financial statements in accordance with generally accepted accounting principles, and that receipts and expendi-tures of the company are being made only in accordance with authorizations of management and directors of the company; and (3) provide reasonable assurance regarding prevention or timely detection of unauthorized acquisition, use, or disposition of the company’s assets that could have a material effect on the financial statements.
Because of the inherent limitations of internal control over financial reporting, including the possibility of collusion or improper management override of controls, material misstatements due to error or fraud may not be prevented or detected on a timely basis. Also, projections of any evaluation of the effectiveness of the internal control over financial reporting to future periods are subject to the risk that the controls may become inadequate because of changes in conditions, or that the degree of compliance with the policies or procedures may deteriorate.
In our opinion, the consolidated financial statements referred to above present fairly, in all material respects, the financial position of the Company as of October 31, 2011 and 2010, and the results of their operations and their cash flows for each of the three years in the period ended October 31, 2011, in conformity with accounting principles generally accepted in the United States of America. Also in our opinion, the Company maintained, in all material respects, effective internal control over financial reporting as of October 31, 2011, based on the criteria established in Internal Control – Integrated Framework issued by the Committee of Sponsoring Organizations of the Treadway Commission.
Deloitte & Touche LLPChicago, IllinoisDecember 19, 2011
22
30409 Deere 2011.indd 12 12/15/11 10:24 AM
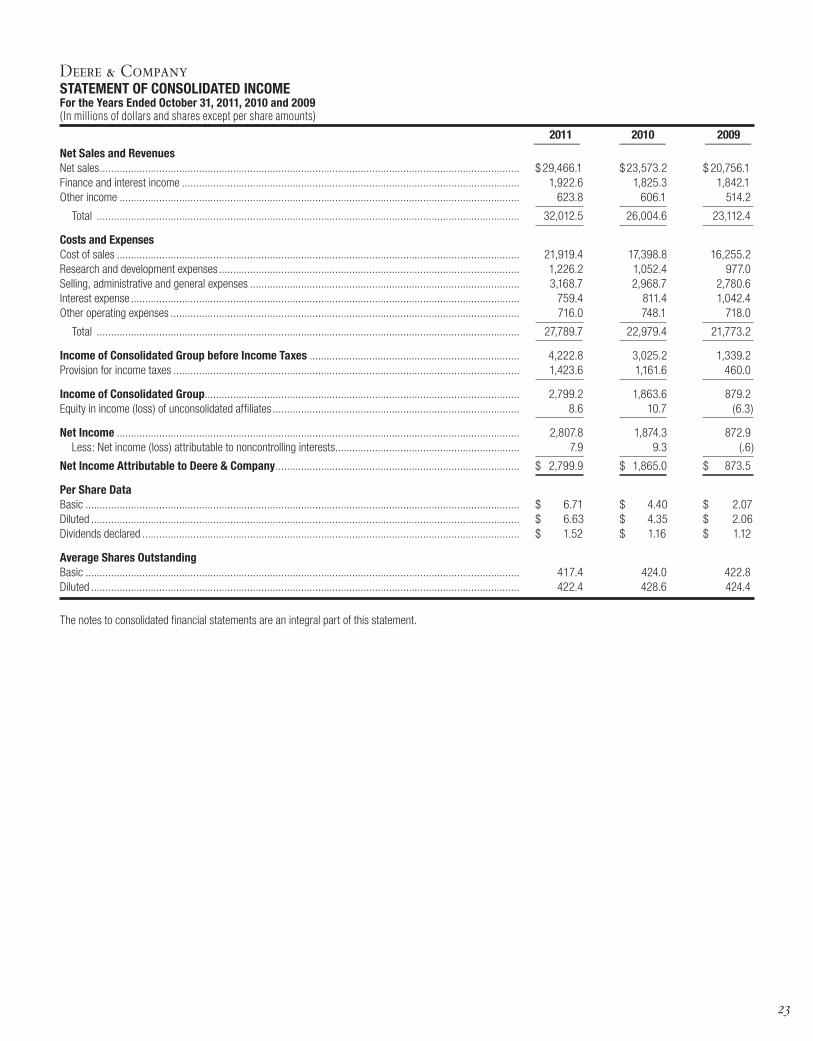
STATEMENT OF CONSOLIDATED INCOMEFor the Years Ended October 31, 2011, 2010 and 2009(In millions of dollars and shares except per share amounts)
2011 2010 2009 _______ _______ _______Net Sales and RevenuesNet sales .................................................................................................................................................... $ 29,466.1 $ 23,573.2 $ 20,756.1Finance and interest income ....................................................................................................................... 1,922.6 1,825.3 1,842.1Other income ............................................................................................................................................. 623.8 606.1 514.2
Total ..................................................................................................................................................... 32,012.5 26,004.6 23,112.4
Costs and ExpensesCost of sales .............................................................................................................................................. 21,919.4 17,398.8 16,255.2Research and development expenses .......................................................................................................... 1,226.2 1,052.4 977.0Selling, administrative and general expenses ............................................................................................... 3,168.7 2,968.7 2,780.6Interest expense ......................................................................................................................................... 759.4 811.4 1,042.4Other operating expenses ........................................................................................................................... 716.0 748.1 718.0
Total ..................................................................................................................................................... 27,789.7 22,979.4 21,773.2
Income of Consolidated Group before Income Taxes .......................................................................... 4,222.8 3,025.2 1,339.2Provision for income taxes .......................................................................................................................... 1,423.6 1,161.6 460.0
Income of Consolidated Group............................................................................................................... 2,799.2 1,863.6 879.2Equity in income (loss) of unconsolidated affiliates ....................................................................................... 8.6 10.7 (6.3)
Net Income .............................................................................................................................................. 2,807.8 1,874.3 872.9 Less: Net income (loss) attributable to noncontrolling interests................................................................. 7.9 9.3 (.6)
Net Income Attributable to Deere & Company ...................................................................................... $ 2,799.9 $ 1,865.0 $ 873.5
Per Share DataBasic ......................................................................................................................................................... $ 6.71 $ 4.40 $ 2.07Diluted ....................................................................................................................................................... $ 6.63 $ 4.35 $ 2.06Dividends declared ..................................................................................................................................... $ 1.52 $ 1.16 $ 1.12
Average Shares OutstandingBasic ......................................................................................................................................................... 417.4 424.0 422.8Diluted ....................................................................................................................................................... 422.4 428.6 424.4
The notes to consolidated financial statements are an integral part of this statement.
Deere & Company
23
30409 Deere 2011.indd 13 12/15/11 10:24 AM
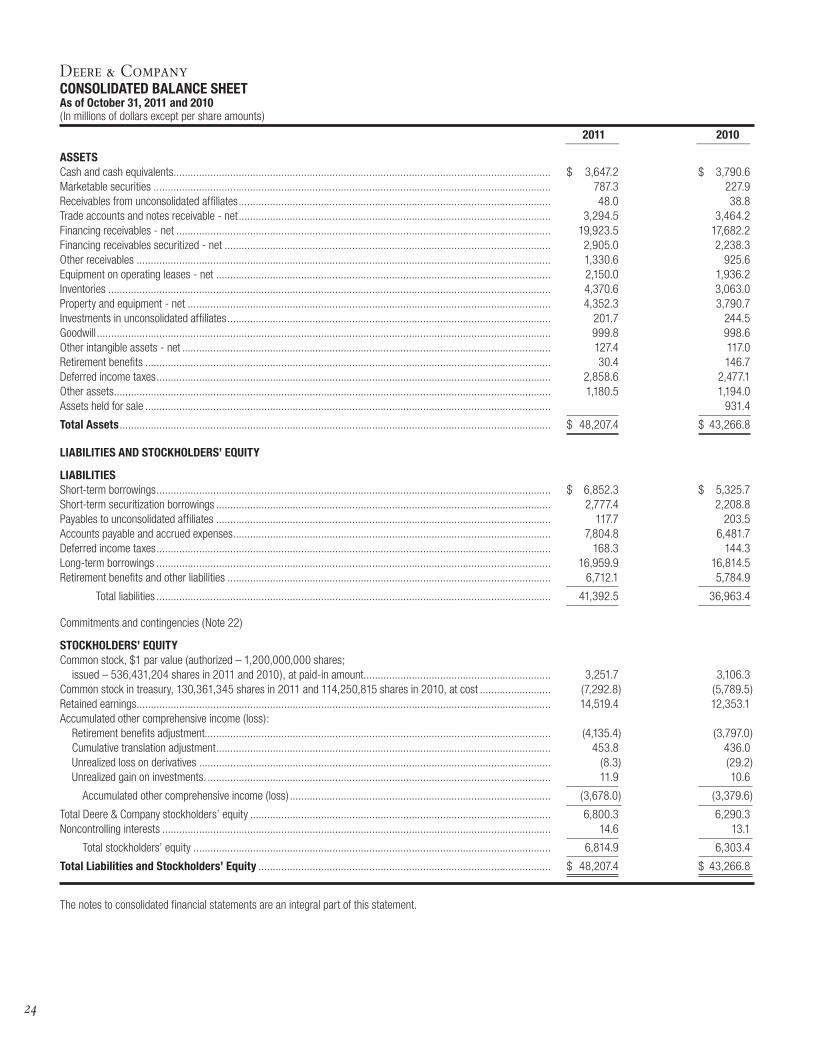
Deere & CompanyCONSOLIDATED BALANCE SHEETAs of October 31, 2011 and 2010( In millions of dollars except per share amounts)
2011 2010 _________ _________
ASSETSCash and cash equivalents..................................................................................................................................... $ 3,647.2 $ 3,790.6Marketable securities ............................................................................................................................................ 787.3 227.9Receivables from unconsolidated affiliates .............................................................................................................. 48.0 38.8Trade accounts and notes receivable - net .............................................................................................................. 3,294.5 3,464.2Financing receivables - net .................................................................................................................................... 19,923.5 17,682.2Financing receivables securitized - net ................................................................................................................... 2,905.0 2,238.3Other receivables .................................................................................................................................................. 1,330.6 925.6Equipment on operating leases - net ...................................................................................................................... 2,150.0 1,936.2Inventories ............................................................................................................................................................ 4,370.6 3,063.0Property and equipment - net ................................................................................................................................ 4,352.3 3,790.7Investments in unconsolidated affiliates .................................................................................................................. 201.7 244.5Goodwill ................................................................................................................................................................ 999.8 998.6Other intangible assets - net .................................................................................................................................. 127.4 117.0Retirement benefits ............................................................................................................................................... 30.4 146.7Deferred income taxes ........................................................................................................................................... 2,858.6 2,477.1Other assets .......................................................................................................................................................... 1,180.5 1,194.0Assets held for sale ............................................................................................................................................... 931.4
Total Assets ........................................................................................................................................................ $ 48,207.4 $ 43,266.8
LIABILITIES AND STOCKHOLDERS’ EQUITY
LIABILITIESShort-term borrowings ........................................................................................................................................... $ 6,852.3 $ 5,325.7Short-term securitization borrowings ...................................................................................................................... 2,777.4 2,208.8Payables to unconsolidated affiliates ...................................................................................................................... 117.7 203.5Accounts payable and accrued expenses ................................................................................................................ 7,804.8 6,481.7Deferred income taxes ........................................................................................................................................... 168.3 144.3Long-term borrowings ........................................................................................................................................... 16,959.9 16,814.5Retirement benefits and other liabilities .................................................................................................................. 6,712.1 5,784.9
Total liabilities ........................................................................................................................................... 41,392.5 36,963.4
Commitments and contingencies (Note 22)
STOCKHOLDERS’ EQUITYCommon stock, $1 par value (authorized – 1,200,000,000 shares; issued – 536,431,204 shares in 2011 and 2010), at paid-in amount .................................................................. 3,251.7 3,106.3Common stock in treasury, 130,361,345 shares in 2011 and 114,250,815 shares in 2010, at cost ......................... (7,292.8) (5,789.5)Retained earnings .................................................................................................................................................. 14,519.4 12,353.1Accumulated other comprehensive income (loss): Retirement benefits adjustment.......................................................................................................................... (4,135.4) (3,797.0) Cumulative translation adjustment ...................................................................................................................... 453.8 436.0 Unrealized loss on derivatives ............................................................................................................................ (8.3) (29.2) Unrealized gain on investments. ......................................................................................................................... 11.9 10.6
Accumulated other comprehensive income (loss) ............................................................................................ (3,678.0) (3,379.6)
Total Deere & Company stockholders’ equity .......................................................................................................... 6,800.3 6,290.3Noncontrolling interests ......................................................................................................................................... 14.6 13.1
Total stockholders’ equity .............................................................................................................................. 6,814.9 6,303.4
Total Liabilities and Stockholders’ Equity ....................................................................................................... $ 48,207.4 $ 43,266.8
The notes to consolidated financial statements are an integral part of this statement.
24
30409 Deere 2011.indd 14 12/15/11 10:24 AM
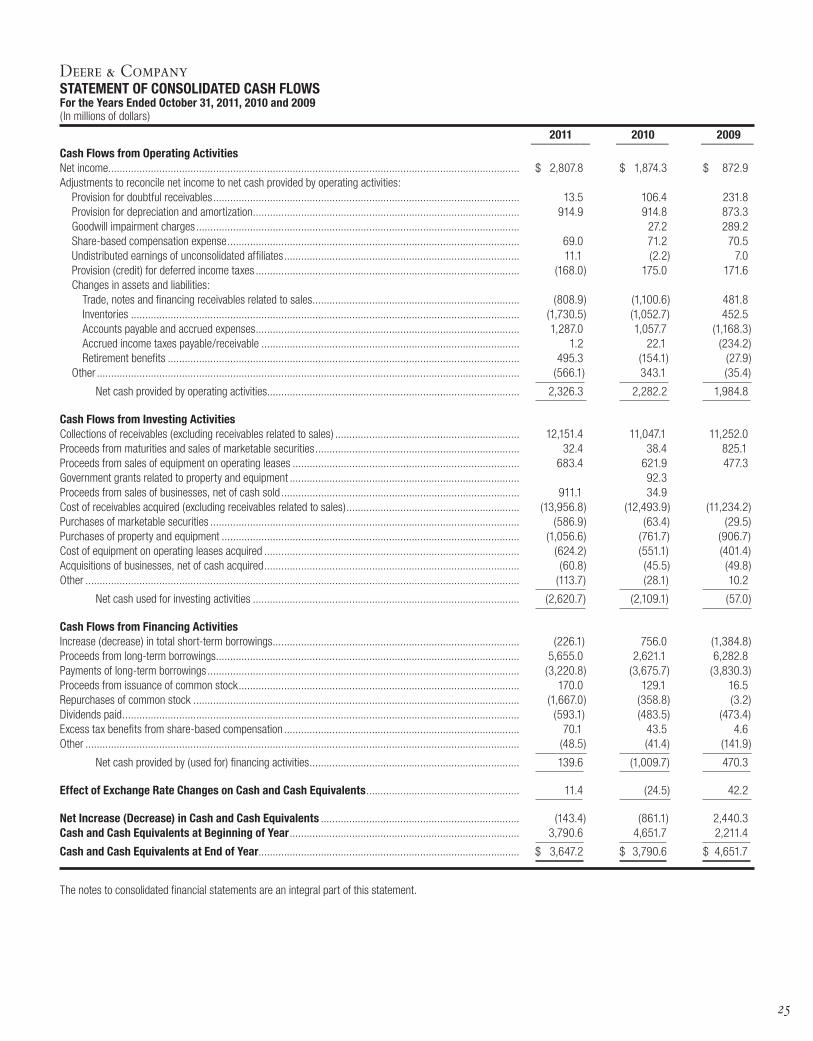
STATEMENT OF CONSOLIDATED CASH FLOWSFor the Years Ended October 31, 2011, 2010 and 2009( In millions of dollars)
2011 2010 2009 _________ ________ ________Cash Flows from Operating ActivitiesNet income ................................................................................................................................................. $ 2,807.8 $ 1,874.3 $ 872.9Adjustments to reconcile net income to net cash provided by operating activities: Provision for doubtful receivables ............................................................................................................ 13.5 106.4 231.8 Provision for depreciation and amortization .............................................................................................. 914.9 914.8 873.3 Goodwill impairment charges .................................................................................................................. 27.2 289.2 Share-based compensation expense ....................................................................................................... 69.0 71.2 70.5 Undistributed earnings of unconsolidated affiliates ................................................................................... 11.1 (2.2) 7.0 Provision (credit) for deferred income taxes ............................................................................................. (168.0) 175.0 171.6 Changes in assets and liabilities: Trade, notes and financing receivables related to sales ......................................................................... (808.9) (1,100.6) 481.8 Inventories ......................................................................................................................................... (1,730.5) (1,052.7) 452.5 Accounts payable and accrued expenses ............................................................................................. 1,287.0 1,057.7 (1,168.3) Accrued income taxes payable/receivable ........................................................................................... 1.2 22.1 (234.2) Retirement benefits ............................................................................................................................ 495.3 (154.1) (27.9) Other ..................................................................................................................................................... (566.1) 343.1 (35.4)
Net cash provided by operating activities......................................................................................... 2,326.3 2,282.2 1,984.8
Cash Flows from Investing ActivitiesCollections of receivables (excluding receivables related to sales) ................................................................. 12,151.4 11,047.1 11,252.0Proceeds from maturities and sales of marketable securities ........................................................................ 32.4 38.4 825.1Proceeds from sales of equipment on operating leases ................................................................................ 683.4 621.9 477.3Government grants related to property and equipment ................................................................................. 92.3 Proceeds from sales of businesses, net of cash sold .................................................................................... 911.1 34.9 Cost of receivables acquired (excluding receivables related to sales) ............................................................. (13,956.8) (12,493.9) (11,234.2)Purchases of marketable securities ............................................................................................................. (586.9) (63.4) (29.5)Purchases of property and equipment ......................................................................................................... (1,056.6) (761.7) (906.7)Cost of equipment on operating leases acquired .......................................................................................... (624.2) (551.1) (401.4)Acquisitions of businesses, net of cash acquired .......................................................................................... (60.8) (45.5) (49.8)Other ......................................................................................................................................................... (113.7) (28.1) 10.2
Net cash used for investing activities .............................................................................................. (2,620.7) (2,109.1) (57.0)
Cash Flows from Financing ActivitiesIncrease (decrease) in total short-term borrowings ....................................................................................... (226.1) 756.0 (1,384.8)Proceeds from long-term borrowings ........................................................................................................... 5,655.0 2,621.1 6,282.8Payments of long-term borrowings .............................................................................................................. (3,220.8) (3,675.7) (3,830.3)Proceeds from issuance of common stock ................................................................................................... 170.0 129.1 16.5Repurchases of common stock ................................................................................................................... (1,667.0) (358.8) (3.2)Dividends paid ............................................................................................................................................ (593.1) (483.5) (473.4)Excess tax benefits from share-based compensation ................................................................................... 70.1 43.5 4.6Other ......................................................................................................................................................... (48.5) (41.4) (141.9)
Net cash provided by (used for) financing activities .......................................................................... 139.6 (1,009.7) 470.3
Effect of Exchange Rate Changes on Cash and Cash Equivalents ...................................................... 11.4 (24.5) 42.2
Net Increase (Decrease) in Cash and Cash Equivalents ...................................................................... (143.4) (861.1) 2,440.3Cash and Cash Equivalents at Beginning of Year ................................................................................. 3,790.6 4,651.7 2,211.4
Cash and Cash Equivalents at End of Year............................................................................................ $ 3,647.2 $ 3,790.6 $ 4,651.7
The notes to consolidated financial statements are an integral part of this statement.
Deere & Company
25
30409 Deere 2011.indd 15 12/15/11 10:24 AM
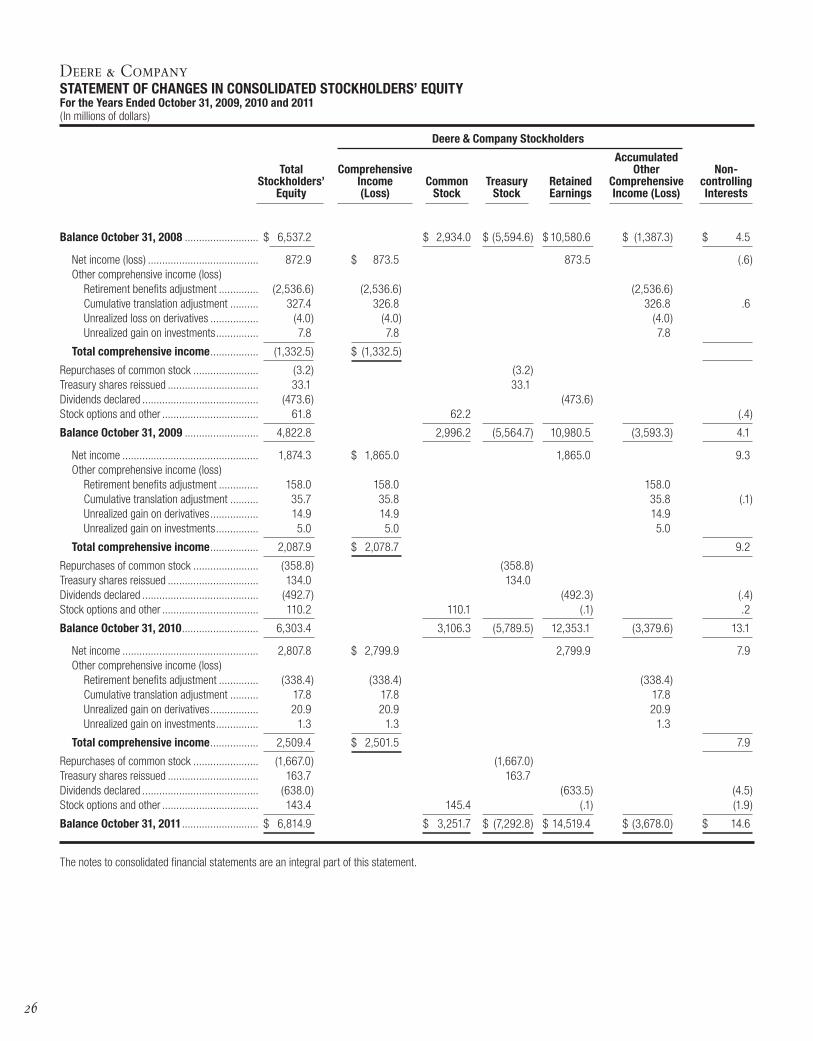
Deere & CompanySTATEMENT OF CHANGES IN CONSOLIDATED STOCKHOLDERS’ EQUITYFor the Years Ended October 31, 2009, 2010 and 2011( In millions of dollars)
Deere & Company Stockholders
Accumulated Total Comprehensive Other Non- Stockholders’ Income Common Treasury Retained Comprehensive controlling Equity (Loss) Stock Stock Earnings Income (Loss) Interests
Balance October 31, 2008 .......................... $ 6,537.2 $ 2,934.0 $ (5,594.6) $ 10,580.6 $ (1,387.3) $ 4.5
Net income (loss) ....................................... 872.9 $ 873.5 873.5 (.6) Other comprehensive income (loss) Retirement benefits adjustment .............. (2,536.6) (2,536.6) (2,536.6) Cumulative translation adjustment .......... 327.4 326.8 326.8 .6 Unrealized loss on derivatives ................. (4.0) (4.0) (4.0) Unrealized gain on investments ............... 7.8 7.8 7.8
Total comprehensive income ................. (1,332.5) $ (1,332.5)
Repurchases of common stock ....................... (3.2) (3.2)Treasury shares reissued ................................ 33.1 33.1Dividends declared ......................................... (473.6) (473.6) Stock options and other .................................. 61.8 62.2 (.4)
Balance October 31, 2009 .......................... 4,822.8 2,996.2 (5,564.7) 10,980.5 (3,593.3) 4.1
Net income ................................................ 1,874.3 $ 1,865.0 1,865.0 9.3 Other comprehensive income (loss) Retirement benefits adjustment .............. 158.0 158.0 158.0 Cumulative translation adjustment .......... 35.7 35.8 35.8 (.1) Unrealized gain on derivatives ................. 14.9 14.9 14.9 Unrealized gain on investments ............... 5.0 5.0 5.0
Total comprehensive income ................. 2,087.9 $ 2,078.7 9.2
Repurchases of common stock ....................... (358.8) (358.8)Treasury shares reissued ................................ 134.0 134.0Dividends declared ......................................... (492.7) (492.3) (.4)Stock options and other .................................. 110.2 110.1 (.1) .2
Balance October 31, 2010 ........................... 6,303.4 3,106.3 (5,789.5) 12,353.1 (3,379.6) 13.1
Net income ................................................ 2,807.8 $ 2,799.9 2,799.9 7.9 Other comprehensive income (loss) Retirement benefits adjustment .............. (338.4) (338.4) (338.4) Cumulative translation adjustment .......... 17.8 17.8 17.8 Unrealized gain on derivatives ................. 20.9 20.9 20.9 Unrealized gain on investments ............... 1.3 1.3 1.3
Total comprehensive income ................. 2,509.4 $ 2,501.5 7.9
Repurchases of common stock ....................... (1,667.0) (1,667.0)Treasury shares reissued ................................ 163.7 163.7Dividends declared ......................................... (638.0) (633.5) (4.5)Stock options and other .................................. 143.4 145.4 (.1) (1.9)
Balance October 31, 2011 ........................... $ 6,814.9 $ 3,251.7 $ (7,292.8) $ 14,519.4 $ (3,678.0) $ 14.6
The notes to consolidated financial statements are an integral part of this statement.
26
30409 Deere 2011.indd 16 12/15/11 10:24 AM
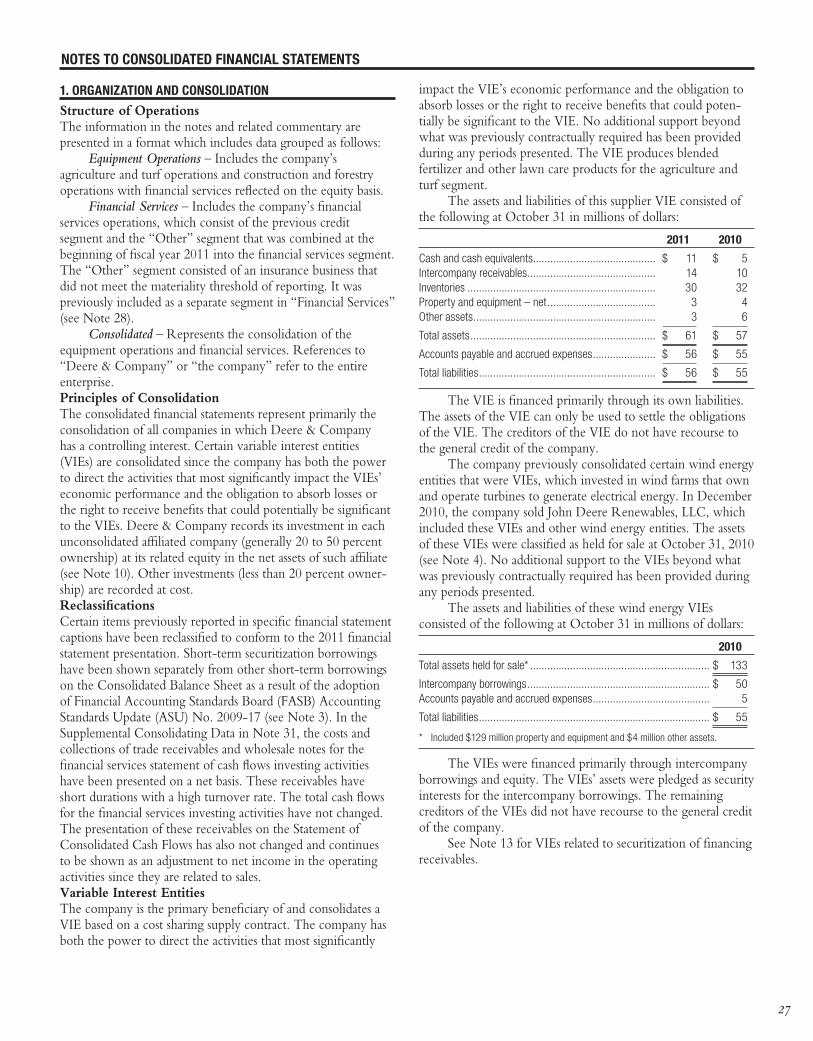
NOTES TO CONSOLIDATED FINANCIAL STATEMENTS
1. ORGANIzATION AND CONSOLIDATION
Structure of OperationsThe information in the notes and related commentary are presented in a format which includes data grouped as follows:
Equipment Operations – Includes the company’s agriculture and turf operations and construction and forestry operations with financial services reflected on the equity basis.
Financial Services – Includes the company’s financial services operations, which consist of the previous credit segment and the “Other” segment that was combined at the beginning of fiscal year 2011 into the financial services segment. The “Other” segment consisted of an insurance business that did not meet the materiality threshold of reporting. It was previously included as a separate segment in “Financial Services” (see Note 28).
Consolidated – Represents the consolidation of the equipment operations and financial services. References to “Deere & Company” or “the company” refer to the entire enterprise.Principles of ConsolidationThe consolidated financial statements represent primarily the consolidation of all companies in which Deere & Company has a controlling interest. Certain variable interest entities (VIEs) are consolidated since the company has both the power to direct the activities that most significantly impact the VIEs’ economic performance and the obligation to absorb losses or the right to receive benefits that could potentially be significant to the VIEs. Deere & Company records its investment in each unconsolidated affiliated company (generally 20 to 50 percent ownership) at its related equity in the net assets of such affiliate (see Note 10). Other investments (less than 20 percent owner-ship) are recorded at cost. ReclassificationsCertain items previously reported in specific financial statement captions have been reclassified to conform to the 2011 financial statement presentation. Short-term securitization borrowings have been shown separately from other short-term borrowings on the Consolidated Balance Sheet as a result of the adoption of Financial Accounting Standards Board (FASB) Accounting Standards Update (ASU) No. 2009-17 (see Note 3). In the Supplemental Consolidating Data in Note 31, the costs and collections of trade receivables and wholesale notes for the financial services statement of cash flows investing activities have been presented on a net basis. These receivables have short durations with a high turnover rate. The total cash flows for the financial services investing activities have not changed. The presentation of these receivables on the Statement of Consolidated Cash Flows has also not changed and continues to be shown as an adjustment to net income in the operating activities since they are related to sales.Variable Interest EntitiesThe company is the primary beneficiary of and consolidates a VIE based on a cost sharing supply contract. The company has both the power to direct the activities that most significantly
impact the VIE’s economic performance and the obligation to absorb losses or the right to receive benefits that could poten-tially be significant to the VIE. No additional support beyond what was previously contractually required has been provided during any periods presented. The VIE produces blended fertilizer and other lawn care products for the agriculture and turf segment.
The assets and liabilities of this supplier VIE consisted of the following at October 31 in millions of dollars:
2011 2010
Cash and cash equivalents ........................................... $ 11 $ 5Intercompany receivables ............................................. 14 10Inventories .................................................................. 30 32Property and equipment – net ...................................... 3 4Other assets ................................................................ 3 6
Total assets ................................................................. $ 61 $ 57
Accounts payable and accrued expenses ...................... $ 56 $ 55
Total liabilities .............................................................. $ 56 $ 55
The VIE is financed primarily through its own liabilities. The assets of the VIE can only be used to settle the obligations of the VIE. The creditors of the VIE do not have recourse to the general credit of the company.
The company previously consolidated certain wind energy entities that were VIEs, which invested in wind farms that own and operate turbines to generate electrical energy. In December 2010, the company sold John Deere Renewables, LLC, which included these VIEs and other wind energy entities. The assets of these VIEs were classified as held for sale at October 31, 2010 (see Note 4). No additional support to the VIEs beyond what was previously contractually required has been provided during any periods presented.
The assets and liabilities of these wind energy VIEs consisted of the following at October 31 in millions of dollars:
2010
Total assets held for sale* ............................................................... $ 133
Intercompany borrowings ................................................................ $ 50Accounts payable and accrued expenses ......................................... 5
Total liabilities ................................................................................. $ 55
* Included $129 million property and equipment and $4 million other assets.
The VIEs were financed primarily through intercompany borrowings and equity. The VIEs’ assets were pledged as security interests for the intercompany borrowings. The remaining creditors of the VIEs did not have recourse to the general credit of the company.
See Note 13 for VIEs related to securitization of financing receivables.
27
30409 Deere 2011.indd 17 12/15/11 10:24 AM
2. SUMMARY OF SIGNIFICANT ACCOUNTING POLICIES
The following are significant accounting policies in addition to those included in other notes to the consolidated financial statements.Use of Estimates in Financial StatementsThe preparation of financial statements in conformity with accounting principles generally accepted in the U.S. requires management to make estimates and assumptions that affect the reported amounts and related disclosures. Actual results could differ from those estimates.Revenue RecognitionSales of equipment and service parts are recorded when the sales price is determinable and the risks and rewards of ownership are transferred to independent parties based on the sales agreements in effect. In the U.S. and most international locations, this transfer occurs primarily when goods are shipped. In Canada and some other international locations, certain goods are shipped to dealers on a consignment basis under which the risks and rewards of ownership are not transferred to the dealer. Accordingly, in these locations, sales are not recorded until a retail customer has purchased the goods. In all cases, when a sale is recorded by the company, no significant uncertainty exists surrounding the purchaser’s obligation to pay. No right of return exists on sales of equipment. Service parts returns are estimable and accrued at the time a sale is recognized. The company makes appropriate provisions based on experience for costs such as doubtful receivables, sales incentives and product warranty.
Financing revenue is recorded over the lives of related receivables using the interest method. Insurance premiums recorded in other income are generally recognized in proportion to the costs expected to be incurred over the contract period. Deferred costs on the origination of financing receivables are recognized as a reduction in finance revenue over the expected lives of the receivables using the interest method. Income and deferred costs on the origination of operating leases are recog-nized on a straight-line basis over the scheduled lease terms in finance revenue.Sales IncentivesAt the time a sale is recognized, the company records an estimate of the future sales incentive costs for allowances and financing programs that will be due when a dealer sells the equipment to a retail customer. The estimate is based on historical data, announced incentive programs, field inventory levels and retail sales volumes.Product WarrantiesAt the time a sale is recognized, the company records the estimated future warranty costs. These costs are usually estimated based on historical warranty claims (see Note 22).Sales TaxesThe company collects and remits taxes assessed by different governmental authorities that are both imposed on and concurrent with revenue producing transactions between the company and its customers. These taxes may include sales, use, value-added and some excise taxes. The company reports the collection of these taxes on a net basis (excluded from revenues).
Shipping and Handling CostsShipping and handling costs related to the sales of the company’s equipment are included in cost of sales.Advertising CostsAdvertising costs are charged to expense as incurred. This expense was $163 million in 2011, $154 million in 2010 and $175 million in 2009.Depreciation and AmortizationProperty and equipment, capitalized software and other intangible assets are stated at cost less accumulated depreciation or amortization. These assets are depreciated over their esti-mated useful lives generally using the straight-line method. Equipment on operating leases is depreciated over the terms of the leases using the straight-line method. Property and equip-ment expenditures for new and revised products, increased capacity and the replacement or major renewal of significant items are capitalized. Expenditures for maintenance, repairs and minor renewals are generally charged to expense as incurred.Securitization of ReceivablesCertain financing receivables are periodically transferred to special purpose entities (SPEs) in securitization transactions (see Note 13). These securitizations qualify as collateral for secured borrowings and no gains or losses are recognized at the time of securitization. The receivables remain on the balance sheet and are classified as “Financing receivables securitized - net.” The company recognizes finance income over the lives of these receivables using the interest method. Receivables and AllowancesAll financing and trade receivables are reported on the balance sheet at outstanding principal adjusted for any charge-offs, the allowance for credit losses and doubtful accounts, and any deferred fees or costs on originated financing receivables. Allowances for credit losses and doubtful accounts are main-tained in amounts considered to be appropriate in relation to the receivables outstanding based on collection experience, economic conditions and credit risk quality. Receivables are written-off to the allowance when the account is considered uncollectible.Impairment of Long-Lived Assets, Goodwill and Other Intangible AssetsThe company evaluates the carrying value of long-lived assets (including property and equipment, goodwill and other intangible assets) when events or circumstances warrant such a review. Goodwill and intangible assets with indefinite lives are tested for impairment annually at the end of the third fiscal quarter each year, or more often if events or circumstances indicate a reduction in the fair value below the carrying value. Goodwill is allocated and reviewed for impairment by reporting units, which consist primarily of the operating segments and certain other reporting units. The goodwill is allocated to the reporting unit in which the business that created the goodwill resides. To test for goodwill impairment, the carrying value of each reporting unit is compared with its fair value. If the carrying value of the goodwill or long-lived asset is considered impaired, a loss is recognized based on the amount by which the carrying value exceeds the fair value of the asset (see Note 5).
28
30409 Deere 2011.indd 18 12/15/11 10:24 AM
Derivative Financial InstrumentsIt is the company’s policy that derivative transactions are executed only to manage exposures arising in the normal course of business and not for the purpose of creating speculative positions or trading. The company’s financial services manage the relationship of the types and amounts of their funding sources to their receivable and lease portfolio in an effort to diminish risk due to interest rate and foreign currency fluctuations, while responding to favorable financing opportunities. The company also has foreign currency exposures at some of its foreign and domestic operations related to buying, selling and financing in currencies other than the functional currencies.
All derivatives are recorded at fair value on the balance sheet. Cash collateral received or paid is not offset against the derivative fair values on the balance sheet. Each derivative is designated as either a cash flow hedge, a fair value hedge, or remains undesignated. Changes in the fair value of derivatives that are designated and effective as cash flow hedges are recorded in other comprehensive income and reclassified to the income statement when the effects of the item being hedged are recognized in the income statement. Changes in the fair value of derivatives that are designated and effective as fair value hedges are recognized currently in net income. These changes are offset in net income to the extent the hedge was effective by fair value changes related to the risk being hedged on the hedged item. Changes in the fair value of undesignated hedges are recognized currently in the income statement. All ineffective changes in derivative fair values are recognized currently in net income.
All designated hedges are formally documented as to the relationship with the hedged item as well as the risk-management strategy. Both at inception and on an ongoing basis the hedging instrument is assessed as to its effectiveness. If and when a derivative is determined not to be highly effective as a hedge, or the underlying hedged transaction is no longer likely to occur, or the hedge designation is removed, or the derivative is terminated, the hedge accounting discussed above is discon-tinued (see Note 27). Foreign Currency TranslationThe functional currencies for most of the company’s foreign operations are their respective local currencies. The assets and liabilities of these operations are translated into U.S. dollars at the end of the period exchange rates. The revenues and expenses are translated at weighted-average rates for the period. The gains or losses from these translations are recorded in other comprehensive income. Gains or losses from transactions denominated in a currency other than the functional currency of the subsidiary involved and foreign exchange forward contracts are included in net income. The pretax net losses for foreign exchange in 2011, 2010 and 2009 were $121 million, $75 million and $68 million, respectively.
3. NEW ACCOUNTING STANDARDS
New Accounting Standards AdoptedIn the first quarter of 2011, the company adopted FASB ASU No. 2009-16, Accounting for Transfers of Financial Assets, which amends Accounting Standards Codification (ASC) 860, Transfers and Servicing (FASB Statement No. 166, Accounting
for Transfers of Financial Assets an amendment of FASB Statement No. 140). This ASU eliminates the qualifying special purpose entities from the consolidation guidance and clarifies the requirements for isolation and limitations on portions of financial assets that are eligible for sale accounting. It requires additional disclosures about the risks from continuing involve-ment in transferred financial assets accounted for as sales. The adoption did not have a material effect on the company’s consolidated financial statements.
In the first quarter of 2011, the company adopted FASB ASU No. 2009-17, Improvements to Financial Reporting by Enterprises Involved with Variable Interest Entities, which amends ASC 810, Consolidation (FASB Statement No. 167, Amendments to FASB Interpretation No. 46(R)). This ASU requires a qualitative analysis to determine the primary benefi-ciary of a VIE. The analysis identifies the primary beneficiary as the enterprise that has both the power to direct the activities of a VIE that most significantly impact the VIE’s economic performance and the obligation to absorb losses or the right to receive benefits that could be significant to the VIE. The adoption did not have a material effect on the company’s consolidated financial statements.
In the first quarter of 2011, the company adopted FASB ASU No. 2010-20, Disclosures about the Credit Quality of Financing Receivables and the Allowance for Credit Losses, which amends ASC 310, Receivables. This ASU requires disclosures related to financing receivables and the allowance for credit losses by portfolio segment. The ASU also requires disclosures of information regarding the credit quality, aging, nonaccrual status and impairments by class of receivable. A portfolio segment is the level at which a creditor develops a systematic methodology for determining its credit allowance. A receivable class is a subdivision of a portfolio segment with similar measurement attributes, risk characteristics and common methods to monitor and assess credit risk. The adoption did not have a material effect on the company’s consolidated financial statements.
In the fourth quarter of 2011, the company adopted FASB ASU No. 2011-02, A Creditor’s Determination of Whether a Restructuring Is a Troubled Debt Restructuring, which amends ASC 310, Receivables. This ASU states that a troubled debt restructuring occurs when a creditor grants a concession it would not otherwise consider to a debtor that is experiencing financial difficulties. Certain disclosures are required for transactions that qualify as troubled debt restructurings. The adoption did not have a material effect on the company’s consolidated financial statements.New Accounting Standards to be AdoptedIn January 2010, the FASB issued ASU No. 2010-06, Improving Disclosures about Fair Value Measurements, which amends ASC 820, Fair Value Measurements and Disclosures. This ASU requires disclosures of transfers into and out of Levels 1 and 2, more detailed roll forward reconciliations of Level 3 recurring fair value measurements on a gross basis, fair value information by class of assets and liabilities, and descriptions of valuation techniques and inputs for Level 2 and 3 measurements.
29
30409 Deere 2011.indd 19 12/15/11 10:24 AM
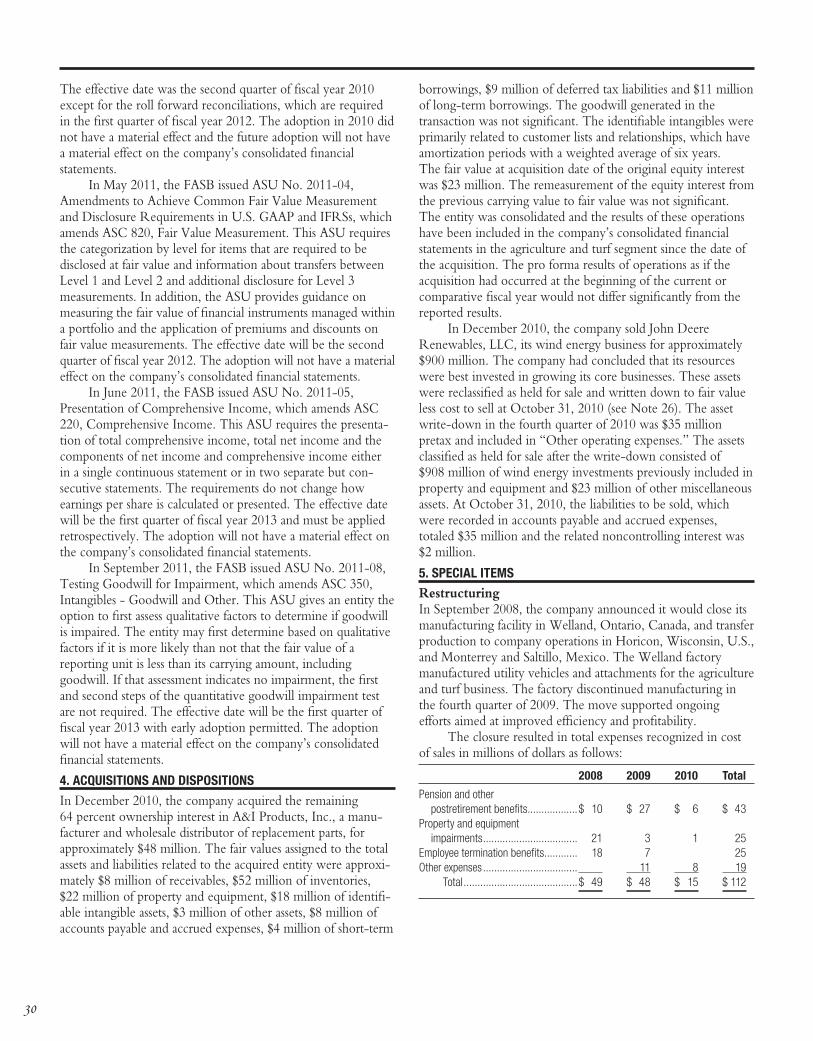
The effective date was the second quarter of fiscal year 2010 except for the roll forward reconciliations, which are required in the first quarter of fiscal year 2012. The adoption in 2010 did not have a material effect and the future adoption will not have a material effect on the company’s consolidated financial statements.
In May 2011, the FASB issued ASU No. 2011-04, Amendments to Achieve Common Fair Value Measurement and Disclosure Requirements in U.S. GAAP and IFRSs, which amends ASC 820, Fair Value Measurement. This ASU requires the categorization by level for items that are required to be disclosed at fair value and information about transfers between Level 1 and Level 2 and additional disclosure for Level 3 measurements. In addition, the ASU provides guidance on measuring the fair value of financial instruments managed within a portfolio and the application of premiums and discounts on fair value measurements. The effective date will be the second quarter of fiscal year 2012. The adoption will not have a material effect on the company’s consolidated financial statements.
In June 2011, the FASB issued ASU No. 2011-05, Presentation of Comprehensive Income, which amends ASC 220, Comprehensive Income. This ASU requires the presenta-tion of total comprehensive income, total net income and the components of net income and comprehensive income either in a single continuous statement or in two separate but con-secutive statements. The requirements do not change how earnings per share is calculated or presented. The effective date will be the first quarter of fiscal year 2013 and must be applied retrospectively. The adoption will not have a material effect on the company’s consolidated financial statements.
In September 2011, the FASB issued ASU No. 2011-08, Testing Goodwill for Impairment, which amends ASC 350, Intangibles - Goodwill and Other. This ASU gives an entity the option to first assess qualitative factors to determine if goodwill is impaired. The entity may first determine based on qualitative factors if it is more likely than not that the fair value of a reporting unit is less than its carrying amount, including goodwill. If that assessment indicates no impairment, the first and second steps of the quantitative goodwill impairment test are not required. The effective date will be the first quarter of fiscal year 2013 with early adoption permitted. The adoption will not have a material effect on the company’s consolidated financial statements.
4. ACQUISITIONS AND DISPOSITIONS
In December 2010, the company acquired the remaining 64 percent ownership interest in A&I Products, Inc., a manu-facturer and wholesale distributor of replacement parts, for approximately $48 million. The fair values assigned to the total assets and liabilities related to the acquired entity were approxi-mately $8 million of receivables, $52 million of inventories, $22 million of property and equipment, $18 million of identifi-able intangible assets, $3 million of other assets, $8 million of accounts payable and accrued expenses, $4 million of short-term
borrowings, $9 million of deferred tax liabilities and $11 million of long-term borrowings. The goodwill generated in the transaction was not significant. The identifiable intangibles were primarily related to customer lists and relationships, which have amortization periods with a weighted average of six years. The fair value at acquisition date of the original equity interest was $23 million. The remeasurement of the equity interest from the previous carrying value to fair value was not significant. The entity was consolidated and the results of these operations have been included in the company’s consolidated financial statements in the agriculture and turf segment since the date of the acquisition. The pro forma results of operations as if the acquisition had occurred at the beginning of the current or comparative fiscal year would not differ significantly from the reported results.
In December 2010, the company sold John Deere Renewables, LLC, its wind energy business for approximately $900 million. The company had concluded that its resources were best invested in growing its core businesses. These assets were reclassified as held for sale and written down to fair value less cost to sell at October 31, 2010 (see Note 26). The asset write-down in the fourth quarter of 2010 was $35 million pretax and included in “Other operating expenses.” The assets classified as held for sale after the write-down consisted of $908 million of wind energy investments previously included in property and equipment and $23 million of other miscellaneous assets. At October 31, 2010, the liabilities to be sold, which were recorded in accounts payable and accrued expenses, totaled $35 million and the related noncontrolling interest was $2 million.
5. SPECIAL ITEMS
RestructuringIn September 2008, the company announced it would close its manufacturing facility in Welland, Ontario, Canada, and transfer production to company operations in Horicon, Wisconsin, U.S., and Monterrey and Saltillo, Mexico. The Welland factory manufactured utility vehicles and attachments for the agriculture and turf business. The factory discontinued manufacturing in the fourth quarter of 2009. The move supported ongoing efforts aimed at improved efficiency and profitability.
The closure resulted in total expenses recognized in cost of sales in millions of dollars as follows:
2008 2009 2010 Total
Pension and other postretirement benefits ..................$ 10 $ 27 $ 6 $ 43 Property and equipment impairments .................................. 21 3 1 25 Employee termination benefits ............ 18 7 25 Other expenses .................................. 11 8 19 Total .........................................$ 49 $ 48 $ 15 $ 112
30
30409 Deere 2011.indd 20 12/15/11 10:24 AM
Cash flows from financing receivables that are related to sales to the company’s customers (see Note 12) are also included in operating activities. The remaining financing receivables are related to the financing of equipment sold by independent dealers and are included in investing activities.
The company had the following non-cash operating and investing activities that were not included in the statement of consolidated cash flows. The company transferred inventory to equipment on operating leases of $449 million, $405 million and $320 million in 2011, 2010 and 2009, respectively. The company also had accounts payable related to purchases of property and equipment of $135 million, $135 million and $81 million at October 31, 2011, 2010 and 2009, respectively.
Cash payments (receipts) for interest and income taxes consisted of the following in millions of dollars:
2011 2010 2009
Interest: Equipment operations ............................ $ 370 $ 378 $ 388 Financial services .................................. 616 679 878 Intercompany eliminations...................... (231) (229) (273)
Consolidated........................................... $ 755 $ 828 $ 993
Income taxes: Equipment operations ............................ $ 1,379 $ 639 $ 170 Financial services .................................. 336 (63) (73) Intercompany eliminations...................... (266) 51 109
Consolidated........................................... $ 1,449 $ 627 $ 206
7. PENSION AND OTHER POSTRETIREMENT BENEFITS
The company has several defined benefit pension plans covering its U.S. employees and employees in certain foreign countries. The company has several postretirement health care and life insurance plans for retired employees in the U.S. and Canada. The company uses an October 31 measurement date for these plans.
The components of net periodic pension cost and the assumptions related to the cost consisted of the following in millions of dollars and in percents:
2011 2010 2009
PensionsService cost .............................................. $ 197 $ 176 $ 124Interest cost .............................................. 492 510 563Expected return on plan assets .................. (793) (761) (739)Amortization of actuarial losses .................. 148 113 1Amortization of prior service cost ............... 46 42 25Early-retirement benefits ............................ 4Settlements/curtailments ........................... 1 24 27
Net cost ................................................... $ 91 $ 104 $ 5
Weighted-average assumptionsDiscount rates ........................................... 5.0% 5.5% 8.1%Rate of compensation increase ................... 3.9% 3.9% 3.9%Expected long-term rates of return ............. 8.1% 8.3% 8.3%
All expenses were included in the agriculture and turf operating segment. The pretax cash expenditures associated with this closure through 2010 were approximately $60 million. The expenditures in 2011 were not significant. The annual pretax increase in earnings and cash flows due to this restructur-ing was approximately $40 million in 2011. Property and equipment impairment values were based primarily on market appraisals. The remaining liability for employee termination benefits at October 31, 2011 was not significant.Voluntary Employee SeparationsThe company combined the agricultural equipment segment and the commercial and consumer equipment segment into the agriculture and turf segment effective at the beginning of the third quarter of 2009. Voluntary employee separations related to the new organizational structure resulted in pretax expenses of $91 million in 2009. The expenses were approximately 60 percent cost of sales and 40 percent selling, administrative and general expenses.Goodwill ImpairmentIn the fourth quarter of 2010, the company recorded a non-cash charge in cost of sales for the impairment of goodwill of $27 million pretax, or $25 million after-tax. The charge was associated with the company’s John Deere Water reporting unit, which is included in the agriculture and turf operating segment. The goodwill impairment was due to a decline in the forecasted financial performance as a result of the global economic downturn and more complex integration activities.
In the fourth quarter of 2009, the company recorded a non-cash charge in cost of sales for the impairment of goodwill of $289 million pretax, or $274 million after-tax. The charge was associated with the company’s John Deere Landscapes reporting unit, which is included in the agriculture and turf operating segment. The key factor contributing to the goodwill impairment was a decline in the reporting unit’s forecasted financial performance as a result of weak economic conditions.
The methods for determining the fair value of the reporting units to measure the fair value of the goodwill included a combination of discounted cash flows and comparable market values for similar businesses (see Note 26).
6. CASH FLOW INFORMATION
For purposes of the statement of consolidated cash flows, the company considers investments with purchased maturities of three months or less to be cash equivalents. Substantially all of the company’s short-term borrowings, excluding the current maturities of long-term borrowings, mature or may require payment within three months or less.
The equipment operations sell a significant portion of their trade receivables to financial services. These intercompany cash flows are eliminated in the consolidated cash flows.
All cash flows from the changes in trade accounts and notes receivable (see Note 12) are classified as operating activities in the statement of consolidated cash flows as these receivables arise from sales to the company’s customers.
31
30409 Deere 2011.indd 21 12/15/11 10:24 AM
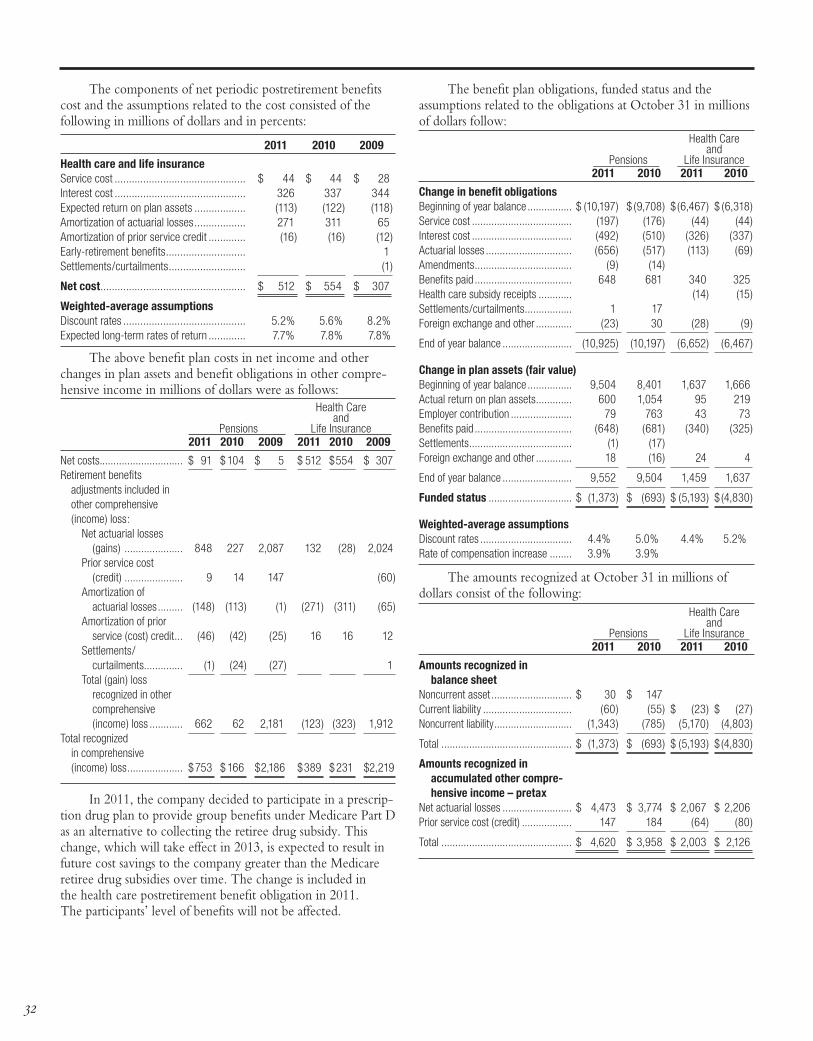
The components of net periodic postretirement benefits cost and the assumptions related to the cost consisted of the following in millions of dollars and in percents:
2011 2010 2009
Health care and life insuranceService cost .............................................. $ 44 $ 44 $ 28Interest cost .............................................. 326 337 344Expected return on plan assets .................. (113) (122) (118)Amortization of actuarial losses .................. 271 311 65Amortization of prior service credit ............. (16) (16) (12)Early-retirement benefits ............................ 1Settlements/curtailments ........................... (1)
Net cost ................................................... $ 512 $ 554 $ 307
Weighted-average assumptionsDiscount rates ........................................... 5.2% 5.6% 8.2%Expected long-term rates of return ............. 7.7% 7.8% 7.8%
The above benefit plan costs in net income and other changes in plan assets and benefit obligations in other compre-hensive income in millions of dollars were as follows: Health Care and Pensions Life Insurance 2011 2010 2009 2011 2010 2009
Net costs.............................. $ 91 $ 104 $ 5 $ 512 $ 554 $ 307 Retirement benefits adjustments included in other comprehensive (income) loss: Net actuarial losses (gains) ..................... 848 227 2,087 132 (28) 2,024 Prior service cost (credit) ..................... 9 14 147 (60) Amortization of actuarial losses ......... (148) (113) (1) (271) (311) (65) Amortization of prior service (cost) credit ... (46) (42) (25) 16 16 12 Settlements/ curtailments .............. (1) (24) (27) 1 Total (gain) loss recognized in other comprehensive (income) loss ............ 662 62 2,181 (123) (323) 1,912 Total recognized in comprehensive (income) loss .................... $ 753 $ 166 $2,186 $ 389 $ 231 $ 2,219
In 2011, the company decided to participate in a prescrip-tion drug plan to provide group benefits under Medicare Part D as an alternative to collecting the retiree drug subsidy. This change, which will take effect in 2013, is expected to result in future cost savings to the company greater than the Medicare retiree drug subsidies over time. The change is included in the health care postretirement benefit obligation in 2011. The participants’ level of benefits will not be affected.
The benefit plan obligations, funded status and the assumptions related to the obligations at October 31 in millions of dollars follow: Health Care and Pensions Life Insurance ___________ ____________ 2011 2010 2011 2010
Change in benefit obligationsBeginning of year balance ................ $ (10,197) $ (9,708) $ (6,467) $ (6,318)Service cost .................................... (197) (176) (44) (44)Interest cost .................................... (492) (510) (326) (337)Actuarial losses ............................... (656) (517) (113) (69)Amendments ................................... (9) (14) Benefits paid ................................... 648 681 340 325Health care subsidy receipts ............ (14) (15)Settlements/curtailments ................. 1 17 Foreign exchange and other ............. (23) 30 (28) (9)
End of year balance ......................... (10,925) (10,197) (6,652) (6,467)
Change in plan assets (fair value)Beginning of year balance ................ 9,504 8,401 1,637 1,666Actual return on plan assets ............. 600 1,054 95 219Employer contribution ...................... 79 763 43 73Benefits paid ................................... (648) (681) (340) (325)Settlements ..................................... (1) (17) Foreign exchange and other ............. 18 (16) 24 4
End of year balance ......................... 9,552 9,504 1,459 1,637
Funded status .............................. $ (1,373) $ (693) $ (5,193) $ (4,830)
Weighted-average assumptionsDiscount rates ................................. 4.4% 5.0% 4.4% 5.2% Rate of compensation increase ........ 3.9% 3.9%
The amounts recognized at October 31 in millions of dollars consist of the following: Health Care and Pensions Life Insurance ___________ ____________ 2011 2010 2011 2010
Amounts recognized in balance sheetNoncurrent asset ............................. $ 30 $ 147 Current liability ................................ (60) (55) $ (23) $ (27)Noncurrent liability ............................ (1,343) (785) (5,170) (4,803)
Total ............................................... $ (1,373) $ (693) $ (5,193) $ (4,830)
Amounts recognized in accumulated other compre- hensive income – pretaxNet actuarial losses ......................... $ 4,473 $ 3,774 $ 2,067 $ 2,206Prior service cost (credit) .................. 147 184 (64) (80)
Total ............................................... $ 4,620 $ 3,958 $ 2,003 $ 2,126
32
30409 Deere 2011.indd 22 12/15/11 10:24 AM
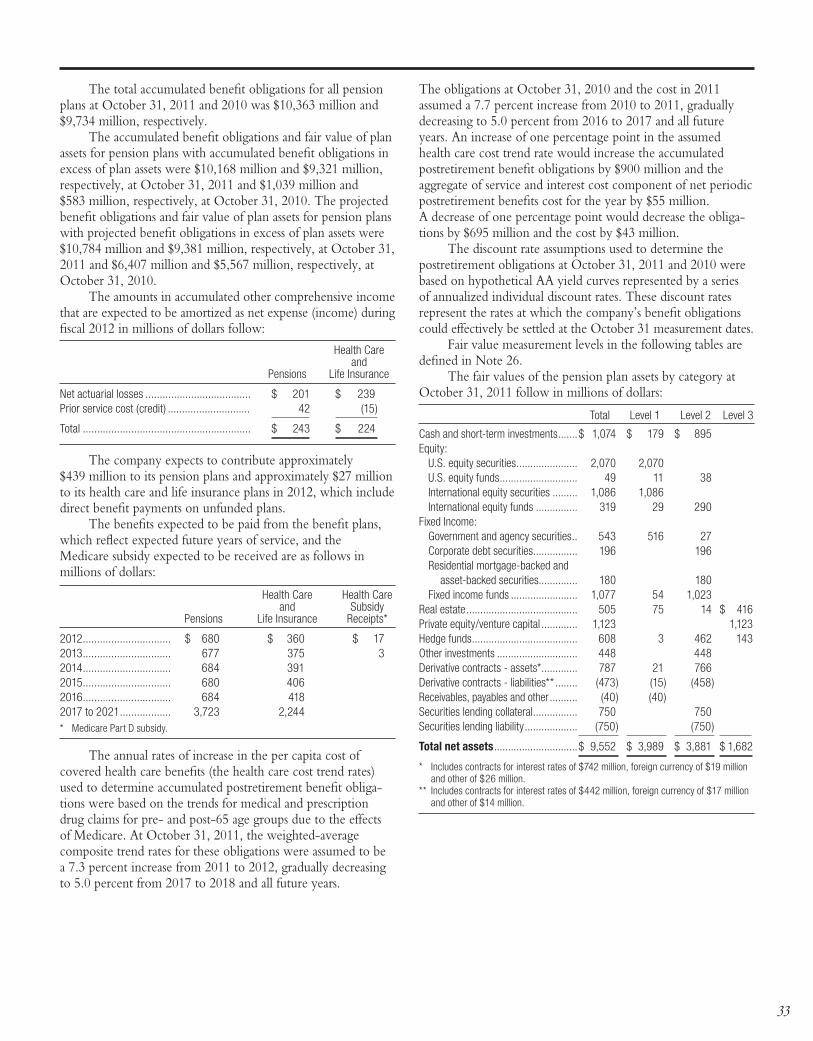
The total accumulated benefit obligations for all pension plans at October 31, 2011 and 2010 was $10,363 million and $9,734 million, respectively.
The accumulated benefit obligations and fair value of plan assets for pension plans with accumulated benefit obligations in excess of plan assets were $10,168 million and $9,321 million, respectively, at October 31, 2011 and $1,039 million and $583 million, respectively, at October 31, 2010. The projected benefit obligations and fair value of plan assets for pension plans with projected benefit obligations in excess of plan assets were $10,784 million and $9,381 million, respectively, at October 31, 2011 and $6,407 million and $5,567 million, respectively, at October 31, 2010.
The amounts in accumulated other comprehensive income that are expected to be amortized as net expense (income) during fiscal 2012 in millions of dollars follow:
Health Care and Pensions Life Insurance
Net actuarial losses ..................................... $ 201 $ 239Prior service cost (credit) ............................. 42 (15)
Total ........................................................... $ 243 $ 224
The company expects to contribute approximately $439 million to its pension plans and approximately $27 million to its health care and life insurance plans in 2012, which include direct benefit payments on unfunded plans.
The benefits expected to be paid from the benefit plans, which reflect expected future years of service, and the Medicare subsidy expected to be received are as follows in millions of dollars:
Health Care Health Care and Subsidy Pensions Life Insurance Receipts*
2012 ............................... $ 680 $ 360 $ 172013 ............................... 677 375 32014 ............................... 684 391 2015 ............................... 680 406 2016 ............................... 684 418 2017 to 2021 .................. 3,723 2,244 * Medicare Part D subsidy.
The annual rates of increase in the per capita cost of covered health care benefits (the health care cost trend rates) used to determine accumulated postretirement benefit obliga-tions were based on the trends for medical and prescription drug claims for pre- and post-65 age groups due to the effects of Medicare. At October 31, 2011, the weighted-average composite trend rates for these obligations were assumed to be a 7.3 percent increase from 2011 to 2012, gradually decreasing to 5.0 percent from 2017 to 2018 and all future years.
The obligations at October 31, 2010 and the cost in 2011 assumed a 7.7 percent increase from 2010 to 2011, gradually decreasing to 5.0 percent from 2016 to 2017 and all future years. An increase of one percentage point in the assumed health care cost trend rate would increase the accumulated postretirement benefit obligations by $900 million and the aggregate of service and interest cost component of net periodic postretirement benefits cost for the year by $55 million. A decrease of one percentage point would decrease the obliga-tions by $695 million and the cost by $43 million.
The discount rate assumptions used to determine the postretirement obligations at October 31, 2011 and 2010 were based on hypothetical AA yield curves represented by a series of annualized individual discount rates. These discount rates represent the rates at which the company’s benefit obligations could effectively be settled at the October 31 measurement dates.
Fair value measurement levels in the following tables are defined in Note 26.
The fair values of the pension plan assets by category at October 31, 2011 follow in millions of dollars:
Total Level 1 Level 2 Level 3
Cash and short-term investments .......$ 1,074 $ 179 $ 895 Equity: U.S. equity securities ...................... 2,070 2,070 U.S. equity funds ............................ 49 11 38 International equity securities ......... 1,086 1,086 International equity funds ............... 319 29 290 Fixed Income: Government and agency securities .. 543 516 27 Corporate debt securities ................ 196 196 Residential mortgage-backed and asset-backed securities.............. 180 180 Fixed income funds ........................ 1,077 54 1,023 Real estate ........................................ 505 75 14 $ 416Private equity/venture capital ............. 1,123 1,123Hedge funds ...................................... 608 3 462 143Other investments ............................. 448 448 Derivative contracts - assets* ............. 787 21 766 Derivative contracts - liabilities** ........ (473) (15) (458) Receivables, payables and other .......... (40) (40) Securities lending collateral ................ 750 750 Securities lending liability ................... (750) (750)
Total net assets ..............................$ 9,552 $ 3,989 $ 3,881 $ 1,682
* Includes contracts for interest rates of $742 million, foreign currency of $19 million and other of $26 million.
** Includes contracts for interest rates of $442 million, foreign currency of $17 million and other of $14 million.
33
30409 Deere 2011.indd 23 12/15/11 10:24 AM
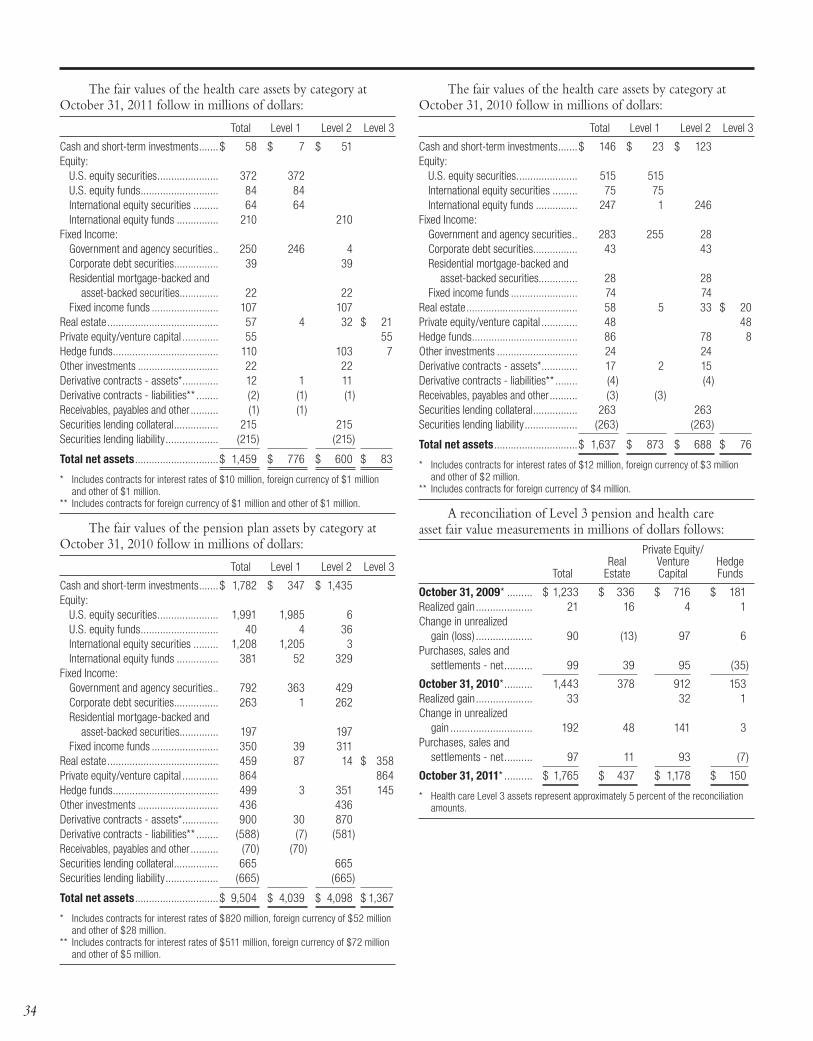
The fair values of the health care assets by category at October 31, 2011 follow in millions of dollars:
Total Level 1 Level 2 Level 3
Cash and short-term investments .......$ 58 $ 7 $ 51 Equity: U.S. equity securities ...................... 372 372 U.S. equity funds ............................ 84 84 International equity securities ......... 64 64 International equity funds ............... 210 210 Fixed Income: Government and agency securities .. 250 246 4 Corporate debt securities ................ 39 39 Residential mortgage-backed and asset-backed securities.............. 22 22 Fixed income funds ........................ 107 107 Real estate ........................................ 57 4 32 $ 21 Private equity/venture capital ............. 55 55 Hedge funds ...................................... 110 103 7 Other investments ............................. 22 22 Derivative contracts - assets* ............. 12 1 11 Derivative contracts - liabilities** ........ (2) (1) (1) Receivables, payables and other .......... (1) (1) Securities lending collateral ................ 215 215 Securities lending liability ................... (215) (215)
Total net assets ..............................$ 1,459 $ 776 $ 600 $ 83
* Includes contracts for interest rates of $10 million, foreign currency of $1 million and other of $1 million.
** Includes contracts for foreign currency of $1 million and other of $1 million.
The fair values of the pension plan assets by category at October 31, 2010 follow in millions of dollars:
Total Level 1 Level 2 Level 3
Cash and short-term investments .......$ 1,782 $ 347 $ 1,435Equity: U.S. equity securities ...................... 1,991 1,985 6 U.S. equity funds ............................ 40 4 36 International equity securities ......... 1,208 1,205 3 International equity funds ............... 381 52 329 Fixed Income: Government and agency securities .. 792 363 429 Corporate debt securities ................ 263 1 262 Residential mortgage-backed and asset-backed securities.............. 197 197 Fixed income funds ........................ 350 39 311 Real estate ........................................ 459 87 14 $ 358Private equity/venture capital ............. 864 864Hedge funds ...................................... 499 3 351 145Other investments ............................. 436 436 Derivative contracts - assets* ............. 900 30 870 Derivative contracts - liabilities** ........ (588) (7) (581) Receivables, payables and other .......... (70) (70) Securities lending collateral ................ 665 665 Securities lending liability ................... (665) (665)
Total net assets ..............................$ 9,504 $ 4,039 $ 4,098 $ 1,367
* Includes contracts for interest rates of $820 million, foreign currency of $52 million and other of $28 million.
** Includes contracts for interest rates of $511 million, foreign currency of $72 million and other of $5 million.
The fair values of the health care assets by category at October 31, 2010 follow in millions of dollars:
Total Level 1 Level 2 Level 3
Cash and short-term investments .......$ 146 $ 23 $ 123Equity: U.S. equity securities ...................... 515 515 International equity securities ......... 75 75 International equity funds ............... 247 1 246 Fixed Income: Government and agency securities .. 283 255 28 Corporate debt securities ................ 43 43 Residential mortgage-backed and asset-backed securities.............. 28 28 Fixed income funds ........................ 74 74 Real estate ........................................ 58 5 33 $ 20 Private equity/venture capital ............. 48 48 Hedge funds ...................................... 86 78 8 Other investments ............................. 24 24 Derivative contracts - assets* ............. 17 2 15 Derivative contracts - liabilities** ........ (4) (4) Receivables, payables and other .......... (3) (3) Securities lending collateral ................ 263 263 Securities lending liability ................... (263) (263)
Total net assets ..............................$ 1,637 $ 873 $ 688 $ 76
* Includes contracts for interest rates of $12 million, foreign currency of $3 million and other of $2 million.
** Includes contracts for foreign currency of $4 million.
A reconciliation of Level 3 pension and health care asset fair value measurements in millions of dollars follows: Private Equity/ Real Venture Hedge Total Estate Capital Funds
October 31, 2009* ......... $ 1,233 $ 336 $ 716 $ 181Realized gain .................... 21 16 4 1Change in unrealized gain (loss) .................... 90 (13) 97 6Purchases, sales and settlements - net .......... 99 39 95 (35)
October 31, 2010* .......... 1,443 378 912 153 Realized gain .................... 33 32 1Change in unrealized gain ............................. 192 48 141 3Purchases, sales and settlements - net .......... 97 11 93 (7)
October 31, 2011* .......... $ 1,765 $ 437 $ 1,178 $ 150
* Health care Level 3 assets represent approximately 5 percent of the reconciliation amounts.
34
30409 Deere 2011.indd 24 12/15/11 10:24 AM
Fair values are determined as follows:Cash and Short-Term Investments – Includes accounts and
cash funds that are valued based on the account value, which approximates fair value, or on the fund’s net asset value (NAV) based on the fair value of the underlying securities. Also included are securities that are valued using a market approach (matrix pricing model) in which all significant inputs are observable or can be derived from or corroborated by observable market data.
Equity Securities and Funds – The values are determined primarily by closing prices in the active market in which the equity investment trades, or the fund’s NAV, based on the fair value of the underlying securities.
Fixed Income Securities and Funds – The securities are valued using either a market approach (matrix pricing model) in which all significant inputs are observable or can be derived from or corroborated by observable market data such as interest rates, yield curves, volatilities, credit risk and prepayment speeds, or they are valued using the closing prices in the active market in which the fixed income investment trades. Fixed income funds are valued using the NAV, based on the fair value of the underlying securities.
Real Estate, Venture Capital and Private Equity – The investments, which are structured as limited partnerships, are valued using an income approach (estimated cash flows discounted over the expected holding period), as well as a market approach (the valuation of similar securities and properties). These investments are valued at estimated fair value based on their proportionate share of the limited partnership’s fair value that is determined by the general partner. Real estate investment trusts are valued at the closing prices in the active markets in which the investment trades. Real estate investment funds are valued at the NAV, based on the fair value of the underlying securities.
Hedge Funds and Other Investments – The investments are valued using the NAV provided by the administrator of the fund, which is based on the fair value of the underlying securities.
Interest Rate, Foreign Currency and Other Derivative Instruments – The derivatives are valued using either an income approach (discounted cash flow) using market observable inputs, including swap curves and both forward and spot exchange rates, or a market approach (closing prices in the active market in which the derivative instrument trades).
The primary investment objective for the pension plan assets is to maximize the growth of these assets to meet the projected obligations to the beneficiaries over a long period of time, and to do so in a manner that is consistent with the company’s earnings strength and risk tolerance. The primary investment objective for the health care plan assets is to provide the company with the financial flexibility to pay the projected obligations to beneficiaries over a long period of time. The asset allocation policy is the most important decision in managing the assets and it is reviewed regularly. The asset allocation policy considers the company’s financial strength and long-term
asset class risk/return expectations since the obligations are long-term in nature. The current target allocations for pension assets are approximately 37 percent for equity securities, 39 percent for debt securities, 5 percent for real estate and 19 percent for other investments. The target allocations for health care assets are approximately 50 percent for equity securities, 33 percent for debt securities, 3 percent for real estate and 14 percent for other investments. The allocation percentages above include the effects of combining derivatives with other investments to manage asset allocations and exposures to interest rates and foreign currency exchange. The assets are well diversified and are managed by professional investment firms as well as by investment professionals who are company employees. As a result of the company’s diversified investment policy, there were no significant concentrations of risk.
The expected long-term rate of return on plan assets reflects management’s expectations of long-term average rates of return on funds invested to provide for benefits included in the projected benefit obligations. The expected return is based on the outlook for inflation and for returns in multiple asset classes, while also considering historical returns, asset allocation and investment strategy. The company’s approach has empha-sized the long-term nature of the return estimate such that the return assumption is not changed unless there are fundamental changes in capital markets that affect the company’s expectations for returns over an extended period of time (i.e., 10 to 20 years). The average annual return of the company’s U.S. pension fund was approximately 7.6 percent during the past ten years and approximately 9.6 percent during the past 20 years. Since return premiums over inflation and total returns for major asset classes vary widely even over ten-year periods, recent history is not necessarily indicative of long-term future expected returns. The company’s systematic methodology for determining the long-term rate of return for the company’s investment strategies supports the long-term expected return assumptions.
The company has created certain Voluntary Employees’ Beneficiary Association trusts (VEBAs) for the funding of postretirement health care benefits. The future expected asset returns for these VEBAs are lower than the expected return on the other pension and health care plan assets due to investment in a higher proportion of liquid securities. These assets are in addition to the other postretirement health care plan assets that have been funded under Section 401(h) of the U.S. Internal Revenue Code and maintained in a separate account in the company’s pension plan trust.
The company has defined contribution plans related to employee investment and savings plans primarily in the U.S. The company’s contributions and costs under these plans were $108 million in 2011, $85 million in 2010 and $131 million in 2009. The contribution rate varies primarily based on the company’s performance in the prior year and employee participation in the plans.
35
30409 Deere 2011.indd 25 12/15/11 10:24 AM
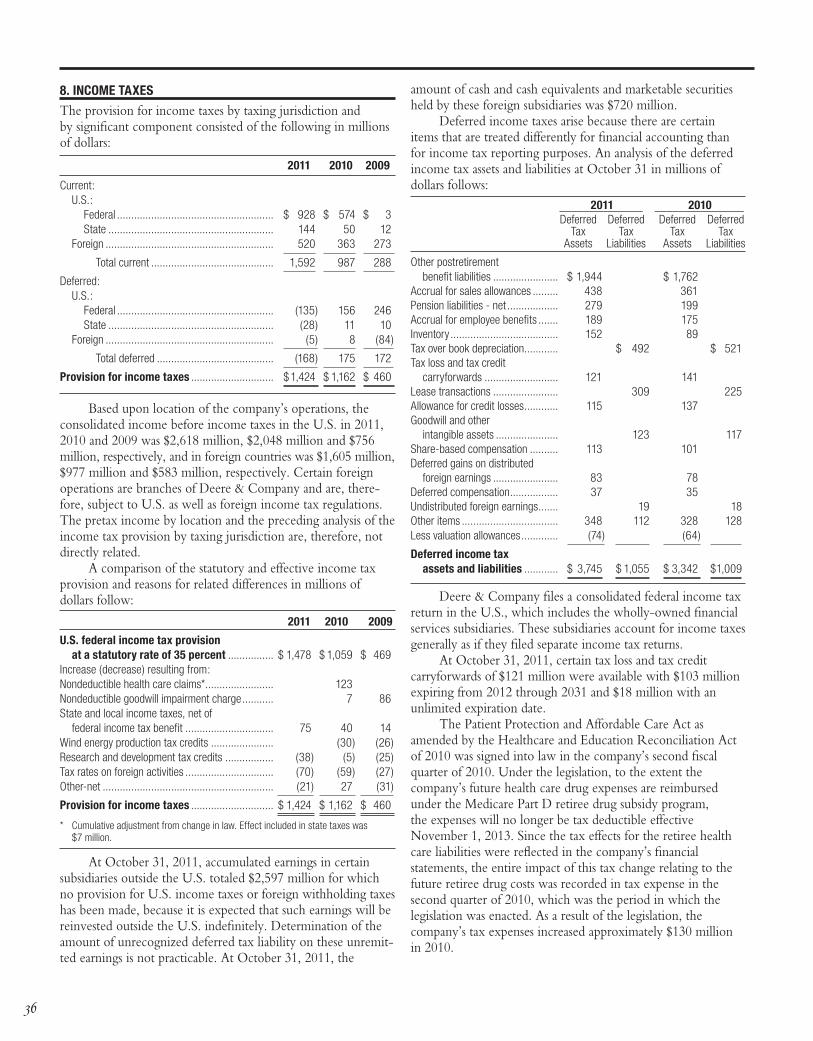
amount of cash and cash equivalents and marketable securities held by these foreign subsidiaries was $720 million.
Deferred income taxes arise because there are certain items that are treated differently for financial accounting than for income tax reporting purposes. An analysis of the deferred income tax assets and liabilities at October 31 in millions of dollars follows: 2011 2010 ______________ _______________ Deferred Deferred Deferred Deferred Tax Tax Tax Tax Assets Liabilities Assets Liabilities
Other postretirement benefit liabilities ....................... $ 1,944 $ 1,762 Accrual for sales allowances ......... 438 361 Pension liabilities - net .................. 279 199 Accrual for employee benefits ....... 189 175 Inventory ...................................... 152 89 Tax over book depreciation ............ $ 492 $ 521Tax loss and tax credit carryforwards .......................... 121 141 Lease transactions ....................... 309 225Allowance for credit losses ............ 115 137 Goodwill and other intangible assets ...................... 123 117Share-based compensation .......... 113 101 Deferred gains on distributed foreign earnings ....................... 83 78 Deferred compensation ................. 37 35 Undistributed foreign earnings ....... 19 18Other items .................................. 348 112 328 128Less valuation allowances ............. (74) (64)
Deferred income tax assets and liabilities ............ $ 3,745 $ 1,055 $ 3,342 $ 1,009
Deere & Company files a consolidated federal income tax return in the U.S., which includes the wholly-owned financial services subsidiaries. These subsidiaries account for income taxes generally as if they filed separate income tax returns.
At October 31, 2011, certain tax loss and tax credit carryforwards of $121 million were available with $103 million expiring from 2012 through 2031 and $18 million with an unlimited expiration date.
The Patient Protection and Affordable Care Act as amended by the Healthcare and Education Reconciliation Act of 2010 was signed into law in the company’s second fiscal quarter of 2010. Under the legislation, to the extent the company’s future health care drug expenses are reimbursed under the Medicare Part D retiree drug subsidy program, the expenses will no longer be tax deductible effective November 1, 2013. Since the tax effects for the retiree health care liabilities were reflected in the company’s financial statements, the entire impact of this tax change relating to the future retiree drug costs was recorded in tax expense in the second quarter of 2010, which was the period in which the legislation was enacted. As a result of the legislation, the company’s tax expenses increased approximately $130 million in 2010.
8. INCOME TAXES
The provision for income taxes by taxing jurisdiction and by sig nificant component consisted of the following in millions of dollars:
2011 2010 2009
Current: U.S.: Federal ....................................................... $ 928 $ 574 $ 3 State .......................................................... 144 50 12 Foreign ........................................................... 520 363 273
Total current ........................................... 1,592 987 288
Deferred: U.S.: Federal ....................................................... (135) 156 246 State .......................................................... (28) 11 10 Foreign ........................................................... (5) 8 (84)
Total deferred ......................................... (168) 175 172
Provision for income taxes ............................. $ 1,424 $ 1,162 $ 460
Based upon location of the company’s operations, the consolidated income before income taxes in the U.S. in 2011, 2010 and 2009 was $2,618 million, $2,048 million and $756 million, respectively, and in foreign countries was $1,605 million, $977 million and $583 million, respectively. Certain foreign operations are branches of Deere & Company and are, there-fore, subject to U.S. as well as foreign income tax regulations. The pretax income by location and the preceding analysis of the income tax provision by taxing jurisdiction are, therefore, not directly related.
A comparison of the statutory and effective income tax provision and reasons for related differences in millions of dollars follow:
2011 2010 2009
U.S. federal income tax provision at a statutory rate of 35 percent ................ $ 1,478 $ 1,059 $ 469Increase (decrease) resulting from:Nondeductible health care claims* ........................ 123 Nondeductible goodwill impairment charge ........... 7 86State and local income taxes, net of federal income tax benefit ............................... 75 40 14Wind energy production tax credits ...................... (30) (26)Research and development tax credits ................. (38) (5) (25)Tax rates on foreign activities ............................... (70) (59) (27)Other-net ............................................................ (21) 27 (31)
Provision for income taxes ............................. $ 1,424 $ 1,162 $ 460
* Cumulative adjustment from change in law. Effect included in state taxes was $7 million.
At October 31, 2011, accumulated earnings in certain subsidiaries outside the U.S. totaled $2,597 million for which no provision for U.S. income taxes or foreign withholding taxes has been made, because it is expected that such earnings will be reinvested outside the U.S. indefinitely. Determination of the amount of unrecognized deferred tax liability on these unremit-ted earnings is not practicable. At October 31, 2011, the
36
30409 Deere 2011.indd 26 12/15/11 10:24 AM
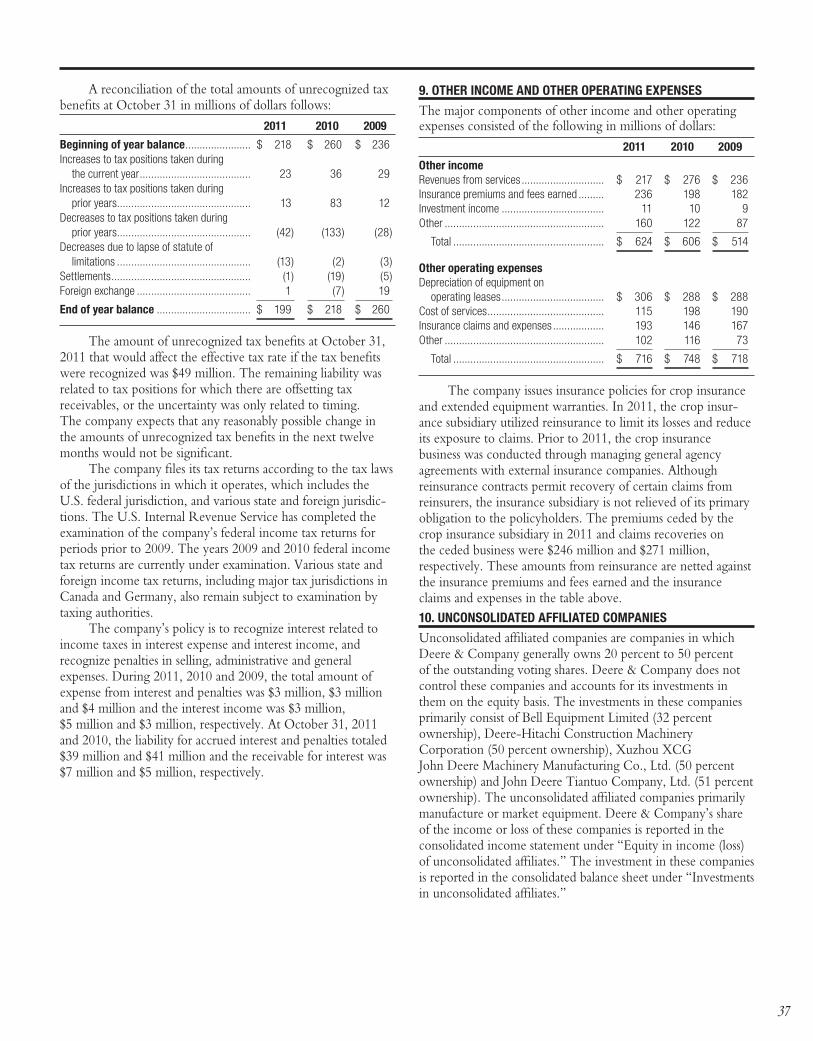
9. OTHER INCOME AND OTHER OPERATING EXPENSES
The major components of other income and other operating expenses consisted of the following in millions of dollars: 2011 2010 2009
Other income Revenues from services ............................. $ 217 $ 276 $ 236Insurance premiums and fees earned ......... 236 198 182Investment income .................................... 11 10 9Other ........................................................ 160 122 87
Total ..................................................... $ 624 $ 606 $ 514
Other operating expensesDepreciation of equipment on operating leases .................................... $ 306 $ 288 $ 288Cost of services ......................................... 115 198 190Insurance claims and expenses .................. 193 146 167Other ........................................................ 102 116 73
Total ..................................................... $ 716 $ 748 $ 718
The company issues insurance policies for crop insurance and extended equipment warranties. In 2011, the crop insur-ance subsidiary utilized reinsurance to limit its losses and reduce its exposure to claims. Prior to 2011, the crop insurance business was conducted through managing general agency agreements with external insurance companies. Although reinsurance contracts permit recovery of certain claims from reinsurers, the insurance subsidiary is not relieved of its primary obligation to the policyholders. The premiums ceded by the crop insurance subsidiary in 2011 and claims recoveries on the ceded business were $246 million and $271 million, respectively. These amounts from reinsurance are netted against the insurance premiums and fees earned and the insurance claims and expenses in the table above.10. UNCONSOLIDATED AFFILIATED COMPANIES
Unconsolidated affiliated companies are companies in which Deere & Company generally owns 20 percent to 50 percent of the outstanding voting shares. Deere & Company does not control these companies and accounts for its investments in them on the equity basis. The investments in these companies primarily consist of Bell Equipment Limited (32 percent ownership), Deere-Hitachi Construction Machinery Corporation (50 percent ownership), Xuzhou XCG John Deere Machinery Manufacturing Co., Ltd. (50 percent ownership) and John Deere Tiantuo Company, Ltd. (51 percent ownership). The unconsolidated affiliated companies primarily manufacture or market equipment. Deere & Company’s share of the income or loss of these companies is reported in the consolidated income statement under “Equity in income (loss) of unconsolidated affiliates.” The investment in these companies is reported in the consolidated balance sheet under “Investments in unconsolidated affiliates.”
A reconciliation of the total amounts of unrecognized tax benefits at October 31 in millions of dollars follows:
2011 2010 2009
Beginning of year balance ....................... $ 218 $ 260 $ 236Increases to tax positions taken during the current year ....................................... 23 36 29Increases to tax positions taken during prior years............................................... 13 83 12Decreases to tax positions taken during prior years............................................... (42) (133) (28)Decreases due to lapse of statute of limitations ............................................... (13) (2) (3)Settlements ................................................. (1) (19) (5)Foreign exchange ........................................ 1 (7) 19
End of year balance ................................. $ 199 $ 218 $ 260
The amount of unrecognized tax benefits at October 31, 2011 that would affect the effective tax rate if the tax benefits were recognized was $49 million. The remaining liability was related to tax positions for which there are offsetting tax receivables, or the uncertainty was only related to timing. The company expects that any reasonably possible change in the amounts of unrecognized tax benefits in the next twelve months would not be significant.
The company files its tax returns according to the tax laws of the jurisdictions in which it operates, which includes the U.S. federal jurisdiction, and various state and foreign jurisdic-tions. The U.S. Internal Revenue Service has completed the examination of the company’s federal income tax returns for periods prior to 2009. The years 2009 and 2010 federal income tax returns are currently under examination. Various state and foreign income tax returns, including major tax jurisdictions in Canada and Germany, also remain subject to examination by taxing authorities.
The company’s policy is to recognize interest related to income taxes in interest expense and interest income, and recognize penalties in selling, administrative and general expenses. During 2011, 2010 and 2009, the total amount of expense from interest and penalties was $3 million, $3 million and $4 million and the interest income was $3 million, $5 million and $3 million, respectively. At October 31, 2011 and 2010, the liability for accrued interest and penalties totaled $39 million and $41 million and the receivable for interest was $7 million and $5 million, respectively.
37
30409 Deere 2011.indd 27 12/15/11 10:24 AM
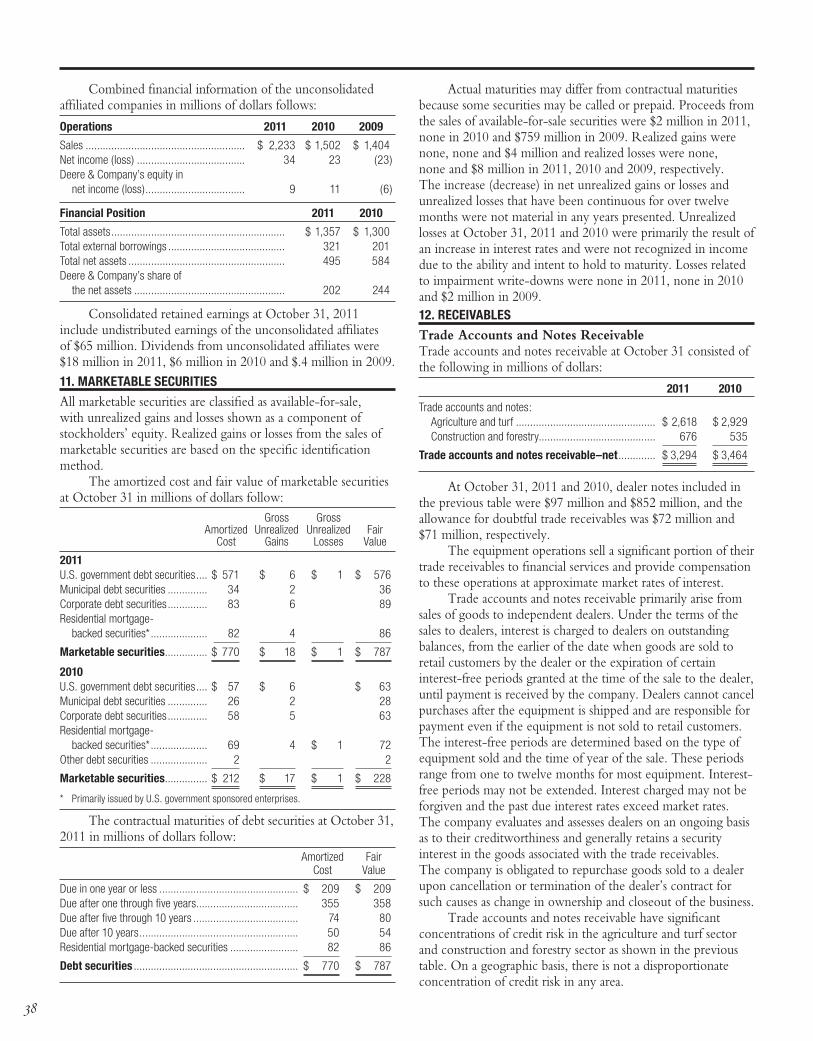
Combined financial information of the unconsolidated affiliated companies in millions of dollars follows:
Operations 2011 2010 2009
Sales ........................................................ $ 2,233 $ 1,502 $ 1,404Net income (loss) ...................................... 34 23 (23)Deere & Company’s equity in net income (loss) ................................... 9 11 (6)
Financial Position 2011 2010
Total assets ............................................................. $ 1,357 $ 1,300Total external borrowings ......................................... 321 201Total net assets ....................................................... 495 584Deere & Company’s share of the net assets ..................................................... 202 244
Consolidated retained earnings at October 31, 2011 include undistributed earnings of the unconsolidated affiliates of $65 million. Dividends from unconsolidated affiliates were $18 million in 2011, $6 million in 2010 and $.4 million in 2009.11. MARKETABLE SECURITIES
All marketable securities are classified as available-for-sale, with unrealized gains and losses shown as a component of stockholders’ equity. Realized gains or losses from the sales of marketable securities are based on the specific identification method.
The amortized cost and fair value of marketable securities at October 31 in millions of dollars follow: Gross Gross Amortized Unrealized Unrealized Fair Cost Gains Losses Value
2011U.S. government debt securities .... $ 571 $ 6 $ 1 $ 576Municipal debt securities .............. 34 2 36Corporate debt securities .............. 83 6 89Residential mortgage- backed securities* .................... 82 4 86
Marketable securities ............... $ 770 $ 18 $ 1 $ 787
2010U.S. government debt securities .... $ 57 $ 6 $ 63Municipal debt securities .............. 26 2 28Corporate debt securities .............. 58 5 63Residential mortgage- backed securities* .................... 69 4 $ 1 72Other debt securities .................... 2 2
Marketable securities ............... $ 212 $ 17 $ 1 $ 228
* Primarily issued by U.S. government sponsored enterprises.
The contractual maturities of debt securities at October 31, 2011 in millions of dollars follow:
Amortized Fair Cost Value
Due in one year or less ................................................. $ 209 $ 209Due after one through five years .................................... 355 358Due after five through 10 years ..................................... 74 80Due after 10 years ........................................................ 50 54Residential mortgage-backed securities ........................ 82 86
Debt securities .......................................................... $ 770 $ 787
Actual maturities may differ from contractual maturities because some securities may be called or prepaid. Proceeds from the sales of available-for-sale securities were $2 million in 2011, none in 2010 and $759 million in 2009. Realized gains were none, none and $4 million and realized losses were none, none and $8 million in 2011, 2010 and 2009, respectively. The increase (decrease) in net unrealized gains or losses and unrealized losses that have been continuous for over twelve months were not material in any years presented. Unrealized losses at October 31, 2011 and 2010 were primarily the result of an increase in interest rates and were not recognized in income due to the ability and intent to hold to maturity. Losses related to impairment write-downs were none in 2011, none in 2010 and $2 million in 2009.12. RECEIVABLES
Trade Accounts and Notes ReceivableTrade accounts and notes receivable at October 31 consisted of the following in millions of dollars:
2011 2010
Trade accounts and notes: Agriculture and turf ................................................. $ 2,618 $ 2,929 Construction and forestry......................................... 676 535
Trade accounts and notes receivable–net ............. $ 3,294 $ 3,464
At October 31, 2011 and 2010, dealer notes included in the previous table were $97 million and $852 million, and the allowance for doubtful trade receivables was $72 million and $71 million, respectively.
The equipment operations sell a significant portion of their trade receivables to financial services and provide compensation to these operations at approximate market rates of interest.
Trade accounts and notes receivable primarily arise from sales of goods to independent dealers. Under the terms of the sales to dealers, interest is charged to dealers on outstanding balances, from the earlier of the date when goods are sold to retail customers by the dealer or the expiration of certain interest-free periods granted at the time of the sale to the dealer, until payment is received by the company. Dealers cannot cancel purchases after the equipment is shipped and are responsible for payment even if the equipment is not sold to retail customers. The interest-free periods are determined based on the type of equipment sold and the time of year of the sale. These periods range from one to twelve months for most equipment. Interest-free periods may not be extended. Interest charged may not be forgiven and the past due interest rates exceed market rates. The company evaluates and assesses dealers on an ongoing basis as to their creditworthiness and generally retains a security interest in the goods associated with the trade receivables. The company is obligated to repurchase goods sold to a dealer upon cancellation or termination of the dealer’s contract for such causes as change in ownership and closeout of the business.
Trade accounts and notes receivable have significant concentrations of credit risk in the agriculture and turf sector and construction and forestry sector as shown in the previous table. On a geographic basis, there is not a disproportionate concentration of credit risk in any area.
38
30409 Deere 2011.indd 28 12/15/11 5:13 PM
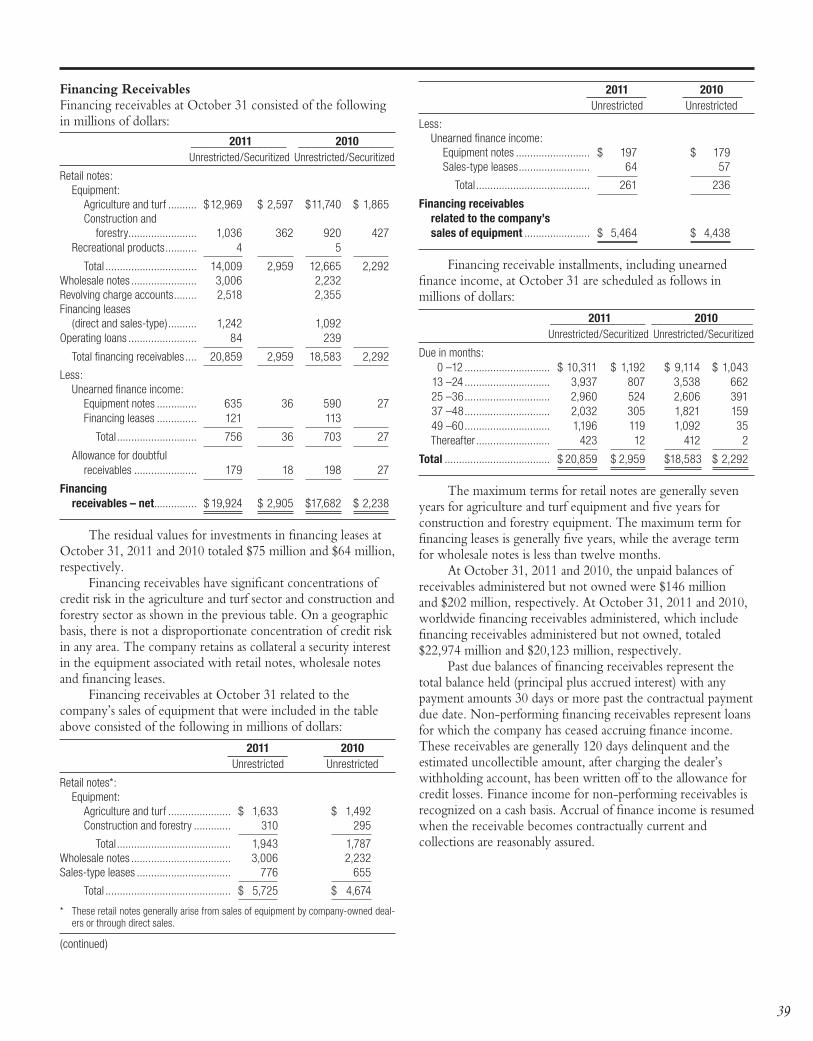
Financing ReceivablesFinancing receivables at October 31 consisted of the following in millions of dollars: 2011 2010 ________________ ________________ Unrestricted/Securitized Unrestricted/Securitized
Retail notes: Equipment: Agriculture and turf .......... $ 12,969 $ 2,597 $ 11,740 $ 1,865 Construction and forestry ........................ 1,036 362 920 427 Recreational products ........... 4 5
Total ................................ 14,009 2,959 12,665 2,292Wholesale notes ....................... 3,006 2,232 Revolving charge accounts ........ 2,518 2,355 Financing leases (direct and sales-type) .......... 1,242 1,092 Operating loans ........................ 84 239
Total financing receivables .... 20,859 2,959 18,583 2,292
Less: Unearned finance income: Equipment notes .............. 635 36 590 27 Financing leases .............. 121 113
Total ............................ 756 36 703 27
Allowance for doubtful receivables ...................... 179 18 198 27
Financing receivables – net............... $ 19,924 $ 2,905 $ 17,682 $ 2,238
The residual values for investments in financing leases at October 31, 2011 and 2010 totaled $75 million and $64 million, respectively.
Financing receivables have significant concentrations of credit risk in the agriculture and turf sector and construction and forestry sector as shown in the previous table. On a geographic basis, there is not a disproportionate concentration of credit risk in any area. The company retains as collateral a security interest in the equipment associated with retail notes, wholesale notes and financing leases.
Financing receivables at October 31 related to the company’s sales of equipment that were included in the table above consisted of the following in millions of dollars:
2011 2010 Unrestricted Unrestricted
Retail notes*: Equipment: Agriculture and turf ...................... $ 1,633 $ 1,492 Construction and forestry ............. 310 295
Total ........................................ 1,943 1,787Wholesale notes ................................... 3,006 2,232Sales-type leases ................................. 776 655
Total ............................................ $ 5,725 $ 4,674
* These retail notes generally arise from sales of equipment by company-owned deal-ers or through direct sales.
(continued)
2011 2010 Unrestricted Unrestricted
Less: Unearned finance income: Equipment notes .......................... $ 197 $ 179 Sales-type leases ......................... 64 57
Total ........................................ 261 236
Financing receivables related to the company’s sales of equipment ....................... $ 5,464 $ 4,438
Financing receivable installments, including unearned finance income, at October 31 are scheduled as follows in millions of dollars:
2011 2010 ________________ _________________ Unrestricted/Securitized Unrestricted/Securitized
Due in months: 0 – 12 .............................. $ 10,311 $ 1,192 $ 9,114 $ 1,043 13 – 24 .............................. 3,937 807 3,538 662 25 – 36 .............................. 2,960 524 2,606 391 37 – 48 .............................. 2,032 305 1,821 159 49 – 60 .............................. 1,196 119 1,092 35 Thereafter .......................... 423 12 412 2
Total ..................................... $ 20,859 $ 2,959 $ 18,583 $ 2,292
The maximum terms for retail notes are generally seven years for agriculture and turf equipment and five years for construction and forestry equipment. The maximum term for financing leases is generally five years, while the average term for wholesale notes is less than twelve months.
At October 31, 2011 and 2010, the unpaid balances of receivables administered but not owned were $146 million and $202 million, respectively. At October 31, 2011 and 2010, worldwide financing receivables administered, which include financing receivables administered but not owned, totaled $22,974 million and $20,123 million, respectively.
Past due balances of financing receivables represent the total balance held (principal plus accrued interest) with any payment amounts 30 days or more past the contractual payment due date. Non-performing financing receivables represent loans for which the company has ceased accruing finance income. These receivables are generally 120 days delinquent and the estimated uncollectible amount, after charging the dealer’s withholding account, has been written off to the allowance for credit losses. Finance income for non-performing receivables is recognized on a cash basis. Accrual of finance income is resumed when the receivable becomes contractually current and collections are reasonably assured.
39
30409 Deere 2011.indd 29 12/15/11 10:24 AM
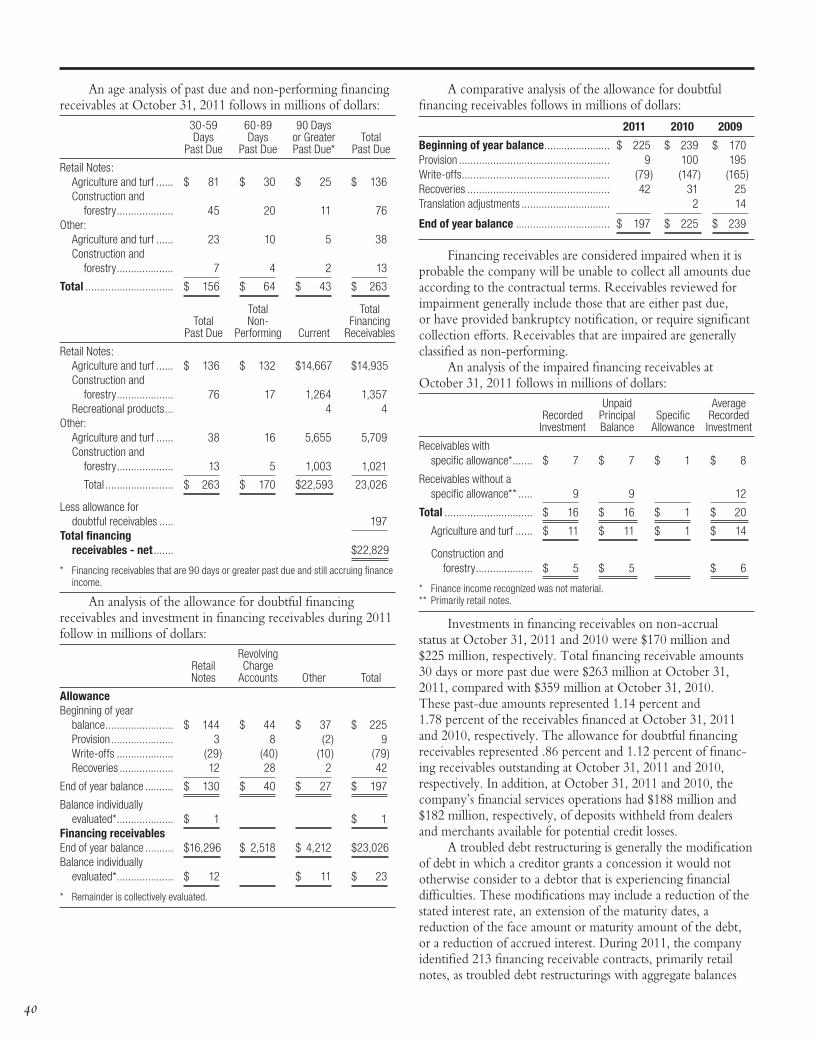
An age analysis of past due and non-performing financing receivables at October 31, 2011 follows in millions of dollars: 30-59 60-89 90 Days Days Days or Greater Total Past Due Past Due Past Due* Past Due
Retail Notes: Agriculture and turf ...... $ 81 $ 30 $ 25 $ 136 Construction and forestry .................... 45 20 11 76Other: Agriculture and turf ...... 23 10 5 38 Construction and forestry .................... 7 4 2 13
Total ............................... $ 156 $ 64 $ 43 $ 263
Total Total Total Non- Financing Past Due Performing Current Receivables
Retail Notes: Agriculture and turf ...... $ 136 $ 132 $ 14,667 $ 14,935 Construction and forestry .................... 76 17 1,264 1,357 Recreational products ... 4 4Other: Agriculture and turf ...... 38 16 5,655 5,709 Construction and forestry .................... 13 5 1,003 1,021
Total ........................ $ 263 $ 170 $ 22,593 23,026
Less allowance for doubtful receivables ..... 197Total financing receivables - net ....... $ 22,829
* Financing receivables that are 90 days or greater past due and still accruing finance income.
An analysis of the allowance for doubtful financing receivables and investment in financing receivables during 2011 follow in millions of dollars: Revolving Retail Charge Notes Accounts Other Total
AllowanceBeginning of year balance ........................ $ 144 $ 44 $ 37 $ 225 Provision ...................... 3 8 (2) 9 Write-offs .................... (29) (40) (10) (79) Recoveries ................... 12 28 2 42
End of year balance .......... $ 130 $ 40 $ 27 $ 197
Balance individually evaluated* .................... $ 1 $ 1Financing receivables End of year balance .......... $ 16,296 $ 2,518 $ 4,212 $ 23,026Balance individually evaluated* .................... $ 12 $ 11 $ 23
* Remainder is collectively evaluated.
A comparative analysis of the allowance for doubtful financing receivables follows in millions of dollars:
2011 2010 2009
Beginning of year balance ....................... $ 225 $ 239 $ 170Provision ..................................................... 9 100 195Write-offs .................................................... (79) (147) (165)Recoveries .................................................. 42 31 25Translation adjustments ............................... 2 14
End of year balance ................................. $ 197 $ 225 $ 239
Financing receivables are considered impaired when it is probable the company will be unable to collect all amounts due according to the contractual terms. Receivables reviewed for impairment generally include those that are either past due, or have provided bankruptcy notification, or require significant collection efforts. Receivables that are impaired are generally classified as non-performing.
An analysis of the impaired financing receivables at October 31, 2011 follows in millions of dollars: Unpaid Average Recorded Principal Specific Recorded Investment Balance Allowance Investment
Receivables with specific allowance* ....... $ 7 $ 7 $ 1 $ 8
Receivables without a specific allowance** ..... 9 9 12
Total ............................... $ 16 $ 16 $ 1 $ 20
Agriculture and turf ...... $ 11 $ 11 $ 1 $ 14
Construction and forestry .................... $ 5 $ 5 $ 6
* Finance income recognized was not material.** Primarily retail notes.
Investments in financing receivables on non-accrual status at October 31, 2011 and 2010 were $170 million and $225 million, respectively. Total financing receivable amounts 30 days or more past due were $263 million at October 31, 2011, compared with $359 million at October 31, 2010. These past-due amounts represented 1.14 percent and 1.78 percent of the receivables financed at October 31, 2011 and 2010, respectively. The allowance for doubtful financing receivables represented .86 percent and 1.12 percent of financ-ing receivables outstanding at October 31, 2011 and 2010, respectively. In addition, at October 31, 2011 and 2010, the company’s financial services operations had $188 million and $182 million, respectively, of deposits withheld from dealers and merchants available for potential credit losses.
A troubled debt restructuring is generally the modification of debt in which a creditor grants a concession it would not otherwise consider to a debtor that is experiencing financial difficulties. These modifications may include a reduction of the stated interest rate, an extension of the maturity dates, a reduction of the face amount or maturity amount of the debt, or a reduction of accrued interest. During 2011, the company identified 213 financing receivable contracts, primarily retail notes, as troubled debt restructurings with aggregate balances
40
30409 Deere 2011.indd 30 12/15/11 10:24 AM
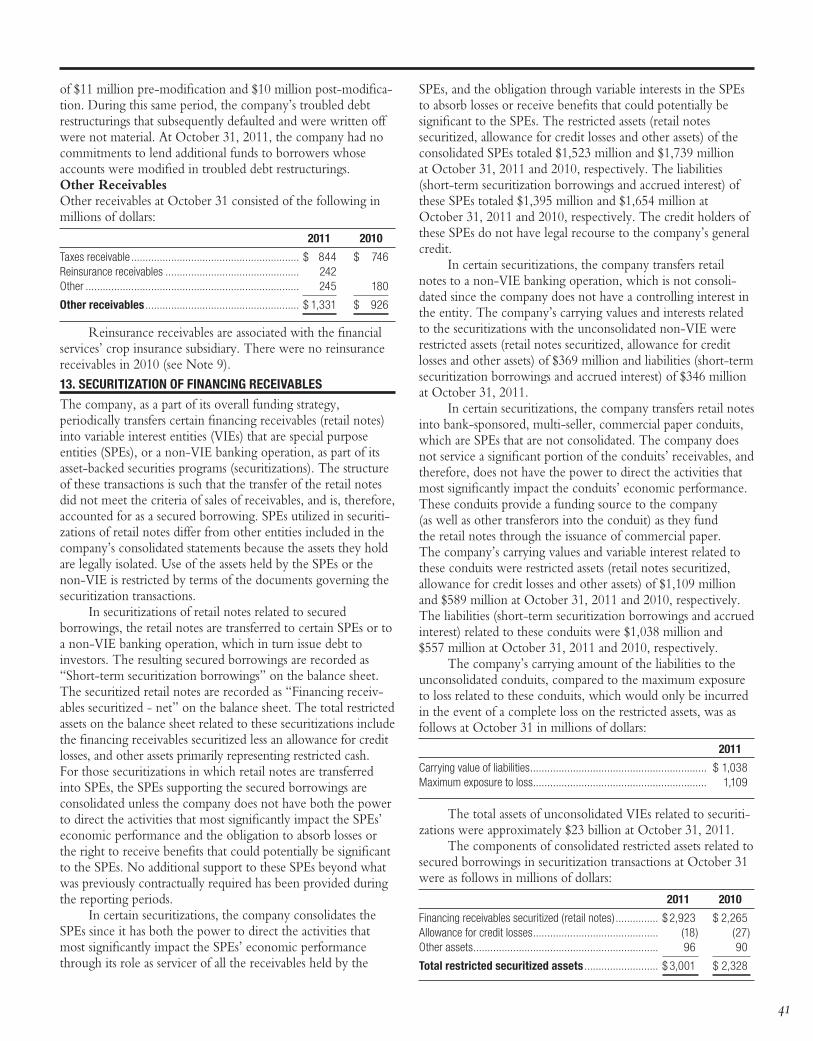
SPEs, and the obligation through variable interests in the SPEs to absorb losses or receive benefits that could potentially be significant to the SPEs. The restricted assets (retail notes securitized, allowance for credit losses and other assets) of the consolidated SPEs totaled $1,523 million and $1,739 million at October 31, 2011 and 2010, respectively. The liabilities (short-term securitization borrowings and accrued interest) of these SPEs totaled $1,395 million and $1,654 million at October 31, 2011 and 2010, respectively. The credit holders of these SPEs do not have legal recourse to the company’s general credit.
In certain securitizations, the company transfers retail notes to a non-VIE banking operation, which is not consoli-dated since the company does not have a controlling interest in the entity. The company’s carrying values and interests related to the securitizations with the unconsolidated non-VIE were restricted assets (retail notes securitized, allowance for credit losses and other assets) of $369 million and liabilities (short-term securitization borrowings and accrued interest) of $346 million at October 31, 2011.
In certain securitizations, the company transfers retail notes into bank-sponsored, multi-seller, commercial paper conduits, which are SPEs that are not consolidated. The company does not service a significant portion of the conduits’ receivables, and therefore, does not have the power to direct the activities that most significantly impact the conduits’ economic performance. These conduits provide a funding source to the company (as well as other transferors into the conduit) as they fund the retail notes through the issuance of commercial paper. The company’s carrying values and variable interest related to these conduits were restricted assets (retail notes securitized, allowance for credit losses and other assets) of $1,109 million and $589 million at October 31, 2011 and 2010, respectively. The liabilities (short-term securitization borrowings and accrued interest) related to these conduits were $1,038 million and $557 million at October 31, 2011 and 2010, respectively.
The company’s carrying amount of the liabilities to the unconsolidated conduits, compared to the maximum exposure to loss related to these conduits, which would only be incurred in the event of a complete loss on the restricted assets, was as follows at October 31 in millions of dollars:
2011
Carrying value of liabilities .............................................................. $ 1,038Maximum exposure to loss ............................................................. 1,109
The total assets of unconsolidated VIEs related to securiti-zations were approximately $23 billion at October 31, 2011.
The components of consolidated restricted assets related to secured borrowings in securitization transactions at October 31 were as follows in millions of dollars:
2011 2010
Financing receivables securitized (retail notes) ............... $ 2,923 $ 2,265 Allowance for credit losses ............................................ (18) (27)Other assets ................................................................. 96 90
Total restricted securitized assets .......................... $ 3,001 $ 2,328
of $11 million pre-modification and $10 million post-modifica-tion. During this same period, the company’s troubled debt restructurings that subsequently defaulted and were written off were not material. At October 31, 2011, the company had no commitments to lend additional funds to borrowers whose accounts were modified in troubled debt restructurings.Other ReceivablesOther receivables at October 31 consisted of the following in millions of dollars:
2011 2010
Taxes receivable ........................................................... $ 844 $ 746Reinsurance receivables ............................................... 242 Other ........................................................................... 245 180
Other receivables ...................................................... $ 1,331 $ 926
Reinsurance receivables are associated with the financial services’ crop insurance subsidiary. There were no reinsurance receivables in 2010 (see Note 9).13. SECURITIzATION OF FINANCING RECEIVABLES
The company, as a part of its overall funding strategy, periodically transfers certain financing receivables (retail notes) into variable interest entities (VIEs) that are special purpose entities (SPEs), or a non-VIE banking operation, as part of its asset-backed securities programs (securitizations). The structure of these transactions is such that the transfer of the retail notes did not meet the criteria of sales of receivables, and is, therefore, accounted for as a secured borrowing. SPEs utilized in securiti-zations of retail notes differ from other entities included in the company’s consolidated statements because the assets they hold are legally isolated. Use of the assets held by the SPEs or the non-VIE is restricted by terms of the documents governing the securitization transactions.
In securitizations of retail notes related to secured borrowings, the retail notes are transferred to certain SPEs or to a non-VIE banking operation, which in turn issue debt to investors. The resulting secured borrowings are recorded as “Short-term securitization borrowings” on the balance sheet. The securitized retail notes are recorded as “Financing receiv-ables securitized - net” on the balance sheet. The total restricted assets on the balance sheet related to these securitizations include the financing receivables securitized less an allowance for credit losses, and other assets primarily representing restricted cash. For those securitizations in which retail notes are transferred into SPEs, the SPEs supporting the secured borrowings are consolidated unless the company does not have both the power to direct the activities that most significantly impact the SPEs’ economic performance and the obligation to absorb losses or the right to receive benefits that could potentially be significant to the SPEs. No additional support to these SPEs beyond what was previously contractually required has been provided during the reporting periods.
In certain securitizations, the company consolidates the SPEs since it has both the power to direct the activities that most significantly impact the SPEs’ economic performance through its role as servicer of all the receivables held by the
41
30409 Deere 2011.indd 31 12/15/11 10:24 AM
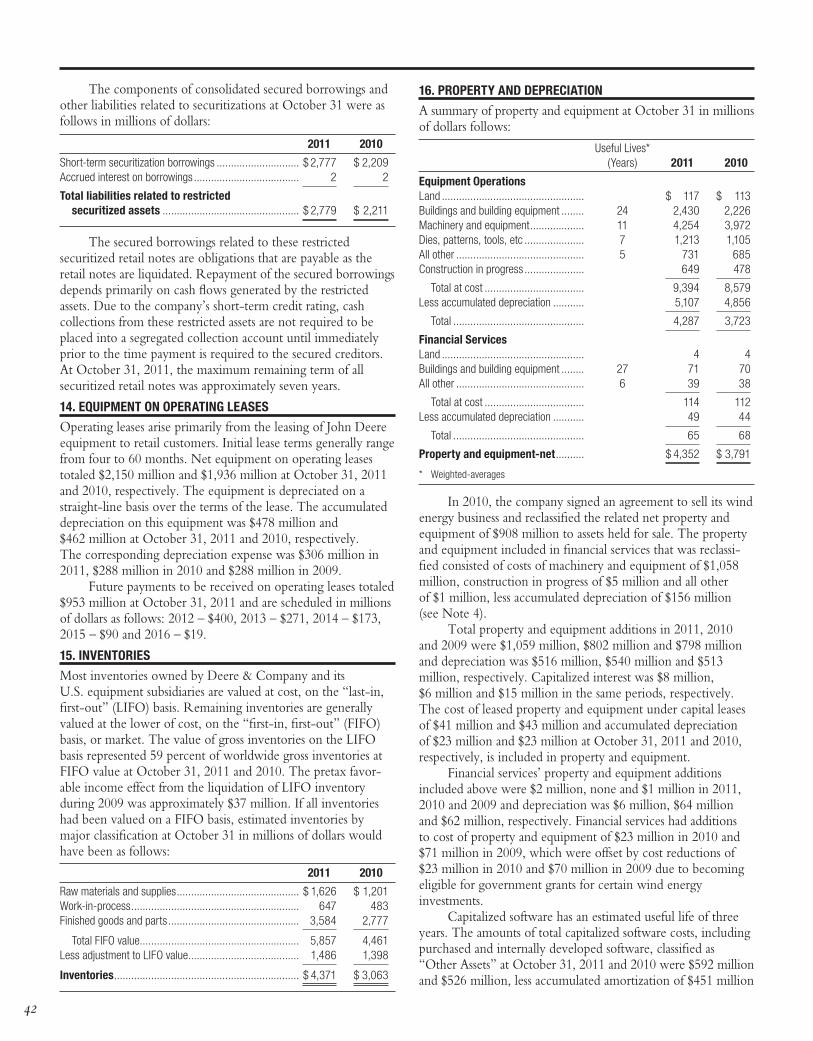
The components of consolidated secured borrowings and other liabilities related to securitizations at October 31 were as follows in millions of dollars:
2011 2010
Short-term securitization borrowings ............................. $ 2,777 $ 2,209Accrued interest on borrowings ..................................... 2 2
Total liabilities related to restricted securitized assets ................................................ $ 2,779 $ 2,211
The secured borrowings related to these restricted securitized retail notes are obligations that are payable as the retail notes are liquidated. Repayment of the secured borrowings depends primarily on cash flows generated by the restricted assets. Due to the company’s short-term credit rating, cash collections from these restricted assets are not required to be placed into a segregated collection account until immediately prior to the time payment is required to the secured creditors. At October 31, 2011, the maximum remaining term of all securitized retail notes was approximately seven years.
14. EQUIPMENT ON OPERATING LEASES
Operating leases arise primarily from the leasing of John Deere equipment to retail customers. Initial lease terms generally range from four to 60 months. Net equipment on operating leases totaled $2,150 million and $1,936 million at October 31, 2011 and 2010, respectively. The equipment is depreciated on a straight-line basis over the terms of the lease. The accumulated depreciation on this equipment was $478 million and $462 million at October 31, 2011 and 2010, respectively. The corresponding depreciation expense was $306 million in 2011, $288 million in 2010 and $288 million in 2009.
Future payments to be received on operating leases totaled $953 million at October 31, 2011 and are scheduled in millions of dollars as follows: 2012 – $400, 2013 – $271, 2014 – $173, 2015 – $90 and 2016 – $19.
15. INVENTORIES
Most inventories owned by Deere & Company and its U.S. equipment subsidiaries are valued at cost, on the “last-in, first-out” (LIFO) basis. Remaining inventories are generally valued at the lower of cost, on the “first-in, first-out” (FIFO) basis, or market. The value of gross inventories on the LIFO basis represented 59 percent of worldwide gross inventories at FIFO value at October 31, 2011 and 2010. The pretax favor-able income effect from the liquidation of LIFO inventory during 2009 was approximately $37 million. If all inventories had been valued on a FIFO basis, estimated inventories by major classification at October 31 in millions of dollars would have been as follows:
2011 2010
Raw materials and supplies ........................................... $ 1,626 $ 1,201Work-in-process ........................................................... 647 483Finished goods and parts .............................................. 3,584 2,777
Total FIFO value ........................................................ 5,857 4,461Less adjustment to LIFO value ....................................... 1,486 1,398
Inventories ................................................................. $ 4,371 $ 3,063
16. PROPERTY AND DEPRECIATION
A summary of property and equipment at October 31 in millions of dollars follows:
Useful Lives* (Years) 2011 2010
Equipment OperationsLand .................................................. $ 117 $ 113Buildings and building equipment ........ 24 2,430 2,226Machinery and equipment ................... 11 4,254 3,972Dies, patterns, tools, etc ..................... 7 1,213 1,105All other ............................................. 5 731 685Construction in progress ..................... 649 478
Total at cost ................................... 9,394 8,579Less accumulated depreciation ........... 5,107 4,856
Total .............................................. 4,287 3,723
Financial ServicesLand .................................................. 4 4Buildings and building equipment ........ 27 71 70All other ............................................. 6 39 38
Total at cost ................................... 114 112Less accumulated depreciation ........... 49 44
Total .............................................. 65 68
Property and equipment-net .......... $ 4,352 $ 3,791
* Weighted-averages
In 2010, the company signed an agreement to sell its wind energy business and reclassified the related net property and equipment of $908 million to assets held for sale. The property and equipment included in financial services that was reclassi-fied consisted of costs of machinery and equipment of $1,058 million, construction in progress of $5 million and all other of $1 million, less accumulated depreciation of $156 million (see Note 4).
Total property and equipment additions in 2011, 2010 and 2009 were $1,059 million, $802 million and $798 million and depreciation was $516 million, $540 million and $513 million, respectively. Capitalized interest was $8 million, $6 million and $15 million in the same periods, respectively. The cost of leased property and equipment under capital leases of $41 million and $43 million and accumulated depreciation of $23 million and $23 million at October 31, 2011 and 2010, respectively, is included in property and equipment.
Financial services’ property and equipment additions included above were $2 million, none and $1 million in 2011, 2010 and 2009 and depreciation was $6 million, $64 million and $62 million, respectively. Financial services had additions to cost of property and equipment of $23 million in 2010 and $71 million in 2009, which were offset by cost reductions of $23 million in 2010 and $70 million in 2009 due to becoming eligible for government grants for certain wind energy investments.
Capitalized software has an estimated useful life of three years. The amounts of total capitalized software costs, including purchased and internally developed software, classified as “Other Assets” at October 31, 2011 and 2010 were $592 million and $526 million, less accumulated amortization of $451 million
42
30409 Deere 2011.indd 32 12/15/11 10:24 AM
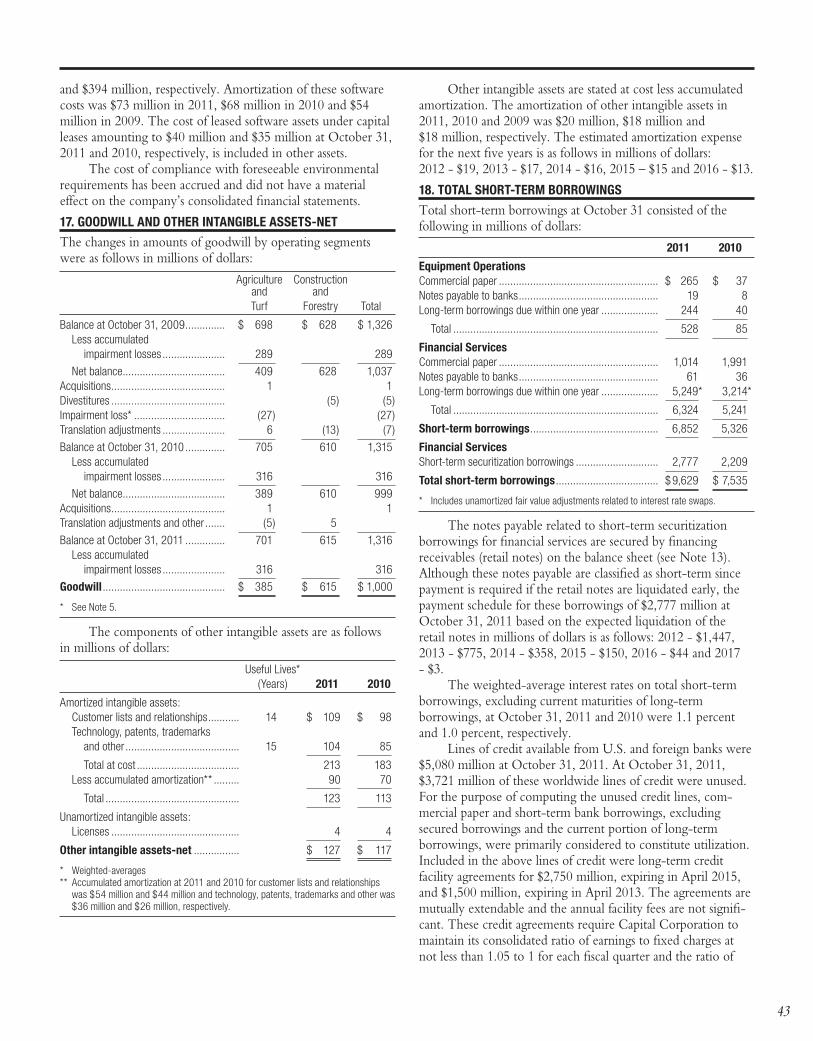
and $394 million, respectively. Amortization of these software costs was $73 million in 2011, $68 million in 2010 and $54 million in 2009. The cost of leased software assets under capital leases amounting to $40 million and $35 million at October 31, 2011 and 2010, respectively, is included in other assets.
The cost of compliance with foreseeable environmental requirements has been accrued and did not have a material effect on the company’s consolidated financial statements.
17. GOODWILL AND OTHER INTANGIBLE ASSETS-NET
The changes in amounts of goodwill by operating segments were as follows in millions of dollars:
Agriculture Construction and and Turf Forestry Total
Balance at October 31, 2009 .............. $ 698 $ 628 $ 1,326 Less accumulated impairment losses ...................... 289 289
Net balance .................................... 409 628 1,037Acquisitions ........................................ 1 1Divestitures ........................................ (5) (5)Impairment loss* ................................ (27) (27)Translation adjustments ...................... 6 (13) (7)
Balance at October 31, 2010 .............. 705 610 1,315 Less accumulated impairment losses ...................... 316 316
Net balance .................................... 389 610 999Acquisitions ........................................ 1 1Translation adjustments and other ....... (5) 5
Balance at October 31, 2011 .............. 701 615 1,316 Less accumulated impairment losses ...................... 316 316
Goodwill ........................................... $ 385 $ 615 $ 1,000
* See Note 5.
The components of other intangible assets are as follows in millions of dollars:
Useful Lives* (Years) 2011 2010
Amortized intangible assets: Customer lists and relationships ........... 14 $ 109 $ 98 Technology, patents, trademarks and other ........................................ 15 104 85
Total at cost .................................... 213 183 Less accumulated amortization** ......... 90 70
Total ............................................... 123 113
Unamortized intangible assets: Licenses ............................................. 4 4
Other intangible assets-net ................ $ 127 $ 117
* Weighted-averages** Accumulated amortization at 2011 and 2010 for customer lists and relationships
was $54 million and $44 million and technology, patents, trademarks and other was $36 million and $26 million, respectively.
Other intangible assets are stated at cost less accumulated amortization. The amortization of other intangible assets in 2011, 2010 and 2009 was $20 million, $18 million and $18 million, respectively. The estimated amortization expense for the next five years is as follows in millions of dollars: 2012 - $19, 2013 - $17, 2014 - $16, 2015 – $15 and 2016 - $13.
18. TOTAL SHORT-TERM BORROWINGS
Total short-term borrowings at October 31 consisted of the following in millions of dollars:
2011 2010
Equipment OperationsCommercial paper ........................................................ $ 265 $ 37Notes payable to banks ................................................. 19 8Long-term borrowings due within one year .................... 244 40
Total ........................................................................ 528 85
Financial ServicesCommercial paper ........................................................ 1,014 1,991Notes payable to banks ................................................. 61 36Long-term borrowings due within one year .................... 5,249* 3,214*
Total ........................................................................ 6,324 5,241
Short-term borrowings ............................................. 6,852 5,326
Financial ServicesShort-term securitization borrowings ............................. 2,777 2,209
Total short-term borrowings .................................... $ 9,629 $ 7,535
* Includes unamortized fair value adjustments related to interest rate swaps.
The notes payable related to short-term securitization borrowings for financial services are secured by financing receivables (retail notes) on the balance sheet (see Note 13). Although these notes payable are classified as short-term since payment is required if the retail notes are liquidated early, the payment schedule for these borrowings of $2,777 million at October 31, 2011 based on the expected liquidation of the retail notes in millions of dollars is as follows: 2012 - $1,447, 2013 - $775, 2014 - $358, 2015 - $150, 2016 - $44 and 2017 - $3.
The weighted-average interest rates on total short-term borrowings, excluding current maturities of long-term borrowings, at October 31, 2011 and 2010 were 1.1 percent and 1.0 percent, respectively.
Lines of credit available from U.S. and foreign banks were $5,080 million at October 31, 2011. At October 31, 2011, $3,721 million of these worldwide lines of credit were unused. For the purpose of computing the unused credit lines, com-mercial paper and short-term bank borrowings, excluding secured borrowings and the current portion of long-term borrowings, were primarily considered to constitute utilization. Included in the above lines of credit were long-term credit facility agreements for $2,750 million, expiring in April 2015, and $1,500 million, expiring in April 2013. The agreements are mutually extendable and the annual facility fees are not signifi-cant. These credit agreements require Capital Corporation to maintain its consolidated ratio of earnings to fixed charges at not less than 1.05 to 1 for each fiscal quarter and the ratio of
43
30409 Deere 2011.indd 33 12/15/11 10:24 AM
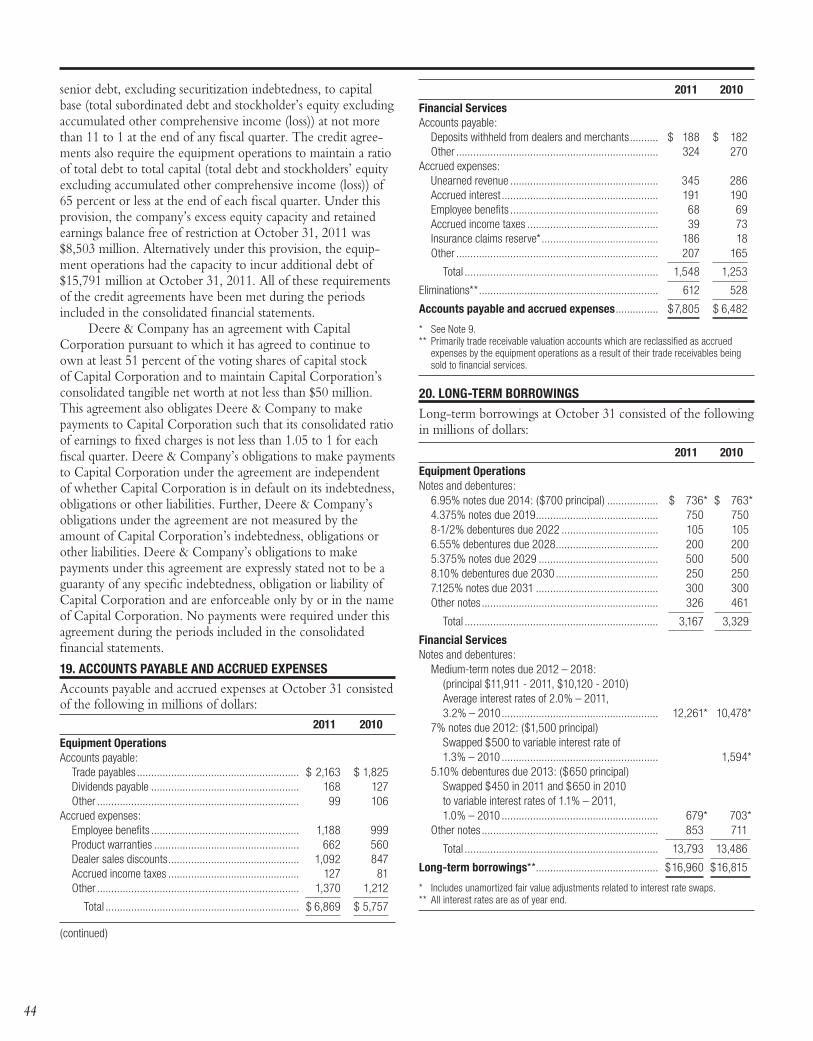
2011 2010
Financial Services Accounts payable: Deposits withheld from dealers and merchants .......... $ 188 $ 182 Other ....................................................................... 324 270Accrued expenses: Unearned revenue .................................................... 345 286 Accrued interest ....................................................... 191 190 Employee benefits .................................................... 68 69 Accrued income taxes .............................................. 39 73 Insurance claims reserve* ......................................... 186 18 Other ....................................................................... 207 165
Total .................................................................... 1,548 1,253
Eliminations** ............................................................... 612 528
Accounts payable and accrued expenses ............... $ 7,805 $ 6,482
* See Note 9.** Primarily trade receivable valuation accounts which are reclassified as accrued
expenses by the equipment operations as a result of their trade receivables being sold to financial services.
20. LONG-TERM BORROWINGS
Long-term borrowings at October 31 consisted of the following in millions of dollars:
2011 2010
Equipment OperationsNotes and debentures: 6.95% notes due 2014: ($700 principal) .................. $ 736* $ 763* 4.375% notes due 2019 ........................................... 750 750 8-1/2% debentures due 2022 .................................. 105 105 6.55% debentures due 2028 .................................... 200 200 5.375% notes due 2029 .......................................... 500 500 8.10% debentures due 2030 .................................... 250 250 7.125% notes due 2031 ........................................... 300 300 Other notes .............................................................. 326 461
Total .................................................................... 3,167 3,329
Financial ServicesNotes and debentures: Medium-term notes due 2012 – 2018: (principal $11,911 - 2011, $10,120 - 2010) Average interest rates of 2.0% – 2011, 3.2% – 2010 ....................................................... 12,261* 10,478* 7% notes due 2012: ($1,500 principal) Swapped $500 to variable interest rate of 1.3% – 2010 ....................................................... 1,594* 5.10% debentures due 2013: ($650 principal) Swapped $450 in 2011 and $650 in 2010 to variable interest rates of 1.1% – 2011, 1.0% – 2010 ....................................................... 679* 703* Other notes .............................................................. 853 711
Total .................................................................... 13,793 13,486
Long-term borrowings** ........................................... $ 16,960 $ 16,815
* Includes unamortized fair value adjustments related to interest rate swaps.** All interest rates are as of year end.
senior debt, excluding securitization indebtedness, to capital base (total subordinated debt and stockholder’s equity excluding accumulated other comprehensive income (loss)) at not more than 11 to 1 at the end of any fiscal quarter. The credit agree-ments also require the equipment operations to maintain a ratio of total debt to total capital (total debt and stockholders’ equity excluding accumulated other comprehensive income (loss)) of 65 percent or less at the end of each fiscal quarter. Under this provision, the company’s excess equity capacity and retained earnings balance free of restriction at October 31, 2011 was $8,503 million. Alternatively under this provision, the equip-ment operations had the capacity to incur additional debt of $15,791 million at October 31, 2011. All of these requirements of the credit agreements have been met during the periods included in the consolidated financial statements.
Deere & Company has an agreement with Capital Corporation pursuant to which it has agreed to continue to own at least 51 percent of the voting shares of capital stock of Capital Corporation and to maintain Capital Corporation’s consolidated tangible net worth at not less than $50 million. This agreement also obligates Deere & Company to make payments to Capital Corporation such that its consolidated ratio of earnings to fixed charges is not less than 1.05 to 1 for each fiscal quarter. Deere & Company’s obligations to make payments to Capital Corporation under the agreement are independent of whether Capital Corporation is in default on its indebtedness, obligations or other liabilities. Further, Deere & Company’s obligations under the agreement are not measured by the amount of Capital Corporation’s indebtedness, obligations or other liabilities. Deere & Company’s obligations to make payments under this agreement are expressly stated not to be a guaranty of any specific indebtedness, obligation or liability of Capital Corporation and are enforceable only by or in the name of Capital Corporation. No payments were required under this agreement during the periods included in the consolidated financial statements.
19. ACCOUNTS PAYABLE AND ACCRUED EXPENSESAccounts payable and accrued expenses at October 31 consisted of the following in millions of dollars:
2011 2010
Equipment OperationsAccounts payable: Trade payables ......................................................... $ 2,163 $ 1,825 Dividends payable .................................................... 168 127 Other ....................................................................... 99 106Accrued expenses: Employee benefits .................................................... 1,188 999 Product warranties ................................................... 662 560 Dealer sales discounts .............................................. 1,092 847 Accrued income taxes .............................................. 127 81 Other ....................................................................... 1,370 1,212
Total .................................................................... $ 6,869 $ 5,757
(continued)
44
30409 Deere 2011.indd 34 12/15/11 10:24 AM
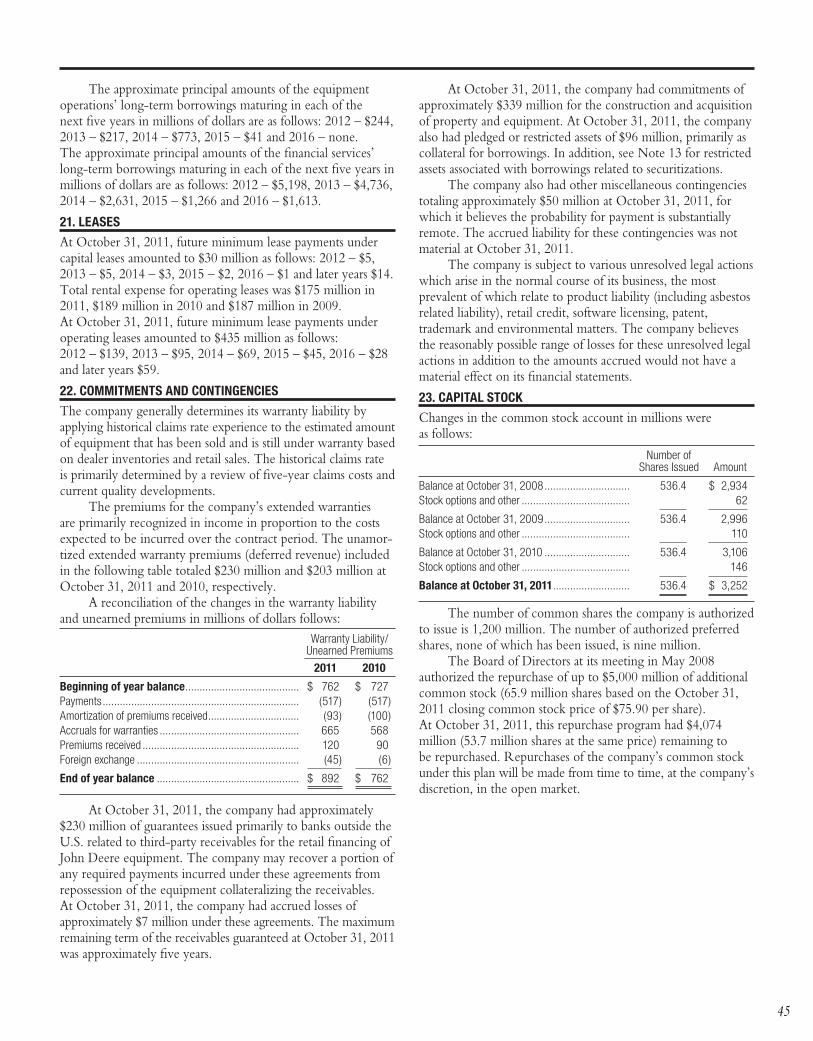
The approximate principal amounts of the equipment operations’ long-term borrowings maturing in each of the next five years in millions of dollars are as follows: 2012 – $244, 2013 – $217, 2014 – $773, 2015 – $41 and 2016 – none. The approximate principal amounts of the financial services’ long-term borrowings maturing in each of the next five years in millions of dollars are as follows: 2012 – $5,198, 2013 – $4,736, 2014 – $2,631, 2015 – $1,266 and 2016 – $1,613.
21. LEASES
At October 31, 2011, future minimum lease payments under capital leases amounted to $30 million as follows: 2012 – $5, 2013 – $5, 2014 – $3, 2015 – $2, 2016 – $1 and later years $14. Total rental expense for operating leases was $175 million in 2011, $189 million in 2010 and $187 million in 2009. At October 31, 2011, future minimum lease payments under operating leases amounted to $435 million as follows: 2012 – $139, 2013 – $95, 2014 – $69, 2015 – $45, 2016 – $28 and later years $59.
22. COMMITMENTS AND CONTINGENCIES
The company generally determines its warranty liability by applying historical claims rate experience to the estimated amount of equipment that has been sold and is still under warranty based on dealer inventories and retail sales. The historical claims rate is primarily determined by a review of five-year claims costs and current quality developments.
The premiums for the company’s extended warranties are primarily recognized in income in proportion to the costs expected to be incurred over the contract period. The unamor-tized extended warranty premiums (deferred revenue) included in the following table totaled $230 million and $203 million at October 31, 2011 and 2010, respectively.
A reconciliation of the changes in the warranty liability and unearned premiums in millions of dollars follows: Warranty Liability/ Unearned Premiums _______________ 2011 2010
Beginning of year balance ........................................ $ 762 $ 727Payments ..................................................................... (517) (517)Amortization of premiums received ................................ (93) (100)Accruals for warranties ................................................. 665 568Premiums received ....................................................... 120 90Foreign exchange ......................................................... (45) (6)
End of year balance .................................................. $ 892 $ 762
At October 31, 2011, the company had approximately $230 million of guarantees issued primarily to banks outside the U.S. related to third-party receivables for the retail financing of John Deere equipment. The company may recover a portion of any required payments incurred under these agreements from repossession of the equipment collateralizing the receivables. At October 31, 2011, the company had accrued losses of approximately $7 million under these agreements. The maximum remaining term of the receivables guaranteed at October 31, 2011 was approximately five years.
At October 31, 2011, the company had commitments of approximately $339 million for the construction and acquisition of property and equipment. At October 31, 2011, the company also had pledged or restricted assets of $96 million, primarily as collateral for borrowings. In addition, see Note 13 for restricted assets associated with borrowings related to securitizations.
The company also had other miscellaneous contingencies totaling approximately $50 million at October 31, 2011, for which it believes the probability for payment is substantially remote. The accrued liability for these contingencies was not material at October 31, 2011.
The company is subject to various unresolved legal actions which arise in the normal course of its business, the most prevalent of which relate to product liability (including asbestos related liability), retail credit, software licensing, patent, trademark and environmental matters. The company believes the reasonably possible range of losses for these unresolved legal actions in addition to the amounts accrued would not have a material effect on its financial statements.
23. CAPITAL STOCK
Changes in the common stock account in millions were as follows:
Number of Shares Issued Amount
Balance at October 31, 2008 .............................. 536.4 $ 2,934Stock options and other ...................................... 62
Balance at October 31, 2009 .............................. 536.4 2,996Stock options and other ...................................... 110
Balance at October 31, 2010 .............................. 536.4 3,106Stock options and other ...................................... 146
Balance at October 31, 2011 ........................... 536.4 $ 3,252
The number of common shares the company is authorized to issue is 1,200 million. The number of authorized preferred shares, none of which has been issued, is nine million.
The Board of Directors at its meeting in May 2008 authorized the repurchase of up to $5,000 million of additional common stock (65.9 million shares based on the October 31, 2011 closing common stock price of $75.90 per share). At October 31, 2011, this repurchase program had $4,074 million (53.7 million shares at the same price) remaining to be repurchased. Repurchases of the company’s common stock under this plan will be made from time to time, at the company’s discretion, in the open market.
45
30409 Deere 2011.indd 35 12/15/11 10:24 AM
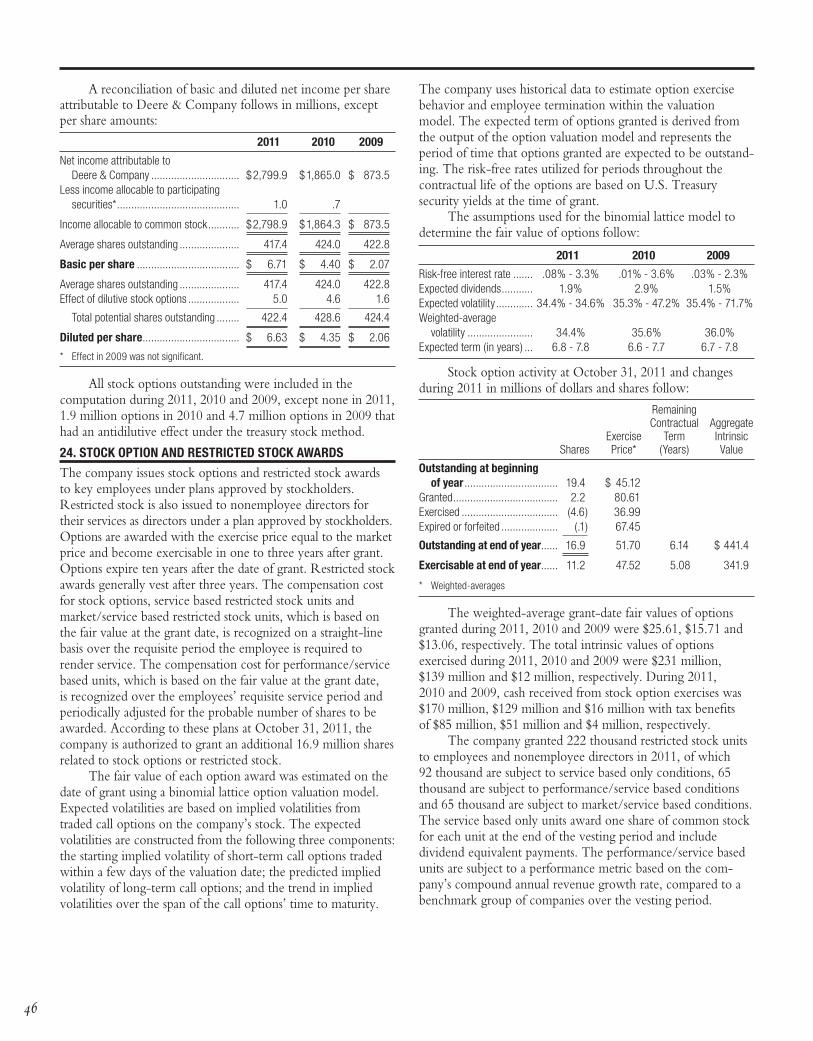
A reconciliation of basic and diluted net income per share attributable to Deere & Company follows in millions, except per share amounts:
2011 2010 2009
Net income attributable to Deere & Company ............................... $ 2,799.9 $ 1,865.0 $ 873.5Less income allocable to participating securities* ........................................... 1.0 .7
Income allocable to common stock ........... $ 2,798.9 $ 1,864.3 $ 873.5
Average shares outstanding ..................... 417.4 424.0 422.8
Basic per share .................................... $ 6.71 $ 4.40 $ 2.07
Average shares outstanding ..................... 417.4 424.0 422.8Effect of dilutive stock options .................. 5.0 4.6 1.6
Total potential shares outstanding ........ 422.4 428.6 424.4
Diluted per share .................................. $ 6.63 $ 4.35 $ 2.06
* Effect in 2009 was not significant.
All stock options outstanding were included in the computation during 2011, 2010 and 2009, except none in 2011, 1.9 million options in 2010 and 4.7 million options in 2009 that had an antidilutive effect under the treasury stock method.
24. STOCK OPTION AND RESTRICTED STOCK AWARDS
The company issues stock options and restricted stock awards to key employees under plans approved by stockholders. Restricted stock is also issued to nonemployee directors for their services as directors under a plan approved by stockholders. Options are awarded with the exercise price equal to the market price and become exercisable in one to three years after grant. Options expire ten years after the date of grant. Restricted stock awards generally vest after three years. The compensation cost for stock options, service based restricted stock units and market/service based restricted stock units, which is based on the fair value at the grant date, is recognized on a straight-line basis over the requisite period the employee is required to render service. The compensation cost for performance/service based units, which is based on the fair value at the grant date, is recognized over the employees’ requisite service period and periodically adjusted for the probable number of shares to be awarded. According to these plans at October 31, 2011, the company is authorized to grant an additional 16.9 million shares related to stock options or restricted stock.
The fair value of each option award was estimated on the date of grant using a binomial lattice option valuation model. Expected volatilities are based on implied volatilities from traded call options on the company’s stock. The expected volatilities are constructed from the following three components: the starting implied volatility of short-term call options traded within a few days of the valuation date; the predicted implied volatility of long-term call options; and the trend in implied volatilities over the span of the call options’ time to maturity.
The company uses historical data to estimate option exercise behavior and employee termination within the valuation model. The expected term of options granted is derived from the output of the option valuation model and represents the period of time that options granted are expected to be outstand-ing. The risk-free rates utilized for periods throughout the contractual life of the options are based on U.S. Treasury security yields at the time of grant.
The assumptions used for the binomial lattice model to determine the fair value of options follow:
2011 2010 2009
Risk-free interest rate ....... .08% - 3.3% .01% - 3.6% .03% - 2.3%Expected dividends ........... 1.9% 2.9% 1.5%Expected volatility ............. 34.4% - 34.6% 35.3% - 47.2% 35.4% - 71.7%Weighted-average volatility ....................... 34.4% 35.6% 36.0%Expected term (in years) ... 6.8 - 7.8 6.6 - 7.7 6.7 - 7.8
Stock option activity at October 31, 2011 and changes during 2011 in millions of dollars and shares follow:
Remaining Contractual Aggregate Exercise Term Intrinsic Shares Price* (Years) Value
Outstanding at beginning of year ................................. 19.4 $ 45.12 Granted ..................................... 2.2 80.61 Exercised .................................. (4.6) 36.99 Expired or forfeited .................... (.1) 67.45
Outstanding at end of year ...... 16.9 51.70 6.14 $ 441.4
Exercisable at end of year ...... 11.2 47.52 5.08 341.9
* Weighted-averages
The weighted-average grant-date fair values of options granted during 2011, 2010 and 2009 were $25.61, $15.71 and $13.06, respectively. The total intrinsic values of options exercised during 2011, 2010 and 2009 were $231 million, $139 million and $12 million, respectively. During 2011, 2010 and 2009, cash received from stock option exercises was $170 million, $129 million and $16 million with tax benefits of $85 million, $51 million and $4 million, respectively.
The company granted 222 thousand restricted stock units to employees and nonemployee directors in 2011, of which 92 thousand are subject to service based only conditions, 65 thousand are subject to performance/service based conditions and 65 thousand are subject to market/service based conditions. The service based only units award one share of common stock for each unit at the end of the vesting period and include dividend equivalent payments. The performance/service based units are subject to a performance metric based on the com-pany’s compound annual revenue growth rate, compared to a benchmark group of companies over the vesting period.
46
30409 Deere 2011.indd 36 12/15/11 10:24 AM

The market/service based units are subject to a market related metric based on total shareholder return, compared to the same benchmark group of companies over the vesting period. The performance/service based units and the market/service based units both award common stock in a range of zero to 200 percent for each unit granted based on the level of the metric achieved and do not include dividend equivalent payments over the vesting period. The weighted-average fair value of the service based only units at the grant dates was $81.90 per unit based on the market price of a share of underly-ing common stock. The fair value of the performance/service based units at the grant date was $76.17 per unit based on the market price of a share of underlying common stock excluding dividends. The fair value of the market/service based units at the grant date was $107.31 per unit based on a lattice valuation model excluding dividends.
The company’s nonvested restricted shares at October 31, 2011 and changes during 2011 in millions of shares follow:
Grant-Date Shares Fair Value*
Service based onlyNonvested at beginning of year ............................. .7 $ 54.62Granted ................................................................ .1 81.90Vested ................................................................. (.2) 84.68
Nonvested at end of year ...................................... .6 49.91
Performance/service and market/service basedGranted ................................................................ .1 91.74
Nonvested at end of year ...................................... .1 91.74
* Weighted-averages
During 2011, 2010 and 2009, the total share-based compensation expense was $69 million, $71 million and $70 million, respectively, with recognized income tax benefits of $26 million for all years. At October 31, 2011, there was $35 million of total unrecognized compensation cost from share-based compensation arrangements granted under the plans, which is related to nonvested shares. This compensation is expected to be recognized over a weighted-average period of approximately 2 years. The total grant date fair values of stock options and restricted shares vested during 2011, 2010 and 2009 were $72 million, $71 million and $66 million, respectively.
The company currently uses shares that have been repurchased through its stock repurchase programs to satisfy share option exercises. At October 31, 2011, the company had 130 million shares in treasury stock and 54 million shares remaining to be repurchased under its current publicly announced repurchase program (see Note 23).
25. OTHER COMPREHENSIVE INCOME ITEMS
Other comprehensive income items are transactions recorded in stockholders’ equity during the year, excluding net income and transactions with stockholders. Following are the items included in other comprehensive income (loss) for Deere & Company and the related tax effects in millions of dollars: Before Tax After Tax (Expense) Tax Amount Credit Amount
2009Retirement benefits adjustment: Net actuarial losses and prior service cost .............................. $ (4,198) $ 1,587 $(2,611) Reclassification of actuarial losses and prior service cost to net income .................................... 105 (31) 74
Net unrealized loss ................................ (4,093) 1,556 (2,537)
Cumulative translation adjustment .............. 326 1 327
Unrealized loss on derivatives: Hedging loss ......................................... (90) 31 (59) Reclassification of realized loss to net income .................................... 84 (29) 55
Net unrealized loss ................................ (6) 2 (4)
Unrealized gain on investments: Holding loss .......................................... (793) 278 (515) Reclassification of realized loss to net income ............................. 805 (282) 523
Net unrealized gain ................................ 12 (4) 8
Total other comprehensive income (loss) .... $ (3,761) $ 1,555 $ (2,206)
2010Retirement benefits adjustment: Net actuarial losses and prior service cost .............................. $ (213) $ 77 $ (136) Reclassification of actuarial losses and prior service cost to net income .................................... 474 (180) 294
Net unrealized gain ................................ 261 (103) 158
Cumulative translation adjustment .............. 49 (13) 36
Unrealized loss on derivatives: Hedging loss ......................................... (56) 19 (37) Reclassification of realized loss to net income .................................... 79 (27) 52
Net unrealized gain ................................ 23 (8) 15
Unrealized holding gain and net unrealized gain on investments .............. 8 (3) 5
Total other comprehensive income (loss) .... $ 341 $ (127) $ 214
(continued)
47
30409 Deere 2011.indd 37 12/15/11 10:24 AM
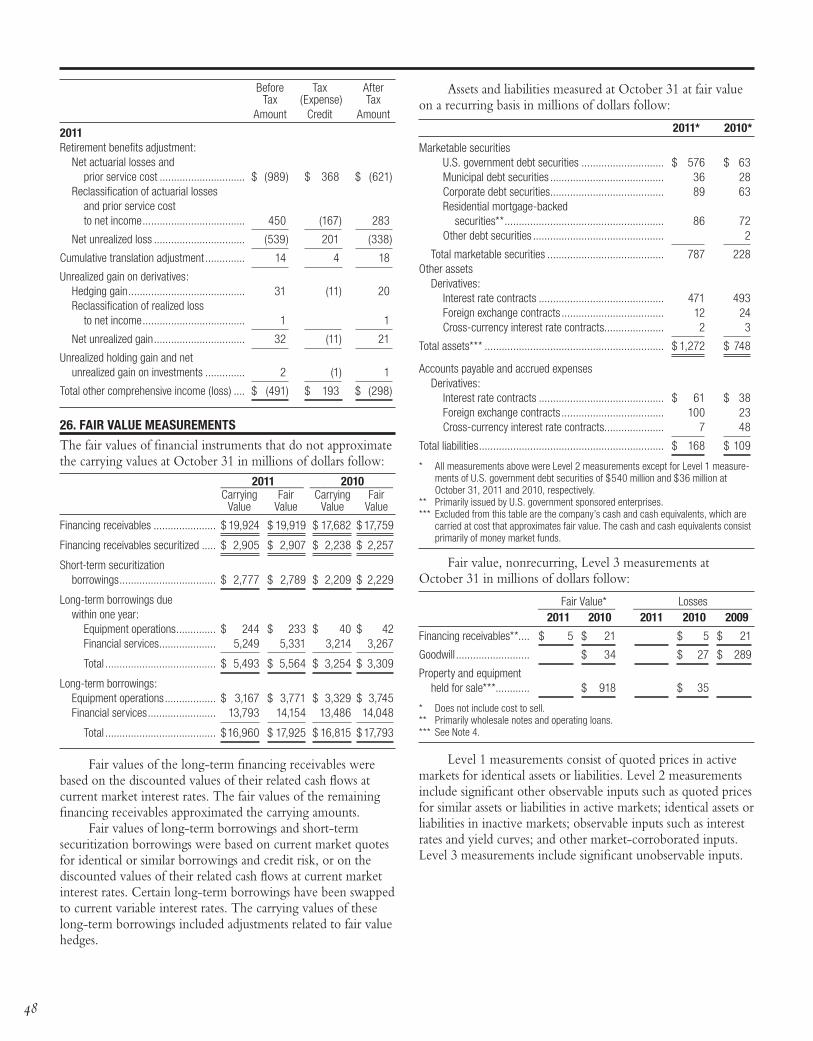
Before Tax After Tax (Expense) Tax Amount Credit Amount
2011Retirement benefits adjustment: Net actuarial losses and prior service cost .............................. $ (989) $ 368 $ (621) Reclassification of actuarial losses and prior service cost to net income .................................... 450 (167) 283
Net unrealized loss ................................ (539) 201 (338)
Cumulative translation adjustment .............. 14 4 18
Unrealized gain on derivatives: Hedging gain ......................................... 31 (11) 20 Reclassification of realized loss to net income .................................... 1 1
Net unrealized gain ................................ 32 (11) 21
Unrealized holding gain and net unrealized gain on investments .............. 2 (1) 1
Total other comprehensive income (loss) .... $ (491) $ 193 $ (298)
26. FAIR VALUE MEASUREMENTS
The fair values of financial instruments that do not approximate the carrying values at October 31 in millions of dollars follow: 2011 2010 ______________ ______________ Carrying Fair Carrying Fair Value Value Value Value
Financing receivables ...................... $ 19,924 $ 19,919 $ 17,682 $ 17,759
Financing receivables securitized ..... $ 2,905 $ 2,907 $ 2,238 $ 2,257
Short-term securitization borrowings .................................. $ 2,777 $ 2,789 $ 2,209 $ 2,229
Long-term borrowings due within one year: Equipment operations .............. $ 244 $ 233 $ 40 $ 42 Financial services .................... 5,249 5,331 3,214 3,267
Total ....................................... $ 5,493 $ 5,564 $ 3,254 $ 3,309
Long-term borrowings: Equipment operations .................. $ 3,167 $ 3,771 $ 3,329 $ 3,745 Financial services ........................ 13,793 14,154 13,486 14,048
Total ....................................... $ 16,960 $ 17,925 $ 16,815 $ 17,793
Fair values of the long-term financing receivables were based on the discounted values of their related cash flows at current market interest rates. The fair values of the remaining financing receivables approximated the carrying amounts.
Fair values of long-term borrowings and short-term securitization borrowings were based on current market quotes for identical or similar borrowings and credit risk, or on the discounted values of their related cash flows at current market interest rates. Certain long-term borrowings have been swapped to current variable interest rates. The carrying values of these long-term borrowings included adjustments related to fair value hedges.
Assets and liabilities measured at October 31 at fair value on a recurring basis in millions of dollars follow:
2011* 2010* Marketable securities U.S. government debt securities ............................. $ 576 $ 63 Municipal debt securities ........................................ 36 28 Corporate debt securities ........................................ 89 63 Residential mortgage-backed securities** ........................................................ 86 72 Other debt securities .............................................. 2
Total marketable securities ......................................... 787 228Other assets Derivatives: Interest rate contracts ............................................ 471 493 Foreign exchange contracts .................................... 12 24 Cross-currency interest rate contracts ..................... 2 3
Total assets*** ............................................................... $ 1,272 $ 748
Accounts payable and accrued expenses Derivatives: Interest rate contracts ............................................ $ 61 $ 38 Foreign exchange contracts .................................... 100 23 Cross-currency interest rate contracts ..................... 7 48
Total liabilities ................................................................. $ 168 $ 109
* All measurements above were Level 2 measurements except for Level 1 measure-ments of U.S. government debt securities of $540 million and $36 million at October 31, 2011 and 2010, respectively.
** Primarily issued by U.S. government sponsored enterprises.*** Excluded from this table are the company’s cash and cash equivalents, which are
carried at cost that approximates fair value. The cash and cash equivalents consist primarily of money market funds.
Fair value, nonrecurring, Level 3 measurements at October 31 in millions of dollars follow:
Fair Value* Losses _____________ ____________________ 2011 2010 2011 2010 2009
Financing receivables**.... $ 5 $ 21 $ 5 $ 21
Goodwill .......................... $ 34 $ 27 $ 289
Property and equipment held for sale*** ............ $ 918 $ 35
* Does not include cost to sell.** Primarily wholesale notes and operating loans.*** See Note 4.
Level 1 measurements consist of quoted prices in active markets for identical assets or liabilities. Level 2 measurements include significant other observable inputs such as quoted prices for similar assets or liabilities in active markets; identical assets or liabilities in inactive markets; observable inputs such as interest rates and yield curves; and other market-corroborated inputs. Level 3 measurements include significant unobservable inputs.
48
30409 Deere 2011.indd 38 12/15/11 10:24 AM
Fair value is defined as the price that would be received to sell an asset or paid to transfer a liability in an orderly transaction between market participants at the measurement date. In determining fair value, the company uses various methods including market and income approaches. The company utilizes valuation models and techniques that maximize the use of observable inputs. The models are industry-standard models that consider various assumptions including time values and yield curves as well as other economic measures. These valuation techniques are consistently applied.
The following is a description of the valuation methodologies the company uses to measure financial instruments and nonmonetary assets at fair value:
Marketable Securities – The portfolio of investments is primarily valued on a market approach (matrix pricing model) in which all significant inputs are observable or can be derived from or corroborated by observable market data such as interest rates, yield curves, volatilities, credit risk and prepayment speeds.
Derivatives – The company’s derivative financial instruments consist of interest rate swaps and caps, foreign currency forwards and swaps and cross-currency interest rate swaps. The portfolio is valued based on an income approach (discounted cash flow) using market observable inputs, including swap curves and both forward and spot exchange rates for currencies.
Financing Receivables – Specific reserve impairments are based on the fair value of the collateral, which is measured using an income approach (discounted cash flow) or a market approach (appraisal values or realizable values). Inputs include interest rates and selection of realizable values.
Goodwill – The impairment of goodwill is based on the implied fair value measured as the difference between the fair value of the reporting unit and the fair value of the unit’s identifiable net assets. An estimate of the fair value of the reporting unit is determined through a combination of an income approach (discounted cash flows) and market values for similar businesses, which includes inputs such as interest rates and selections of similar businesses.
Property and Equipment Held for Sale – The impairment of long-lived assets held for sale is measured at the lower of the carrying amount, or fair value less cost to sell. Fair value is based on the probable sale price. The inputs include estimates of final sale price adjustments.
27. DERIVATIVE INSTRUMENTS
Certain of the company’s derivative agreements contain credit support provisions that require the company to post collateral based on reductions in credit ratings. The aggregate fair value of all derivatives with credit-risk-related contingent features that were in a liability position at October 31, 2011 and 2010 was $23 million and $16 million, respectively. The company, due to its credit rating, has not posted any collateral. If the credit-risk-related contingent features were triggered, the company would be required to post full collateral for this liability position, prior to considering applicable netting provisions.
Derivative instruments are subject to significant concen-trations of credit risk to the banking sector. The company manages individual counterparty exposure by setting limits that consider the credit rating of the counterparty and the size of other financial commitments and exposures between the company and the counterparty banks. All interest rate derivatives are transacted under International Swaps and Derivatives Association (ISDA) documentation. Some of these agreements include collateral support arrangements. Each master agreement permits the net settlement of amounts owed in the event of early termination. The maximum amount of loss that the company would incur if counterparties to derivative instruments fail to meet their obligations, not considering collateral received or netting arrangements, was $485 million and $520 million as of October 31, 2011 and 2010, respectively. The amount of collateral received at October 31, 2011 and 2010 to offset this potential maximum loss was $25 million and $85 million, respectively. The netting provisions of the agreements would reduce the maximum amount of loss the company would incur if the counterparties to derivative instruments fail to meet their obligations by an additional $59 million and $58 million as of October 31, 2011 and 2010, respectively. None of the concen-trations of risk with any individual counterparty was considered significant at October 31, 2011 and 2010.Cash Flow HedgesCertain interest rate and cross-currency interest rate contracts (swaps) were designated as hedges of future cash flows from borrowings. The total notional amounts of the receive-variable/pay-fixed interest rate contracts at October 31, 2011 and 2010 were $1,350 million and $1,060 million, respectively. The total notional amounts of the cross-currency interest rate contracts were $853 million and $849 million at October 31, 2011 and 2010, respectively. The effective portions of the fair value gains or losses on these cash flow hedges were recorded in other comprehensive income (OCI) and subsequently reclassified into interest expense or other operating expenses (foreign exchange) in the same periods during which the hedged transactions affected earnings. These amounts offset the effects of interest rate or foreign currency exchange rate changes on the related borrowings. Any ineffective portions of the gains or losses on all cash flow interest rate contracts designated as cash flow hedges were recognized currently in interest expense or other operat-ing expenses (foreign exchange) and were not material during any years presented. The cash flows from these contracts were recorded in operating activities in the statement of consolidated cash flows.
The amount of loss recorded in OCI at October 31, 2011 that is expected to be reclassified to interest expense or other operating expenses in the next twelve months if interest rates or exchange rates remain unchanged is approximately $4 million after-tax. These contracts mature in up to 35 months. There were no gains or losses reclassified from OCI to earnings based on the probability that the original forecasted transaction would not occur.
49
30409 Deere 2011.indd 39 12/15/11 10:24 AM
Fair Value HedgesCertain interest rate contracts (swaps) were designated as fair value hedges of borrowings. The total notional amounts of the receive-fixed/pay-variable interest rate contracts at October 31, 2011 and 2010 were $7,730 million and $6,640 million, respectively. The effective portions of the fair value gains or losses on these contracts were offset by fair value gains or losses on the hedged items (fixed-rate borrowings). Any ineffective portions of the gains or losses were recognized currently in interest expense. The ineffective portions were a loss of $5 million in 2011 and a gain of $1 million in 2010. The cash flows from these contracts were recorded in operating activities in the statement of consolidated cash flows.
The gains (losses) on these contracts and the underlying borrowings recorded in interest expense follow in millions of dollars:
2011 2010
Interest rate contracts* ........................................... $ 16 $ 150Borrowings** .......................................................... (21) (149)* Includes changes in fair values of interest rate contracts excluding net accrued
interest income of $172 million and $222 million during 2011 and 2010, respectively.** Includes adjustments for fair values of hedged borrowings excluding accrued interest
expense of $277 million and $336 million during 2011 and 2010, respectively.
Derivatives Not Designated as Hedging InstrumentsThe company has certain interest rate contracts (swaps and caps), foreign exchange contracts (forwards and swaps) and cross-currency interest rate contracts (swaps), which were not formally designated as hedges. These derivatives were held as economic hedges for underlying interest rate or foreign currency exposures primarily for certain borrowings and purchases or sales of inventory. The total notional amounts of the interest rate swaps at October 31, 2011 and 2010 were $3,216 million and $2,702 million, the foreign exchange contracts were $3,058 million and $2,777 million and the cross-currency interest rate contracts were $52 million and $60 million, respectively. At October 31, 2011 and 2010, there were also $1,402 million and $1,055 million, respectively, of interest rate caps purchased and the same amounts sold at the same capped interest rate to facilitate borrowings through securitization of retail notes. The fair value gains or losses from the interest rate contracts were recognized currently in interest expense and the gains or losses from foreign exchange contracts in cost of sales or other operating expenses, generally offsetting over time the expenses on the exposures being hedged. The cash flows from these non-designated contracts were recorded in operating activities in the statement of consolidated cash flows.
Fair values of derivative instruments in the consolidated balance sheet at October 31 in millions of dollars follow: 2011 2010
Other AssetsDesignated as hedging instruments:Interest rate contracts ............................................. $ 404 $ 457Not designated as hedging instruments:Interest rate contracts ............................................. 67 36Foreign exchange contracts .................................... 12 24Cross-currency interest rate contracts ..................... 2 3
Total not designated ........................................... 81 63
Total derivatives ...................................................... $ 485 $ 520
Accounts Payable and Accrued ExpensesDesignated as hedging instruments:Interest rate contracts ............................................. $ 13 $ 18Cross-currency interest rate contracts ..................... 7 47
Total designated ................................................. 20 65Not designated as hedging instruments:Interest rate contracts ............................................. 48 20Foreign exchange contracts .................................... 100 23Cross-currency interest rate contracts ..................... 1
Total not designated ........................................... 148 44
Total derivatives ...................................................... $ 168 $ 109
The classification and gains (losses) including accrued interest expense related to derivative instruments on the statement of consolidated income consisted of the following in millions of dollars: 2011 2010 2009
Fair Value HedgesInterest rate contracts – Interest expense ..... $ 188 $ 372 $ 453
Cash Flow HedgesRecognized in OCI(Effective Portion):Interest rate contracts – OCI (pretax)* .......... (5) (14) (90)Foreign exchange contracts – OCI (pretax)* ........................................... 36 (42)
Reclassified from OCI(Effective Portion):Interest rate contracts – Interest expense* .... (20) (68) (84)Foreign exchange contracts – Other expense* ....................................... 19 (11)
Recognized Directly in Income(Ineffective Portion):Interest rate contracts – Interest expense* .... ** ** **Foreign exchange contracts – Other expense* ....................................... ** ** **
Not Designated as HedgesInterest rate contracts – Interest expense* .... (1) 25 (5)Foreign exchange contracts – Cost of sales ........................................... (51) (19) (64)Foreign exchange contracts – Other expense* ....................................... (127) (92) (90)
Total not designated ................................ $ (179) $ (86) $ (159)
* Includes interest and foreign exchange gains (losses) from cross-currency interest rate contracts.
** The amount is not significant.
50
30409 Deere 2011.indd 40 12/15/11 10:24 AM
28. SEGMENT AND GEOGRAPHIC AREA DATA FOR THE YEARS ENDED OCTOBER 31, 2011, 2010 AND 2009
At the beginning of fiscal year 2011, the company combined the reporting of the credit segment and the “Other” segment into the financial services segment. The “Other” segment consisted of an insurance business related to extended warranty policies that did not meet the materiality threshold of reporting. The segment information for previous periods was revised accordingly.
The company’s operations are presently organized and reported in three major business segments described as follows:
The agriculture and turf segment primarily manufactures and distributes a full line of farm and turf equipment and related service parts – including large, medium and utility tractors; loaders; combines, corn pickers, cotton and sugarcane harvesters and related front-end equipment and sugarcane loaders; tillage, seeding and application equipment, including sprayers, nutrient management and soil preparation machinery; hay and forage equipment, including self-propelled forage harvesters and attachments, balers and mowers; turf and utility equipment, including riding lawn equipment and walk-behind mowers, golf course equipment, utility vehicles, and commercial mowing equipment, along with a broad line of associated implements; integrated agricultural management systems technology; precision agricultural irrigation equipment and supplies; landscape and nursery products; and other outdoor power products.
The construction and forestry segment primarily manufac-tures and distributes a broad range of machines and service parts used in construction, earthmoving, material handling and timber harvesting – including backhoe loaders; crawler dozers and loaders; four-wheel-drive loaders; excavators; motor graders; articulated dump trucks; landscape loaders; skid-steer loaders; and log skidders, feller bunchers, log loaders, log forwarders, log harvesters and related attachments.
The products and services produced by the segments above are marketed primarily through independent retail dealer networks and major retail outlets.
The financial services segment primarily finances sales and leases by John Deere dealers of new and used agriculture and turf equipment and construction and forestry equipment. In addition, the financial services segment provides wholesale financing to dealers of the foregoing equipment, provides operating loans, finances retail revolving charge accounts and offers crop risk mitigation products and extended equipment warranties.
Because of integrated manufacturing operations and common administrative and marketing support, a substantial number of allocations must be made to determine operating segment and geographic area data. Intersegment sales and revenues represent sales of components and finance charges, which are generally based on market prices.
Information relating to operations by operating segment in millions of dollars follows. In addition to the following unaffiliated sales and revenues by segment, intersegment sales and revenues in 2011, 2010 and 2009 were as follows: agriculture and turf net sales of $98 million, $59 million and $32 million, construction and forestry net sales of $3 million, $7 million and $4 million, and financial services revenues of $210 million, $224 million and $255 million, respectively.
OPERATING SEGMENTS 2011 2010 2009
Net sales and revenues Unaffiliated customers: Agriculture and turf net sales ................. $ 24,094 $ 19,868 $ 18,122 Construction and forestry net sales ........................................... 5,372 3,705 2,634
Total net sales ................................... 29,466 23,573 20,756Financial services revenues ........................ 2,163 2,074 2,028Other revenues* ........................................ 384 358 328
Total ........................................................ $ 32,013 $ 26,005 $ 23,112
* Other revenues are primarily the equipment operations’ revenues for finance and interest income, and other income as disclosed in Note 31, net of certain intercompany eliminations.
Operating profit (loss)Agriculture and turf .................................... $ 3,447 $ 2,790 $ 1,448Construction and forestry ........................... 392 119 (83)Financial services* ..................................... 725 499 242
Total operating profit.............................. 4,564 3,408 1,607
Interest income .......................................... 47 42 46Interest expense ........................................ (191) (184) (163)Foreign exchange losses from equipment operations’ financing activities ............... (11) (30) (40)Corporate expenses – net .......................... (177) (200) (117)Income taxes ............................................. (1,424) (1,162) (460)
Total ..................................................... (1,756) (1,534) (734)
Net income ................................................ 2,808 1,874 873Less: Net income attributable to noncontrolling interests .......................... 8 9
Net income attributable to Deere & Company ................................. $ 2,800 $ 1,865 $ 873
* Operating profit of the financial services business segment includes the effect of its interest expense and foreign exchange gains or losses.
(continued)
51
30409 Deere 2011.indd 41 12/15/11 10:24 AM
OPERATING SEGMENTS 2011 2010 2009
Interest income*Agriculture and turf .................................... $ 23 $ 20 $ 28Construction and forestry ........................... 3 3 4Financial services ...................................... 1,581 1,528 1,584Corporate .................................................. 47 42 46Intercompany ............................................ (231) (229) (273)
Total ..................................................... $ 1,423 $ 1,364 $ 1,389
* Does not include finance rental income for equipment on operating leases.
Interest expense Agriculture and turf .................................... $ 152 $ 165 $ 208Construction and forestry ........................... 26 21 19Financial services ...................................... 621 670 925Corporate .................................................. 191 184 163Intercompany ............................................ (231) (229) (273)
Total ..................................................... $ 759 $ 811 $ 1,042
Depreciation* and amortization expenseAgriculture and turf .................................... $ 505 $ 470 $ 438Construction and forestry ........................... 82 79 78Financial services ...................................... 328 366 357
Total ..................................................... $ 915 $ 915 $ 873
* Includes depreciation for equipment on operating leases.
Equity in income (loss) of unconsolidated affiliates Agriculture and turf .................................... $ 5 $ 13 $ 14Construction and forestry ........................... 3 (3) (21)Financial services ...................................... 1 1 1
Total ..................................................... $ 9 $ 11 $ (6)
Identifiable operating assets Agriculture and turf .................................... $ 9,178 $ 7,593 $ 6,526Construction and forestry ........................... 2,915 2,353 2,132Financial services ...................................... 29,795 27,507 25,964Corporate* ................................................ 6,319 5,814 6,511
Total ..................................................... $ 48,207 $ 43,267 $ 41,133
* Corporate assets are primarily the equipment operations’ retirement benefits, deferred income tax assets, marketable securities and cash and cash equivalents as disclosed in Note 31, net of certain intercompany eliminations.
Capital additionsAgriculture and turf .................................... $ 909 $ 729 $ 702Construction and forestry ........................... 148 73 95Financial services ...................................... 2 1
Total ..................................................... $ 1,059 $ 802 $ 798
Investments in unconsolidated affiliatesAgriculture and turf .................................... $ 35 $ 66 $ 57Construction and forestry ........................... 159 172 149Financial services ...................................... 8 7 7
Total ..................................................... $ 202 $ 245 $ 213
The company views and has historically disclosed its operations as consisting of two geographic areas, the U.S. and Canada, and outside the U.S. and Canada, shown below in millions of dollars. No individual foreign country’s net sales and revenues were material for disclosure purposes.
GEOGRAPHIC AREAS 2011 2010 2009
Net sales and revenues Unaffiliated customers: U.S. and Canada: Equipment operations net sales (88%)* ........................... $ 17,357 $ 14,794 $ 13,022 Financial services revenues (81%)*.... 1,857 1,817 1,801
Total ............................................. 19,214 16,611 14,823
Outside U.S. and Canada: Equipment operations net sales ......... 12,109 8,779 7,734 Financial services revenues ............... 306 257 227
Total ............................................. 12,415 9,036 7,961
Other revenues .......................................... 384 358 328
Total ......................................................... $ 32,013 $ 26,005 $ 23,112
* The percentages indicate the approximate proportion of each amount that relates to the U.S. only and are based upon a three-year average for 2011, 2010 and 2009.
Operating profit U.S. and Canada: Equipment operations ........................ $ 2,898 $ 2,302 $ 1,129 Financial services .............................. 593 400 156
Total ............................................. 3,491 2,702 1,285
Outside U.S. and Canada: Equipment operations ........................ 941 607 236 Financial services .............................. 132 99 86
Total ............................................. 1,073 706 322
Total ......................................................... $ 4,564 $ 3,408 $ 1,607
Property and equipmentU.S. .......................................................... $ 2,329 $ 2,035 $ 2,907Germany ................................................... 572 489 442Other countries.......................................... 1,451 1,267 1,183
Total ................................................. $ 4,352 $ 3,791 $ 4,532
52
30409 Deere 2011.indd 42 12/15/11 10:24 AM
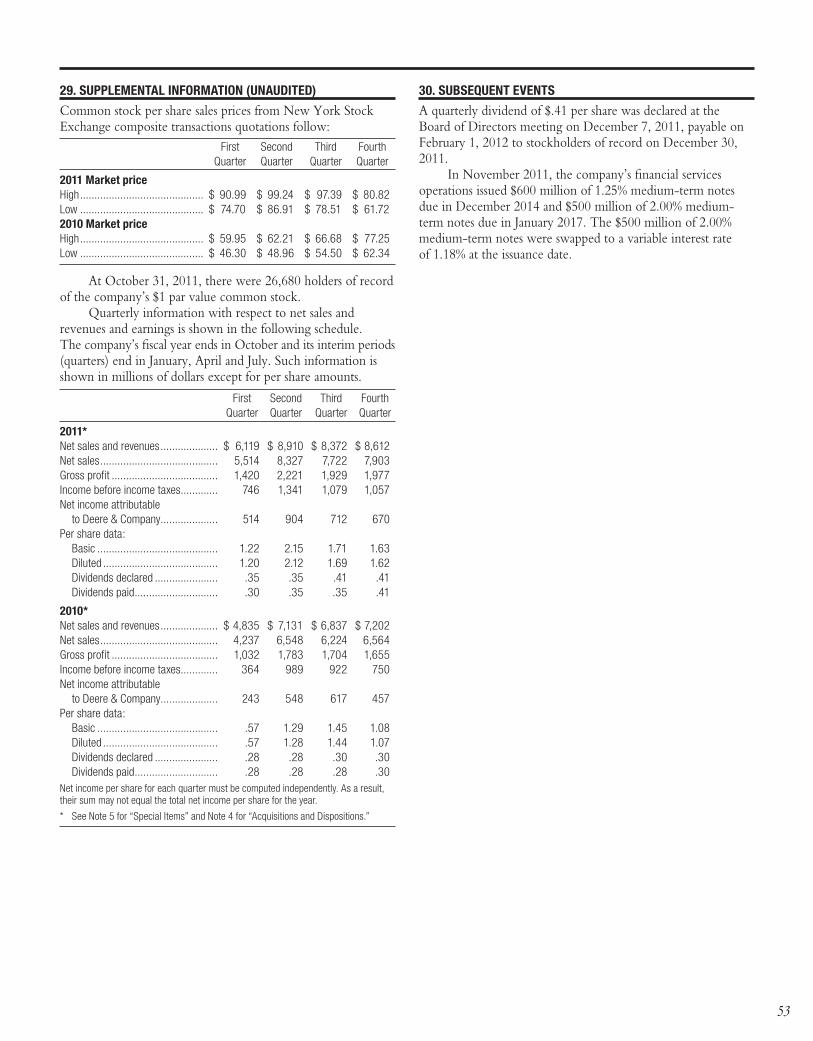
29. SUPPLEMENTAL INFORMATION (UNAUDITED)
Common stock per share sales prices from New York Stock Exchange composite transactions quotations follow: First Second Third Fourth Quarter Quarter Quarter Quarter
2011 Market priceHigh ........................................... $ 90.99 $ 99.24 $ 97.39 $ 80.82Low ........................................... $ 74.70 $ 86.91 $ 78.51 $ 61.722010 Market priceHigh ........................................... $ 59.95 $ 62.21 $ 66.68 $ 77.25Low ........................................... $ 46.30 $ 48.96 $ 54.50 $ 62.34
At October 31, 2011, there were 26,680 holders of record of the company’s $1 par value common stock.
Quarterly information with respect to net sales and revenues and earnings is shown in the following schedule. The company’s fiscal year ends in October and its interim periods (quarters) end in January, April and July. Such information is shown in millions of dollars except for per share amounts.
First Second Third Fourth Quarter Quarter Quarter Quarter
2011*Net sales and revenues .................... $ 6,119 $ 8,910 $ 8,372 $ 8,612Net sales ......................................... 5,514 8,327 7,722 7,903Gross profit ..................................... 1,420 2,221 1,929 1,977Income before income taxes ............. 746 1,341 1,079 1,057Net income attributable to Deere & Company .................... 514 904 712 670Per share data: Basic .......................................... 1.22 2.15 1.71 1.63 Diluted ........................................ 1.20 2.12 1.69 1.62 Dividends declared ...................... .35 .35 .41 .41 Dividends paid ............................. .30 .35 .35 .41
2010*Net sales and revenues .................... $ 4,835 $ 7,131 $ 6,837 $ 7,202Net sales ......................................... 4,237 6,548 6,224 6,564Gross profit ..................................... 1,032 1,783 1,704 1,655Income before income taxes ............. 364 989 922 750Net income attributable to Deere & Company .................... 243 548 617 457Per share data: Basic .......................................... .57 1.29 1.45 1.08 Diluted ........................................ .57 1.28 1.44 1.07 Dividends declared ...................... .28 .28 .30 .30 Dividends paid ............................. .28 .28 .28 .30Net income per share for each quarter must be computed independently. As a result, their sum may not equal the total net income per share for the year.
* See Note 5 for “Special Items” and Note 4 for “Acquisitions and Dispositions.”
30. SUBSEQUENT EVENTS
A quarterly dividend of $.41 per share was declared at the Board of Directors meeting on December 7, 2011, payable on February 1, 2012 to stockholders of record on December 30, 2011.
In November 2011, the company’s financial services operations issued $600 million of 1.25% medium-term notes due in December 2014 and $500 million of 2.00% medium-term notes due in January 2017. The $500 million of 2.00% medium-term notes were swapped to a variable interest rate of 1.18% at the issuance date.
53
30409 Deere 2011.indd 43 12/15/11 10:24 AM
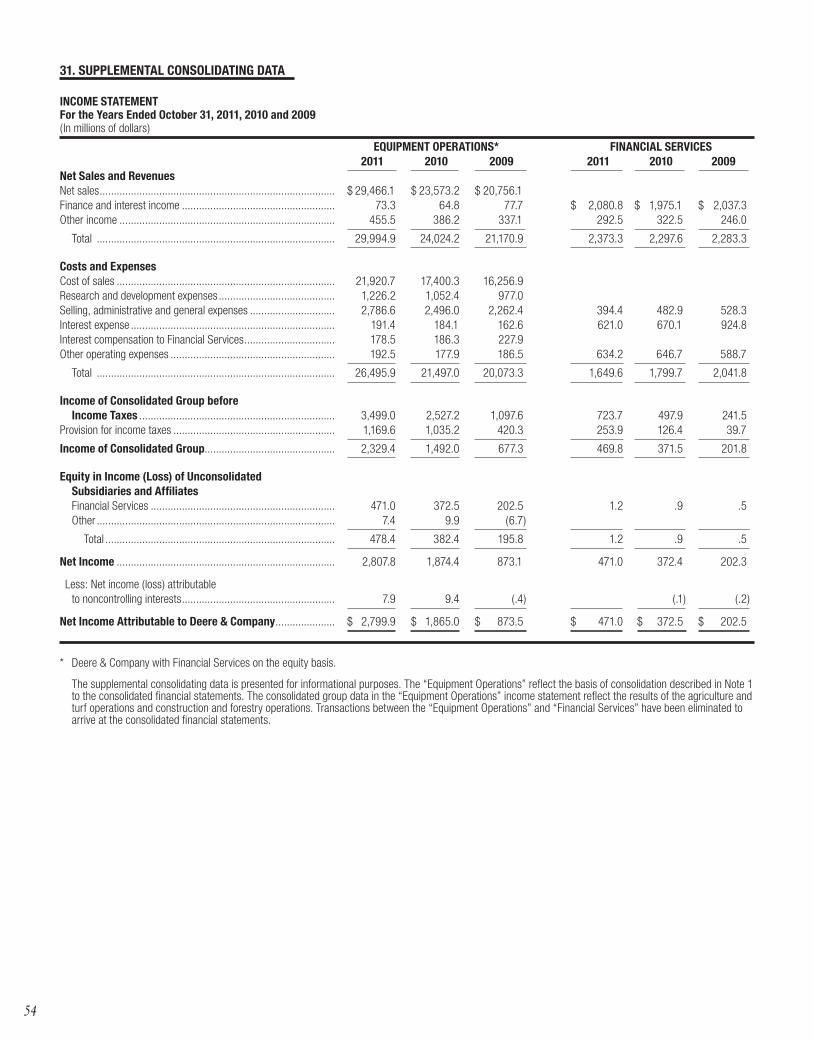
31. SUPPLEMENTAL CONSOLIDATING DATA
INCOME STATEMENTFor the Years Ended October 31, 2011, 2010 and 2009( In millions of dollars)
EQUIPMENT OPERATIONS* FINANCIAL SERVICES 2011 2010 2009 2011 2010 2009 Net Sales and RevenuesNet sales ................................................................................... $ 29,466.1 $ 23,573.2 $ 20,756.1Finance and interest income ...................................................... 73.3 64.8 77.7 $ 2,080.8 $ 1,975.1 $ 2,037.3Other income ............................................................................ 455.5 386.2 337.1 292.5 322.5 246.0
Total .................................................................................... 29,994.9 24,024.2 21,170.9 2,373.3 2,297.6 2,283.3
Costs and ExpensesCost of sales ............................................................................. 21,920.7 17,400.3 16,256.9Research and development expenses ......................................... 1,226.2 1,052.4 977.0Selling, administrative and general expenses .............................. 2,786.6 2,496.0 2,262.4 394.4 482.9 528.3Interest expense ........................................................................ 191.4 184.1 162.6 621.0 670.1 924.8Interest compensation to Financial Services ................................ 178.5 186.3 227.9Other operating expenses .......................................................... 192.5 177.9 186.5 634.2 646.7 588.7
Total .................................................................................... 26,495.9 21,497.0 20,073.3 1,649.6 1,799.7 2,041.8
Income of Consolidated Group before Income Taxes ..................................................................... 3,499.0 2,527.2 1,097.6 723.7 497.9 241.5Provision for income taxes ......................................................... 1,169.6 1,035.2 420.3 253.9 126.4 39.7
Income of Consolidated Group.............................................. 2,329.4 1,492.0 677.3 469.8 371.5 201.8
Equity in Income (Loss) of Unconsolidated Subsidiaries and Affiliates Financial Services ................................................................. 471.0 372.5 202.5 1.2 .9 .5 Other .................................................................................... 7.4 9.9 (6.7)
Total ................................................................................. 478.4 382.4 195.8 1.2 .9 .5
Net Income ............................................................................. 2,807.8 1,874.4 873.1 471.0 372.4 202.3
Less: Net income (loss) attributable to noncontrolling interests ...................................................... 7.9 9.4 (.4) (.1) (.2)
Net Income Attributable to Deere & Company ..................... $ 2,799.9 $ 1,865.0 $ 873.5 $ 471.0 $ 372.5 $ 202.5
* Deere & Company with Financial Services on the equity basis.
The supplemental consolidating data is presented for informational purposes. The “Equipment Operations” reflect the basis of consolidation described in Note 1 to the consolidated financial statements. The consolidated group data in the “Equipment Operations” income statement reflect the results of the agriculture and turf operations and construction and forestry operations. Transactions between the “Equipment Operations” and “Financial Services” have been eliminated to arrive at the consolidated financial statements.
54
30409 Deere 2011.indd 44 12/15/11 10:24 AM
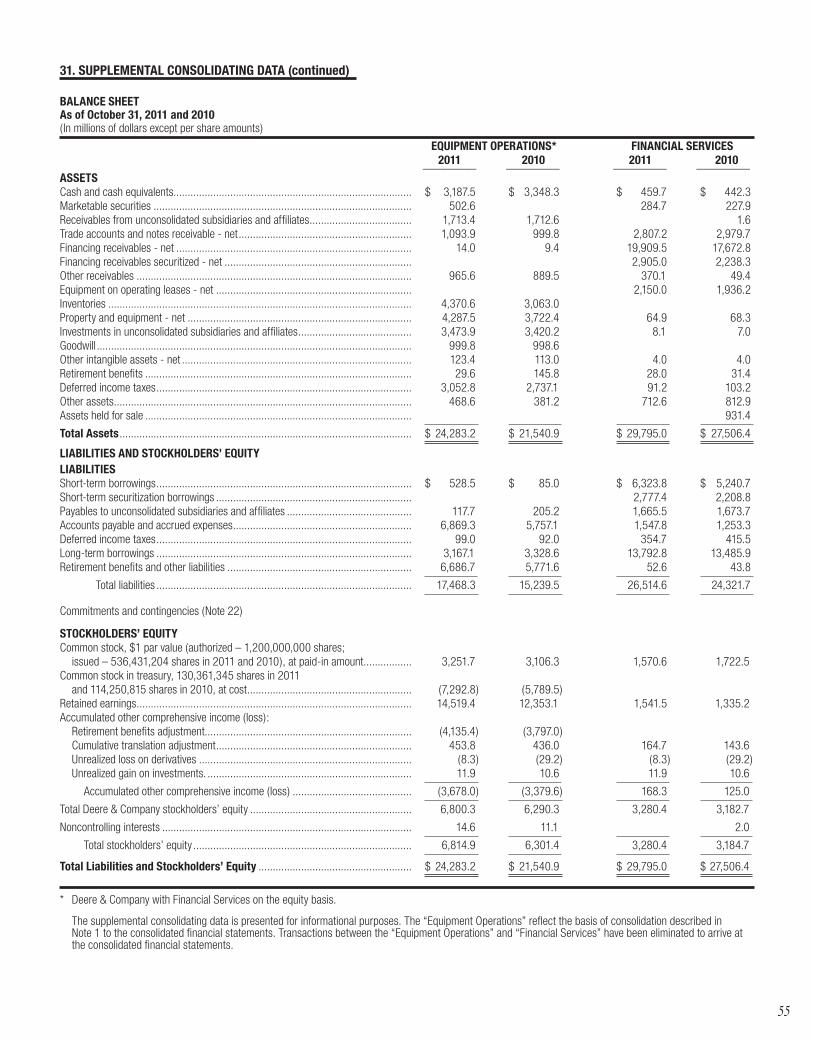
31. SUPPLEMENTAL CONSOLIDATING DATA (continued)
BALANCE SHEETAs of October 31, 2011 and 2010( In millions of dollars except per share amounts)
EQUIPMENT OPERATIONS* FINANCIAL SERVICES 2011 2010 2011 2010 _________ _________ _________ _________ASSETSCash and cash equivalents.................................................................................... $ 3,187.5 $ 3,348.3 $ 459.7 $ 442.3Marketable securities ........................................................................................... 502.6 284.7 227.9Receivables from unconsolidated subsidiaries and affiliates .................................... 1,713.4 1,712.6 1.6Trade accounts and notes receivable - net ............................................................. 1,093.9 999.8 2,807.2 2,979.7Financing receivables - net ................................................................................... 14.0 9.4 19,909.5 17,672.8Financing receivables securitized - net .................................................................. 2,905.0 2,238.3Other receivables ................................................................................................. 965.6 889.5 370.1 49.4Equipment on operating leases - net ..................................................................... 2,150.0 1,936.2Inventories ........................................................................................................... 4,370.6 3,063.0Property and equipment - net ............................................................................... 4,287.5 3,722.4 64.9 68.3Investments in unconsolidated subsidiaries and affiliates ........................................ 3,473.9 3,420.2 8.1 7.0Goodwill ............................................................................................................... 999.8 998.6 Other intangible assets - net ................................................................................. 123.4 113.0 4.0 4.0Retirement benefits .............................................................................................. 29.6 145.8 28.0 31.4Deferred income taxes .......................................................................................... 3,052.8 2,737.1 91.2 103.2Other assets ......................................................................................................... 468.6 381.2 712.6 812.9Assets held for sale .............................................................................................. 931.4
Total Assets ....................................................................................................... $ 24,283.2 $ 21,540.9 $ 29,795.0 $ 27,506.4
LIABILITIES AND STOCKHOLDERS’ EQUITYLIABILITIESShort-term borrowings .......................................................................................... $ 528.5 $ 85.0 $ 6,323.8 $ 5,240.7Short-term securitization borrowings ..................................................................... 2,777.4 2,208.8Payables to unconsolidated subsidiaries and affiliates ............................................ 117.7 205.2 1,665.5 1,673.7Accounts payable and accrued expenses ............................................................... 6,869.3 5,757.1 1,547.8 1,253.3Deferred income taxes .......................................................................................... 99.0 92.0 354.7 415.5Long-term borrowings .......................................................................................... 3,167.1 3,328.6 13,792.8 13,485.9Retirement benefits and other liabilities ................................................................. 6,686.7 5,771.6 52.6 43.8
Total liabilities .......................................................................................... 17,468.3 15,239.5 26,514.6 24,321.7
Commitments and contingencies (Note 22)
STOCKHOLDERS’ EQUITYCommon stock, $1 par value (authorized – 1,200,000,000 shares; issued – 536,431,204 shares in 2011 and 2010), at paid-in amount ................. 3,251.7 3,106.3 1,570.6 1,722.5Common stock in treasury, 130,361,345 shares in 2011 and 114,250,815 shares in 2010, at cost .......................................................... (7,292.8) (5,789.5) Retained earnings ................................................................................................. 14,519.4 12,353.1 1,541.5 1,335.2Accumulated other comprehensive income (loss): Retirement benefits adjustment......................................................................... (4,135.4) (3,797.0) Cumulative translation adjustment ..................................................................... 453.8 436.0 164.7 143.6 Unrealized loss on derivatives ........................................................................... (8.3) (29.2) (8.3) (29.2) Unrealized gain on investments. ........................................................................ 11.9 10.6 11.9 10.6
Accumulated other comprehensive income (loss) .......................................... (3,678.0) (3,379.6) 168.3 125.0
Total Deere & Company stockholders’ equity ......................................................... 6,800.3 6,290.3 3,280.4 3,182.7
Noncontrolling interests ........................................................................................ 14.6 11.1 2.0
Total stockholders’ equity ............................................................................. 6,814.9 6,301.4 3,280.4 3,184.7
Total Liabilities and Stockholders’ Equity ...................................................... $ 24,283.2 $ 21,540.9 $ 29,795.0 $ 27,506.4
* Deere & Company with Financial Services on the equity basis.
The supplemental consolidating data is presented for informational purposes. The “Equipment Operations” reflect the basis of consolidation described in Note 1 to the consolidated financial statements. Transactions between the “Equipment Operations” and “Financial Services” have been eliminated to arrive at the consolidated financial statements.
55
30409 Deere 2011.indd 45 12/15/11 10:24 AM
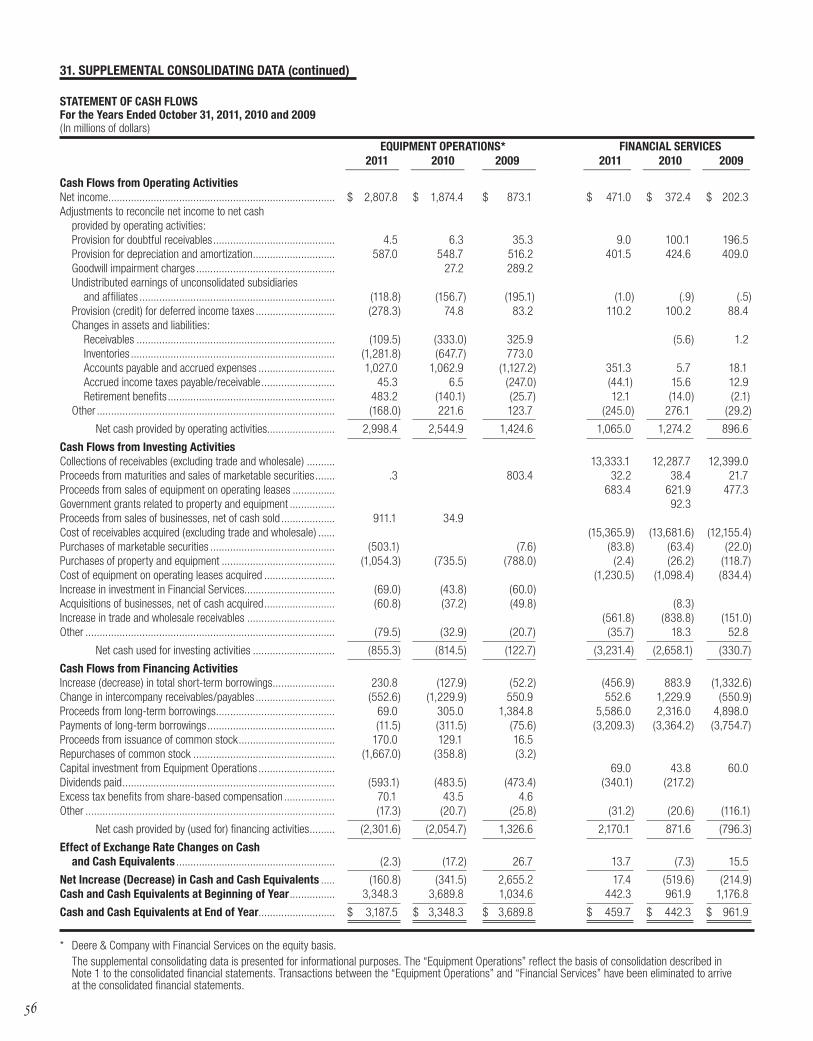
31. SUPPLEMENTAL CONSOLIDATING DATA (continued)
STATEMENT OF CASH FLOWSFor the Years Ended October 31, 2011, 2010 and 2009( In millions of dollars)
EQUIPMENT OPERATIONS* FINANCIAL SERVICES 2011 2010 2009 2011 2010 2009 _________ _________ _________ ________ ________ ________
Cash Flows from Operating ActivitiesNet income ................................................................................ $ 2,807.8 $ 1,874.4 $ 873.1 $ 471.0 $ 372.4 $ 202.3Adjustments to reconcile net income to net cash provided by operating activities: Provision for doubtful receivables ........................................... 4.5 6.3 35.3 9.0 100.1 196.5 Provision for depreciation and amortization ............................. 587.0 548.7 516.2 401.5 424.6 409.0 Goodwill impairment charges ................................................. 27.2 289.2 Undistributed earnings of unconsolidated subsidiaries and affiliates ..................................................................... (118.8) (156.7) (195.1) (1.0) (.9) (.5) Provision (credit) for deferred income taxes ............................ (278.3) 74.8 83.2 110.2 100.2 88.4 Changes in assets and liabilities: Receivables ...................................................................... (109.5) (333.0) 325.9 (5.6) 1.2 Inventories ........................................................................ (1,281.8) (647.7) 773.0 Accounts payable and accrued expenses ........................... 1,027.0 1,062.9 (1,127.2) 351.3 5.7 18.1 Accrued income taxes payable/receivable .......................... 45.3 6.5 (247.0) (44.1) 15.6 12.9 Retirement benefits ........................................................... 483.2 (140.1) (25.7) 12.1 (14.0) (2.1) Other .................................................................................... (168.0) 221.6 123.7 (245.0) 276.1 (29.2)
Net cash provided by operating activities........................ 2,998.4 2,544.9 1,424.6 1,065.0 1,274.2 896.6
Cash Flows from Investing ActivitiesCollections of receivables (excluding trade and wholesale) .......... 13,333.1 12,287.7 12,399.0Proceeds from maturities and sales of marketable securities ....... .3 803.4 32.2 38.4 21.7Proceeds from sales of equipment on operating leases ............... 683.4 621.9 477.3Government grants related to property and equipment ................ 92.3 Proceeds from sales of businesses, net of cash sold ................... 911.1 34.9 Cost of receivables acquired (excluding trade and wholesale) ...... (15,365.9) (13,681.6) (12,155.4)Purchases of marketable securities ............................................ (503.1) (7.6) (83.8) (63.4) (22.0)Purchases of property and equipment ........................................ (1,054.3) (735.5) (788.0) (2.4) (26.2) (118.7)Cost of equipment on operating leases acquired ......................... (1,230.5) (1,098.4) (834.4)Increase in investment in Financial Services................................ (69.0) (43.8) (60.0) Acquisitions of businesses, net of cash acquired ......................... (60.8) (37.2) (49.8) (8.3) Increase in trade and wholesale receivables ............................... (561.8) (838.8) (151.0)Other ........................................................................................ (79.5) (32.9) (20.7) (35.7) 18.3 52.8
Net cash used for investing activities ............................. (855.3) (814.5) (122.7) (3,231.4) (2,658.1) (330.7)
Cash Flows from Financing ActivitiesIncrease (decrease) in total short-term borrowings ...................... 230.8 (127.9) (52.2) (456.9) 883.9 (1,332.6)Change in intercompany receivables/payables ............................ (552.6) (1,229.9) 550.9 552.6 1,229.9 (550.9)Proceeds from long-term borrowings .......................................... 69.0 305.0 1,384.8 5,586.0 2,316.0 4,898.0Payments of long-term borrowings ............................................. (11.5) (311.5) (75.6) (3,209.3) (3,364.2) (3,754.7)Proceeds from issuance of common stock .................................. 170.0 129.1 16.5 Repurchases of common stock .................................................. (1,667.0) (358.8) (3.2) Capital investment from Equipment Operations ........................... 69.0 43.8 60.0Dividends paid ........................................................................... (593.1) (483.5) (473.4) (340.1) (217.2) Excess tax benefits from share-based compensation .................. 70.1 43.5 4.6 Other ........................................................................................ (17.3) (20.7) (25.8) (31.2) (20.6) (116.1)
Net cash provided by (used for) financing activities ......... (2,301.6) (2,054.7) 1,326.6 2,170.1 871.6 (796.3)
Effect of Exchange Rate Changes on Cash and Cash Equivalents ........................................................ (2.3) (17.2) 26.7 13.7 (7.3) 15.5
Net Increase (Decrease) in Cash and Cash Equivalents ..... (160.8) (341.5) 2,655.2 17.4 (519.6) (214.9)Cash and Cash Equivalents at Beginning of Year ................ 3,348.3 3,689.8 1,034.6 442.3 961.9 1,176.8
Cash and Cash Equivalents at End of Year........................... $ 3,187.5 $ 3,348.3 $ 3,689.8 $ 459.7 $ 442.3 $ 961.9
* Deere & Company with Financial Services on the equity basis.The supplemental consolidating data is presented for informational purposes. The “Equipment Operations” reflect the basis of consolidation described in Note 1 to the consolidated financial statements. Transactions between the “Equipment Operations” and “Financial Services” have been eliminated to arrive at the consolidated financial statements.
56
30409 Deere 2011.indd 46 12/15/11 10:24 AM
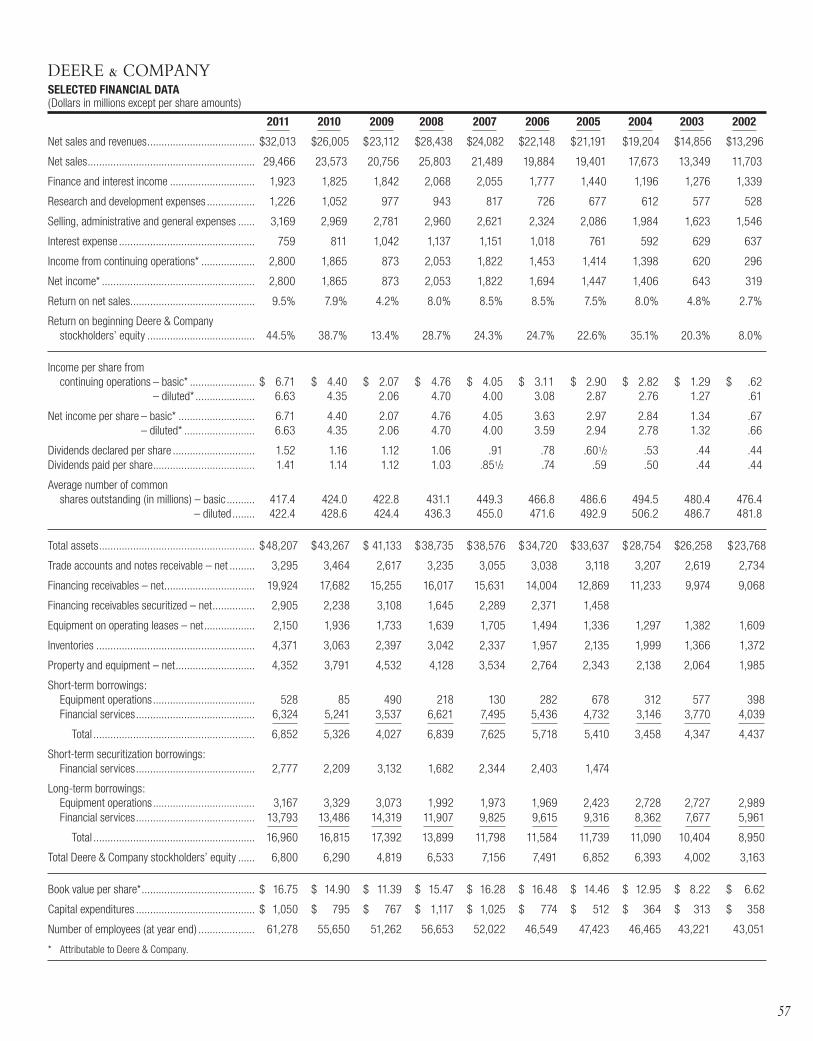
SELECTED FINANCIAL DATA(Dollars in millions except per share amounts)
2011 2010 2009 2008 2007 2006 2005 2004 2003 2002
Net sales and revenues ...................................... $ 32,013 $ 26,005 $ 23,112 $ 28,438 $ 24,082 $ 22,148 $ 21,191 $ 19,204 $ 14,856 $ 13,296
Net sales ........................................................... 29,466 23,573 20,756 25,803 21,489 19,884 19,401 17,673 13,349 11,703
Finance and interest income .............................. 1,923 1,825 1,842 2,068 2,055 1,777 1,440 1,196 1,276 1,339
Research and development expenses ................. 1,226 1,052 977 943 817 726 677 612 577 528
Selling, administrative and general expenses ...... 3,169 2,969 2,781 2,960 2,621 2,324 2,086 1,984 1,623 1,546
Interest expense ................................................ 759 811 1,042 1,137 1,151 1,018 761 592 629 637
Income from continuing operations* ................... 2,800 1,865 873 2,053 1,822 1,453 1,414 1,398 620 296
Net income* ...................................................... 2,800 1,865 873 2,053 1,822 1,694 1,447 1,406 643 319
Return on net sales ............................................ 9.5% 7.9% 4.2% 8.0% 8.5% 8.5% 7.5% 8.0% 4.8% 2.7%
Return on beginning Deere & Company stockholders’ equity ...................................... 44.5% 38.7% 13.4% 28.7% 24.3% 24.7% 22.6% 35.1% 20.3% 8.0%
Income per share from continuing operations – basic* ....................... $ 6.71 $ 4.40 $ 2.07 $ 4.76 $ 4.05 $ 3.11 $ 2.90 $ 2.82 $ 1.29 $ .62 – diluted* ..................... 6.63 4.35 2.06 4.70 4.00 3.08 2.87 2.76 1.27 .61
Net income per share – basic* ........................... 6.71 4.40 2.07 4.76 4.05 3.63 2.97 2.84 1.34 .67 – diluted* ......................... 6.63 4.35 2.06 4.70 4.00 3.59 2.94 2.78 1.32 .66
Dividends declared per share ............................. 1.52 1.16 1.12 1.06 .91 .78 .601/2 .53 .44 .44Dividends paid per share .................................... 1.41 1.14 1.12 1.03 .851/2 .74 .59 .50 .44 .44
Average number of common shares outstanding (in millions) – basic .......... 417.4 424.0 422.8 431.1 449.3 466.8 486.6 494.5 480.4 476.4 – diluted ........ 422.4 428.6 424.4 436.3 455.0 471.6 492.9 506.2 486.7 481.8
Total assets ....................................................... $ 48,207 $ 43,267 $ 41,133 $ 38,735 $ 38,576 $ 34,720 $ 33,637 $ 28,754 $ 26,258 $ 23,768
Trade accounts and notes receivable – net ......... 3,295 3,464 2,617 3,235 3,055 3,038 3,118 3,207 2,619 2,734
Financing receivables – net ................................ 19,924 17,682 15,255 16,017 15,631 14,004 12,869 11,233 9,974 9,068
Financing receivables securitized – net ............... 2,905 2,238 3,108 1,645 2,289 2,371 1,458
Equipment on operating leases – net .................. 2,150 1,936 1,733 1,639 1,705 1,494 1,336 1,297 1,382 1,609
Inventories ........................................................ 4,371 3,063 2,397 3,042 2,337 1,957 2,135 1,999 1,366 1,372
Property and equipment – net ............................ 4,352 3,791 4,532 4,128 3,534 2,764 2,343 2,138 2,064 1,985
Short-term borrowings: Equipment operations .................................... 528 85 490 218 130 282 678 312 577 398 Financial services .......................................... 6,324 5,241 3,537 6,621 7,495 5,436 4,732 3,146 3,770 4,039
Total ......................................................... 6,852 5,326 4,027 6,839 7,625 5,718 5,410 3,458 4,347 4,437
Short-term securitization borrowings: Financial services .......................................... 2,777 2,209 3,132 1,682 2,344 2,403 1,474
Long-term borrowings: Equipment operations .................................... 3,167 3,329 3,073 1,992 1,973 1,969 2,423 2,728 2,727 2,989 Financial services .......................................... 13,793 13,486 14,319 11,907 9,825 9,615 9,316 8,362 7,677 5,961
Total ......................................................... 16,960 16,815 17,392 13,899 11,798 11,584 11,739 11,090 10,404 8,950
Total Deere & Company stockholders’ equity ...... 6,800 6,290 4,819 6,533 7,156 7,491 6,852 6,393 4,002 3,163
Book value per share* ........................................ $ 16.75 $ 14.90 $ 11.39 $ 15.47 $ 16.28 $ 16.48 $ 14.46 $ 12.95 $ 8.22 $ 6.62
Capital expenditures .......................................... $ 1,050 $ 795 $ 767 $ 1,117 $ 1,025 $ 774 $ 512 $ 364 $ 313 $ 358
Number of employees (at year end) .................... 61,278 55,650 51,262 56,653 52,022 46,549 47,423 46,465 43,221 43,051
* Attributable to Deere & Company.
DEERE & COMPANY
57
30409 Deere 2011.indd 47 12/15/11 10:24 AM

5858
ANNUAL MEETINGThe annual meeting of company stockholders will be held at 10 a.m. CT on February 29, 2012, at the Deere & Company World Headquarters, One John Deere Place, Moline, Illinois.
TRANSFER AGENT & REGISTRAR
other inquiries, including those concerning lost, stolen or
Deere & Company
P.O. Box 358015Pittsburgh, PA 15252-8015
www.bnymellon.com/shareowner/isd
DIVIDEND REINVESTMENT & DIRECT PURCHASE PLAN
New York Mellon’s BuyDIRECT Plan. Automatic monthly
Deere & Company
P.O. Box 358015Pittsburgh, PA 15252-8015
STOCKHOLDER RELATIONS
Deere & CompanyStockholder Relations Department
INVESTOR RELATIONS
Tony Huegel
Deere & Company
STOCK EXCHANGESDeere & Company common stock is listed on the New York Stock Exchange under the ticker symbol DE.
FORM 10-K
written request to Deere & Company Stockholder Relations.
AUDITORSDeloitte & Touche LLP Chicago, Illinois
Unless otherwise indicated, all capitalized names of products and services are trademarks or service marks of Deere & Company.
CORPORATE LEADERSHIP
Senior Vice President, John Deere Power Systems,
Engineering, and Global Supply Management & Logistics
Senior Vice President and General Counsel
Vice President and Deputy General Counsel, International
Vice President and Comptroller
Vice President, Corporate Communications and Global Brand Management
Vice President and Deputy General Counsel, North America
Vice President, Taxes
Vice President, Global Human Resources
Vice President, Global Supply Management & Logistics
Vice President, Labor Relations
Vice President, Internal Audit
Vice President, Public Affairs Worldwide
Vice President, Information Technology
Vice President and Treasurer
Corporate Secretary and Associate General Counsel
WORLDWIDE AGRICULTURE & TURF DIVISION
President, North America, Asia, Australia, Sub-Saharan and South Africa, and Global Tractor and Turf Products
President, Europe, CIS, Northern Africa, Middle East, Latin America,
Senior Vice President, Global Platform - Tractor
WORLDWIDE CONSTRUCTION & FORESTRY DIVISION
President
Senior Vice President, Sales & Marketing
Senior Vice President,Engineering and Manufacturing
WORLDWIDE FINANCIAL SERVICES DIVISION
President
Senior Vice President and Chief Counsel
Senior Vice President, International Finance
Senior Vice President, Sales & Marketing, U.S. and Canada
Senior Vice President, Credit & Operations, U.S. and Canada
STOCKHOLDER INFORMATION
Figures in parentheses represent complete years of company service through 12/31/11 and assignments as of that date.
* Effective 1/1/12, Thomas C. Spitzfaden succeeds Dennis R. Schwartzas Vice President, Pension Fund & Investments.
30409 2011_AR.indd 58 1/5/12 6:53 PM

Net Sales and Revenues (MM)
2009 2010 2011
$23,112 $26,005 $32,013
Operating Profit (MM)
2009 2010 2011
$1,607 $3,408 $4,564
Net Income *(MM)
2009 2010 2011
$873 $1,865 $2,800
*Net income attributable to Deere & Company
The Deere senior management team shown with replica of founder John Deere’s first 1837 plow and company’s new S690 Combine, one of the world’s most advanced harvesters. From left, Dave Everitt, Mike Mack, Jim Jenkins, Sam Allen, Jean Gilles, Jim Field, Mark von Pentz, and Jim Israel.
The 175th anniversary of the founding of John Deere is a time to connect the pride of the past with the promise of the future. Our heritage is rich. Our achievements are many. Our future is bright. Guided by an ambitious plan for global growth, we aim to seize the great opportunities that lie ahead, based on the world’s growing need for food, shelter and infrastructure. John Deere’s goal is to capitalize on these positive trends in order to deliver increasing value to our customers, investors and other constituents in the years ahead.
SAMUEL R. ALLEN (2)Chairman and Chief Executive Officer Deere & Company
CRANDALL C. BOWLES (15)Chairman, Springs Industries, Inc. Chairman, The Springs Company home furnishings
VANCE D. COFFMAN (7)Retired ChairmanLockheed Martin Corporationaerospace, defense and information technology
CHARLES O. HOLLIDAY, JR. (4) Chairman of the BoardBank of America Corporationbanking, investing and asset management
DIPAK C. JAIN (9)Dean, INSEADbusiness education
CLAYTON M. JONES (4)Chairman, President and Chief Executive OfficerRockwell Collins, Inc.aviation electronics and communications
JOACHIM MILBERG (8)Chairman, Supervisory BoardBayerische Motoren Werke (BMW) AGmotor vehicles
RICHARD B. MYERS (5)Retired Chairman, Joint Chiefs of Staff Retired General, United States Air Forceprincipal military advisor to the President, the Secretary of Defense, and the National Security Council
From left: David B. Speer, Aulana L. Peters, Thomas H. Patrick, Richard B. Myers, Joachim Milberg, Samuel R. Allen, Clayton M. Jones, Dipak C. Jain, Charles O. Holliday, Jr., Vance D. Coffman and Crandall C. Bowles; shown at the John Deere Pavilion, Moline, Illinois, with a sculpture of a John Deere combine made of canned and packaged foods that were later donated to area food pantries.
BOARD OF DIRECTORS
THOMAS H. PATRICK (11)ChairmanNew Vernon Capital, LLCprivate equity fund
AULANA L. PETERS (9)Retired PartnerGibson, Dunn & Crutcher LLPlaw firm
DAVID B. SPEER (3)Chairman and Chief Executive OfficerIllinois Tool Works Inc.engineered components, industrial systems and consumables
(Not pictured: Elected 12/7/11)SHERRY M. SMITHExecutive Vice President and Chief Financial OfficerSUPERVALU INC. grocery
Figures in parentheses represent complete years of board service through 12/31/11 and positions as of that date.
30409 2011 AR Covers.indd 2 1/3/12 10:11 AM

COMMITTED TO THOSE LINKED TO THE LAND
Deere & CompanyOne John Deere PlaceMoline, Illinois 61265(309) 765-8000www.JohnDeere.com
“I will never put my nameon a product that does not have in it
the best that is in me.”— John Deere
Medallion created to celebratethe company’s centennial in 1937.
Deere & Company Annual Report 2011
DEERE &
COM
PANY AN
NU
AL REPORT 2011
30409 2011 AR Covers.indd 1 12/21/11 5:46 PM