Embed Size (px)
Citation preview

Prepared with data at closing of 31st December 2017, unless otherwise noticed
Committed to trustworthy and profitable banking
Corporate Presentation April 2018

2
Disclaimer
The purpose of this presentation is purely informative and should not be considered as a service or offer of any financial product, service or advice, nor should it beinterpreted as, an offer to sell or exchange or acquire, or an invitation for offers to buy securities issued by CaixaBank, S.A. (“CaixaBank”) or any of the companies mentionedherein. The information contained herein is subject to, and must be read in conjunction with, all other publicly available information. Any person at any time acquiringsecurities must do so only on the basis of such person’s own judgment as to the merits or the suitability of the securities for its purpose and only on such information as iscontained in such public information set out in the relevant documentation filed by the issuer in the context of such specific issue having taken all such professional or otheradvice as it considers necessary or appropriate in the circumstances and not in reliance on the information contained in this presentation.
CaixaBank cautions that this presentation might contain forward-looking statements concerning the development of our business and economic performance. Particularly,the financial information from CaixaBank Group for the year 2017 related to results from investments has been prepared mainly based on estimates. While these statementsare based on our current projections, judgments and future expectations concerning the development of our business, a number of risks, uncertainties and other importantfactors could cause actual developments and results to differ materially from our expectations. Such factors include, but are not limited to the market general situation,macroeconomic factors, regulatory, political or government guidelines and trends, movements in domestic and international securities markets, currency exchange rates andinterest rates, changes in the financial position, creditworthiness or solvency of our customers, debtors or counterparts.
Statements as to historical performance, historical share price or financial accretion are not intended to mean that future performance, future share price or future earningsfor any period will necessarily match or exceed those of any prior year. Nothing in this presentation should be construed as a profit forecast. In addition, it should be notedthat although this presentation has been prepared based on accounting registers kept by CaixaBank and by the rest of the Group companies it may contain certainadjustments and reclassifications in order to harmonize the accounting principles and criteria followed by such companies with those followed by CaixaBank. Accordingly, andparticularly in the case of Banco Português de Investimento (“BPI”), the relevant data included in this presentation may differ from those included in the relevant financialinformation as published by BPI.
In particular, regarding the data provided by third parties, neither CaixaBank, nor any of its administrators, directors or employees, , either explicitly or implicitly, guaranteesthat these contents are exact, accurate, comprehensive or complete, nor are they obliged to keep them updated, nor to correct them in the case that any deficiency, error oromission were to be detected. Moreover, in reproducing these contents in by any means, CaixaBank may introduce any changes it deems suitable, may omit partially orcompletely any of the elements of this document, and in case of any deviation between such a version and this one, CaixaBank assumes no liability for any discrepancy.
In relation to Alternative Performance Measures (APMs) as defined in the guidelines on Alternative Performance Measures issued by the European Securities and MarketsAuthority on 30 June 2015 (ESMA/2015/1057), this report uses certain APMs, which have not been audited, for a better understanding of the company's financialperformance. These measures are considered additional disclosures and in no case replace the financial information prepared under the International Financial ReportingStandards (IFRS). Moreover, the way the Group defines and calculates these measures may differ to the way similar measures are calculated by other companies.Accordingly, they may not be comparable. Please refer to the Glossary section for a list of the APMs used along with the relevant reconciliation between certain indicators.
This document has not been submitted to the Comisión Nacional del Mercado de Valores (CNMV – the Spanish Stock Markets regulatory authority) for review or for approval.Its content is regulated by the Spanish law applicable at the date hereto, and it is not addressed to any person or any legal entity located in any other jurisdiction. For thisreason it may not necessarily comply with the prevailing norms or legal requisites as required in other jurisdictions.
Notwithstanding any legal requirements, or any limitations imposed by CaixaBank which may be applicable, permission is hereby expressly refused for any type of use orexploitation of the content of this presentation, and for any use of the signs, trademarks and logotypes contained herein. This prohibition extends to any kind ofreproduction, distribution, transmission to third parties, public communication or conversion by any other mean, for commercial purposes, without the previous expressconsent of CaixaBank and/or other respective proprietary title holders. Any failure to observe this restriction may constitute a legal offence which may be sanctioned by theprevailing laws in such cases.

3
Index
1. CaixaBank at a glance p. 4
2. Competitive stance p. 12
3. 2015-18 Strategic Plan p. 24
4. International presence & Investments p. 30
5. Activity & results update: FY 2017 p. 33
Appendix p. 61

4
CaixaBank [At a glance]
5
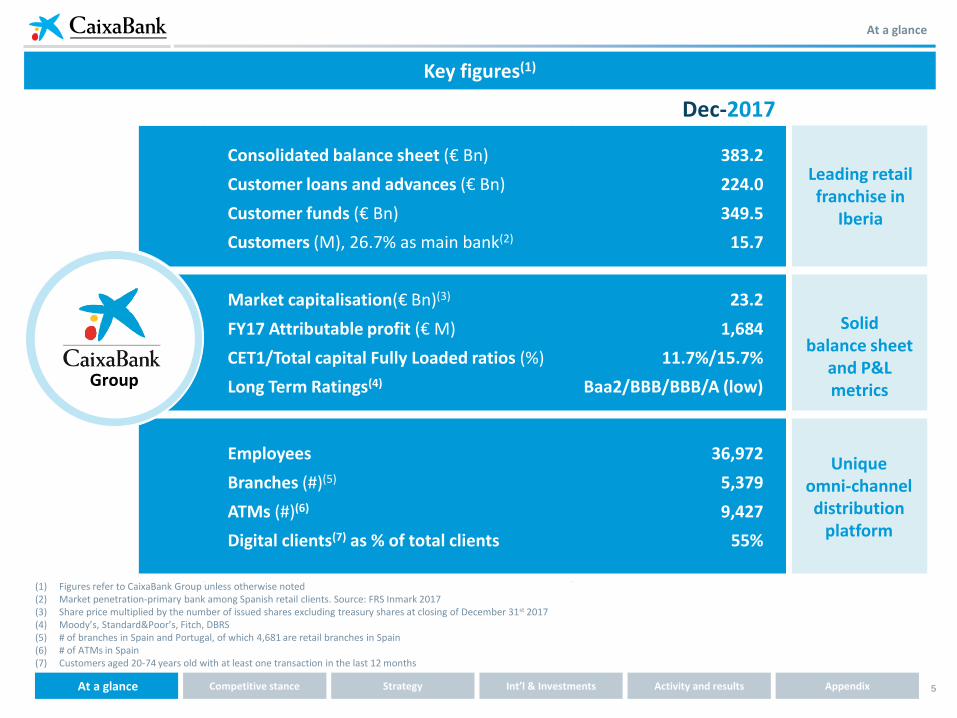
At a glance
Key figures(1)
Int’l & Investments Activity and resultsAt a glance Competitive stance Strategy Appendix
Consolidated balance sheet (€ Bn)
Customer loans and advances (€ Bn)
Customer funds (€ Bn)
Customers (M), 26.7% as main bank(2)
383.2
224.0
349.5
15.7
Market capitalisation(€ Bn)(3)
FY17 Attributable profit (€ M)
CET1/Total capital Fully Loaded ratios (%)
Long Term Ratings(4)
23.2
1,684
11.7%/15.7%
Baa2/BBB/BBB/A (low)
Employees
Branches (#)(5)
ATMs (#)(6)
Digital clients(7) as % of total clients
36,972
5,379
9,427
55%
Dec-2017
Leading retail franchise in
Iberia
Solid balance sheet
and P&L metrics
Unique omni-channel distribution
platform
(1) Figures refer to CaixaBank Group unless otherwise noted(2) Market penetration-primary bank among Spanish retail clients. Source: FRS Inmark 2017(3) Share price multiplied by the number of issued shares excluding treasury shares at closing of December 31st 2017 (4) Moody’s, Standard&Poor’s, Fitch, DBRS(5) # of branches in Spain and Portugal, of which 4,681 are retail branches in Spain(6) # of ATMs in Spain(7) Customers aged 20-74 years old with at least one transaction in the last 12 months
Group

6
At a glance
Flagship Group in Iberian retail banking
Int’l & Investments Activity and resultsAt a glance Competitive stance Strategy Appendix
Main banking relationship for 26.7% of Spaniards(1) and leader in online & mobile banking in Spain
15.7M clients; 13.8M in Spain, 1.9M in Portugal
5,379 branches(2); 9,427 ATMs(3): best-in-class omni-channel platform
Highly-rated brand: based on trust and excellence in quality of service
€23.2 bn Market capitalisation(4). Listed since July 1st 2011
Net profit FY17: €1,684M; 8.4% RoTEtrailing 12 Months; 11.2% Spain Bancassurance RoTE(5)
Solid capital metrics: CET1 B3 FL at 11.7%; CET1 phase-in at 12.7%
Outstanding NPL Coverage ratio: 50%
Ample liquidity: €72.8 Bn in liquid assets
Stable funding structure: LTD ratio 108.0%
Aiming at a sustainable and socially responsible banking model
Proud of our heritage: over 110-year history, 78 acquisitions
Included in leading sustainability indices (DJSI, FTSE4Good, CDP A-list, MSCI Global Sustainability, EthibelSustainability Index (ESI), STOXX® Global ESG Leaders)
Deeply rooted values: quality, trust and social commitment
Leading bancassurance franchise Robust financials Solid heritage & values
(1) Retail clients in Spain aged 18 or above. (2) # of branches in Spain and Portugal, of which 4,681 are retail branches in Spain(3) # of ATMs in Spain(4) Share price multiplied by the number of issued shares excluding treasury shares at closing of December 31st 2017(5) RoTE exc. extraordinary items +€256M net business combination result from BPI, -€212M early retirement programmes of 2Q17 and -€3M of extraordinary costs; all after tax. Note that RoTE includes the
coupon of AT1 accrued in the year (-€22M post-tax)
7
At a glance
A history that spans over 110 years
Int’l & Investments Activity and resultsAt a glance Competitive stance Strategy Appendix
19
70
"la Caixa"is established
19
04
19
18
Welfare programmeintegrated into the organisation
Building of significant industrial portfolio
19
77
Opportunity to offer same services as banks
19
88
National expansion outside the original region
20
00
CaixaHoldingcreated
20
07
Internationalisation& IPO of Criteria Caixa Corp
20
08
Acquisition of Morgan Stanley Wealth in Spain
20
10
Acquisition of Caixa Girona
Acquisition of Banca Civica
Acquisition of Banco de Valencia
Prudential deconsolidation from Criteria
CaixaBankcreated and listed
20
11
20
11
-12
Acquisition of Bankpime
20
12
20
13
20
14
“la Caixa” Banking Foundation (LCBF)created
Acquisition of Barclays2
01
5
20
16
Disposal of BEA/GFI
Disposal of Boursorama
20
17
Acquisition of BPI
Launch of ImaginBank
15.7Mclients
Full separation from LCBF board

8
Final restructuring of “la Caixa” Group was recently completed
From unlisted savings-bank to 3 institutions with separate missions and governance
Bancassurance
Non-core RE
Investments
BPI
100%
40%
Prudential deconsolidation acknowledged by the ECB in September 2017
Lead independent director
Non-exec Chairman
Clear separation of roles
Best-in-class corporate governance
CaixaBank board distribution, %
CRI stake reduced: 40% (vs. 81.5% Jun-2011)
Reduced lending to CRI: €0.2Bn (-95% vs. Jun-2011)
The Foundation no longer controls the board
61%
39%
Other(2)
“la Caixa”Banking Foundation(1)
(1) Includes 6 proprietary directors representing “la Caixa” Banking Foundation and 1 board member proposed by the banking foundations formerly comprising Banca Cívica(2) Includes 9 independent directors, 1 proprietary director proposed by Mutua Madrileña and the CEO
At a glance
Int’l & Investments Activity and resultsAt a glance Competitive stance Strategy Appendix

9
Organic growth has been reinforced by well-timed acquisitions
Proven integration track record
(1) Time lapsed from closing, legal merger or acquisition agreement until completion of IT integration(2) It involved completing 4 sequential integrations
Strict financial discipline for acquisitions
Synergies as % of initial costs Synergies 2016(€M)
Timing(begin/completed)
Initial target Achieved
59% 63% 580 2012/2015
52% 62% 101 2013/2015
45% 57% 189 2015/2016
Effective delivery of synergies exceeding targets and earlier than expected. In €M
0.3x0.0x
0.5x
Attractive P/BV multiples
2008 2010 2011-12 2012-13 2014-15
6 months(1) 4 months(1) 8.5 months(1),(2) 5 months(1)10 months(1) 4.5 months(1)
2017
P/TBV
0.68x
Total synergy target
€122 M
By 2019 +
Int’l & Investments Activity and resultsAt a glance Competitive stance Strategy Appendix
At a glance

10
Premium brand reputation with ample external recognition
Int’l & Investments Activity and resultsAt a glance Competitive stance Strategy Appendix
Premium brand reputation Wide recognition of leading IT & Mobile infrastructure
Updated April 9th 2018
European Seal of Excellence +500 EFQM: European Foundation for Quality Management (2016)
Best Bank in Spain in 2017 and 2018. Best Consumer Digital Bank in Western Europe in 2016 and 2017Global Finance
Best Bank in Spain 2017Best Private Bank in Spain 2016, 2017, 2018Euromoney
Innovation in Payments and Disruptive Innovation in Banking 2016Bai
European Retail Bank of The Year 2017World’s most innovative bank in 2016Retail Banker
Most responsible financial institution and best corporate governanceMerco (2016)
Technology Project of the Year 2017: Artificial Intelligence. Best Global Technology Project 2016 The Banker
Global Innnovator 2016Efma and Accenture
Best Private Bank for Customer Service in Europe 2017The Banker
Model Bank of the YearCelent
Dow Jones Sustainability Index The bank scored 87 points, placing it among the world’s leading banks in terms of corporate responsibility
At a glance
Best Bank for Quality Service in Portugal 2017ECSI
Other recognitions in 2017:

11
Geared to performance of the Iberian economies
(1) Loans to the “Other Resident Sectors” excluding to financial services companies (Bank of Spain and Bank of Portugal statistics)Sources: Eurostat (GDP growth), Bank of Spain and Bank of Portugal (credit and deposits growth), INE Spain and Portugal (unemployment rate and general government balance), Spanish Ministry of Public Works (housing prices), and CaixaBank Research (all forecasts 2017E and 2018E). Forecasts as of 31th of March 2018
Solid economic recovery
-2.9%-1.7%
1.4%
3.4% 3.3% 3.1% 2.8%
2012 2013 2014 2015 2016 2017 2018E
-9.9% -9.4%-7.1%
-4.3%-2.9%
-2.0%-0.5%
2012 2013 2014 2015 2016 2017 2018E
Int’l & Investments Activity and resultsAt a glance Competitive stance Strategy Appendix
At a glance
SPAIN PORTUGAL
Unemployment rate, % yoy
Credit(1) (industry), % yoy
Housing prices (nominal) % yoy
Unemployment rate, % yoy
Credit(1) (industry), % yoy
-5.9% -5.1%
-7.9%
-4.0% -4.1%-2.8%
-1.5%
2012 2013 2014 2015 2016 2017 2018E
15.8% 16.5%14.1%
12.6%11.2%
8.9% 7.7%
2012 2013 2014 2015 2016 2017 2018E
-8.8%-5.8%
-2.4%
1.1% 1.9%2.4% 4.0%
2012 2013 2014 2015 2016 2017 2018E
-5.7%-4.8%
-7.2%
-4.4%
-2.0%-3.0%
-1.2%
2012 2013 2014 2015 2016 2017 2018E
General government balance, % of GDP
24.8% 26.1% 24.4%22.1%
19.6%17.2%
15.3%
2012 2013 2014 2015 2016 2017 2018E
-4.0%
-1.1%
0.9%1.8% 1.5% 2.7% 2.4%
2012 2013 2014 2015 2016 2017 2018E
GDP growth, % yoy
3.1
2.5
2.7
2.5
2.0
1.5
2.6
2.3
2.4
2.3
2.1
1.4
Spain
Euro Area
Portugal
Germany
France
Italy
2017
2018-19 (forecast)
SPAIN
PORTUGAL

12
Competitive [Stance]

13
A one-stop shop distribution model for lifetime finance and insurance needs
Competitive stance
Int’l & Investments Activity and resultsAt a glance Competitive stance Strategy Appendix
“Much more than just a bank”
Scale and capillarityProximity/ customer
intimacy
55% of our clients are digital(1)
33% penetration in digital(2)
IT and digitalisation
Mobility and big data
Comprehensive offering
Wide and bespoke with 100% owned
factories
10,500 certified advisors (Spain)
1.5M affluent banking clients(3)
>100,000 private banking clients(3)
Advisory Focus on capabilities and quality of service
#1 Insurance Group in Spain
#1 Asset ManagementGroup in Spain
#1 in payments in Spain
13.8M clients (Spain)
4,681 retail branches (Spain)
9,427 ATMs (Spain)
(1) Customers aged 20-74 years old with at least one transaction in the last 12 months(2) 12 months average; source: Comscore, latest available data(3) Latest available data as of 16th February 2018, in Spain
Provides unique advantages in current operating environment
Sources: Bank of Spain, ICEA, Inverco, Comscore

14
The “bank of choice” for Spanish retail customers
Market share in line with two closest peers combined... ... yet still growing organically more than peers
(1) Retail clients in Spain aged 18 or above. Peer group includes: Banco Santander (including Banco Popular), BBVA. Source: FRS Inmark 2017(2) In Spain(3) Retail clients in Spain aged 18 or above. Peers include Banco Sabadell, Banco Santander + Popular (Pro-forma in 2016), Bankia, BBVA. Source: FRS Inmark 2017 report(4) Peers include Banco Sabadell, Banco Santander (ex Banco Popular), Bankia, BBVA. Sources: for CaixaBank, Social Security (February 2018); peers: FRS Inmark 2017
Commercial activity
Organic growth reflects franchise and value proposition strengths
25.7%
14.4% 13.3%
9.0%5.6%
26.7%
14.7%12.8%
9.6%6.1%
Peer 1 Peer 2 Peer 3 Peer 4
Retail clients penetration (primary bank)(3) in Spain, %
Growing leadership in client income flows
+0.0% = -0.2% +0.6%
CABK
+0.3% -0.5% +0.6% +0.5%+1.0%
2016
2017
25.9%
15.5%11.1%
9.0%5.6%
26.5%
15.5%
10.3% 8.8%6.2%
Peer 1 Peer 2 Peer 3 Peer 4
2016
2017
-0.8% +0.6%
CABK
Market share in payroll deposits(4) in Spain, %Feb-17
Feb-18
Market penetration among Spanish retail clients (primary bank)(1) , %
Leadership in income flows is key to generate further relationship value
13.8 M Customers(2)
5
10
15
20
25
1994 1997 2000 2003 2006 2009 2012 2015
Peer 212.8%
Peer 114.7%
2017
26.7%
CABK
Int’l & Investments Activity and resultsAt a glance Competitive stance Strategy Appendix

15
Market leadership
Our leading market position generates valuable network effects
2007 market share Growth since 07
Leading franchise in Spanish retail bankingCABK Market penetration for retail clients in Spain(1), %
(1) Spanish customers older than 18 years of age. Peers include BBVA, Bankia, Cajas Rurales, Sabadell and Santander (including Banco Popular)(2) Deposit included demand and time deposits and loan data to the other resident sectors as per Bank of Spain data(3) SMEs: Firms with turnover <€50M. Latest data for 2016; initial data for 2008 (bi-annual survey). Corporate: firms with turnover >€50M. Latest data for 2016; initial data for 2008 (bi-annual survey). For
firms with turnover €1-100M, market penetration was at 48,0% in 2016 according to FRS Inmark survey
Latest available data as of 6th of April 2018. Source: FRS Inmark 2017, Social Security, BoS, INVERCO, ICEA, AEF, Servired, 4B and Euro6000
Strong market shares across the boardCABK Market share by key products in Spain, %
Int’l & Investments Activity and resultsAt a glance Competitive stance Strategy Appendix
CABK
17.8%
17.6%
23.2%
9.1%
14.4%
5.6%
11.2%
20.0%
21.5%
11.0%
12.5%
14.4%
9.1%
10.2%
15.6%
20.4%
POS terminal Turnover
Credit cards turnover
Health insurance
Life-risk insurance
Savings Insurance
Mutual Funds
Pension Plans
SME penetration
Corporate penetration
Mortgages
Pensions deposits
Payroll deposits
Loans
Deposits
CABK as primary bank
Customer penetration 30.0%
26.7%
15.7%
26.5%
52.5%
26.8%
23.3%
14.5%
57.7%
16.7%
23.5%
18.7%
27.1%
Mass retail banking
AuM
Payment systems
Insurance
Individuals
Businesses
20.1%
17.6%
(1)
(2)
(3)
29.2%
(3)
(2)30%
18% 17%
12%10%
8%
Peer 1 Peer 2 Peer 3 Peer 4 Peer 5

16
Economies of scale and technology are key drivers of operational efficiency
Cost benefits from economies of scale
Int’l & Investments Activity and resultsAt a glance Competitive stance Strategy Appendix
Minimal HQ staff
(1) Data as of December 2016 for CaixaBank ex BPI and own estimates as of the acquisition date for the acquired entities (Banca Cívica, Banco de Valencia and Barclays)(2) Last data available. CaixaBank ex BPI(3) Source: FRS Inmark 2017 Report on the financial behavior of individuals and reports from companies (Spain). Peers in Spain, including: Bankia, BBVA, SAB and SAN (including Banco Popular)
Light branch model
18%
82%
CABK (ex BPI) Task absorption at the branch (%)
Branches
ATMs
Sales force focused on value creation
Retail customers per employee(3)
Scalable and efficient sales-oriented network
6%
17%20%
30%
CaixaBank Acquisition 1 Acquisition 2 Acquisition 3
HQ staff as % of total employees(1)
CABK
CABK
406
373
314
245
202
CABK
Peer 1
Peer 2
Peer 3
Peer 4
Employees/branch(2)
6.0 6.7
13.1
CABK Spanish sector avg. Euro area

17
Scale economies result in significant cost benefits
(1) General expenses and amortisations last 12 months. Recurrent expenses for CABK and SAB. FY17 for CaixaBank (ex BPI) and peers. Peers include: Bankia, Bankinter, BBVA Spain + RE business, Sabadell (ex TSB), SAN Spain + RE business.
(2) Business volumen includes gross customer loans and customer funds
Cost benefits from economies of scale
In % In %
General expenses(1) / gross income General expenses(1) / business volume(2)
Extremely competitive general expenses: low and falling
Int’l & Investments Activity and resultsAt a glance Competitive stance Strategy Appendix
32.1
24.6 24.1
20.9 20.618.8
Peer 5 Peer 4 Peer 3 Peer 2 Peer 1 CABK
0.45
0.37 0.360.34
0.27 0.27
Peer 5 Peer 4 Peer 3 Peer 2 Peer 1 CABK

18
Segmentation
Businesses
(0.06)
Individuals(assets managed range, €M)
Companies, institutions, micro businesses & self-employed (3), (turnover range, €M)
(1) There is additional market segmentation (including, for instance, real estate developers and public sector & non-profits) not shown in the pyramid(2) Retail banking includes individuals, micro businesses, self-employed, retail establishments, freelance professionals and agribusinesses(3) Also including retail establishments, freelance professionals and agribusinesses
(4) Total customers: CaixaBank + BPI
Customer breakdown by segment(1):
(0.5)
Micro Businesses & self-employed (3) Individuals
Retail Banking(2)
One of the largest customer bases: 15.7 M(4)
A highly segmented business model based on specialisation and quality of service
Segmentation is key to better serving client needs
Premier Banking
Private Banking
Specialised network
(2)
Corporate& Institutional
Banking(200)
Int’l & Investments Activity and resultsAt a glance Competitive stance Strategy Appendix
Specialised sales staff

19
Omni-channel distribution network
Best-in-class omni-channel distribution platform with multi-product capabilities
Staff time is freed-up to concentrate on building relationships and innovation
(1) As of March 2017. Source: Bank of Spain(2) Customers aged 20-74 years old with at least one transaction in the last 12 months(3) 12 month average, latest available data (December 2017). Source: ComScore(4) As of December 2017
4,681 retail branches
18.2% market share
CABK Branch market share by province1, %
The largest physical footprint in Spain
<10%
>15%
10-15%
Employees with mobile equipment
9,427 ATMs
18.2% market share
Leader in digital channels in Spain
Int’l & Investments Activity and resultsAt a glance Competitive stance Strategy Appendix
Internet banking
27% of transactions
33% penetration(3)
Mobile banking
+ 53% CAGR 2012-2017(4)
29% of transactions
55% of our clients are digital(2)

20
An efficient and effective branch model which evolves over time
Omni-channel distribution network
A high number of branches is an indication of reach and client proximity – not a cost driver
(1) As of March 2017. CaixaBank ex BPI(2) FRS Inmark 2017 (Spain). Peers: SAN (including POP), BBVA, SAB, BKIA(3) Excluding international branches and representative offices(4) Number of closed branches net of number of opened branches
Int’l & Investments Activity and resultsAt a glance Competitive stance Strategy Appendix
5,480
8,380
5,3792,365 3,001
535
2007 Acquisitions 2007 PF withacquisitions
Closed (net) 2017
Employees/branch(1)
Light branch model…
… very effective in a geographically-dispersed country
Primary bank choice: main reasons(2) (%)Primary bank customers/customers(2)
Evolution of branch network(3) size
-36%
A dynamic network
+54% Clients/Branch
(4)
Group
18.7
19.4
19.9
20.8
21.1
43.2
Payroll/pension
Economic conditions
Direct debits
Prescription
Service quality
Proximity
89%
83% 83%
78% 78%
CABK Peer1 Peer2 Peer3 Peer4
6.0 6.7
13.1
CABK Spanish sector avg. Euro area

21
At the forefront of digitalisation
The highest digital penetration
(1) 12 month average, latest available data (December 2017). CaixaBank ex BPI; peer group includes: Bankia, Bankinter, Banco Sabadell, Banco Santander, BBVA, ING. Source: Comscore(2) Customers aged 20-74 years old with at least one transaction in the last 12 months(3) Sales executed via electronic channels (web, mobile and ATM)Market penetration for digital clients data as of December 2017. In Spain
Innovative products and services
Not just “anytime, anyplace, anywhere” but also a bespoke offering
Int’l & Investments Activity and resultsAt a glance Competitive stance Strategy Appendix
Innovation & Technology
Market penetration for digital clients(1) in %
of our clients are digital(2)
Leveraging IT for commercial effectiveness…
…while boosting efficiency and facilitating compliance
32,200SMART PCs
161
NEW BRANCH FORMAT(STORES)
DIGITAL SALES
28%of consumer loans(3)
99%
DIGITAL PROCESSES
68M
DIGITAL SIGNATURES AUTOMATION
22%administrative tasks in
branches vs. 42% in 2006
>2 M transactions >3.0 M users
With extended opening hours
Available from Oct-17
8%
11%
12%
14%
20%
22%
33%
Peer 6
Peer 5
Peer 4
Peer 3
Peer 2
Peer 1
CABK
55%
22
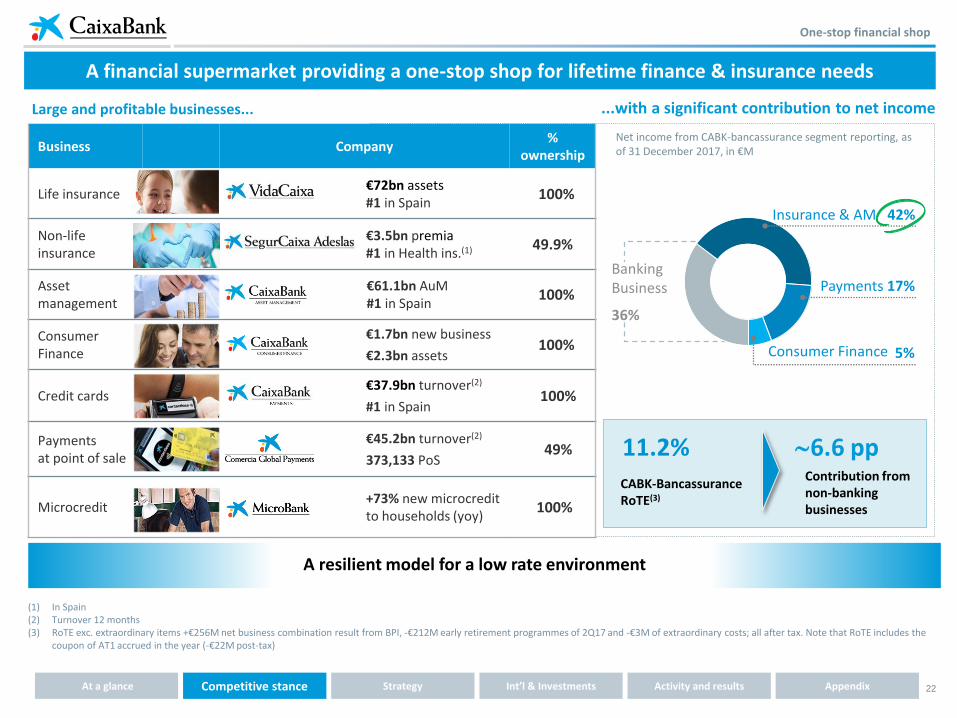
Business Company%
ownership
Life insurance €72bn assets #1 in Spain
100%
Non-life insurance
€3.5bn premia #1 in Health ins.(1) 49.9%
Asset management
€61.1bn AuM #1 in Spain
100%
Consumer Finance
€1.7bn new business
€2.3bn assets100%
Credit cards €37.9bn turnover(2)
#1 in Spain100%
Payments at point of sale
€45.2bn turnover(2)
373,133 PoS49%
Microcredit +73% new microcredit
to households (yoy)100%
One-stop financial shop
(1) In Spain(2) Turnover 12 months(3) RoTE exc. extraordinary items +€256M net business combination result from BPI, -€212M early retirement programmes of 2Q17 and -€3M of extraordinary costs; all after tax. Note that RoTE includes the
coupon of AT1 accrued in the year (-€22M post-tax)
A financial supermarket providing a one-stop shop for lifetime finance & insurance needs
Int’l & Investments Activity and resultsAt a glance Competitive stance Strategy Appendix
Large and profitable businesses... ...with a significant contribution to net income
11.2%CABK-BancassuranceRoTE(3)
6.6 ppContribution from non-banking businesses
Net income from CABK-bancassurance segment reporting, as of 31 December 2017, in €M
A resilient model for a low rate environment
Insurance & AM 42%
Payments 17%
Consumer Finance
BankingBusiness
36%
5%

23
Premium brand reputation
A trustworthy brand
Int’l & Investments Activity and resultsAt a glance Competitive stance Strategy Appendix
CORPORATE VALUES MAIN HIGHLIGHTS & COMMITMENTS
Quality
Trust
Social commitment
Integrity, transparency and good governance
Promoting entrepreneurship and
financial inclusion
Social commitment: corporate volunteering &
financial education
Incorporating social and environmental criteria in
risk analysis, products and services
Main corporate responsibility aims
• Honoured by Euromoney as the Best Bank for CSR in Europe (July 2016)
• Inclusion of CaixaBank in the main worldwide sustainability indices (DJSI, FTSE4Good, …) and in the CDP A-list 2017 of the leading companies fighting against climate change
• MicroBank, CaixaBank’s social bank, first European institution by volume of microcredit loans granted
• Equator Principles’ signatory: consideration of social and environmental impacts in financing large projects
• Extension to clients of welfare programmes of “la Caixa” Banking Foundation. Eg.: labour inclusion (“Incorpora” programme), Business Alliance for Children Vaccination
• More than 32,000 flats in social rent, the main private social housing stock in the country
• €44.3M budget of “la Caixa” Foundation, channelled through the CaixaBank commercial branch network to cover local social needs
• Corporate Volunteering programme with more than 5,000 employees as active participants
• Chairing the Spanish Network of the United Nations Global Compact since 2012
Last updated on 8th February 2018

24
Strategic Plan [2015-2018]

25
Unique position to benefit from the
recovery
Building the leading Spanish banking franchise
Strengthening the balance sheet
Proactive changeFrom an unlisted savings bank to 3 institutions with different missions and governance
From # 3 to # 1Growing organically and non-organically
Best in classOnly domestic bank with investment grade ratings throughout the crisis
2007-2014: emerged from the crisis as a stronger institution
2011 2014
IPO IPO
2007
Transforming the corporate structure
2008 2010 2011-12 2012-13 2014-15
Starting point
Int’l & Investments Activity and resultsAt a glance Competitive stance Strategy Appendix

26
Strategic priorities 2015-2018
Sustainable profitability above cost of capital
Enhance our leadership in banking digitalisation
Retain and attract the best talent
Optimisation of capital allocation
Client focus: Best-in-class in quality of
service and reputation
Committed
to trustworthy
and profitable
banking
Strategic Plan
2015-2018
strategic priorities 2015-20185
Strategic Plan 2015-2018
Int’l & Investments Activity and resultsAt a glance Competitive stance Strategy Appendix

27
Progress across all five 2015-18 Strategic Priorities
A positive mid-term balance
Strategy update
Market share gains across the board –Retail client penetration (preferred bank)(1)
2014 2017
RoTE
Capital allocated to stakes
% digitalised processes
Client focus: Best-in-class in quality of service and reputation
Sustainable profitability above cost of capital
Optimisation of capital allocation
Enhance our leadership in banking digitalisation
Retain and attract the best talent
% digital clients(2)
Advanced training in advisory services –Post-graduate degree in financial advisory
10,500
Employees
23.5% 26.7%
3.4% 8.4%
~16% <5%
45% 55%
69% ~99%
Int’l & Investments Activity and resultsAt a glance Competitive stance Strategy Appendix
(1) Source: FRS Inmark 2016(2) Digital clients as % of total clients. Customers aged 20-74 years old with at least one transaction in the last 12 months

28
Revised 2018 Financial Targets(1)
Strategy update
(1) See p.60 for updated 2018 Group guidance(2) Cost-to-income ratio trailing 12 months stripping out extraordinary expenses(3) Core revenues: NII + Fees + insurance revenues from life-risk premia and equity accounted income from SegurCaixa Adeslas. (4) 2016-18. CaixaBank standalone (ex BPI) (5) Recurrent administrative expenses, depreciation and amortisation(6) Pro-forma Barclays Spain. CaixaBank standalone (ex BPI)
Geared for growth and increased profitability
RoTE
Recurrent C/I ratio(2)
CET1 FL
Total Capital FL
Cash dividend payout ratio
Special dividend and/or share buybacks
Pro
fita
bili
tySo
lve
ncy
Div
iden
d
Core revenues(3)(4)
9-11%
55%
2018
11-12%
>14.5%
≥ 50%
If CET1 FL >12%
4% CAGR(1)
Revised targets
Maintaining solid capital metrics still a key priority
Commitment implies a comfortable buffer above regulatory minima
Strong capital position supports payout ≥ 50%
Intend to transition to full cash dividend in 2017
Focus of the strategic update: generating a sustainable return above cost of equity
Core revenues(3) growth to be underpinned by sustained insurance and AuM activity and consumer lending growth
Cost-saving measures to offset wage inflation
Improving asset quality and positive macro dynamics to support further CoR decline
Recurrent operating expenses(5)(6) Flat 2014(1)
Cost of risk <40 bps(1)
Int’l & Investments Activity and resultsAt a glance Competitive stance Strategy Appendix

29
Shareholder remuneration
Actively seeking to return capital to shareholders
Shareholder Remuneration Policy
Int’l & Investments Activity and resultsAt a glance Competitive stance Strategy Appendix
2016 Results (1)
2015 Results DEC 2015
MAR 2016
JUN 2016
Scrip€ 0.04
Cash€ 0.04
Scrip€ 0.04
Cash€ 0.04
SEP 2016
Cash€ 0.03
SEP 2015
DEC 2016
Scrip€ 0.04
APR 2017
Cash€ 0.06
2015-18
Strategic Plan
Cash dividend payout ≥ 50% from 2015
Transition to full cash dividend in 2017
2017 Results (2)
Cash€ 0.07
New dividend policy: two half-yearly cash dividends(2)
Cash
€ 0.08
NOV2017
APR 2018
(1) The total shareholder remuneration for 2016 has been EUR 0.13 per share (gross), bringing the total cash amount paid to 54% of consolidated net profit, in line with the 2015-2018 Strategic Plan (2) In accordance with the new dividend policy, the Board of Directors also resolved that shareholder remuneration for 2017 will be paid through two half-yearly cash dividends. The AGM approved the
distribution of a final cash dividend of EUR 0.08 per share (gross) against 2017 profits to be paid on 13 April 2018. After payment of this dividend, the total shareholder remuneration for 2017 will be EUR 0.15 per share (gross), bringing the total cash amount paid to 53% of consolidated net profit, in line with the 2015-2018 Strategic Plan.

30
International presence &[Investments]

31
Internationalisation
Supporting clients internationally and developing joint business initiatives
17 Representative OfficesParis, Milan, Beijing, Shanghai, Dubai, New Delhi, Istanbul, Singapore, Cairo, Santiago de Chile, Bogotá, New York, Johannesburg, Sao Paulo, Hong Kong, Lima, Algiers
Representation offices & international branches to better serve our clients(1)
Non-controlled International Banking Stakes
% stake
Erste Group Bank 9.92%
(1) As of April, 4th 2018
JV with Erste and Global Payments
Payment services
Czech Rep., Slovakia, Romania
EBG: 49%
Global Payments+CABK: 51%
Influential position
Building strategic alliances
Sharing best practices
JVs and project development
Int’l & Investments Activity and resultsAt a glance Competitive stance Strategy Appendix
3 Spanish DeskLisbon, Mexico City, Vienna
4 International Branches (6 offices)Warsaw Morocco with three offices:
• Casablanca• Tangier• Agadir
London Frankfurt
Representative office
International branch
Spanish Desk

32
Industrial stakes
5.00%
One of the largest telecommunications companies in the world in terms of market cap and number of customers. Company market value(1): €42.2 Bn
9.64%
Integrated global energy company , carrying out upstream and downstream activities. Company market value(1): €22.5 Bn
(1) Market value of CaixaBank stakes as of December 31st 2017. Source: Bloomberg
Diversification
Value
Profitability
Financial flexibility
Income diversification: sound revenue base
Geographical diversification
Very liquid investments
Limited regulatory capital consumption
Potential capital buffer
High dividend yield
Attractive return
Tax-efficient (≥ 5%)
International leaders, defensive sectors
Solid fundamentals
Strong financials
€4.4bn(1)
Solid and liquid legacy assets provide revenue and capital diversification
Int’l & Investments Activity and resultsAt a glance Competitive stance Strategy Appendix

33
Activity & results [FY 2017]

34
Strong profitability improvement on higher core revenues and lower impairments2017
FY 2017 Highlights
Note: Hereinafter “CABK” refers to CaixaBank stand-alone while “CABK Group” or “Group” refers to CaixaBank Group
(1) CABK: penetration as primary bank amongst retail clients aged 18 or above in Spain; source: FRS Inmark 2017. BPI: penetration as primary bank amongst retail clients in Portugal; source BASEF Banca. Latest available data. (2) 12 months average; source: Comscore, latest available data. (3) Mutual funds (including SICAVs and managed portfolios) and pension plans. (4) Total provisions, including loan-loss provisions and other provisions plus net gains/losses on RE (disposals and other). (5) Performing loan-book; businesses including corporates and SMEs and excluding RE developers. (6) NPAs include NPLs, non performing contingent liabilities and OREO (all gross of provisions). (7) As reported by BPI
230316
620
814
1,047
1,508
176
FY12 FY13 FY14 FY15 FY16 FY17
1,684Profit attributable to the Group, in €M
Strong profitability improvement
RoTE, trailing 12 months in %
8.4%5.6% 1.3% 3.4% 4.3% 1.7%
BPI
+44%
Better business mix and higher margins
Reinforced leadership in Iberian retail banking
Core revenues and lower impairments drive profit growth
NII
Fees
AuM(3) + insurance revenues
Total provisions + net RE result (4)
Net income
AuM(3) + insurance funds
Consumer + business loans(5) (perform.)
Customer spread (annual avg.)
Steep decline in NPAs
NPAs(6)
OREO sales
Capital gains on RE sales (% of NBV)
FY % yoy
+5.1%
+6.3%
+19.9%
-17.6%
+44.1%
+9.5%
+7.7%
-9.3%
€1.6Bn
20%
+12 bps
Successful integration of BPI
Growing retail market share(1) CABK
+100 bps yoy to 26.7% (#1); BPI +50 bps yoy
#1 market penetration for digital clients(2): 33%
+61%
Better operating performance masked by BFA charges
NII + Fees(7)
Recurrent costs(7)
BFA 4Q one-offs (gross) -€119M
+3.1%
-5.3%
Group
CET1 FL (YE17)
CET1 SREP FL 2018
LCR (YE17)
11.7%
Net attributable income €1,684 M +61%
Strong solvency and liquidity metrics
202%
8.75%1.9M
Clients
13.8MClients
Int’l & Investments Activity and resultsAt a glance Competitive stance Strategy Appendix
35
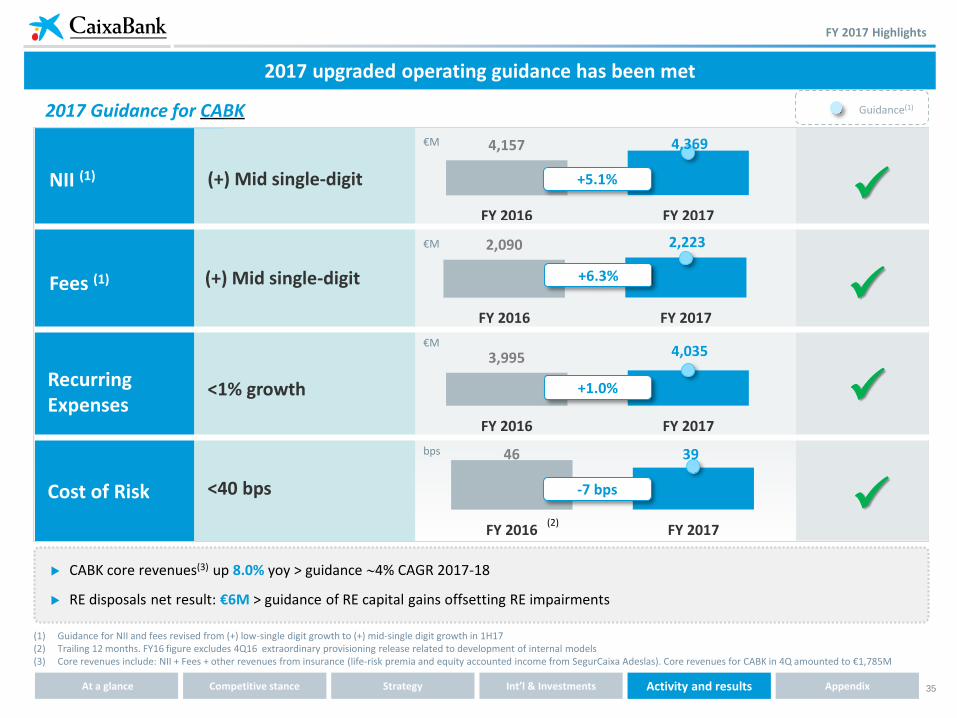
2017 upgraded operating guidance has been met
2017 Guidance for CABK Guidance(1)
(1) Guidance for NII and fees revised from (+) low-single digit growth to (+) mid-single digit growth in 1H17(2) Trailing 12 months. FY16 figure excludes 4Q16 extraordinary provisioning release related to development of internal models(3) Core revenues include: NII + Fees + other revenues from insurance (life-risk premia and equity accounted income from SegurCaixa Adeslas). Core revenues for CABK in 4Q amounted to €1,785M
NII (1)
Recurring Expenses
(+) Mid single-digit
<40 bpsCost of Risk
Fees (1)
4,157 4,369
FY 2016 FY 2017
+5.1%
3,995 4,035
FY 2016 FY 2017
+1.0%
46 39
FY 2016 FY 2017
-7 bps
(2)
€M
€M
€M
bps
(+) Mid single-digit
<1% growth
2,090 2,223
FY 2016 FY 2017
+6.3%
CABK core revenues(3) up 8.0% yoy > guidance 4% CAGR 2017-18
RE disposals net result: €6M > guidance of RE capital gains offsetting RE impairments
FY 2017 Highlights
Int’l & Investments Activity and resultsAt a glance Competitive stance Strategy Appendix

36
Commercial activity
Growth in AuM and savings insurance continues
Customer funds breakdown(1), in €Bn
31st Dec. % ytd % qoq
I. On balance-sheet funds 247.5 14.0% (1.0%)
Demand deposits 158.8 19.7% (1.3%)
Time deposits(2) 35.8 (9.7%) (2.4%)
Subordinated liabilities 2.0 (38.7%) (0.4%)
Insurance 50.0 23.9% 2.2%
Other funds 1.0 (16.0%) (38.0%)
II. Assets under management 96.6 17.9% 1.1%
Mutual funds(3) 66.9 18.0% 0.9%
Pension plans 29.7 17.7% 1.5%
III. Other managed resources(4) 5.4 9.9% 18.5%
Total customer funds 349.5 15.0% (0.2%)
Key CABK trends+15.0%
ytd
% ytd % qoq
2.8% (1.1%)
10.9% (1.5%)
(31.1%) (2.6%)
(38.8%) 0.0%
13.7% 2.4%
(17.2%) (38.3%)
7.5% 1.3%
7.8% 1.2%
6.8% 1.6%
(34.2%) 22.2%
3.5% (0.2%)
Customer funds CABK, evolution ytd in €Bn and %
11.7
10.6
11.2 (12.3)
Insurance+ AuM
Demand deposits &other
Time deposits Total
+9.5% +7.9% -31.1% +3.5%
Continued migration from time deposits to higher-yielding alternatives in a low-rate environment…
…drives structural growth in savings insurance andAuM products
Customer funds
€349.5 BnGroup
(1) BPI Vida acquired by VidaCaixa in December 2017 contributes €4.1Bn in insurance funds and €2.7Bn in pension plans as of 31 December 2017 that are included within the BPI perimeter to report the organic evolution in the quarter
(2) Includes retail debt securities amounting to €490M (Group) and €455M (CABK) at 31 December 2017(3) Includes SICAVs and managed portfolios(4) Impacted in 1Q by amortisation of €1.5Bn subordinated notes issued by Criteria(5) Mutual funds (including SICAVs and managed portfolios) and pension plans
(5)(2)
Int’l & Investments Activity and resultsAt a glance Competitive stance Strategy Appendix

37
Unique advisory capabilities of the network help to grow market share
(1) Mutual funds (including own and third-party funds, SICAVs and managed portfolios) and pension plans(2) Net inflows. Includes own and third-party funds, SICAVs and managed portfolios
Consolidating our new advisory model
Life insurance + AuM(1) as % of managed client funds in Private and Premier Banking
Commercial activity
54%
60%
Dec-16 Dec-17
€168 BnTotal managed client funds in Private and Premier Banking
Private and Premier banking accounts under
advisory contract
Mutual funds owned by clients under advisory
contract
70% 85%
Discretionary managed portfolios
Ready for Mifid II ahead of its implementation
55.966.5
75.6
89.7
108.9
122.2
133.9
Dec-11 Dec-12 Dec-13 Dec-14 Dec-15 Dec-16 Dec-17
Life-savings insurance
€8.8 Bn
Pension plans(2) €1.9 Bn
€3.2 BnMutual funds(2)
Net inflows (CABK), FY17 yoy
+100% FY17 yoy
Leveraging strong advisory capabilities
530 Client Managers
1,950Client Managers
Steady growth in lifetime saving volumes
Life-savings insurance + AuM(1), €Bn CABK
+140%
Int’l & Investments Activity and resultsAt a glance Competitive stance Strategy Appendix

38
Loan-book breakdown(1), gross figures in €Bn
31st Dec. % ytd % qoq
I. Loans to individuals 128.5 8.6% (0.5%)
Residential mortgages 94.2 9.0% (1.1%)
Other loans to individuals(2) 34.3 7.5% 1.2%
o/w: CABK consumer loans(3) 9.9 22.4% 3.0%
II. Loans to businesses 83.5 12.7% 0.5%
Corporates and SMEs 76.2 17.5% 1.9%
Real Estate developers 7.1 (11.5%) (11.6%)
Criteria Caixa 0.2 (85.2%) (28.7%)
Loans to individuals & businesses 212.0 10.2% (0.1%)
III. Public sector 12.0 (4.0%) (7.7%)
Total loans 224.0 9.3% (0.5%)
Performing loans 210.2 10.3% (0.1%)
% ytd % qoq
(2.0%) (0.6%)
(3.8%) (1.2%)
3.1% 1.0%
22.4% 3.0%
0.5% 1.0%
4.0% 2.2%
(14.6%) (8.4%)
(85.2%) (28.7%)
(1.0%) (0.0%)
(15.6%) (7.9%)
(1.9%) (0.4%)
(1.2%) (0.1%)
177.0 177.7
Dec-16 Mortgages Other-indiv. Businesses Dec-17
(3.3) +0.8 +3.2
+ 0.4%
Continued growth in consumer lending and loansto non-RE businesses…
…offsets RE developer and mortgage deleveraging(seasonally-high in 4Q) and leads to stableperforming loan book
Improved quality of the portfolio with continueddecline in NPLs
Avoiding price competition: back-book loan yield stable qoq
(1) BPI Vida, acquired by VidaCaixa in December 2017, holds €784M in gross loans as of 31 December 2017 that have been kept within the BPI perimeter to facilitate analysis of organic trends in the quarter(2) “Other loans to individuals” includes consumer lending and other credit to individuals(3) Loans to individuals with personal guarantee, excluding those for home purchases. Includes personal loans from CaixaBank, MicroBank and CaixaBank Consumer Finance as well as credit cards
(CaixaBank Payments) except for float.
Commercial activity
Selective loan-book growth with strict defence of credit spreads
Key CABK trends+10.3%Performing, ytdPerforming loans
€210.2 BnGroup
CABK performing loans ex CRI and public sector
Int’l & Investments Activity and resultsAt a glance Competitive stance Strategy Appendix

39
Loan production continues to expand in higher-yielding segments
Positive loan production dynamics…
Commercial activity
(1) Including loans and credit facilities(2) Market share in businesses (corporates and SMEs) in Spain; source: Bank of Spain
…reflect franchise strength and focused value-proposition
New lending growth (CABK), % FY17/FY16
New consumer lending (CABK), €Bn
Consumer lending
6.6
7.7
FY17FY16
+15%
► Capturing a greater share of the value chain in consumer products
Strategic alliances and commercial agreements at the point-of-sale
New consumer lending (CABK) FY2017, breakdown in %
22%Consumer finance
Credit cards 28%
Personal loans 50%+42% CAGR 2014-17
+22% CAGR 2014-17
+23% CAGR 2014-17
€7.7Bn
450,000
258,000 8,350
TV & cell phones in 2017 at 0%
Autos commercialised
at the branch in 2017
Cell phones financed in 2017
SMEs
New lending to SMEs(1), €Bn
New lending growth (CABK), % FY17/FY16
10.4
12.2
FY17FY16
+16%
► Materialising our potential in business lending: specialisation and quality of service
Market share(2), %
14.1%
15.0%
Dec-16 Nov-17
1,240Specialised managers
116Specialised branches
New segmentsInnovative tools
10 years
+81 bps yoy
Int’l & Investments Activity and resultsAt a glance Competitive stance Strategy Appendix

40
2017 net income growth underpinned by higher core revenues and lower credit costs
Group(1) CABK
FY2017 FY2016 % yoy % yoy
Net interest income 4,746 4,157 14.2 5.1
Net fees and commissions 2,499 2,090 19.5 6.3
Income and exp. from insurance(2) 472 311 51.9 51.9
Other revenues 505 1,269 (60.2) (69.4)
Gross income 8,222 7,827 5.1 (4.8)
Total expenses (4,577) (4,116) 11.2 (1.9)
Pre-impairment income 3,645 3,711 (1.8) (8.0)
LLPs, other provisions, gains/losses on asset disposals & other
(1,547) (2,173) (28.8) (27.5)
Pre-tax income 2,098 1,538 36.4 19.5
Income tax, minority interest & others (414) (491) (15.7) (32.8)
Profit attributable to the Group 1,684 1,047 60.9 44.1
Consolidated Income Statement
In €M
(1) BPI consolidates from 1st February 2017(2) Recovery of reinsurance flows in 4Q 2016 after expiry of the value-in-force (VIF) contract with Berkshire Hathaway boosts yoy growth(3) In 4Q17, core revenues include equity-income from BPI bancassurance stakes
Financial results
Higher-quality revenues: % core vs gross income at 96% (85% FY16)
Large restructuring effort at CABK and BPI (€561M restructuring charges)
Significantly lower losses below-the-line (c. -30% yoy)
Net income grows 61% with RoTE up 2.8 pp yoy to 8.4%
Core revenues, as % of Group revenues
85% 96%
FY 2016 FY 2017
Higher quality revenue growth reflects successful model
6,6346,530 6,576
6,683
6,970
7,350
7,641
7,887
6,858
7,0667,178 7,219
1Q16 2Q16 3Q16 4Q16 1Q17 2Q17 3Q17 4Q17
Group
CABK
Core revenues(3), trailing 12M in €M
+8%
+18%
Int’l & Investments Activity and resultsAt a glance Competitive stance Strategy Appendix

41
Bancassurance core revenue growth offsets lower trading gains
CABK bancassurance RoTE at 11.2% as core revenues more than offset decline in trading income
(1) Non-core RE segment primarily includes non-core lending to RE developers and foreclosed RE assets (OREO and rental property)(2) Ex annex IX impact in FY2016(3) Excluding the impact of BPI reclass and BEA/GFI disposal(4) Core revenues include: NII + Fees + other revenues from insurance (life-risk premia and equity accounted income from SegurCaixa Adeslas). In 4Q17, core revenues include equity-income from BPI
bancassurance stakes (5) RoTE exc. extraordinary items +€256M net business combination result from BPI, -€212M early retirement programmes of 2Q17 and -€3M of extraordinary costs; all after tax. Note that RoTE includes
the coupon of AT1 accrued in the year (-€22M post-tax)
Financial results
Group P&L by segment
7,636 7,711
540 (465)
FY16 Core revenues Non-corerevenues
FY17
Non-banking businesses are key contributors to earnings
Gross income from CABK-bancassurance segment reporting, €M
Contributing 6.6 pp to CABK bancassurance RoTE(5) 11.2% (+0.4pp yoy)
+1%
FY17/FY16, %
13.0%(2) (9.9%) 60.9%n/a(41.5%)(2)
Profit attributable to the Group FY2017, breakdown by segment in €M
1,748
1,684173(413)
176
Bancassurance Investments Non-core RE BPI CaixaBank Group(1)
CaixaBank: €1,508 M (+ 44.1% yoy)
Bancassurance RoTE(5) at 11.2% despite lower trading gains
Investments grow 24.2% yoy like for like(3)
Non-core RE losses significantly reduced: -41.5% yoy(2)
BPI contribution partially offset by BFA one-off charges in 4Q
Net income from CABK-bancassurance segment reporting, €M
Insurance & AM 42%
Payments 17%
Consumer Finance
BankingBusiness
36%5%
(4)
+24.2% vs. FY16 like-for-like(3)
Int’l & Investments Activity and resultsAt a glance Competitive stance Strategy Appendix

42
NII + Fees
Recurrent expenses
+3.1% yoyCore operatingincome
+16.7% yoy
Client funds Mutual fundsCredit to businesses(4)
+5.6% ytd +12.7% ytd +6.4% ytd
-5.3% yoy
Domestic recurrent BPI segment contributes €169M in a year marked by the integration into CABK Group
Strong core operating performance continues in 4Q
In 2017, BFA did not contribute to CABK net attributable income: -€91M in January and €67M in Feb-Dec
FY17, as reported by BPI
…supporting Group recurrent earnings
Significant BPI contribution after 11 months from integration
4Q results reflect positive operating trends…
Financial results
(1) BPI consolidates for 11 months, since February 1st 2017(2) BFA contribution to equity accounted income in 4Q includes -€119M one-off impact of which -€76M corresponds to the estimated impact from applying inflationary accounting (according to IAS 29). Net
attributable income from BFA in 4Q (post tax and minorities) amounts to -€52M (3) Excluding both BFA and BCI contribution to equity accounted income in Feb-Dec 2017 (€88M and €7M respectively) and extraordinary operating expenses in the period (-€106M), all gross figures, as well
as the impact on taxes and minority interests(4) In Portugal (5) For a total of €168M when also including cost of restructuring programs in 2016 and Jan 2017 (6) Considering the reduction in revenues derived from the sale to CaixaBank in December 2017 of BPI Vida and other BPI subsidiaries
in €M (Feb-Dec 2017)FY17(1) 4Q17
Net interest income 377 108
Net fees and commissions 276 82
Other income(2) 117 (68)
Gross income 770 122
Recurring expenses (432) (114)
Extraordinary operating expenses (106)
Pre-impairment income 232 8
Impairment losses & other provisions 29 6
Gains/losses on asset disposals & others (1) (1)
Pre-tax income 260 13
Income tax, minority interests and other (84) (17)
Net attributable profit 176 (4)
Segment P&LDomestic recurrentFeb-Dec 17(1)(3)
Meeting synergy targets post-integration
Upfront restructuring costs
€106M 2020+Targets
> 10%
50%Recurrent RoTE(6)
< initial estimate (€250M)
Synergy target accomplished
Annual gross synergies 2020+
€122MRecurrent C/IFeb-Dec 2017(5)
377
276
22
675
(432)
243
29
(1)
271
(102)
169
FY17 domestic recurrent(3)
€169M
Int’l & Investments Activity and resultsAt a glance Competitive stance Strategy Appendix

43
Group
Consolidated income statement, €M Q4 2017 % yoy(1) % qoq
Net interest income 1,196 11.1 (0.4)
Net fees and commissions 632 16.0 2.6
Income from investments & associates 39 (85.8) (82.5)
Trading income (5)
Income and exp. from insurance(3) 118 21.1 (3.1)
Other operating income & exp. (249) 4.3
Gross income 1,731 (8.3) (21.7)
Recurring expenses (1,124) 12.7 (0.2)
Extraordinary operating expenses (1) (60.6)
Pre-impairment income 606 (32.0) (44.0)
Loan impairment losses (141) (136.9) (24.7)
Other provisions (112) (59.1)
Gains/losses on asset disposals & other (117) (84.9)
Pre-tax income 236 5.2 (72.4)
Income tax (42) (72.1) (77.6)
Profit for the period 194 160.3 (71.0)
Minority interests & other 2 (33.0)
Profit attributable to the Group 196 154.9 (69.8)
Q4 net income reflects solid operating trends in a seasonal quarter
(1) BPI consolidates from 1st February 2017(2) Where comparable, i.e. associates and sub-totals not comparable yoy(3) Recovery of reinsurance flows in 4Q 2016 after expiry of the value-in-force (VIF) contract with Berkshire Hathaway boosts yoy growth(4) Estimated impact from applying (according to IAS 29) the inflationary effects in Angola to the financial statements of BFA(5) Post 10% tax and 15.5% minority interests
Financial results
CABK
% yoy(2) % qoq
1.1 (1.0)
1.0 2.2
(29.6)
21.1 (3.1)
3.8
(17.6)
1.3 0.3
(60.6)
(36.6)
(26.7)
(59.6)
(85.0)
(68.3)
(85.7) (86.3)
(63.1)
160.9 (63.2)
+155%yoy4Q17 Net income
€196 MGroup
Resilience of NII and fees
Insurance remains a powerhouse of growth
Recurrent costs flat in the quarter and in line with guidance for the year
Steep reduction in loan-loss provisions reduces annual CoR to 39 bps as guided for
Other provisions include conservative provisioning for legal contingencies in 4Q yet down 59.6% yoy
Group earnings impacted by one-off charges concerning BFA
One-off Impacts at CABK Group, in €M 4Q17
IAS29 accounting is mostly neutral on equity
Key CABK trends
Income from associates -119
Net attributable impact(5) -90
Inflationary accounting (IAS 29)(4)
Other-76-43
Int’l & Investments Activity and resultsAt a glance Competitive stance Strategy Appendix

44
NII broadly stable in the quarter
Financial results
(1) 1Q17 includes 2 months of BPI and impact of FV adjustments. In 2Q-3Q-4Q, BPI contributes a full quarter, also impacted by FV adjustments
NII growth at CABK aligned with upgraded mid-single digit guidance
BPI contribution (11 months) boosts 2017 NII
NII grows 5.1% in the first full year with Euribor 12M in negative territory
Improvement yoy as funding repricing offsets negative Euribor resets and lower ALCO re-pricing on stable average volumes
Evolution qoq mostly reflects:
Lower ALCO yields and average loan volumes
Partly offset by lower retail and wholesale funding costs
NII(1), in €M
4,157 4,369
377
FY16 FY17
1,077 1,084 1,098 1,099 1,088
69 98 102 108
4Q16 1Q17 2Q17 3Q17 4Q17
1,153 1,196 1,1961,201
-0.4%Group
CABKBPI
4,746
1,077
1,0991,088
+27
(9) +4 +7 (6)(12)
4Q16 3Q17 4Q17
Key CABK trends
NII bridge, in €M
Client yields
Client volumes
Wholesale funding, ALCO & other
-1.0%
Client yields
Client volumes
Wholesale funding, ALCO & other
CABK
+1.1%CABK
+11.1%Group
+5.1%CABK
+14.2%Group
Int’l & Investments Activity and resultsAt a glance Competitive stance Strategy Appendix

45
Limited potential for re-pricing as back book below front book
Group
Time deposits: back book (bps)
35
14
7 51
4Q16 1Q17 2Q17 3Q17 4Q17
18
7 5 2 00
1 4
1Q16 2Q16 3Q16 4Q16 1Q17 2Q17 3Q17 4Q17
CABK Time deposits: front book, in bps
CABK
2.14 2.19 2.19 2.18 2.19
4Q16 1Q17 2Q17 3Q17 4Q17
0.13 0.06 0.04 0.04 0.03
2.27 2.25 2.23 2.22 2.22
CABK
1.27 1.30 1.30 1.271.21
4Q16 1Q17 2Q17 3Q17 4Q17
NIM, in %
CABK
Customer spread up slightly on lower funding costs and stable loan yields
NIM mostly reflects denominator effect from cash balances
Client funds(2)Loans and credit Customer spread
Group
2.17 2.17 2.15 2.16
1Q17 2Q17 3Q17 4Q17
1.30 1.30 1.27 1.22
1Q17 2Q17 3Q17 4Q17
Customer spread, in %
Group
0.06 0.04 0.04 0.03
2.23 2.21 2.19 2.19
CABK
BB -15bps qoq/-9bps ytd as expensive maturities more than offset impact from new issuances
CABK wholesale funding back-book(1) in €Bn and spread over 6M Euribor in bps, as of 31 Dec. 2017
28.7 27.6 27.5 29.7 29.5
Dec'16 Mar'17 Jun'17 Sep'17 Dec'17
CABK
Volume
CABK issuances in 2017
Spread
135 141 140 141126
(1) Includes securitisations placed with investors and self-retained multi-issuer covered bonds. It does not include the AT1 issued in June 2017.(2) The cost of customer funds reflects the cost of both demand and time deposits, as well as repos with retail clients. Excludes the cost of institutional issuance and subordinated liabilities
Financial results
Liability repricing continues to provide support
1510 9 6
Deposit repricing still helping margins Higher customer spread but lower NIMLower wholesale funding costs
Date Amount Coupon
SNP Sep €1.25Bn 1.125%
Tier 2 July €1Bn 2.75%
AT1 June €1Bn 6.75%
Senior May €1Bn 1.125%
Tier 2 Feb €1Bn 3.50%
Covered bonds Jan €1.5Bn 1.25%
Int’l & Investments Activity and resultsAt a glance Competitive stance Strategy Appendix

46
Structural ALCO volumes decline
(1) 1Q Group asset yields and average balances BPI calculated on 2 months of BPI contribution(2) Banking book fixed-income securities portfolio, excluding trading book assets and liquidity management portfolio. Refer to the appendix for reconciliation with previously disclosed total ALCO series(3) Held-to-maturity securities and debt securities at amortised cost(4) Banking book fixed-income securities portfolio bought for liquidity reasons
Financial results
Conservative liquidity management in anticipation of TLTRO redemption
With stable liquidity portfolioLoan yields and volumes remain stable
Stable duration consistent with prudent risk management
11.5 12.4 13.9 14.6 13.4
2.93.5
3.1 3.12.9
14.316.0 17.0 17.8
16.3
Dec-16 Mar-17 Jun-17 Sep-17 Dec-17
AFS
HTM
Duration, yrs
Average life, yrs
Group structural ALCO portfolio(2), in €Bn
Yield, %
Duration in line with TLTRO maturity
Lower yield reflects management of excess cash balances at current yields
3.1 3.5 2.9 4.6 3.8
6.0 6.0 6.0
9.4 9.4
9.1 9.5 8.9
14.0 13.2
Dec-16 Mar-17 Jun-17 Sep-17 Dec-17
AFS
HTM
Yield, %
Duration, yrs
Average life, yrs
Group ALCO-liquidity management(4) portfolio, in €Bn
(3)
2.3 2.2 2.02.7 2.5
4.6 4.8 4.94.1 4.5
(3)
0.1 0.2 0.20.1 0.1
2.5 3.2 2.92.7 2.6
1.4 2.8
193 193 191 191 190
13 20 20 20
4Q16 1Q17 2Q17 3Q17 4Q17
313 311303
327
301
Average loan balance (net), in €Bn
CABK BPI
Loan-book yields, in bps
FB (ex public sector) Back book
BB yields stable as accretive FB (mix-shift to higher-yielding segments) offsets Euribor resets
206211 210
Group
(1)
(1)
GroupCABK
209
223 221 219 219
1Q17 2Q17 3Q17 4Q17
227 225 223 222 222
4Q16 1Q17 2Q17 3Q17 4Q17
Int’l & Investments Activity and resultsAt a glance Competitive stance Strategy Appendix

47
(1) 1Q17 includes only 2 months of BPI(2) Mutual funds, managed portfolios and pension plans(3) Based on domestic activity data reported by BPI
Financial results
Fees grow on the back of another strong quarter in insurance and AuM
Fees exceed stated target for the year… … on the back of sustained growth in AuM and insurance
CABK Net fee income bridge, in €M
544 550
632
(18) +22+2 +82
4Q16 Banking AuM Insurance 4Q17 BPI 4Q17
Group
Fees benefit from sustained growth in AuM and insurance; aided qoq by positive seasonality in pension plan fees
Asset management (+12.4% yoy) and insurance distribution fees (+3.0% yoy) increase yoy underpinned by higher activity
Negative banking fee evolution mostly reflect lower non-recurrent activity in 2H17
CABK trends 4Q
BPI 4Q
CABK
Banking and other fees
Mutual funds
Pension plans
Insurance distribution fees
Group4Q17
% qoq
(1.8)
5.5
17.6
5.2
Net fees breakdown, €M 4Q % yoy
CABK CABKGroup
(1.8)
6.2
18.2
7.6
363
134
62
73
9.4
23.1
24.4
34.4
(4.7)
9.2
19.2
3.0
Net fee income, in €M
544 545590
538 550
4374
77 82
4Q16 1Q17 2Q17 3Q17 4Q17(1)
588
664615 632
+16.0%Group
+1.0%CABK
+2.6%Group
+2.2%CABK
(2)
CABKBPI
Fees continue to grow (9.3% yoy(3)/5.1% qoq) with strong performance in AuM (47.5% yoy(3)/14.8% qoq)
Int’l & Investments Activity and resultsAt a glance Competitive stance Strategy Appendix

48
Revenues(excluding non-recurrent items(1))
1,850 466 25%
% yoy +3% +17% +3 p.p.
Net interest income 1,148 84 7%
% yoy +2% +27% +1 p.p.
Net fees and commissions 549 235 43%
% yoy +1% +11% +4 p.p.
Income from associates (equity accounted) 35 29 83%
% yoy +6% +12% +4 p.p.
Income and exp. From insurance 118 118 100%
% yoy +22% +22% =
…increasing its contribution to CABK bancassurance earnings
CABK-Bancassurance
Insurance & AuM
as % bancassuran.
CABK-Bancassurance 4Q17, in €M
Non-banking businesses mitigate effect of low rates
% of CABK bancassurance revenues(1)
Growing contribution to revenues
22% 25%
4Q16 4Q17
Double-digit growth yoy in insurance and AM revenues...
Financial results
Insurance and asset-management remain key contributors to bancassurance segment
Revenues from insurance and AM(1), in €M
400466
504
+18+24 +3 +21
+38
4Q16 4Q17 4Q17
Insur.NII
AM+ Insur.Fees
EquityAccount.
Other insur.
Incl. +€10MVIF
BPI
(1) Excludes trading income and other operating income and expenses
+16.5%CABK
336
374393 400
429
492508 504
408
458470 466
1Q16 2Q16 3Q16 4Q16 1Q17 2Q17 3Q17 4Q17
Group
CABK
+26.0%Group
+16.5%CABK
Int’l & Investments Activity and resultsAt a glance Competitive stance Strategy Appendix

49
Financial results
Restructuring and expense control keep costs flat
(1) 1Q17 includes 2 months of BPI(2) Includes €19M cost-savings from actions in 2H16
Group recurrent costs down 0.2% qoq as savings offset inflation
Recurrent costs, in €M
CABKBPI
Important initiatives in 2017 to rationalise costs at CABK/BPI
€455M/€106M restructuring charges
€104M/€36M in annual cost savings
CABK cost-savings beyond strategic target facilitate investments in new revenue opportunities
Recurrent C/I ratio at 54.3%
CABK trends in line with guidance
BPI: 2020 synergy ambition met
CABK
3,995 4,035
FY16 FY17
Personnel
Other
+1.0%
+0.2%
+2.5%
Recurrent costs, in €M
BPI annual synergies (structural), in €M pre-tax
998 1,013 1,004 1,008 1,010
78 121 119 114
4Q16 1Q17 2Q17 3Q17 4Q17
1,091 1,125 1,127
(1)
1,124
+1.3%CABK
+12.7%Group
-0.2%
+0.3%CABK
Group
BPI annual synergies (structural) from initiatives completed or underway, in €M pre-tax
Ambition 2020+
55
22
45
Personnel Other expenses Revenues Total
122 120
(2)
Int’l & Investments Activity and resultsAt a glance Competitive stance Strategy Appendix

50
Core operating income continues to improve
Positive jaws and BPI contribution lift core operating income
(1) Core operating income defined as core revenues minus recurrent costs(2) Core revenues include: NII + Fees + other revenues from insurance (life-risk premia and equity accounted income from SegurCaixa Adeslas). In 4Q17, they also include equity-income from BPI
bancassurance stakes. Core revenues for CABK in 4Q amounted to €1,785M
Financial results
Double digit growth yoy in core operating income… …supported by all core revenue lines and BPI
2,603
2,5182,582
2,688
2,853
3,056
3,1563,184
1Q16 2Q16 3Q16 4Q16 1Q17 2Q17 3Q17 4Q17
CABK core operating income(1) trailing 12M, in €M
Group€3,420 M
CABK
+18.5%
(+27.2% yoy)
746
775
850
+11 +6 +24 (12) +75
4Q16 NII Fees Otherinsurancerevenues
Costs 4Q17 BPI 4Q17
CABK
Group core operating income(1) bridge 4Q yoy, in €M
+3.9%CABK
+13.9%Group
CABK Group
GroupTotal core revenues(2) 4Q17
€1,974 M(+13.2% yoy)
Int’l & Investments Activity and resultsAt a glance Competitive stance Strategy Appendix
51
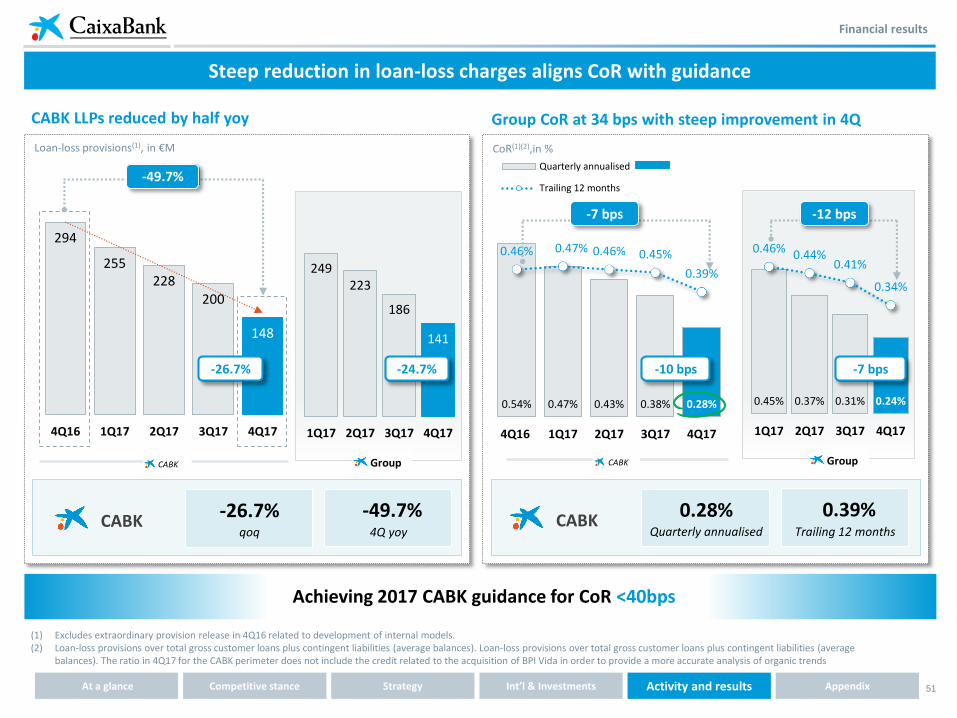
Financial results
(1) Excludes extraordinary provision release in 4Q16 related to development of internal models. (2) Loan-loss provisions over total gross customer loans plus contingent liabilities (average balances). Loan-loss provisions over total gross customer loans plus contingent liabilities (average
balances). The ratio in 4Q17 for the CABK perimeter does not include the credit related to the acquisition of BPI Vida in order to provide a more accurate analysis of organic trends
Steep reduction in loan-loss charges aligns CoR with guidance
CABK LLPs reduced by half yoy
Achieving 2017 CABK guidance for CoR <40bps
Group CoR at 34 bps with steep improvement in 4Q
0.54% 0.47% 0.43% 0.38% 0.28%
0.46% 0.47% 0.46% 0.45%
0.39%
4Q16 1Q17 2Q17 3Q17 4Q17
Loan-loss provisions(1), in €M
CABK Group
294
255228
200
148
4Q16 1Q17 2Q17 3Q17 4Q17
-26.7%
-49.7%
-10 bps
CABK Group
-7 bps -12 bps
0.39%Trailing 12 months
CABK CABK
249223
186
141
1Q17 2Q17 3Q17 4Q17
-24.7%
0.28%Quarterly annualised
-49.7%4Q yoy
-26.7%qoq
CoR(1)(2),in %
0.45% 0.37% 0.31% 0.24%
0.46% 0.44%0.41%
0.34%
1Q17 2Q17 3Q17 4Q17
Quarterly annualised
Trailing 12 months
-7 bps
Int’l & Investments Activity and resultsAt a glance Competitive stance Strategy Appendix

52
Financial results
RE disposal capital gains offset RE provisioning
RE disposal result (net of provisions) for FY17 at €6M in line with guidance
(1) Gains/losses on asset disposals and others in BPI are insignificant
Record capital gains from higher OREO sales
€M 4Q17 FY17 FY16
Results from RE sales 108 248 72
Other RE gains/losses (149) (242) (1,106)
Net RE result (41) 6 (1,034)
Other non-RE related (75) 159 (70)
Gains/losses on asset disposals and others
(116) 165 (1,104)
Yielding a positive net RE result in 2017
72
248
FY16 FY17
RE capital gains (CABK), as % of net book value
14%15% 15%
21%
27%
4Q16 1Q17 2Q17 3Q17 4Q17
Strong decline in 2017 RE impairments with 4Q conservative provisioning to accelerate future disposals
1,106
242
FY16 FY17
833
10 28 55149
4Q16 1Q17 2Q17 3Q17 4Q17
Other RE losses (CABK), in €M
OREO sales €1.6Bn+20% yoy
RE capital gains (CABK), €M
x 3
Gains/losses on asset disposals and other (CABK), breakdown in €M(1)
“Other non-RE related” in 4Q reflects one-
off related to impairment for obsolete
assets
-78%
Int’l & Investments Activity and resultsAt a glance Competitive stance Strategy Appendix

53
Asset quality
(1) CABK OREO portfolio net of provisions and non-performing RE developer loans net of specific provisions. BPI OREO portfolio net of provisions amounts to €53M as of 31 December 2017
Higher OREO sales and falling inflows drive RE NPA decline
Good RE fundamentals and solid coverage support OREO decline
Reduced non-performing RE exposure with stable coverageDouble-digit increase in OREO sales …
CABK non-performing RE exposure(1), in €Bn, net of provisions
6.3 6.3 6.3 6.1 5.9
1.4 1.3 1.1 1.10.9
7.7 7.6 7.4 7.26.9
4Q16 1Q17 2Q17 3Q17 4Q17
OREO portfolio
RE developers NPLs
OREO book coverage ratio, % 58%
Coverage w/ accounting provisions only 50%
-12.0%
- 6.1%
-6.0%
CABK1,199
831
FY16 FY17
… with inflows on a declining trend
Inflows (net of provisions) to OREO portfolio, in €M (CABK)
-34.2%
CABK
-30.8%
292324
270
313
239
245
141
206
1Q 2Q 3Q 4Q 1Q 2Q 3Q 4Q
2016 2017
1,3371,610
FY16 FY17
OREO sales, in €M (CABK)
CABK
277
333
269
458
296
373
380
561
1Q 2Q 3Q 4Q 1Q 2Q 3Q 4Q
+22.5%
2016 2017
+20.4%
Int’l & Investments Activity and resultsAt a glance Competitive stance Strategy Appendix

54
Asset quality
NPL decline accelerates
(1) Including non-performing contingent liabilities (€508M in 4Q17, including BPI)(2) NPL ratio is the ratio of NPLs to total gross customer loans and contingent liabilities as of the end of the period(3) Calculations factoring in the credit of BPI Vida under the BPI perimeter to provide a more accurate analysis of organic performance(4) NPAs include NPLs, non performing contingent liabilities and OREO (all gross of provisions)
NPL coverage ratio to increase 5 p.p. with IFRS 9 NPLs down 45% since 2Q13 peak of €26Bn
NPL coverage in %
NPLs -11.3% ytd/-6.0% qoq aided by portfolio sales (€440M) in 4Q
NPL ratio(3) at 6.1%, down 72bps ytd/42bps qoq on lower NPL stock and relatively stable loan book
NPAs(4) down 9.3% ytd with stable coverage at 53%
BPI contributes €1.2Bn NPLs to Group
Group NPL ratio down to 6.0% (-43 bps qoq)
Group NPL coverage stable at 50% and 55% pro-forma for IFRS9
CABK: Group:
Group
CABK
BPI
CABK NPL breakdown by collateral, 31 December 2017
4Q17
CABK
Collateralised
66.5%
Uncollateralised
33.5%
Coverage
74.8%
Coverage including appraised
collateral
107.5%
14.8 14.614.1 13.9
13.1
1.51.4 1.4
1.2
4Q16 1Q17 2Q17 3Q17 4Q17
-6.0%CABK
16.115.3
15.5
3Q17 4Q17
14.3
-6.4%Group
50%
47%
80%
50%
46%
87%
55%
52%
4Q17 – PF IFRS9
87%
-11.3%CABK
CABKBPI
Group6.9%
6.7%
6.5% 6.4%
6.0%
NPL stock(1) in €Bn and NPL ratio(2) in %
Int’l & Investments Activity and resultsAt a glance Competitive stance Strategy Appendix

55
20.3 20.2
22.5
25.9 25.7 25.4
24.0
22.6
21.4
20.1
21.6
20.119.2
17.116.4 16.1
15.2 14.8
16.115.5 15.3
14.3
3Q12 3Q13 3Q14 3Q15 3Q16 3Q17
Net non-performing RE assets(2)NPL stock on a steady downward trend
Asset quality
Significant NPA reduction since peak in 2013
NPL stock(1), in €Bn
Refin. loans
4.4 5.1
5.8 6.2 6.3 6.2 6.4 6.7 7.0 6.9 7.0 7.0 7.1 7.3 7.2 7.1 7.1 6.3 6.3 6.3 6.1 5.9
7.87.3
7.0 6.6 6.1
5.3 5.0 4.5 4.13.5 3.2 2.8 2.6 2.1 2.0 1.9
1.5
1.4 1.3 1.1 1.10.9
12.112.4
12.8 12.812.5
11.4 11.4 11.2 11.0
10.410.2
9.8 9.79.4
9.2 9.08.6
7.7 7.6 7.4 7.26.9
3Q12 3Q13 3Q14 3Q15 3Q16 3Q17
OREO portfolio
RE developers NPLs
In €Bn, net of provisions
(1) Including non-performing contingent liabilities(2) OREO portfolio and RE developer non-performing loans, both net of provisions. In 4Q13, detailed portfolio review resulting in: 1) Reclassification from substandard to NPLs; 2) Assignment of
remaining RE developer generic provision (€1.9 Bn at Q3) o/w €310M allocated to foreclosed assets; 3) €1.7 Bn loan reclassification to non-RE
Peak (2Q13)
-46%
Peak (1Q13)-45%
Int’l & Investments Activity and resultsAt a glance Competitive stance Strategy Appendix
CABKGroup
4Q12 4Q13 4Q14 4Q15 4Q16 4Q17 4Q12 4Q13 4Q14 4Q15 4Q16 4Q17

56
Initial application of IFRS 9 in line with stated guidance
NPL provision and coverage Reserves and solvency
+€758MNPL provisions
+5 ppGroup NPL coverage ratio
-15 bps(1)CET1 FL ratio
Reserves -€564MImpact Dec-17 PF
CET1 FL YE17 pro forma IFRS9 at 11.5%
NPL coverage ratio YE17PF IFRS9 at 55%
Transitional period will not be applied
Estimates as of 31 December 2017 Estimates as of 31 December 2017
(1) Including -38 bps from impact on reserves and +23 bps in other impacts to CET1, mainly the release of the deduction for IRB provision deficit
IFRS 9
Int’l & Investments Activity and resultsAt a glance Competitive stance Strategy Appendix

57
Liquidity
(1) High quality liquid assets(2) Including €2Bn from BPI. All TLTRO 2 except for €637 M TLTRO 1 from BPI
Liquidity position remained stable in 4Q
Liquid assets
€73 BnGroup
+44% ytdLiquid assets
€64 Bn +27% ytd
49
644
1595
HQLA Other assets eligible asECB collateral
Liquid assets
73
Total liquid assets (Group), as of 31 Dec-2017 in €Bn
202%LCR
Other liquidity metrics, as of 31 December 2017
TLTRO(2)
13 14 12 13 15
37 3346
49 49
50 47
5863 64
Dec-16 Mar-17 Jun-17 Sep-17 Dec-17
Total liquid assets (CABK), in €Bn
19
HQLAs (1)
Other assets eligible as ECB collateral
€28.8 Bn
54
CABK
BPI
LCR
Taking advantage of market conditions to pre-fund TLTRO redemption
Issued in January 2018
160% 207%
€1Bn @ SPGB -48 bps
LTD 108%€2.4 Bn
€0.375Bn @ SPGB - 48 bps
€1.0Bn @ SPGB + 37 bps
10yr CoveredBond
15yr CoveredBond
5yr Senior Preferred
(1)
Int’l & Investments Activity and resultsAt a glance Competitive stance Strategy Appendix

58
SREP for 2018 (8.063% CET1 phase-in(2); 8.75% CET1 FL) reaffirms solvency strength
Organic capital generation mainly offset by negative TEF performance in 4Q
2017 first year for full cash dividend payment since listing with cash interim dividend of 0.07€ p.s. paid in November.
Solvency
SREP showcases high solvency metrics
(1) CABK CET1 phase in ratio on a solo basis as of 31 December 2017 is 13.6%. BPI CET1 phase-in ratio as of 31 December 2017 is 13.2% (12.4% on a solo basis)(2) Including the Capital Conservation buffer (1.875%) and the O-SII buffer (0.187%). The O-SII and capital conservation buffer considers a linear implementation period of four years starting on 1 January
2016 and should reach 0.25% and 2.5% respectively in 2019
CET1 FL ratio evolution
CABK Group, in %, ytd
Capital ratios
CABK Group(1), in % as of 31 December 2017
RWAs 134.4
CET1 16.6 17.4
149.4
17.3
148.6
12.4%
11.7% 11.7%
(108 bps)
+34 bps +10 bps (10 bps)
Dec-16 Sep-17 Dec-17
BPI acquisition
9M17
Organic capital
generationVal. Adj. & other
In €BnGroup
Phase-in Fully loaded
12.7% 11.7%
12.8% 12.3%
16.1% 15.7%
17.2% 16.8%
5.5% 5.3%
CET1
Total Capital
Leverage ratio
Tier 1
T. Capital + SNPMREL-subordinated instruments
Int’l & Investments Activity and resultsAt a glance Competitive stance Strategy Appendix
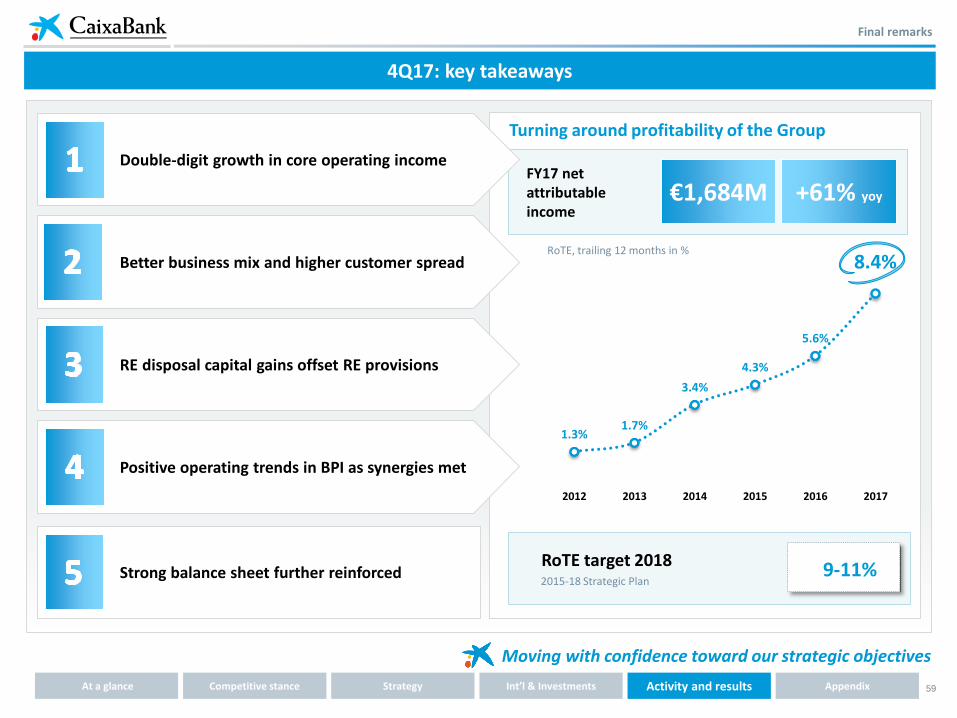
59
FY17 net attributable income
RoTE target 2018
€1,684M
Turning around profitability of the Group
9-11%
RoTE, trailing 12 months in %
4Q17: key takeaways
Final remarks
Moving with confidence toward our strategic objectives
Better business mix and higher customer spread
RE disposal capital gains offset RE provisions
Positive operating trends in BPI as synergies met
Double-digit growth in core operating income
Strong balance sheet further reinforced
1.3%1.7%
3.4%
4.3%
5.6%
8.4%
2012 2013 2014 2015 2016 2017
2015-18 Strategic Plan
+61% yoy
Int’l & Investments Activity and resultsAt a glance Competitive stance Strategy Appendix

60
2018 Guidance for CaixaBank Group
Main drivers
NII
Core revenues
Cost of Risk
Fees
4%
< 30 bps
Price discipline in both loans and deposits
Stable loan balances on higher-yielding mix
Accretive FB yield
Euribor resets expected to trough during the year
Growth across all core revenue lines
Better macro outlook
High level of NPL recognition and coverage
Visibility of IFRS9 impacts
2018 Guidance for Group: % yoy
Recurrent costs
CABK wages to grow (collective bargaining agreement(1))
1 additional month of BPI costs
Regulation, technology and other growth opportunities
2-3%
3%
3-4% Growth in insurance and managed funds
Broadly stable core banking fees
UPCOMING INVESTOR DAY: 4Q 2018 (1) Salary increase of 1.75%
Strategy update
Int’l & Investments Activity and resultsAt a glance Competitive stance Strategy Appendix

61
[Appendix]

62
Consolidated Income Statement: BPI consolidates fully from 1st February 2017 (11 months)
Consolidated Income Statement
CABK Group CABK
in €MFY2017 FY2016 % yoy FY2017 % yoy
Net interest income 4,746 4,157 14.2 4,369 5.1
Net fees and commissions 2,499 2,090 19.5 2,223 6.3
Income from investments & associates 653 828 (21.0) 541 (34.5)
Trading income 282 848 (66.7) 259 (69.5)
Income and exp. from insurance 472 311 51.9 472 51.9
Other operating income & exp. (430) (407) 5.6 (412) 1.1
Gross income 8,222 7,827 5.1 7,452 (4.8)
Recurring expenses (4,467) (3,995) 11.8 (4,035) 1.0
Extraordinary expenses (110) (121) (8.7) (4) (96.7)
Pre-impairment income 3,645 3,711 (1.8) 3,413 (8.0)
Loan impairment losses (799) (314) 154.2 (831) 164.4
Other provisions (912) (755) 20.8 (909) 20.4
Gains/losses on asset disposals & others 164 (1,104) - 165 -
Pre-tax income 2,098 1,538 36.4 1,838 19.5
Income tax (378) (482) (21.7) (324) (32.8)
Profit for the period 1,720 1,056 62.9 1,514 43.4
Minority interests & other 36 9 277.8 6 (32.7)
Profit attributable to the Group 1,684 1,047 60.9 1,508 44.1
Appendix
Int’l & Investments Activity and resultsAt a glance Competitive stance Strategy Appendix

63
Reconciliation between BPI reported P&L and BPI Segment contribution to the Group
P&L in €M
FY17 reported by BPI
Consolidation adjustments(1)
BPI segment (Feb-Dec)
Net interest income 407 (30) 377
Dividends 7 7
Income from investments & associates accounted for using the equity method 125 (20) 105
Net fees and commissions 297 (21) 276
Trading income 14 9 23
Other operating income & expenses (186) 168 (18)
Gross income 664 106 770
Operating expenses (456) 24 (432)
Extraordinary operating expenses (107) 1 (106)
Pre-impairment income 101 131 232
Pre-impairment income without extraordinary expenses 208 130 338
Impairment losses 5 27 32
Other provisions (3) (3)
Gains/losses on asset disposals & others (1) (1)
Pre-tax income 106 154 260
Income tax (96) 42 (54)
Income from investments & associates
Profit for the period 10 196 206
Minority interests & other (30) (30)
Profit attributable to the Group 10 166 176
(1) Including the reversal of January P&L, the reversal of fair value adjustments in the business combination and attribution of profits to minority interests
Appendix
Int’l & Investments Activity and resultsAt a glance Competitive stance Strategy Appendix
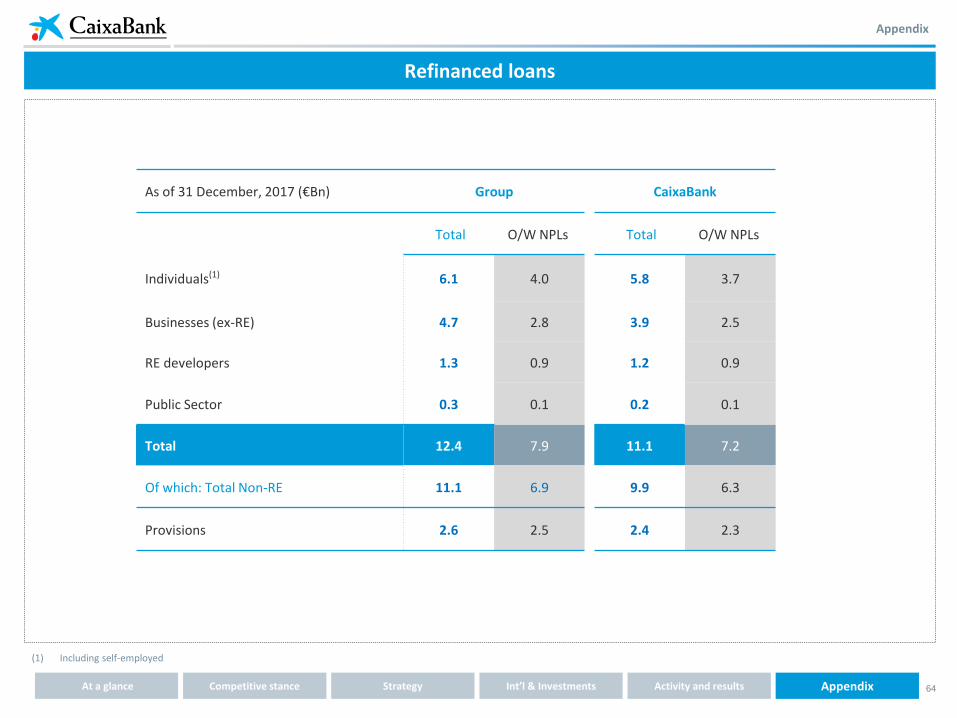
64
Refinanced loans
Appendix
(1) Including self-employed
As of 31 December, 2017 (€Bn) Group CaixaBank
Total O/W NPLs Total O/W NPLs
Individuals(1) 6.1 4.0 5.8 3.7
Businesses (ex-RE) 4.7 2.8 3.9 2.5
RE developers 1.3 0.9 1.2 0.9
Public Sector 0.3 0.1 0.2 0.1
Total 12.4 7.9 11.1 7.2
Of which: Total Non-RE 11.1 6.9 9.9 6.3
Provisions 2.6 2.5 2.4 2.3
Int’l & Investments Activity and resultsAt a glance Competitive stance Strategy Appendix

65
Appendix
Credit Ratings
(1) As of 10th May 2017(2) As of 6th April 2018(3) As of 6th February 2018(4) As of 15th March 2018(5) As of 18th June 2015(6) As of 27th March 2018(7) As of 17th January 2018
Baa2
BBB+
BBB
P-2
A-2
F2
stable
positive
Long term Short term Outlook
stable
A (low) R-1 (low) stable
(2)
(1)
(3)
(4)
AA (high)
Rating of covered bond program
Aa2
AA-
-
(6)
(5)
(7)
Int’l & Investments Activity and resultsAt a glance Competitive stance Strategy Appendix

66
Total ALCO book
Total ALCO(1) (structural(2) + liquidity(3) portfolios), in €Bn
18.515.0 13.1 14.3 16.0 17.0 17.8 16.3
4.15.6 7.0
9.19.5 8.9
14.013.2
22.620.6 20.1
23.425.4 25.9
31.729.5
Mar-16 Jun-16 Sep-16 Dec-16 Mar-17 Jun-17 Sep-17 Dec-17
Structural Liquidity
Yield, %
Duration, yrs
New purchases partly swapped into floating 2.1
Average life, yrs
v2.5 2.1 2.0 1.7 1.51.6 1.21.3
v3.4 3.1 2.5 3.6 3.93.8 4.04.1
GroupCABK
Appendix
(1) Banking book fixed-income securities portfolio and liquidity management portfolio, excluding trading book assets. The series from Mar-2016 has been restated to include the liquidity management portfolio of CaixaBank and BPI (€3 Bn as of 31 December 2017 for BPI) previously excluded from the reported ALCO portfolio.
(2) Banking book fixed-income securities portfolio, excluding trading book assets and liquidity management portfolio(3) Banking book fixed-income securities portfolio bought for liquidity reasons. Includes liquidity management portfolio of €3 Bn for the Group (all from BPI), as of 31 December 2017 (See note 1)
Int’l & Investments Activity and resultsAt a glance Competitive stance Strategy Appendix

67
Wholesale funding maturities
Maturities in € billion(1) as of December 31st 2017
Appendix
(1) Excludes self-retained bonds. Wholesale funding figures in the Annual Financial Report reflect the Group’s funding needs and as such do not include ABS securities and self-retained multi-issuer covered bonds, unlike this Figure, which depicts the impact of wholesale issuances in funding costs
5.1
2.4
1.7
2.9
2018 2019 2020 2021
Spread over 6M Euribor in bps, as of December 31st 2017
173 37 145 124
Int’l & Investments Activity and resultsAt a glance Competitive stance Strategy Appendix

68
(1) Since February 6th 2017, following the sale by CriteriaCaixa of a packet of shares representing c.5.3% of CaixaBank’s capital which reduced the stake of CriteriaCaixa in CaixaBank from 45% to 40%(2) Latest figures reported by CriteriaCaixa. “Other” include, among others, stakes in Aigües de Barcelona, 100% of Caixa Capital Risc and RE business(3) The acceptance period for the tender offer for Banco BPI finalized on February 7th 2017(4) Main non-controlled stakes of CABK. BPI’s main non-control stakes include: 48.10% of BFA and 35.67% of BCI; the ownership attributed to CaixaBank Group at 31 December 2017 is 40.65% of BFA
and 30.15% of BCI
40%(1)
Other Investments(2)
Other (2)
(24.44%)
(18.44%)
(5.86%)
(50.1%)
(20.0%)
Non-controlled stakes(4)
Welfare program
In June 2014, “la Caixa” became a banking foundationand in October 2014 the legal reorganisation of the Group was completed after segregating assets and liabilities to CriteriaCaixa, including its stake
in CaixaBank.
1
3
2
3
A streamlined organisation of “la Caixa” Group
(5.94%)
(9.10%) (17.44%)
100%2
1
(9.64%) (5.00%)(9.92%)
Financial subsidiaries
100%
100%
100%
49%
CaixaBank AM
VidaCaixa Group (Insurance) 100%
CaixaBank Payments (Credit Cards)
CaixaBank Consumer Finance
Comercia Global Payments (PoS payments)
RE activitiesBuilding Center (100%); ServihabitatServ. Inm. (49%)
Group structure
BPI (84.51%)
Post tender offer(3), increased stake from 45.5% to 84.5%
Int’l & Investments Activity and resultsAt a glance Competitive stance Strategy Appendix
Appendix

69
Appendix - Shareholder base and corporate governance
Transparency, independence and good governance are key priorities
Increased free float with diversified investor base
(1) The book of registered shares has an excess of approximately 67M shares which are allocated to the institutional category(2) Percentage calculated on the institutional free float identified at the Shareholder identification elaborated by CMi2i(3) One executive director is appointed by “la Caixa” Banking Foundation and, as such, is both executive and proprietary. One executive director is pending for approval by the ECB(4) Including 1 director from Banking Foundation of Caja Navarra, Banking Foundation of Cajasol, Banking Foundation of Caja Canarias and Banking Foundation of Caja de Burgos and 1 director from
Mutua Madrileña. The total number of proprietary directors including the executive director appointed by “la Caixa” Banking Foundation is 8(5) On the 22nd of June 2017, the Board of Directors appointed its Lead Independent Director. On 21st of September 2017, the Board of Directors appointed an independent Director through co-optation
until the next General Meeting
Int’l & Investments Activity and resultsAt a glance Competitive stance Strategy Appendix
Board of Directors composition
30.3% Retail
Free float 54.8%
69.7% Institutional
Shareholder base by group(1), In % of share capital as of 31st of December 2017
America 38%
UK/Ireland 25%
Spain 5%
Geographical distribution of institutional investors(2)
% of total shares owned by institutional investors, Dec-2017
Rest of Europe 23%
Number of shareholders, in thousands
Control and management of the bank is shared by the AGM, Boardof Directors and Board committees: Audit and control; Executive;Appointments; Remuneration; Risks. The majority shareholder is notoverrepresented in the board
CABK’s relationship with other Group entities is immaterial, performed on an arm’s length basis and governed by the Internal Relations Protocol
Proprietary directors(4) 72 Executive directors(3)
Independent directors(5) 9
45.2% CriteriaCaixa, Board of Directors, treasury stockand other reference shareholders
360605
2007 31 December 2017
RoW 9%

70
Appendix - Financial statements
Balance sheet P&L
Balance sheet and P&L
Int’l & Investments Activity and resultsAt a glance Competitive stance Strategy Appendix
BPI
€ million 2017 2016 Chg. in % 2017 Chg. in % 2017
Net interest income 4.746 4.157 14,2 4.369 5,1 377
Dividend income 127 199 (35,9) 120 (39,2) 7
Share of profit/(loss) of entities accounted for using the equity method 526 629 (16,3) 421 (33,0) 105
Net fee and commission income 2.499 2.090 19,5 2.223 6,3 276
Gains/(losses) on financial assets and liabilities and others 282 848 (66,7) 259 (69,5) 23
Income and expense arising from insurance or reinsurance contracts 472 311 51,9 472 51,9
Other operating income and expense (430) (407) 5,6 (412) 1,1 (18)
Gross income 8.222 7.827 5,1 7.452 (4,8) 770
Recurring administrative expenses, depreciation and amortisation (4.467) (3.995) 11,8 (4.035) 1,0 (432)
Extraordinary expenses (110) (121) (8,7) (4) (96,7) (106)
Pre-impairment income 3.645 3.711 (1,8) 3.413 (8,0) 232
Pre-impairment income stripping out extraordinary expenses 3.755 3.832 (2,0) 3.417 (10,8) 338
Allowance for insolvency risk (799) (314) (831) 32
Other charges to provisions (912) (755) 20,8 (909) 20,4 (3)
Gains/(losses) on disposal of assets and others 164 (1.104) 165 (1)
Profit/(loss) before tax 2.098 1.538 36,4 1.838 19,5 260
Income tax expense (378) (482) (21,7) (324) (32,8) (54)
Profit/(loss) after tax 1.720 1.056 62,9 1.514 43,4 206
Profit/(loss) attributable to minority interest and others 36 9 6 (32,7) 30
Profit/(loss) attributable to the Group 1.684 1.047 60,9 1.508 44,1 176
Group CABK
€ million Dec. 31, 2017 Sep. 30, 2017 Dec. 31, 2016
Cash, cash balances at central banks and other
demand deposits20.155 12.615 13.260
Financial assets held for trading 10.597 11.883 11.668
Available-for-sale financial assets 69.555 71.489 65.077
Loans and receivables 226.272 226.163 207.641
Loans and advances to central banks and credit
institutions7.378 5.950 6.742
Loans and advances to customers 216.318 217.330 200.338
Debt securities 2.576 2.883 561
Held-to-maturity investments 11.085 11.154 8.306
Investments in joint ventures and associates 6.224 6.278 6.421
Tangible assets 6.480 6.509 6.437
Intangible assets 3.805 3.827 3.687
Non-current assets held for sale 6.069 6.283 6.405
Other assets 22.944 22.911 19.025
Total assets 383.186 379.112 347.927
Liabilities 358.503 354.120 324.371
Financial liabilities held for trading 8.605 9.045 10.292
Financial liabilities measured at amortised cost 280.897 276.458 254.093
Deposits from central banks and credit institutions 43.196 39.821 36.345
Customer deposits 203.608 204.048 187.167
Debt securities issued 29.919 29.428 27.708
Memorandum item: Subordinated liabilities 5.054 5.070 4.119
Other financial liabilities 4.174 3.161 2.873
Liabilities under insurance or reinsurance contracts 49.750 49.341 45.804
Provisions 5.001 5.065 4.730
Other liabilities 14.250 14.211 9.452
Equity 24.683 24.992 23.556
Own funds 24.204 24.496 23.400
of which: Profit/(loss) attributable to the Group 1.684 1.488 1.047
Minority interest 434 413 29
Valuation adjustment and other 45 83 127
Total liabilities and equity 383.186 379.112 347.927
Group

71
+34 93 411 75 03
Av. Diagonal, 621-629 - BarcelonaPº Castellana, 51 - Madrid
Investor Relations
Pintor Sorolla, 2-446002 Valencia
www.CaixaBank.com