Embed Size (px)
Citation preview

JRC Scientific and Technical Reports
Scientific, Technical and Economic Committee for Fisheries (STECF)
Evaluation of Fishing Effort Regimes Deep Sea and Western Waters
(STECF-11-12)
Edited by Nick Bailey & Nikolaos Mitrakis
This report was reviewed by the STECF during its 38th plenary meeting held from 07 to 11 November, 2011 in
Brussels, Belgium
EUR 25036 EN - 2011
JRC dpScE U R O P E A N C O M M I S S I O N ± L

The mission of the Institute for the Protection and Security of the Citizen (IPSC) is to provide research results and to support EU policy-m akers in their effort towards global security and towards protection of European citizens from accidents, deliberate attacks, fraud and illegal actions against EU policies
The Scientific, Technical and Economic Committee for Fisheries (STECF) has been established by the European Commission. The STECF is being consulted at regular intervals on matters pertaining to the conservation and m anagement of living aquatic resources, including biological, economic, environmental, social and technical considerations.
European Commission Joint Research CentreInstitute for the Protection and Security of the Citizen
Contact informationAddress: TP 051, 21027 Ispra (VA), Italy E-mail: stecf-secretariat@ jrc.ec.europa.eu Tel.: 0039 0332 789343 Fax: 0039 0332 789658
https://stecf.irc.ec.europa.eu/hom ehttp://ipsc.irc.ec.europa.eu/http://www.irc.ec.europa.eu/
Legal NoticeNeither the European Commission nor any person acting on behalf of the Commission is responsible for the use which might be made of this publication.This report does not necessarily reflect the v iew of the European Commission and in no way anticipates the Com m ission’s future policy in this area.
Europe Direct is a service to help you find answers to your questions about the European Union
Freephone number (*):00 800 6 7 8 9 10 11
(*) Certain mobile te lephone operators do not allow access to 00 800 numbers or these calls _____________________________________ may be billed._____________________________________
A great deal of additional information on the European Union is available on the Internet. It can be accessed through the Europa server http://europa.eu/
JRC67718
EUR 25036 ENISBN 978-92-79-22039-5ISSN 1831-9424 (online)ISSN 1018-5593 (print) doi:10.2788/10803
Luxembourg: Publications Office of the European Union
© European Union, 2011
Reproduction is authorised provided the source is acknowledged
Printed in Italy

TABLE OF CONTENTS
Evaluation of fishing effort regimes Part 3 Deep Sea and Western Waters (STECF-11-11)........... 4
STECF observations.........................................................................................................................................4
STECF conclusions........................................................................................................................................... 5
Expert Working Group report........................................................................................................................ 6
1. Executive Summary................................................................................................................................. 7
2. Introduction.................................................................................................................................................8
2.1. Terms of R eference........................................................................................................................................................................8
2.2. Participants.................................................................................................................................................................................... 10
2.3. Data C a ll.........................................................................................................................................................................................10
2.4. Data policy, formats and availability........................................................................................................................................ 10
2.4.1. Data policy................................................................................................................................................................................10
2.4.2. Nominal Deep Sea and Western Waters effort and catch data in 2000-2010..............................................................11
3. Deep S ea A ccess R egim e................................................................................................................... 12
3.1. Introduction.................................................................................................................................................................................... 12
3.2. Overview of spatial distribution of fishing effort d a ta ......................................................................................................... 14
3.3. Deep Sea effort, catch composition and catch by gear including discussion o f trends...................................................20
3.3.1. Information presented in report............................................................................................................................................20
3.3.2. Deep Sea ICES Area I ........................................................................................................................................................... 20
3.3.3. Deep Sea ICES Area I I ..........................................................................................................................................................20
3.3.4. Deep Sea ICES Area III.........................................................................................................................................................24
3.3.5. Deep Sea ICES Area I V ........................................................................................................................................................26
3.3.6. Deep Sea ICES Area V ..........................................................................................................................................................29
3.3.7. Deep Sea ICES Area V I ........................................................................................................................................................34
3.3.8. Deep Sea ICES Area V II.......................................................................................................................................................40
3.3.9. Deep Sea ICES Area VIII..................................................................................................................................................... 45
3.3.10. Deep Sea ICES Area I X .................................................................................................................................................49
3.3.11. Deep Sea ICES Area X ................................................................................................................................................... 53
3.3.12. Deep Sea ICES Area X II ................................................................................................................................................55
3.3.13. Deep Sea ICES Area X IV ..............................................................................................................................................58
1

3.3.14. Deep Sea CECAF Area 34.1.1....................................................................................................................................... 60
3.3.15. Deep Sea CECAF Area 34.1.2....................................................................................................................................... 62
3.3.16. Deep Sea CECAF Area 34.1.3....................................................................................................................................... 66
3.3.17. Deep Sea CECAF Area 34.2.0....................................................................................................................................... 66
4. We ste rn Wate rs ....................................................................................................................... 67
4.1. Background....................................................................................................................................................................................67
4.2. Fishing effort and catch composition in Western W aters......................................................................................................67
4.2.1. Western waters Area V ......................................................................................................................................................... 67
4.2.1.1. Area V E U ....................................................................................................................................................................67
4.2.1.2. Area V non EU ............................................................................................................................................................ 70
4.2.2. Western waters Area V I ........................................................................................................................................................72
4.2.2.E Area VI E U ................................................................................................................................................................. 72
1.2.2.2. Area VI non E U ..........................................................................................................................................................77
4.2.3. Western waters Area V II.......................................................................................................................................................79
4.2.3.1. Area VII excluding Vlld E U .................................................................................................................................79
1.2.3.2. Area VII excluding Vlld non E U ............................................................................................................................. 85
1.2.3.3. Area V lld .....................................................................................................................................................................85
4.2.4. Western waters Biologically Sensitive Area (BSA)........................................................................................................ 90
4.2.5. Western waters Area VIII......................................................................................................................................................94
4.2.5.1. Area VIII E U ............................................................................................................................................................... 94
1.2.5.2. Area VIII non EU........................................................................................................................................................98
4.2.6. Western waters Area I X ........................................................................................................................................................98
4.2.6.1. Area IX E U .......................................................................................................................................................................... 98
1.2.6.2. Area IX non E U .................................................................................................................................................................102
4.2.7. Western waters Area X ........................................................................................................................................................ 104
4.2.7.1. Area X E U .................................................................................................................................................................. 104
4.2.7.2. Area X non EU ...................................................................................................................................................................104
4.2.8. Western waters Area CECAF 34.1 .1................................................................................................................................106
1.2.8.1. Area 34.1.1 EU.......................................................................................................................................................... 106
4.2.8.2. Area 34.1.1 non E U ................................................................................................................................................. 107
4.2.9. Western waters Area CECAF 34.1 .2................................................................................................................................109
4.2.9.1. Area 34.1.2 EU.......................................................................................................................................................... 109
4.2.9.2. Area 34.1.2 non E U ................................................................................................................................................. 110
4.2.10. Western waters Area CECAF 34.1.3........................................................................................................................... I l l
4.2.10.1. Area 34.1.3 EU.......................................................................................................................................................... I l l
4.2.10.2. Area 34.1.3 non E U ................................................................................................................................................. I l l
4.2.11. Western waters Area CECAF 34.2.0........................................................................................................................... I l l
4.2.11.1. Area 34.2.0 EU.......................................................................................................................................................... I l l
2
4.2.11.2. Area 34.2.0 non E U ..................................................................................................................................................I l l
Annex 1 : Data call from 23 February 2011..................................................................................113
Annex 2: Participants.................................................................................................................... 139
Annex 3: Expert declarations........................................................................................................142
3

SCIENTIFIC, TECHNICAL AND ECONOMIC COMMITTEE FOR FISHERIES (STECF)
Evaluation of fishing effort regimes Part 3 Deep Sea and Western Waters (STECF-11-11)
THIS REPORT WAS REVIEWED DURING THE PLENARY MEETING HELD IN BRUSSELS 7-11 NOVEMBER 2011
Request to the STECF
STECF is requested to review the report of the EWG-11-11 held from September 26-30, 2011 in Cadiz, evaluate the findings and make any appropriate comments and recommendations.
Introduction
The report of the Expert Working Group on Evaluation of fishing effort regimes in the Baltic (EWG- 11-11) was reviewed by the STECF during its 38th plenary meeting held from 7 to 11 November, 2011, Belgium. The following observations, conclusions and recommendations represent the outcomes of that review.
STECF observations
General observations
The STECF expert working group on effort management EWG -11-06 met in Galway in June 2011 and in Cadiz in September 2011. The TOR for the meetings included conducting effort and catch reviews for the Baltic, Annex II A, B and C stocks, Celtic Sea, Bay of Biscay and Deep Sea/Western waters. The data call for this meeting was sent out in February 2011. A number of Member States submitted material in good time, several submitted data close to the effort meeting and some elements of the material were obtained in the first day of the meeting. Only Spain failed to provide any inputs in due time.
STECF notes that the procedures for automatic and manual checks introduced by the JRC have provided the group with more time to address the different ToRs.
Deep Sea fisheries
STECF notes that the TORs were only partially addressed due to time constraints.
Effort in a number of gears (particularly otter trawls) and countries has declined in recent years. Nevertheless increases in the effort of long liners have occurred in a number of areas.
STECF notes that there is a reduction in the landings of a number of species across the range of areas reported with the exception of landings of certain deep water sharks in the more southerly ICES areas.
The group was also requested to discuss whether additional data on fishing depth and VMS position could improve the analysis and interpretation of deep sea fisheries, and how these data could be called
4

from MS, processed and presented. STECF notes that additional data on fishing depth and VMS position could be useful to the deepwater data analysis and it would be highly valuable in improving the analysis and interpretation of deep sea fisheries through the identification of individual fisheries at a fine scale.
Western Waters
STECF notes that there were difficulties in preparing landings data and summaries for some Member States most notably Portugal, France and Spain are confusing. Since these MSs are key operators in the western waters overall effort figures remain unreliable.
STECF conclusions
STECF endorses the main findings and conclusions of the report of the EWG 11-11.
Western Waters
Given the poor quality and misleading effort information provided by some Member States, STECF considers that the fishery-dependent information is unreliable and not representative of the fisheries in the area and should not be used as a basis for management decisions.
5

E x p e r t W o r k in g G r o u p r e p o r t
REPORT TO THE STECF
EXPERT WORKING GROUP ON EVALUATION OF FISHING EFFORT REGIMES PART 3 DEEP SEA AND WESTERN
WATERS(EWG-11-11)
Cadiz, Spain, 26-30 September 2011
This report does not necessarily reflect the view of the STECF and the European Commission and in no way anticipates the Commission’s future policy in this area

1. E x e c u t iv e S u m m a r y
General remarks
• The work of the effort EWG is to collate and summarise data provided by member states. In this respect the output is dependent on timely submission of accurate material and STECF EWG is only able to provide an output which reflects the quality of these data. While every effort is made to accommodate updates and revisions from member states, it is not possible to capture all of these in the finalised reports.
• Deep sea data has been provided by a number of countries representing further development in the work of EWG. While improvements are evident from some countries involved, the deep sea and western waters effort data from others was either not supplied or was incomplete. Problems were most evident in the western waters summaries from France (pre 2009) and Portugal where it appears that failure to submit data correctly has resulted in negative effort values in some tables. Spain failed to supply any 2010 data and in the years prior to this data were incomplete. Given the prominence of these countries in the areas covered by both control Regulations, the aggregate data must be treated as uncertain.
• So far, the data available on deep sea species is mainly restricted to landings information. To gain a true perception of removals from these fisheries, catch data are required.
• The combination of questionable effort data and absence of catch information renders the calculation of CPUEs from deep sea and western waters data rather pointless for the present.
Review of Deep Sea and Western Waters effort Regimes
• STECF EWG provided a further evaluation of deep sea and western waters effort and catches. This continues to be a work in progress.
• TORs were partially achieved by EWG but there was insufficient time to address all requests as fully as might be possible in a more dedicated meeting.
• STECF SGMOS presented effort trends for each member state and gear by ICES (and CECAF) areas. The general position is that effort in a number of gears (particularly otter trawls) and countries has declined in recent years. This is most evident in the most northerly areas.Increases in the effort of longliners has occurred in a number of areas.
• SGMOS also presented information on catches and catch composition. This is very detailed but in general shows reductions in the landings of a number of species across the range of areas reported. One exception is the landings of certain deep water sharks in the more southerly ICES areas.
• Information on landings of the top 5 species in the western waters analysis was provided for demersal and pelagic species. Note that for information on herring was not extracted from the database into summary tables so could not be included in the analysis. This affects perceptions of importance of pelagic species, particularly in areas VI and VII. Data on scallops and crabs and the gear types catching them was also provided.
7

2 . I n t r o d u c t io n
2.1. Terms of Reference
Assessment of fishing effort and evaluation of management measures to be assessed in 2009(Deep sea and Western Waters effort regime)
Terms of Reference:
1. To provide historical series, as far back in time as possible, according to each of the following fishing areas:
(i) ICES area I (EU waters; non EU waters), only linked to Deep Sea species
(ii) ICES area II (EU waters; non EU waters), only linked to Deep Sea species
(iii) ICES area III (EU waters; non EU waters), only linked to Deep Sea species
(iv) ICES area IV (EU waters; non EU waters), only linked to Deep Sea species
(v) ICES area V (EU waters; non EU waters)
(vi) ICES area VI (EU waters; non EU waters)
(vii) ICES area VII excluding Vlld (EU waters; non EU waters)
(viii) ICES division Vlld
(ix) the Biologically Sensitive Area as defined in Article 6 of Reg (EC) No 1954/2003
(x) ICES area VIII (EU waters; non EU waters)
(xi) ICES area IX (EU waters; non EU waters)
(xii) ICES area X (EU waters; non EU waters)
(xiii) ICES area XII (EU waters; non EU waters), only linked to Deep Sea species
(xiv) ICES area XIV (EU waters; non EU waters), only linked to Deep Sea species
(xv) CECAF area 34.1.1 (EU waters; non EU waters)
(xvi) CECAF area 34.1.2 (EU waters; non EU waters)
(xvii) CECAF area 34.1.3 (EU waters; non EU waters)
(xviii) CECAF area 34.2 (EU waters; non EU waters)
The data should also be broken down by
- Member State ;
- The following gear types:

regulated gear types
o Beam trawlso Bottom trawls & demersal seineso dredgeso drifting longlines or set longlines (bottom)o driftnets or set gillnetso trammel netso pots & traps
- Unregulated gear types:o Pelagic trawls and pelagic seines; o longlines (surface)
for the following parameters:
a. Fishing effort, measured in kW.days, in GT.days and in number of vessels concerned
b. Catches (landings and discards provided separately) by weight of5 most important (in weight landed) demersal species excluding scallops, edible crab, spider crab,ScallopsSpider crab and edible crab5 most important (in weight landed) Deep-sea species (according to Annex I and II of Reg 2347/2002), only related to fisheries which have been identified with special condition DEEP4 most important (in weight landed) pelagic species, plus always tuna-like species (SKJ,ALB,YFT,BET,SWO).
c. Landings Per Unit of Effort (LPUE) and Catches Per Unit Effort (CPUE) by Member State and gear, given by total catches of the gear divided by kW-days and GT-days.
2. If relevant data are available, to comment on the quality of estimations on total catches and discards.
3. When providing and explaining data in accordance with point (1), the following specific question should be answered as well
Discuss whether additional data on fishing depth and VMS position could improve the analysis and interpretation of deep sea fisheries, and how these data could be called from MS, processes and presented
9

4. To identify recent effort trends in pelagic fisheries where possible, in particular in areas XI, X and CECAF areas.
5. To highlight any unexpected evolutions shown by the data which are not in line with general trend.
2.2. Participants
Participants of the 2 meetings are grouped by STECF members, invited experts, JRC experts and EU- Commission representatives and are listed in Appendix 1.
In 2007, STECF and its subgroups adopted a new working style with the opportunity for stakeholders to participate as observers to improve transparency in scientific evaluations. No stakeholder participants attended in 2011
2.3. Data Call
On 23rd February 2011 the Commission DG Mare requested that Member States fleet specific catch and effort data no later than 6th May 2011. A corrigendum was 2011 clarifying the data submission relating to FDF (fully documented fisheries), to Member States with a final deadline of 20th May 201 l(see. Appendix 2).
2.4. Data policy, formats and availability
Originally, the catch and effort data base structures used by STECF-SGRST were developed by the ICES Study Group on the Development of Fishery-based Forecasts (ICES CM 2004/ACFM :ll, 41 pp.) with few amendments required for the review of fishery regulations. The format of the fleet specific data on catches including discards and effort is given in Annex 1 of Part II of the effort report. The format has been almost unchanged compared to the data bases compiled during earlier STECF subgroup meetings dealing with cod recovery or mixed fisheries reviews. Fields allowing for the attachment of special conditions have been adapted to accommodate the development of new management measures. To identify Deep Sea activity a specon was added to appropriate trips (see below).
2.4.1. Data policy
Experts reported a continued use of the data by STECF-SGRST but with the required permission for any use by other scientific or non-scientific groups. In the case of the Deep Sea and Western Waters data, the uncertainties surrounding some of the submissions and the fact that the process of effectively defining Deep Sea effort is still being developed means that these data are subject to significant change. This implies that national experts need to be contacted for their consent before granting access to the data. However, Denmark and Portugal reserves the right of the deletion of the national data on request.
JRC requests to be informed about applications of data access and their notifications.
electronically submit issued on 23rd March
. A reminder was sent
10

2.4.2. Nominal Deep Sea and Western Waters effort and catch data in 2000-2010
The provision of information on effort and catches concerning Deep Sea and Western Waters was supplied to EWG in the context of the wider data call concerning the Baltic and Annex II effort evaluations.
The fleet aggregation according to the derogations (gear group, mesh size and management area) defined in Annexes IIA-C or aggregation according to the revised cod plan is within the competence of the Member States’ institutes. While every attempt is made to encourage a consistent approach, some differences between countries due to availability of essential information, different interpretations and/or different expertise to manage the extensive databases is known to occur. A number of Member States invested additional time in improving their data submissions and the overall quality is believed to have improved. However, the new requirements to provide Deep Sea and Western Waters effort data have raised new issues and it is expected that these will take a while to resolve.
It is only recently that attempts have been made to collate Deep Sea and Western Waters effort and from the outset was seen as a first step towards providing comprehensive information. Conyinued progress was made but data provided by several countries remains questionable, incomplete or absent altogether AS A CONSEQUENCE THE RESULTS PRESENTED HERE SHOULD AGAIN BE TREATED AS HIGHLY PROVISIONAL AND SUBJECT TO CONSIDERABLE FUTURE AMENDMENTS - PARTICULARLY THE WESTERN WATERS EFFORT INFORMATION.
Aspects of the database querying and extraction are also continuing to be refined and this year it was discovered that information on herring landings was not appearing in Western waters summaries in places where they would be expected to contribute significantly to pelagic landings - this will be corrected in 2012.
11

3. D e e p S e a A c c e s s R e g im e
3.1. Introduction
Details of the Deep Sea Regulations can be found in COUNCIL REGULATION (EC) No 2347/2002.
The format for presenting Deep Sea information was discussed during the July 2009 SGMOS meeting when experts with particular knowledge were present. It was agreed that the most useful presentation would be data summarised on a regional approach so as to identify geographic differences in effort distribution by key member states and important gears. It was decided that regions would be based on ICES areas. It may be the case that similarities between some of these areas would allow areas to be combined in future summaries. Where an ICES area contained waters within EU jurisdiction and waters outside of this, separate summaries are provided where data allow.
So as to provide a more complete and self contained picture of activities in each of the regions, it was also agreed that information on catches of different deep sea species would be presented alongside the effort data. It is hoped this will facilitate the reader in identifying key features and trends.
Data on catches are restricted to the Annex I and 2 species as shown in Table 3.1.1.
The Commission have specifically requested the following; “Discuss whether additional data on fishing depth and VMS position could improve the analysis and interpretation of deep sea fisheries, and how these data could be called from MS, processed and presented”
Additional data on fishing depth and VMS position could be useful to the deepwater data analysis. The Group feei that VMS data would be highly valuable in improving the analysis and interpretation of deep sea fisheries through the identification of individual fisheries at a fine scale.
Since fishing depth data may not be regularly recorded by vessel logbooks it could be possible to estimate depth from VMS data. If VMS were to be used it should be limited to aggregated data identified as fishing effort, such as a grid basis of 0.1 x 0.1 degree, and linked to logbooks for associated catches.
Data should be processed into grid format within member state to a predetermined standard methodology and submitted in a grid format for aggregation at an international level.
This aggregated data could subsequently be presented in map format.
ICES currently have a study group, SGVMS, looking at VMS issues. EWG believes that some guidance could be sought from them regarding methodology and processing this type of data and that in the future, a combined approach to accessing, collating and analysing these data would be beneficial and make better use of available scientific resources.
12

Table 3.1.1: Annex I and 2 species list
Code Annex Scientific name Common nameALF 1 Beryx spp AlfonsinosAPQ 1 Apristurus laurussonii Iceland catcharkARU 1 Argentina silus Greater silver sm eltBLI 1 Molva dypterygia Blue lingBSF 1 Aphanopus carbo Black scabbardCFB 1 Centroscyllium fabricii Black dogfishCYO 1 Centroscymnus coelolepis Portuguese dogfishCYP 1 Centroscymnus crepidater Longnose ve lve t dogfishDCA 1 Deania calcea Birdbeak dogfishETR 1 Etmopterus princeps Greater lantern sharkETX 1 Etmopterus spinax Velvet bellyFOX 1 Phycis blennoides ForkbeardsGAM 1 Galeus murinus Mouse catsharkGSK 1 Somniosus microcephalus Greenland sharkGUP 1 Centrophorus granulosus Guiper sharkGUQ 1 Centrophorus sguam osus Leafscale gu iper sharkHXC 1 Chlamydoselachus anguineus Frilled sharkORY 1 Hoplostethus atlanticus Orange roughyOXN 1 Oxynotus paradoxus Sharpback sharkRNG 1 Coryphaenoides rupestris Roundnose grenadierSBL 1 Hexanchus griseus Six-gilled sharkSCK 1 Dalatias licha Kitefin sharkSHO 1 Galeus m elastom us Blackm outh dogfishSYR 1 Scymnodon ringens K nife tooth dogfish
ALC 2 Alepocephalus bairdii Baird's sm oothheadANT 2 Antimora rostrata Blue antim oraBRF 2 Helicolenus dactylopterus Blue m outh redfishCMO 2 Chimaera m onstrosa RabbitfishCOE 2 Conger conger Conger eelCYH 2 Hydrolagus mirabilis Large-eyed rabbitfishELZ 2 Lycodes esmarkii EelpoutEPI 2 Epigonus telescopus Black cardinal fishHPR 2 Hoplostethus m editerraneus Silver roughyJAD 2 Dipturus nidarosiensis Norwegian skateKEF 2 Chaceon affinis Deep-water red crabPHO 2 Alepocephalus rostratus Risso's sm oothheadRCT 2 Rhinochimaera atlantica Straightnose rabbitfishRHG 2 Macrourus berglax Roughhead grenadierRIB 2 Mora moro Common moraRJG 2 Amblyraja hyperborea Arctic skateRJY 2 Rajella fyllae Round skateSBR 2 Pagellus bogaraveo Red (blackspot) seabreamSFS 2 Lepidopus caudatus Silver scabbard fishSFV 2 Sebastes viviparus Small redfishTJX 2 Trachyscorpia cristulata Spiny (deep sea) scorpionfishWRF 2 Polyprion americanus W reckfish
13

3.2. Overview of spatial distribution of fishing effort data
Collation of data to address questions associated with deepwater fisheries, provided and opportunity to present spatial data across wide geographic areas giving a general picture of the distribution of fishing activity.
Figures 3.2.1 to 3.2.5 show respectively the distribution of effort for five of the categories of gear; bottom trawl, pelagic trawl, longline, gili nets and beam trawl specified in the Terms of Reference. Bottom trawl effort is concentrated in ICES Area IVa as well as the Continental shelf and slope to the west and southwest of Ireland and the UK. Up to 2010 bottom trawl effort is also found in the Cantabrian Sea and off the Portuguese coast. Pelagic trawling was concentrated to the west of Ireland, and to the west and north of Scotland in the mid 2000s. This effort decreased greatly between 2007 and 2009 but increased again in 2010. Longline effort was concentrated on the shelf and slope between Shetland and Portugal but has been in decline in recent years. In the mid 2000s gili net effort was concentrated in the Celtic sea and Porcupine Bank. Due to current restrictions in the use of deepwater gili nets much of this effort is now concentrated in the Celtic sea, with some effort in the North sea, west of Scotland and the Bay of Biscay. Beam trawling is concentrated in the Celtic sea and the western English Channel. While beam trawls are not a deepwater gear some of the species caught are classified under Annex 2.
14

7065
60
55
50
40
V-ïT — i--------T----1------ r•10 0 10 20 30 2QQ3_____________
jv ^~n—i------1-----1---r■10 0 10 20 502 Q Q 3 _
- 4 0 - 5 0 - 2 0
7065
60
55
5045
~ r —i-----1-----1-----r-10 0 10 20 30
□it {trawled his) OS BOTTOM TRAW□ a « äooo□ 5000 « 10000□ 10000 « 15000■ 15000 « 20000■ 20000 « 25000
Fig. 3.2.1 Distribution of bottom trawl effort, 2003 - 2010
15

7065
60
55
50
40
■10 0
T — i------t 1 r•10 0 10 20 30-40 -50 -20 10 20 30 -40 -50 -20 -40 -30 -20 -10 0 10 20 50 -40 -30 -20 -10 0 10 20 50
■ZQ-1Q7065
60
55
5045
-40 -50 -20 10 20 30 -40 -50 -20 -40 -30 -20 -10 0 10 20 50 -40 -30 -20 -10 0 10 20 50
O ft (trawled hrs) DS. PELAGIC TRAWI □ -200 <= 0 □ 0 <= 200□ 200 <= 400□ 400 <= 600□ 600 <= 800 ™ 800 <= 1000 □ 1000 <= 1200 □ 1200 <= 1400
Fig. 3.2.2 Distribution of pelagic trawl effort, 2003 - 2010
16

7065
60
55
50
40
-40 -50 -20 10 20 30
7065
60
55
50
40
■10 0-40 -50 -20 10 20 30
Effort (trawled hre) DS.LONGLINE□ -5-000 <= 0□ 0 <= 5-000□ 5000 <= 10000□ 10000 <= 15000□ 15000 <=20000□ 20000 <= 25000□ 25000 <= 30000□ 30000 <= 35000□ 35000 <= 40000□ 40000 <= 45000□ 45000 <= 50000IS 50000 <= 55000
2004
I I I [ 10 20 30
i--- r— i— r10 20 50
Fig. 3.2.3 Distribution of longline effort, 2003 - 2010
17
7065
60
55
50
45
40
7065
60
55
50
40
70
65
60
55
50
45
40
20 IQ7065
60
55
50
40

73
65
60
55
5045
-40 -30 -20 10 20 30
7065
6055
5045
■10 0-40 -30 -20 10 20 30
Effort {trawled hrs) D S. G ILL□ -1000 <= 0□ 0 <= 1000□ 1000 <= 2000□ 2000 <= 3000□ 3000 <= 4000□ 4000 <= 5000□ 5000 <= 6000n 6000 <= 7000□ 7000 <= 8000□ 8000 <= 9000□ 9000 <= 10000IB 10000 <= 11000
2 0 0 4
I I I I I 10 20 30
i —i-----T 1 r10 20 30
Fig. 3.2.4 Distribution of gili net effort, 2003 - 2010
18
7065
55
50
45
7065
6055
5045
7065
55
50
45
7065
6055
5045

íc. *c X -10 -IO -31 -20
Effort {trawled his) OS BEAM□ a <= 20CICI□ 2000 « 4000□ 4000 « 6000□ 6000 « 8000 □ 8000 <= 10000 ■ 10000 <«12000 ■ 12000 <« 14000
Fig. 3.2.5 Distribution of beam trawl effort, 2003 - 2010
19
2 0 0 5 200 6
: :: :: -AO -30 -20 -10 0 10 202Q1Q
10 20 30-A0 -30 -20 -10 -A0 -30 -20 -10

3.3. Deep Sea effort, catch composition and catch by gear including discussion of trends
3.3.1. Information presented in report
For each ICES area, tables are included which show effort by country (and an overall effort for the area) and effort by gear. In addition, figures illustrating trends are included for the most important gears. Catches are shown for each species in bubble plots covering the years 2003 to 2010. For each gear, catch composition is illustrated by the relative sizes of bubble associated with each of the species in the Annex I&2 list, with shading used to give an indication of the absolute amount caught (white = smallest amounts, black = largest amounts)
Effort data are presented for Kwdays. Information on GT days is made available on the STECF/EWG -11-11 website:
https://stecf.irc.ec.europa.eu/meetings/20117p p id=62 INSTANCE 9gxN&p p lifecvcle=0&p p state=maximized&p p mode=view&p p coi id=column-
2&P p coi count=l& 62 INSTANCE 9gxN struts action=%2Fioumal articles%2Fview& 62 I NSTANCE 9gxN groupld=43805& 62 INSTANCE 9gxN articleld=88491& 62 INSTANCE 9 gxN version=1.0
3.3.2. Deep Sea ICES Area I
Effort
Only sparse effort by Germany is reported is from this area (Table 3.3.2.1). None of this is in EU waters.
Table 3.3.2.1 Deep Sea Effort (kwdays) by country ICES Area I (total)AREA ms 2000 2001 2002 2003 2004 2005 2006 2007 2008 2009 20101 non EU GER 70600 2427Total 70600 2427
Note: the entries reported by Germany in 2006 and 2009 comprised otter trawl effort only
Catch and Catch Composition
No information was provided from this area.
3.3.3. Deep Sea ICES Area II
Effort
Three countries, France, Netherlands and UK contributed most effort in this area with the pattem of each varying through time (Table 3.3.3.1); French effort showed a particularly noticeable drop in the mid 2000s. Netherlands pelagic trawl effort stopped in 2007. Germany contributed some effort in the mid 2000s. Effort in Area II (EU) shows no obvious trend, however effort in Area II (non EU) has been decreasing since 2004 (Table 3.3.3. land 3.3.3.2).
20

The principal gear used in this area (Tables 3.3.3.3 and 3.3.3.4, and Figures 3.3.3.1 and 3.3.3.2) was the otter trawl (by France and UK). UK gili net effort fluctuated between 2002 and 2008 (albeit at a relatively low level), but had dropped to zero in 2010.
Table 3.3.3.1 Deep Sea Effort (kwdays) 2000-2010 by country ICES Area II (EU)AREA ms 2000 2001 2002 2003 2004 2005 2006 2007 2008 2009 2010
2 EU DEN 24060 24221FRA 208280 325607 623365 43886 29608 65124 210353 134456 248412 246993 144020GER 33516 87864 12000NED 24265 22652 13200 158115UK 165402 122393 114443 66870 26431 12017 200446 97363 79378 73683 71877
Total 422007 470652 762029 157472 302018 77141 422799 231819 327790 320676 215897
Table 3.3.3.2 Deep Sea Effort (kwdays) 2000-2010 by country ICES Area II (non EU)AREA ms 2000 2001 2002 2003 2004 2005 2006 2007 2008 2009 2010
2 non EU FRA 81836GER 94653 49420 43686 262923 266743IRL 2940 1350NED 86785 349335 781113 196020 216254POR 764606 175049UK 1288608 1113050 645077 701782 649580 817921 802633 613414 603521 380425 283442
Total 2053214 1374884 648017 1147120 1480113 1057627 1281810 613414 603521 647168 365278
Table 3.3.3.3 Deep Sea Effort (kwdays) 2000-2010 by gear and country ICES Area II (EU)Area Gear ms 2000 2001 2002 2003 2004 2005 2006 2007 2008 2009 2010
2 EU BOTTOM TRAWLS FRA 208280 325607 623365 43886 29608 65124 210353 134456 248412 246993 144020GER 4410 12000UK 145845 122393 113652 66870 17755 4661 178712 45144 24171 47637 69845
GILL GER 33516 53802UK 19557 791 8676 7356 21734 39241 55207 26046 2032
PELAGIC TRAWLS DEN 24060 24221GER 29652NED 24265 22652 13200 158115UK 12978
Total 422007 470652 762029 157472 302018 77141 422799 231819 327790 320676 215897
Table 3.3.3.4 Deep Sea Effort (kwdays) 2000-2010 by gear and country ICES Area II (non EU)Area Gear ms 2000 2001 2002 2003 2004 2005 2006 2007 2008 2009 2010
2 non EU BOTTOM TRAWLS FRA 71532GER 94653 43686 262923 266743POR 486524 175049UK 1288608 1113050 645077 701782 649580 817921 802633 470655 603521 380425 283442
DREDGE FRA 10304LONGLINE IRL 1350PELAGIC TRAWLS GER 49420
IRL 2940NED 86785 349335 781113 196020 216254POR 278082UK 142759
Total 2053214 1374884 648017 1147120 1480113 1057627 1281810 613414 603521 647168 365278
21
Area 2 EU, by gear, KWdays Area 2 non EU, by gear, KWdays
pelagic trawlso
0 ...
2000 2002 2004 2006 2008 2010
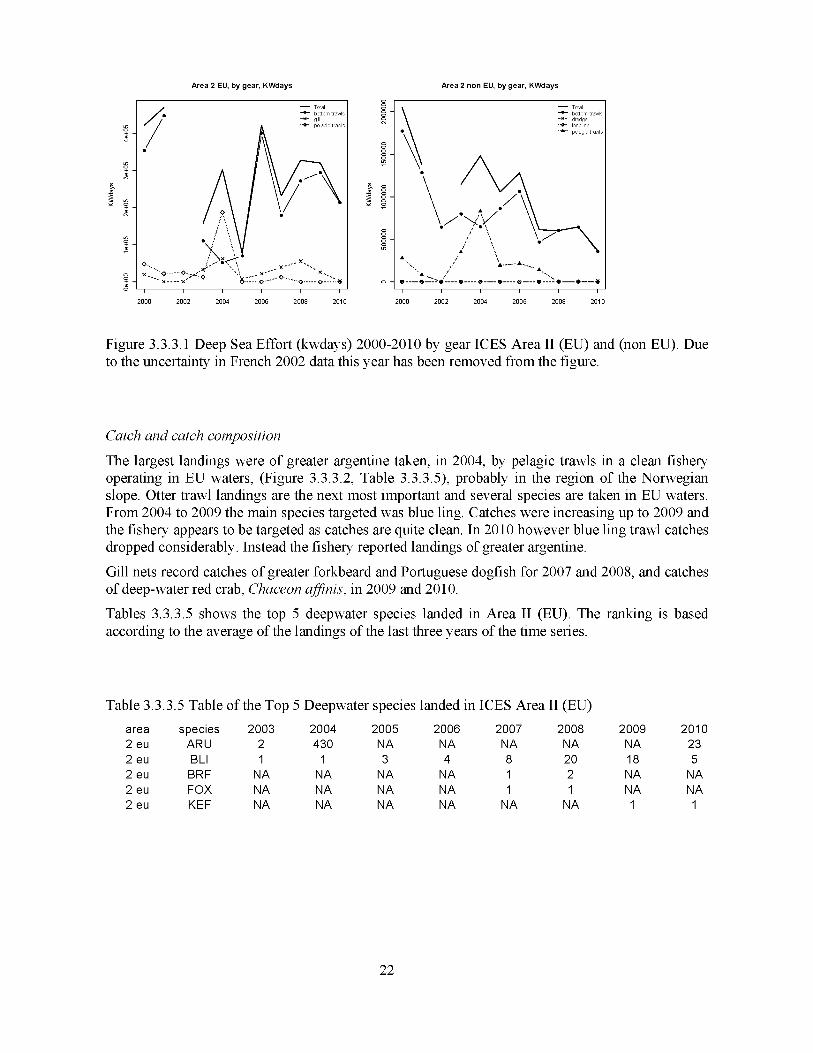
longlir
Figure 3.3.3.1 Deep Sea Effort (kwdays) 2000-2010 by gear ICES Area II (EU) and (non EU). Due to the uncertainty in French 2002 data this year has been removed from the figure.
Catch and catch composition
The largest landings were of greater argentine taken, in 2004, by pelagic trawls in a clean fishery operating in EU waters, (Figure 3.3.3.2, Table 3.3.3.5), probably in the region of the Norwegian slope. Otter trawl landings are the next most important and several species are taken in EU waters. From 2004 to 2009 the main species targeted was blue ling. Catches were increasing up to 2009 and the fishery appears to be targeted as catches are quite clean. In 2010 however blue ling trawl catches dropped considerably. Instead the fishery reported landings of greater argentine.
Gili nets record catches of greater forkbeard and Portuguese dogfish for 2007 and 2008, and catches of deep-water red crab, Chaceon affinis, in 2009 and 2010.
Tables 3.3.3.5 shows the top 5 deepwater species landed in Area II (EU). The ranking is based according to the average of the landings of the last three years of the time series.
Table 3.3.3.5 Table of the Top 5 Deepwater species landed in ICES Area II (EU)area species 2003 2004 2005 2006 2007 2008 2009 20102 eu ARU 2 430 NA NA NA NA NA 232 eu BLI 1 1 3 4 8 20 18 52 eu BRF NA NA NA NA 1 2 NA NA2 eu FOX NA NA NA NA 1 1 NA NA2 eu KEF NA NA NA NA NA NA 1 1
22

Landings com positions f o r th e m ost im portant d e ep s e a s p e c ie s in annex 1 and 2
2 EU 2 EU 2 EU 2 EUBEAM BOTTOM TRAWLS DREDOE PILL
ALF
ARII• BLI
BSFCFBCYO
CYPDCAETRFOX
GUPGUQORY
SCK
SHOSYRBRF oo
•COE2-EPIl-KEF•RHG Œ•SBR
•SFS•WRF
2 EU 2 EU 2 EU 2 EULONGLINE PELAGIC TRAWLS POTS TRAMMEL
2 0 0 4 2000 2008 2 0 10 20 0 4 2006 2008 2010
100 %
80 %
60 %
40 %
20 %
p re s e n t
-ALF-ARU
-BLI-BSF-CFB-CYO [0,10)t
-CYP-DCA [10,100)t-ETR-FOX
>1 oot-GUP-GUO
-ORY-RNG-SCK
-SHO-SYR-BRF-COE
-EPI-KEF-RHG-SBR
-SFS
-WRF
Figure 3.3.3.2 Catches of Annex 1&2 Deep Sea species (tonnes) 2003-2010 by gear ICES Area II (EU)
There was deepwater effort in ICES Area II (non EU) but no landings of the main Annex 1 or 2 species.
23

3.3.4. Deep Sea ICES Area III
Effort
All effort takes place in EU waters but is very limited and the majority of the records are for Danish vessels with German data reported for 2004 only.
Table 3.3.4.1 Deep Sea Effort (kwdays) 2000-2010 by country ICES Area III (non Baltic)Area Gear ms 2000 2001 2002 2003 2004 2005 2006 2007 2008 2009 2010
3 no Baltic BOTTOM TRAWLS
GILL
DENGERDEN
132752 164649
85
155250 237134 5175481470
375444 153296 11370 2682
Total 132752 164734 155250 237134 519018 375444 153296 11370 2682
Note: the entry reported by Germany in 2004 comprised otter trawl effort only
Area 3 no Baltic, by gear, KWdays
o
2000 2002 2004 2006 2008 2010
Figure 3.3.4.1 Deep Sea Effort (kwdays) 2000-2010 by gear ICES Area III (no Baltic)
Catch and catch composition
The main fishery was roundnose grenadier targeted by Danish bottom trawlers, up to 2006. No fishing took place in 2007 or 2008, but small amounts of grenadier were landed again in 2009 and 2010. There were small catches of greater argentine and blue ling between 2003 and 2006.
Tables 3.3.4.2 shows the top 4 deepwater species landed in Area III (no Baltic). The ranking is based according to the average of the landings of the last three years of the time series.
24

Table 3.3.4.2 Table of the Top 4 Deepwater species landed in ICES Area III (no Baltic)area species 2003 2004 2005 2006 2007 2008 2009 2010
3 no baltic RNG 3333 5081 9975 2016 NA NA 1 13 no baltic ARU 929 990 547 366 NA NA NA NA3 no baltic BLI 17 18 47 42 NA NA NA NA3 no baltic ETX NA NA NA 9 NA NA NA NA
Landings com positions f o r th e m ost im portant d e ep s e a s p e c ie s in annex 1 and 2
1-ALF -
1-ARU - 1-BLI -
1-BSF - 1-CFB - 1-CYO -
1-CYP - 1-DCA - 1-ETR - 1-FOX -
1-GUP - 1-GUQ - 1-ORY - 1-RNG -
1-SCK - 1-SHO -1-SYR -2-BRF -
2-COE -2-EPI -
2 -KEF - 2-RHG - 2-SBR -
2-SFS - 2-WRF -
BOTTOM TRAWLS
Œ
PELAGIC TRAWLS
[0,10)t
>1 oot
oOoo
p re s e n t
■ 1-ALF■ 1-ARU
■ 1-BLI
■ 1-BSF■ 1-CFB■ 1-CYO
■ 1-CYP
1-DCA [10,100)t■ 1-ETR■ 1-FOX
■ 1-GUP■ 1-GUQ■ 1-ORY■ 1-RNG■ 1-SCK
■ 1-SHO■ 1-SYR■ 2-BRF■ 2-COE
■ 2-EPI■ 2-KEF■ 2-RHG■ 2-SBR
■ 2-SFS■ 2-WRF
oo
Figure 3.3.4.2 Catch composition of Annex 1&2 Deep Sea species 2003-2010 by gear ICES Area III (No Baltic)
25

3.3.5. Deep Sea ICES Area IV
Effort
All reported effort in this ICES area occurs in EU waters. Three countries, France, Netherlands and UK contributed most effort in this area (Tables 3.3.5.1 and 3.3.5.2). There is an obvious downward trend in overall effort up to 2008, with the 2008 figure only about 25% of the figure in 2000, but effort increased again in 2009 and 2010. French and UK effort showed marked declines up to 2008 but have shown an increase again in the latter two years. While Dutch effort peaked in the mid 2000s significant longlining was again carried out in 2010. Germany also contributed some effort in the mid 2000s.
Otter trawl was by far the most important gear used, mainly by France and the UK. The UK also used beam trawl, and gili nets in reasonable amounts with small amounts of longline. Downward trends are evident in all of these gears up to 2008 (Figure 3.3.5.1) when otter trawling showed an increase.
Table 3.3.5.1 Deep Sea Effort (kwdays) 2000-2010 by country ICES Area IVAREA ms 2000 2001 2002 2003 2004 2005 2006 2007 2008 2009 20104 DEN 1326 8341 12997 6000
FRA 1017129 635135 1575689 277155 176632 261732 178577 289736 185516 173847 484416GER 206302 134099 195941 15600 123550IRL 25800 35145 10500 4701NED 7260 134640 128276 619530 537132 500354 195760 222638 40084 106630UK 2987253 3023864 3032377 1835877 1284533 1299055 1399548 1018323 993200 1371175 1402424
Total 4038768 3828784 4755183 2732562 2222297 2195240 1969826 1546297 1224800 1668572 1993470
Table 3.3.5.2 Deep Sea Effort (kwdays) 2000-2010 by gear and country ICES Area IVArea Gear ms 2000 2001 2002 2003 2004 2005 2006 2007 2008 2009 20104 BEAM NED 8826
UK 236790 198288 264316 52274 16008 14775 2045BOTTOM TRAWLS DEN 1326 6000
FRA 1017129 635135 1575689 277155 176632 261732 178577 289736 185516 173847 477056GER 39270 61113 108000 123550IRL 25800 35145 10500UK 2323564 2457315 2373676 1437532 905088 939566 952052 806117 797312 1104312 1191245
DREDGE FRA 7360GILL GER 3798
UK 308720 332310 330460 253584 305389 259341 399015 136272 187454 225154 200327LONGLINE UK 117747 28338 36410 63020 50987 85373 46397 11044 8434 41709 10672PELAGIC TRAWLS DEN
GERIRL
8341 12997167032
470169188 87941 15600
NED 7260 134640 128276 619530 537132 500354 195760 222638 40084 97804UK 7613 27515 28560 7061 64890
POTS UK 432 907 39TRAMMEL UK 180
Total 4038768 3828784 4755183 2732562 2222297 2195240 1969826 1546297 1224800 1668572 1993470
26

Area 4, by gear, KWdays
o
-O - dredge
x'
2000 2002 2004 2006 2008 20 1 0
Figure 3.3.5.1 Deep Sea Effort (kwdays) 2000-2010 by gear ICES Area IV. Due to the uncertainty in French 2002 data this year has been removed from the figure.
Catch and catch composition
The species are typical of the mixed trawl fishery in the North Sea with black scabbard and blue ling dominating. Blue ling catches decreased in the mid 2000s but have since started increasing again as have those for black scabbard. Roundnose grenadier catches have been low since 2007 although an increase was noticed in 2010. It is notable that few sharks are landed from the trawl fishery and that landings of sharks from gili nets are decreasing, probably reflecting the ban on Deep Sea gillnets. Conger eel catches started to rise in 2007. Deep-water red crab, Chaceon affinis are important in the gili net fishery but landings have been decreasing since 2008. The moderately large pelagic catches of greater silver smelt in the mid 2000s are to be expected.
Tables 3.3.5.3 shows the top 5 deepwater species landed in Area IV. The ranking is based according to the average of the landings of the last three years of the time series.
Table 3.3.5.3 Table of the Top 5 Deepwater species landed in ICES Area IV area species 2003 2004 2005 2006 2007 2008 2009 2010
4 BLI 26 34 12 9 4 10 16 524 BSF NA 5 2 13 1 NA NA 214 KEF 13 5 109 59 172 37 21 24 COE 7 8 8 6 9 6 15 134 ARU 20 52 NA 39 NA NA NA 10
27

sppa
nx
Lan dings c o m p o s i t io n s f o r t h e m ost important d e e p s e a s p e c i e sin an n e x 1 and 2
1-ALF -
1-ARU - 1-BLI -
1-BSF - 1-CFB - 1-CYO -
1-CYP - 1-DCA - 1-ETR - 1-FOX -
1-GUP - 1-GUQ - 1-ORY - 1-RNG -
1-SCK -
1-SHO -1-SYR -2-BRF -
2-COE -2-EPI -
2 -KEF - 2-RHG - 2-SBR -
2-SFS - 2-WRF -
o
o
20 0 4 2006
BO TTO M T R A W LS
o . o OO o ° o o o
o o O ° o O
PELAGIC TRAWLS
33)0 1-ALF1-ARU
1-BLI1-BSF1-CFB1-CYO
1-CYP1-DCA1-ETR1-FOX
1-GUP1-GUQ
1-ORY1-RNG1-SCK
1-SHO1-SYR2-BRF 2-COE
2-EPI 2-KEF 2-RHG 2-SBR
2-SFS
2-WRF
p re s e n t
[0.10)t
[10,100)t
>1 oot
2 0 0 4 2000 200 8 2010 2 0 0 4 2006
Figure 3.3.5.2 Catches of Annex 1&2 Deep Sea species (tonnes) 2003-2010 by gear ICES Area IV
28

3.3.6. Deep Sea ICES Area V
Effort
Four countries, France, Netherlands and UK and Germany contributed effort in this area (Tables 3.3.6.1 and 3.3.6.2 and Figures 3.3.6.1 and 3.3.6.2). In the EU portion, French effort has dominated throughout the series and remains high up to 2010 while UK and Netherlands effort showed marked declines throughout the time period. In the non EU section both France and the UK effort peaked in 2004 and has dropped slowly since. German effort dropped from the mid 2000s before rising again in 2009 and 2010.
In both sections of Area V the predominant gear used was otter trawl, with some gili net fishing and pelagic trawls (Tables 3.3.6.3 and 3.3.6.4). German effort in the early part of the time series was both otter and pelagic trawls, but in later years this was confined to bottom trawls and since 2008 this effort is increasing quite quickly. Dutch effort, which generally declined throughout the series, was confined to pelagic trawls.
Effort in Area V (EU) has been declining since 2007, while effort in Area V (non EU) which had been in decline since 2003 has started increasing again in 2009 and 2010.
Table 3.3.6.1 Deep Sea Effort (kwdays) 2000-2010 by country ICES Area V (EU)AREA ms 2000 2001 2002 2003 2004 2005 2006 2007 2008 2009 2010
5 EU FRA 952552 991663 4018388 1231117 1203179 992021 981544 1177248 947792 947792 381100GER 4851 4942 60375 12742 2600IRL 1800NED 228862 14014 117600 175353 80010 31618 11453 33971 6600UK 218768 330610 170210 187245 250636 59416 23658 296 11228 20837 41132
Total 1171320 1552935 4202612 1540813 1634110 1191822 1049562 1191597 992991 968629 428832
Table 3.3.6.2 Deep Sea Effort (kwdays) 2000-2010 by country ICES Area V (non EU)AREA ms 2000 2001 2002 2003 2004 2005 2006 2007 2008 2009 2010
5 non EU FRA 113443 696775 1835624 664525 776742 381706 325531 294664 219992 219992 44400GER 256560 194758 446140 274286 23400 7281 103500 385062NED 7260 271601 15850 154495 26765 47559 7428UK 825086 977943 1067328 917320 1071860 885811 422340 272851 114920 128263 232011
Total 938529 1681978 2902952 2110006 2059210 1868152 1048922 638474 342193 451755 668901
Table 3.3.6.3 Deep Sea Effort (kwdays) 2000-2010 by gear and country ICES Area V (EU)Area Gear ms 2 0 0 0 2 0 0 1 2 0 0 2 2003 2004 2005 2006 2007 2008 2009 2 0 1 0
5 EU BEAM FRA 1519 12288BOTTOM TRAWLS FRA 868648 959279 3653332 1195742 1102571 921365 927080 1111008 793232 793232 381100
IRL 1800UK 74165 96718 75712 57191 84681 14667 15854 296 11228 20837 37747
GILL FRA 83904 32384 365056 33856 88320 70656 54464 66240 154560 154560GER 4851UK 140735 233104 86980 130054 106655 41530 7804
LONGLINE UK 778 788 3219 3385PELAGIC TRAWLS GER 4942 60375 12742 2600
NED 228862 14014 117600 175353 80010 31618 11453 33971 6600UK 3090 7518 59300
Total 1171320 1552935 4202612 1540813 1634110 1191822 1049562 1191597 992991 968629 428832
29

Table 3.3.6.4 Deep Sea Effort (kwdays) 2000-2010 by gear and country ICES Area V (non EU)Area Gear ms 2 0 0 0 2 0 0 1 2 0 0 2 2003 2004 2005 2006 2007 2008 2009 2 0 1 0
5 non EU BEAM FRA 6077 7400BOTTOM TRAWLS FRA 113443 696775 1835624 658448 769342 381706 325531 294664 219992 219992 44400
GER 256560 174990 339900 249060 7281 103500 385062UK 825086 977943 1067328 917320 1071860 885811 422340 272851 114920 128263 232011
PELAGIC TRAWLS GER 19768 106240 25226 23400NED 7260 271601 15850 154495 26765 47559 7428
Total 938529 1681978 2902952 2110006 2059210 1868152 1048922 638474 342193 451755 668901
Area 5 EU, by gear, KWdays Area 5 non EU, by gear, KWdays
•-O- gili
-e " pelagic trawls
f l — .
2000 2002 2004 2006 2008 201 0
pelagic trawls
Figure 3.3.6.1 Deep Sea Effort (kwdays) 2000-2010 by gear for ICES Area V (EU) and V (non EU). Due to the uncertainty in French 2002 data this year has been removed from the figure.
Catch and catch composition
Area V (EU)
Bottom trawls provides the majority of catches from this area (Figure 3.3.6.2, Table 3.3.6.5). The main species targeted are roundnose grenadier and blue ling, with smaller catches of black scabbard, leafscale guiper sharks, and regular catches of roughhead grenadier and blue mouth redfish. In 2010 Scotland reported landings of greater silver smelt and France both Portuguese dogfish and black dogfish.
Gili nets catch small amounts, less than 10 tonnes, of blue ling, and in the early part of the time series caught deepwater red crab, Chaceon affinis but this ended in 2006. Netherland pelagic trawlers landed greater silver smelt in 2004 and 2005 but nothing since.
Beam trawl data from 2003 and 2004 may be misclassified bottom trawl data.
Area V (non EU)
Landings are solely provided by bottom trawls (Figure 3.3.6.3, Table 3.3.6.6). The main species landed are blue ling and roundnose grenadier. However since 2006 there has been a significant reduction in the grenadier landings and now the majority of the landings is blue ling. France also
30

records regular landings of black scabbard. Scottish landings of Portuguese dogfish ceased in 2005 but in 2010 France reported landings for both Portuguese dogfish and black dogfish.
Again there is a possible issue of misclassified beam trawl data.
Tables 3.3.6.5 and 3.3.6.6 show the top 5 deepwater species landed in Area VI. The ranking is based according to the average of the landings of the last three years of the time series.
Table 3.3.6.5 Table of the Top 5 Deepwater species landed in ICES Area V (EU)area species 2003 2004 2005 2006 2007 2008 2009 20105 eu BLI 895 859 643 647 806 591 590 3595 eu RNG 657 682 706 747 769 404 404 3095 eu BSF 144 81 71 75 96 145 145 1115 eu ARU 1 42 27 NA NA NA NA 405 eu CFB NA NA NA NA NA NA NA 38
Table 3.3.6.6 Table of the Top 5 Deepwater species landed in ICES Area V (non EU)area species 2003 2004 2005 2006 2007 2008 2009 2010non eu BLI 345 370 257 240 478 365 434 304non eu RNG 385 380 226 128 93 44 45 22non eu BSF 35 82 55 17 20 14 15 41non eu CYO 1 7 8 NA NA NA NA 18non eu CFB NA NA NA NA NA NA NA 13
31

sppa
nx
Lan dings c o m p o s i t io n s f o r t h e m ost important d e e p s e a s p e c i e sin an n e x 1 and 2
20 0 4 2006
BO TTO M T R A W LS
2 0 0 4 2006 2 008 2010
1-ALF
1-ARU 1-BLI
1-BSF 1-CFB 1-CYO
1-CYP ■ 1-DCA 1-ETR 1-FOX
1-GUP 1-GUQ 1-ORY ■ 1-RNG ■
1-SCK ■
1-SHO1-SYR ■2-BRF
2-COE2-EPI
2-KEF 2-RHG 2-SBR
2-SFS ' 2-WRF
O O • • • • • • • •
O O • • • • • • • •
PELAGIC TRAWLS
GO
o GO
o oo
C O
1-ALF1-ARU
1-BLI1-BSF1-CFB1-CYO
1-CYP1-DCA1-ETR1-FOX
1-GUP1-GUQ
1-ORY1-RNG1-SCK
1-SHO1-SYR2-BRF 2-COE
2-EPI 2-KEF 2-RHG 2-SBR
2-SFS
2-WRF
40 %
20 %
p re s e n t
[0.10)t
[10,100)t
>1 oot
2 0 0 4 2000 2008 2 0 0 4 2 006 2008 2010
Figure 3.3.6.2 Catches of Annex 1&2 Deep Sea species (tonnes) 2003-2010 by gear ICES Area V (EU)
32

sppa
nx
Lan dings c o m p o s i t io n s f o r t h e m ost important d e e p s e a s p e c i e sin an n e x 1 and 2
BO TTO M T R A W LS1-ALF
1-ARU 1-BLI
1-BSF 1-CFB 1-CYO
1-CYP ■ 1-DCA 1-ETR 1-FOX
1-GUP 1-GUQ 1-ORY ■ 1-RNG ■
1-SCK ■
1-SHO1-SYR ■2-BRF
2-COE2-EPI
2-KEF 2-RHG 2-SBR
2-SFS ' 2-WRF
OO
PELAGIC TRAWLS
O 1-ALF1-ARU
1-BLI1-BSF1-CFB1-CYO
1-CYP1-DCA1-ETR1-FOX
1-GUP1-GUQ
1-ORY1-RNG1-SCK
1-SHO1-SYR2-BRF 2-COE
40 %
20 %
p re s e n t
[0.10)t
[10,100)t
>1 oot
2 -K E F 2-RHG 2-SBR
2-SFS
2-WRF
Figure 3.3.6.3 Catches of Annex 1&2 Deep Sea species (tonnes) 2003-2010 by gear ICES Area 5 (non EU)
33
3.3.7. Deep Sea ICES Area VI
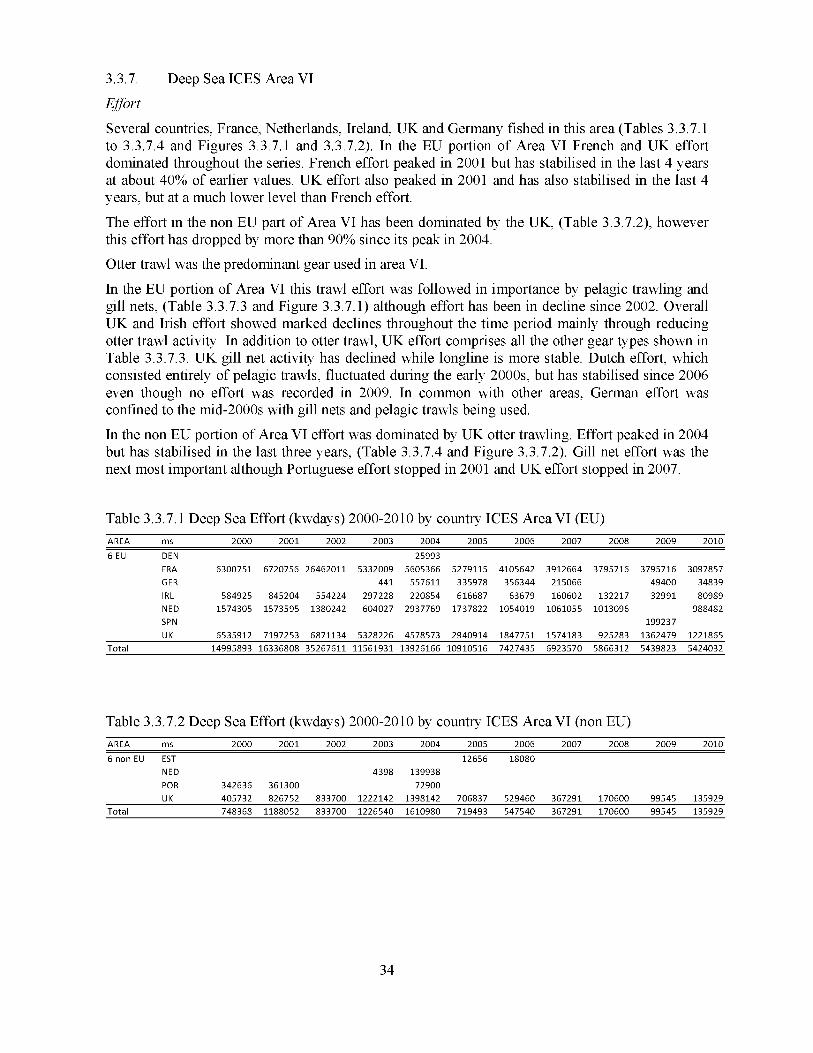
Effort
Several countries, France, Netherlands, Ireland, UK and Germany fished in this area (Tables 3.3.7.1 to 3.3.7.4 and Figures 3.3.7.1 and 3.3.7.2). In the EU portion of Area VI French and UK effort dominated throughout the series. French effort peaked in 2001 but has stabilised in the last 4 years at about 40% of earlier values. UK effort also peaked in 2001 and has also stabilised in the last 4 years, but at a much lower level than French effort.
The effort in the non EU part of Area VI has been dominated by the UK, (Table 3.3.12), however this effort has dropped by more than 90% since its peak in 2004.
Otter trawl was the predominant gear used in area VI.
In the EU portion of Area VI this trawl effort was followed in importance by pelagic trawling and gili nets, (Table 3.3.7.3 and Figure 3.3.7.1) although effort has been in decline since 2002. Overall UK and Irish effort showed marked declines throughout the time period mainly through reducing otter trawl activity. In addition to otter trawl, UK effort comprises all the other gear types shown in Table 33.1.3. UK gili net activity has declined while longline is more stable. Dutch effort, which consisted entirely of pelagic trawls, fluctuated during the early 2000s, but has stabilised since 2006 even though no effort was recorded in 2009. In common with other areas, German effort was confined to the mid-2000s with gili nets and pelagic trawls being used.
In the non EU portion of Area VI effort was dominated by UK otter trawling. Effort peaked in 2004 but has stabilised in the last three years, (Table 3.3.7.4 and Figure 3.3.7.2). Gili net effort was the next most important although Portuguese effort stopped in 2001 and UK effort stopped in 2007.
Table 3.3.7.1 Deep Sea Effort (kwdays) 2000-2010 by country ICES Area VI (EU)AREA ms 2000 2001 2002 2003 2004 2005 2006 2007 2008 2009 2010
6 EU DEN 25993FRA 6300751 6720756 26462011 5332009 5605366 5279115 4105642 3912664 3795716 3795716 3097857GER 441 557611 335978 356344 215066 49400 34839IRL 584925 845204 554224 297228 220854 616687 63679 160602 132217 32991 80989NED 1574305 1573595 1380242 604027 2937769 1737822 1054019 1061055 1013096 988482SPN 199237UK 6535912 7197253 6871134 5328226 4578573 2940914 1847751 1574183 925283 1362479 1221865
Total 14995893 16336808 35267611 11561931 13926166 10910516 7427435 6923570 5866312 5439823 5424032
Table 3.3.1.2 Deep Sea Effort (kwdays) 2000-2010 by country ICES Area VI (non EU)AREA ms 2000 2001 2002 2003 2004 2005 2006 2007 2008 2009 2010
6 non EU ESTNEDPOR 342636 361300
4398 13993872900
12656 18080
UK 405732 826752 833700 1222142 1398142 706837 529460 367291 170600 99545 135929Total 748368 1188052 833700 1226540 1610980 719493 547540 367291 170600 99545 135929
34
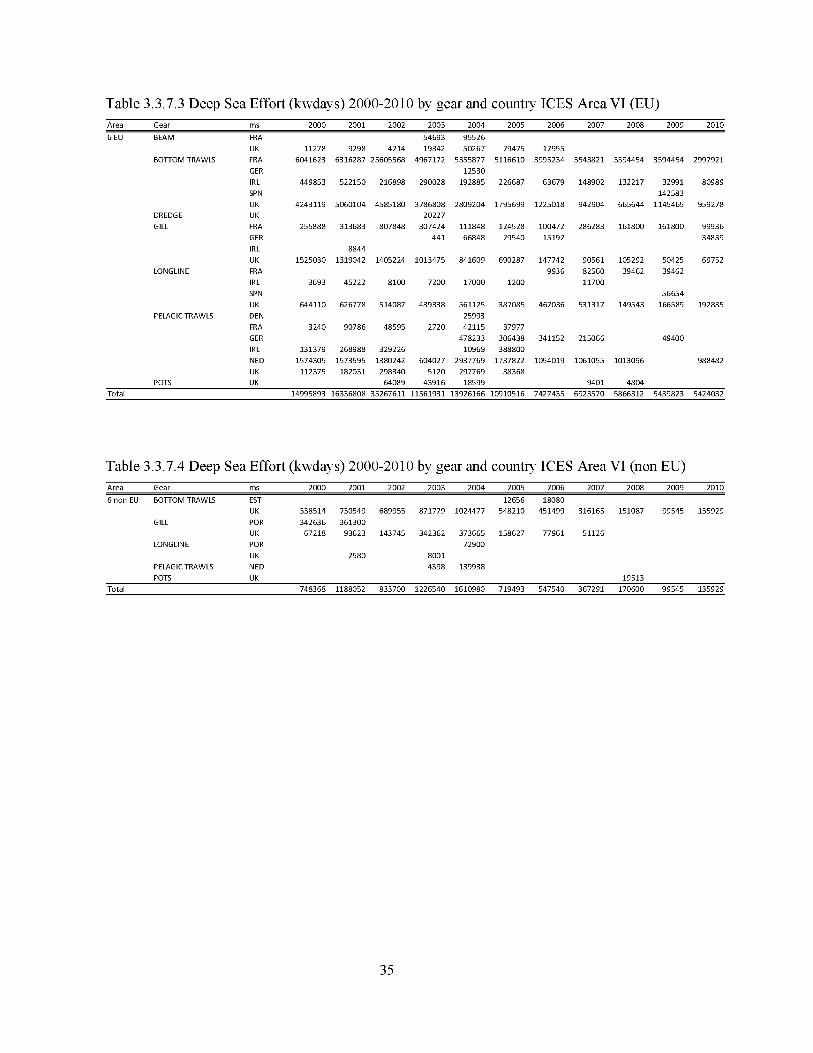
Table 3.3.7.3 Deep Sea Effort (kwdays) 2000-2010 by gear and country ICES Area VI (EU)Area Gear ms 2 0 0 0 2 0 0 1 2 0 0 2 2003 2004 2005 2006 2007 2008 2009 2 0 1 0
6 EU BEAM FRA 54693 95526UK 11278 9298 4214 19342 50267 29475 12955
BOTTOM TRAWLS FRA 6041623 6316287 25605568 4967172 5355877 5116610 3995234 3543821 3 5 9 4 4 5 4 3 5 9 4 4 5 4 2997921GER 12530IRL 449853 522150 216898 290028 192885 226687 63679 148902 132217 32991 80989SPN 142583UK 4243119 5060104 4585180 3786808 2809204 1795699 1225018 942904 665644 1145465 959278
DREDGE UK 20227GILL FRA 255888 313683 807848 307424 111848 124528 100472 286283 161800 161800 99936
GER 441 66848 29540 15192 34839IRL 8844UK 1525030 1319042 1405224 1013475 841609 690287 147742 90561 105292 50425 69752
LONGLINE FRA 9936 82560 39462 39462IRL 3693 45222 8100 7200 17000 1 2 0 0 11700SPN 56654UK 644110 626778 514087 439338 561125 387085 462036 531317 149543 166589 192835
PELAGIC TRAWLS DEN 25993FRA 3240 90786 48595 2720 42115 37977GER 478233 306438 341152 215066 49400IRL 131379 268988 329226 10969 388800NED 1574305 1573595 1380242 604027 2937769 1737822 1054019 1061055 1013096 988482UK 112375 182031 298340 5120 297769 38368
POTS UK 64089 43916 18599 9401 4804Total 14995893 16336808 35267611 11561931 13926166 10910516 7427435 6923570 5866312 5439823 5424032
Table 3.3.7.4 Deep Sea Effort (kwdays) 2000-2010 by gear and country ICES Area VI (non EU)Area Gear ms 2 0 0 0 2 0 0 1 2 0 0 2 2003 2004 2005 2006 2007 2008 2009 2 0 1 0
6 non EU BOTTOM TRAWLS EST 12656 18080UK 338514 730549 689955 871779 1024477 548210 451499 316165 151087 99545 135929
GILL POR 342636 361300UK 67218 93623 143745 342362 373665 158627 77961 51126
LONGLINE PORUK 2580 8001
72900
PELAGIC TRAWLS NED 4398 139938POTS UK 19513
Total 748368 1188052 833700 1226540 1610980 719493 547540 367291 170600 99545 135929
35

Area 6 EU, by gear, KWdays Area 6 non EU, by gear, KWdays
longlir■■Q" dredge
2000 2002 2004 2006 2008 201 0
Figure 3.3.7.1 Deep Sea Effort (kwdays) 2000-2010 by gear ICES Area VI (EU) and VI (non EU). Due to the uncertainty in French 2002 data this year has been removed from the figure.
Catch and catch composition
VI (EU)
Figure 3.3.7.2 shows aggregate catches in VI (EU) by gear. There is a mixed bottom trawl fishery targeting roundnose grenadier, blue ling and black scabbard. It is conducted mainly by France with small catches by Scotland. Of the other Annex 1 species Portuguese dogfish, leafscale guiper sharks and greater forkbeard are all landed consistently, albeit in small amounts. Of the Annex 2 species blue mouth redfish, conger eel and roughhead grenadier are also all landed regularly. Beam trawl landings of roundnose grenadier and blue ling, in 2003 and 2004, are probably misclassified.
Pelagic trawls, mainly Dutch, are targeting greater silver smelt although landings have started decreasing in recent years.
Longlines, in recent years, are primarily targeting greater forkbeard. Landings have increased in the last three years. There are also regular landings of blue mouth redfish and conger eel. Historically various species of shark were targeted but these landings have stopped since 2007.
In the early 2000s there were large landings of Portuguese dogfish by the UK using gili nets. Other sharks, such as leafscale guiper shark, were also targeted. These landings stopped in 2006. Scotland and England are currently using gili nets to target deep-water red crab, Chaceon affinis, with regular landings of 10 - 100 tonnes in the last few years. Landings were minimal for 2008 and 2009 but have increased in 2010. This species was also fished using pots up until 2008. In 2008 and 2009 landings of blue ling and roundnose grenadier were recorded.
VI (non EU)
Oher trawls in VI non EU are targeting blue ling, greater forkbeard and blue mouth redfish, but catches have been declining in recent years (Figure 3.3.7.3). Gili net landings, which were targeting deep-water red crab, Portuguese dogfish and greater forkbeard, ceased in 2007.
36

Tables 3.3.7.5 and 3.3.7.6 show the top 5 deepwater species landed in Area VI. The ranking is based according to the average of the landings of the last three years of the time series.
Table 33.1.5 Table of the Top 5 Deepwater species landed in ICES Area VI (EU)area species 2003 2004 2005 2006 2007 2008 2009 20106 eu BSF 3107 2859 2614 1814 2052 2373 2427 18016 eu BLI 2975 3287 2672 2565 2059 1717 1928 14506 eu RNG 5102 4651 2977 1949 1579 1440 1447 13086 eu FOX 547 313 179 155 176 120 286 1836 eu BRF 53 87 100 64 57 82 104 96
Table 33.1.6 Table of the Top 5 Deepwater species landed in ICES Area VI (non EU)area species 2003 2004 2005 2006 2007 2008 2009 2010non eu KEF 47 372 80 1 73 56 NA NAnon eu FOX 26 24 23 33 52 20 5 6non eu BLI 48 80 74 20 33 9 3 1non eu BRF 32 44 39 36 15 3 NA 1non eu ALC NA NA 61 82 NA NA NA NA
37

sppa
nx
Lan dings c o m p o s i t io n s f o r t h e m ost important d e e p s e a s p e c i e sin an n e x 1 and 2
1-ALF
1-ARU1-BLI
1-BSF1-CFB1-CYO
1-CYP1-DCA1-ETR1-FOX
1-GUP1-GUQ1-ORY1-RNG
1-SCK
1-SHO1-SYR2-BRF
2-COE2-EPI
2-KEF 2-RHG 2-SBR
2-SFS 2-WRF
o
• • o* * o
ÔCC
20 0 4 2 006 2008
BOTTOM TRAWLS
2 0 0 4 2006 2 008 2010
• • • • •
PELAG IC TR AW LS
O
ID
o o
• •
O O
•«3D- -C
-
-
100 %
- 80 %
- 60 %
- 40 %
- 20 %
p re s e n t
- 1-ALF- 1-ARU
- 1-BLI- 1-BSF- 1-CFB- 1-CYO [0,10)t
- 1-CYP- 1-DCA- 1-ETR
[10,100)t
- 1-FOX
- 1-GUP >1 oot- 1-GUQ
- 1-ORY- 1-RNG- 1-SCK
- 1-SHO- 1-SYR- 2-BRF- 2-COE
- 2-EPI- 2-KEF- 2-RHG- 2-SBR
- 2-SFS
- 2-WRF
2 0 0 4 2006 200 8 2010 2 0 0 4 2 006 2008 2010
Figure 3.3.7.2 Catches of Annex 1&2 Deep Sea species (tonnes) 2003-2010 by gear ICES Area VI (EU)
38

Lan dings c o m p o s i t io n s f o r t h e m ost important d e e p s e a s p e c i e sin a n n e x 1 and 2
20 0 4 2 006 200 8 2010 2 0 0 4 2006 2 008 2010
1-ALF
1-ARU1-BLI
1-BSF1-CFB1-CYO
1-CYP1-DCA1-ETR1-FOX
1-GUP1-GUQ1-ORY1-RNG
1-SCK
1-SHO1-SYR2-BRF
2-COE2-EPI
2-KEF 2-RHG 2-SBR
2-SFS 2-WRF
D
O
BOTTOM TRAWLS
OO ° ° o o o- - O -
occco o
O o ° o o
PELAG IC TR AW LS
o
O
’•CXO- 2 0 %
p r e s e n t
- 1-ALF- 1-ARU
- 1-BLI- 1-BSF- 1-CFB- 1-CYO [0 ,1 0 )t
- 1-CYP- 1-DCA- 1-ETR
[1 0 ,1 0 0 ) t
- 1-FOX
- 1-GUP >1 oot- 1-GUQ
- 1-ORY- 1-RNG- 1-SCK
- 1-SHO- 1-SYR- 2-BRF- 2-COE
- 2-EPI- 2-KEF- 2-RHG- 2-SBR
- 2-SFS
- 2-WRF
Oooo
oo
2 0 0 4 2006 200 8 2010 2 0 0 4 2 006 2008 2010
Figure 3.3.7.3 Catches of Annex 1&2 Deep Sea species (tonnes) 2003-2010 by gear ICES Area VI ( non EU)
39

3.3.8. Deep Sea ICES Area VII
Effort
Six countries supplied data indicating activity in this area (Tables 3.3.8.1 to 3.3.8.4), however there was only information for one year from Spain. Almost all of this effort took place in the EU part of Area VII (Tables 3.3.8.1 and 3.3.8.2). UK, France and Ireland were the predominant countries with the Netherlands also deploying effort in this area throughout the time series. Germany used a small amount in the mid-2000s.
This area has been broken up into Area VII (EU no Vlld), EU Vlld, and non EU. EU Vlld is the eastern English channel and is often associated with the North sea as much as the English channel.
Area VII EU no Vlld effort is primarily UK otter trawl effort, followed by France and Ireland. With the exception of France, effort used by each of the countries has declined by over 50% in the time period and this is particularly striking for the UK which has dropped from over 10 million KWdays to just under 3 million. French effort dropped in 2008 but has been relatively stable since. Irish effort has dropped to 3.5% of its peak in 2003. Overall, effort in 2010 was just over 30% of the reported value in 2000.
Area VII EU Vlld effort is from UK and France. Earlier effort from the Netherlands stopped in2004. The effort fluctuates greatly from year to year. 2006 marks a change in effort from English beam to Scottish bottom trawl (Figure 3.3.8.2).
Area VII non EU effort was confined to the UK and stopped in 2004. It was made up of bottom trawling and gili netting.
Table 3.3.8.4 and Figure 3.3.8.1 and 3.3.8.2 shows trends in effort by country and by main gears illustrating that otter trawls, longlines and gili nets were the most frequently used gears. UK also recorded effort by beam trawls and trammel nets but both have declined considerably. In general the declines in effort reported above are evident in most gears, however longline effort by France has generally increased over the time period and that of the UK increased up to 2008 before decreasing again. Gili net effort in France and the UK has been declining since reaching a peak in 2004. The Netherlands was responsible for most of the pelagic trawling. This effort fluctuated between 2000 and 2005, and became intermittent at low levels after that. However the Netherlands has reported quite high effort again for 2010.
Table 3.3.8.1 Deep Sea Effort (kwdays) 2000-2010 by country ICES Area VII (EU no Vlld)AREA ms 2000 2001 2002 2003 2004 2005 2006 2007 2008 2009 2010
7 EU no 7d FRA 2029867 2388719 7738371 1544420 1236669 1591217 1633554 1424224 992530 981979 965551GER 111935 318242 344403 8398IRL 1576450 2867608 3033612 3113903 2326743 2157787 1128283 775290 602643 128419 108979NED 1146962 219372 535722 150544 636250 299936 22652 53536 482503SPN 374808UK 10045990 8779217 8495761 7416387 7135728 6434736 4853687 5235798 4228708 2823796 2999309
Total 14799269 14254916 19803466 12337189 11653632 10828079 7638176 7443710 5877417 4309002 4556342
40
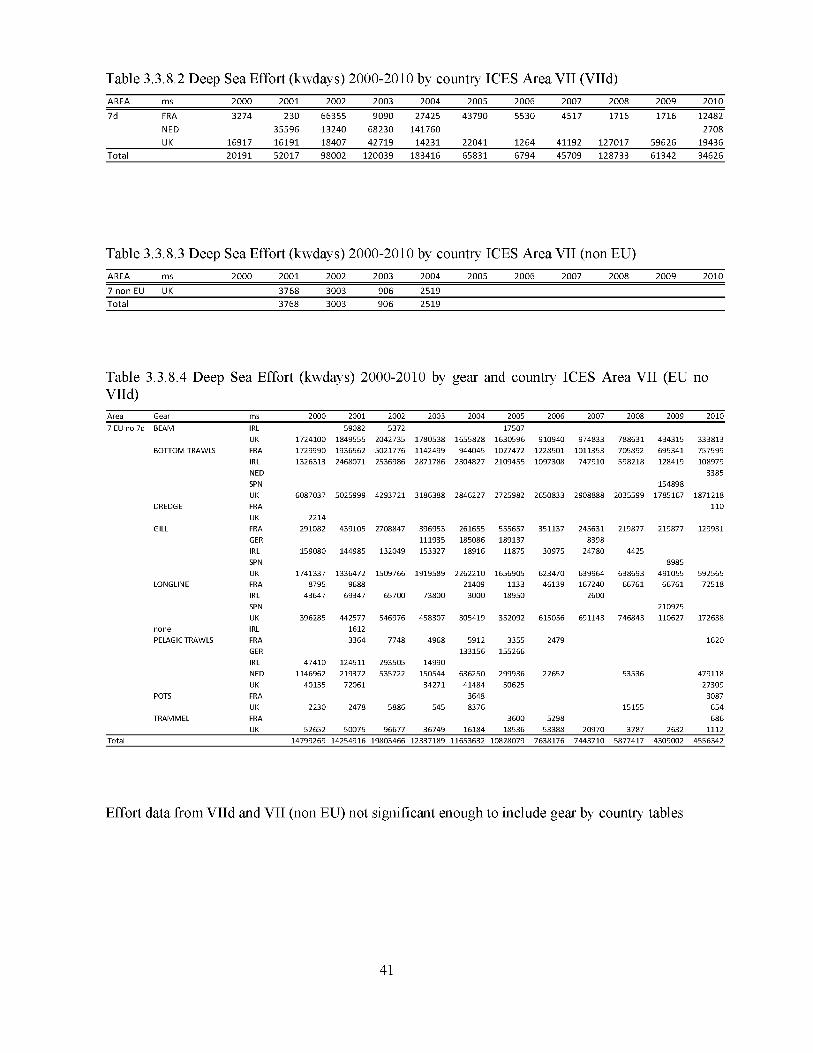
Table 3.3.8.2 Deep Sea Effort (kwdays) 2000-2010 by country ICES Area VII (Vlld)AREA ms 2000 2001 2002 2003 2004 2005 2006 2007 2008 2009 2010
7d FRA 3274 230 66355 9090 27425 43790 5530 4517 1716 1716 12482NED 35596 13240 68230 141760 2708UK 16917 16191 18407 42719 14231 22041 1264 41192 127017 59626 19436
Total 20191 52017 98002 120039 183416 65831 6794 45709 128733 61342 34626
Table 3.3.8.3 Deep Sea Effort (kwdays) 2000-2010 by country ICES Area VII (non EU)AREA ms 2000 2001 2002 2003 2004 2005 2006 2007 2008 2009 2010
7 non EU UK 3768 3003 906 2519Total 3768 3003 906 2519
Table 3.3.8.4 Deep Sea Effort (kwdays) 2000-2010 by gear and country ICES Area VII (EU Vlld)
no
Area Gear ms 2 0 0 0 2 0 0 1 2 0 0 2 2003 2004 2005 2006 2007 2008 2009 2 0 1 0
7 EU no 7d BEAM IRL 59082 5372 17507UK 1724100 1849555 2042735 1780538 1655828 1630596 910940 974833 788631 434315 333813
BOTTOM TRAWLS FRA 1729990 1936562 5021776 1142499 944045 1027472 1228501 1011353 705892 695341 757599IRL 1326313 2468071 2536986 2871786 2304827 2109455 1097308 747910 598218 128419 108979NED 3385SPN 154898UK 6087037 5025999 4293721 3186388 2846227 2725982 2650833 2908888 2035599 1785167 1871218
DREDGE FRA 1 1 0
UK 2214GILL FRA 291082 439105 2708847 396953 261655 555657 351137 245631 219877 219877 129931
GER 111935 185086 189137 8398IRL 159080 144985 132049 153327 18916 11875 30975 24780 4425SPN 8985UK 1741337 1336472 1509766 1919589 2262210 1656905 623470 639964 638693 491055 592565
LONGLINE FRA 8795 9688 21409 1133 46139 167240 66761 66761 72518IRL 43647 69347 65700 73800 3000 18950 2600SPN 210925UK 396285 442577 546976 458307 305419 352092 615056 691143 746843 110627 172638
none IRL 1612PELAGIC TRAWLS FRA 3364 7748 4968 5912 3355 2479 1620
GER 133156 155266IRL 47410 124511 293505 14990NED 1146962 219372 535722 150544 636250 299936 22652 53536 479118UK 40135 72061 34271 41484 50625 27309
POTS FRA 3648 3087UK 2230 2478 5886 545 8376 15155 654
TRAMMEL FRA 3600 5298 6 8 6
UK 52652 50075 96677 36749 16184 18536 53388 20970 3787 2632 1 1 1 2
Total 14799269 14254916 19803466 12337189 11653632 10828079 7638176 7443710 5877417 4309002 4556342
Effort data from Vlld and VII (non EU) not significant enough to include gear by country tables
41

Area 7 EU no 7d, by gear, KWdays
■■Q" dredge
Area 7d, by gear, KWdays
gili
Figure 3.3.8.1 Deep Sea Effort (kwdays) 2000-2010 by gear ICES Area VII (EU no Vlld) and (EU Vlld). Due to the uncertainty in French 2002 data this year has been removed from the figure.
Catch and catch composition
Area VII EU no Vlld
Longlines were originally responsible for landing sharks but this stopped in 2007. The main landings for this fishery were conger eel but landings have decreased in the last few years. This has been replaced by an increase in landings of blue mouth redfish and greater forkbeard.
The bottom trawl fishery produced a wide variety of landings. France and Ireland were targeting roundnose grenadier and black scabbard. Landings of grenadier started to decrease after 2007 while black scabbard landings stayed higher until 2010. This fishery also reports catches for roughhead grenadier, Portuguese dogfish and cardinal fish. The cardinal fish catches were probably connected with the historic orange roughy fishery. Reported landings of orange roughy fishery ceased in 2005. Reported landings of Portuguese dogfish ceased after 2007 but were reported again in 2010. The trawl fishery conducted by Spain, England and Scotland reported catches mainly of conger eel, greater forkbeard and red seabream. While UK longline catches of conger eel have been decreasing in recent years, trawl catches have been on the increase. Greater forkbeard landings started to decrease in 2008 while catches of conger eel increased with 2010 producing the largest landings of the time series. Other species reported annually are blue ling, blue mouth redfish and alfonsinos, although landings are small.
The beam trawl fishery is conducted primarily by England. The main landings are conger eel but landings have begun to decrease in recent years. Small amounts of greater forkbeard are also landed.
Gili nets targeted sharks early on but the only shark species with reported landings after 2006 is Portuguese dogfish. Landings of deep-water red crab decreased after 2007 but have increased again in 2010. There was an increase in landings of blue ling, blue mouth redfish and wreckfish up to 2009 but these have since declined. Landings of greater forkbeard have been increasing since 2007.
Pelagic trawling for greater silver smelt stopped in 2005, although the Netherlands restarted the fishery in 2010.
42

Area Vlld
The catch data provided are very sparse. In recent years otter trawls were catching small amounts of red seabream, and 2 tonnes of kitefin shark was reported for 2010. Small catches of conger eel, less than 10 tonnes, were reported for longlines in 2008 and 2009.
Area VII non EU
No information reported after 2004
Tables 3.3.8.5 and 3.3.8.6 show the top 5 deepwater species landed in Area VII EU. The ranking is based according to the average of the landings of the last three years of the time series.
Table 3.3.8.5 Table of the Top 5 Deepwater species landed in ICES Area VII (EU no Vlld)
area species 2003 2004 2005 2006 2007 2008 2009 20107 eu no 7d COE 678 572 497 380 295 217 147 1467 eu no 7d BSF 342 375 198 359 199 124 125 847 eu no 7d FOX 669 543 487 304 196 142 107 677 eu no 7d RNG 358 261 178 326 167 84 83 367 eu no 7d BRF 46 44 68 72 58 60 68 53
Table 3.3.8.6 Table of the Top 4 Deepwater species landed in ICES Area Vlldarea species 2003 2004 2005 2006 2007 2008 2009 20107d SBR NA NA NA NA 1 10 10 47d COE NA NA NA NA NA 7 6 NA7d SCK NA NA NA NA NA NA NA 27d BLI NA NA NA NA NA NA NA NA7d BSF 1 2 NA NA NA NA NA NA
43

Lan dings c o m p o s i t io n s f o r t h e m ost important d e e p s e a s p e c i e sin a n n e x 1 and 2
1-ALF
1-ARU1-BLI
1-BSF1-CFB1-CYO
1-CYP1-DCA1-ETR1-FOX
1-GUP1-GUQ1-ORY1-RNG
1-SCK
1-SHO1-SYR2-BRF
2-COE2-EPI
2-KEF 2-RHG 2-SBR
2-SFS 2-WRF
xoiocrc
o OO
7 EU NO 7DBOTTOM TRAWLS
Ü O #
PELAGIC TRAWLS
9°0 C
— i----------- 1----------- 1----------- r2 0 0 4 2000 200 8 2010
“ I-------------- 1-------------- 1-------------- T
C
o o
• • •
• •
o o *o o o
o O ° o
o
o
o
- 2 0 %
present
- 1-ALF- 1-ARU
- 1-BLI- 1-BSF- 1-CFB- 1-CYO [0 ,1 0 )t- 1-CYP- 1-DCA- 1-ETR
[1 0 ,1 0 0 )t
- 1-FOX
- 1-GUP >1 oot- 1-GUQ
- 1-ORY- 1-RNG- 1-SCK
- 1-SHO- 1-SYR- 2-BRF- 2-COE
- 2-EPI- 2-KEF- 2-RHG- 2-SBR
- 2-SFS
- 2-WRF
oooo
oo
2 0 0 4 2 006 2008 2010
Figure 3.3.8.2 Catches of Annex 1&2 Deep Sea species (tonnes) 2003-2010 by gear ICES Area VII (EU no Vlld)
44

3.3.9. Deep Sea ICES Area VIII
Effort
Most of the effort in this area was contributed by three countries as shown in Tables 3.3.9.1 and 3.3.9.2, (Spain only reported data for one year). Almost all of this effort took place in the EU part of Area VIII (Table 3.3.9.1). UK, France and Netherlands were the predominant countries with small amounts from Ireland and Germany. Netherlands effort declined to zero in 2007, but was restarted in 2010. UK and French effort increased to the mid 2000s but has since declined. Overall, effort in 2010 was 80% of the reported value in 2000.
Table 3.3.9.3 and Figure 3.3.9.1 shows trends in effort by country and by main gears illustrating that otter trawls were the most important followed by pelagic trawls, gili nets and longlines. In general the pattem of peak effort in the mid 2000s followed by decline is evident in all gears. There was a peak of effort in both bottom trawl and longlines in 2009 but this had decreased again in 2010 .
Bottom trawl was the predominant gear used in this region, with 92% of the effort reported by France. Netherlands effort comprised the majority of the pelagic trawling. Gili net effort was initially confined to France but since 2004 the UK has been contributing 50%. Over the time series the majority of the longline effort came from the UK, but Spain reported large effort for 2009.
Fishing effort in Area VIII non EU was minimal.
Table 3.3.9.1 Deep Sea Effort (kwdays) 2000-2010 by country ICES Area VIII (EU)AREA ms 2000 2001 2002 2003 2004 2005 2006 2007 2008 2009 2010
8 EU FRAGERIRL
206775
23400
198432 1221537
2500
289751 28727622626
572978 563460 330069 330114 326333 296990
NED 328154 200158 734687 49974 22284 26400 35596 67980POR 4069 9663 10329 1089SPN 971345UK 5971 20365 119176 87112 195594 131379 351815 108637 102356 29684 84663
Total 564300 418955 2081969 436500 538109 730757 950871 438706 433559 1327362 449633
Table 3.3.9.2 Deep Sea Effort (kwdays) 2000-2010 by country ICES Area VIII (non EU)AREA ms 2000 2001 2002 2003 2004 2005 2006 2007 2008 2009 2010
8 non EU UK 34994 5376Total 34994 5376
45

Table 3.3.9.3 Deep Sea Effort (kwdays) 2000-2010 by gear and country ICES Area VIII (EU)Area Gear ms 2 0 0 0 2 0 0 1 2 0 0 2 2003 2004 2005 2006 2007 2008 2009 2 0 1 0
8 EU BEAM UK 880BOTTOM TRAWLS FRA
PORSPNUK
141365 161208 999557 177729 229630 473093 424001 194049 2805991089
276818
285745
173738
6943GILL FRA
SPN53458 24366 88991 95204 53378 78282 117246 121418 20269 20269
12971928215
UK 2730 89612 67015 278374 57053 58969 29684 51073LONGLINE FRA
PORSPN
5379 10849 20544069 9663 10329
1417 2674 407 19486 19486
538568
76154
UK 5971 20365 63052 87112 105982 64364 73441 51584 41960 12761none SPN 11863PELAGIC TRAWLS FRA
GERIRL
3807
23400
116371
2500
822522626
7442 10239 6521 13619
NED 328154 200158 734687 49974 22284 26400 35596 67980SPN 5406UK 53394 13886
POTS FRA 1596 2464TRAMMEL FRA
SPNUK
2766 2009 14564 8593 4268 11148 9300 7674 9760
547
976044
2800
Total 564300 418955 2081969 436500 538109 730757 950871 438706 433559 1327362 449633
Area 8 EU, by gear, KWdays
V . 1
2000 2002 2004 2006 2008 2010
Figure 3.3.9.1 Deep Sea Effort (kwdays) 2000-2010 by gear ICES Area VIII (EU). Due to the uncertainty in French 2002 data this year has been removed from the figure.
Catch and catch composition
Most catches are taken in ICES areas VIII (EU) (Figure 3.3.9.2) with only small amounts being landed from Area VIII non EU by Portuguese longliners.
Two different bottom trawl fisheries are carried out. The French trawl fishery mainly catches black scabbard with small amounts of roundnose grenadier. Blue mouth redfish is a bycatch species in this fishery. Spanish data hasn’t been submitted yet but Spain is known to conduct a shallower trawl
46

fishery that takes deepwater shark, such as blackmouth dogfish, and greater forkbeard. Small amounts of conger eel and alfonsinos are also landed by bottom trawls in this area.
There is a small, but consistent, Spanish gili net fishery landing alfonsinos. Catches have been low but showed an increase in 2010. There is a Scottish fishery landing blue mouth redfish but apart from one large catch in 2008, landings have been small. Small amounts of conger eel and blue ling are also landed.
Conger eel provides the biggest component of the landings for the UK longline fishery. These landings have remained relatively constant throughout the time series until 2010. Spanish catches of Portuguese dogfish have decreased from their highest level in 2006. Spain landed large catches, > 100 tonnes, of blue mouth redfish in 2009. Low amounts of greater forkbeard are landed by both Spain and the UK although no landings were recorded for 2010. Other species landed historically include blackmouth dogfish, knifetooth dogfish and wreckfish.
French pelagic trawls land small amounts, less than 10 tonnes, of black scabbard and Spain landed blackmouth dogfish in 2008 and 2009.
Tables 3.3.9.4 shows the top 5 deepwater species landed in Area VIII EU. The ranking is based according to the average of the landings of the last three years of the time series.
Table 3.3.9.4 Table of the Top 5 Deepwater species landed in ICES Area VIII (EU)area species 2003 2004 2005 2006 2007 2008 2009 20108 eu COE 98 143 82 75 71 90 168 298 eu BRF 2 8 27 70 16 48 144 68 eu SHO 37 27 16 19 34 43 69 NA8 eu FOX 22 31 19 9 14 20 75 NA8 eu BSF 33 37 23 47 26 43 51 15
47
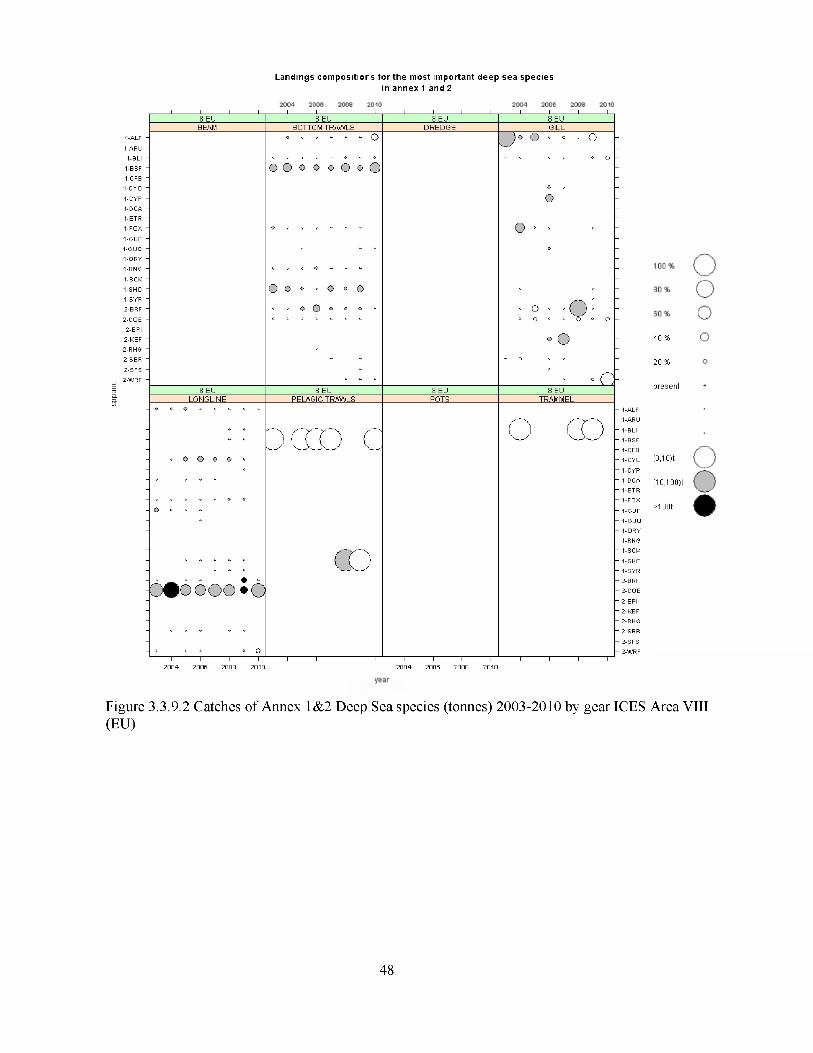
sppa
nx
Lan dings c o m p o s i t io n s f o r t h e m ost important d e e p s e a s p e c i e sin an n e x 1 and 2
EU EU EU EUBEAM BOTTOM TRAWLS DREDOE PILL
ALF
• BLI
BSFCFB
:K
BRF
l-EPI•KEF
•SFS
EU EU EU EULONGLINE PELAGIC TRAWLS POTS TRAMMEL
2 0 0 4 2000 2008 2 0 10 20 0 4 2006 2008 2010
1-ALF1-ARU
1-BLI1-BSF1-CFB1-CYO
1-CYP1-DCA1-ETR1-FOX
1-GUP1-GUQ
1-ORY1-RNG1-SCK
1-SHO1-SYR2-BRF 2-COE
2-EPI 2-KEF 2-RHG 2-SBR
2-SFS
2-WRF
40 %
20 %
present
[0 .1 0 )t
[1 0 ,1 0 0 )t
>1 oot
Figure 3.3.9.2 Catches of Annex 1&2 Deep Sea species (tonnes) 2003-2010 by gear ICES Area VIII (EU)
48

3.3.10. Deep Sea ICES Area IX
Effort
Most of the effort in area IX was contributed by Portugal as shown in Tables 3.3.10.1 and 3.3.10.2, (Spain only provided data for one year). Almost all of the effort took place in the EU part of Area IX (Table 3.3.10.1). Small amounts of effort were recorded by France and UK. Prior to 2003 recorded effort was quite low and the highest values occur recently. In the non EU part of Area IX effort peaked between 2003 and 2005 but has declined greatly since.
Tables 3.3.10.3 and 3.3.10.4, and Figure 3.3.10.1 show trends in effort by country and by main gears illustrating that Portuguese longline is the most important and that this gear is responsible for the overall trend.
Table 3.3.10.1 Deep Sea Effort (kwdays) 2000-2010 by country ICES Area IX (EU)AREA ms 2000 2001 2002 2003 2004 2005 2006 2007 2008 2009 2010
9 EU FRAPOR 40929 28032 15563 323445 254615 465091 820109 964352
1472859628
1472787838 628818
SPNUK 138797 11906
100673
Total 40929 28032 15563 323445 254615 465091 958906 976258 861100 889983 628818
Table 3.3.10.2 Deep Sea Effort (kwdays) 2000-2010 by country ICES Area IX (non EU)A R EA m s 2000 2001 2002 2003 2004 2005 2006 2007 2008 2009 2010
9 n o n EU PO R 39812 63800 40008 163067 63968 163069 3356 13187 43272 11581 3401Total 39812 63800 40008 163067 63968 163069 3356 13187 43272 11581 3401
Table 3.3.10.3 Deep Sea Effort (kwdays) 2000-2010 by gear and country ICES Area IX (EU)Area Gear m:; 2 0 0 0 200 1 2 002 2 0 0 ;I 2 004 2005 2006 2007 2 0 0 8 2009 201 0
9 EU BOTTOM TRAWLS PORSPN
9210 6122 6182 37237 63980 90887 133980 85031 10365888673
37393
DREDGE POR 89 74 89GILL FRA 1472 1472
POR 1477 5141 1859 3712 2956 4340 16061 12332 7604 2453UK 130733 11906
LONGLINE PORSPNUK
27976 22191 7582 309598 213345 393156 710169
4928
787845 734259 6679171 2 0 0 0
580377
PELAGIC TRAWLS POR 2 0 1 71 60 142 137POTS POR
UK428 1865 354 1541
31361331 3296 395 1 0 0
TRAMMEL POR 2266 272 3752 2168 4485 13038 25135 24568 8127 8406Total 40929 28032 15563 323445 254615 465091 958906 976258 861100 889983 i528818
Table 3.3.10.4 Deep Sea Effort (kwdays) 2000-2010 by gear and country ICES Area IX ( non EU)Area Gear ms 2 0 0 0 2 0 0 1 2 0 0 2 2003 2004 2005 2006 2007 2008 2009 2 0 1 0
9 non EU GILLLONGLINE
PORPOR
783231559
471859082
956530155
229162301 63968
1968159709 3356 13187 43272 11581 3401
PELAGIC TRAWLS TRAMMEL
PORPOR 421 288 537
1250142
Total 39812 63800 40008 163067 63968 163069 3356 13187 43272 11581 3401
49

Area 9 EU, by gear, KWdays
o
2000 2002 2004 2006 2008 2010
Area 9 non EU, by gear, KWdays
pelagic trawls
2000 2002 2004 2006 2008 2010
Figure 3.3.10.1 Deep Sea Effort (kwdays) 2000-2010 by gear ICES Area IX (EU) and IX (non EU)
Catch and catch composition
Figures 3.3.10.2 and 3.3.10.3 show catch composition. Catches by longline dominate in ICES IX EU and black scabbard is the most important species. Landings for this species have remained constant since 2007. In the past Portuguese dogfish and leafscale guiper sharks were a major bycatch of this fishery although landings have decreased in recent years, however since 2007 landings of knifetooth dogfish have increased significantly. There are also regular catches of conger eel.
The bottom trawl fishery, carried out by Spain and Portugal, mainly lands blackmouth dogfish although landings were very small in 2010.
Gili nets are a very minor fishery with small amounts of alfonsinos landed. In 2006 and 2007 large landings of deep-water red crab took place but these have not been repeated.
Catches from the non EU part of IX are all longline and comprise minor catches of conger eel and wreckfish. Early landings of guiper shark stopped by 2006. 12 tonnes of silver scabbard were landed in 2009. Blue mouth redfish and greater forkbeard are occasionally landed in small amounts.
Tables 3.3.10.5 and 3.3.10.6 show the top 5 deepwater species landed in the EU and non EU areas. The ranking is based according to the average of the landings of the last three years of the time series.
Table 3.3.10.5 Table of the Top 5 Deepwater species landed in ICES Area IX (EU)area species 2003 2004 2005 2006 2007 2008 2009 20109 eu BSF 423 43 1177 1937 2721 2856 2702 26809 eu SYR NA NA NA NA 66 107 76 1069 eu SHO 35 20 23 30 48 42 50 29 eu GUQ 134 74 196 319 161 61 16 19 eu COE 13 7 23 47 50 43 22 12
50

Table 3.3.10.6 Table of the Top 5 Deepwater species landed in ICES Area IX (non EU)area species 2003 2004 2005 2006 2007 2008 2009 2010
9 non eu SFS 5 5 1 NA NA NA 12 NA9 non eu COE 1 12 9 4 9 10 12 69 non eu WRF 3 15 4 1 9 12 6 19 non eu BRF NA NA NA 1 2 3 4 NA9 non eu FOX NA 1 4 NA NA 1 NA 1
Landings com positions f o r th e m ost im portant d e ep s e a s p e c ie s in annex 1 and 2
1-ALF -
1-ARU - 1-BLI -
1-BSF - 1-CFB - 1-CYO -
1-CYP - 1-DCA - 1-ETR - 1-FOX -
1-GUP - 1-GUQ -
1-ORY - 1-RNG -
1-SCK - 1-SHO -1-SYR -2-BRF -
2-COE -2-EPI -
2 -KEF - 2-RHO - 2-SBR -
2-SFS -
2-WRF -
BOTTOM TRAWLS
o
3300X0°
PELAGIC TRAWLS
oo
ooo XL
- 20 %
p re s e n t
- 1-ALF- 1-ARU
- 1-BLI- 1-BSF- 1-CFB- 1-CYO [0,10)t
- 1-CYP- 1-DCA- 1-ETR
[10,100)t
- 1-FOX
- 1-GUP >1 oot
- 1-GUQ- 1-ORY- 1-RNG- 1-SCK
- 1-SHO- 1-SYR- 2-BRF- 2-COE
- 2-EPI- 2-KEF
- 2-RHG- 2-SBR
- 2-SFS- 2-WRF
oooo
OO
Figure 3.3.10.2 Catches of Annex 1&2 Deep Sea species (tonnes) 2003-2010 by gear ICES Area IX (EU)
51

xuedds
Lan dings c o m p o s i t io n s f o r t h e m ost important d e e p s e a s p e c i e sin an n e x 1 and 2
9 NON EU 9 NON EU 9 NON EU 9 NON EUBEAM BOTTOM TRAWLS DRED G E GILL
ALF
-BLIBSFCFB
:TR
BRF
•EPI•KEF
• SFS
9 NON EU 9 NON EU 9 NON EU 9 NON EULONGLINE PELAGIC TRAWLS POTS TRAMMEL
O O O o 0
20082 0 0 4 2006 2 0 10 20 0 4 2006 2008 2010
1-ALF1-ARU
1-BLI1-BSF1-CFB1-CYO
1-CYP1-DCA1-ETR
1-FOX
1-GUP1-GUQ1-ORY1-RNG1-SCK
1-SHO1-SYR2-BRF 2-COE
2-EPI 2-KEF 2-RHG 2-SBR
2-SFS 2-WRF
40 %
20 %
p re s e n t
[0,10)t
[10,100)t
>1 oot
Figure 3.3.10.3 Catches of Annex 1&2 Deep Sea species (tonnes) 2003-2010 by gear ICES Area IX (non EU)
52

3.3.11. Deep Sea ICES Area X
Effort
Recordings of effort in ICES X are very small and more sporadic than other areas. Most of the effort in the non EU part of X is Portuguese longline, while Ireland and the UK record some effort from otter trawls (Table 3.3.11.1 and 3.3.11.2 and Figure 3.3.11.1). There has been no effort recorded in Area X EU since 2006.
Table 3.3.11.1 Deep Sea Effort (kwdays) 2000-2010 by country ICES A reaX (EU)AREA ms 2000 2001 2002 2003 2004 2005 2006 2007 2008 2009 2010
10 EU PORUK 12218
7517 15006
Total 12218 7517 15006
Table 3.3.11.2 Deep Sea Effort (kwdays) 2000-2010 by country ICES A reaX (non EU)AREA ms 2000 2001 2002 2003 2004 2005 2006 2007 2008 2009 2010
10 non EU IRLPORUK 18327
9929 6987 91883137826101
8656229555 8931 20388 2478
Total 18327 9929 6987 9188 57479 238211 8931 20388 2478
Area 10 non EU, by gear, KWdays
pelagic trawls
2000 2002 2004 2006 2008 2010
Figure 3.3.11.1 Deep Sea Effort (kwdays) 2000-2010 by gear ICES A reaX (non EU)
Catch and catch composition
Figure 3.3.11.2 show catch composition. There is little of note in the catches from this region. Bottom trawl catches in 2004 were for orange roughy landed by Ireland. Longline catches were originally guiper shark with some black scabbard. The most recent landings are for conger eel in 2009. Portugal recorded on big catch of alfonsinos from pelagic trawls in 2005.
Table 3.3.11.3 shows the top 4 deepwater species landed. The ranking is based according to the average of the landings of the last three years of the time series.
53

Table 3.3.11.3 Table of the Top 4 Deepwater species landed in ICES Area X (non EU)area species 2003 2004 2005 2006 2007 2008 2009 2010
10 non eu COE NA NA NA NA NA NA 1 NA10 non eu ALF NA NA 334 NA NA NA NA NA10 non eu BRF NA NA NA NA 1 NA NA NA10 non eu BSF NA NA 1 9 NA NA NA NA10 non eu CYO NA NA NA NA NA NA NA NA
Landings com positions f o r th e m ost im portant d e ep s e a s p e c ie s in annex 1 and 2
10 NON EU 10 NON EU 10 NON EU 10 NON EUBEAM BOTTOM TRAWLS DREDGE GILL
ALF
ARIIB LI
BSFCFBCYO
CYPDCAETRFOX
GUPGUQORYRNG
SCKSHOSYRBRF
•COE2-EPIl-KEF•RHG-SBR
Ï-SFS•WRF
10 NON EU 10 NON EU 10 NON EU 10 NON EULONGLINE PELAGIC TRAWLS POTS TRAMMEL
2 0 0 4 2006 2008 2010 20 0 4 2006 2008 2010
1-ALF 1-ARU
B LI
BSF CFB CYO
CYP DCA ETR FOX
GUP GUQ ORY RNG SCK
SHO SYR BRF COE
EPI KEF RHG SBR
SFS WRF
60 %
40 %
20 %
p r e s e n t
[0 ,1 0 )t
[1 0 ,1 0 0 ) t
oooo
OO
Figure 3.3.11.2 Catches of Annex 1&2 Deep Sea species (tonnes) 2003-2010 by gear ICES A reaX (non EU)
54

3.3.12. Deep Sea ICES Area XII
Effort
Overall effort from ICES XII is shown in Table 3.3.12.1. The UK recorded most effort throughout the series (mainly using otter trawl and gili net - Table 3.3.12.2 and Figure 3.3.12.1) although this has dropped markedly from 2006 onwards. Other countries contributing effort included Germany, Netherlands and Ireland. Spain provided effort for 2009 only indicating major bottom trawl effort, followed by pelagic trawls and other unspecified gears.
Table 3.3.12.1 Deep Sea Effort (kwdays) 2000-2010 by country ICES Area XII (non EU)AREA ms 2000 2001 2002 2003 2004 2005 2006 2007 2008 2009 2010
12 non EU ESTFRAGERIRLNEDPORSPN
2100029509
22932
1442063180
2712
9708
22944
28024 35328
2361476
5141
UK 60837 115481 116025 102568 49670 113809 2356 4480 9359Total 60837 115481 116025 153077 150202 149173 30380 39808 9359 2361476 5141
Table 3.3.12.2 Deep Sea Effort (kwdays) 2000-2010 by gear and country ICES Area XII (total)Area Gear ms 2 0 0 0 2 0 0 1 2 0 0 2 2003 2004 2005 2006 2007 2008 2009 2 0 1 0
12 non EU BOTTOM TRAWLS EST 2712 28024 35328FRA 5141IRL 28159SPN 1896092UK 54686 79013 49648 12768 3310 9255
GILL UK 6151 28073 64420 87514 46360 104554 2356LONGLINE IRL 1350
POR 63180UK 8395 1957
none SPN 241944PELAGIC TRAWLS GER 2 1 0 0 0 22932 9708
NED 14420 22944SPN 223440
POTS UK 2286 4480 9359Total 60837 115481 116025 153077 150202 149173 30380 39808 9359 2361476 5141
55

Area 12 non EU, by gear, KWdays
2000 2002 2004 2006 2008 201 0
Figure 3.3.12.1 Deep Sea Effort (kwdays) 2000-2010 by gear ICES Area XII (non EU)
Catch and catch composition
Figure 3.3.12.2 shows that trawl catches in the early years were mainly of roundnose grenadier with small amounts reported for 2010 by France. Orange roughy was landed by Ireland in 2003. Sporadic landings of blue ling and black scabbard were reported up to 2006, with France reporting a small catch of black scabbard for 2010.
Gili net catches of Portuguese dogfish, leafscale guiper shark and deep-water red crab by the UK ended in 2006.
Occasional pot landings of deep-water red crab ended in 2008.
Table 3.3.12.3 shows the top 5 deepwater species landed. The ranking is based according to the average of the landings of the last three years of the time series. The 2009 Spanish landing data has been excluded from Figure 3.3.12.2 as it is thought to be incomplete.
Table 3.3.12.3 Table of the Top 5 Deepwater species landed in ICES Area XII (non EU)area species 2003 2004 2005 2006 2007 2008 2009 2010
12 non eu RNG NA 4 20 27 140 NA 2273 212 non eu BLI 10 NA 21 1 7 NA 196 NA12 non eu BSF 1 1 NA 2 7 NA 86 212 non eu KEF 187 27 164 21 7 16 NA NA12 non eu CYO 76 94 60 1 NA NA 10 NA
56

sppa
nx
Lan dings c o m p o s i t io n s f o r t h e m ost important d e e p s e a s p e c i e sin an n e x 1 and 2
20 0 4 2006
12 NON EU 12 NON EU 12 NON EU 12 NON EUBEAM BOTTOM TRAWLS DREDOE PILL
• BLI
:K
•EPI
12 NON EU 12 NON EU 12 NON EU 12 NON EULONGLINE PELAGIC TRAWLS POTS TRAMMEL
2 0 0 4 2000 2008 2 0 10 20 0 4 2006 2008 2010
1 0 0 %
80 %
60 %
40 %
2 0 %
present
-ALF-ARU
-BLI-BSF-CFB-CYO [0 ,1 0 )t-CYP-DCA [1 0 ,1 0 0 )t-ETR-FOX
>1 oot-GUP-GUO
-ORY-RNG-SCK
-SHO-SYR-BRF-COE
-EPI-KEF-RHG-SBR
-SFS
-WRF
Figure 3.3.12.2 Catches of Annex 1&2 Deep Sea species (tonnes) 2003-2010 by gear ICES Area XII (non EU)
57

3.3.13. Deep Sea ICES Area XIV
Effort
Effort in ICES Area XIV (shown in Tables 3.3.13.1 and 3.3.13.2 and Figure 3.3.13.1) is mainly expended outside EU waters by Germany and the UK using otter trawls. UK effort peaked in the mid 2000s but has since declined while German effort rose in the mid 2000s and remains at a relatively high level. Spain reported otter trawl effort for 2009. German pelagic trawling stopped in2005.
Table 3.3.13.1 Deep Sea Effort (kwdays) 2000-2010 by country ICES Area XIV (non EU)AREA ms 2000 2001 2002 2003 2004 2005 2006 2007 2008 2009 2010
14 non EU GER 1067316 1975374 1349730 1248640 1427857 1719689 1960922 1694549POR 35100SPN 194085UK 289234 128310 179731 801239 609192 261337 143075 96501 250077 186300
Total 289234 128310 179731 1868555 2584566 1646167 1248640 1570932 1816190 2405084 1880849
Note: Effort by Germany and UK was all otter trawl
Table 3.3.13.2 Deep Sea Effort (kwdays) 2000-2010 by gear and country ICES Area XIV (non EU)Area Gear ms 2 0 0 0 2 0 0 1 2 0 0 2 2003 2004 2005 2006 2007 2008 2009 2 0 1 0
14 non EU BOTTOM TRAWLS GER 1016316 1963026 1232628 1248640 1427857 1719689 1960922 1694549SPN 194085UK 289234 128310 179731 801239 609192 261337 143075 96501 250077 186300
LONGLINE POR 35100PELAGIC TRAWLS GER 51000 12348 117102
Total 289234 128310 179731 1868555 2584566 1646167 1248640 1570932 1816190 2405084 1880849
Area 14 non EU, by gear, KWdays
2000 2002 2004 2006 2008 2010
Figure 3.3.13.1 Deep Sea Effort (kwdays) 2000-2010 by gear ICES Area XIV (non EU)
Catch and catch composition
The main species landed by bottom trawl, by Germany, is roundnose grenadier followed by occasional, small, landings of blue ling. Grenadier landings have remained constant through the time series. Germany also recorded occasional catches of black scabbard and orange roughy.
58

Table 3.3.13.3 shows the top 4 deepwater species landed. The ranking is based according to the average of the landings of the last three years of the time series.
Table 3.3.13.3 Table of the Top 4 Deepwater species landed in ICES Area XIV (non EU)area species 2003 2004 2005 2006 2007 2008 2009 2010
14 non eu BLI 6 7 18 NA NA 1 76 314 non eu RNG 42 27 12 18 19 17 27 3514 non eu BSF NA NA NA NA NA NA 1 NA14 non eu ORY NA 4 NA NA NA NA NA 114 non eu ALC NA NA NA NA NA NA NA NA
Landings com positions f o r th e m ost im portant d e ep s e a s p e c ie s in annex 1 and 2
1-ALF -
1-ARU - 1-BLI -
1-BSF - 1-CFB - 1-CYO -
1-CYP - 1-DCA - 1-ETR - 1-FOX -
1-GUP - 1-GUQ - 1-ORY - 1-RNG -
1-SCK - 1-SHO -1-SYR -2-BRF -
2-COE -2-EPI -
2 -KEF - 2-RHG - 2-SBR -
2-SFS - 2-WRF -
34<IjjX
O
BOTTOM TRAWLS
O
PELAGIC TRAWLS
- 2 0 %
present
- 1-ALF- 1-ARU
- 1-BLI
- 1-BSF- 1-CFB- 1-CYO [0 .1 0 )t- 1-CYP- 1-DCA- 1-ETR
[1 0 ,1 0 0 )t
- 1-FOX
- 1-GUP >1 oot
- 1-GUQ- 1-ORY- 1-RNG- 1-SCK
- 1-SHO- 1-SYR- 2-BRF- 2-COE
- 2-EPI- 2-KEF- 2-RHG- 2-SBR
- 2-SFS- 2-WRF
oooo
OO
2 006 2008
Figure 3.3.13.2 Catches of Annex 1&2 Deep Sea species (tonnes) 2003-2010 by gear ICES Area XIV (non EU)
59
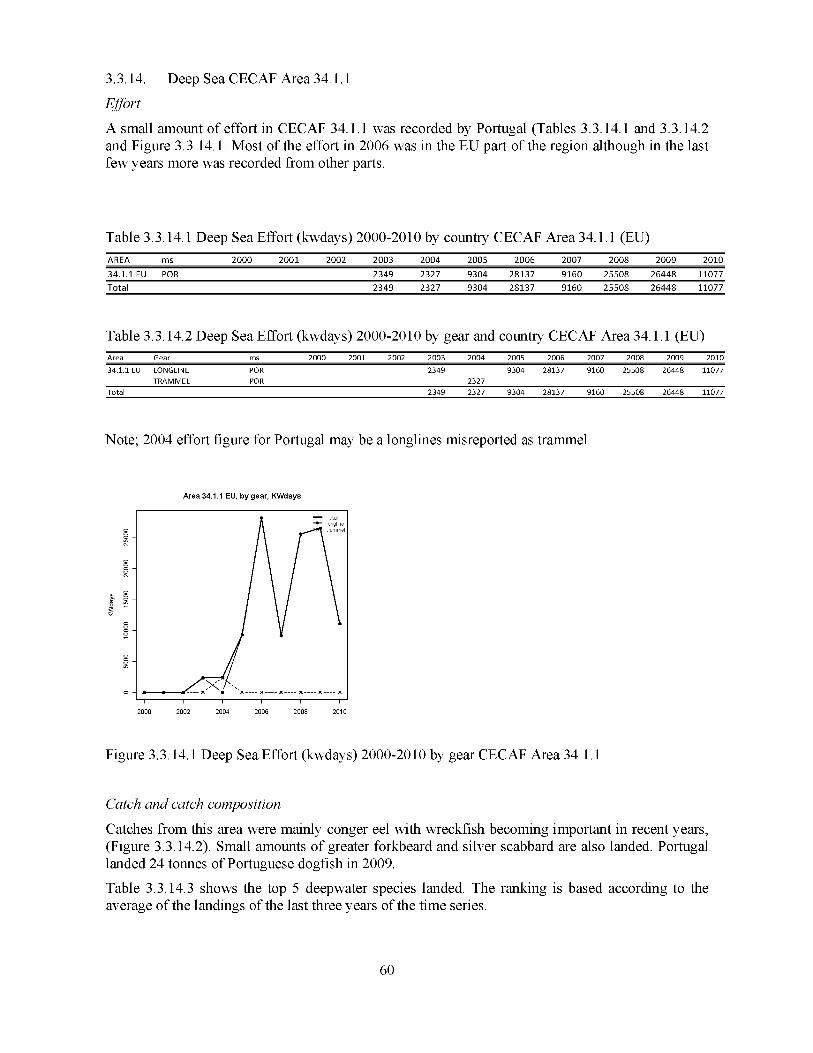
3.3.14. Deep Sea CECAF Area 34.1.1
Effort
A small amount of effort in CECAF 34.1.1 was recorded by Portugal (Tables 3.3.14.1 and 3.3.14.2 and Figure 3.3.14.1. Most of the effort in 2006 was in the EU part of the region although in the last few years more was recorded from other parts.
Table 3.3.14.1 Deep Sea Effort (kwdays) 2000-2010 by country CECAF Area 34.1.1 (EU)AREA ms 2000 2001 2002 2003 2004 2005 2006 2007 2008 2009 201034.1.1 EU POR 2349 2327 9304 28137 9160 25508 26448 11077Total 2349 2327 9304 28137 9160 25508 26448 11077
Table 3.3.14.2 Deep Sea Effort (kwdays) 2000-2010 by gear and country CECAF Area 34.1.1 (EU)Area Gear ms 2000 2001 2002 2003 2004 2005 2006 2007 2008 2009 2010
34.1.1 EU LONGLINETRAMMEL
PORPOR
23492327
9304 28137 9160 25508 26448 11077
Total 2349 2327 9304 28137 9160 25508 26448 11077
Note; 2004 effort figure for Portugal may be a longlines misreported as trammel
Area 34.1.1 EU, by gear, KWdays
2000 2002 2004 2006 2008 2010
Figure 3.3.14.1 Deep Sea Effort (kwdays) 2000-2010 by gear CECAF Area 34.1.1
Catch and catch composition
Catches from this area were mainly conger eel with wreckfish becoming important in recent years, (Figure 3.3.14.2). Small amounts of greater forkbeard and silver scabbard are also landed. Portugal landed 24 tonnes of Portuguese dogfish in 2009.
Table 3.3.14.3 shows the top 5 deepwater species landed. The ranking is based according to the average of the landings of the last three years of the time series.
60

Table 3.3.14.3 Table of the Top 5 Deepwater species landed in CECAF Area 34.1.1 (EU)area species 2003 2004 2005 2006 2007 2008 2009 2010
34.1.1 eu CYO NA NA NA NA NA NA 24 NA34.1.1 eu COE 2 NA 1 16 5 14 16 1134.1.1 eu WRF NA NA 1 16 6 15 11 334.1.1 eu FOX 1 NA NA 2 2 5 2 234.1.1 eu SFS NA NA NA NA NA 2 4 1
Landings com positions f o r th e m ost im portant d e ep s e a s p e c ie s in annex 1 and 2
1-ALF
1-ARU1-BLI
1-BSF1-CFB1-CYO
1-CYP1-DCA1-ETR1-FOX
1-GUP1-GUQ1-ORY1-RNG
1-SCK1-SHO1-SYR2-BRF
2-COE2-EPI
2-KEF 2-RHG 2-SBR
2-SFS 2-WRF
O
o O
O o o O O o ó
BOTTOM TRAWLS
PELAGIC TRAWLS1-ALF1-ARU
BLI
BSFCFBCYO
CYPDCAETRFOX
GUPGUQORYRNGSCK
SHOSYRBRFCOE
EPIKEFRHGSBR
SFSWRF
60 %
40 %
20 %
present
[0 ,1 0 )t
[1 0 ,1 0 0 )t
oooo
OO
Figure 3.3.14.2 Catches of Annex 1&2 Deep Sea species (tonnes) 2003-2010 by gear CECAF Area34.1.1 (EU)
61

3.3.15. Deep Sea CECAF Area 34.1.2
Effort
Up to 2010 all effort in CECAF 34.1.2 was in EU waters and recorded by Portugal, (No data was submitted to the group by Spain), (Table 3.3.15.1). Prior to 2010 there had been an increasing trend in effort in the EU area. In 2010 Portugal recorded a large amount of effort in the non EU waters of the area. Effort is all by longline.
Table 3.3.15.1 Deep Sea Effort (kwdays) 2000-2010 by country CECAF Area 34.1.2 (EU)AREA ms 2000 2001 2002 2003 2004 2005 2006 2007 2008 2009 201034.1.2 EU POR 8771 12191 6808 14909 19293 24163 11727Total 8771 12191 6808 14909 19293 24163 11727
Table 3.3.15.2 Deep Sea Effort (kwdays) 2000-2010 by country CECAF Area 34.1.2 (non EU)AREA ms 2000 2001 2002 2003 2004 2005 2006 2007 2008 2009 201034.1.2 non EU POR 619800Total 619800
Area 34.1.2 EU, by gear, KWdays Area 34.1.2 non EU, by gear, KWdays
1
2000 2002 2004 2006 2008 201 0
Figure 3.3.15.1 Deep Sea Effort (kwdays) 2000-2010 by gear CECAF Area 34.1.2 (EU) and 34.1.2 (non EU).
Catch and catch composition
The longline fishery in EU waters is landing small amounts of conger eel, wreckfish and greater forkbeard, Figure 3.3.15.2. In 2009 Portugal recorded a small landing of silver scabbard. In non EU waters Portugal reported landings for black scabbard, Figure 3.3.15.3.
62

Tables 3.3.15.3 and 3.3.15.4 show the top 5 deepwater species landed. The ranking is based according to the average of the landings of the last three years of the time series. NOTE: The 2010 Portuguese landing data for CECAF Area 34.1.2 (non EU) needs to be checked, there seems to be a scaling issue.
Table 3.3.15.3 Table of the Top 5 Deepwater species landed in CECAF Area 34.1.2 (EU)area species 2003 2004 2005 2006 2007 2008 2009 2010
34.1.2 eu SFS NA NA NA NA NA NA 11 NA34.1.2 eu COE NA 5 8 9 9 13 14 534.1.2 eu WRF NA 4 3 6 10 8 10 134.1.2 eu FOX NA NA NA NA 2 3 2 234.1.2 eu BRF NA NA NA 1 3 2 2 1
Table 3.3.15.4 Table of the Top 5 Deepwater species landed in CECAF Area 34.1.2 (non EU). NOTE 2010 data highly unreliable
area species 2003 2004 2005 2006 2007 2008 2009 20104.1.2 non e BSF NA NA NA NA NA NA NA 18603204.1.2 non e GUQ NA NA NA NA NA NA NA 2092674.1.2 non e EPI NA NA NA NA NA NA NA 29404.1.2 non e RIB NA NA NA NA NA NA NA 4584.1.2 non e CYO NA NA NA NA NA NA NA 260
63
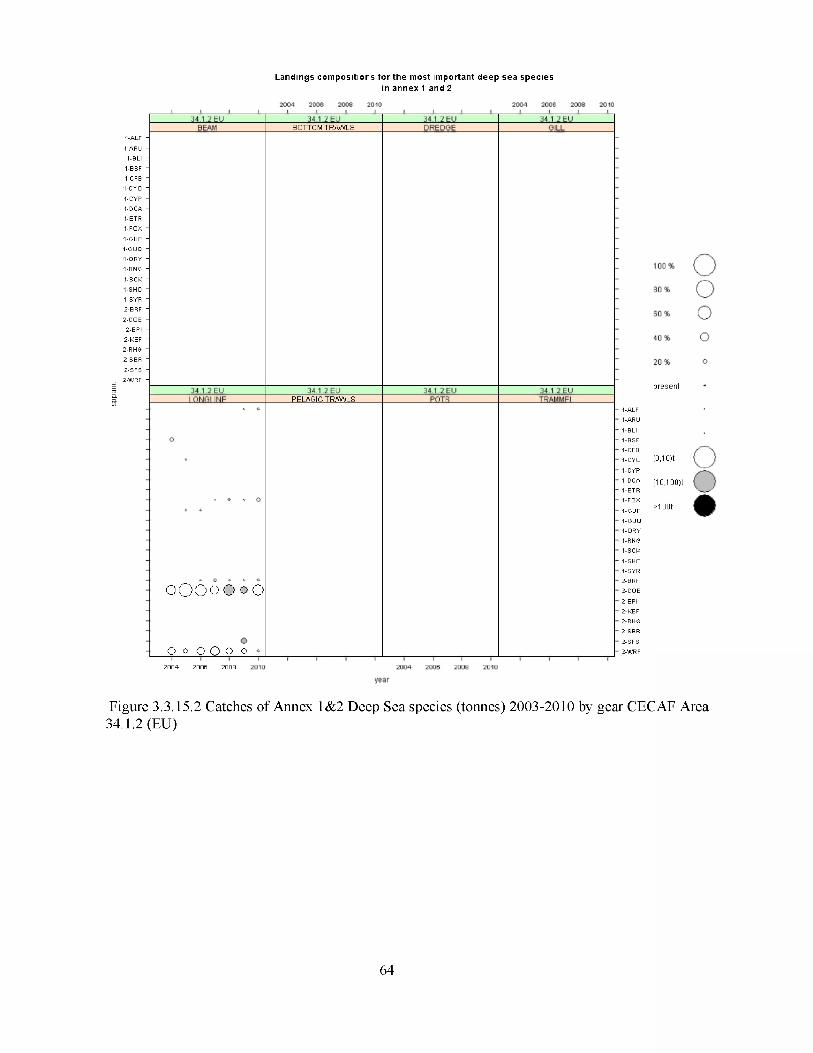
sppa
nx
Lan dings c o m p o s i t io n s f o r t h e m ost important d e e p s e a s p e c i e sin an n e x 1 and 2
1-ALF -
1-ARU - 1-BLI -
1-BSF - 1-CFB - 1-CYO -
1-CYP - 1-DCA - 1-ETR - 1-FOX -
1-GUP - 1-GUQ - 1-ORY - 1-RNG -
1-SCK -
1-SHO -1-SYR -2-BRF -
2-COE -2-EPI -
2 -KEF - 2-RHG - 2-SBR -
2-SFS - 2-WRF -
O O O o O o O
O O O O O o
BOTTOM TRAWLS
PELAGIC TRAWLS1-ALF1-ARU
1-BLI1-BSF1-CFB1-CYO
1-CYP1-DCA1-ETR1-FOX
1-GUP1-GUQ
1-ORY1-RNG1-SCK
1-SHO1-SYR2-BRF 2-COE
2-EPI 2-KEF 2-RHG 2-SBR
2-SFS
2-WRF
present
[0 .1 0 )t
[1 0 ,1 0 0 )t
>1 oot
2 0 0 4 2000 2008
Figure 3.3.15.2 Catches of Annex 1&2 Deep Sea species (tonnes) 2003-2010 by gear CECAF Area34.1.2 (EU)
64

sppa
nx
Lan dings c o m p o s i t io n s f o r t h e m ost important d e e p s e a s p e c i e sin an n e x 1 and 2
34.1.2 NUN EU
1-ALF -
1-ARU - 1-BLI -
1-BSF - 1-CFB - 1-CYO -
1-CYP - 1-DCA - 1-ETR - 1-FOX -
1-GUP - 1-GUQ - 1-ORY - 1-RNG -
1-SCK -
1-SHO -1-SYR -2-BRF -
2-COE -2-EPI -
2 -KEF - 2-RHG - 2-SBR -
2-SFS - 2-WRF -
34.1 .2 NON EU
3 4.1 .2 NON EU BOTTOM TRAWLS
3 4.1 .2 NON EU PELAGIC TRAWLS
34.1 .2 NON EU
3 4 .1 .2 NON EU
34.1 .2 NON EU
34.1 .2 NON EU
1-ALF1-ARU
1-BLI1-BSF1-CFB1-CYO
1-CYP1-DCA1-ETR1-FOX
1-GUP1-GUQ
1-ORY1-RNG1-SCK
1-SHO1-SYR2-BRF 2-COE
2-EPI 2-KEF 2-RHG 2-SBR
2-SFS
2-WRF
present
[0 .1 0 )t
[1 0 ,1 0 0 )t
>1 oot
Figure 3.3.15.3 Catches of Annex 1&2 Deep Sea species (tonnes) 2003-2010 by gear CECAF Area34.1.2 (non EU)
65

3.3.16. Deep Sea CECAF Area 34.1.3
Effort
Only a very small amount of deep sea effort was recorded in this area by the Netherlands and only in 2004. Netherlands effort was pelagic trawls. No data were submitted to the group by Spain.
Table 3.3.16.1 Deep Sea Effort (kwdays) 2000-2010 by country CECAF Area 34.1.3 (non EU)AREA ms 2000 2001 2002 2003 2004 2005 2006 2007 2008 2009 201034.1.3 non EU NED 22944Total 22944
Catches were too sparse to merit comment.
3.3.17. Deep Sea CECAF Area 34.2.0
There was no effort or catches in this area.
6 6
4 . W e s t e r n W a t e r s
4.1. Background
Details of the Western Waters regulations and its geographical extent can be found in the regulationCOUNCIL REGULATION (EC) No 1415/2004.
The EWG experienced extreme difficulties in preparing these data and the interpretation of them is confounded by uncertainty in the western waters data summaries for some member states most notably Portugal, France and Spain. SINCE THESE COUNTRIES OPERATE EXTENSIVELY IN THE WESTERN WATERS AREAS AND ARE LIKELY TO CONTRIBUTE A SIGNIFICANT PROPORTION TO THE OVERALL EFFORT COVERED BY THIS REGULATION, THE DATA SHORTFALL IMPLIES THAT OVERALL EFFORT FIGURES REMAIN UNRELIABLE.
The EWG database records effort in the areas covered by the Western waters regulation including effort which becomes categorised as ‘deep sea’. Since these two regulations are legislated to be non-overlapping, columns are included to show the western waters effort without the deep sea.
4.2. Fishing effort and catch composition in Western Waters
Effort and catch data under the Western Waters regulation is presented by a number of EU and non- EU areas. Where relevant these encompass breakdowns by country, gear and vessel length groups.
4.2.1. Western waters Area V
4.2.1.1. Area V EU
Effort
There is uncertainty relating to French effort. French effort in this region prior to 2009 appears to be seriously in error as negative values appear in the table. In addition effort values in 2002 are extremely high. Overall effort figures are therefore unreliable.
Overall effort within this area has declined over time, having previously been fished at relatively low levels by a number of nations utilising bottom and pelagic trawls, as well as a small amount of gillnet effort (Table 4.2.1.1.1. and Figure 4.2.1.1.1).
The majority of fishing effort within the area is directed toward fisheries not covered by the western waters regulation. In recent years, pelagic trawl effort has declined by around 80% from the highs of 2001-2004. Bottom trawling also occurs within the area, the majority of which targets deepwater fisheries. France has persisted as the dominant nation deploying effort, with more minor contributions from Scotland.
Catch composition
The majority of demersal species landings are associated with the deepwater fisheries taking place within the area.
67

The top five demersal species landed from V EU are detailed within Table 4.2.1.1.2 showing anglerfish (ANF) to have had the greatest landings in recent years. Anglerfish landings dropped dramatically from 270t in 2009 to just 3t in 2010. Landings of this species originate solely from France. Landings of all other species averaged across 2008 to 2010 are very low.
The primary pelagic species landed is blue whiting (WHB), with sporadic landings of mackerel (MAC) and horse mackerel (JAX) occurring (Table 4.2.1.1.3).
Small quantities of edible crab (CRE) were landed from this area prior to 2006 (Table 4.2.1.1.4).
Table 4.2.1.1.1. Effort (kWdays) by country, gear and vessel size group within Area V EU, 2004- 2010 .
Gear country length Effort Effort Deep0"18 Effort Effort Deer'"8 Effort Effort Deer'"8 Effort Effort Deer'"8 Effort Effort Deer'"8 Effort Effort Deer'"8 Effort Effort Deer'"8beam FRA 015m 12288 12288 0 0 0 0 0 0 0 0 0 0 0 0
r :E3825 1102571 -1098746 2208 921365 -919157 3521 927080 -923559 6350 1111008 -1104658 0 793232 -793232 793232 793232 0 381100 381100 0
dredge SCO 015m 0 ( 0 ( 0 ( 0 ( 0 ( 0 ( 0 0
GER
106655 106655 070656 70656 0 5.45. 5.45. 5 55.55 555.5 . 5.55 154560 154560 0 154560 154560 0 : : :
longi,ne ENG ol5m0 0 0
3219 3219 00 0 0 0 0 0 0 0 0
0 0 03681 3385 296
NED:E
341000 175353 165647 142740 80010 62730
ÏÏÏ 455.5
44686 11453 33233 48530 33971 14559 43560 0 43560 6600 6600 0
potsNbf
015m
1 1 I Ü A 1,4‘ 554 534trammel =RA 015m5 EU Total 796599 1634110 -837511 393166 1191822 -798656 258079 1049562 -791483 190086 1191597 -1001511 230765 992991 -762226 1030226 968629 61597 446513 428832 17681
Table 4.2.1.1.2. Top demersal species landed (tonnes) (average 2008-2010) within Area V EU, 2003-2010.area species Type 2003 2004 2005 2006 2007 2008 2009 20105 EU ANF L 44 242 297 196 157 255 270 35 EU POK L 36 28 28 21 15 NA 22 55 EU COD L 7 3 NA NA NA 4 NA NA5 EU BRF L NA NA NA NA NA NA 1 NA5 EU HAD L 27 4 1 2 NA NA 1 1
Table 4.2.1.1.3. Top pelagic species landed (tonnes) (average 2008-2010) within Area V EU, 2003- 2010 .
area species Type 2003 2004 2005 2006 2007 2008 2009 20105 EU WHB L 8939 3736 2309 1325 982 734 571 9225 EU MAC L 1005 2416 NA NA NA NA NA 115 EU JAX L 12 NA NA NA 366 NA NA NA
Table 4.2.1.1.4. Scallop and crab species by gear landed within Area V EU, 2003-2010. Values are landings in tonnes.A re a __________ G e a r ___________________S p e c ie s ___________ 2 0 0 3 2 0 0 4 2 0 0 5 2 0 0 6 2 0 0 7 2 0 0 8 2 0 0 9 2 0 1 0
5 EU D R E D G E S Œ Ö5 EU GILL C R E 5 3 4 85 EU P O T S C R E 2 12
6 8

A r e a 5 EU, b y g e a r , K W d a y s A r e a 5 EU, b y g e a r , K W d a y s
-O - dredge ■ ■ ^ g i l
2000 2002 2004 2006 2008 2010
o
2000 2002 2004 2006 2008 2010
Figure 4.2.1.1.1. kWdays effort reported within Area V EU by gear type, 2000-2010, with (left) and without (right) reported deepwater effort.
Catch composition of sp ecies in W estern Water a reas
2004 2006 2008 2010
WHS - WHB - SCK RNS RIB -
RHS - POK MAC - KEF -
HKE - HAD - SUQ - SUP FOX - CYO - CRE COD - CMO - CFB -
ARU ANF -
o o
o o
o o c m m o c c
o m c j
o
O O
o o
20 %
p re s e n t
WHS WHB SCK
' RNS RIB
' RHS POK
' MAC
SUQSURFOXCYOCRECODCMO
ARUANF
[U l IJU)I
[100,1000)tI IJIJ Lit
Figure 4.2.1.1.1. Landings composition by gear (countries combined) Western waters area V EU,2003-2010. Size of circles represents relative contribution to landings, shading indicates quantity.
69

4.2.1.2. Area V non EU
Effort
There is uncertainty relating to French effort. French effort in this region prior to 2009 appears to be seriously in error as negative values appear in the table. In addition effort values in 2002 are extremely high. Overall effort figures are unreliable.
Overall effort within this area has declined over time, having previously been fished by a number of nations utilising bottom and pelagic trawls (Table 4.2.1.2.1. and Figure 4.2.1.2.1).
The majority of fishing effort within the area is directed toward fisheries not covered by the western waters regulation. Bottom trawling is the primary gear within the area, much of which targets deepwater fisheries. Scotland has been the dominant nation deploying this effort. Pelagic trawl effort fluctuated between 2003-2005, since when effort has declined to nominal levels in 2009 and 2010, fishing was principally carried out by Denmark, the Netherlands, and Scotland.
Catch composition
The top five demersal species landed from V non EU are detailed within Table 4.2.1.2.2 showing saithe (POK) to contribute the biggest landings both as recent average and over the period available. Landings of this species had previously been declining prior to 2009 but have since begun to increase. Declining quantities of cod (COD) are also landed from this area, currently ranked second in importance. Anglerfish, haddock and whiting also occur in the current top five with variable landings. Haddock shows some signs of decline.
Blue whiting (WHB) is the sole pelagic species landed during the average (2008-2010) period used to rank the top five pelagic species (Table 4.2.1.2.3).
No landings of scallops or crabs were reported within this area.
Table 4.2.1.2.1. Effort (kWdays) by country, gear and vessel size group within Area V non EU, 2004-2010.
Gear country length Effort Effort Deep0"18 Effort Effort Deep0"18 Effort Effort Deep01"8 Effort Effort Deep01"8Effort Effort Deep Effort Effort Deep Effort Effort Deepbeam FRA ol5m 7400 0 0 0 0 0 0
SCO ol5m 0 0 0 C 0 C 0 C 0 C 0 C 0 0bottom tri DEN ol5m 0 0 35292 35292 0 0 0 0 103067 103067 0 0 0 0
ENG ol5m 652390 646050 6340 455353 455353 0 159462 159462 0 226963 226963 0 67258 67258 0 0 0 0 0 0 0=RA ol5m 29974 769342 -73936E 7979 381706 -373727 12989 325531 -312542 23690 294664 -270974 1850 219992 -213142 1850 219992 -213142 60422 44400 16022GER ol5m 208425 174990 33435 342960 339900 3060 250260 249060 1200 137210 0 137210 7281 7281 0 130500 103500 27000 335062 385062 0SCO ol5m 840663 425810 41485: 931460 430458 501002 704552 262878 441674 342705 45888 296817 252446 47662 204784 414033 128263 235325 475549 232011 243538FRA ol5m 0 0 0 0 0 0 0 0 0 0 0 0 0 0SCO ol5m 0 0 0 0 0 0 0 0 0 0 0 0 0 0
none DEN ol5m 837 837 0 0 0 0 0 0 0 0 0 0 0 0pelagic tra DEN ol5m 108776 108776 215592 215592 172263 172263 170505 170505 14035 14035 0 0 0 0
FRA ol5m 41216 41216 52992 52992 23552 23552 17664 17664 0 0 0 0 0 0GER ol5m 19768 19768 0 106240 106240 0 57020 25226 31794 23400 23400 0 20300 0 20800 0 0 0 0 0 09ED ol5m 39936 15850 74086 385028 154495 23053: 53530 26765 26765 31918 47559 3435! 0 0 0 0 0 0 7428 7428 0SCO ol5m 46080 46080 8353 835: 28980 28980 32287 32237 68337 68337 0 0 28120 23120
pots ENG ol5m 0 0 0 0 0 0 0 0 0 0 0 0 0 0trammel =RA o!5m 0 0 0 0 0 0 0 0 0 0 0 0 0 05 non EU Total 2038065 2059210 -13745 2541249 1868152 673097 1462603 1048922 413636 1106342 638474 467868 535074 342193 192881 546438 451755 94633 956581 668901 287680
Table 4.2.1.2.2. Top demersal species landed (average 2008-2010) within Area V non EU, 2003- 2010. Values are landings in tonnes.area species Type 2003 2004 2005 2006 2007 2008 2009 20105 NON EU POK L 1259 1363 1556 1216 454 409 689 7585 NON EU POK D 273 83 497 27 NA NA NA NA5 NON EU COD L 493 782 803 337 423 412 339 3665 NON EU COD D NA NA 5 150 NA NA NA NA5 NON EU ANF L 104 174 265 244 123 73 174 1085 NON EU HAD L 183 195 128 109 51 65 91 745 NON EU WHG L 21 21 17 42 17 7 33 41
70

Table 4.2.1.2.3. Top pelagic species landed (average 2008-2010) within Area V non EU, 2003- 2010. Values are landings in tonnes.area species 5 NON EU WHB 5 NON EU MAC
TypeLL
20036455
NA
20044961
2
200513593
NA
20067537
NA
20076926
NA
20088520
NA
2009NANA
20101628
NA
Area 5 non EU, by gear, KWdays Area 5 non EU, by gear, KWdays
"O " gili gili
o
X'"'
2000 2002 2004 2006 2008 201 0
Figure 4.2.1.2.1. kWdays effort reported within Area V non EU by gear type, 2000-2010 with (left) and without (right) reported deepwater effort.
71

Catch co m p o sitio n of s p e c ie s in W estern W ater a re a s
2004 2006 2008 2010
WHO
WHB
RNG '
RHG ■
POK '
PLE ■
MAC ■
HKE ■
HAD ■
GUQ
FOX
CYO
COD
CMO
ARU
ANF
333000 C
O
20 %
p r e s e n t
WHB
RNG
RHG
- POK
- PLE
MAC
- HKE
- HAD
- GUQ
- FOX
- CYO
- COD
CMO
- CFB
BSF
BLI
"ARU
ANF
[0.1
100.1000)1
uuut
Figure 4.2.1.2.2 Landings composition by gear (countries combined) Western waters area V non EU, 2003-2010. Size of circles represents relative contribution to landings, shading indicates quantity.
4.2.2. Western waters Area VI
4.2.2.1. Area VI EU
Effort
There is uncertainty relating to French effort. French effort in this region appears to be in error since negative values appear in the table. In addition effort values in 2002 are extremely high. Overall effort figures are unreliable.
There has been a gradual decline in effort within Area VI EU over the period (Table 4.2.2.1.1. and Figure 4.2.2.1.1.)
Bottom trawling and pelagic trawling are the primary gear categories within this area, along with smaller amounts of pots and traps. Bottom trawling effort has remained stable over the past six years declining slightly in 2009 and 2010. Pelagic trawl effort has shown a steadier decline throughout the period. The influence of deepwater fisheries in Area VI EU is less then in Area V, here the majority of annual effort is directed to non-deepwater fisheries. A variety of nations
72

operate within this area. Scotland dominates bottom trawl effort, with large contributions from France (directed toward deepwater fisheries), and to a lesser extent Ireland. Pelagic effort is dominated by the Netherlands, Scotland and Ireland.
A number of additional gear categories are used within this area, occurring at comparatively low levels. This includes pot, dredging, longlines and gillnets. Of these, pots have the highest effort. Much of this effort originates from Scottish vessels, although Irish, English and Northern Irish vessels also utilise this gear. Gillnetting previously showed higher levels of effort, the majority of which was associated with deepwater fisheries, which have subsequently declined since 2006 to low levels. Scotland, France and Germany carry out demersal gillnetting at lower levels.
Catch composition
There are a variety of different fisheries taking place within area VI EU by a number of different gears, as seen in Figure 4.2.2.1.2. The top five demersal species landed from VI EU are detailed within Table 4.2.2.1.2. Landings of all five species are far higher than those in area V. Nephrops (NEP) has both the greatest average landings and throughout the period, although a slight decline is seen in most recent years. Saithe (POK) and haddock (HAD) show fluctuations without trend. Hake (HKE) landings show a steady increase over the whole period, as do those of anglerfish until 2010 when landings were reduced.
There are three top pelagic species landed from VI EU (Table 4.2.2.1.3). Mackerel (MAC) rank first and have shown a declining trend until 2009 and 2010 when greater landings were ercorded. Blue whiting (WHB) has declined to lower levels than seen in the earlier period while horse mackerel landings have fluctuated.
Table 4.2.2.1.4 details landings of scallops and crabs in area VI EU. Large scallop (SCE) landings occur from dredging, and indicate a declining trend until 2007, halted by an increase in 2008, since which landings have begun to decline again. Relatively small amounts of scallops are landed from the ‘none’ category. Pots contribute large quantities of edible crabs (CRE), landings of which increased until 2007, with firther increases again in 2010. Only minor landings of spider crab (SCR) have occurred between 2007 and 2009, from pots and traps.
73
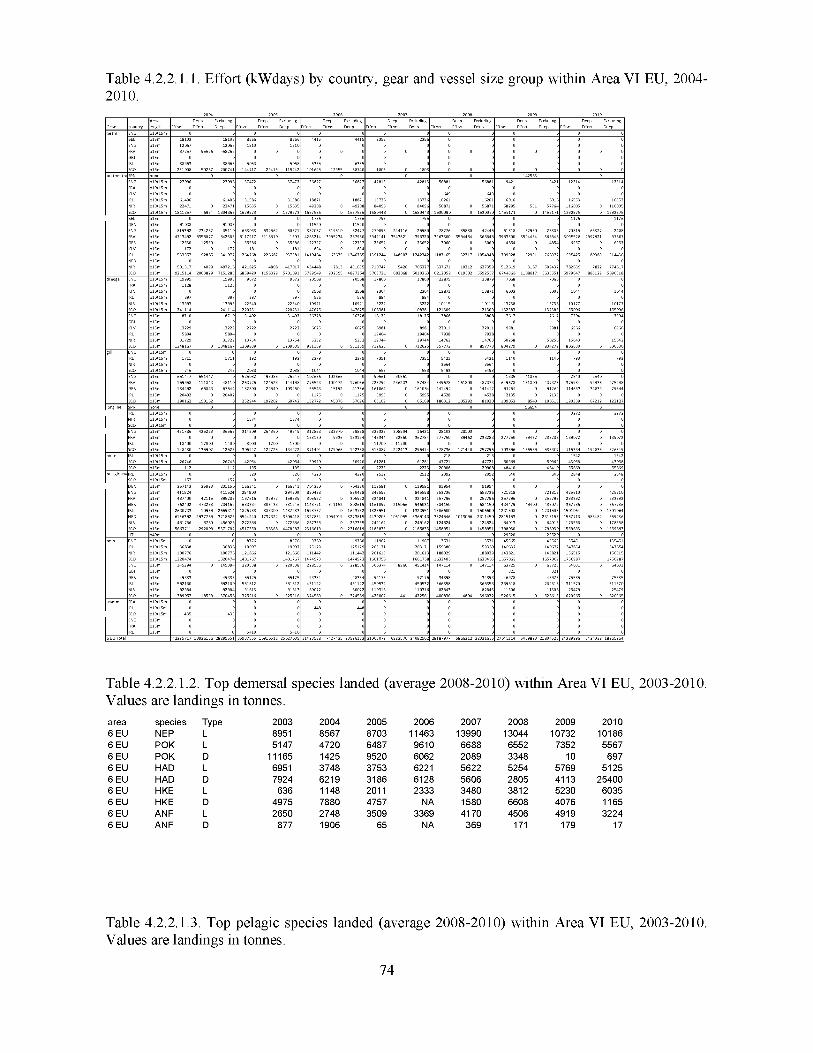
Table 4.2.2.1.1. Effort (kWdays) by country, gear and vessel size group within Area VI EU, 2004- 2010 .
3963300 3594454 3963300 3594454 309552S 2997921
192SS5 1341072 126426S 2266S7 1037581 1187165 132217 1054948
5979647 883129 5096518
159958 111848 268726 124528 144198132800 29540 103260
190162 190162 252944 192202 186312 105292
461786 425223 314209 264360
148430 135902 306947 122725 184222 371404 179066 192338 222413 296474 378736 121440 703396 166589 536807 719384 192835 526549
437400762402 478233 284169
2680783 10969 26698146156392 2937769 3218623
1786 5760 4560265663711 292009 5371702
294900 294900197616 37977 159639638384 306438 331946
1826733 388800 14379335544240 1737822 3806418272866 0 272866
4517350 38368 4478982
704360 0 704360890428 890428305922 0 305922
1143771 3411521693782 0 16937824327834 1054019 :
1161097 215066 9460311328951 0 13289514430203 1061055
1506600 03824546 1013096124524 0 124524
1458951 0 1458951
4844791281508 1281508 1501064 1501064
1474973 1661758188029
1657069
42225717 13926166 28299551 35937555 10910516 25027039 31423588 7427435 23996153 31006072 6923570 24082502 28187977 5866312 22321665 27045114 5439823 21804528 24389996 5424032 18965964
Table 4.2.2.1.2. Top demersal species landed (average 2008-2010) within Area VI EU, 2003-2010. Values are landings in tonnes.area species Type 2003 2004 2005 2006 2007 2008 2009 20106 EU NEP L 8951 8567 8703 11463 13990 13044 10732 101866 EU POK L 5147 4720 6487 9610 6688 6552 7352 55676 EU POK D 11165 1425 9520 6062 2089 3348 10 6976 EU HAD L 6951 3748 3753 6221 5622 5254 5769 51256 EU HAD D 7924 6219 3186 6128 5606 2805 4113 254006 EU HKE L 636 1148 2011 2333 3480 3812 5230 60356 EU HKE D 4975 7880 4757 NA 1580 6608 4076 11656 EU ANF L 2650 2748 3509 3369 4170 4506 4919 32246 EU ANF D 877 1906 65 NA 369 171 179 17
Table 4.2.2.1.3. Top pelagic species landed (average 2008-2010) within Area VI EU, 2003-2010. Values are landings in tonnes.
74

area species Type 2003 2004 2005 2006 2007 2008 2009 20106 EU MAC L 155590 126775 115097 99501 100778 85139 138876 1068666 EU MAC D 24255 257197 5597194 NA 1492 336 45 8386 EU WHB L 39159 125221 122411 150756 57708 31467 33918 407236 EU WHB D 166 359 49 NA 4 23 4 2336 EU JAX L 23276 17745 14297 11200 22452 23877 18736 208926 EU JAX D 8578 17775 1230 NA 184 24750 22 1026
Table 4.2.2.1.4. Scallop and crab species by gear landed within Area VI EU, 2003-2010. Values are landings in tonnes.A re a G e a r S p e c i e s 2 0 0 3 2 0 0 4 2 0 0 5 2 0 0 6 2 0 0 7 2 0 0 8 2 0 0 9 2 0 1 0
6 EU BEAM S C E 2 5 0 06 EU B O T T O M T R A W L S O R E 3 12 2 0 2 0 0 136 EU B O T T O M T R A W L S S C E 8 2 0 36 EU B O T T O M T R A W L S S C R 06 EU D R E D G E O R E 3 2 0 18 2 0 06 EU D R E D G E S C E 5 2 2 7 4 6 4 2 3 9 9 4 3 0 1 4 2 6 8 7 3 5 5 8 3 1 1 5 2 9 9 86 EU GILL O R E 6 2 5 5 2 0 21 0 5 1 16 EU n o n e O R E 1 0 16 EU n o n e S C E 1 22 11 4 9 75 7 9 4 7 71 586 EU P O T S O R E 7 8 4 0 8 1 1 7 8 1 0 0 8 6 3 6 9 3 4 4 7 9 8 6 7 3 9 4 8 9 3 56 EU P O T S S C E 7 0 16 EU P O T S S C R 5 2 4 0
Area 6 EU, by gear, KWdays
odredge
2000 2002 2004 2006 2008 20 1 0
Area 6 EU, by gear, KWdays
dredge
2000 2002 2004 2006 2008 2010
Figure 4.2.2.1.1. kWdays effort reported within Area VI EU by gear type, 2000-2010 with (left) and without (right) reported deepwater effort.
75

Catch co m p o sitio n of s p e c ie s in W estern W ater a re a s
VKHG • WHB TJX ■ SYR ■ SOL ■ SFS SCR ■ SCK SCE ■ SBR SBL ■ RNG
PHOPEN ■ ORY
JAX ■ HKE ■ HAD • GUQ •g u pFOX ■ ETX ETR ■ EPI
DCA ■ CYP • CYO CRE COE • COD CMO
WHO • WHB • TJX SYR ■ SOL SFS ■ SCR SCK SCE SBR • SBL ' RNG ■
PHOPENORY ■ NEP MAC ■ KEF ■ JAX ■ HKE ■ HAD ■ GUQ • GUP ■ FOX ■ ETX ■ ETR • EPI
DCA CYP ■ CYO CRE COE • COD • CMO
o ' O
o O
o o o Q Q O
° o o o o6 EU
p e la g ic tra w ls
ô • O ô O C- O
O * û ô O O O O
30*3*X *
O o o
lo n g lin e
'CfOX
6 EU p o ts
c#ooôcœ
o
6 EU t r a m m e l
o
- SOL- SFS
SCR SCKSCE 1 0 0 % SBR SBL RNG RIB RHG
0 %POKPLEPHOPENORYNEPMACKEFJAXHKEHADGUQGUPFOXETXETREPIDCACYPCYOCRECOECODCMOCFBBSFBRFBLIARUANFALF
[0,1 00 )t
[100 ,1000)1
>1 ooot
Figure 4.2.2.1.2 Landings composition by gear (countries combined) Western waters area VI EU, 2003-2010. Size of circles represents relative contribution to landings, shading indicates quantity.
76

4.2.2.2. Area VI non EU
Effort
Effort has been declining within this area over time, having peaked in 2004. Effort has increased slightly in the last two years (Table 4.2.2.2.I. and Figure 4.2.2.2.I.).
Bottom trawling is the primary activity, carried out by English and Scottish vessels. Much of the effort had been directed towards deepwater fisheries, however, the increase in effort during 2009 and 2010, primarily by Scottish vessels, was not associated with this activity.
At the beginning of the time series, gillnetting also occurred, carried out by England, Scotland and Portugal, and much of this effort was directed toward deepwater fisheries. Since 2006 effort within this category has been minimal. A period of pelagic trawling peaked during the middle of the time series, is now at minimal levels.
Catch composition
The top five demersal species landed from VI non EU are detailed within Table 4.2.2.2.2 with more general composition given in Figure 4.2.2.2.2. The top five demersal species has changed over the last number of years. The fluctuating landings of anglerfish (ANF) would previously have been ranked first occurring as part of the deepwater fishery along with blue mouth (BRF; 4th). However, haddock is now the top demersal species, with small increasing landings of saithe (POK) reflecting the greater effort directed to demersal species within this area over the last two years.
This is not an area of activity for pelagic fishing, blue whiting (WHB) landings occurred in 2003 since which there have been no pelagic landings (Table 4.2.2.2.3).
Within area VI non EU minimal crab (CRE) landings occurred (2003-2004) and no scallop landings have occurred (Table 4.2.2.2.4).
Table 4.2.2.2.I. Effort (kWdays) by country, gear and vessel size group within Area VI non EU,2004-2010.
528446 528446 434191 434191 307643 307643
352587 326449 415654 115989 299665
326127 326127 151406 146583
254730 139938 114792
284491 805209 719493 551960 547540 158837 179173 170600 131730 477730 135929
Table 4.2.2.2.2. Top demersal species landed (average 2008-2010) within Area VI non EU, 2003- 2010. Values are landings in tonnes.area species Type 2003 2004 2005 2006 2007 2008 2009 20106 NON EU HAD L 281 18 4 4 67 21 333 8496 NON EU HAD D NA NA NA NA NA NA 237 NA6 NON EU ANF L 52 128 217 95 172 20 42 1246 NON EU POK L 2 NA NA NA 2 1 5 156 NON EU POK D NA NA NA NA NA NA NA 36 NON EU BRF L 32 44 39 36 15 3 NA 16 NON EU COD L 1 NA NA 1 NA NA NA NA6 NON EU COD D NA NA NA NA NA NA NA 1
77

Table 4.2.2.2.3. Top pelagic species landed (average 2008-2010) within Area VI non EU, 2003- 2010. Values are landings in tonnes.area species Type 2003 2004 2005 2006 2007 2008 2009 20106 NON EU WHB L 8198 NA NA NA NA NA NA NA
Table 4.2.2.2.4. Scallop and crab species by gear landed within Area VI non EU, 2003-2010. Values are landings in tons.Area________ Gear______________ Species_______ 2003 2004 2005 2006 2007 2008 2009 2010
Area 6 non EU, by gear, KWdays Area 6 non EU, by gear, KWdays
longii
'1 - * ^ -
2000 2002 2004 2006 2008 20 1 0
--O- longii
o
Figure 4.2.2.2.I. kWdays effort reported within Area VI non EU by gear type, 2000-2010 with (left) and without (right) reported deepwater effort.
78

Catch co m p o sitio n of s p e c ie s in W estern W ater a re a s
2004 2006 2008 2010
WHB
SCK ■
RNG
POK
NEP ■
KEF '
HAD ■
GUQ •
GUP '
FOX
ETX ■
CYP '
CYO
CRE
COD '
CMO
oc
O o
oO ] o
0
Q U O P)
O
20 %
p r e s e n t
SCK
RNG
POK
HAD
GUQ
GUP
FOX
ETX
CYP
CYO
CRE
COD
CMO
[0.1 00 )t
100.1000)1
uuut
Figure 4.2.2.2.2 Landings composition by gear (countries combined) Western waters area VI non EU, 2003-2010. Size of circles represents relative contribution to landings, shading indicates quantity.
4.2.3. Western waters Area VII
4.2.3.1. Area VII excluding Vlld EU
Effort
There is uncertainty relating to French effort.
Within EU waters of Area VII, excluding Vlld a wide variety of activity occurs incorporating a number of nations. Overall effort declined from 2004 until 2009, whereas an increase occurred in 2010. A relatively small proportion of effort is directed to deepwater fisheries (Table 4.2.3.1.1 and Figure 4.2.3.1.1).
The main gear in use is bottom trawl, with France the primary contributor followed by Ireland. England and Northern Ireland also participate at lower levels of activity. Pelagic trawling, dominated by the Netherlands and with smaller amounts by Ireland, has increased in 2010 owing to increased effort from Ireland in the last two years.
79

Beam trawling (by England, Belgium and Ireland) has declined over time, likely due to a number of decommissioning schemes removing vessels from the fleet. Over the last three years beam trawl effort amounts have been similar to dredging (by France, Scotland, England and Ireland). A small amount of effort is also directed toward pots and gillnets.
Catch composition
The top five demersal species landed from VI non EU are detailed within Table 4.2.3.1.2 with more general composition given in Figure 4.2.3.1.2. Within this area Nephrops (NEP) accounts for the greatest landings, followed closely by anglerfish (ANF) which would have previously been ranked first in the earlier part of the time series. Haddock (HAD) and whiting (WHG), also within the top five have shown increased landings in the last two years, while hake (HKE) landings doubled in 2010 .
Horse mackerel (JAX) tops the pelagic species landings, having shown greatly increased landings in the last two years (Table 4.2.3.1.3). Mackerel shows a similar increased trend in the last two years, whilst blue whiting peaked between 2005 and 2006.
Crab and Scallop landings from the area are detailed in Table 4.2.3.1.4. This shows that the greatest landings of scallops (SCE) by far originate from dredges and that there has been a general increase until 2010. Beam trawls also land scallops, although at a much lower level. Edible crabs (CRE) are landed by a wide variety of gears. Pots yield the greatest landings (~6500t), with quantities also originating from for example, trammel nets (~300t), gili nets (-250) and bohom trawls (-100). Gili nets generate the largest spider crab (SCR) landings, around 1900t, with contributions also coming from trammel nets and pots.
80

Table 4.2.3.1.1 Effort (kWdays) by country, gear and vessel size group within Area VII EU excluding Vlld, 2004-2010._____________________________________2004_____________________2005____________________ 2006____________________ 2007_____________________2008____________________ 2009____________________ 2010________
60517495739694296461409038
3551216
6051749 1616438 4123256
296461 39390 3(
0 3551216
5691268 56912685804604 1556059 4248545244545 244545205771 74537 131234
3459895 17507 345884 5884
4400152 44001525296966 910940 431207818 207818
4308567 43085674980958 971167 4009791
189856 11
2841633 788631 3483382
90473
2596153 25961533829861 434315 3395546
90473 !
3112466 31124663686937 333813 3353124196958 196958
38287644233974832
212638287644160173789
16755672477485
113934973
57498842744318385
18440 1657127 0 2477485
11393 4973
574988 0 4274430 18385
10101 1606872 0 1442715
5605 8235
529956 0 4810490 162
13692624626483352
52193
1369262462648335252193
103221239811689992
103221239803489992
132868233528
361581017806538
1220193164393
38735401478467
132868 233528
1660127 1955683 944045 16862493
0 111882304827 9897104
0 64393237891 3635649 943076 535391
23240075248
308826918308670
674525251
12406557108566
36886051807435
232400 75248
0 1712899 2 17281198
6745 0 252515 10297102 0 1085665 3499119 0 651935
458682120115
308472517116070
10628824162551
33311721197596
458682 120115
1680393 1404332 1228501 15887569
1097308 9531516 0 162551
72490 3258682 888182 309414
11118324113851
30588371070697
54148873624
1956036 1079726 1011353 15044565
30580 0 25439
747910 10370414 0 113851
84658 2974179 849754 220943
926709491281
35072041434085
0 7252598218 86i
0 91281138948 3368256 894552 539533
498969146213
159171312298413
7850513216240
31452841475403
146213 873921 717792695341 11603072
128419 7722094 0 216240
189296 2955988 712191 763212
43935933000
196128315129220
166209883350258516
2896269
43935933000
916477 1044806 754785 14374435
37620 0 16620
108979 9774371 3385 255131
226403 2669866 727247 1120629
212605190434863
615166339410087
4052792518083
6605615166339410087
5637482478802
10835
5637482478802
1083571627
6440911680695
225651550562735369546
644091 110 1680585
22565 155056 27353
110454413677293221
1326466
110454413677293221
1326466
58300319854061077
1595679
58300319854061077
1595679
33423187827130515
3342318782713051547758
1254132
1205932537817912865029
1378579
1205932537817912865029
1378579
1281624986214640482416
1749138
1281624986214640482416
1749138
72828801975788405
2162329632621369790015
1778744
72828801975788405
2162329632621369790015
1778744
109230957867664555
2903841581977210
1068561361824
109230957867664555
29038415819
77210106856
1361824
416116 151424 2646921015940 0 1015940
85866 85866
329209 141351 187858904288 0 9177196 77196
31172595167595549
277319917344103537
200870917344103537
245683704412118991
167042704412118991
272559704349131330
203756704349131330
66165 198503
522176 118490 499763 309415 190348 19976 172090
2700375119 107619219877 1315810
355646 184933 170713 437451 181345 256106 387259 260816 126443
6329913911415374
6261513911415374
4056313911423396
50388 1394 48994170925 17092555648 55648
359017 300599 58418206807 1133 20567468722 18950 4977250975 50332 249936 185823
587563 493801 93762410608 167240 24336818092 2600 15492
257928 196816 61112
139650 111634 28016336703 66761 269942
8381 0 8381811319 634525 176794 194403 108702 85701
374256 72518 30173817819 0 17819
232883 170064 62819
111331 0 111331
17841 :
5066 1341 596329954909490
1645559123684625202955183074257341
1092027
329954 0 909490
5912 1639647 133156 1103690
0 2520295 636250 4546824
6400 25094135084 1056943
519088601144
1623092936424
19177774516777287278
1107013
519088 0 601144
3355 1619737 155266 781158
0 1917777299936 4216841 30242 25703620383 1086630
43369610247221715749856734
14767214683381153357310332
433696 0 1024722
2479 1713270 0 8567340 1476721
22652 4660729 0 1533570 310332
89424910327291830063962635
21799174252343
191854927221
89424910327291830063962635
21799174252343191854927221
1239855985998
119157321904045963606118872
1033393
388076 0 1239855 0 9859980 1191573 0 2190404
53536 5910070 0 1188720 1033393
6243471212908982443
109562232598134570498126604803582
6243471212908982443
109562232598134570498126604803582
220185414795292030306182798042500295980349123838
1135333
0 1827980 0 4250029
479118 5501231 0 1238380 1135333
246000 246000
1697202623012627
1697202623012627
2276974222031257
2276974222031257
4912524158935190
4468169705533366
47883611582194393
47883611582194393
537343310610758688015022932
528967306962758688015022932
496013331470563981772667473
496013331470563981772667473
503029383133394023195937763
328
5030293831333940231959
567335367272670263595249735
567335367272670263595249735
59242015023137307
339573017649382
5924201502313730788658339573017649382
607630150231650899025145423
9840
6045193722255466362274
6045193722255466362274
1531666253310507
1543566238215900
16189 12830 3359438016 3600 43441616260 16260
63807465337
13550
1396949893238938
12857498712
3893813362 13362
92886385 11653632 81232753 90149528 10828079 79321449 82861633 7638176 75223457 84671011 7443710 77227301 72008286 5877417 66130869 68603018 4309002 81898738 4556342 77342396
81

Table 4.2.3.1.2. Top demersal species landed (average 2008-2010) within Area VII EU excluding Vlld, 2003-2010. Values are landings in tonnes.a r e a s p e c i e s T y p e 2 0 0 3 2 0 0 4 2 0 0 5 2 0 0 6 2 0 0 7 2 0 0 8 2 0 0 9 2 0 1 07 E U N O 7 D N E P L 1 2 1 2 1 1 2 0 7 6 1 2 9 2 6 1 2 7 3 1 1 6 2 1 9 1 7 7 0 3 1 5 0 4 1 1 5 6 7 77 E U N O 7 D N E P D N A 1 N A N A N A N A 2 6 2 9 2 8 67 E U N O 7 D A N F L 1 5 0 8 1 1 6 7 8 8 1 6 7 0 4 1 6 0 5 8 1 8 0 3 5 1 5 6 0 9 1 5 8 8 9 1 1 8 9 87 E U N O 7 D A N F D 3 9 7 4 8 1 3 4 3 4 7 4 0 0 2 2 2 1 4 1 3 7 9 57 E U N O 7 D H A D L 6 3 3 3 7 0 9 6 5 5 6 6 4 7 1 2 6 0 5 5 6 3 8 0 7 6 8 9 9 7 2 57 E U N O 7 D H A D D 8 0 5 6 9 1 3 0 9 6 0 4 2 6 2 1 4 6 2 4 8 0 6 3 8 3 8 2 1 6 7 6 37 E U N O 7 D W H G L 1 0 4 3 6 9 3 9 7 1 2 1 5 4 9 1 2 2 8 7 2 3 5 4 9 8 6 0 7 4 8 7 5 87 E U N O 7 D W H G D 2 9 6 2 1 0 3 7 3 1 1 6 3 2 3 2 3 4 1 1 6 8 4 6 8 0 3 4 7 6 9 4 6 3 27 E U N O 7 D H K E L 4 5 4 9 4 7 3 3 4 7 7 2 4 5 1 1 4 7 5 9 4 4 7 0 4 0 7 3 7 7 1 07 E U N O 7 D H K E D 4 4 9 8 4 7 8 3 1 2 1 2 0 8 4 7 3 7 9 2 8 3 1 8 9 5 4 6 7 3 1 9 3
Table 4.2.3.1.3. Top pelagic species landed (average 2008-2010) within Area VII EU excluding Vlld, 2003-2010. Values are landings in tonnes.a r e a s p e c i e s T y p e 2 0 0 3 2 0 0 4 2 0 0 5 2 0 0 6 2 0 0 7 2 0 0 8 2 0 0 9 2 0 1 07 E U N 0 7 D J A X L 4 1 4 1 5 4 1 5 2 0 4 1 4 8 2 3 7 1 4 6 2 2 6 7 7 3 0 5 7 5 9 0 2 7 4 1 2 0 2 1 37 E U N 0 7 D J A X D 9 5 3 5 8 4 5 1 0 6 1 8 8 1 2 2 3 5 0 2 5 3 1 2 7 6 2 5 1 1 5 0 1 4 5 77 E U N 0 7 D M A C L 4 3 4 6 0 5 1 0 0 0 4 1 1 8 9 2 0 7 4 7 3 7 5 2 5 3 8 6 5 6 6 5 4 8 7 8 2 0 6 5
7 E U N 0 7 D M A C D 5 4 1 2 2 0 1 0 5 5 4 1 3 1 8 5 7 2 7 2 5 1 0 1 0 4 3 9 6 0 4 7 1 4 9 6 57 E U N 0 7 D W H B L 2 9 2 9 0 2 4 5 5 0 8 8 0 8 1 8 2 8 1 3 1 1 7 2 7 5 7 3 1 3 9 3 4 6 4 4 3 3 9 2 67 E U N 0 7 D W H B D 4 6 9 1 2 0 0 1 6 0 9 1 5 3 0 2 0 3 0 6 8 6 2 6 7 6
Table 4.2.3.1.4. Scallop and crab species by gear landed within Area VII EU excluding Vlld, 2003- 2010. Values are landings in tonnes.A re a G e a r S p e c i e s 2 0 0 3 2 0 0 4 2 0 0 5 2 0 0 6 2 0 0 7 2 0 0 8 2 0 0 9 2 0 1 0
7 EU n o 7d BEAM C R E 4 0 51 3 7 43 1 14 6 9 5 6 437 EU n o 7d BEAM S C E 2 7 5 2 8 5 2 0 2 190 2 9 2 1 82 14 8 1617 EU n o 7d BEAM S C R 1 1 0 1 2 3 2 37 EU n o 7d B O T T O M T R A W L S C R E 1 67 109 1 65 139 1 00 8 0 9 0 477 EU n o 7d B O T T O M T R A W L S S C E 8 6 125 1 52 108 1 84 1 27 14 3 987 E U n o 7 d B O T T O M T R A W L S S C R 42 3 8 3 4 3 8 2 6 1 9 2 5 177 EU n o 7d D R E D G E C R E 3 7 11 2 2 2 2 17 EU n o 7d D R E D G E S C E 1 3 9 6 3 1 9 7 2 2 1 9 2 9 0 1 7 2 1 6 1 8 6 2 3 1 8 9 2 5 2 2 2 0 7 1 7 4 8 57 EU n o 7d D R E D G E S C R 41 2 2 27 22 2 0 12 12 227 EU n o 7d GILL C R E 3 4 4 331 2 8 3 2 6 4 2 4 8 2 3 5 2 5 0 1 257 EU n o 7d GILL S C E 6 8 10 13 7 4 7 4 7 297 EU n o 7d GILL S C R 1 6 9 9 2 3 4 6 2 0 3 2 16 1 7 1 9 5 3 1 9 5 4 1 9 5 7 1 0 9 27 EU n o 7d L O N G L IN E C R E 1 0 10 0 5 4 6 37 EU n o 7d L O N G L IN E S C E 0 1 1 1 0 0 07 EU n o 7d L O N G L IN E S C R 1 0 1 0 07 EU n o 7d n o n e C R E 0 1 0 3 1 07 EU n o 7d n o n e S C E 4 0 33 4 1 12 127 EU n o 7d n o n e S C R 3 6 30 74 0 0 07 EU n o 7d P E L A G IC T R A W L S C R E 1 7 0 0 0 07 EU n o 7d P E L A G IC T R A W L S S C E 0 1 17 EU n o 7d P E L A G IC T R A W L S S C R 0 0 0 0 07 EU n o 7d P O T S C R E 6 7 3 8 6 4 0 6 5 4 1 0 5 3 8 4 7 4 6 5 6 2 2 3 6 3 0 9 7 7 9 67 EU n o 7d P O T S S C E 1 16 10 4 3 6 5 747 EU n o 7d P O T S S C R 4 8 7 5 7 7 5 2 8 5 0 5 5 1 8 3 3 9 3 1 2 4 0 87 EU n o 7d TR A M M E L C R E 2 4 5 2 7 0 2 8 0 3 3 6 3 8 5 3 3 9 3 3 3 2217 EU n o 7d TR A M M E L S C E 0 0 4 2 5 2 2 57 EU n o 7d TR A M M E L S C R 1 90 2 4 4 2 1 6 2 4 6 2 8 4 2 0 8 211 2 6 5
82

Area 7 EU no 7d, by gear, KWdays Area 7 EU no 7d, by gear, KWdays
-•O- dredge
o
2 ̂ o :::: J...B = = B B = B = • B — B B —“ B
2000 2002 2004 2006 2008 20 1 0
dredge
o
2000 2002 2004 2006 2008 2 010
Figure 4.2.3.1.1. kWdays effort reported within Area VII EU excluding Vlld by gear type, 2000- 2010 with (left) and without (right) reported deepwater effort. Due to uncertainty in French 2002 data this year has been removed from the figures.
83

Catch co m p o sitio n of s p e c ie s in W estern W ater a re a s
WRF ' WHG • WHB ' TJX • SYR ' SOL ■ SHO SFV SFS SCR SCK • SCE ' SBR ' SBL • RNG ' RJY ■
RHO ' OXN • ORY
JAX ■ HKE HAD • GIJQ ' GUP FOX • ETX ■ ETR ■ EPI
DCA CYP ' CYO CRE COE COD • Ch.,IO ■
WRF WHG WHB ' TJX SYR ' SOL • SHO ' SFV ■ SFS SUR ' SCK ■ SCE SBR SBL
RNG RJY
PHOOXN ' ORY ' NEP • MAC ' KEF ■ JAX HKE ' HAD • GUQ GUP FOX ETX • ETF: ' EPI
DCA CYP ■ CYO ■ CRE COE
O O G *
O o o O O O O
o o O O O *
o O o * * O
O o7 EU NO 7D
pelagic trawls
2004 2006 20G8 2010
___________ 7 EU NO 7D___________________________b o tto m Iraw l s _________________
o o o o o * O
cfxraxco o o O o O O O
lo n g lin e
? O O O •
0 # Ó O 0 0 O 0
7 EU NO 7D p o ts
cixxxxxc
o o o O o O í
Ô
o7 EU NO 7D
trammel
O o
o o * O
2 004 2006 2008 2010
o o o o mmo2004 2006 2008 2010
TJXSYRSOLSHOSFVSFSSCRSCKSCESBRSBLRNGRJYRJG
0 RY NEP MAC1 E F JAX HKE HAD GUQ GUP FOX ETX ETR E F' I DCA CVF CYO C Fl E COE COD CMO CFB B S F
AFUJANFALFALC
1 0 0 %
80 %
[0,1 00 )t
[1 0 0 ,1 000>t
>1 ooot
Table 4.2.3.1.2. Landings composition by gear (countries combined) Western waters area VII EU excluding Vlld, 2003-2010. Size of circles represents relative contribution to landings, shading indicates quantity.
84

4.2.3.2. Area VII excluding Vlld non EU
Effort
Very little effort occurs within this area (Table 7.2.3.2.1). Pelagic trawling effort occurs sporadically, by the Netherlands. During 2010 there was some increase in effort, directed at longlines and to a lesser extent bottom trawls.
Catch Composition
Very few demersal species are landed from this area (Table 4.2.3.2.2), average 2008-2010 landings indicate only 1 tonne of hake (HKE) was reported and this originates from pelagic trawl gear.
Blue whiting (WHB) is the only pelagic species with reported landings from the area (Table 4.2.3.2.3). It should be noted that blue whiting landings (2003, 2009 and 2010) do not match the occurrence of pelagic trawl effort which also occurs in 2004 and 2005, indicating an issue in the submitted data.
There are no reported landings of scallops or crabs within this area.
Table 4.2.3.2.1 Effort (kWdays) by country, gear and vessel size group within Area VII non EU excluding Vlld, 2004-2010.
Table 4.2.3.2.2. Top demersal species landed (average 2008-2010) within Area VII non EU, 2003- 2010. Values are landings in tonnes.area species Type 2003 2004 2005 2006 2007 2008 2009 20107 NON EU HKE L NA NA NA NA NA NA NA 17 NON EU COE L 3 NA NA NA NA NA NA NA
Table 4.2.3.2.3. Top pelagic species landed (average 2008-2010) within Area VII non EU, 2003- 2010. Values are landings in tonnes.area species Type 2003 2004 2005 2006 2007 2008 2009 20107 NON EU WHB L 2515 NA NA NA NA NA 1712 689
4.2.3.3. Area Vlld
Effort
There is uncertainty relating to 2002 French effort.
Effort within Area Vlld had been increasing until 2006 after which effort has declined. France is the primary nation operating within this area, driving the overall trends. There is an issue with 2002 French data and should be discounted. There is essentially no effort associated with deepwater fisheries (Table 4.2.3.3.1 and Figure 4.2.3.3.1).
85

A wide variety of gears are utilised within this area, bottom trawling (France) and dredging (also France) show the greatest effort. While pelagic trawling (France and the Netherlands with some minor effort from other nations), beam trawling (Belgium, France, England), and trammel nets (France) are also used accounting for roughly 10% each.
Catch Composition
There are a number of different fisheries taking place in this area by a number of different gears showing varying species compositions as seen in Figure 4.2.3.3.2. In relation to the top demersal species (Table 4.2.3.3.2) whiting (WHG) contributes the greatest quantities and landings have increased over the last three years. Sole (SOL) and plaice (PLE) are currently landed in similar quantities following a decline in sole landings. Around 1000t of Cod (COD) is landed from the area, with a slight decline in most recent years. Conger eel (COE) ranks fifth with landings that halved in 2010.
Pelagic landings of horse mackerel (JAX) have increased greatly in 2009 and 2010, making this species the top landed pelagic species within Vlld (Table 4.2.3.3.3). Mackerel (MAC) landings have declined, and nominal, sporadic blue whiting (WHB) landings are reported.
Table 4.2.3.3.4 details scallop and crab landings from the area, showing large and increasing landings volumes of scallops (SCE) made by dredgers. There is also a smaller pot fishery for edible crabs (CRE; 500-800t), and in recent years bottom trawling took ~200t of scallops.
Table 4.2.3.3.1 Effort (kWdays) by country, gear and vessel size group within Area Vlld, 2004- 2010 .
2070380286106
2070380 2782454 2782454 3184292180704
3184292 2226560 2226560
5597093
1801763
1874695 27425
1965236 141760
449401 449401
100940 100940
898279298994
898279298994
34586802 183416 34403386 3
2945844 2052319
642980 5591709 37371231 30954645 128733 30825912 3
86

Table 4.2.3.3.2. Top demersal species landed (average 2008-2010) within Area Vlld, 2003-2010. Values are landings in tonnes.area species Type 2003 2004 2005 2006 2007 2008 2009 20107D WHG L 6362 4825 4501 3510 3052 3892 3991 54917D WHG D 1740 190 13 24 79 283 283 187247D SOL L 5488 4877 4021 4141 4414 3949 4006 26987D SOL D 2 123 25 93 111 70 172 1607D PLE L 3877 3611 3063 2786 3144 2987 2677 28497D PLE D 229 2469 128 329 146 343 278 1683417D COD L 1513 768 889 1045 1551 1089 1038 10077D COD D NA 10 2 19 29 91 8 557D COE L 386 416 296 219 372 311 317 157
Table 4.2.3.3.3. Top pelagic species landed (average 2008-2010) within Area Vlld, 2003-2010. Values are landings in tonnes.area species Type 2003 2004 2005 2006 2007 2008 2009 20107D JAX L 1324 3170 2933 1701 3988 1851 18929 211817D MAC L 9902 8980 6797 6965 4692 5462 5543 40457D MAC D NA 2 NA NA 2 NA NA 247487D WHB L NA NA 5 NA NA NA NA NA
Table 4.2.3.3.4. Scallop and crab species by gear landed within Area Vlld, 2003-2010. Values are landings in tonnes.A re a G e a r S p e c i e s 2 0 0 3 2 0 0 4 2 0 0 5 2 0 0 6 2 0 0 7 2 0 0 8 2 0 0 9 2 0 1 0
7d BEAM C R E 4 4 2 1 3 6 4 17d BEAM S C E 41 2 3 18 49 4 8 4 2 4 8 247d BEAM S C R 6 3 1 1 1 0 07d B O T T O M T R A W L S C R E 2 2 2 2 4 3 3 27d B O T T O M T R A W L S S C E 68 4 6 101 101 7 0 2 0 8 2 0 8 1 637 d B O T T O M T R A W L S S C R 3 1 1 2 1 1 1 17 d D R E D G E C R E 1 0 0 0 1 1 1 07 d D R E D G E S C E 1 0 5 6 6 1 3 3 8 2 1 6 5 3 2 1 5 1 7 2 1 4 1 7 3 1 4 0 1 6 1 8 1 2 2 1 8 8 6 47 d D R E D G E S C R 0 1 0 0 3 0 0 217 d GILL C R E 1 2 8 0 2 1 0 27 d GILL S C E 0 0 0 07 d GILL S C R 0 3 1 1 2 2 817 d L O N G L IN E C R E 11 1 0 0 0 07 d L O N G L IN E S C E 8 27 d L O N G L IN E S C R 3 07 d n o n e C R E 1 07 d n o n e S C E 2 21 1 13 137 d n o n e S C R 4 0 0 07 d P E L A G IC T R A W L S C R E 0 07 d P E L A G IC T R A W L S S C E 2 3 2 1 12 12 27 d P E L A G IC T R A W L S S C R 07 d P O T S C R E 6 8 2 7 6 7 7 9 0 7 5 0 4 9 7 4 8 6 4 6 0 5 4 57 d P O T S S C E 1 7 7 17 d P O T S S C R 1 22 7 3 79 56 6 5 13 12 107 d TR A M M E L C R E 7 12 17 22 13 11 11 147 d TR A M M E L S C E 9 7 15 15 247 d TR A M M E L S C R 1 8 17 10 4 1 1 8
87

KW
days
Area 7d, by gear, KWdays
dredge
. . .O ..
2000 2002 2004 2006 2008 201 0
Figure 4.2.3.3.1. kWdays effort reported within Area Vlld by gear type, 2000-2010. Note:Due to uncertainty in French 2002 data this year has been removed from the figure.

Catch c o m po s i t i o n of s p e c i e s in W e s t e r n Water ar e as
2004 2000 2008 2010
d r e d a e
WHB
SYR
0 0 0 * 0 0 0 0SOL
SHO
SCR
SCK
SBR
RAJ
POK
PLE
NEP
MAC
JAX
HKE
HAO
CRE
COE
COD
0SF
ANF
lo n g lin e
p e la g ic tra w ls p o ts
WHB
SYR o#ooooooSOL
SHO
SCR
SCK
SCE
SBR
POK
PLE
NEP
MAC
JAX
HKE
HAD
GAM
CRE
COE
COD
BSF
ANF
2004 2006 2008 2010 2006 2008 2010
SYR
SOL
SHO
SCR
SCK
SCE
SBR
RAJ
POK
PLE
NEP
MAC
JAX
HKE
HAD
GAM
CRE
COE
COD
BSF
ANF
1 0 0 %
80 %
[0,1 00 )t
[100 ,1000)1
>1 ooot
Figure 4.2.3.3.2 Landings composition by gear (countries combined) Western waters area Vlld,2003-2010. Size of circles represents relative contribution to landings, shading indicates quantity.
89

4.2.4. Western waters Biologically Sensitive Area (BSA)
Effort
There is uncertainty relating to 2002 French effort.
Current fishing effort within the BSA is lower than 2003 levels, showing a decline until 2006 after which effort has fluctuated, and is now increasing (Table 4.2.4.1 and Figure 4.2.4.1). Overall, bottom trawl effort predominates within the area in common with the picture for the wider EU waters of Area VII. The majority of this effort arises from two nations which showed similar amounts until 2009 but which diverged in 2010, Ireland increased while France decreased. Minimal levels of English and Scottish effort occur over the period.
A number of other gears are used within the BSA. This includes pelagic trawls, use of which has increased in recent years, predominantly by vessels from the Netherlands and Ireland. Gillnetting, by France, Ireland and England, shows a decline in effort following that of French trawl effort. Beam trawling carried out almost exclusively by Ireland shows a pronounced decline until 2008 after which effort has stabilised, similar to the picture in the wider EU waters of Area VII.
The use of pots and dredges in the area is low, however both gears show marked increases in most resent years. Both gears are used almost exclusively by Ireland.
Catch composition
As in the wider area VII, a variety of fisheries occur within the BSA through the use of different gears. Beam trawling occurs targeting anglerfish (ANF), gillnetting for hake (HKE), dredging for scallops (SCE) and potting for edible crab (CRE). The general species composition by gear is given in Figure 4.2.4.2.
In 2010 the top 5 demersal species based on 2008-2010 average landings are all similar in value, anglerfish (ANF), Nephrops (NEP), hake (HKE), haddock (HAD) and whiting (WHG). Both hake and haddock have fluctuated around relatively stable levels over the period while Nephrops declined sharply in 2010, and 2010 anglerfish landings having declined are currently slightly below than those seen in 2004. Whiting, the last of the top five increased in 2009 and 2010.
In relation to pelagic species, mackerel (MAC) tops the pelagic species ranking (Table 4.2.4.3) having increased in the last two years. Horse mackerel (JAX) had previously been relatively stable (~ 1 OOOOt) until extremely large landings occurred in 2009 (>40000t). Landings subsequently fell by roughly 30% in 2010, still far above previous levels. Blue whiting (WHB) is also landed from the BSA, although levels are comparatively low and variable.
Table 4.2.4.4 details scallop and crab landings from the BSA. In this area scallop and crab landings are far lower than the wider VII EU area. Scallops (SCE) from dredging showing an increasing trend in recent years to around 425t. Around the same quantity of edible crabs (CRE) is landed from pots and also shows an increasing trend. All other gears contribute minimal landings.
90

Table 4.2.4.1 Effort (kWdays) by country, gear and vessel size group within the BSA Area, 2004-2010.
65585035675850
6558503937084
59860295124440
93708459860295124440
57960594365002
57960594365002
118063057207684769246
101768346070294493036
101768346070294493036 4588996 4588996
10108222984866
104854 104854
1594955 1594955 2075091 2075091
22983156 20169959 20169959 17816863 19149407 17352225 17352225 18772848 18772848 19337345
Table 4.2.4.2. Top demersal species landed (average 2008-2010) within the BSA Area, 2003-2010. Values are landings in tonnes.area species Type 2003 2004 2005 2006 2007 2008 2009 2010BSA ANF L 5308 4622 4067 4214 5159 4617 5077 3962BSA NEP L 4912 3718 3799 3675 4162 4812 4687 3067BSA HKE L 3519 4154 3690 3790 4154 3474 3653 3511BSA HAD L 3657 3147 2946 2559 3101 2862 3969 3464BSA WHG L 5131 3101 2977 2394 2254 1631 2199 3274
Table 4.2.4.3. Top pelagic species landed (average 2008 Values are landings in tonnes.
-2010) within the BSA Area,
area species Type 2003 2004 2005 2006 2007 2008 2009 2010BSA MAC L 17756 30768 22985 12602 25723 27851 42124 41025BSA MAC D NA NA NA 12 NA NA NA 306BSA JAX L 8260 10169 10039 9347 6046 10866 40161 28112BSA WHB L 1009 1210 998 25 279 953 970 1010BSA WHB D NA NA NA NA NA NA 1 NA
91

Table 4.2.4.4. Scallop and crab species by gear landed within the BSA Area Vlld, 2003-2010. Values are landings in tons.A re a G e a r S p e c i e s 2 0 0 3 2 0 0 4 2 0 0 5 2 0 0 6 2 0 0 7 2 0 0 8 2 0 0 9 2 0 1 0
B SA BEAM C R E 2 2 1 4 6 0 1 0B SA BEAM S C E 21 19 3 2 30 3 2 19 6 12B SA BEAM S C R 0 0B SA B O T T O M T R A W L S C R E 8 9 4 4 1 18 30 2 8 17 2 6 17B SA B O T T O M T R A W L S S C E 4 2 2 1 3 1 1 6B SA B O T T O M T R A W L S S C R 0 5 0 1 1 0 1 0B SA D R E D G E C R E 1 5 6 0 0 0B SA D R E D G E S C E 1 44 104 1 62 82 1 35 3 5 0 4 6 2 4 7 0B SA D R E D G E S C R 0B SA GILL C R E 9 3 9 11 17 12 17 4 0 12B SA GILL S C E 3 0 0 0B SA GILL S C R 6 11 12 0 9 2 9 2 4 3B SA L O N G L IN E C R E 0 2 4 6 0B SA P E L A G IC T R A W L S C R E 0 0 0B SA P O T S C R E 2 5 8 201 5 8 8 161 3 2 9 3 6 2 3 4 6 5 6 9B SA P O T S S C E 0 1B SA P O T S S C R 0 3 0 3 15 4 6 4 2 29B SA TR A M M E L C R E 2 0 0 4 2 2 3 9B SA TR A M M E L S C E 0B SA TR A M M E L S C R 0 0 0 1 1
Area BSA by gear, KWdays
dredge
X
2000 2002 2004 2006 2008 2010
Figure 4.2.4.1. kWdays effort reported within the BSA Area by gear type, 2000-2010. Note: Due to uncertainty in French 2002 data this year has been removed from the figure.
92

Catch c o m po s i t i o n of s p e c i e s in W e s t e r n Water ar e as
WRFWHO WHB SYR ' SOL ' SCR ■ SCK ■ SCE SBR SBL RHO
OXN ORY NEP ■ MAC ■ KEF JAX ' HKE ' HAD ■ 6UQ ■ OUP FOX ETR ■ DCA CYP ' CYO ■ CRE ■ COE ■ COD ■
WRF ■ WHO ■ WHB SYR ■ SOL SCR SCK ' SCE ' SBR ■ SBL RHO
OXN ' ORY ■ NEP ■ MAC ' KEF JAX ■ HKE HAD ' OUQ ' OUP ■ FOX ■ ETR ■ DCA CYP ■ CYO ' CRE ' COE ■ COD ■
o o o o o O O
0*000000
BSAp o ts
oeCCCCOCO O o o o
o O o o o
lo n g lin e
O O? : QOOOOO
BSAtr a m m e l
o o
cairxixr*o O o o o 0 ° o
p e la g ic tra w ls
O t t O Q O o Oo o o O ° o O •
SYRSOLSCRSCKSCESBRSBLRHORAJPOKPLEOXNORYNEPMACKEFJAXHKEHADOUQOUPFOXETRDCACYPCYOCRECOECODBSFBRFBLIARUANFALFALC
1 0 0 %
80 %
[0,1 00 )t
[1 0 0 ,1 000>t
>1 ooot
Figure 4.2.4.2 Landings composition by gear (countries combined) Western waters area BSA. Size of circles represents relative contribution to landings, shading indicates quantity.
93

4.2.5. Western waters Area VIII
4.2.51. Area VIII EU
Effort
Note: There is great uncertainty relating to effort descriptions of this area figures should only be considered between 2003 and 2009. Issues appear in French 2002 and there is uncertainty around 2010 data. Spain did not provide information for 2010.
The overall trend has fluctuated within this area with greatest effort around 2006/2007 following increased French effort. Little effort is associated with deepwater fisheries (Table 4.2.5.1 and Figure 4.2.5.1). Two nations primarily fish this area, France and Spain.
Most effort occurs with bottom trawling gear, dominated by France. The remainder of effort is Spanish. A small (1-2%) proportion of effort is contributed by Portugal. Pelagic trawling accounts for around 12-18% of effort within the area, again primarily by France and Spain.
Other gears are used within the area to lesser extents, with trammel and gillnetting accounting for around 10% each, both have shown an increase over the period. France is again the dominant nation using both gear classes, particularly within the trammel category.
Catch composition
Note: 2010 landings should not be considered due to a lack of Spanish landings information.
A number of different fisheries take place within area VIII EU using different gears as can be seen by the variable species compositions in Figure 4.2.5.1.2. Table 4.2.5.1.2 details the top 5 demersal species landed from the area. This includes hake (HKE), anglerfish (ANF), sole (SOL), Nephrops (NEP) and conger eels (COE). Hake, by far, dominates the demersal species landings and shows an increasing trend over the period. Anglerfish, sole and Nephrops landings have all remained relatively constant whilst conger eel landings built to a peak in 2007, followed by a slight declining trend.
Mackerel (MAC) tops the pelagic species ranking (Table 4.2.5.1.3) showing a gradual increase until 2008, followed by a sharp increase in 2009. Horse mackerel (JAX) and blue whiting (WHB) have both shown fluctuations in landings without trend over the period.
Details of scallop and crab landings from this area are given in Table 4.2.5.1.4. Within area VIII EU, landings are far lower than those in, for example, area VII EU. In addition, landings come from a variety of different gears with no clear predominant gear. Pots generally contribute to edible crab (CRE) landings, although none were landed in 2008 or 2009; large landings occurred in 2010. Scallops (SCE) landings from dredges declined in 2010. Trammel nets provide landings of spider crabs (SCR), as do gili nets although landings from these have shown a decline. Spider and edible crabs (CRE) are both landed from bottom trawls.
94

Table 4.2.5.1.1. Effort (kWdays) by country, gear and vessel size group within Area VIII EU, 2004-2010. Spanish 2010 effort is not included.
8016774_______ 0 8016774 6211119 285745 5925374
9142569_____ 456 9142113 3050309_____ 818 3049491
13681228 473093 13208135 16077214 193593 15883621
569383 0 569383
275019 14364494 4683314 172920 4510394
225946 0 225946
505681___________505681 400047___________400047 118023___________118023
129719 1779127
1695291 116516 1578775
172436 124046452625 538568
224597 0 2245971632314 0 1632314
369230 0 369230
4030865 4023423 5409869 1576063 1576063
46018033 538109 45490253 56325137 730757 55594380 62895757 950871 61944886 62722921 438706 62284215 52693294 433559 52259735 54311497 1327362 52984135 15882982 449633 15433349
Table 4.2.5.1.2. Top demersal species landed (average 2008-2010) within Area VIII EU, 2003- 2010. Values are landings in tonnes. Spanish 2010 landings are not included.area species Type 2003 2004 2005 2006 2007 2008 2009 20108 EU HKE L 5919 5846 9092 8560 10769 14104 14397 71078 EU HKE D NA 236 678 2031 1003 1278 1500 7518 EU ANF L 5352 6560 7291 7192 7033 6715 6669 8778 EU ANF D NA NA NA NA NA NA 70 588 EU SOL L 2276 2545 3294 3470 3277 3339 3420 6708 EU SOL D NA NA NA NA NA NA 9 67838 EU NEP L 2496 2600 3225 3012 2889 2745 2724 12448 EU NEP D NA NA NA NA NA NA NA 124688 EU COE L 1193 1320 1230 1474 1723 1692 1627 10028 EU COE D NA NA NA NA NA NA NA 316
Table 4.2.5.1.3. Top pelagic species landed (average 2008-2010) within Area VIII EU, 2003-2010. Values are landings in tonnes. Spanish 2010 landings are not included.area species Type 2003 2004 2005 2006 2007 2008 2009 20108 EU MAC L 23023 34150 45785 47854 53237 56258 93622 61378 EU MAC D 154 NA 602 NA NA NA NA 3508 EU JAX L 24339 26499 31428 29315 26243 29401 24018 16608 EU JAX D NA NA NA NA NA NA NA 51478 EU WHB L 14024 16125 15232 13820 14982 13687 18174 36
95

Table 4.2.5.1.4. Scallop and crab species by gear landed within Area VIII EU, 2003-2010. Values are landings in tonnes.A re a G e a r S p e c i e s 2 0 0 3 2 0 0 4 2 0 0 5 2 0 0 6 2 0 0 7 2 0 0 8 2 0 0 9 2 0 1 0
8 EU BEAM C R E 0 1 2 08 EU BEAM S C E 0 0 0 1 08 EU BEAM S C R 1 1 0 0 08 EU B O T T O M T R A W L S C R E 1 39 181 1 94 166 2 6 2 2 3 8 2 3 4 418 EU B O T T O M T R A W L S S C E 22 19 17 14 16 2 3 21 48 EU B O T T O M T R A W L S S C R 2 3 4 2 4 7 2 6 6 2 8 5 2 3 3 2 0 3 201 378 EU D R E D G E C R E 0 0 0 0 0 0 0 08 EU D R E D G E S C E 5 1 6 5 0 9 6 2 8 6 1 6 7 0 5 6 0 8 5 9 3 1 468 EU D R E D G E S C R 1 1 1 1 1 3 2 18 EU GILL C R E 3 6 2 4 3 5 23 11 13 12 38 EU GILL S C E 0 7 0 3 0 08 EU GILL S C R 1 12 175 1 93 176 8 7 5 6 5 0 228 EU L O N G L IN E C R E 0 2 1 0 0 0 08 EU L O N G L IN E S C E 1 0 1 0 0 08 EU L O N G L IN E S C R 0 0 1 10 0 0 0 08 EU n o n e C R E 1 1 1 0 0 08 EU n o n e S C E 2 4 7 0 2 3 38 EU n o n e S C R 0 0 1 5 0 0 08 EU P E L A G IC T R A W L S C R E 0 0 0 0 0 1 1 08 EU P E L A G IC T R A W L S S C E 0 0 08 EU P E L A G IC T R A W L S S C R 1 0 0 0 1 1 18 EU P O T S C R E 8 8 5 1 0 8 4 7 5 4 7 5 5 5 5 6 8 9 8 9 1 2 3 28 EU P O T S S C E 08 EU P O T S S C R 3 6 61 3 16 5 0 2 2 828 EU TR A M M E L C R E 2 2 61 3 2 59 61 5 0 5 0 128 EU TR A M M E L S C E 0 2 1 1 1 28 EU TR A M M E L S C R 1 75 2 1 8 2 5 5 4 0 6 3 8 6 3 2 2 3 2 2 91
Area 8 EU, by gear, KWdays
dredge
o
*3-
Figure 4.2.5.1.1. kWdays effort reported within Area VIII EU by gear type, 2000-2010. This figure should only be read from 2003 to 2009 due to uncertainty in French 2002 and 2010 data and the lack of Spanish data in 2010.
96

Catch c o m po s i t i o n of s p e c i e s in W e s t e r n Water ar e as
WRF 'WHO WHB • TJX ■ SYR ' SOL SFS ■ SCR ■ SCE SBR
JAX ■ HKE ■ HAD ' OUQ FOX DCA ■ CYP ' CYO CRE COE ' COD CMO
WRFWHO ■ WHB • TJXSYR ■ SOL ■ SFS ' SCR SCE ■ SBR '
JAX ■ HKE ■ HAD ■ OUQ FOX ■ DCA ■ CYP ■ CYO CRE ■ COE COD CMO
Oooo#oo
O o o o O o
OÔ*ÔOOOC
O o O O8 EU
p e la g ic tra w ls
Ö O O Ó O # 0 0O • O O O o O
2004 2000 2008 2010
________________ 8JEJJ_____________________
O • o o o o O
o o Q O o O O #
o o o o o o <■ »
longline
O O
OOOOOOo o
8 EU p o ts
cco»o°oo
CfcCXXC»
8 EU t r a m m e l
0 * 0 0 0 oo
TJXSYRSOLSFSSCRSCESBRRAJPOKPLENEPMACKEFJAXHKEHADOUQFOXDCACYPCYOCRECOECODCMOBSFBRFBLIANFALFALC
1 0 0 %
80 %
[0,1 00 )t
[100 ,1000)1
>1 ooot
Figure 4.2.5.1.2. Landings composition by gear (countries combined) Western waters area VIII EU. Size of circles represents relative contribution to landings, shading indicates quantity.
97

4.2.5.2. Area VIII non EU
Effort
Minimal effort occurs sporadically within this area (Table 4.2.5.2.1).
Catch Composition
No demersal species landings were reported between 2008 and 2010.
Minimal pelagic landings (horse mackerel; JAX) occurred in 2006 (Table 4.2.5.2.2).
No scallops or crabs landings were reported.
Table 4.2.5.2.1. Effort (kWdays) by country, gear and vessel size group within Area VIII non EU, 2004-2010.
Table 4.2.5.2.2. Top pelagic species landed (average 2008-2010) within Area VIII non EU, 2003- 2010. Values are landings in tonnes.area species Type 2003 2004 2005 2006 2007 2008 2009 20108 NON EU JAX L NA NA NA 69 NA NA NA NA
4.2.6. Western waters Area IX
4.2.6.1. Area IX EU
Effort
Two nations are active in this area, Portugal and Spain, although minor contributions from other nations do occur (Table 4.2.6.1 and Figure 4.2.6.1). Spanish data was provided in previous years covering the period 2002 to 2009. Since Spain operates extensively in this area, overall trends should not be considered outside this period.
Overall effort increased around 2006-2008, levelling off in most recent years. Comparatively little effort is directed toward deepwater fisheries, apart from Portuguese longlines. There is an issue with these data however, resulting in negative effort (ie lower effort submitted to the group for overall effort than was reported for deepwater effort). Spanish deepwater effort was only provided in this area for 2009, given the low effort assigned to deepwater fisheries in 2009, this may not have been significant over the period.
The main fishing activity is bottom trawling, and while this is carried out by both nations, Portuguese effort is much higher. Over the period, Portuguese effort increased until 2007, surpassing Spanish effort levels, although indicating a slight decline since. There has been little relative change in Spanish effort levels.
A number of other gears are used at lower levels, the greatest of which, pelagic trawls, is carried out solely by Spanish vessels. Low levels of trammel net, gillnet, pot, and longline effort occur. Increases have been seen in trammel, gillnet and potting effort in recent years. Spain does more
98

potting and non-deepwater longlining, while Portugal contributes a greater proportion of trammel and gillnetting effort. Spain also carries out a small amount of dredging in the area.
Catch composition
Note: 2010 landings should not be considered due to a lack of Spanish landings information.
A number of different fisheries take place within area IX EU using different gears as can be seen by the variable species compositions in Figure 4.2.6.1.2. As in area VIII EU hake is the top demersal species landed (Table 4.2.6.1.2) and has been increasing over the period. Anglerfish (ANF) landings peaked in 2007 and has since been declining. Landings of the remaining top demersal species (rays; RAJ, Nephrops; NEP, and conger eels; COE) are comparatively minor.
Horse mackerel (JAX) has by far the greatest pelagic landings from this area (Table 4.2.6.1.3). These landings have increased over the majority of the period, however landings declined in 2009. Blue whiting (WHB) and mackerel (MAC) are also landed both of which had reduced weights in2009. While mackerel landings had slowly increased over the period, blue whiting showed more stability.
Minor landings of spider crab (SCR) occur from trammel nets within the area (Table 4.2.6.1.4). No other scallop or crab landings occurred.
Table 4.2.6.1.1. Effort (kWdays) by country, gear and vessel size group within Area IX EU, 2004- 2010 .
8379491 133980 8245511 7093202 103658 6989544
130733 130733
377070 -357748 670904 -623755 118832 735832 -617000 562664 -484531
954450827189214000675 254615 13746060 12379951 465091 11915020 17994569 976258 17018311 17681850 889983 16793476
Table 4.2.6.1.2. Top demersal species landed (average 2008-2010) within Area IX EU, 2003-2010. Values are landings in tonnes.area species Type 2003 2004 2005 2006 2007 2008 2009 20109 EU HKE L 757 610 985 1926 3076 3713 4682 16079 EU HKE D NA 186 505 761 1455 1048 2251 5729 EU ANF L 509 462 508 789 1088 685 550 1799 EU RAJ L 37 53 68 137 312 340 486 5189 EU NEP L 90 94 87 240 318 262 175 1479 EU COE L 13 19 40 57 129 134 167 215
99

Table 4.2.6.1.3. Top pelagic species landed (average 2008-2010) within Area IX EU, 2003-2010. Values are landings in tonnes.area species Type 2003 2004 2005 2006 2007 2008 2009 20109 EU JAX L 8980 11623 9325 12161 12737 16001 11812 63269 EU WHB L 3858 5149 4637 3485 5141 6106 4673 13309 EU MAC L 1878 1916 3496 3841 6044 6167 1231 290
Table 4.2.5.1.4. Scallop and crab species by gear landed within Area IX EU, 2003-2010. Values are landings in tonnes.A re a G e a r S p e c i e s 2 0 0 3 2 0 0 4 2 0 0 5 2 0 0 6 2 0 0 7 2 0 0 8 2 0 0 9 2 0 1 0
9 EU B O T T O M T R A W L S O R E 0 09 EU B O T T O M T R A W L S S C E 09 EU B O T T O M T R A W L S S C R 0 0 09 EU GILL O R E 0 0 0 09 EU GILL S C R 0 0 0 09 EU L O N G L IN E O R E 0 09 EU L O N G L IN E S C R 09 EU P O T S O R E 0 0 0 0 09 EU P O T S S C R 0 0 0 0 0 0 09 EU TR A M M E L O R E 0 0 0 0 0 0 09 EU TR A M M E L S C R 0 1 1 5 7 1 3 3
Area 9 EU, by gear, KWdays
2000 2002 2004 2006 2008 20 1 0
Figure 4.2.6.1.1. kWdays effort reported within Area IX EU by gear type, 2000-2010. N.B figure contains minor effort directed toward deepwater fisheries. Spanish data included only from 2002 to2009.
100

Catch c o m po s i t i o n of s p e c i e s in W e s t e r n Water ar e as
WRFWHO ■ WHB SYR ■ SOL ■ SHO SFS ' SCR ■ SCK SBR '
JAX ■ HPR ■ HKE ' HAD ■ GUQ GUP ' FOX ■ EPI
DCA ' CYP ■ CYO COE ■ COD ■
WRF ■ WHO WHB 'SYR ■ SOL SHO ■ SFS ■ SCR SCK ■ SBR ■
PENNEP ■ MAC ■ KEF JAX ■ HPR ■ HKE ■ HAD ■ GUQ ■ GUP FOX ■ EPI ■
DCA CYP ■ CYO COE COD ■
long line
O • o o O °O
_Q_9 EU p o ts
o
OO o o o o
o o o o o o o
O O O Q O O O Q
O O O O O O O
9 EU tr a m m e l
o
O O * o 15 o o O
• O o o o o
O o o o
Ô o o ooooo
p e la g ic tra w ls
O • O o *O o oO
SYRSOLSHOSFSSCRSCKSBR
NEPMACKEFJAXHPRHKEHADGUQGUPFOXEPIDCACYPCYOCOECODBSFBRF
1 0 0 %
80 %
[0 ,100 )t
[1 0 0 ,1 000>t
>1 ooot
Figure 4.2.6.1.2. Landings composition by gear (countries combined) Western waters area IX EU. Size of circles represents relative contribution to landings, shading indicates quantity. Spanish 2010 landings not included.
101

4.2.6.2. Area IX non EU
Effort
Little effort is associated with this area. Prior to 2006 a variety of gears were used, all at low levels, all of which by Portugal (Table 4.2.6.2.1. and Figure 4.2.6.2.1.). Since 2006, effort declined and was focused in longlines. Some of the longline effort is associated with deepwater fisheries. There is an issue with these data however, resulting in negative effort (ie lower effort submitted to the group for overall effort than was reported as deepwater effort).
Catch composition
There are few landings of demersal species originating from this area (Table 4.2.6.2.2 and Figure 4.2.6.2.2). The greatest of which in recent years is conger eel (COE) and likely linked to the deepwater longline fishery.
In relation to pelagic species, minimal landings occurred in the earlier part of the time series, with only It of horse mackerel occurring since 2006 (Table 4.2.6.2.3).
No scallop or crab landings were reported for this area.
Table 4.2.6.2.1. Effort (kWdays) by country, gear and vessel size group within Area IX non EU, 2004-2010.
167159 147859
163069 166042
Table 4.2.6.2.2. Top demersal species landed (average 2008-2010) within Area IX non EU, 2003- 2010. Values are landings in tonnes.area species Type 2003 2004 2005 2006 2007 2008 2009 20109 NON EU COE L 20 10 28 5 2 15 39 99 NON EU BRF L NA NA NA 1 1 5 9 19 NON EU RAJ L NA NA 3 NA NA 1 1 19 NON EU ANF L 27 NA 12 NA NA NA NA NA
Table 4.2.6.2.3. Top pelagic species landed (average 2008-2010) within Area IX non EU, 2003- 2010. Values are landings in tonnes.area species Type 2003 2004 2005 2006 2007 2008 2009 20109 NON EU JAX L 6 27 59 NA NA NA 1 NA9 NON EU MAC L 5 NA 6 NA NA NA NA NA9 NON EU WHB L 4 34 43 NA NA NA NA NA
102

Area 9 non EU, by g ea r, KW days Area 9 non EU, by g ea r, KW days
Totalbottom trawls gili
--O-- longline “ *"■ pots
Totalbottom trawls gili
■O” longline pots
- s — trammel
Figure 4.2.6.2.1. kWdays effort reported within Area IX non EU by gear type, 2000-2010 with (left) and without (right) effort directed toward deepwater fisheries.
C a tc h c o m p o s i t io n o f s p e c i e s in W e s te r n W a te r a r e a s
2004 2006 2008 2010
9 NON EU 9 NON EU 9 NON EUbottom traw ls alli lona line
WRF - ‘ o * o O O o * -
WHG -
WHB - * O oSOL -
SFS - 0
SBR -
RAJ -
NEP -
MAC -
JAX - * o OHKE - o ° •
oOGUQ -
e u p - ‘ o * * -FOX - O ♦ , 0
DCA -
CYO - 0 Í
COE - • ° A • ° ° o OBSF - • oBRF - O O O » " -
S ANF - •
O0
S ALF "CO 9 NON EU 9 NON EUë Dots tram m el
-WRF
-WHO
- -WHB
- o - SOL
- - SFS
- - SBR
- O - RAJ
- - NEP
- - MAC
- O - HKE
- - GUQ
- - GUP
- O * - FOX
- - DCA
- - CYO
- O - COE
- - BSF- - BRF
o • -ANF
- -ALF
p re se n t
I J . 'l u u i t
[100,1000)t
■I IJIJ IJt
2004 2006 2008 2010
Figure 4.2.6.2.2. Landings composition by gear (countries combined) Western waters area IX non EU. Size of circles represents relative contribution to landings, shading indicates quantity.
103

4.2.7. Western waters Area X
4.2.7.1. Area X EU
Effort
Little effort is carried out within this area. The effort that does occur is with longlines by Portugal (Table 4.2.7.1.1 and Figure 4.2.7.1.1). This effort is primarily associated with deepwater fisheries. There is an issue with these data however, resulting in negative effort (ie lower effort submitted to the group for overall effort than was reported as deepwater effort).
Catch composition
There have been no demersal, pelagic, scallop, or crab species landed from this area in recent years.
Table 4.2.7.1.1. Effort (kWdays) by country, gear and vessel size group within Area X EU, 2004- 2010 .
Area 10 EU, by gear, KWdays
o
Area 10 EU, by gear, KWdays
Figure 4.2.7.1.1. kWdays effort reported within Area X EU by gear type, 2000-2010 with (left) and without (right) effort directed toward deepwater fisheries.
4.2.7.2. Area X non EU
Effort
There is an issue with the data in this area, resulting in negative effort due to lower effort submitted to the group for overall effort than reported as deepwater effort.
Little effort is carried out within Area X non EU. Effort which does occur is primarily with longlines by Portugal, associated with deepwater fisheries (Table 4.2.7.2.1. and Figure 4.2.7.2.1.).
104

Occurrence of other gears and or nations is more sporadic and tending to relate to deepwater fisheries, including small amounts of bottom trawling in 2004/2005.
Catch composition
Very few landings of demersal species have occurred across the period. Those from recent years are detailed in Table 4.2.7.2.2.
In relation to pelagic species, where only It of mackerel has been landed (Table 4.2.7.2.3).
No scallop or crab landings have been reported for this area in recent years.
Table 4.2.7.2.I. Effort (kWdays) by country, gear and vessel size group within Area X non EU,2004-2010.
Table 4.2.7.2.2. Top demersal species landed (average 2008-2010) within Area X non EU, 2003- 2010. Values are landings in tonnes.area species Type 2003 2004 2005 2006 2007 2008 2009 201010 NON EU COE L NA NA NA NA NA NA 5 1610 NON EU NEP L NA NA NA NA NA NA NA 110 NON EU RAJ L NA NA NA NA NA NA 1 NA
Table 4.2.7.2.3. Top pelagic species landed (average 2008-2010) within Area X non EU, 2003-2010. Values are landings in tonnes.area species Type 2003 2004 2005 2006 2007 2008 2009 201010 NON EU MAC L NA NA NA NA NA NA NA 1
105

Area 10 non EU, by gear, KWdays Area 10 non EU, by gear, KWdays
-O - longii
o
-O - longii
2000 2002 2004 2006 2008 2010 2000 2002 2004 2006 2008 2010
Figure 4.2.7.2.1. kWdays effort reported within Area X non EU by gear type, 2000-2010 with (left)and without (right) effort directed toward deepwater fisheries.
4.2.8. Western waters Area CECAF 34.1.1
4.2.8.1. Area 34.1.1 EU
Effort
There is an issue with the data for this area, resulting in negative (ie due to lower effort submitted to the group for overall effort than was reported as deepwater effort).
Effort is low within this area. Portugal is the sole nation with effort reported in this area and isassociated with longlining (Table 4.2.8.1.1 and Figure 4.2.8.1.1). Much of this effort is used to target deepwater fisheries. In 2008 and 2009 greater effort became directed to other fisheries. A single year of Portuguese bottom trawling created an effort peak in 2007.
Catch composition
There have been very low landings of demersal species from this area over the period examined. Table 4.2.8.1.2 details the top five species from recent (2008-2010) years. Conger eel (COE) predominates and this is likely related to the deepwater longline fishery.
Pelagic species landings are detailed within Table 4.2.8.1.3, showing a single tonne of horse mackerel (JAX) in both 2009 and 2010.
No scallop or crab landings have been reported for this area in recent years.
Table 4.2.8.1.1. Effort (kWdays) by country, gear and vessel size group within CECAF Area 34.1.1 EU, 2004-2010.
Table 4.2.8.1.2. Top demersal species landed (average 2008-2010) within CECAF Area 34.1.1 EU, 2003-2010. Values are landings in tonnes.
106

area species Type 2003 2004 2005 2006 2007 2008 2009 201034.1.1 EU COE L 5 11 6 16 7 38 66 4634.1.1 EU BRF L NA NA NA 3 2 9 6 234.1.1 EU RAJ L NA NA NA 1 1 1 2 NA34.1.1 EU COD L NA NA NA NA 20 NA NA NA
Table 4.2.8.1.3. Top pelagic species landed (average 2008-2010) within CECAF Area 34.1.1 EU, 2003-2010. Values are landings in tonnes.area species Type 2003 2004 2005 2006 2007 2008 2009 201034.1.1 EU JAX L NA NA NA NA NA 1 1 NA
Area 34.1.1 EU, by gear, KWdays Area 34.1.1 EU, by gear, KWdays
Figure 4.2.8.1.1. kWdays effort reported within CECAF Area 34.1.1 EU by gear type, 2000-2010 with (left) and without (right) effort directed toward deepwater fisheries.
4.2.8.2. Area 34.1.1 non EU
Effort
Effort is low within this area. Early in the available time series Portugal was the sole nation with effort reported. This effort was primarily bottom trawling (Table 4.2.8.2.1 and Figure 4.2.8.2.1). This was replaced by longlining from the middle of the period. There has been minor bottom trawling occurring again in the last two years. In 2010, effort from Lithuania was reported directed to pelagic trawling, surpassing that of Portuguese longline effort.
Little or no effort is associated with deepwater fisheries in this area.
Catch composition
There have been very low or no landings of demersal species from this area over the period examined. Although there has been some small increases since 2007. Table 4.2.8.2.2 details the top five from recent (2008-2010) years, primarily conger eel (COE) and hake (HKE).
Pelagic species landings are detailed within Table 4.2.8.2.3, showing a single tonne of horse mackerel (JAX) in 2009. Although effort from Lithuania was reported directed to pelagic trawling in 2010 no pelagic landings were reported for the area and year combination.
No scallop or crab landings have been reported for this area in recent years.
107

Table 4.2.8.2.1. Effort (kWdays) by country, gear and vessel size group within CECAF Area 34.1.1non EU, 2004-2010.
448297 448297
Table 4.2.8.2.2. Top demersal species landed (average 2008-2010) within CECAF Area 34.1.1 non EU, 2003-2010. Values are landings in tonnes.a r e a s p e c i e s T y p e 2 0 0 3 2 0 0 4 2 0 0 5 2 0 0 6 2 0 0 7 2 0 0 8 2 0 0 9 2 0 1 03 4 .1 .1 N O N E U C O E L 9 N A 4 N A 1 4 1 3 1 4 2 03 4 .1 .1 N O N E U H K E L N A N A N A N A N A N A 4 2 53 4 .1 .1 N O N E U B R F L N A N A N A N A 4 2 6 63 4 .1 .1 N O N E U R A J L N A N A N A N A N A 5 2 1
Table 4.2.8.2.3. Top pelagic species landed (average 2008-2010) within CECAF Area 34.1.1 non EU, 2003-2010. Values are landings in tonnes.a r e a s p e c i e s T y p e 2 0 0 3 2 0 0 4 2 0 0 5 2 0 0 6 2 0 0 7 2 0 0 8 2 0 0 9 2 0 1 03 4 .1 .1 N O N E U J A X L N A N A N A N A N A N A 1 N A
Area 34.1.1 non EU, by gear, KWdays
o -•O- pelagic
Figure 4.2.8.2.1. kWdays effort reported within CECAF Area 34.1.1 non EU by gear type, 2000-2010 .
108

4.2.9. Western waters Area CECAF 34.1.2
4.2.9.1. Area 34.1.2 EU
Effort
There is an issue with the data in this area, resulting in negative effort (ie lower effort submitted to the group for overall effort than was reported as deepwater effort).
Effort is low within this area. Portugal is the sole nation with effort reported in this area and uses longlines (Table 4.2.9.1.1 and Figure 4.2.9.1.1). Some of this effort, since 2004, has been directed toward deepwater fisheries.
Catch composition
Demersal species landings from this area have been minimal over the period. Table 4.2.9.1.2 details the top demersal species from the area. This shows conger eel (COE) to contribute the most to landings which have fluctuated over time. Other demersal landings have been minimal.
Pelagic species landings are detailed within Table 4.2.9.1.3, showing 2t of horse mackerel (JAX) in 2009.
No scallop or crab landings have been reported for this area in recent years.
Table 4.2.9.1.1. Effort (kWdays) by country, gear and vessel size group within CECAF Area 34.1.2 EU, 2004-2010.
Table 4.2.9.1.2. Top demersal species landed (average 2008-2010) within CECAF Area 34.1.2 EU, 2003-2010. Values are landings in tonnes.a r e a s p e c i e s T y p e 2 0 0 3 2 0 0 4 2 0 0 5 2 0 0 6 2 0 0 7 2 0 0 8 2 0 0 9 2 0 1 03 4 .1 .2 E U C O E L 2 1 0 2 0 8 1 5 1 4 2 5 1 83 4 .1 .2 E U B R F L N A N A N A 2 2 2 3 13 4 .1 .2 E U R A J L N A N A N A N A N A N A 1 1
Table 4.2.9.1.3. Top pelagic species landed (average 2008-2010) within CECAF Area 34.1.2 EU, 2003-2010. Values are landings in tonnes.a r e a s p e c i e s T y p e 2 0 0 3 2 0 0 4 2 0 0 5 2 0 0 6 2 0 0 7 2 0 0 8 2 0 0 9 2 0 1 03 4 . 1 . 2 E U J A X L N A N A N A N A N A N A 2 N A
109

Area 34.1.2 EU, by gear, KWdays
o
Area 34.1.2 EU, by gear, KWdays
Figure 4.2.9.1.1. kWdays effort reported within CECAF Area 34.1.2 EU by gear type, 2000-2010, with (left) and without (right) effort directed toward deepwater fisheries.
4.2.9.2. Area 34.1.2 non EU
Effort
Effort within this area is minimal, effort only occurred during 2010 (Table 4.2.9.2.1) as longlines by Portugal (Madeira), therefore no further comment can be made.
Catch composition
In 2010, quantities of conger eel (COE), blackbelly rosefish (BRF) and Nephrops (NEP) were reported from this area (Table 4.2.9.2.2).
No pelagic species landings have been reported within this area.
No scallop or crab landings have been reported for this area in recent years.
Table 4.2.9.2.1. Effort (kWdays) by country, gear and vessel size group within CECAF Area 34.1.2 non EU, 2004-2010.
532035 -498166
Table 4.2.9.2.2. Top demersal species landed (average 2008-2010) within CECAF Area 34.1.2 non EU, 2003-2010. Values are landings in tonnes.a r e a s p e c i e s T y p e 2 0 0 3 2 0 0 4 2 0 0 5 2 0 0 6 2 0 0 7 2 0 0 8 2 0 0 9 2 0 1 03 4 .1 .2 N O N E U C O E L N A N A N A N A N A N A N A 1 1 5 33 4 .1 .2 N O N E U B R F L N A N A N A N A N A N A N A 3 7 43 4 .1 .2 N O N E U N E P L N A N A N A N A N A N A N A 1 0 8
110

4.2.10. Western waters Area CECAF 34.1.3
4.2.10.1.Area 34.1.3 EU
No effort data was submitted within this area.
4.2.10.2.Area 34.1.3 non EU
No western waters effort was submitted within this area (Table 4.2.10.2.1). The Netherlands, however, made a submission of deepwater effort in 2004, highlighting a data issue.
Table 4.2.10.2.1. Effort (kWdays) by country, gear and vessel size group within CECAF Area 34.1.3 non EU, 2004-2010.
4.2.11. Western waters Area CECAF 34.2.0
4.2.11.1. Area 34.2.0 EU
No effort data was submitted within this area.
4.2.11.2. Area 34.2.0 non EU
Effort
Effort is low within this area. According to the data provided, a relatively small Portuguese longline fishery began in this area in 2005, which has subsequently declined (Table 4.2.11.2.1 and Figure 4.2.11.2.1). None of this effort is associated with deepwater fisheries.
Catch composition
Over the period of long-lining, small quantities of conger eel (COE) and blackbelly rosefish (BRF) occurred. Rays (RAJ) occurred in 2010, at which time quantities of the two other species increased (Table 4.2.9.2.2).
No pelagic landings were reported within this area.
No scallop or crab landings have been reported for this area in recent years.
Table 4.2.11.2.1. Effort (kWdays) by country, gear and vessel size group within CECAF Area 34.2.0 non EU, 2004-2010.
I l l

Table 4.2.11.2.2. Top demersal species landed (average 2008-2010) within CECAF Area 34.2.0 non EU, 2003-2010. Values are landings in tonnes.a r e a s p e c i e s T y p e 2 0 0 3 2 0 0 4 2 0 0 5 2 0 0 6 2 0 0 7 2 0 0 8 2 0 0 9 2 0 1 03 4 .2 .0 N O N E U C O E L N A N A N A 7 9 3 N A 1 53 4 .2 .0 N O N E U R A J L N A N A N A N A N A N A N A 43 4 .2 .0 N O N E U B R F L N A N A N A 1 1 1 N A 6
Area 34.2.0 non EU, by gear, KWdays
o
2000 2002 2004 2006 2008 2010
Figure 4.2.11.2.1. kWdays effort reported within CECAF Area 34.2.0 non EU by gear type, 2000- 2010, excluding effort directed toward deepwater fisheries.
112

A n n e x 1 : D a t a c a l l f r o m 23 F e b r u a r y 2011.
Ref. Ares(2011)200418-23/02/2011
EUROPEAN COMMISSIONDIRECTORATE-GENERAL FOR MARITIME AFFAIRS AND FISHERIES
POLICY DEVELOPMENT AND CO-ORDINATION COMMON FISHERIES POLICY AND AQUACULTURE
Brussels,MARE A2/MT/dos D(2011)
Fa x
To: Permanent Representations of Telephone:EU Member States
Fax:
Cc: Ministries of EU MemberStates
From: Ernesto PENAS LADO Telephone:
Fax:
Number of pages: 3+21
Subject: Fishing effort management schemes related to recovery and managementplans in the Baltic Sea, the North Sea, to the Western waters, to the deep sea fisheries and review of fisheries located in the Celtic Sea.
Message:
Following a similar approach as has been implemented for the last six years, the Commission will consult the STECF 'Working Group on fishing effort regime evaluations' on a review of fisheries regulated through fishing effort management schemes adopted in application of
S the long term plan for cod stocks [R(EC) No 1342/2008],
S the recovery plan for Southern hake and Norway lobster stocks in the Cantabrian Sea and Western Iberian peninsula [R(EC) No 2166/2005],
S the multi-annual plan for the North Sea plaice and sole stocks [R(EC) No 676/2007],
S the multi-annual plan of Western Channel sole stock [R(EC) No 509/2007],
S the multi-annual plan for the cod stocks in the Baltic Sea [R(EC) No 1098/2007],
S the multi-annual plan for the sustainable exploitation of the stock of sole in the Bay of Biscay [R(EC) No 388/2006],
(32-2) 296 37 44
(32-2) 299 48 02
113
'S R(EC) No 2347/2002 establishing specific access requirements and associated conditions applicable to fishing for deep sea stocks, and
•S R(EC) No 1954/2003 on the management of the fishing effort relating to certain Community fishing areas and resources - so called Western Waters regime..
The meetings of the STECF Working Group will take place from 06 to 10 June 2011 and from 26 to 30 September 2011. Similarly to last year, the Commission will consult the STECF Working Group on an analysis of fisheries located in the Celtic Sea which would be affected by a possible extension of effort management related to demersal stocks in that area.
These reviews and analysis will be based on data as collected according to R(EC) No 1639/2001 and to R(EC) No 199/2008 establishing a Community framework for the collection and management of the data needed to conduct the common fisheries policy, supplemented by Commission Decision 2010/93/EU of 18 December 2009 (which repealed Commission Decision 2008/949/EC), as well as other scientific information collected at national level which would allow Member States to fulfil their cooperation obligation laid down in article 4 (3) of the Treaty on European Union. They will include:
S A synopsis of the biological status of the relevant resources;
S Details of historic effort deployed by all fishing vessels, even those of less than 10 m. Loa included, in each fishery, segregated by gear type and by Member State, for the 2000-2010 time period;
S Details of historic catches (landings and discards) made by all fishing vessels , those of less than 10 m. Loa included, in each fishery, segregated by age, by gear type and by Member State, for the 2003-2010 time period.
These data should characterise landings and discards structured by age for the period 2003-2010 and effort for the period 2000-2010.
However, if a Member State considers that data already received by the JRC and handled by the STECF for the 2000-2009 or 2003-2009 time periods do not have to be updated, the Member State is invited to limit the answer to the data call to data for the year 2010. In case where the Member State had not or only partially submitted requested data for the period 2003-2009, the Member State will have to submit data covering the overall periods of time (2003-2010 for catches and 2000-2010 for effort). In addition, Member States will be requested to provide relevant information explaining the need for update and the discrepancies possibly observed between the set of data submitted as answer to the last call and the set of data to be sent as answer to the current call.
To enable the STECF Working Group on fishing effort regime evaluations both to review such fishing effort management schemes and to analyse the fishing effort deployed in the Celtic Sea fisheries, Member States are invited to provide, as soon as possible and no later than 06 May 2011. data to the Commission and to the scientists who would attend the meeting.
The data format to be used, which has been discussed with the STECF secretariat, is described in annex II joined to this facsimile. Such completed data sets should be uploaded on the JRC DCF data collection web site and put at the disposition of the STECF working groups by the intermediation of scientists who will form part of it.
Requests for complementary information related to this upload process may be requested to Hans- Joachim Raetz and to Marco Traa through the following e-mail boxes:
hans-i oachim. raetz@i rc. ec. europa, eu
114
slecf-secrelariat'iv.i rc. ec. europa, eu
Please note that STECF has repeatedly highlighted shortfalls in the data submitted by a number of Member States. Annex I shows a summary table of data not submitted by MS following the data call on effort and catches in 2010. These shortfalls continue to compromise the analysis and member States are asked to pay special attention to providing missing data.
In addition, STECF highlighted several times that it had been unable to comment on the quality of the fleet specific estimates of total catches and discards, mainly due to lack of requested data quality parameters, i.e. number of discards samples, fish measured and aged.
The Commission requests Member States to provide all available information on number of discards samples, fish measured and aged which were implemented during the time-series beforehand specified and either for each metier or for each stock covered by the current call for data. It is recommended that MS authorities liaise with their experts who are expected to attend the STECF meetings to ensure this task is fulfilled.
The Commission reminds Member States that according to Article 8(4) and 8(5) of Regulation (EC) No 199/2008, reductions and suspensions of European Union financial assistance may be applied by the Commission in case of lack of data transmission by the Member States to regional RFMO and scientific bodies. Therefore the Member States are encouraged to respect the above mentioned deadline and to provide all requested data.
Member States shall take note of the new Data Validation Tool (provided by DG-JRC and downloadable from the respective website) and are encourage to try it out in order to support the data submissions and enhance the data quality.
Ernesto PENAS LADO Director
115

Annex I.
Summary table of data not submitted by MS following the SG MOS data call on effort and catches 2010
Note 1 : The data call concerned catch data by metier and ICES division disaggregated by age and length; nominal effort data by metier and ICES division; and effective fishing time by metier and statistical rectangle.
Note 2: the list does not concern the quality of data submitted, but only non-submission
Note 3 : the data call 2010 only asked mandatorily for data concerning the year 2009, to be collected under the new DCF.
Member State DCF data missing still at the STECF November Plenary (before finalisation of the SG MOS working group report)
DCF data missing by end of May 2010 (expiry of the data submission deadline)
Sweden
Finland Catch and nominal effort data not disaggregated by area, gear, quarter
No fish lengths and age
No data on effective fishing time
Catch and nominal effort data not disaggregated by area, gear, quarter
No fish lengths and age
No data on effective fishing time
Estonia No catch and discard data on 120 (out o f 122) species
No discard data
No fish lengths and age
No vessels u8m and no o l0 tl2 m
No catch and discard data on 120 (out o f 122) species
No discard data
No fish lengths and age
No vessels u8m and no o l0 tl2 m
Latvia No vessels u8m and no o l0 tl2 m No vessels u8m and no o l0 tl2 m
Lithuania No data for vessels below 12m
No catch and discard data for 121 (out o f 122) species
No data for vessels below 12m
No catch and discard data for 121 (out o f 122) species
No data on nominal effort
No data on effective fishing time
Poland No catch and discard data for 121 (out o f 122) species No catch and discard data for 121 (out o f 122) species
No data on effective fishing time
Germany
Denmark
Netherlands No discard data for 119 (out o f 122) species No discard data for 119 (out o f 122) species
Belgium No discard data for one metier No data at all (see note 1)
United Kingdom No data for England and W ales
France No discard data. No data at all (see note 1)
Ireland
Spain No data on vessel lengths
No data (catches, effort and effective fishing time) for the non-coastal fleets, i.e. for areas outside ICES divisions VIIIc and IXa
No data on vessel lengths
No data (catches, effort and effective fishing time) for the non-coastal fleets, i.e. for areas outside ICES divisions VIIIc and IXa
No data (catches, effort and effective fishing time) on
116

deep sea metier
No data on effective fishing time
Portugal No discard data for 121 species (out o f 122), no fish lengths and age data
No discard data for 121 species (out o f 122), no fish lengths and age data
117

Annex II.
Form at adaptedfrom the latest f le e t specific f ish in g effort and catch data call issued by the European Commission, D G Mare.
Data reports can be provided in simple comma separated text fdes, Microsoft EXCEL or ACCESS formats. All missing values (empty data cells) must be indicated by a -1.
In contrast to last year’s data formats, which were sequential, you are kindly requested to stick this year to a simple table format which makes im- and exporting much more easily.
A. Catch data fo r 2010 (and the 2003-2009 tim e period i f appropriate - see cover letter), aggregated (sum) by ID except fo r mean weight and length in landings and discards at age (arithmetic mean). Please ensure that data entries are fu lly consistent with coding given in Appendixes.
1. ID (this is a unique identifier; e.g. the combination o f country, year, quarter, gear, mesh size range, fishery or metier, and area; this is free text with a maximum of 40 characters without space)
2. COUNTRY (this should be given according to the code list provided in Appendix 1)3. YEAR (this should be given in four digits), like 20044. QUARTER (this should be given as one digit), like 1, 2, 3, or 45. VESSEL_LENGTH (vessel length should be given according to the code list provided in Appendix 2)6. GEAR (gear should be given according to the code list provided in Appendix 3, which follows the EU data
regulation 1639/2001)7. MESH_SIZE_RANGE (the mesh size range should be given according to the code list provided in
Appendix 4, which largely follows the Council regulation 850/98)8. FISHERY (species complex and gear) or métier (species complex, gear and vessel characteristics) (this is
free text with a maximum of 40 characters without space; this specification may include e.g. target species, roundfish area or quarter) (a fishery can encompass, e.g. more than one mesh size range; in this case separate records have to be provided, e.g. one for each mesh size range, with the same fishery identification)
9. AREA (the ICES division or sub-area should be given according to the code list provided in Appendix 510. SPECON to be specified in accordance with Appendix 6, if SPECON is not available or not applicable,
1” should be given. All landings, discards and other biological parameters falling under the Deep Sea regulations should be aggregated separately, indicated with SPECON=DEEP and appended to the data base.This will allow separate analyses of Deep Sea effort, without conflicts with other effort management schemes.
11. SPECIES (the species should be given according to the code list provided in Appendix 7, which follows the Council Regulation EC 2287/2003)
12. LANDINGS (estimated landings in tonnes should be given; if age based information is present, this quantity should correspond to the sum of products)
13. DISCARDS (estimated discards in tonnes should be given; if age based information is present, this quantity should correspond to the sum of products)
14. NO_SAMPLES_LANDINGS (the number of TRIPS should be given that relate to landings only; a number should be given only if it relates to this fishery only; otherwise “- 1 ” should be given)
15. NO_LENGTH_MEASUREMENT S_L ANDING S (the number o f length measurements should be given that relate to landings only; a number should be given only if it relates to this fishery only; otherwise “- 1 ” should be given)
16. NO_AGE_MEASUREMENTS_LANDINGS (the number of age measurements should be given that relate to landings only; a number should be given only if it relates to this fishery only; otherwise “- 1 ” should be given)
17. NO_SAMPLES_DISCARDS (the number of TRIPS should be given that relate to discards only; a number should be given only if it relates to this fishery only; otherwise “- 1 ” should be given)
18. NO_LENGTH_MEASUREMENTS_DISCARDS (the number of length measurements should be given that relate to discards only; a number should be given only if it relates to this fishery only; otherwise “- 1 ” should be given)
19. NO_AGE_MEASUREMENTS_DISCARDS (the number o f age measurements should be given that relate to discards only; a number should be given only if it relates to this fishery only; otherwise “-1 ” should be given)
20. NO_SAMPLES_CATCH (the number o f TRIPS should be given that relate to catches only; a number should be given only if it relates to this fishery only; otherwise “- 1 ” should be given)
118

21. NO_LENGTH_MEASUREMENTS_CATCH (a number of length measurements should be given here if it relates to catch, i.e. landings and discards; a number should be given only if it relates to this fishery only; otherwise “-1 ” should be given)
22. NO_AGE_MEASUREMENTS_CATCH (a number of age measurements should be given here if it relates to catch, i.e. landings and discards; a number should be given only if it relates to this fishery only; otherwise “- 1 ” should be given)
23. MIN_AGE (this is the minimum age in the data section; if minimum age and maximum age are both “- 1 ”, no age based data are given; otherwise age data must follow in the data section for each age in the age range MIN_AGE to MAX_AGE; minimum age and maximum age must either both be “-1” or both be not “-1”)
24. MAX_AGE (this is the true maximum age in the data section (no plus group is allowed); if minimum age and maximum age are both “-1 ”, no age based data are given; otherwise age data must follow in the data section for each age in the age range MIN_AGE to MAX_AGE; minimum age and maximum age must either both be “-1” or both be not “-1”)
25. Age 0 (years)=026. Age 0 No. Landed (thousands)27. Age 0 MEAN Weight Landed (kg, precision in gram=3 digits after the comma)28. Age 0 MEAN Length Landed (cm, precision in mm=l digits after the comma)29. Age 0 No. Discard (thousands)30. Age 0 MEAN Weight Discard (kg, precision in gram=3 digits after the comma)31. Age 0 MEAN Length Discard (cm, precision in mm=l digits after the comma)32. Age 1 (years)=l33. Age 1 No. Landed (thousands)34. Age 1 MEAN Weight Landed (kg, precision in gram=3 digits after the comma)35. Age 1 MEAN Length Landed (cm, precision in mm=l digits after the comma)36. Age 1 No. Discard (thousands)37. Age 1 MEAN Weight Discard (kg, precision in gram=3 digits after the comma)38. Age 1 MEAN Length Discard (cm, precision in mm=l digits after the comma)39. Age 2 (years)=240. Age 2 No. Landed (thousands)41. Age 2 MEAN Weight Landed (kg, precision in gram=3 digits after the comma)42. Age 2 MEAN Length Landed (cm, precision in mm=l digits after the comma)43. Age 2 No. Discard (thousands)44. Age 2 MEAN Weight Discard (kg, precision in gram=3 digits after the comma)45. Age 2 MEAN Length Discard (cm, precision in mm=l digits after the comma)46. Age 3 (years)=347. Age 3 No. Landed (thousands)48. Age 3 MEAN Weight Landed (kg, precision in gram=3 digits after the comma)49. Age 3 MEAN Length Landed (cm, precision in mm=l digits after the comma)50. Age 3 No. Discard (thousands)51. Age 3 MEAN Weight Discard (kg, precision in gram=3 digits after the comma)52. Age 3 MEAN Length Discard (cm, precision in mm=l digits after the comma)53. Age 4 (years)=454. Age 4 No. Landed (thousands)55. Age 4 MEAN Weight Landed (kg, precision in gram=3 digits after the comma)56. Age 4 MEAN Length Landed (cm, precision in mm=l digits after the comma)57. Age 4 No. Discard (thousands)58. Age 4 MEAN Weight Discard (kg, precision in gram=3 digits after the comma)59. Age 4 MEAN Length Discard (cm, precision in mm=l digits after the comma)60. Age 5 (years)=561. Age 5 No. Landed (thousands)62. Age 5 MEAN Weight Landed (kg, precision in gram=3 digits after the comma)63. Age 5 MEAN Length Landed (cm, precision in mm=l digits after the comma)64. Age 5 No. Discard (thousands)65. Age 5 MEAN Weight Discard (kg, precision in gram=3 digits after the comma)66. Age 5 MEAN Length Discard (cm, precision in mm=l digits after the comma)67. Age 6 (years)=668. Age 6 No. Landed (thousands)69. Age 6 MEAN Weight Landed (kg, precision in gram=3 digits after the comma)70. Age 6 MEAN Length Landed (cm, precision in mm=l digits after the comma)71. Age 6 No. Discard (thousands)
119

72. Age73. Age74. Age75. Age76. Age77. Age78. Age79. Age80. Age81. Age82. Age83. Age84. Age85. Age86. Age87. Age88. Age89. Age90. Age91. Age92. Age93. Age94. Age95. Age96. Age97. Age98. Age99. Age100 ■Age101 ■Age102 ■Age103 ■Age104 ■Age105 ■Age106■ Age107 ■Age108 ■Age109 ■Age110 ■Age111 ■Age112 ■Age113 ■Age114 ■Age115 ■Age116 ■Age117 ■Age118 ■Age119 ■Age120 ■Age121 ■Age122 ■Age123 ■Age124 ■Age125 ■Age126 ■Age127 ■Age128 ■Age129 ■Age130 ■Age131 ■Age
6 MEAN Weight Discard (kg, precision in gram=3 digits after the comma)6 MEAN Length Discard (cm, precision in mm=l digits after the comma)7 (years)=77 No. Landed (thousands)7 MEAN Weight Landed (kg, precision in gram=3 digits after the comma)7 MEAN Length Landed (cm, precision in mm=l digits after the comma)7 No. Discard (thousands)7 MEAN Weight Discard (kg, precision in gram=3 digits after the comma)7 MEAN Length Discard (cm, precision in mm=l digits after the comma)8 (years)=88 No. Landed (thousands)8 MEAN Weight Landed (kg, precision in gram=3 digits after the comma)8 MEAN Length Landed (cm, precision in mm=l digits after the comma)8 No. Discard (thousands)8 MEAN Weight Discard (kg, precision in gram=3 digits after the comma)8 MEAN Length Discard (cm, precision in mm=l digits after the comma)9 (years)=99 No. Landed (thousands)9 MEAN Weight Landed (kg, precision in gram=3 digits after the comma)9 MEAN Length Landed (cm, precision in mm=l digits after the comma)9 No. Discard (thousands)9 MEAN Weight Discard (kg, precision in gram=3 digits after the comma)9 MEAN Length Discard (cm, precision in mm=l digits after the comma)10 (years)=1010 No. Landed (thousands)10 MEAN Weight Landed (kg, precision in gram=3 digits after the comma) 10 MEAN Length Landed (cm, precision in mm=l digits after the comma) 10 No. Discard (thousands)10 MEAN Weight Discard (kg, precision in gram=3 digits after the comma)10 MEAN Length Discard (cm, precision in mm=l digits after the comma)11 (years)=ll11 No. Landed (thousands)11 MEAN Weight Landed (kg, precision in gram=3 digits after the comma) 11 MEAN Length Landed (cm, precision in mm=l digits after the comma)11 No. Discard (thousands)11 MEAN Weight Discard (kg, precision in gram=3 digits after the comma)11 MEAN Length Discard (cm, precision in mm=l digits after the comma)12 (years)=1212 No. Landed (thousands)12 MEAN Weight Landed (kg, precision in gram=3 digits after the comma) 12 MEAN Length Landed (cm, precision in mm=l digits after the comma) 12 No. Discard (thousands)12 MEAN Weight Discard (kg, precision in gram=3 digits after the comma)12 MEAN Length Discard (cm, precision in mm=l digits after the comma)13 (years)=1313 No. Landed (thousands)13 MEAN Weight Landed (kg, precision in gram=3 digits after the comma) 13 MEAN Length Landed (cm, precision in mm=l digits after the comma) 13 No. Discard (thousands)13 MEAN Weight Discard (kg, precision in gram=3 digits after the comma)13 MEAN Length Discard (cm, precision in mm=l digits after the comma)14 (years)=1414 No. Landed (thousands)14 MEAN Weight Landed (kg, precision in gram=3 digits after the comma) 14 MEAN Length Landed (cm, precision in mm=l digits after the comma) 14 No. Discard (thousands)14 MEAN Weight Discard (kg, precision in gram=3 digits after the comma)14 MEAN Length Discard (cm, precision in mm=l digits after the comma)15 (years)=1515 No. Landed (thousands)
1 2 0

132. Age 15 MEAN Weight Landed (kg, precision in gram=3 digits after the comma)133. Age 15 MEAN Length Landed (cm, precision inm m =l digits after the comma)134. Age 15 No. Discard (thousands)135. Age 15 MEAN Weight Discard (kg, precision in gram=3 digits after the comma)136. Age 15 MEAN Length Discard (cm, precision in mm=l digits after the comma)137. Age 16 (years)=16138.Age 16 No. Landed (thousands)139. Age 16 MEAN Weight Landed (kg, precision in gram=3 digits after the comma)140. Age 16 MEAN Length Landed (cm, precision in mm=l digits after the comma) 141 .Age 16 No. Discard (thousands)142. Age 16 MEAN Weight Discard (kg, precision in gram=3 digits after the comma)143. Age 16 MEAN Length Discard (cm, precision in mm=l digits after the comma)144. Age 17 (years)=17145.Age 17 No. Landed (thousands)146. Age 17 MEAN Weight Landed (kg, precision in gram=3 digits after the comma)147. Age 17 MEAN Length Landed (cm, precision in mm=l digits after the comma)148. Age 17 No. Discard (thousands)149. Age 17 MEAN Weight Discard (kg, precision in gram=3 digits after the comma)150. Age 17 MEAN Length Discard (cm, precision in mm=l digits after the comma)151. Age 18 (years)= 18152. Age 18 No. Landed (thousands)153 .Age 18 MEAN Weight Landed (kg, precision in gram=3 digits after the comma)154. Age 18 MEAN Length Landed (cm, precision in mm=l digits after the comma)155.Age 18 No. Discard (thousands)156. Age 18 MEAN Weight Discard (kg, precision in gram=3 digits after the comma)157. Age 18 MEAN Length Discard (cm, precision in mm=l digits after the comma)158. Age 19 (years)=19159. Age 19 No. Landed (thousands)160. Age 19 MEAN Weight Landed (kg, precision in gram=3 digits after the comma) 161 .Age 19 MEAN Length Landed (cm, precision in mm=l digits after the comma)162. Age 19 No. Discard (thousands)163. Age 19 MEAN Weight Discard (kg, precision in gram=3 digits after the comma)164. Age 19 MEAN Length Discard (cm, precision in mm=l digits after the comma)165.Age 20 (years)=20166. Age 20 No. Landed (thousands)167. Age 20 MEAN Weight Landed (kg, precision in gram=3 digits after the comma)168. Age 20 MEAN Length Landed (cm, precision in mm=l digits after the comma)169. Age 20 No. Discard (thousands)170. Age 20 MEAN Weight Discard (kg, precision in gram=3 digits after the comma) 171 .Age 20 MEAN Length Discard (cm, precision in mm=l digits after the comma)
B. E ffo rt data fo r 2010 (and the 2000-2009 time period i f appropriate - see cover letter), aggregated (sum) by ID
1. ID (this is a unique identifier; e.g. the combination of country, year, quarter, gear, mesh size range, fishery or metier, and area; this is free text with a maximum of 40 characters without space)
2. COUNTRY (this should be given according to the code list provided in Appendix 1)3. YEAR (this should be given in four digits)4. QUARTER (this should be given as one digit)5. VESSEL_LENGTH (vessel length should be given according to the code list provided in Appendix 2)6. GEAR (this identifies gear, and should be given according to the code list provided in Appendix 3, which
follows largely the EU data regulation 1639/2001)7. MESH_SIZE_RANGE (the mesh size range should be given according to the code list provided in
Appendix 4, which follows largely the Council regulation 850/98)8. FISHERY (species complex and gear) or métier (species complex, gear and vessel characteristics) (this is
free text with a maximum of 40 characters without space; this specification may include e.g. target species, roundfish area or quarter)
9. AREA (the ICES division or sub-area should be given according to the code list provided in Appendix 5)
1 2 1

10. SPECON to be specified in accordance with Appendix 6, if SPECON is not available or not applicable,1” should be given. All landings , discards and other biological parameters falling under the Deep Sea regulations should be aggregated separately, indicated with SPECON=DEEP and appended to the data base.This will allow separate analyses of Deep Sea effort, without conflicts with other effort management schemes.
11. FISE1ING_ACTIVITY (mandatory only for effort belonging to the Baltic Sea cod plan, the Western Channel sole plan, and the Southern hake and Nephrops plan, for other plans - e.g. North Sea sole and plaice plan - or parameters this filed is optional; the nominal fishing activity should be given in days at sea - or days absent from port in the specific case of the Baltic Sea cod plan; if nominal fishing activity is not available, “-1” should be given).
12. FISE1ING_CAPACITY (mandatory for effort belonging to the sole in the Bay of Biscay plan and the North Sea sole and plaice plan, for other plans or parameters this filed is optional; the nominal fishing capacity should be given in gross tonnage, except for the North Sea sole and plaice plan where the fishing capacity will have to be expressed in kW; if nominal fishing capacity is not available, “-1” should be given)
13. NOMINAL_EFFORT (effort should be given in kW.days, i.e. engine power in kW times days at sea; if nominal effort is not available, “-1” should be given)
14. GT_DAYS_AT_SEA (effort should be given in gross tonnage * days at sea; if the number is not available,“-1” should be given).
15. NO_VESSELS (not for Baltic Sea cod plan), simple integer value of vessels, if the number is not available,“-1” should be given.
C. Specific effort data by rectangle f o r 2010 (and the 2003-2009 time period i f appropriate - see cover letter), in units o f fish ing hours
1. ID (this is a unique identifier; e.g. the combination of country, year, quarter, gear, mesh size range, fishery or metier, and area; this is free text with a maximum of 40 characters without space)
2. COUNTRY (this should be given according to the code list provided in Appendix 1)3. YEAR (this should be given in four digits)4. QUARTER (this should be given as one digit)5. VESSEL_LENGTE1 (vessel length should be given according to the code list provided in Appendix 2)6. GEAR (this identifies gear, and should be given according to the code list provided in Appendix 3, which
follows largely the EU data regulation 1639/2001).7. MESE1_SIZE_RANGE (the mesh size range should be given according to the code list provided in
Appendix 4, which follows largely the Council regulation 850/98)8. FISE1ERY (species complex and gear) or métier (species complex, gear and vessel characteristics) (this is
free text with a maximum of 40 characters without space; this specification may include e.g. target species, roundfish area or quarter)
9. AREA (the ICES division or sub-area should be given according to the code list provided in Appendix 5).10. SPECON to be specified in accordance with Appendix 6, if SPECON is not available or not applicable,
1” should be given. All landings , discards and other biological parameters falling under the Deep Sea regulations should be aggregated separately, indicated with SPECON=DEEP and appended to the data base. This will allow separate analyses of Deep Sea effort, without conflicts with other effort management schemes.
11. RECTANGLE (text, 4 letters like 44F6)12. EFFECTIVE_EFFORT (hours fished, simple long numerical integer)
D. Fisheries capacity data o f active fish in g vessels in the Baltic Sea fo r the 2003-2010 tim e period, fu lly aggregated (counts or sum s as defined). Please ensure that data entries are fu lly consistent with coding given in Appendixes. N ote the different time, area and gear aggregations defined in this table D as compared with table B definitions.
16. COUNTRY (this should be given according to the code list provided in Appendix 1)17. YEAR (this should be given in four digits)18. VESSEL_LENGTE1 (vessel length should be given according to the code list provided in Appendix 2)19. GEAR (use the code “REGGEAR” and aggregate all regulated gears1 as defined in COUNCIL
REGULATION (EC) No 1098/2007 in case such regulated gear was used once or repeatedly, use the code “NONGEAR” and aggregate all other gears in case regulated gears were never used).
1 2 2

20. AREA (in accordance with definitions of COUNCIL REGULATION (EC) No 1098/2007 use the code “A” for the vessels which have operated exclusively in ICES subdivisions 22-24, use the code “B” for the vessels which have operated exclusively in ICES subdivisions 25- 28, use the code “AB” for the vessels which have operated in both ICES subdivisions 22-24 and 25-28).
21. NO_VESSELS (simple integer value of vessel counts, if the number is not available, “-1” should be given.22. FISElING_CAPACITY_kW (to be summed in units of kW; if fishing capacity is not available, “-1” should
be given)23. FISE1ING_CAPACITY_GT (to be summed in units o f gross tonnage; if fishing capacity is not available,
1 ” should be given)
’) regulated gears coded “REGGEAR” comprise fishing with trawls, Danish seines or similar gear (Appendix 3: OTTER, DEM_SEINE, PEL_TRAWL, PEL_SEINE) of a mesh size equal to or larger than 90 mm, with gillnets (Appendix 3: GILL), entangling nets or trammel nets (Appendix 3: TRAMMEL) of a mesh size equal to or larger than 90 mm, with bottom set lines, longlines except drifting lines, handlines and jigging (Appendix 3: LONGLINE).
123

COUNTRY
Appendix 1
Country coding
CODE
Belgium BEL
Denmark DEN
Estonia EST
Finland FIN
France FRA
Germany GER
Ireland IRL
Latvia LAT
Lithuania LIT
Netherlands NED
Poland POL
Portugal (mainland) POR
Portugal (Azores) PTA
Portugal (Madeira) PTM
Spain (mainland) SPN
Spain (Canaries islands) SPC
Sweden SWE
United Kingdom (Jersey) GBJ
United Kingdom (Guernsey) GBG
United Kingdom (Aldemy/Sark/Herm) GBC
United Kingdom (England and Wales) ENG
United Kingdom (Isle of Man) IOM
United Kingdom (Northern Ireland) NIR
United Kingdom (Scotland) SCO
124

Appendix 2
Vessel length coding
According to the Data Collection Framework, Member States should be able to provide data characterising fisheries located in the Baltic Sea, the North Sea and the Western Waters and covering the year 2010 on the basis of the following segmentation of the fleet:
(1)Length over all shorter than 10 m.
(2)Length over all of 10 m. to shorter than 12 m.
(3)Length over all of 12 m. to shorter than 18 m.
(4)Length over all of 18 m. to shorter than 24 m.
(5)Length over all of 24 m. to shorter than 40 m
(6)Length over all of 40 m. or longer
However, to ensure consistency with the 2000-2009 or 2003-2009 time series already submitted last year and to ensure compliance with provisions adopted in legal texts supporting fishing effort regimes in the Baltic Sea, North Sea and Western Waters, Member States are requested to submit data according to the following segmentation:
Fishing efforts regimes of the Kattegat, Skagerrak, North Sea and the Western Waters
Vessel length over all classes Code
Length over all shorter than 10 m. ulOm
Length over all of 10 m. to shorter than 15 m. o l0 tl5m
Length over all of 15 m. and over ol5m
Fishing efforts regimes of the Baltic Sea
Vessel length over all classes Code
Length over all shorter than 8 m. u8m
Length over all of 8 m. to shorter than 10 m. o8tl0m
(7) Length over all of 10 m. to shorter than 12 m. o l0 tl2m
(8) Length over all of 12 m. to shorter than 18 m. o l2 tl8m
(9) Length over all of 18 m. to shorter than 24 m. ol8t24m
(10) Length over all of 24 m. to shorter than 40 m o24t40m
(11) Length over all of 40 m. or longer o40m
125

Appendix 3
Gear coding
TYPES OF FISHING TECHNIQUES Gear code to be used when
answering the data call
G ear code specified for
métiers in App.IV of
2008//949/CE
Mobile gears Beam trawls BEAM TBB
Bottom trawls & demersal seines
Bottom otter trawls, Multi-rig otter trawls or Bottom pair trawls
OTTER OTB, OTT, PTE
Fly shooting seines, Anchored seines or Pair seines
DEM SEIN E S SC, SDN, SPR
Pelagic trawls & pelagic Seines
Midwater otter trawls or Midwater pair trawls
PELTRAW L OTM, PTM
Purse seines,Fly shooting seines or Anchored seines
PELSEIN E PS
Dredges DREDGE DRB, HMD
Passive gears Drifting longlines or Set longlines
LONGLINE LHP, LHM, LTL, LLD, LLS
Driftnets orSet gillnets (except Trammel Nets)
GILL GNS, GND
Trammel Nets TRAMMEL GTR
Pots & traps POTS FPO
126

Appendix 4
Mesh size codingMesh sizes (and selective devices) to be taken into account when evaluating catches and effort made in relation to metiers described in Appendix IV of the Commission Decision update decision no should be as follows:
■ in relation to R(EC) No 88/98 and R(EC) No 2187/2005 for metiers observed in the Baltic Sea;■ in relation to R(EEC) No 1888/85, R(EEC) No 1638/87, R(EC) No 850/98, R(EC) No 2056/2001, R(EC)
No 494/2002 for metiers observed in the North Sea and Western Atlantic;■ in relation to R(EC) No 850/98, R(EC) No 2549/2000, R(EC) No 2056/2001, R(EC) No 494/2002, R(EC)
No 1386/2007 for metiers observed in the Northern Atlantic.
Nevertheless, to ease the process o f submission of data linked to the current call, the Commission would suggest following the mesh size ranges specified in the table below:
G ear type Mesh size range
M obile gears <16
16-31
32-54
55-69
70-79
80-89
90-99
100-119
>=105‘
>=120
Passive gears 10-30
31-49
50-59
60-69
70-79
80-89
90-99
100-109
110-149
110-1562
150-219
157-2192
>=220
• 1 To be used for mobile gears in the context the fishing effort management scheme applied in the Baltic Sea• 2 To be used for passive gears in the context the fishing effort management scheme applied in the Baltic Sea
127

Appendix 5
Area coding by WG, IC E S statistical areas and IB SF C areas fo r Baltic
Baltic Sea
IBSFC areas fo r Baltic Codes in bold to be used in relation compulsory provisions o f the Comm Decision 2008/949/EC
Codes to be used in relation to the g agreement reached between the DG and the M ember States about the ev o f the fish ing effort regimes
III.c.22 22
III.c.23 23
III.c.24 24
III.c.25 25
III.c.26 26
III.c.27 27
III.c.28 283
III.c.28.2 28.2
III.d.29 29
III.d.30 30
III.d.31 31
III.d.32 32
North Sea, Skagerrak, Kattegat and Eastern Channel
ICES statistical areas Codes in bold to be used in relation compulsory provisions o f the Comm Decision 2008/949/EC
Codes to be used in relation to the g agreement reached between the DG and the M ember States about the ev o f the fish ing effort regimes
II EU waters (2) 2 EU
III.a.N (3a) 3an
III.a.S 3as
IV 4
VII. d 7d
Northern Shelf
ICES statistical areas Codes in bold to be used in relation compulsory provisions o f the Comm Decision 2008/949/EC
Codes to be used in relation to the g agreement reached between the DG and the M ember States about the ev o f the fish ing effort regimes
I (1) 1 COAST7
• 3 Area 28.2 included.
128

II non EU waters (2)
1 RFMO8
2 COAST
V.a 5a
2 RFMO
V.b EU waters (5b) 5b EU9
V.b non EU waters 5b COAST
VI.a 6a
5b RFMO
VI.b EU waters (6b) 6b EU
VI.b non EU waters 6b RFMO
VII. a 7a
VII Biological Sensitive Area BSA10
VII. b 7b4
VII.c EC Waters (7c) 7c EU
VII. e 7e
7c RFMO
V ll.f 7f
Vll.g 7g5
VII. h 7h6
VII .j EU waters (7j) 7j EU11
VII .j non EU waters 7j RFMO
VII.k EU waters (7k) 7k EU
VII.k non EU waters 7k RFMO
XII 12
XIV.a 14a 14a
XIV.b (14b) 14b COAST
14b RFMO
• 4 ICES statistical rectangles of ICES division Vllb and corresponding to the BSA shall be included.• 5 ICES statistical rectangles of ICES division Vllg and corresponding to the BSA shall be included.• 6 ICES statistical rectangles of ICES division V llh and corresponding to the BSA shall be included.• 7 COAST will refer to waters under jurisdiction o f a non-EU coastal state.• 8 RFMO will refer to waters where fisheries are managed through RFMOs.• 9 5b EU will have to be considered as covering the following ICES statistical rectangles: 49D6, 49D7, 49D8,
49D9, 49E0, 49E1, 49E2, 49E3, 49E4, 50E5.• 10 BSA (Biological Sensitive Area) will have to be considered as covering the following ICES statistical
rectangles: 35D8, 35D9, 35E0, 35E1, 34D8, 34D9, 34E0, 34E1, 33D8, 33D9, 33EO, 33E2, 32D8, 32D9, 32E0, 32E1, 32E2, 31D8, 31D9, 31E0, 31E1, 31E2, 30D9, 30E0, 30E1, 30E2, 29D9, 29E0, 29E1, 29E2, 28D9, 28E0, 28E1, 28E2.
• 11 ICES statistical rectangles o f ICES division Vllj and corresponding to the BSA shall be included.
129

Southern Shelf
ICES statistical areas Codes in bold to be used in relation compulsory provisions o f the Comm Decision 2008/949/EC
Codes to be used in relation to the g agreement reached between the DG and the M ember States about the ev o f the fish ing effort regimes
VIII. a 8a
VIII. b 8b
VIII. c 8c
VIII.d EU waters (8d) 8d EU
VIII.d non EU waters 8d RFMO
VIII.e EU waters (8e) 8e EU
VIII.e non EU waters 8e RFMO
IX.a 9a
IX.b EU waters (9b) 9b EU
IX.b non EU waters 9b RFMO
X EU waters (10) 10 EU
X non EU waters 10 RFMO
CECAF
F A O statistical areas Codes to be used in relation to the compulsory provisions o f the Comm Decision 2008/949/EC
Codes to be used in relation to the g agreement reached between the DG and the M ember States about the ev o f the fish ing effort regimes
34.1.1 EU waters 34.1.1 EU
34.1.1 non EU waters 34.1.1 COAST
34.1.2 EU waters 34.1.2 EU
34.1.2 non EU waters 34.1.2 COAST
34.1.2 RFMO
34.1.3 34.1.3 COAST
34.1.3 RFMO
34.2.0 EU waters 34.2.0 EU
34.2.0 non EU waters 34.2.0 COAST
34.2.0 RFMO
130

Appendix 6
Coding o f specific conditions related to the Cod Plan, to A n n e x I IB o f R(EC) N o 53/2010, to Deep Sea regulations, to Sole Bay o f Biscay R(EC) N o 388/2006, to fu lly docum entedfisheries and o f
Baltic Technical conditions in Council Regulation (EC) N o 2187/2005
Specific conditions associated to fishing effort regimes
Condition Code
Cod Plan R(EU) No 53/2010
Effort deployed by those vessels granted the <1.5% derogation excluding them from the effort regime
CPartl 1
effort deployed by vessels operating in MS schemes under Article 13
CPartl 3
Annex IIB of R(EU) No 53/2010
Less than 5 tons of hake and 2,5 tons of Nephrops in the catches
IIB72ab
Baltic Technical Conditions
Gear equipped with a BACOMA BACOMA
Gear equipped with a T90 T90
Effort Regime in Deep Sea fisheries
Deep-water species DEEP12
Sole Bay of Biscay R(EC) No 388/2006
Special fishing permit (>2 tons of sole/A) SBcIIIart5
Fully documented fisheries R(EU) No 53/2010
Catch and effort data for 2010 for vessels participating in trials on fully documented fisheries in the annex IIA areas (art 2 R(EU) no 53/2010)
FDFIIA
Catch and effort data for 2010 for vessels participating in trials on fully documented fisheries in the Baltic Sea (art 38 R(EU) no 53/2010)
FDFBAL
12 Where the deep-sea species related effort is not identified by an métier-sampling exclusively for
deep sea species under DCF, the effort should be identified as follows:
(1) the gear is exclusively used in deep-sea fisheries;
(2) catch o f Deep Sea species retained > 100kg (as per the Regulation), or
(3) catch o f Deep Sea species retained < 100kg but the percentage o f Deep Sea species >=35%..
131

Appendix 7
Species coding according to Council Regulation (EC) No. 2298/2003
Common name Alpha-3 code Scientific name
1. Albacore ALB Thunnus alalunga
2. Alfonsinos ALF Beryx spp.
3. American plaice PLA Hippoglossoides platessoides
4. Anchovy ANE Engraulis encrasicolus
5. Anglerfish ANF Lophiidae
6. Antarctic icefish ANI Champsocephalus gunnari
7. Arctic skate RJG Raja hyperborea
8. Atlantic catfish CAT Anarhichas lupus
9. Atlantic halibut HAL Hippoglossus hippoglossus
10. Atlantic salmon SAL Salmo salar
11. Atlantic thomyhead TJX Trachyscorpia cristulata
12. Baird's slickhead ALC Alepocephalus bairdii
13. Basking shark BSK Cetorhinus maximus
14. Bigeye tuna BET Thunnus obesus
15. Birdbeak dogfish DCA Deania calcea
16. Blackbelly rosefish BRF Helicolenus dactylopterus
17. Black cardinal fish EPI Epigonus telescopus
18. Black dogfish CFB Centroscyllium fabricii
19. Black scabbardfish BSF Aphanopus carbo
20. Blackfin icefish SSI Chaenocephalus aceratus
21. Blackmouth catshark SHO Galeus melastomus
22. Blue antimora ANT Antimora rostrata
23. Blue ling BLI Molva dypterigia
24. Blue marlin BUM Makaira nigricans
25. Blue whiting WHB Micromesistius poutassou
26. Bluefin tuna BFT Thunnus thynnus
27. Blutnose sixgill shark SBL Hexanchus griseus
28. Capelin CAP Mallotus villosus
29. Cod COD Gadus morhua
30. Common mora RIB Mora moro
31. Common sole SOL Solea solea
132

32. Common shrimp CSH
33. Crab PAI
34. Dab DAB
35. Deep-seared crab KEF
36. Edible Crab C RE
37. Eelpouts ELZ
38. European conger COE
39. European pearch FPE
40. Flatfish, flounder FLX
41. Forkbeards FOX
42. Frilled shark HXC
43. Greater silver smelt ARU
44. Greenland halibut GHL
45. Grenadier GRV
46. Great Atlantic Scallop SCE
47. Great lantern shark ETR
48. Greenland shark GSK
49. Grey rockcod NOS
50. Guiper shark GUP
51. Haddock HAD
52. Hake HKE
53. Herring HER
54. Horse mackerel JAX
55. Humped rockcod NOG
56. Iceland catshark APQ
57. Kitefin shark SCK
58. Knifetooth dogfish SYR
59. Krill KRI
60. Lantern fish LAC
61. Large-eyed rabbitfish CYH
62. Leafscale guiper shark GUQ
63. Lemon sole LEM
64. Ling LIN
65. Lumpsucker LUM
66. Longnose velvet dogfish CYP
Crangon crangon
Paralomis spp.
Limanda limanda
Chaceon affinis
Cancer pagurus
Lycodes spp.
Conger conger
Perca fluviatilis
Pleuronectiformes, Platichthys flesus
Phycis spp.
Chlamydoselachus anguineus
Argentina silus
Reinhardtius hippoglossoides
Macrourus spp.
Pecten maximus
Etmopterus princeps
Somniosus microcephalus
Lepidonotothen squamifrons
Centrophorus granulosus
Melanogrammus aeglefinus
Merluccius merluccius
Clupea harengus
Trachurus spp.
Gobionotothen gibberifrons
Apristurus laurussonii
Dalatias licha
Scymnodon rigens
Euphausia superba
Lampanyctus achirus
Hydrolagus mirabilis
Centrophorus squamosus
Microstomus kitt
Molva molva
Cyclopterus lumpus
Centroscymnus crepidater
133

67. Mackerel MAC
68. Marbled rockcod NOR
69. Mediterranean slimehead HPR
70. Megrims LEZ
71. Mouse catshark GAM
72. Northern prawn PRA
73. Norway lobster NEP
74. Norway pout NOP
75. Norway redfish SFV
76. Norwegian skate JAD
77. Orange roughy ORY
78. ‘Penaeus' shrimps PEN
79. Pike FPI
80. Pike pearch FPP
81. Plaice PLE
82. Polar cod POC
83. Pollack POL
84. Porbeagle POR
85. Portuguese dogfish CYO
86. Rabit fish CMO
87. Rays RAJ
88. Redfish RED
89. Red Seabream SBR
90. Risso's smooth-head PHO
91. Roughead grenadier RHG
92. Roundnose grenadier RNG
93. Round ray RJY
94. Sailfin roughshark OXN
95. Saithe POK
96. Sandeel SAN
97. Scallop KMV
98. Seabass BSS
99. Short fin squid SQI
100. Silver scabbardfish SFS
101. Skates SRX
Scomber scombrus
Notothenia rossii
Hoplostethus mediterraneus
Lepidorhombus spp.
Galeus murinus
Pandalus borealis
Nephrops norvegicus
Trisopterus esmarki
Sebastes viviparus
Raja nidarosiensis
Hoplostethus atlanticus
Penaeus spp
Esox lucius
Sander lucioperca
Pleuronectes platessa
Boreogadus saida
Pollachius pollachius
Lamna nasus
Centroscymnus coelolepis
Chimaera monstrosa
Rajidae
Sebastes spp.
Pagellus bogaraveo
Alepocephalus rostratus
Macrourus berglax
Coryphaenoides rupestris
Raja fyllae
Oxynotus paradoxus
Pollachius virens
Ammodytidae
Chlamys livida
Dicentrarchus labrax
Illex illecebrosus
Lepidopus caudatus
Rajidae
134

102. Smooth lantern shark ETP Etmopterus pusillus
103. Snow crab PCR Chionoecetes spp.
104. South Georgian icefish SGI Pseudochaenichthys georgianus
105. Spanish ling SLI Molva macrophthalmus
106. Spinous spider crab SCR Maja squinado
107. Sprat SPR Sprattus sprattus
108. S pur dog DGS Squalus acanthias
109. Straightnose rabbitfish RCT Rhinochimaera atlantica
110. Swordfish SWO Xiphias gladius
111. Toothfish TOP Dissostichus eleginoides
112. Tope shark GAG Galeorhinus galeus
113. Turbot TUR Psetta maxima
114. Tusk USK Brosme brosme
115. Unicom icefish LIC Channichthys rhinoceratus
116. Velvet belly ETX Etmopterus spinax
117. White marlin WHM Tetrapturus alba
118. Whiting WHG Merlangius merlangus
119. Witch flounder WIT Glyptocephalus cynoglossus
120. Wreckfish WRF Polyprion americanus
121. Y ellowfin tuna YFT Thunnus albacores
122. Yellowtail flounder YEL Limanda ferruginea
135

EUROPEAN COMMISSION
Ref. Ares(2011)321496-23/03/2011
DIRECTORATE-GENERAL FOR MARITIME AFFAIRS AND FISHERIES
POLICY DEVELOPMENT AND CO-ORDINATION COMMON FISHERIES POLICY AND AQUACULTURE
Brussels,MARE A2/M T/ D(2011)
F a x
To: Permanent Representations of Telephone: EU Member States
Fax:
Cc: Ministries of EU Member States
From: Ernesto PENAS LADO Telephone: (32-2) 296 37 44
Fax: (32-2) 299 48 02
Number of pages: 3
Subject: CORRIGENDUM
Fishing effort management schemes related to recovery and management plans in the Baltic Sea, the North Sea, to the Western waters, to the deep sea fisheries and review of fisheries located in the Celtic Sea.
Message:
On Wednesday 23-02-2011 DG MARE sent a data call to all Member States' permanent representations regarding the preparation of the analytical work of the STECF 'Working Group on fishing effort regime evaluations' (reference Ares (2011)200418-23/02/2011).
With this CORRIGENDUM, we draw your attention to a change that needs to be made to the specifications given in the above mentioned data call. Another point of attention is a correction of the summary table of data not submitted by Member States (annex I of the data call).
It is important that the experts of the STECF are in a position to clearly identify the trips of vessels participating in trials on fully documented fisheries, as defined in appendix 6, in order to prevent confusion and discussion about the quality of the results. To make that possible, annex II part A (Catch data), part B (Effort data) and part C (Specific effort data by rectangle) of the data call need to be revised.
Correction o f the Summary table (annex I)
Annex I of the data call incorrectly stated that Belgium had failed to submit discard data for one metier at the moment of the STECF November Plenary. The Belgium discard data were available at the STECF November meeting 2010.
136

Fully documented fisheries in Annex IIA areas and the Baltic sea
Fully documented fisheries trips FDFIIA and FDFBAL can fall under more than one special condition, i.e. FDFIIA in Annex IIA with the special conditions CPartl 1, CPart 13, and FDFBAL with special conditions BACOMA and T90. This would impede the data aggregation to be accurate.
In order to avoid such potential conflicts, it is necessary that the trips of special condition FDFIIA in Annex IIA areas and of special condition FDFBAL in the Baltic Sea are aggregated separately and appended to the data submission, exactly as it is done for the special condition DEEP.
For that reason point 10 of Annex II part A (Catch data), part B (Effort data) and part C (Specific effort data by rectangle) is substituted as follows:
For part A (Catch data), point 10:10. SPECON to be specified in accordance with Appendix 6, if SPECON is not available or not applicable, “-1” should be given. All landings, discards and other biological parameters falling under the Deep Sea regulations should be aggregated separately, indicated with SPECON=DEEP and appended to the data base. This will allow separate analyses of Deep Sea effort, without conflicts with other effort management schemes. A ll landings, discards and other biological parameters o f vessels participating in trials on fully documented fisheries in the Annex IIA areas (R(EU) no 53/2010) or in the Baltic Sea (R(EC) No 1098/2007) should be aggregated separately, indicated with SPECON=FDFIIA for the Annex IIA areas and SPECON=FDFBAL for the Baltic Sea and appended to the data base. This will allow separate analyses o f data related to fully documented fisheries, without conflicts with other effort manasement schemes.
For part B (Effort data), point 10:10. SPECON to be specified in accordance with Appendix 6, if SPECON is not available or not applicable, “-1” should be given. All effort parameters falling under the Deep Sea regulations should be aggregated separately, indicated with SPECON=DEEP and appended to the data base. This will allow separate analyses of Deep Sea effort, without conflicts with other effort management schemes. AU effort parameters o f vessels varticivatins in trials on fully documented fisheries in the Annex IIA areas (RfEU) no 53/2010) or in the Baltic Sea (RŒC) No 1098/2007) should be assresated sevaratelv, indicated with SPECON=FDFIIA for the Annex IIA areas and SPECON=FDFBAL for the Baltic Sea and am ended to the data base. This will allow sevarate analyses o f data related to fully documented fisheries, without conflicts with other effort manasement schemes.
For part C (Specific effort data by rectangle), point 10:10. SPECON to be specified in accordance with Appendix 6, if SPECON is not available or not applicable, “-1” should be given. The effort parameter falling under the Deep Sea regulations should be aggregated separately, indicated with SPECON=DEEP and appended to the data base. This will allow separate analyses of Deep Sea effort, without conflicts with other effort management schemes. The effort parameter o f vessels varticivatins in trials on fully documented fisheries in the Annex IIA areas (RfEU) no 53/2010) or in the Baltic Sea (R(EC) No 1098/2007) should be assresated sevaratelv, indicated with SPECON=FDFIIA for the Annex IIA areas and SPECON=FDFBAL for the Baltic Sea and am ended to the data base. This will allow sevarate analyses o f data related to fully documented fisheries, without conflicts with other effort manaeement schemes.
I hope this clarification makes it possible to apply the categorizations mentioned in order to improve the usefulness of the data provided by the Member States.
Member States are invited to provide the requested data to the Commission and to the scientists who would attend the meeting no later than 6 May 2011.
137

Ernesto PENAS LADO Director
138

An n e x 2: Pa r t ic ip a n t s
Name Address Telephone no. Email EWG11-06
EWG11-11
STECF membersBailey, Nick FRS Marine Lab.
Victoria Road AB11 9DB Aberdeen, UK
+44(0)1224295398 bailevnfôtaarlab. ac.uk X X
Vanhee,Willy
ILVO, Hospitaalstraat, 8400 Oostende, Belgium
+32(059)433083 wvanhee i®r> andora. be X X
UlrichRescan, Clara
DTU-Aqua Charlottenlund Castle, 2920 Charlottenlund, Denmark
+4533963395 clufiMilres.dk X X
Invited expertsBarratt,Katherine(Katy)
Scottish Executive Environment and Rural Affairs D, Robb's Loan, EH14 1TY, Edinburgh, UK
131-244-6437 katv.barrattiae Scotland, esi. eov.uk
X
Bell, Ewen Cefas, Pakefield Road, NR33 OHT, Lowestoft, United Kingdom
+44 1502524238 ewen.bellf0eeefas.co.uk X
Carlshamre,Sofia
Swedish Board of Fisheries, Inst. O f Marine Research, P.O. Box 4, 453 21, Lysekil, Sweden
+46-(0)523-18700 sofia.carlshamrefôefiskeriv erket.se
X X
Davie, Sarah Marine Institute Rinville, Oranmore, Ireland
+353(0)91387200 sarah. daviefôemarine.ie X X
Demaneche,Sebastien
IFREMER, 29280 Plouzané, France
+33 298224040 sdemanecfôeifremer.fr X
Dolder, Paul Cefas, Pakefield Road, NR33 OHT, Lowestoft, United Kingdom
+441502 524259 naul.dolderf0eeefas.co.uk X
Holmes,Steven
Fisheries research services, Victoria road, Aberdeen, UK
+44(0)1224295507
s.holmesfôemarlab.ac.uk X X
Jardim,Ernesto
INRB-L/IPIMAR,A V. de Brasilia, 1449-006, Lisboa, Portugal
+351 213 027 093 emestofôeipim ar.pt X
139

Kempi,Alexander
Institute o f Sea Fisheries, Palmadle 9, 22767 Hamburg, Germany
alexander.kempfi®vti.bund.de
X
Kovsars,Maxim
Fish Resources Research department (BIOR), Lejupes Street 3, LV- 1076, Riga, Latvia
Maksims. Kovsarsi®bior. e ov.lv
X X
Lövgren,Johan
FIV Sweden, PO Box 4, 45330, Lysekil, Sweden
i ohan. loverenfôYiskeriver ket.se
X X
O’Hea,Brendan
Marine Institute Rinville, Oranmore, Ireland
+35391 387304 brendan. ohea (ôJnarine. ie X
Radtke,Krzysztof
Sea Fisheries Institute, Kollataja 1, 81-332, Gdynia, Poland
krzvsztof.radtkefôJnir.edvnia.nl
X X
Raid, Tiit Estonian Marine Institute, University of Tartu, Tartu, Estonia
tiit. raidi® email. com X X
Silva,Cristina
INRB-L/IPIMAR,A V. de Brasilia, 1449-006, Lisboa, Portugal
+351 213 026745 csilvaf0Tpimar.pt X
Van der Kamp, Peter
IMARES, Haringkade 1, 1976 CP, Ijmuiden, The Netherlans
+ 31317487176 peter.vanderkampfiiwur.nI
X X
Vermand,Youen
IFREMER 150, quai Gambetta, 62321, Boulogne sur mer, France
Y ouen. V ermardfôTfremer.fr
X X
JRC Experts
Mitrakis,Nikolaos
Joint Research Centre (IPSC), Maritime Affairs Unit Via E. Femii, 2749, 21027 Ispra (Varese), Italy
+390332786479 nikolao s. mitrakis fôT re. ec. europa.eu
X X
European CommissionGoldmanis,Edgars
DG Mare Unit E2, Office J-79 05/07 Rue Joseph II 79, 1049 Bmssels, Belgium
+32-2-2964526 Edears.GOLDMANISföie c.europa.eu
X
Traa, Marco DG Mare Unit A2, Office J-99 01/035 Rue Joseph II 99, 1049 Bmssels, Belgium
+32 2 2968070 marco.traafiiec.europa.eu X X
140
STECF Secretariat
Mitrakis,Nikolaos
Joint Research Centre (IPSC), Maritime Affairs Unit Via E. Femii, 2749, 21027 Ispra (Varese), Italy
+390332786479 nikolao s. mitrakis (cù\ re. ec. europa.eu
X X
141

An n e x 3: E x pe r t d e c l a r a t io n s
Declarations of invited experts are published on the STECF web site on https://stecf.irc.ec.europa.eu/home together with the final report.
142

European Commission
EUR 25036 EN - Joint Research Centre - Institute for the Protection and Security of the CitizenTitle: Scientific, Technical and Economic Committee for Fisheries. Evaluation of Fishing Effort Regimes - Deep Sea and W estern W aters (STEC F-11-12).
EWG-11-11 members: Barratt, K., Bell, E., Carlshamre, S., Davie, S., Demaneche, S., Dolder, P., Holmes, S., Jardim, E., Kempf, A., Kovsars, M., Lövgren, J., O ’Hea, B., Radtke, K., Raid, T., Silva, C., Van der Kamp, P., Vermand, Y., Mitrakis, N.
STECF members: Casey, J., Abella, J. A., Andersen, J., Bailey, N., Bertignac, M., Cardinale, M., Curtis, H., Daskalov, G., Delaney, A., Döring, R., Garcia Rodriguez, M., Gascuel, D., Graham, N., Gustavsson, T., Jennings, S., Kenny, A., Kirkegaard, E., Kraak, S., Kuikka, S., Malvarosa, L., Martin, P., Motova, A., Murua, H., Nowakowski, P., Prellezo, R., Sala, A., Somarakis, S., Stransky, C., Theret, F., Ulrich, C., Vanhee, W. & Van Oostenbrugge, H.
Luxembourg: Publications Office of the European Union 2011 - 1 4 2 pp. - 2 1 X 29.7 cmEUR - Scientific and Technical Research series - ISSN 1831-9424 (online), ISSN 1018-5593 (print) ISBN 978-92-79-22039-5 doi:10.2788/10803
AbstractEWG-11-11 meeting was held on 26 - 30 September 2011 in Cadiz (Spain). This Section of the report covers the Deep Sea and W estern W aters and provides fleet specific trends in catch (including discards), nominal effort and catch (landings) per unit o f effort in order to advise on fleet specific impacts on stocks under multiannual m anagement plans. STECF reviewed the report during its November 2011 plenary meeting.

How to obtain EU publications
Our priced publications are available from EU Bookshop (http://bookshop.europa.eu), where you can place an order with the sales agent of your choice.
The Publications Office has a worldw ide network of sales agents. You can obtain the ir contact details by sending a fax to (352) 29 29-42758.

The mission of the JRC is to provide customer-driven scientific and technical support for the conception, development, implementation and monitoring of EU policies. As a service of the European Commission, the JRC functions as a reference centre of science and technology for the Union. Close to the policy-making process, it serves the common interest of the Member States, while being independent of special interests, whether private or national.
E U R O P E A N C O M M I S S I O N
The Scientific, Technical and Economic Committee for Fisheries (STECF) has been established by the European Commission. The STECF is being consulted at regular intervals on matters pertaining to the conservation and management of living aquatic resources, including biological, economic, environmental, social and technical considerations.
HI■ P u b l i c a t i o n s O f f i c e
ISBN 978-92-79-22039-5
9 7 8 9 2 7 9 2 2 0 3 9 5
LB-N
A-25036-E
N-N