Embed Size (px)
Citation preview
Committee on Ecology and Transportation Newsletter
Transportation Research Board Committee ADC30 January 2017
From roosts to roots
It very much goes without saying that our world—this living, breathing, and moving planet and its inhabitants—is arriving at an important port-of-call on our journey together. It goes without saying, but it nonetheless bears reminding. We have virtually leapt from enlightenment to revolution to innovation, and back again; all-the-while struggling to dis-tinguish information from ideas. And we are at a point in our history together where that struggle is palpable. This is where the scientific method provides an exquisite medium for achieving balance with a fulcrum formed of research. That is where TRB and the all-volunteer members and friends of the Committee on Ecology and Transportation rally for substan-tive change and progress.
Together, we strive in pursuit of ideas and informa-tion. An extension of our livelihoods, the journey is ulti-mately about achieving conservation in this living world that includes being home to humanity. How we achieve that conservation is not a thing of serendipity, but the result of research where we validate information by testing ideas, and creating new ideas from tested information.
At the 96th annual TRB Annual Meeting, January 8-12, 2017 in Washington DC, we examine some of the contemporary stress-tests between transportation, infra-structure, and the natural environment. For the current and next generation of researchers and decision-makers, we are Cultivating Resilience in a crosscutting session that revisits FHWA’s Roadside Use of Native Vegetation. We also take a look at Maintaining Connectivity to distinguish the design and care of habitats at wildlife crossings from standard speci-fication in transportation rights-of-way.
At the 2017 Annual Meeting we also host the opportu-nity to educate and engage both presenters and audience in the joyful din of the TRB Environment and Energy Section poster session. We spotlight submitted papers with their emerging themes and ideas through the various sessions and workshops sponsored by the committee. Perhaps more than in any previous year, there are additional offerings in which the committee is cosponsoring; from a workshop on inno-vative use of LiDAR to sessions on pollinator conservation; alternative uses for rights-of-way; emerging technologies and challenges in biofuels; and the environmental and human health effects of rapidly emerging LED lighting technologies being deployed on our highways and byways.
During our workshop on Bats at the Crossroads, we begin the 2017 Annual Meeting emerging from transporta-tion’s relationship with life on the ground to its relationship with life—quite-literally—overhead. This half-day gather-ing brings together experts in the field of bat conservation and research with officials from state transportation and private infrastructure industry to explore and learn about balancing the need for improved and maintained transpor-tation facilities with an imperative to secure the perpetuity of quality roosting habitats, while biologists work to halt and reverse the demise of biologically and economically important bat species, some of whose North American populations are decimated by the introduced, exotic white-nose syndrome epidemic.
For the 96th TRB Annual Meeting, I want to acknowl-edge the leadership and members of other standing com-mittees with whom we have successfully collaborated for program development: Committee on Native American Transportation Issues (ABE80); Committee on Landscape and Environmental Design (AFB40); Committee on Information
View from the ChairAlex Levy, Senior Ecologist VHB
ROOTS continued on page 2
2
Transportation Research Board Committee ADC30 January 2017
Join us for the ninth biennial ICOET conference, co-hosted by the Utah and Wyoming Departments of Transportation, with support from the US DOT Federal Highway Administration.
ICOET is the foremost interdisciplinary, interagency supported conference addressing the broad range of ecological issues related to transportation systems in all modes. Experts in transportation development, related scientific study, policy issues, and administrative processes gather at ICOET to share current research, quality applications, and best practices that can enhance both the project development process and the ecological sustainability of all transportation modes.
The ICOET program includes podium presentations, posters, field trips, and exhibits on topics of interest to researchers, biologists, engineers, planners, project managers, administrators, and policy makers. Hundreds of professionals—representing government, Tribal, academic, nongovernmental, and private industry organizations—from the United States and more than 20 countries regularly attend ICOET.
We look forward to seeing you at the conference!http://www.icoet.net/ICOET_2017/index.asp
Systems and Technology (ABJ50); Committee on Geographic Information Science and Applications (ABJ60); Committee on Environmental Analysis in Transportation (ADC10); Committee on Transportation and Air Quality (ADC20); Committee on Historic and Archeological Preservation in Transportation (ADC50); Committee on Resource Conservation and Recovery (ADC60); Committee on Transportation Energy (ADC70); Committee on Alternative Transportation Fuels and Technologies (ADC80); Committee on Landscape and Environmental Design (AFB40); Committee on Roadside Maintenance Operations (AHD50); Committee on Environmental Issues in Transportation Law (AL050); Joint Subcommittee on Animal-Vehicle Collisions (ANB20(2)); Committee on Visibility (AND40); as well as the Planning and Environment Group (AD000) and the Environment and Energy Section (ADC00).
I also want to acknowledge the Environment and Energy Section Chair, Jonathan Rubin, PhD, of the University of Maine, and TRB’s senior program officer, Christine Gerencher, who—along with her staff—have patiently and lovingly toiled alongside our committee from the 2016 membership rotation through preparations for the 2017 Annual Meeting, and beyond. I especially want to acknowl-edge the members of our committee whose hard work and dedication are responsible for the showcase of ideas and con-versations that make the 2017 Annual Meeting one of our best-yet: Kris Gade, PhD, with Arizona DOT; Daniel Smith, PhD, from the University of Central Florida; Todd Nichols, with the Maryland State Highway Administration; Fraeser Shilling, PhD, at the University of California, Davis; and Jeff
Simmons, with Stantec, our new stalwart Communications Coordinator and—along with his colleagues—the editor of this newsletter.
Many of these leaders and more can also be encountered at our mid-year joint business meeting with the Committee on Environmental Analysis in Transportation (ADC10) at the 2017 International Conference on Ecology and Transportation (www.ICOET.net), May 14-18, at the Salt Palace Convention Center in Salt Lake City, Utah, for which registration is now open.
Finally, the pages you hold in your hands (or are view-ing on an illuminated screen) represent the hard work and dedication of a few of the many committee members and friends with whom I have had the privilege to collaborate, cerebrate, and celebrate for the nearly six years I’ve served as chair throughout my time as a founding member of ADC30. So it is at this point that I pen this column, my last instal-lation as committee chair. Part of the beauty of TRB is in how it sanctions enthusiasm and creates a sustainable struc-ture whereby committees are guaranteed to be refreshed with emerging ideas and leaders.
For me, it also goes without saying that my role has been a labor of love, but it is also true how rewarding is the honor I’ve had serving with the leading thinkers, researchers, and front-line practitioners in our quest to sustain and improve the relationship of ecology and transportation. The list of individuals I wish to thank for sharing their dedication and enthusiasm on this journey is long enough for a tome. So I will close by simply saying how much I look forward to the next chapter in our journey together.
Plan to attend ICOET 2017! MAY 14-18, 2017Salt Palace Convention Center, Salt Lake City, Utah
ROOTS continued from page 1
Host of the Mid-year Meetings of
the TRB Committees on Environmental Analysis
in Transportation (ADC10) and Ecology and Transportation
(ADC30)
3
Transportation Research Board Committee ADC30 January 2017
Taxa Chinese Name English Name Scientific NameProtective
LevelType of Crossing
Structures
Birds
鸮 Owl II T
雉鸡 Common pheasant Phasianus colchicus * C, B
花尾榛鸡 Hazel grouse Tetrastes bonasia II T, B
Mammals
东北兔 Manchurian hare Lepus mandschuricus * T, C, B
獾 Asian badger Meles leucurus * T
黄鼬 Siberian weasel Mustela sibirica * T, C, B
银鼠(伶鼬) Least weasel Mustela nivalis * T, C, B
狍 Siberian roe deer Capreolus pygargus * T, B
青鼬 Yellow-throated marten Martes flavigula II T, C, B
松鼠 Eurasian red squirrel Sciurus vulgaris * T, C, B
野猪 Wild boar Sus scrofa * T, B
紫貂 Sable Martes zibellina I T, C
银狐 Silver fox Vulpes vulpes C
Total: 13
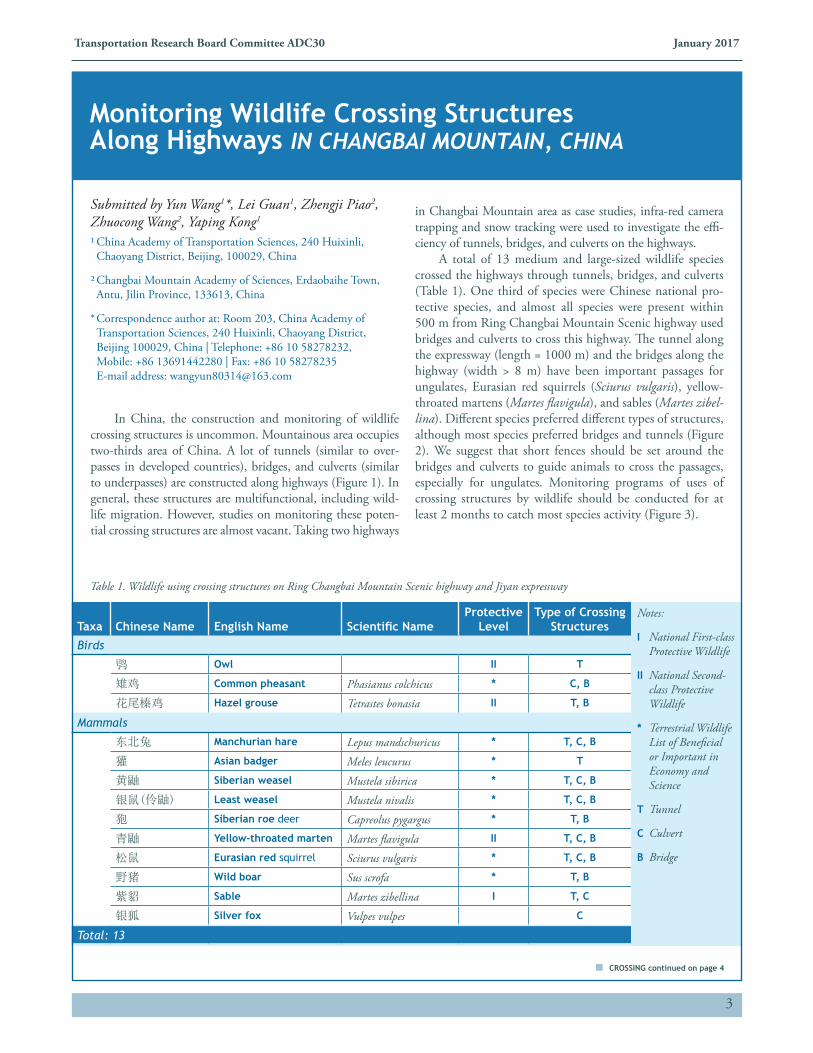
Table 1. Wildlife using crossing structures on Ring Changbai Mountain Scenic highway and Jiyan expressway
Notes:
I National First-class Protective Wildlife
II National Second-class Protective Wildlife
* Terrestrial Wildlife List of Beneficial or Important in Economy and Science
T Tunnel
C Culvert
B Bridge
Submitted by Yun Wang1*, Lei Guan1, Zhengji Piao2, Zhuocong Wang2, Yaping Kong1
1 China Academy of Transportation Sciences, 240 Huixinli, Chaoyang District, Beijing, 100029, China
2 Changbai Mountain Academy of Sciences, Erdaobaihe Town, Antu, Jilin Province, 133613, China
* Correspondence author at: Room 203, China Academy of Transportation Sciences, 240 Huixinli, Chaoyang District, Beijing 100029, China | Telephone: +86 10 58278232, Mobile: +86 13691442280 | Fax: +86 10 58278235 E-mail address: [email protected]
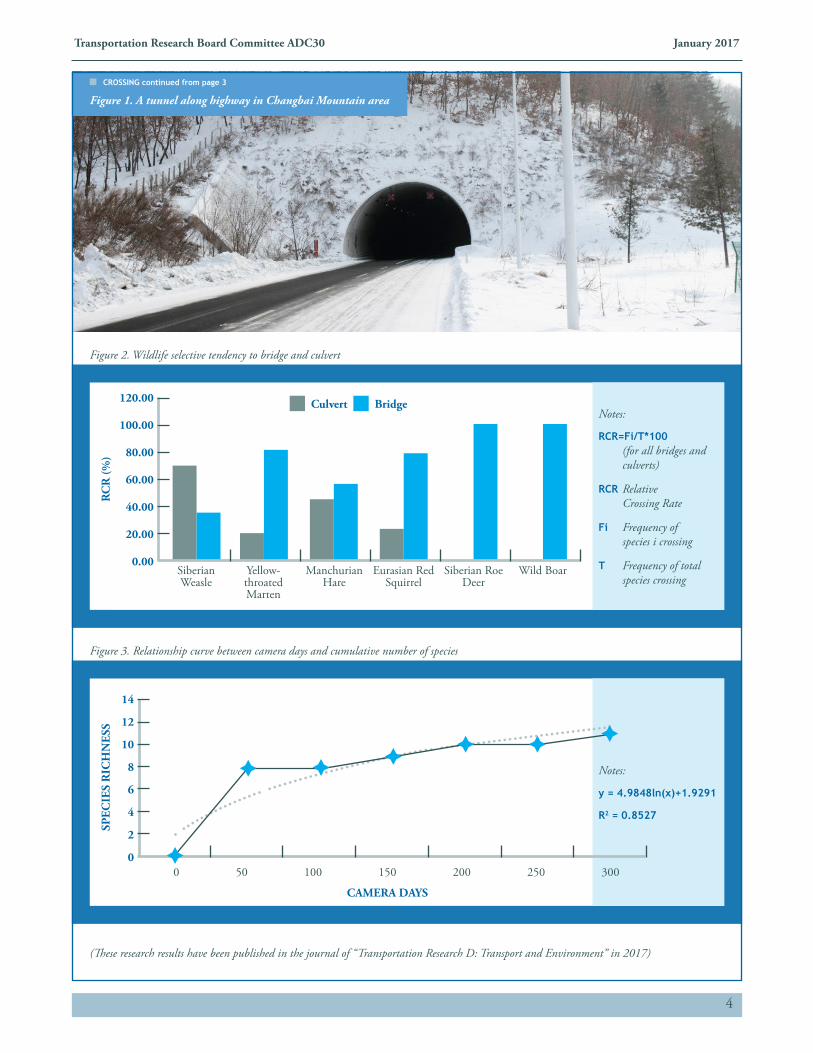
In China, the construction and monitoring of wildlife crossing structures is uncommon. Mountainous area occupies two-thirds area of China. A lot of tunnels (similar to over-passes in developed countries), bridges, and culverts (similar to underpasses) are constructed along highways (Figure 1). In general, these structures are multifunctional, including wild-life migration. However, studies on monitoring these poten-tial crossing structures are almost vacant. Taking two highways
in Changbai Mountain area as case studies, infra-red camera trapping and snow tracking were used to investigate the effi-ciency of tunnels, bridges, and culverts on the highways.
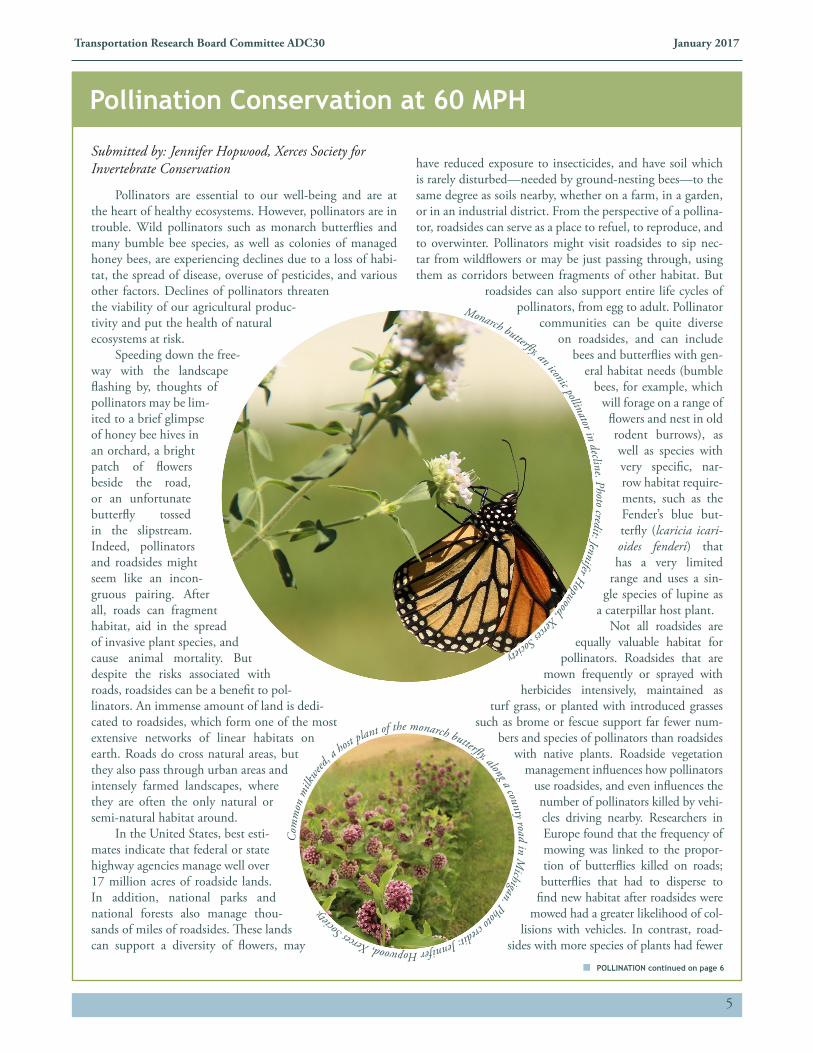
A total of 13 medium and large-sized wildlife species crossed the highways through tunnels, bridges, and culverts (Table 1). One third of species were Chinese national pro-tective species, and almost all species were present within 500 m from Ring Changbai Mountain Scenic highway used bridges and culverts to cross this highway. The tunnel along the expressway (length = 1000 m) and the bridges along the highway (width > 8 m) have been important passages for ungulates, Eurasian red squirrels (Sciurus vulgaris), yellow-throated martens (Martes flavigula), and sables (Martes zibel-lina). Different species preferred different types of structures, although most species preferred bridges and tunnels (Figure 2). We suggest that short fences should be set around the bridges and culverts to guide animals to cross the passages, especially for ungulates. Monitoring programs of uses of crossing structures by wildlife should be conducted for at least 2 months to catch most species activity (Figure 3).
Monitoring Wildlife Crossing Structures Along Highways IN CHANGBAI MOUNTAIN, CHINA
CROSSING continued on page 4
4
Transportation Research Board Committee ADC30 January 2017
Notes:
y = 4.9848ln(x)+1.9291
R2 = 0.8527
Figure 3. Relationship curve between camera days and cumulative number of species
(These research results have been published in the journal of “Transportation Research D: Transport and Environment” in 2017)
Figure 1. A tunnel along highway in Changbai Mountain area
Figure 2. Wildlife selective tendency to bridge and culvert
120.00
100.00
80.00
60.00
40.00
20.00
0.00Siberian Weasle
RC
R (%
)
Yellow-throated Marten
Manchurian Hare
Eurasian Red Squirrel
Siberian Roe Deer
Wild Boar
Culvert BridgeNotes:
RCR=Fi/T*100 (for all bridges and culverts)
RCR Relative Crossing Rate
Fi Frequency of species i crossing
T Frequency of total species crossing
0
SPEC
IES
RIC
HN
ESS
CAMERA DAYS
50 100 150 200 250 300
14
12
10
8
6
4
2
0
CROSSING continued from page 3
5
Transportation Research Board Committee ADC30 January 2017
Submitted by: Jennifer Hopwood, Xerces Society for Invertebrate Conservation
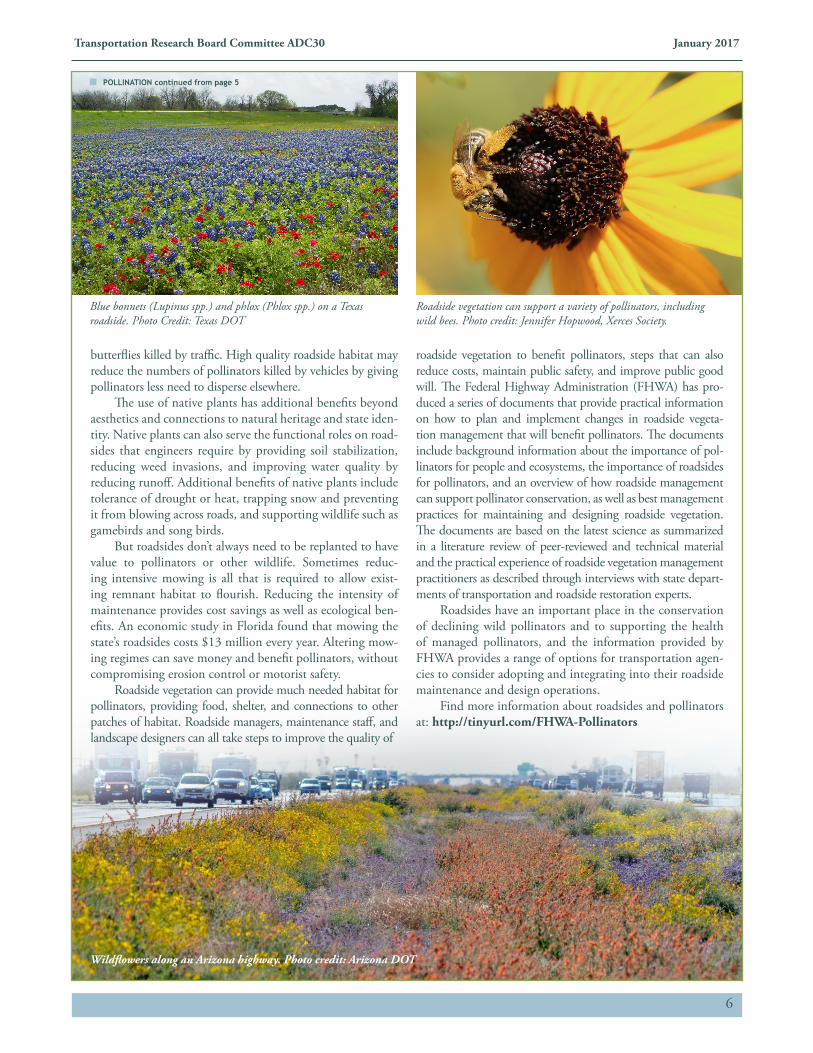
Pollinators are essential to our well-being and are at the heart of healthy ecosystems. However, pollinators are in trouble. Wild pollinators such as monarch butterflies and many bumble bee species, as well as colonies of managed honey bees, are experiencing declines due to a loss of habi-tat, the spread of disease, overuse of pesticides, and various other factors. Declines of pollinators threaten the viability of our agricultural produc-tivity and put the health of natural ecosystems at risk.
Speeding down the free-way with the landscape flashing by, thoughts of pollinators may be lim-ited to a brief glimpse of honey bee hives in an orchard, a bright patch of flowers beside the road, or an unfortunate butterfly tossed in the slipstream. Indeed, pollinators and roadsides might seem like an incon-gruous pairing. After all, roads can fragment habitat, aid in the spread of invasive plant species, and cause animal mortality. But despite the risks associated with roads, roadsides can be a benefit to pol-linators. An immense amount of land is dedi-cated to roadsides, which form one of the most extensive networks of linear habitats on earth. Roads do cross natural areas, but they also pass through urban areas and intensely farmed landscapes, where they are often the only natural or semi-natural habitat around.
In the United States, best esti-mates indicate that federal or state highway agencies manage well over 17 million acres of roadside lands. In addition, national parks and national forests also manage thou-sands of miles of roadsides. These lands can support a diversity of flowers, may
have reduced exposure to insecticides, and have soil which is rarely disturbed—needed by ground-nesting bees—to the same degree as soils nearby, whether on a farm, in a garden, or in an industrial district. From the perspective of a pollina-tor, roadsides can serve as a place to refuel, to reproduce, and to overwinter. Pollinators might visit roadsides to sip nec-tar from wildflowers or may be just passing through, using them as corridors between fragments of other habitat. But
roadsides can also support entire life cycles of pollinators, from egg to adult. Pollinator
communities can be quite diverse on roadsides, and can include
bees and butterflies with gen-eral habitat needs (bumble
bees, for example, which will forage on a range of flowers and nest in old rodent burrows), as well as species with very specific, nar-row habitat require-ments, such as the Fender’s blue but-terfly (lcaricia icari-oides fenderi) that has a very limited
range and uses a sin-gle species of lupine as
a caterpillar host plant. Not all roadsides are
equally valuable habitat for pollinators. Roadsides that are
mown frequently or sprayed with herbicides intensively, maintained as
turf grass, or planted with introduced grasses such as brome or fescue support far fewer num-
bers and species of pollinators than roadsides with native plants. Roadside vegetation
management influences how pollinators use roadsides, and even influences the number of pollinators killed by vehi-cles driving nearby. Researchers in Europe found that the frequency of mowing was linked to the propor-tion of butterflies killed on roads; butterflies that had to disperse to
find new habitat after roadsides were mowed had a greater likelihood of col-
lisions with vehicles. In contrast, road-sides with more species of plants had fewer
Pollination Conservation at 60 MPH
Monarch butterfl y, an iconic pollinator in decline. Photo credit: Jennifer Hopwood, Xerces Society
Com
mon
milk
weed
, a host
plant of the monarch butterfl y, along a county road in Michigan. Photo credit: Jennifer Hopwood, Xerce
s Soci
ety.
POLLINATION continued on page 6
6
Transportation Research Board Committee ADC30 January 2017
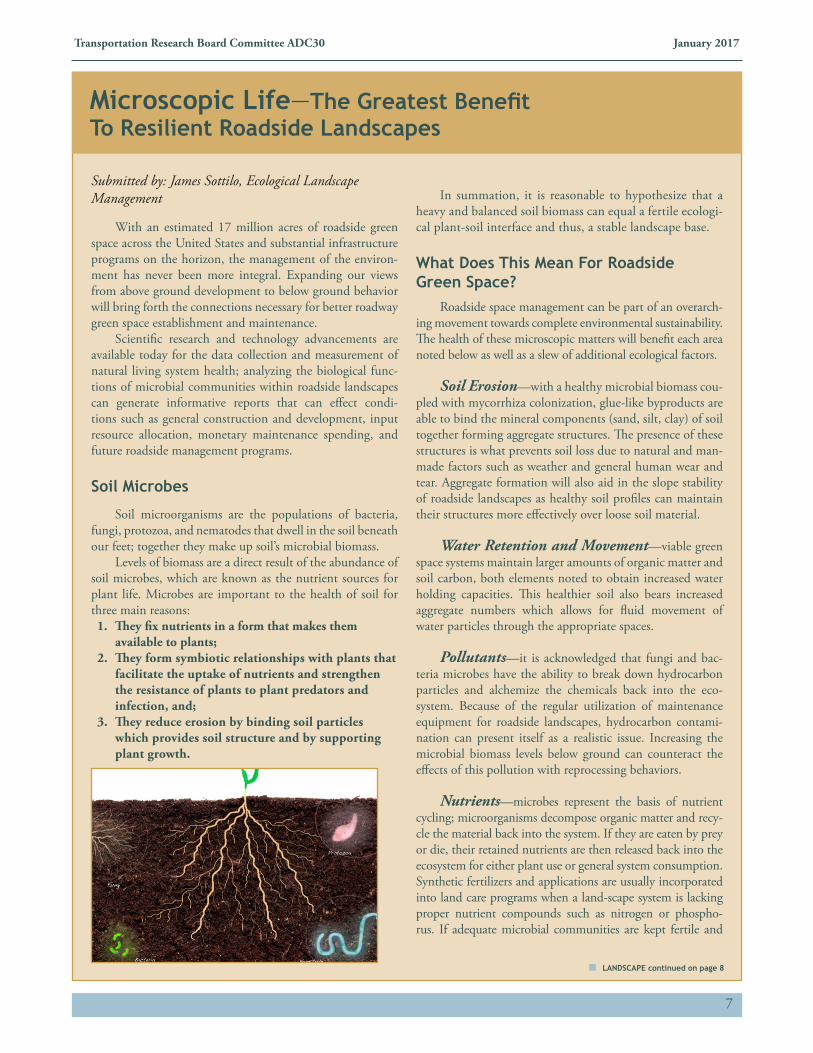
Blue bonnets (Lupinus spp.) and phlox (Phlox spp.) on a Texas roadside. Photo Credit: Texas DOT
Wildflowers along an Arizona highway. Photo credit: Arizona DOT
POLLINATION continued from page 5
Roadside vegetation can support a variety of pollinators, including wild bees. Photo credit: Jennifer Hopwood, Xerces Society.
butterflies killed by traffic. High quality roadside habitat may reduce the numbers of pollinators killed by vehicles by giving pollinators less need to disperse elsewhere.
The use of native plants has additional benefits beyond aesthetics and connections to natural heritage and state iden-tity. Native plants can also serve the functional roles on road-sides that engineers require by providing soil stabilization, reducing weed invasions, and improving water quality by reducing runoff. Additional benefits of native plants include tolerance of drought or heat, trapping snow and preventing it from blowing across roads, and supporting wildlife such as gamebirds and song birds.
But roadsides don’t always need to be replanted to have value to pollinators or other wildlife. Sometimes reduc-ing intensive mowing is all that is required to allow exist-ing remnant habitat to flourish. Reducing the intensity of maintenance provides cost savings as well as ecological ben-efits. An economic study in Florida found that mowing the state’s roadsides costs $13 million every year. Altering mow-ing regimes can save money and benefit pollinators, without compromising erosion control or motorist safety.
Roadside vegetation can provide much needed habitat for pollinators, providing food, shelter, and connections to other patches of habitat. Roadside managers, maintenance staff, and landscape designers can all take steps to improve the quality of
roadside vegetation to benefit pollinators, steps that can also reduce costs, maintain public safety, and improve public good will. The Federal Highway Administration (FHWA) has pro-duced a series of documents that provide practical information on how to plan and implement changes in roadside vegeta-tion management that will benefit pollinators. The documents include background information about the importance of pol-linators for people and ecosystems, the importance of roadsides for pollinators, and an overview of how roadside management can support pollinator conservation, as well as best management practices for maintaining and designing roadside vegetation. The documents are based on the latest science as summarized in a literature review of peer-reviewed and technical material and the practical experience of roadside vegetation management practitioners as described through interviews with state depart-ments of transportation and roadside restoration experts.
Roadsides have an important place in the conservation of declining wild pollinators and to supporting the health of managed pollinators, and the information provided by FHWA provides a range of options for transportation agen-cies to consider adopting and integrating into their roadside maintenance and design operations.
Find more information about roadsides and pollinators at: http://tinyurl.com/FHWA-Pollinators
7
Transportation Research Board Committee ADC30 January 2017
Submitted by: James Sottilo, Ecological Landscape Management
With an estimated 17 million acres of roadside green space across the United States and substantial infrastructure programs on the horizon, the management of the environ-ment has never been more integral. Expanding our views from above ground development to below ground behavior will bring forth the connections necessary for better roadway green space establishment and maintenance.
Scientific research and technology advancements are available today for the data collection and measurement of natural living system health; analyzing the biological func-tions of microbial communities within roadside landscapes can generate informative reports that can effect condi-tions such as general construction and development, input resource allocation, monetary maintenance spending, and future roadside management programs.
Soil Microbes
Soil microorganisms are the populations of bacteria, fungi, protozoa, and nematodes that dwell in the soil beneath our feet; together they make up soil’s microbial biomass.
Levels of biomass are a direct result of the abundance of soil microbes, which are known as the nutrient sources for plant life. Microbes are important to the health of soil for three main reasons: 1. They fix nutrients in a form that makes them
available to plants;2. They form symbiotic relationships with plants that
facilitate the uptake of nutrients and strengthen the resistance of plants to plant predators and infection, and;
3. They reduce erosion by binding soil particles which provides soil structure and by supporting plant growth.
In summation, it is reasonable to hypothesize that a heavy and balanced soil biomass can equal a fertile ecologi-cal plant-soil interface and thus, a stable landscape base.
What Does This Mean For Roadside Green Space?
Roadside space management can be part of an overarch-ing movement towards complete environmental sustainability. The health of these microscopic matters will benefit each area noted below as well as a slew of additional ecological factors.
Soil Erosion—with a healthy microbial biomass cou-pled with mycorrhiza colonization, glue-like byproducts are able to bind the mineral components (sand, silt, clay) of soil together forming aggregate structures. The presence of these structures is what prevents soil loss due to natural and man-made factors such as weather and general human wear and tear. Aggregate formation will also aid in the slope stability of roadside landscapes as healthy soil profiles can maintain their structures more effectively over loose soil material.
Water Retention and Movement—viable green space systems maintain larger amounts of organic matter and soil carbon, both elements noted to obtain increased water holding capacities. This healthier soil also bears increased aggregate numbers which allows for fluid movement of water particles through the appropriate spaces.
Pollutants—it is acknowledged that fungi and bac-teria microbes have the ability to break down hydrocarbon particles and alchemize the chemicals back into the eco-system. Because of the regular utilization of maintenance equipment for roadside landscapes, hydrocarbon contami-nation can present itself as a realistic issue. Increasing the microbial biomass levels below ground can counteract the effects of this pollution with reprocessing behaviors.
Nutrients—microbes represent the basis of nutrient cycling; microorganisms decompose organic matter and recy-cle the material back into the system. If they are eaten by prey or die, their retained nutrients are then released back into the ecosystem for either plant use or general system consumption. Synthetic fertilizers and applications are usually incorporated into land care programs when a land-scape system is lacking proper nutrient compounds such as nitrogen or phospho-rus. If adequate microbial communities are kept fertile and
Microscopic Life—The Greatest Benefit To Resilient Roadside Landscapes
LANDSCAPE continued on page 8
8
Transportation Research Board Committee ADC30 January 2017
naturally present, chemical fertilization input methods and resources can be eliminated.
Carbon Sequestration—as plants photosynthesize, carbon dioxide is taken out of the air to become part of the pho-tosynthates that fuel plant growth as well as root exudates that leach into the rhizo-sphere to feed microbial communities. As microbes are made up of 50 percent carbon, their abundance is a direct link to soil car-bon and carbon sinks.
Biodiversity—biodiversity is just as important below ground as it is above. Dynamic groupings of flora above ground provide broad areas for beneficial plants and pollinators to thrive, and provide wild-life habit and they aesthetically pleasing space. The planting of varieties of fauna can also impact below ground microbial popu-lations as different exudates can populate the soil with contrasting organism commu-nities. It is recognized that areas containing various faunas tend to have healthier bio-logical measurements. In general, assorted groupings of microbes catalyze plant-root-soil behaviors for long term sustainability.
Available Technology
Measuring the microbial biomass of any landscape has always been viewed as a daunting task that can have over-whelming effects on budgets, time resources, and labor. The truth now lies in the advancements of present day technol-ogy and testing techniques. The new and innovative means that are available for environmental measurement such as microbial biomass populations, introduce simple, inexpen-sive equipment and processes. One test option available is the U.S. patented MicroBiometer™.
This particular field-test allows for the on-site collection of soil, equipment for microbial load testing and a tracking database program for a fraction of lab analysis work costs while also returning data within 15 minutes. Alternatives such as this have the potential to revolutionize the way land space across the nation is accounted for and deliver results that will paint a vivid picture of roadway green space health and long term success. With such opportunity, entities such as DOTs now have the means of effectively tracking roadside land space through each state and compiling monumental data that will serve as an extension of the goals associated with transportation and ecology.
Looking Forward
We now stand at a pivotal crossroad where evaluating this green space can be assessed on both quantitative and qualitative scales. This direction will aid in the focus of cre-ating roadside space as not only sustainable acreage but also resilient landscape space playing an important role in large scale environmental protection, preservation, and awareness.
Interested in learning even more? Join us Tuesday, January 10, 2017 as James Sottilo presents at the 2017 Annual Meeting of the Transportation Research Board in Washington, DC. More information about the meeting can be found here: http://www.trb.org/AnnualMeeting/AnnualMeeting.aspx
James Sottilo, Ecological Landscape Management373 Smithtown bypass, Suite 256 Hauppague, NY 11788-2516Tel: (631) [email protected]
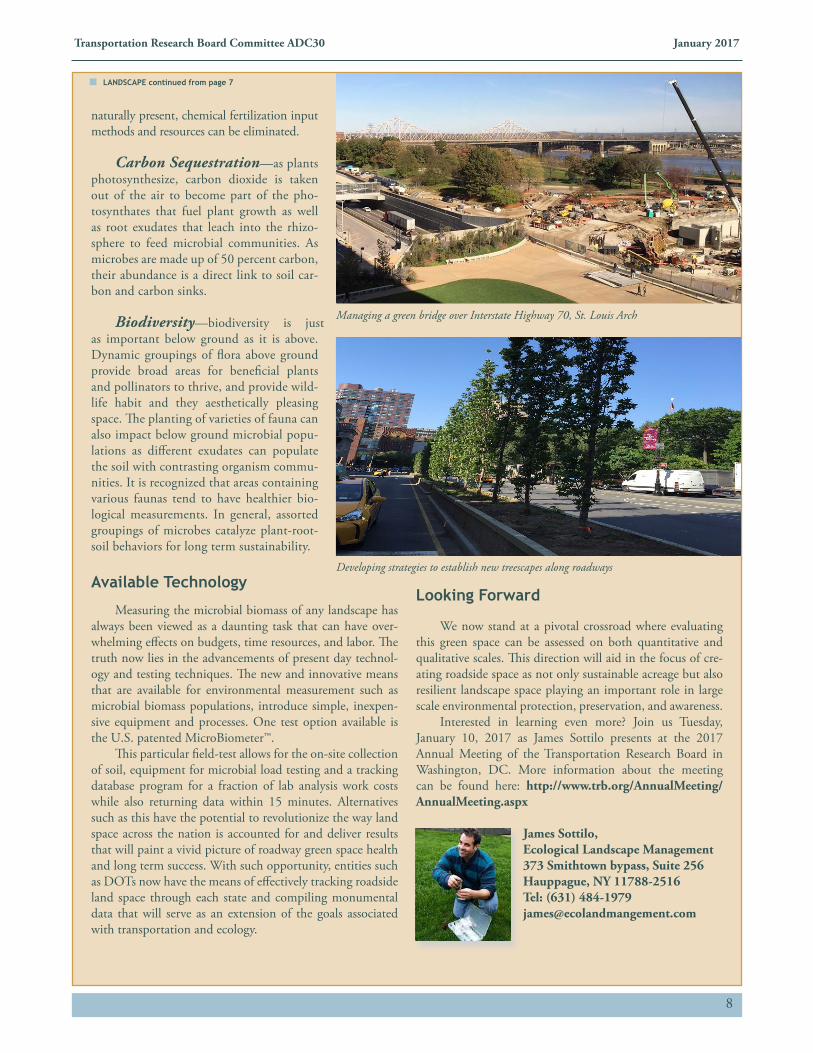
Managing a green bridge over Interstate Highway 70, St. Louis Arch
Developing strategies to establish new treescapes along roadways
LANDSCAPE continued from page 7
9
Transportation Research Board Committee ADC30 January 2017
Submitted by: Jeff Gagnon, Statewide Research Biologist, Arizona Game and Fish Department
Wildlife crossings (underpasses and overpasses) facili-tate wildlife movements across roads, reducing collisions and maintaining habitat connectivity for many species. A key component to successful wildlife crossings is exclusion-ary (or “funnel”) fencing. Fencing reduces wildlife access to roads and funnels them to wildlife crossings accelerating the learning curve for species in an area where new wildlife crossings are implemented.
Once wildlife crossings are connected with fencing, one common question is “Where do you end the fence?”. There is no one-size-fits all approach for length of fence and such considerations should be site-specific. In many cases fencing can be taken well beyond a wildlife-vehicle collision hotspot or known wildlife movement corridor with the assumption that animals would rather use the wildlife crossing than travel all the way around the end of the fence to get to the same location. In other cases, attempts to turn the end of the fence away from the road to steer animals in a different direction, tie fencing into cliffs, or place large boulders at the ends of
fences to deter wildlife have been suggested. However, little information exists on the effectiveness of these approaches.
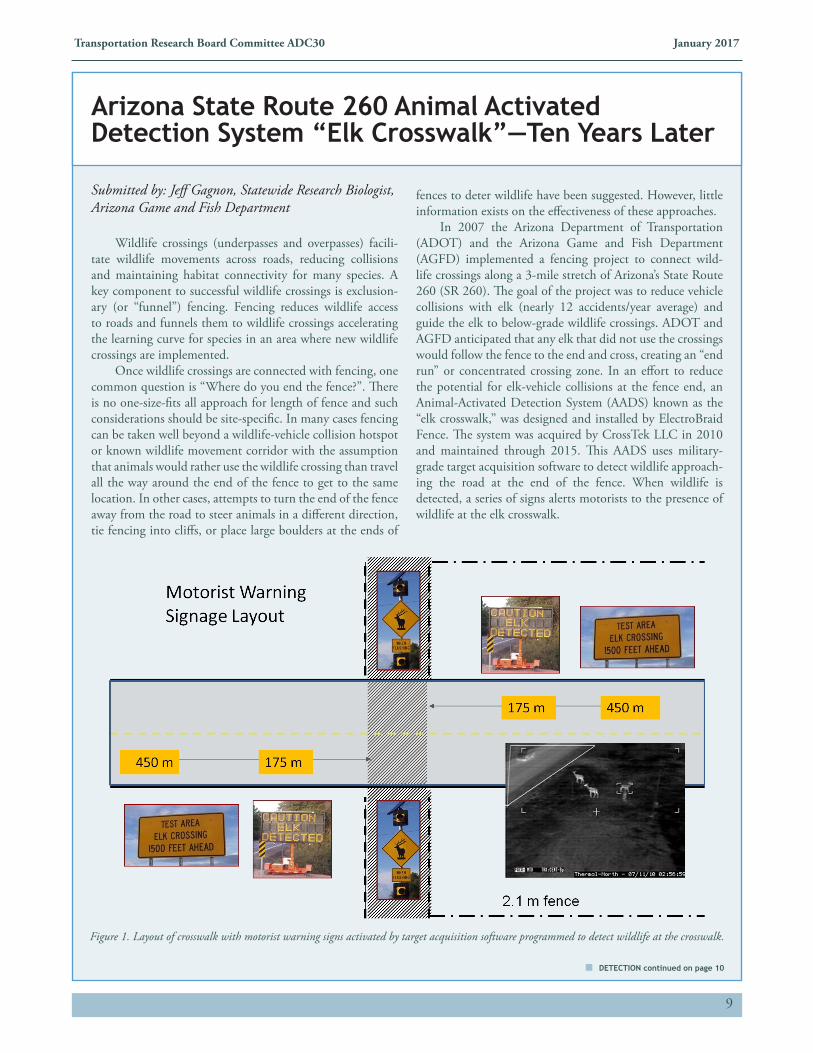
In 2007 the Arizona Department of Transportation (ADOT) and the Arizona Game and Fish Department (AGFD) implemented a fencing project to connect wild-life crossings along a 3-mile stretch of Arizona’s State Route 260 (SR 260). The goal of the project was to reduce vehicle collisions with elk (nearly 12 accidents/year average) and guide the elk to below-grade wildlife crossings. ADOT and AGFD anticipated that any elk that did not use the crossings would follow the fence to the end and cross, creating an “end run” or concentrated crossing zone. In an effort to reduce the potential for elk-vehicle collisions at the fence end, an Animal-Activated Detection System (AADS) known as the “elk crosswalk,” was designed and installed by ElectroBraid Fence. The system was acquired by CrossTek LLC in 2010 and maintained through 2015. This AADS uses military-grade target acquisition software to detect wildlife approach-ing the road at the end of the fence. When wildlife is detected, a series of signs alerts motorists to the presence of wildlife at the elk crosswalk.
Arizona State Route 260 Animal Activated Detection System “Elk Crosswalk”—Ten Years Later
Figure 1. Layout of crosswalk with motorist warning signs activated by target acquisition software programmed to detect wildlife at the crosswalk.
DETECTION continued on page 10
10
Transportation Research Board Committee ADC30 January 2017
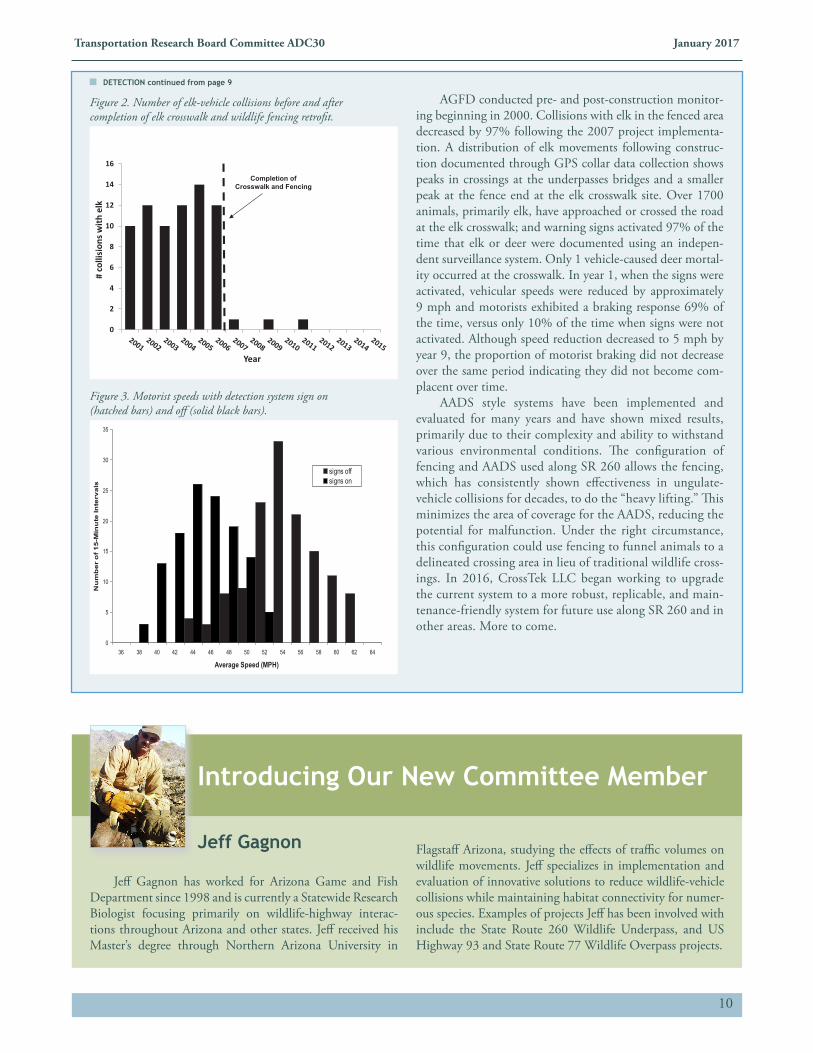
AGFD conducted pre- and post-construction monitor-ing beginning in 2000. Collisions with elk in the fenced area decreased by 97% following the 2007 project implementa-tion. A distribution of elk movements following construc-tion documented through GPS collar data collection shows peaks in crossings at the underpasses bridges and a smaller peak at the fence end at the elk crosswalk site. Over 1700 animals, primarily elk, have approached or crossed the road at the elk crosswalk; and warning signs activated 97% of the time that elk or deer were documented using an indepen-dent surveillance system. Only 1 vehicle-caused deer mortal-ity occurred at the crosswalk. In year 1, when the signs were activated, vehicular speeds were reduced by approximately 9 mph and motorists exhibited a braking response 69% of the time, versus only 10% of the time when signs were not activated. Although speed reduction decreased to 5 mph by year 9, the proportion of motorist braking did not decrease over the same period indicating they did not become com-placent over time.
AADS style systems have been implemented and evaluated for many years and have shown mixed results, primarily due to their complexity and ability to withstand various environmental conditions. The configuration of fencing and AADS used along SR 260 allows the fencing, which has consistently shown effectiveness in ungulate-vehicle collisions for decades, to do the “heavy lifting.” This minimizes the area of coverage for the AADS, reducing the potential for malfunction. Under the right circumstance, this configuration could use fencing to funnel animals to a delineated crossing area in lieu of traditional wildlife cross-ings. In 2016, CrossTek LLC began working to upgrade the current system to a more robust, replicable, and main-tenance-friendly system for future use along SR 260 and in other areas. More to come.
0
2
4
6
8
10
12
14
16
# co
llisi
ons w
ith e
lk
Year
Completion of Crosswalk and Fencing
Study Methods Researchers with Wildlife Contracts Branch evaluated crosswalk and fence effectiveness by collecting motorist and animal response data. Motorists’ response data included speed and braking when the signs were activated as well as wildlife-vehicle collision rates. Wildlife re-sponse data included video surveillance of their behavior, and elk ability to successfully cross SR 260 was measured by Global Positioning System (GPS) movement data.
Results Motorists responded to the warning system by reducing their speed by nearly 10 mph and braking 70% of the time when signs were acti-vated (Figures 2 and 3). Average collisions with elk per year were reduced by 97%.
Wildlife successfully crossed the highway during 27% of the approaches, and 86% of these crossings occurred between 1:00 AM to 4:00 AM when traffic volume was lowest (32 veh/hr). Passage rates of GPS collared elk were reduced by 70% following project completion.
Conclusions Wildlife crosswalks provide an effective alter-native to costly wildlife crossing structures by reducing wildlife-vehicle collisions and main-taining habitat connectivity. However, as with wildlife crossing structures, fencing to funnel the animals to the crosswalk is necessary to en-sure its success.
When using fencing to funnel wildlife to highway crossings, crossing opportunities should be adequately spaced to encourage us-age and to reduce habitat fragmentation. Spac-ing of structures will depend on the species.
Because increases in traffic volume reduce successful crossings for many wildlife species, the ability of animal-activated crosswalks in promoting wildlife passage is inherently lim-ited to highways with relatively low to moder-ate traffic volumes. Along highways where traffic volumes are higher, wildlife crossing structures are the best option.
Special thanks to Arizona Department of Transportation,
CrossTek LLC and US Fish and Wildlife Service Wildlife and Sport Fish Restoration Program.
Figure 3. Motorist speeds with detection system sign on (striped bars) and off (black bars).
0
5
10
15
20
25
30
35
36 38 40 42 44 46 48 50 52 54 56 58 60 62 64
Average Speed (MPH)
Nu
mb
er
of
15
-Min
ute
Inte
rva
ls
signs offsigns on
Figure 2. Number of elk-vehicle collisions before and after completion of elk crosswalk and wildlife fencing retrofit.
Figure 2. Number of elk-vehicle collisions before and after completion of elk crosswalk and wildlife fencing retrofit.
Figure 3. Motorist speeds with detection system sign on (hatched bars) and off (solid black bars).
Introducing Our New Committee Member
Jeff Gagnon
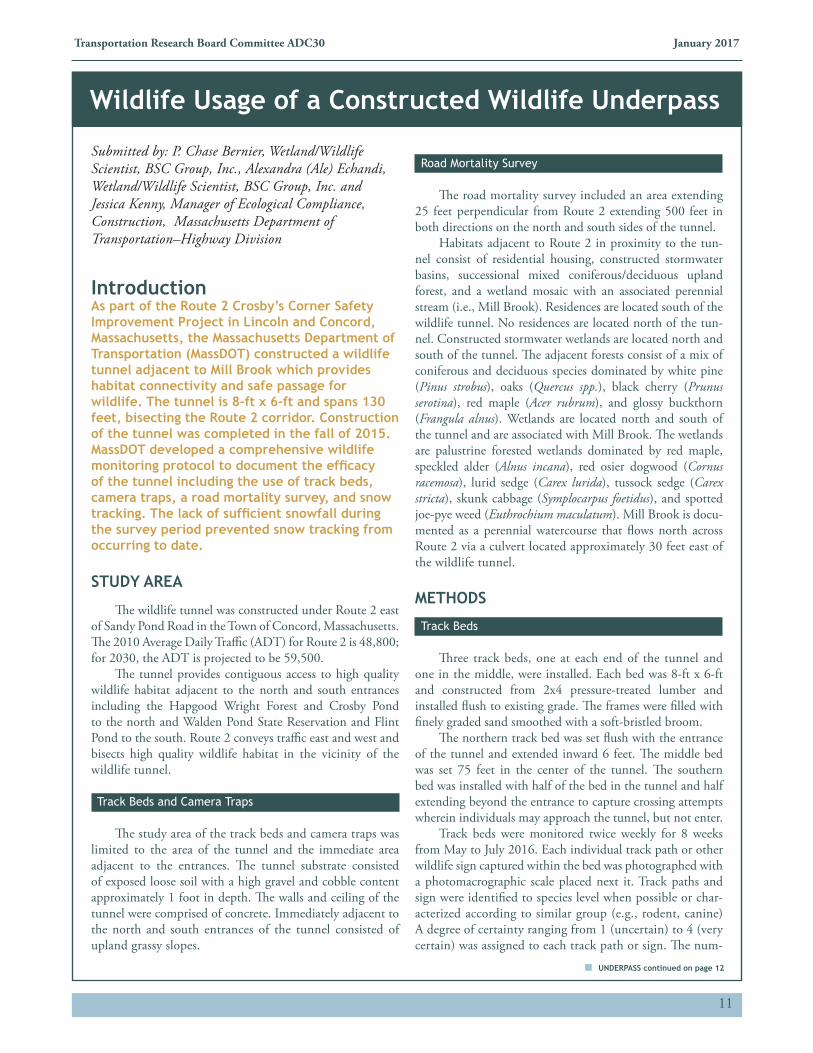
Jeff Gagnon has worked for Arizona Game and Fish Department since 1998 and is currently a Statewide Research Biologist focusing primarily on wildlife-highway interac-tions throughout Arizona and other states. Jeff received his Master’s degree through Northern Arizona University in
Flagstaff Arizona, studying the effects of traffic volumes on wildlife movements. Jeff specializes in implementation and evaluation of innovative solutions to reduce wildlife-vehicle collisions while maintaining habitat connectivity for numer-ous species. Examples of projects Jeff has been involved with include the State Route 260 Wildlife Underpass, and US Highway 93 and State Route 77 Wildlife Overpass projects.
DETECTION continued from page 9
11
Transportation Research Board Committee ADC30 January 2017
Submitted by: P. Chase Bernier, Wetland/Wildlife Scientist, BSC Group, Inc., Alexandra (Ale) Echandi, Wetland/Wildlife Scientist, BSC Group, Inc. and Jessica Kenny, Manager of Ecological Compliance, Construction, Massachusetts Department of Transportation–Highway Division
IntroductionAs part of the Route 2 Crosby’s Corner Safety Improvement Project in Lincoln and Concord, Massachusetts, the Massachusetts Department of Transportation (MassDOT) constructed a wildlife tunnel adjacent to Mill Brook which provides habitat connectivity and safe passage for wildlife. The tunnel is 8-ft x 6-ft and spans 130 feet, bisecting the Route 2 corridor. Construction of the tunnel was completed in the fall of 2015. MassDOT developed a comprehensive wildlife monitoring protocol to document the efficacy of the tunnel including the use of track beds, camera traps, a road mortality survey, and snow tracking. The lack of sufficient snowfall during the survey period prevented snow tracking from occurring to date.
STUDY AREA
The wildlife tunnel was constructed under Route 2 east of Sandy Pond Road in the Town of Concord, Massachusetts. The 2010 Average Daily Traffic (ADT) for Route 2 is 48,800; for 2030, the ADT is projected to be 59,500.
The tunnel provides contiguous access to high quality wildlife habitat adjacent to the north and south entrances including the Hapgood Wright Forest and Crosby Pond to the north and Walden Pond State Reservation and Flint Pond to the south. Route 2 conveys traffic east and west and bisects high quality wildlife habitat in the vicinity of the wildlife tunnel.
Track Beds and Camera Traps
The study area of the track beds and camera traps was limited to the area of the tunnel and the immediate area adjacent to the entrances. The tunnel substrate consisted of exposed loose soil with a high gravel and cobble content approximately 1 foot in depth. The walls and ceiling of the tunnel were comprised of concrete. Immediately adjacent to the north and south entrances of the tunnel consisted of upland grassy slopes.
Road Mortality Survey
The road mortality survey included an area extending 25 feet perpendicular from Route 2 extending 500 feet in both directions on the north and south sides of the tunnel.
Habitats adjacent to Route 2 in proximity to the tun-nel consist of residential housing, constructed stormwater basins, successional mixed coniferous/deciduous upland forest, and a wetland mosaic with an associated perennial stream (i.e., Mill Brook). Residences are located south of the wildlife tunnel. No residences are located north of the tun-nel. Constructed stormwater wetlands are located north and south of the tunnel. The adjacent forests consist of a mix of coniferous and deciduous species dominated by white pine (Pinus strobus), oaks (Quercus spp.), black cherry (Prunus serotina), red maple (Acer rubrum), and glossy buckthorn (Frangula alnus). Wetlands are located north and south of the tunnel and are associated with Mill Brook. The wetlands are palustrine forested wetlands dominated by red maple, speckled alder (Alnus incana), red osier dogwood (Cornus racemosa), lurid sedge (Carex lurida), tussock sedge (Carex stricta), skunk cabbage (Symplocarpus foetidus), and spotted joe-pye weed (Euthrochium maculatum). Mill Brook is docu-mented as a perennial watercourse that flows north across Route 2 via a culvert located approximately 30 feet east of the wildlife tunnel.
METHODS
Track Beds
Three track beds, one at each end of the tunnel and one in the middle, were installed. Each bed was 8-ft x 6-ft and constructed from 2x4 pressure-treated lumber and installed flush to existing grade. The frames were filled with finely graded sand smoothed with a soft-bristled broom.
The northern track bed was set flush with the entrance of the tunnel and extended inward 6 feet. The middle bed was set 75 feet in the center of the tunnel. The southern bed was installed with half of the bed in the tunnel and half extending beyond the entrance to capture crossing attempts wherein individuals may approach the tunnel, but not enter.
Track beds were monitored twice weekly for 8 weeks from May to July 2016. Each individual track path or other wildlife sign captured within the bed was photographed with a photomacrographic scale placed next it. Track paths and sign were identified to species level when possible or char-acterized according to similar group (e.g., rodent, canine) A degree of certainty ranging from 1 (uncertain) to 4 (very certain) was assigned to each track path or sign. The num-
Wildlife Usage of a Constructed Wildlife Underpass
UNDERPASS continued on page 12
12
Transportation Research Board Committee ADC30 January 2017
ber and direction of track paths and sign was also recorded by sketching the general location and path on a bed-spe-cific datasheet. Wildlife sign immediately adjacent to the beds was also recorded.
Crossing rates were calculated by comparing the num-ber of individuals per species that crossed each individual track bed to the total number of individuals per species crossing all three beds in each direction during each survey period. Individuals which crossed all three beds were con-sidered to be have successfully crossed through the tunnel.
Camera Traps
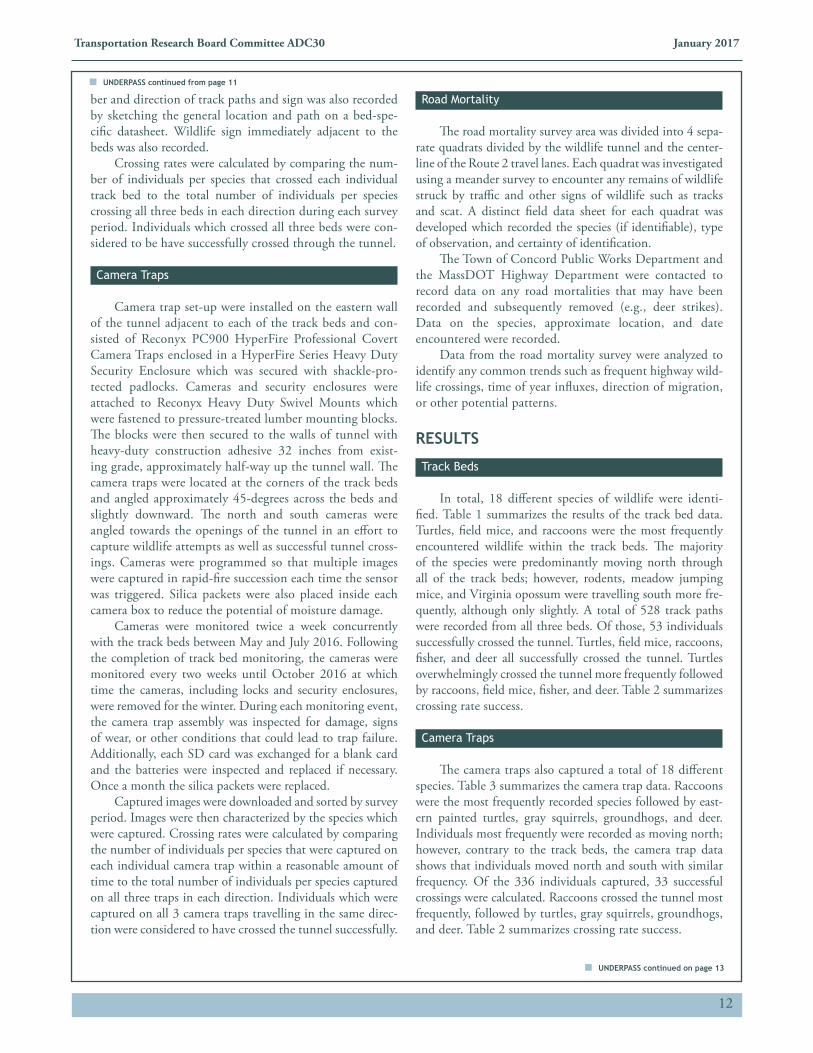
Camera trap set-up were installed on the eastern wall of the tunnel adjacent to each of the track beds and con-sisted of Reconyx PC900 HyperFire Professional Covert Camera Traps enclosed in a HyperFire Series Heavy Duty Security Enclosure which was secured with shackle-pro-tected padlocks. Cameras and security enclosures were attached to Reconyx Heavy Duty Swivel Mounts which were fastened to pressure-treated lumber mounting blocks. The blocks were then secured to the walls of tunnel with heavy-duty construction adhesive 32 inches from exist-ing grade, approximately half-way up the tunnel wall. The camera traps were located at the corners of the track beds and angled approximately 45-degrees across the beds and slightly downward. The north and south cameras were angled towards the openings of the tunnel in an effort to capture wildlife attempts as well as successful tunnel cross-ings. Cameras were programmed so that multiple images were captured in rapid-fire succession each time the sensor was triggered. Silica packets were also placed inside each camera box to reduce the potential of moisture damage.
Cameras were monitored twice a week concurrently with the track beds between May and July 2016. Following the completion of track bed monitoring, the cameras were monitored every two weeks until October 2016 at which time the cameras, including locks and security enclosures, were removed for the winter. During each monitoring event, the camera trap assembly was inspected for damage, signs of wear, or other conditions that could lead to trap failure. Additionally, each SD card was exchanged for a blank card and the batteries were inspected and replaced if necessary. Once a month the silica packets were replaced.
Captured images were downloaded and sorted by survey period. Images were then characterized by the species which were captured. Crossing rates were calculated by comparing the number of individuals per species that were captured on each individual camera trap within a reasonable amount of time to the total number of individuals per species captured on all three traps in each direction. Individuals which were captured on all 3 camera traps travelling in the same direc-tion were considered to have crossed the tunnel successfully.
Road Mortality Survey
The road mortality survey area was divided into 4 sepa-rate quadrats divided by the wildlife tunnel and the center-line of the Route 2 travel lanes. Each quadrat was investigated using a meander survey to encounter any remains of wildlife struck by traffic and other signs of wildlife such as tracks and scat. A distinct field data sheet for each quadrat was developed which recorded the species (if identifiable), type of observation, and certainty of identification.
The Town of Concord Public Works Department and the MassDOT Highway Department were contacted to record data on any road mortalities that may have been recorded and subsequently removed (e.g., deer strikes). Data on the species, approximate location, and date encountered were recorded.
Data from the road mortality survey were analyzed to identify any common trends such as frequent highway wild-life crossings, time of year influxes, direction of migration, or other potential patterns.
RESULTS
Track Beds
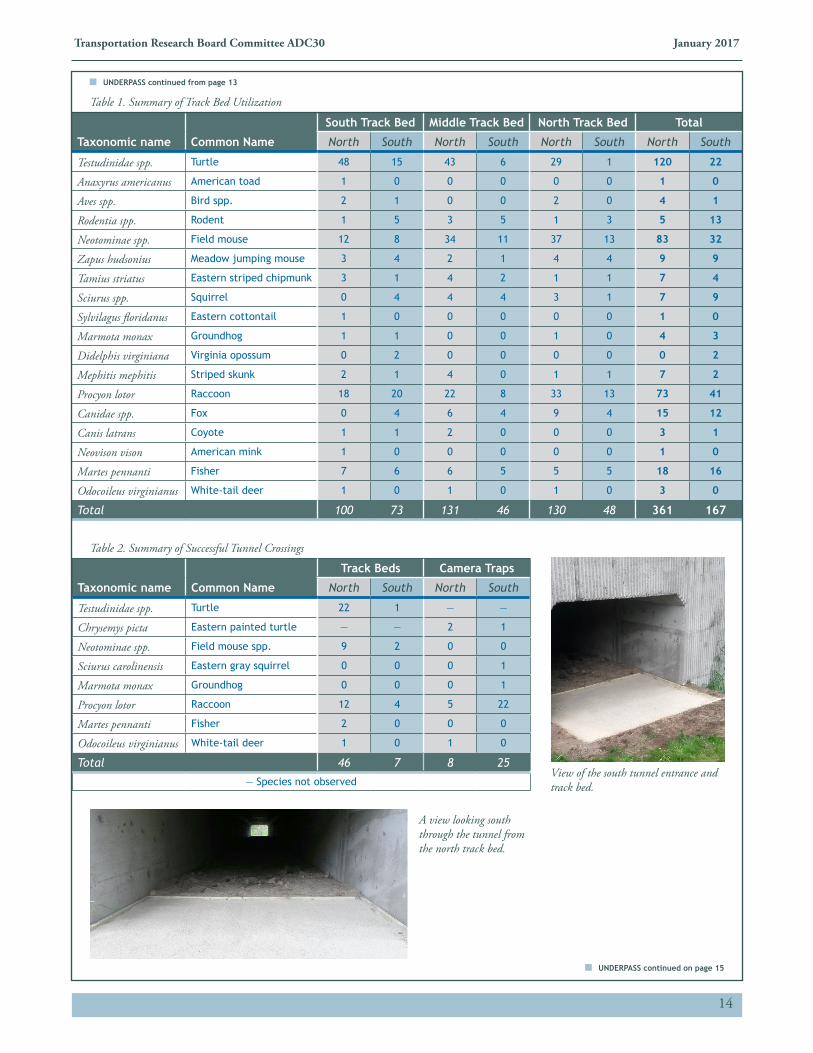
In total, 18 different species of wildlife were identi-fied. Table 1 summarizes the results of the track bed data. Turtles, field mice, and raccoons were the most frequently encountered wildlife within the track beds. The majority of the species were predominantly moving north through all of the track beds; however, rodents, meadow jumping mice, and Virginia opossum were travelling south more fre-quently, although only slightly. A total of 528 track paths were recorded from all three beds. Of those, 53 individuals successfully crossed the tunnel. Turtles, field mice, raccoons, fisher, and deer all successfully crossed the tunnel. Turtles overwhelmingly crossed the tunnel more frequently followed by raccoons, field mice, fisher, and deer. Table 2 summarizes crossing rate success.
Camera Traps
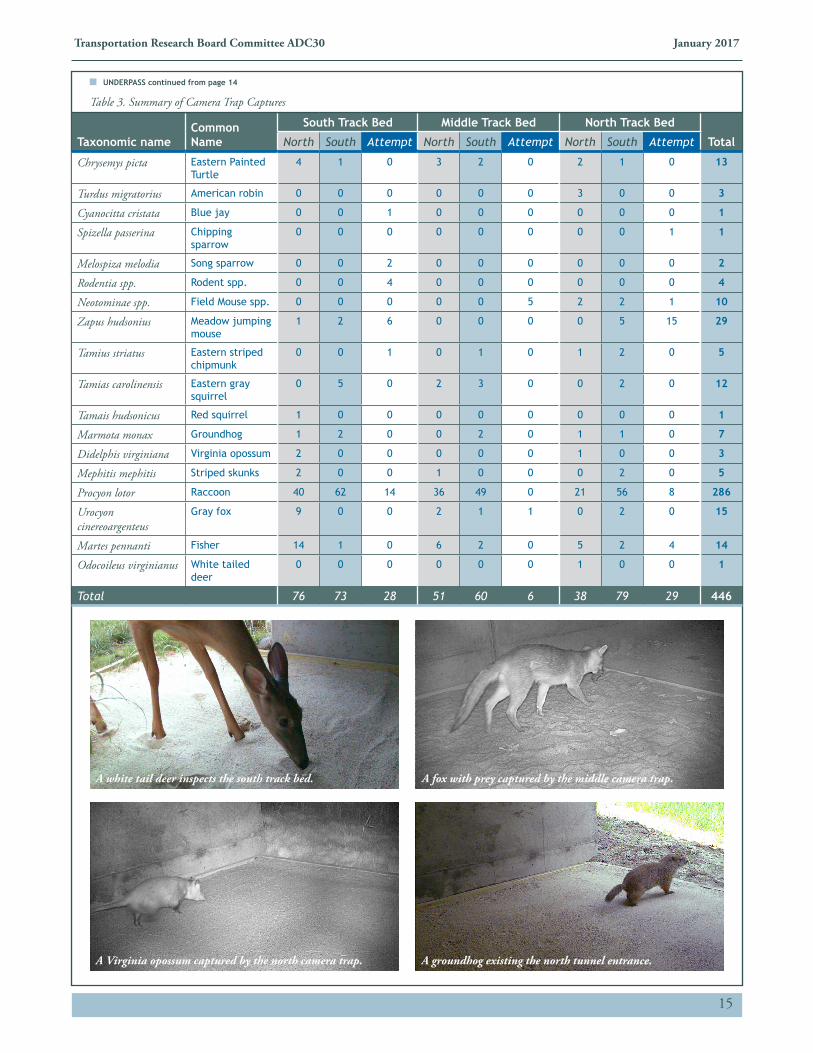
The camera traps also captured a total of 18 different species. Table 3 summarizes the camera trap data. Raccoons were the most frequently recorded species followed by east-ern painted turtles, gray squirrels, groundhogs, and deer. Individuals most frequently were recorded as moving north; however, contrary to the track beds, the camera trap data shows that individuals moved north and south with similar frequency. Of the 336 individuals captured, 33 successful crossings were calculated. Raccoons crossed the tunnel most frequently, followed by turtles, gray squirrels, groundhogs, and deer. Table 2 summarizes crossing rate success.
UNDERPASS continued from page 11
UNDERPASS continued on page 13
13
Transportation Research Board Committee ADC30 January 2017
Road Mortality Survey
No wildlife strikes other than small reptiles, birds, and small mammals were observed. A total of 13 species remains were observed (mostly in the southwest quadrant). Eastern painted turtles were the most common species’ remains encountered, with 198 strikes, predominantly located in the SW Quad. The unusually high number of eastern box turtle strikes is hypothesized to be the result of the drought condi-tions, with the turtles migrating from a smaller (drier) pond and wetland system south of the roadway to a larger wet-land system north of the highway. The turtles were migrating through the SW Quad, northerly toward the larger wetland system. Twelve other species’ remains were infrequent and observed within the roadway from vehicle strikes with only occasional encounters along an adjacent road or vegetated habitats. Other wildlife signs observed including scat, tracks, burrows, and numerous live encounters.
DISCUSSION
Using multiple methods to document wildlife usage of the tunnel was beneficial. Each method provided benefits and worked well in concert with each other.
Track Beds
The track beds were effective in accurately recording species’ movements; however, it was often difficult to prop-erly identify the individual tracks to species level due to being weathered and tracked over. As the season progressed, the north and south beds experienced aggressive weed growth resulting in false triggers of the camera traps and reduced the effectiveness of the beds.
Camera Traps
The camera traps captured clear pictures and provided confirmation of which species were utilizing the tunnel. They allowed for species identification of similar tracks and provided confirmation of which individuals successfully tra-versed the tunnel and at what times wildlife utilized the tun-nel most frequently.
Several challenges to effectively capture pictures of the wildlife were encountered. The height and location of the camera mounts provided limited flexibility to adjust the angle of the camera and the height at which they were installed created blind spots. The narrow width of the field prevented the successful capture of individuals traveling quickly or that were too small to trigger the sensor. Views of the tunnel entrances were also not possible. Thus, attempts at crossing were restricted to wildlife at the entrances that at least partially entered the tunnel.
Road Mortality Survey
The road mortality survey effectively documented wildlife that were not utilizing the tunnel and were instead crossing Route 2. The walking meander survey provided an effective method of documenting wildlife; however, the dan-ger of the Route 2 travel lanes prevented removal and exten-sive investigation of wildlife remains. The unusually high number of strikes of eastern painted turtle may have been associated with the unusual drought conditions in 2016, evi-denced by migration from a smaller pond on the south side of the highway to a larger pond on the north side.
RECOMMENDATIONS
Documenting wildlife usage of the tunnel underpass utilizing a combination of track beds and camera traps has been a success. Despite the challenges noted above, the methodology of utilizing multiple techniques provides more thorough collection of data. In order to improve the qual-ity of data collected, the following recommendations and improvements are provided:
Track Beds
• Line the beds with geotextile/weed barrier to reduce vegeta-tive growth through the tracking medium (i.e., sand); and
• Refill the beds to within 0.25-inches with fine sand to replace the volume of settled sand.
Camera Traps
• Relocate the traps lower on the wall so that the motion sensors are just above the top of the track bed frames so more wildlife trigger the sensors;
• Reposition the traps to the center of the length of the track beds so the camera angle can be better manipulated to encounter a greater number of individuals as they cross the beds; and
• Add 2 additional camera traps that are installed outside of the tunnel and positioned to aim towards the entrances down the tunnel to document wildlife attempts.
Road Mortality Survey
• GPS locate and/or remove remains and/or other signs during each survey period. This is only feasible for lesser travelled roadways.
UNDERPASS continued from page 12
UNDERPASS continued on page 14
14
Transportation Research Board Committee ADC30 January 2017
Taxonomic name Common Name
South Track Bed Middle Track Bed North Track Bed Total
North South North South North South North South
Testudinidae spp. Turtle 48 15 43 6 29 1 120 22
Anaxyrus americanus American toad 1 0 0 0 0 0 1 0
Aves spp. Bird spp. 2 1 0 0 2 0 4 1
Rodentia spp. Rodent 1 5 3 5 1 3 5 13
Neotominae spp. Field mouse 12 8 34 11 37 13 83 32
Zapus hudsonius Meadow jumping mouse 3 4 2 1 4 4 9 9
Tamius striatus Eastern striped chipmunk 3 1 4 2 1 1 7 4
Sciurus spp. Squirrel 0 4 4 4 3 1 7 9
Sylvilagus floridanus Eastern cottontail 1 0 0 0 0 0 1 0
Marmota monax Groundhog 1 1 0 0 1 0 4 3
Didelphis virginiana Virginia opossum 0 2 0 0 0 0 0 2
Mephitis mephitis Striped skunk 2 1 4 0 1 1 7 2
Procyon lotor Raccoon 18 20 22 8 33 13 73 41
Canidae spp. Fox 0 4 6 4 9 4 15 12
Canis latrans Coyote 1 1 2 0 0 0 3 1
Neovison vison American mink 1 0 0 0 0 0 1 0
Martes pennanti Fisher 7 6 6 5 5 5 18 16
Odocoileus virginianus White-tail deer 1 0 1 0 1 0 3 0
Total 100 73 131 46 130 48 361 167
Table 1. Summary of Track Bed Utilization
Taxonomic name Common Name
Track Beds Camera Traps
North South North South
Testudinidae spp. Turtle 22 1 — —
Chrysemys picta Eastern painted turtle — — 2 1
Neotominae spp. Field mouse spp. 9 2 0 0
Sciurus carolinensis Eastern gray squirrel 0 0 0 1
Marmota monax Groundhog 0 0 0 1
Procyon lotor Raccoon 12 4 5 22
Martes pennanti Fisher 2 0 0 0
Odocoileus virginianus White-tail deer 1 0 1 0
Total 46 7 8 25
— Species not observed
Table 2. Summary of Successful Tunnel Crossings
View of the south tunnel entrance and track bed.
A view looking south through the tunnel from the north track bed.
UNDERPASS continued from page 13
UNDERPASS continued on page 15
15
Transportation Research Board Committee ADC30 January 2017
Taxonomic nameCommon Name
South Track Bed Middle Track Bed North Track Bed
TotalNorth South Attempt North South Attempt North South Attempt
Chrysemys picta Eastern Painted Turtle
4 1 0 3 2 0 2 1 0 13
Turdus migratorius American robin 0 0 0 0 0 0 3 0 0 3
Cyanocitta cristata Blue jay 0 0 1 0 0 0 0 0 0 1
Spizella passerina Chipping sparrow
0 0 0 0 0 0 0 0 1 1
Melospiza melodia Song sparrow 0 0 2 0 0 0 0 0 0 2
Rodentia spp. Rodent spp. 0 0 4 0 0 0 0 0 0 4
Neotominae spp. Field Mouse spp. 0 0 0 0 0 5 2 2 1 10
Zapus hudsonius Meadow jumping mouse
1 2 6 0 0 0 0 5 15 29
Tamius striatus Eastern striped chipmunk
0 0 1 0 1 0 1 2 0 5
Tamias carolinensis Eastern gray squirrel
0 5 0 2 3 0 0 2 0 12
Tamais hudsonicus Red squirrel 1 0 0 0 0 0 0 0 0 1
Marmota monax Groundhog 1 2 0 0 2 0 1 1 0 7
Didelphis virginiana Virginia opossum 2 0 0 0 0 0 1 0 0 3
Mephitis mephitis Striped skunks 2 0 0 1 0 0 0 2 0 5
Procyon lotor Raccoon 40 62 14 36 49 0 21 56 8 286
Urocyon cinereoargenteus
Gray fox 9 0 0 2 1 1 0 2 0 15
Martes pennanti Fisher 14 1 0 6 2 0 5 2 4 14
Odocoileus virginianus White tailed deer
0 0 0 0 0 0 1 0 0 1
Total 76 73 28 51 60 6 38 79 29 446
Table 3. Summary of Camera Trap Captures
A white tail deer inspects the south track bed. A fox with prey captured by the middle camera trap.
A Virginia opossum captured by the north camera trap. A groundhog existing the north tunnel entrance.
UNDERPASS continued from page 14
16
Transportation Research Board Committee ADC30 January 2017
Submitted by: Wendy Collinson, Endangered Wildlife Trust
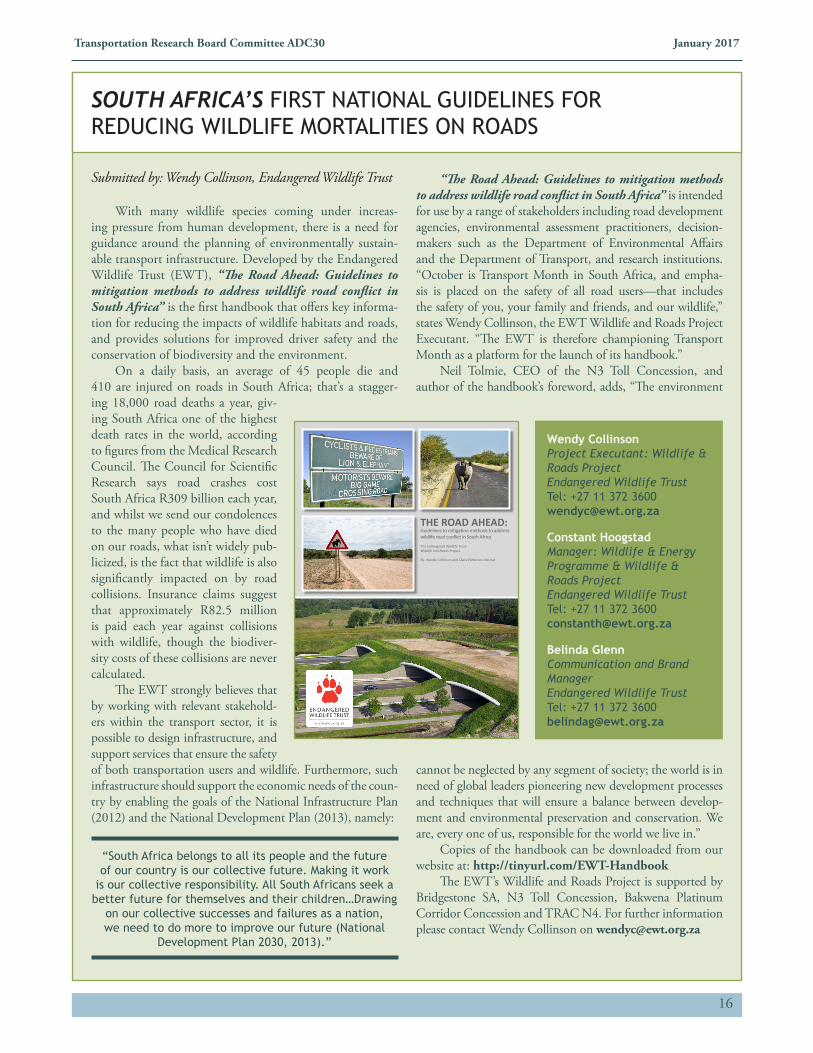
With many wildlife species coming under increas-ing pressure from human development, there is a need for guidance around the planning of environmentally sustain-able transport infrastructure. Developed by the Endangered Wildlife Trust (EWT), “The Road Ahead: Guidelines to mitigation methods to address wildlife road conflict in South Africa” is the first handbook that offers key informa-tion for reducing the impacts of wildlife habitats and roads, and provides solutions for improved driver safety and the conservation of biodiversity and the environment.
On a daily basis, an average of 45 people die and 410 are injured on roads in South Africa; that’s a stagger-ing 18,000 road deaths a year, giv-ing South Africa one of the highest death rates in the world, according to figures from the Medical Research Council. The Council for Scientific Research says road crashes cost South Africa R309 billion each year, and whilst we send our condolences to the many people who have died on our roads, what isn’t widely pub-licized, is the fact that wildlife is also significantly impacted on by road collisions. Insurance claims suggest that approximately R82.5 million is paid each year against collisions with wildlife, though the biodiver-sity costs of these collisions are never calculated.
The EWT strongly believes that by working with relevant stakehold-ers within the transport sector, it is possible to design infrastructure, and support services that ensure the safety of both transportation users and wildlife. Furthermore, such infrastructure should support the economic needs of the coun-try by enabling the goals of the National Infrastructure Plan (2012) and the National Development Plan (2013), namely:
“South Africa belongs to all its people and the future of our country is our collective future. Making it work
is our collective responsibility. All South Africans seek a better future for themselves and their children…Drawing
on our collective successes and failures as a nation, we need to do more to improve our future (National
Development Plan 2030, 2013).”
“The Road Ahead: Guidelines to mitigation methods to address wildlife road conflict in South Africa” is intended for use by a range of stakeholders including road development agencies, environmental assessment practitioners, decision-makers such as the Department of Environmental Affairs and the Department of Transport, and research institutions. “October is Transport Month in South Africa, and empha-sis is placed on the safety of all road users—that includes the safety of you, your family and friends, and our wildlife,” states Wendy Collinson, the EWT Wildlife and Roads Project Executant. “The EWT is therefore championing Transport Month as a platform for the launch of its handbook.”
Neil Tolmie, CEO of the N3 Toll Concession, and author of the handbook’s foreword, adds, “The environment
cannot be neglected by any segment of society; the world is in need of global leaders pioneering new development processes and techniques that will ensure a balance between develop-ment and environmental preservation and conservation. We are, every one of us, responsible for the world we live in.”
Copies of the handbook can be downloaded from our website at: http://tinyurl.com/EWT-Handbook
The EWT’s Wildlife and Roads Project is supported by Bridgestone SA, N3 Toll Concession, Bakwena Platinum Corridor Concession and TRAC N4. For further information please contact Wendy Collinson on [email protected]
SOUTH AFRICA’S FIRST NATIONAL GUIDELINES FOR REDUCING WILDLIFE MORTALITIES ON ROADS
Wendy CollinsonProject Executant: Wildlife & Roads ProjectEndangered Wildlife TrustTel: +27 11 372 [email protected]
Constant HoogstadManager: Wildlife & Energy Programme & Wildlife & Roads ProjectEndangered Wildlife TrustTel: +27 11 372 [email protected]
Belinda GlennCommunication and Brand ManagerEndangered Wildlife TrustTel: +27 11 372 [email protected]
ROAD AHEAD | 1
THE ROAD AHEAD: Guidelines to mitigation methods to address wildlife road conflict in South Africa
The Endangered Wildlife Trust: Wildlife and Roads Project
By: Wendy Collinson and Claire Patterson-Abrolat
17
Transportation Research Board Committee ADC30 January 2017
The views expressed in this newsletter are those of the authors and do not reflect the policies or opinions of TRB, or the National Academy of Science, or Stantec.
Editor: Jeff SimmonsCoordination: Kate McPhersonLayout: Carrianne Knight
Submitted by: Tucker Creed, Chad Long, and Sean Connolly, South Carolina Department of Transportation
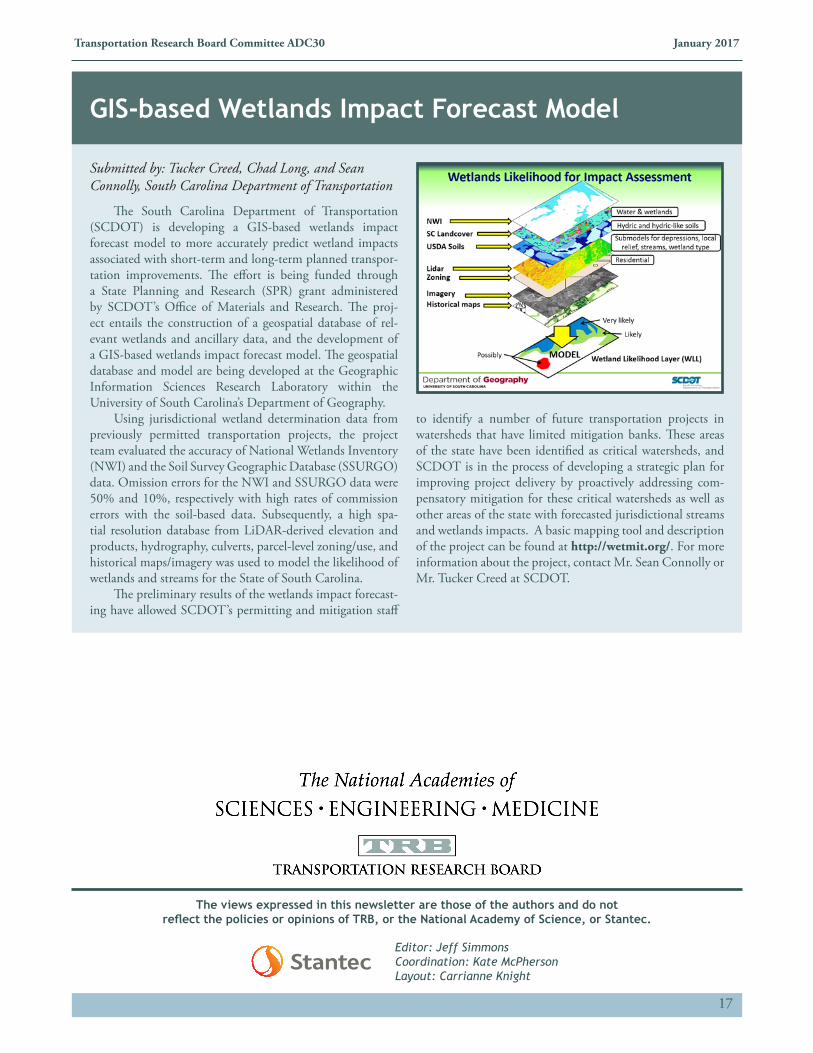
The South Carolina Department of Transportation (SCDOT) is developing a GIS-based wetlands impact forecast model to more accurately predict wetland impacts associated with short-term and long-term planned transpor-tation improvements. The effort is being funded through a State Planning and Research (SPR) grant administered by SCDOT’s Office of Materials and Research. The proj-ect entails the construction of a geospatial database of rel-evant wetlands and ancillary data, and the development of a GIS-based wetlands impact forecast model. The geospatial database and model are being developed at the Geographic Information Sciences Research Laboratory within the University of South Carolina’s Department of Geography.
Using jurisdictional wetland determination data from previously permitted transportation projects, the project team evaluated the accuracy of National Wetlands Inventory (NWI) and the Soil Survey Geographic Database (SSURGO) data. Omission errors for the NWI and SSURGO data were 50% and 10%, respectively with high rates of commission errors with the soil-based data. Subsequently, a high spa-tial resolution database from LiDAR-derived elevation and products, hydrography, culverts, parcel-level zoning/use, and historical maps/imagery was used to model the likelihood of wetlands and streams for the State of South Carolina.
The preliminary results of the wetlands impact forecast-ing have allowed SCDOT’s permitting and mitigation staff
to identify a number of future transportation projects in watersheds that have limited mitigation banks. These areas of the state have been identified as critical watersheds, and SCDOT is in the process of developing a strategic plan for improving project delivery by proactively addressing com-pensatory mitigation for these critical watersheds as well as other areas of the state with forecasted jurisdictional streams and wetlands impacts. A basic mapping tool and description of the project can be found at http://wetmit.org/. For more information about the project, contact Mr. Sean Connolly or Mr. Tucker Creed at SCDOT.
GIS-based Wetlands Impact Forecast Model