Embed Size (px)
Citation preview
McGraw-Hill
Commodity and Strategic Futures Index Methods: Adjusting to a New World Economy
October 2013
For Financial Professionals/Not for Public Distribution
Analytic services and products by S&P Dow Jones Indices are the result of separate activities designed to
preserve the independence and objectivity of each analytic process. S&P Dow Jones Indices has established
policies and procedures to maintain the confidentiality of non-public information received during each analytic
process.
PROPRIETARY. PERMISSION TO REPRINT OR DISTRIBUTE ANY CONTENT FROM THIS PRESENTATION REQUIRES THE WRITTEN APPROVAL OF S&P DOW JONES INDICES.
What is an asset class?
•commRR_phil_28a
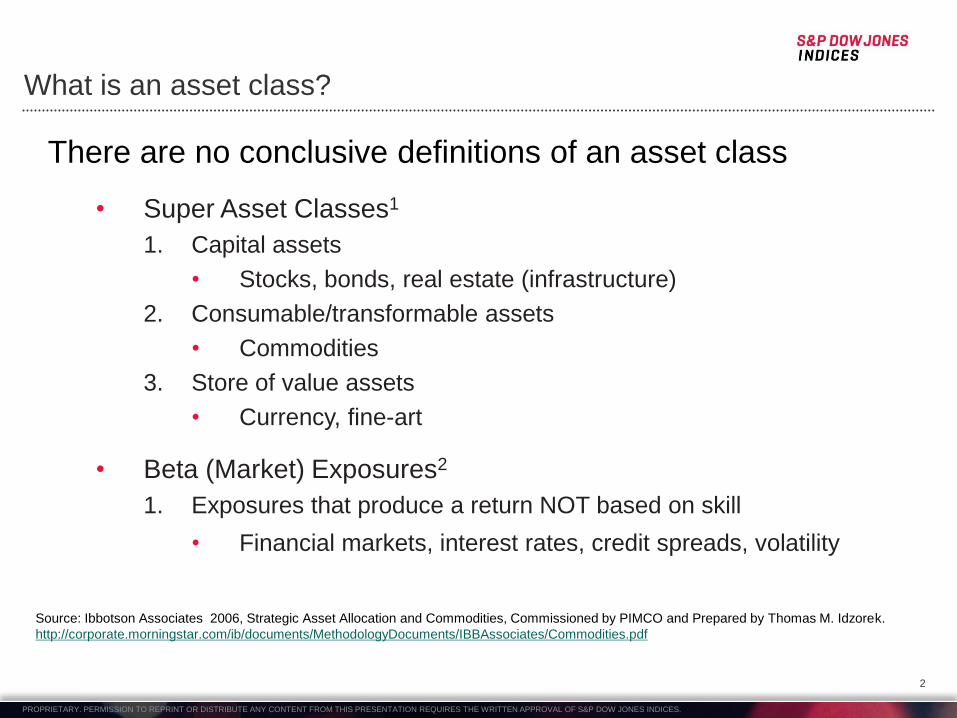
There are no conclusive definitions of an asset class
• Super Asset Classes1
1. Capital assets
• Stocks, bonds, real estate (infrastructure)
2. Consumable/transformable assets
• Commodities
3. Store of value assets
• Currency, fine-art
• Beta (Market) Exposures2
1. Exposures that produce a return NOT based on skill
• Financial markets, interest rates, credit spreads, volatility
2
Source: Ibbotson Associates 2006, Strategic Asset Allocation and Commodities, Commissioned by PIMCO and Prepared by Thomas M. Idzorek.
http://corporate.morningstar.com/ib/documents/MethodologyDocuments/IBBAssociates/Commodities.pdf

PROPRIETARY. PERMISSION TO REPRINT OR DISTRIBUTE ANY CONTENT FROM THIS PRESENTATION REQUIRES THE WRITTEN APPROVAL OF S&P DOW JONES INDICES.
What makes COMMODITIES an asset class?
•commRR_phil_28a
Commodities offer an inherent or natural return that is not
conditional on skill. Coupled with the fact that commodities
are the basic ingredients that build society, commodities are
a unique asset class and should be treated as such.
3
Source: Ibbotson Associates 2006, Strategic Asset Allocation and Commodities, Commissioned by PIMCO and Prepared by Thomas M. Idzorek.
http://corporate.morningstar.com/ib/documents/MethodologyDocuments/IBBAssociates/Commodities.pdf

PROPRIETARY. PERMISSION TO REPRINT OR DISTRIBUTE ANY CONTENT FROM THIS PRESENTATION REQUIRES THE WRITTEN APPROVAL OF S&P DOW JONES INDICES.
Accessing commodities directly for asset class exposure
•commRR_phil_28a
Source: Barclays Capital, Commodities Research, Commodity Cross Currents Commodity investing to rebound, February 2012
“We believe that this reflects a preference for the kind of risk profile
provided by direct commodity returns, which is very different to that of
commodity equities.”
4
PROPRIETARY. PERMISSION TO REPRINT OR DISTRIBUTE ANY CONTENT FROM THIS PRESENTATION REQUIRES THE WRITTEN APPROVAL OF S&P DOW JONES INDICES.
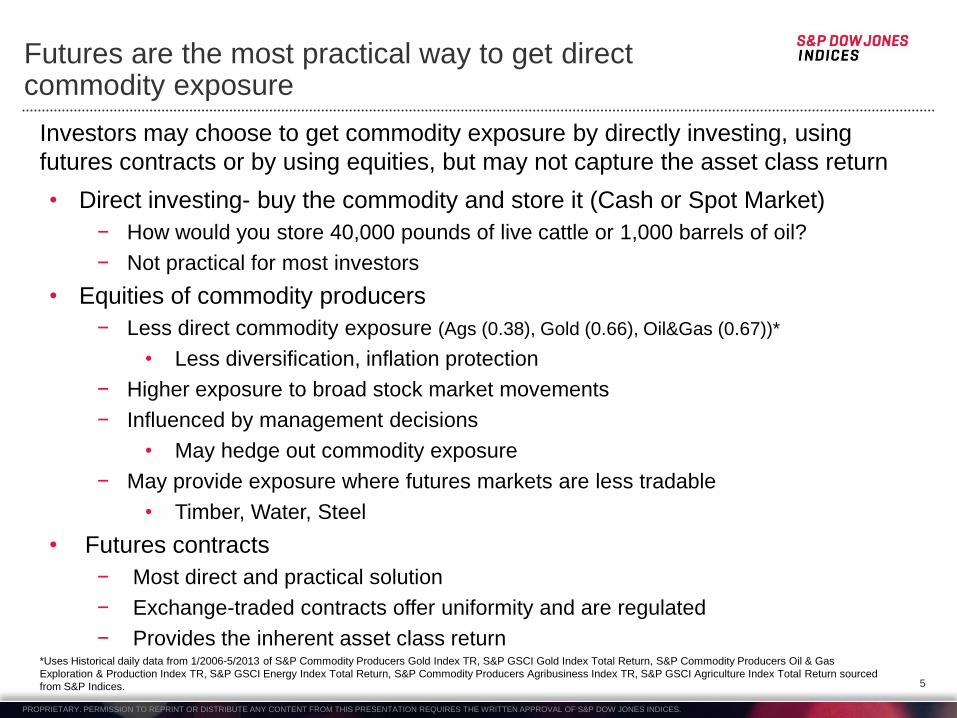
Futures are the most practical way to get direct commodity exposure
• Direct investing- buy the commodity and store it (Cash or Spot Market)
− How would you store 40,000 pounds of live cattle or 1,000 barrels of oil?
− Not practical for most investors
• Equities of commodity producers
− Less direct commodity exposure (Ags (0.38), Gold (0.66), Oil&Gas (0.67))*
• Less diversification, inflation protection
− Higher exposure to broad stock market movements
− Influenced by management decisions
• May hedge out commodity exposure
− May provide exposure where futures markets are less tradable
• Timber, Water, Steel
• Futures contracts
− Most direct and practical solution
− Exchange-traded contracts offer uniformity and are regulated
− Provides the inherent asset class return
Investors may choose to get commodity exposure by directly investing, using
futures contracts or by using equities, but may not capture the asset class return
5
*Uses Historical daily data from 1/2006-5/2013 of S&P Commodity Producers Gold Index TR, S&P GSCI Gold Index Total Return, S&P Commodity Producers Oil & Gas
Exploration & Production Index TR, S&P GSCI Energy Index Total Return, S&P Commodity Producers Agribusiness Index TR, S&P GSCI Agriculture Index Total Return sourced
from S&P Indices.
PROPRIETARY. PERMISSION TO REPRINT OR DISTRIBUTE ANY CONTENT FROM THIS PRESENTATION REQUIRES THE WRITTEN APPROVAL OF S&P DOW JONES INDICES.
A special quality makes commodities tradable
• Commodities are fungible, raw materials used to produce the products consumers buy, from food to furniture to gasoline.
– Some examples include crude oil, corn, cocoa, wheat, cattle, aluminum, copper, and gold.
• Where the raw materials trade for cash is called the “Spot Market”
6
PROPRIETARY. PERMISSION TO REPRINT OR DISTRIBUTE ANY CONTENT FROM THIS PRESENTATION REQUIRES THE WRITTEN APPROVAL OF S&P DOW JONES INDICES.
7
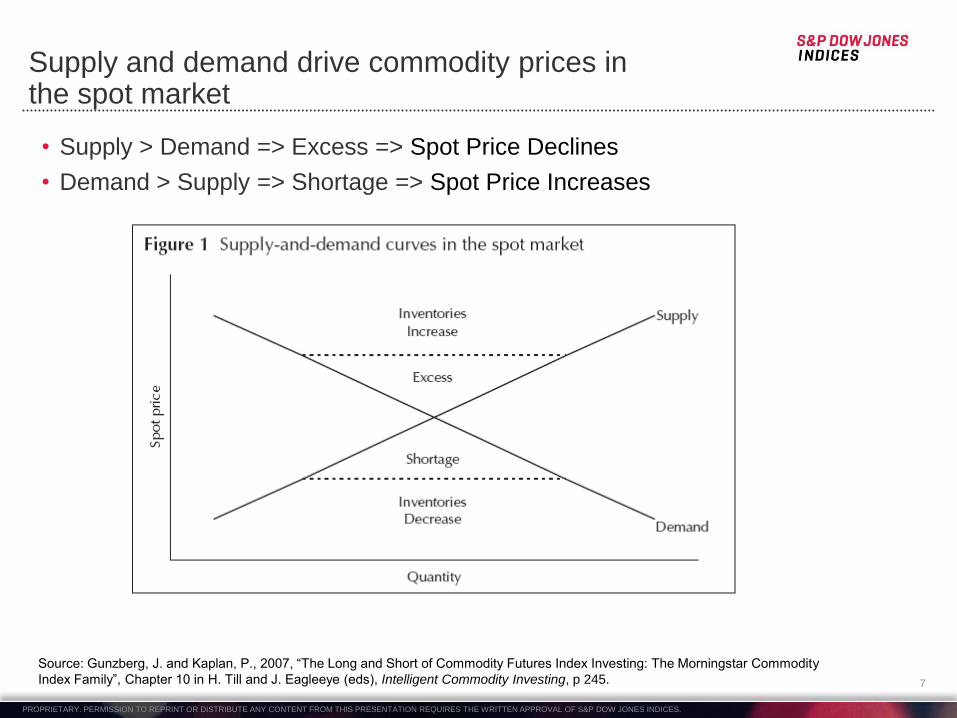
• Supply > Demand => Excess => Spot Price Declines
• Demand > Supply => Shortage => Spot Price Increases
Supply and demand drive commodity prices in the spot market
Source: Gunzberg, J. and Kaplan, P., 2007, “The Long and Short of Commodity Futures Index Investing: The Morningstar Commodity
Index Family”, Chapter 10 in H. Till and J. Eagleeye (eds), Intelligent Commodity Investing, p 245.
PROPRIETARY. PERMISSION TO REPRINT OR DISTRIBUTE ANY CONTENT FROM THIS PRESENTATION REQUIRES THE WRITTEN APPROVAL OF S&P DOW JONES INDICES.
Futures Contracts
• What is a futures contract?
A standardized agreement between two parties.
– The buyer agrees to buy and the seller agrees to deliver (sell) the underlying asset at a specified price on a set future date or expiration date.
– Most positions are closed before expiration to avoid delivery.
– The futures contracts in indices are exchange-traded and regulated.
• Futures prices are directly related to spot prices
8
PROPRIETARY. PERMISSION TO REPRINT OR DISTRIBUTE ANY CONTENT FROM THIS PRESENTATION REQUIRES THE WRITTEN APPROVAL OF S&P DOW JONES INDICES.
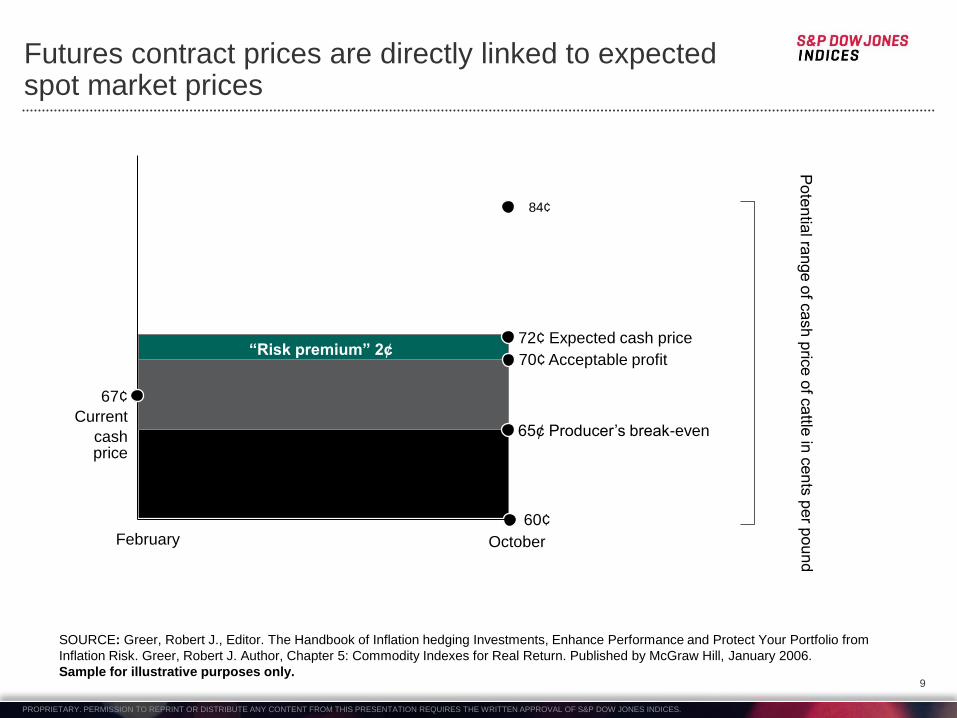
“Risk premium” 2¢
Futures contract prices are directly linked to expected spot market prices
SOURCE: Greer, Robert J., Editor. The Handbook of Inflation hedging Investments, Enhance Performance and Protect Your Portfolio from
Inflation Risk. Greer, Robert J. Author, Chapter 5: Commodity Indexes for Real Return. Published by McGraw Hill, January 2006.
Sample for illustrative purposes only.
October
65¢ Producer’s break-even
70¢ Acceptable profit
72¢ Expected cash price
84¢
60¢
February
67¢
Current
cash price
•commRR_phil_10 9
PROPRIETARY. PERMISSION TO REPRINT OR DISTRIBUTE ANY CONTENT FROM THIS PRESENTATION REQUIRES THE WRITTEN APPROVAL OF S&P DOW JONES INDICES.
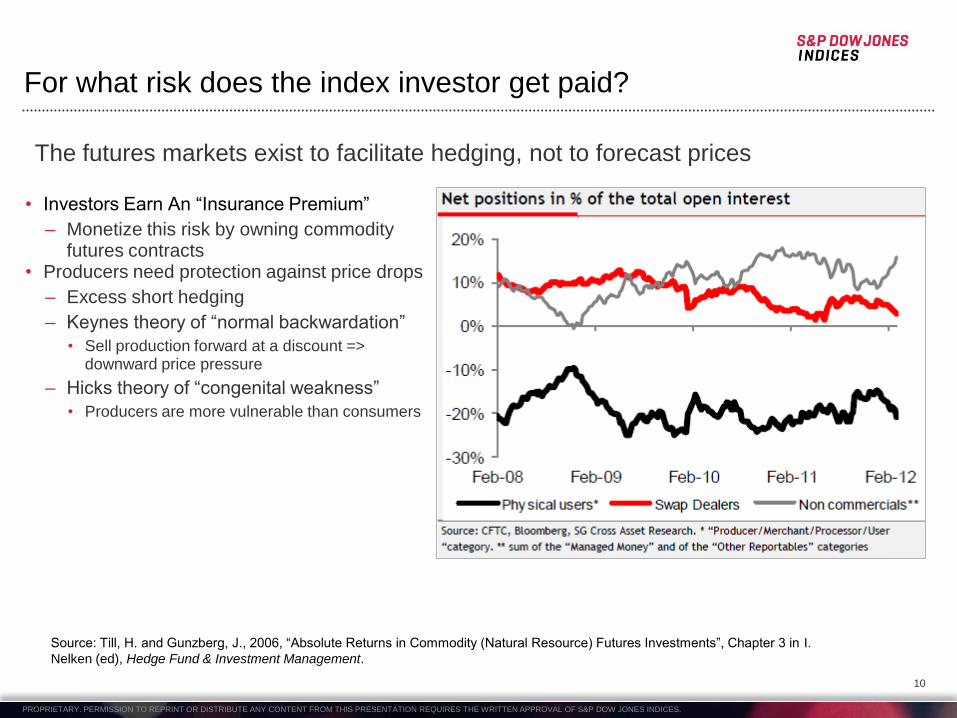
For what risk does the index investor get paid?
• Investors Earn An “Insurance Premium”
– Monetize this risk by owning commodity futures contracts
• Producers need protection against price drops
– Excess short hedging
– Keynes theory of “normal backwardation”
• Sell production forward at a discount => downward price pressure
– Hicks theory of “congenital weakness”
• Producers are more vulnerable than consumers
Source: Till, H. and Gunzberg, J., 2006, “Absolute Returns in Commodity (Natural Resource) Futures Investments”, Chapter 3 in I.
Nelken (ed), Hedge Fund & Investment Management.
10
The futures markets exist to facilitate hedging, not to forecast prices
PROPRIETARY. PERMISSION TO REPRINT OR DISTRIBUTE ANY CONTENT FROM THIS PRESENTATION REQUIRES THE WRITTEN APPROVAL OF S&P DOW JONES INDICES.
pg 11
J F M A M J J A S O N D J F M A M J J A S O N D
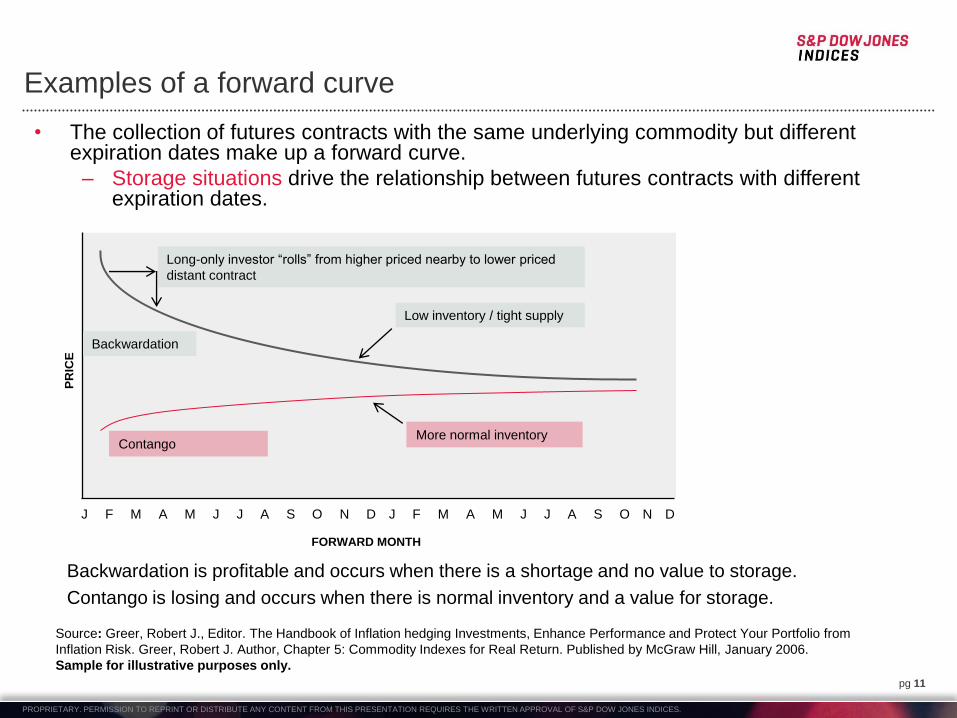
Examples of a forward curve
More normal inventory
PR
ICE
FORWARD MONTH
•commRR_phil_27
Long-only investor “rolls” from higher priced nearby to lower priced
distant contract
Low inventory / tight supply
Contango
Backwardation
Backwardation is profitable and occurs when there is a shortage and no value to storage.
Contango is losing and occurs when there is normal inventory and a value for storage.
• The collection of futures contracts with the same underlying commodity but different expiration dates make up a forward curve.
– Storage situations drive the relationship between futures contracts with different expiration dates.
Source: Greer, Robert J., Editor. The Handbook of Inflation hedging Investments, Enhance Performance and Protect Your Portfolio from
Inflation Risk. Greer, Robert J. Author, Chapter 5: Commodity Indexes for Real Return. Published by McGraw Hill, January 2006.
Sample for illustrative purposes only.
PROPRIETARY. PERMISSION TO REPRINT OR DISTRIBUTE ANY CONTENT FROM THIS PRESENTATION REQUIRES THE WRITTEN APPROVAL OF S&P DOW JONES INDICES.
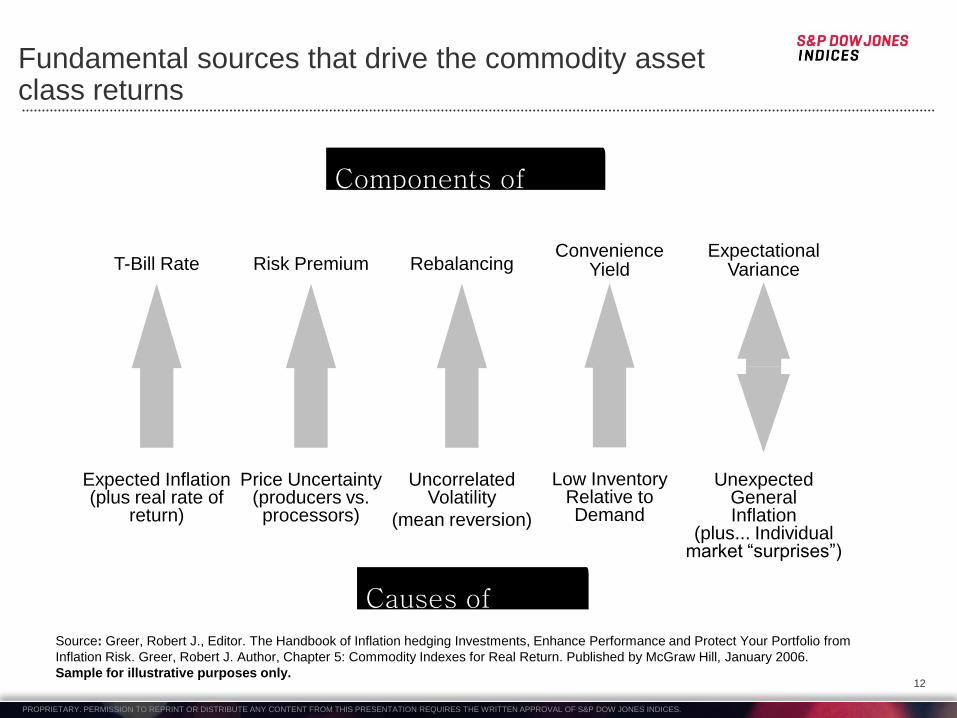
Fundamental sources that drive the commodity asset class returns
•commRR_phil_12a
T-Bill Rate
Expected Inflation (plus real rate of
return)
Risk Premium
Price Uncertainty (producers vs. processors)
Unexpected General Inflation
(plus... Individual market “surprises”)
Expectational Variance
Uncorrelated Volatility
(mean reversion)
Rebalancing
Low Inventory Relative to Demand
Convenience Yield
Components of Return
Causes of Return
12
Source: Greer, Robert J., Editor. The Handbook of Inflation hedging Investments, Enhance Performance and Protect Your Portfolio from
Inflation Risk. Greer, Robert J. Author, Chapter 5: Commodity Indexes for Real Return. Published by McGraw Hill, January 2006.
Sample for illustrative purposes only.
PROPRIETARY. PERMISSION TO REPRINT OR DISTRIBUTE ANY CONTENT FROM THIS PRESENTATION REQUIRES THE WRITTEN APPROVAL OF S&P DOW JONES INDICES.
Commodity indexing captures the asset class return
In order to obtain the market return or beta from commodities,
index investments should measure returns from a process that:
Constructs and calculates with a passive, specified method
Considers only exchange-traded futures contracts on physical commodities
Assumes only long positions
Collateralizes each position fully
13
PROPRIETARY. PERMISSION TO REPRINT OR DISTRIBUTE ANY CONTENT FROM THIS PRESENTATION REQUIRES THE WRITTEN APPROVAL OF S&P DOW JONES INDICES.
14
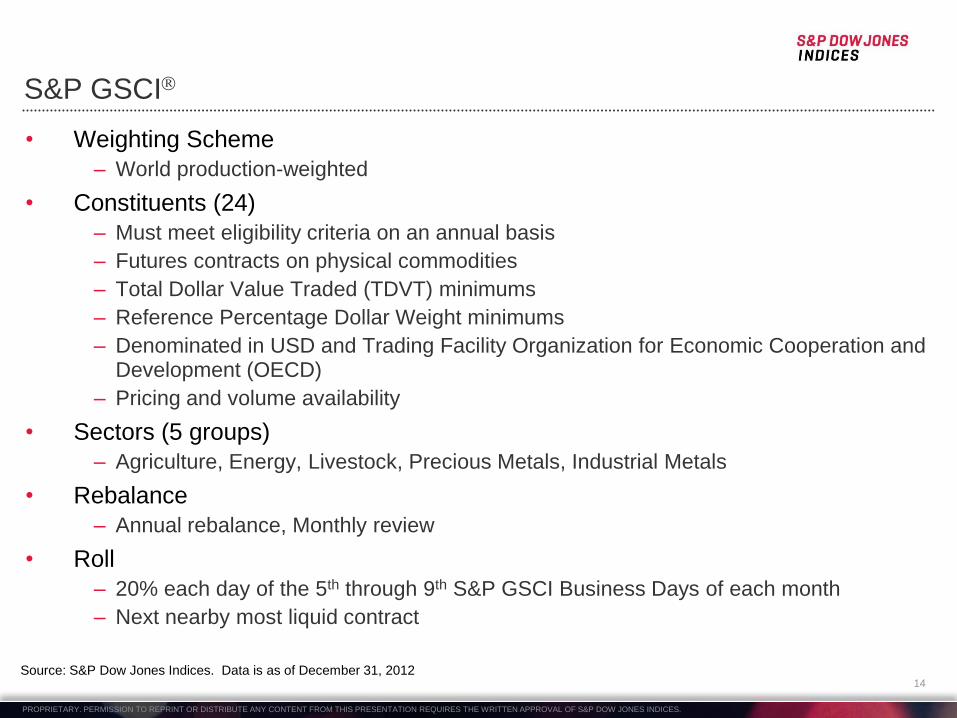
S&P GSCI
• Weighting Scheme
– World production-weighted
• Constituents (24)
– Must meet eligibility criteria on an annual basis
– Futures contracts on physical commodities
– Total Dollar Value Traded (TDVT) minimums
– Reference Percentage Dollar Weight minimums
– Denominated in USD and Trading Facility Organization for Economic Cooperation and Development (OECD)
– Pricing and volume availability
• Sectors (5 groups)
– Agriculture, Energy, Livestock, Precious Metals, Industrial Metals
• Rebalance
– Annual rebalance, Monthly review
• Roll
– 20% each day of the 5th through 9th S&P GSCI Business Days of each month
– Next nearby most liquid contract
Source: S&P Dow Jones Indices. Data is as of December 31, 2012
PROPRIETARY. PERMISSION TO REPRINT OR DISTRIBUTE ANY CONTENT FROM THIS PRESENTATION REQUIRES THE WRITTEN APPROVAL OF S&P DOW JONES INDICES.
15
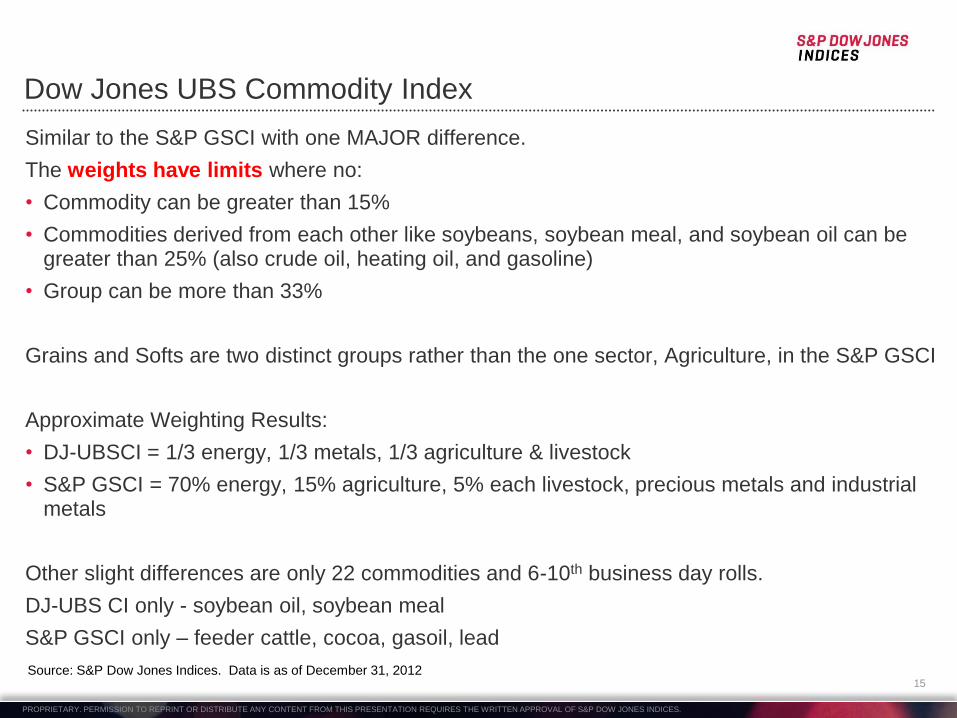
Dow Jones UBS Commodity Index
Similar to the S&P GSCI with one MAJOR difference.
The weights have limits where no:
• Commodity can be greater than 15%
• Commodities derived from each other like soybeans, soybean meal, and soybean oil can be greater than 25% (also crude oil, heating oil, and gasoline)
• Group can be more than 33%
Grains and Softs are two distinct groups rather than the one sector, Agriculture, in the S&P GSCI
Approximate Weighting Results:
• DJ-UBSCI = 1/3 energy, 1/3 metals, 1/3 agriculture & livestock
• S&P GSCI = 70% energy, 15% agriculture, 5% each livestock, precious metals and industrial metals
Other slight differences are only 22 commodities and 6-10th business day rolls.
DJ-UBS CI only - soybean oil, soybean meal
S&P GSCI only – feeder cattle, cocoa, gasoil, lead
Source: S&P Dow Jones Indices. Data is as of December 31, 2012
PROPRIETARY. PERMISSION TO REPRINT OR DISTRIBUTE ANY CONTENT FROM THIS PRESENTATION REQUIRES THE WRITTEN APPROVAL OF S&P DOW JONES INDICES.
0%
10%
20%
30%
40%
50%
60%
Portfolio
d'fication
Absolute
return
Inflation
hedge
E. market
growth
Currency
hedge
Other
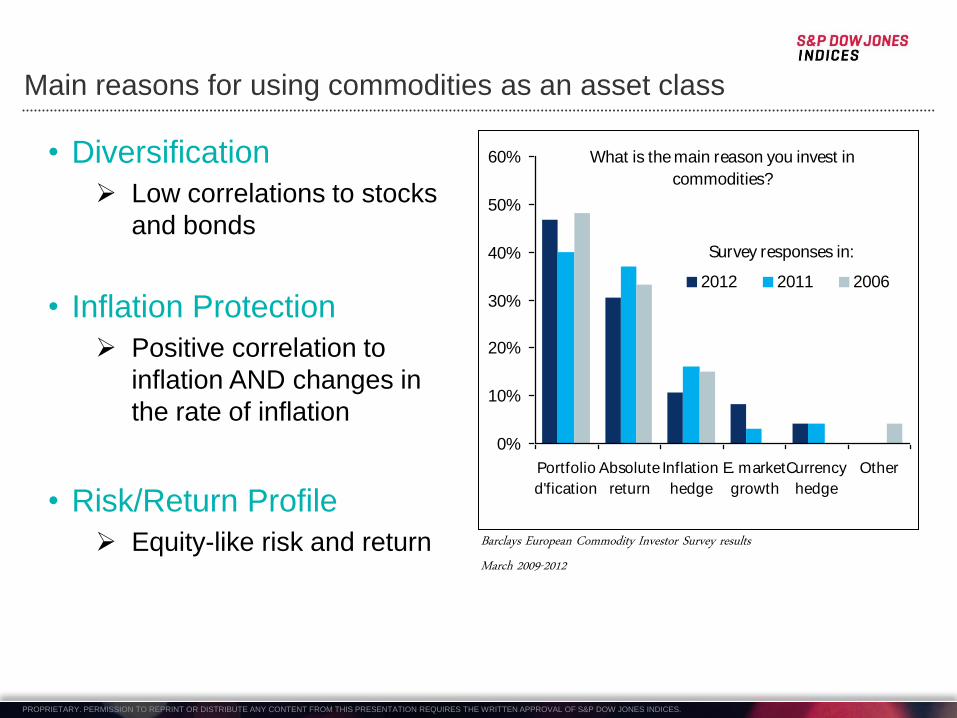
2012 2011 2006
What is the main reason you invest in
commodities?
Survey responses in:
Main reasons for using commodities as an asset class
•commRR_phil_28a
• Diversification
Low correlations to stocks
and bonds
• Inflation Protection
Positive correlation to
inflation AND changes in
the rate of inflation
• Risk/Return Profile
Equity-like risk and return
Barclays European Commodity Investor Survey results March 2009-2012
PROPRIETARY. PERMISSION TO REPRINT OR DISTRIBUTE ANY CONTENT FROM THIS PRESENTATION REQUIRES THE WRITTEN APPROVAL OF S&P DOW JONES INDICES.
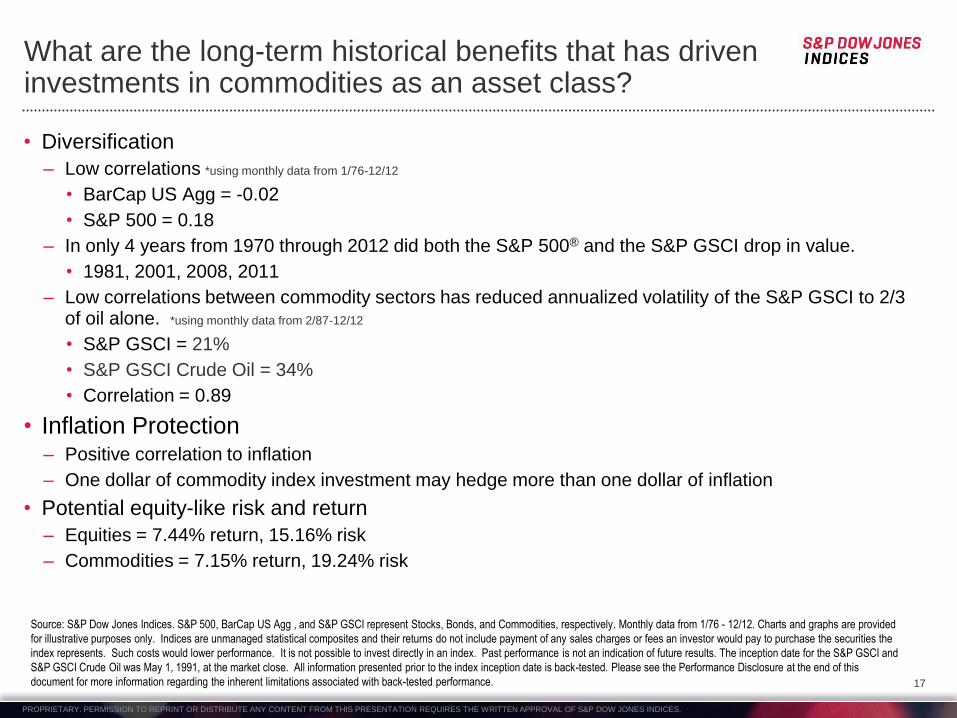
What are the long-term historical benefits that has driven investments in commodities as an asset class?
• Diversification
– Low correlations *using monthly data from 1/76-12/12
• BarCap US Agg = -0.02
• S&P 500 = 0.18
– In only 4 years from 1970 through 2012 did both the S&P 500® and the S&P GSCI drop in value.
• 1981, 2001, 2008, 2011
– Low correlations between commodity sectors has reduced annualized volatility of the S&P GSCI to 2/3 of oil alone. *using monthly data from 2/87-12/12
• S&P GSCI = 21%
• S&P GSCI Crude Oil = 34%
• Correlation = 0.89
• Inflation Protection – Positive correlation to inflation
– One dollar of commodity index investment may hedge more than one dollar of inflation
• Potential equity-like risk and return
– Equities = 7.44% return, 15.16% risk
– Commodities = 7.15% return, 19.24% risk
Source: S&P Dow Jones Indices. S&P 500, BarCap US Agg , and S&P GSCI represent Stocks, Bonds, and Commodities, respectively. Monthly data from 1/76 - 12/12. Charts and graphs are provided
for illustrative purposes only. Indices are unmanaged statistical composites and their returns do not include payment of any sales charges or fees an investor would pay to purchase the securities the
index represents. Such costs would lower performance. It is not possible to invest directly in an index. Past performance is not an indication of future results. The inception date for the S&P GSCI and
S&P GSCI Crude Oil was May 1, 1991, at the market close. All information presented prior to the index inception date is back-tested. Please see the Performance Disclosure at the end of this
document for more information regarding the inherent limitations associated with back-tested performance.
17
PROPRIETARY. PERMISSION TO REPRINT OR DISTRIBUTE ANY CONTENT FROM THIS PRESENTATION REQUIRES THE WRITTEN APPROVAL OF S&P DOW JONES INDICES.
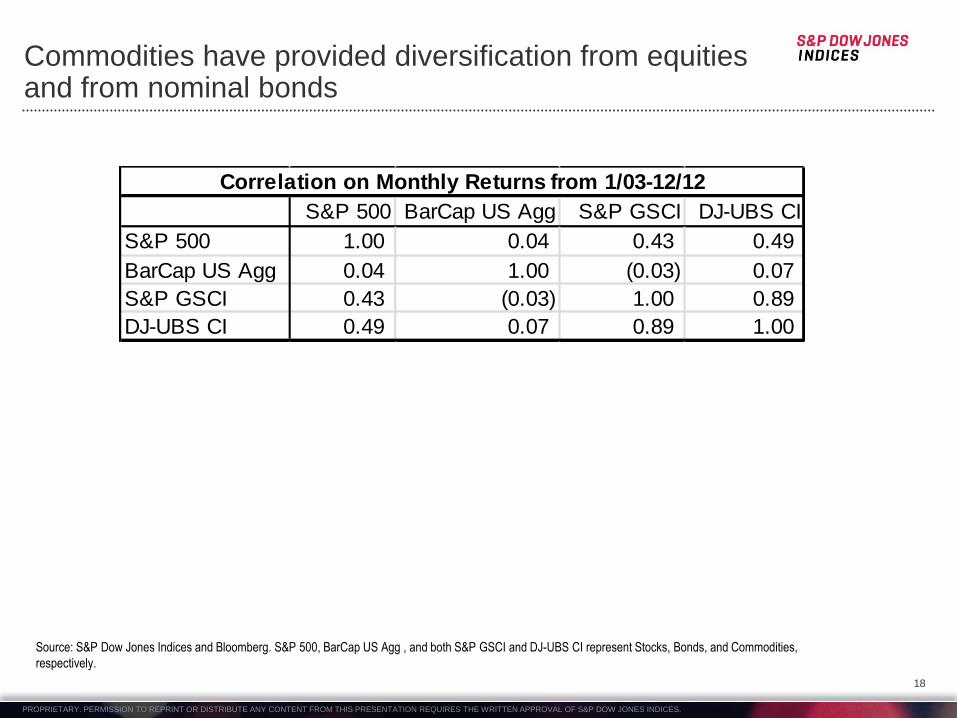
Commodities have provided diversification from equities and from nominal bonds
Source: S&P Dow Jones Indices and Bloomberg. S&P 500, BarCap US Agg , and both S&P GSCI and DJ-UBS CI represent Stocks, Bonds, and Commodities,
respectively.
18
S&P 500 BarCap US Agg S&P GSCI DJ-UBS CI
S&P 500 1.00 0.04 0.43 0.49
BarCap US Agg 0.04 1.00 (0.03) 0.07
S&P GSCI 0.43 (0.03) 1.00 0.89
DJ-UBS CI 0.49 0.07 0.89 1.00
Correlation on Monthly Returns from 1/03-12/12
PROPRIETARY. PERMISSION TO REPRINT OR DISTRIBUTE ANY CONTENT FROM THIS PRESENTATION REQUIRES THE WRITTEN APPROVAL OF S&P DOW JONES INDICES.
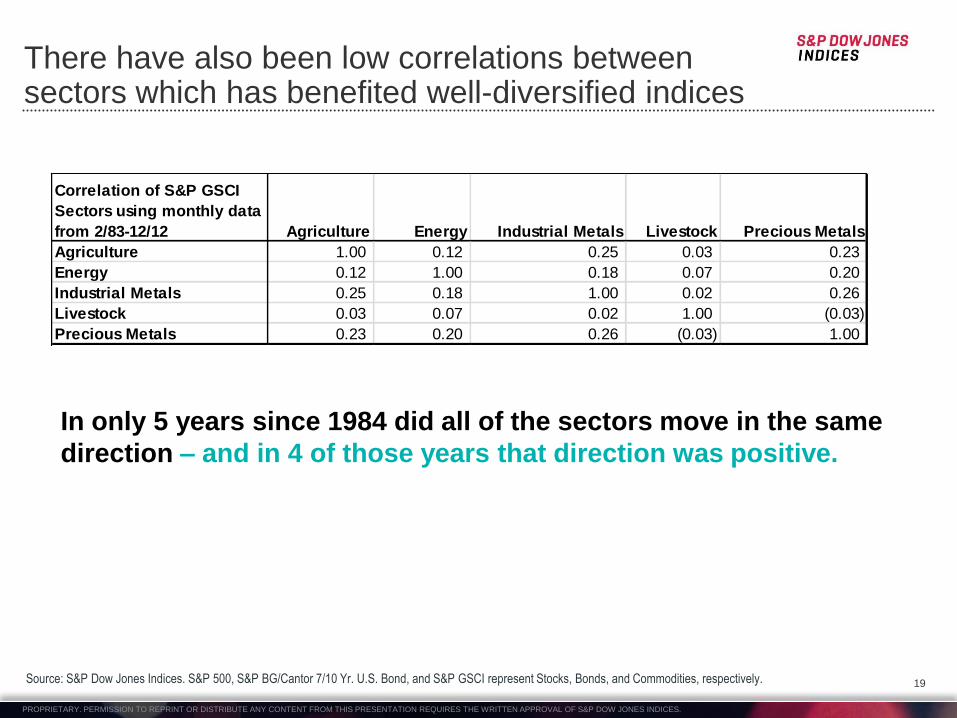
There have also been low correlations between sectors which has benefited well-diversified indices
Source: S&P Dow Jones Indices. S&P 500, S&P BG/Cantor 7/10 Yr. U.S. Bond, and S&P GSCI represent Stocks, Bonds, and Commodities, respectively.
In only 5 years since 1984 did all of the sectors move in the same
direction – and in 4 of those years that direction was positive.
19
Correlation of S&P GSCI
Sectors using monthly data
from 2/83-12/12 Agriculture Energy Industrial Metals Livestock Precious Metals
Agriculture 1.00 0.12 0.25 0.03 0.23
Energy 0.12 1.00 0.18 0.07 0.20
Industrial Metals 0.25 0.18 1.00 0.02 0.26
Livestock 0.03 0.07 0.02 1.00 (0.03)
Precious Metals 0.23 0.20 0.26 (0.03) 1.00
PROPRIETARY. PERMISSION TO REPRINT OR DISTRIBUTE ANY CONTENT FROM THIS PRESENTATION REQUIRES THE WRITTEN APPROVAL OF S&P DOW JONES INDICES.
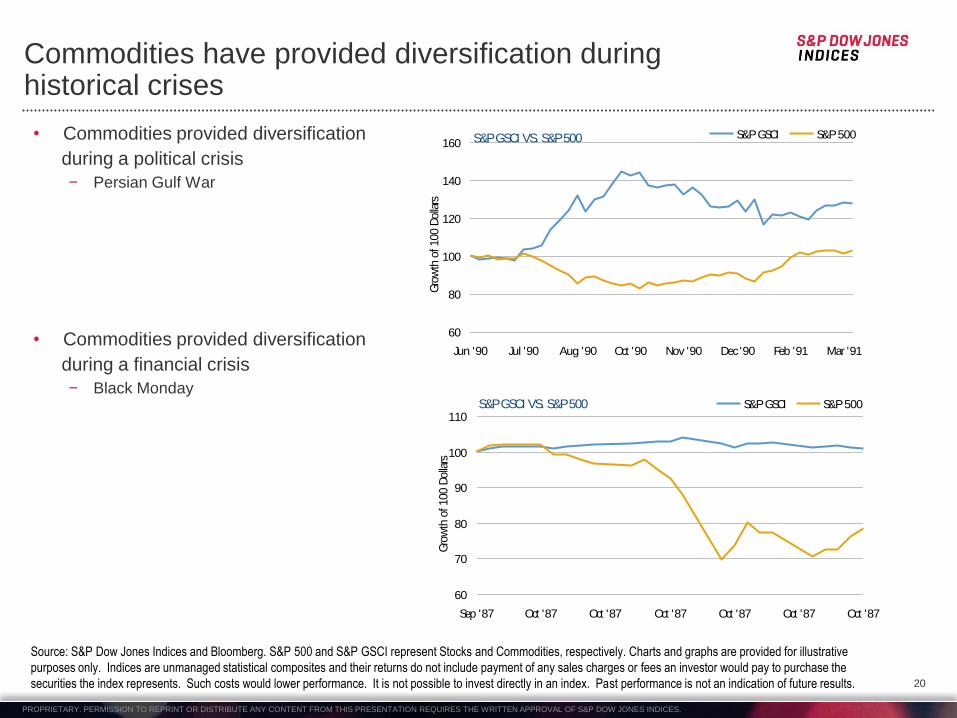
Commodities have provided diversification during historical crises
• Commodities provided diversification
during a political crisis
− Persian Gulf War
• Commodities provided diversification
during a financial crisis
− Black Monday
•commRR_phil_23
S&P GSCI VS. S&P 500
60
80
100
120
140
160
Jun '90 Jul '90 Aug '90 Oct '90 Nov '90 Dec '90 Feb '91 Mar '91
Gro
wth
of 100 D
olla
rs
S&P GSCI S&P 500
S&P GSCI VS. S&P 500
60
70
80
90
100
110
Sep '87 Oct '87 Oct '87 Oct '87 Oct '87 Oct '87 Oct '87
Gro
wth
of 100 D
olla
rs
S&P GSCI S&P 500
20
Source: S&P Dow Jones Indices and Bloomberg. S&P 500 and S&P GSCI represent Stocks and Commodities, respectively. Charts and graphs are provided for illustrative
purposes only. Indices are unmanaged statistical composites and their returns do not include payment of any sales charges or fees an investor would pay to purchase the
securities the index represents. Such costs would lower performance. It is not possible to invest directly in an index. Past performance is not an indication of future results.
PROPRIETARY. PERMISSION TO REPRINT OR DISTRIBUTE ANY CONTENT FROM THIS PRESENTATION REQUIRES THE WRITTEN APPROVAL OF S&P DOW JONES INDICES.
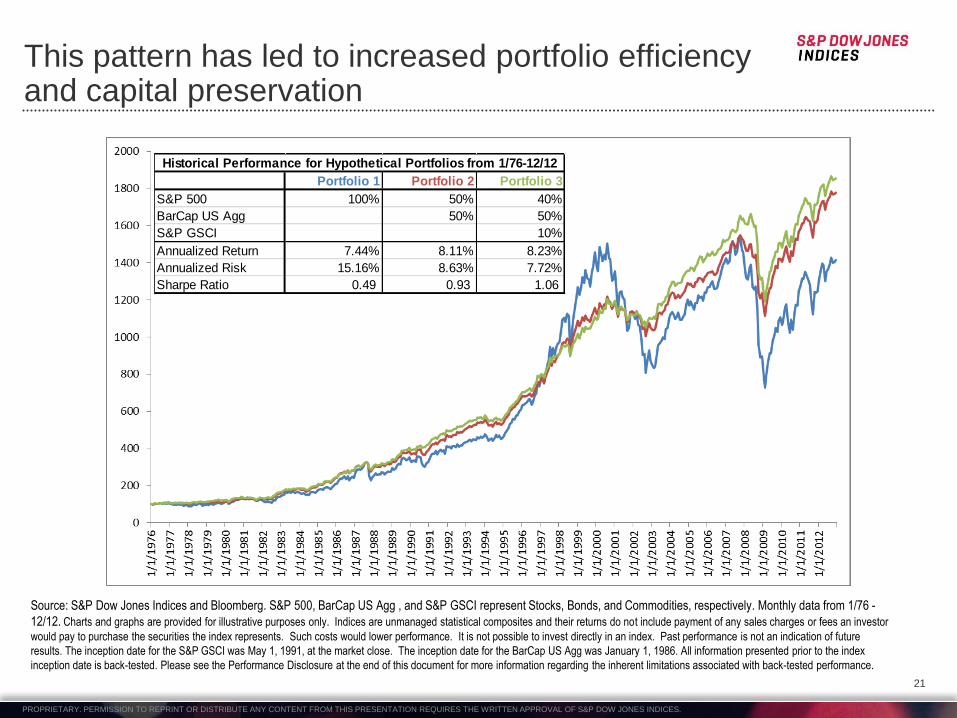
This pattern has led to increased portfolio efficiency and capital preservation
21
Portfolio 1 Portfolio 2 Portfolio 3
S&P 500 100% 50% 40%
BarCap US Agg 50% 50%
S&P GSCI 10%
Annualized Return 7.44% 8.11% 8.23%
Annualized Risk 15.16% 8.63% 7.72%
Sharpe Ratio 0.49 0.93 1.06
Historical Performance for Hypothetical Portfolios from 1/76-12/12
Source: S&P Dow Jones Indices and Bloomberg. S&P 500, BarCap US Agg , and S&P GSCI represent Stocks, Bonds, and Commodities, respectively. Monthly data from 1/76 -
12/12. Charts and graphs are provided for illustrative purposes only. Indices are unmanaged statistical composites and their returns do not include payment of any sales charges or fees an investor
would pay to purchase the securities the index represents. Such costs would lower performance. It is not possible to invest directly in an index. Past performance is not an indication of future
results. The inception date for the S&P GSCI was May 1, 1991, at the market close. The inception date for the BarCap US Agg was January 1, 1986. All information presented prior to the index
inception date is back-tested. Please see the Performance Disclosure at the end of this document for more information regarding the inherent limitations associated with back-tested performance.
PROPRIETARY. PERMISSION TO REPRINT OR DISTRIBUTE ANY CONTENT FROM THIS PRESENTATION REQUIRES THE WRITTEN APPROVAL OF S&P DOW JONES INDICES.
pg 22
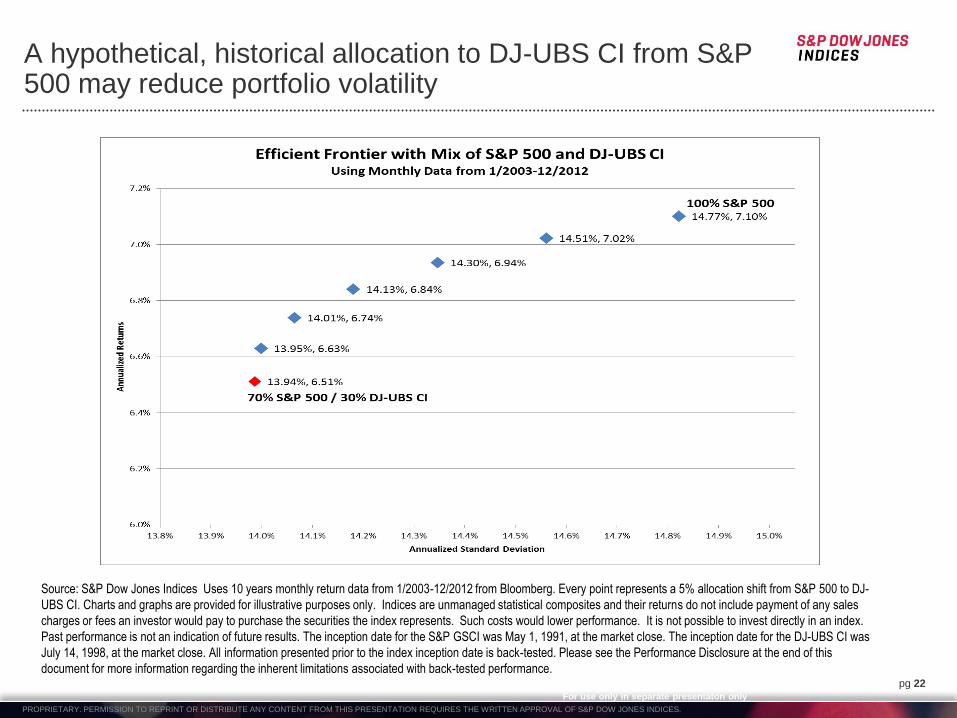
A hypothetical, historical allocation to DJ-UBS CI from S&P 500 may reduce portfolio volatility
•ILB_review_24
For use only in separate presentaton only
Source: S&P Dow Jones Indices Uses 10 years monthly return data from 1/2003-12/2012 from Bloomberg. Every point represents a 5% allocation shift from S&P 500 to DJ-
UBS CI. Charts and graphs are provided for illustrative purposes only. Indices are unmanaged statistical composites and their returns do not include payment of any sales
charges or fees an investor would pay to purchase the securities the index represents. Such costs would lower performance. It is not possible to invest directly in an index.
Past performance is not an indication of future results. The inception date for the S&P GSCI was May 1, 1991, at the market close. The inception date for the DJ-UBS CI was
July 14, 1998, at the market close. All information presented prior to the index inception date is back-tested. Please see the Performance Disclosure at the end of this
document for more information regarding the inherent limitations associated with back-tested performance.
PROPRIETARY. PERMISSION TO REPRINT OR DISTRIBUTE ANY CONTENT FROM THIS PRESENTATION REQUIRES THE WRITTEN APPROVAL OF S&P DOW JONES INDICES.
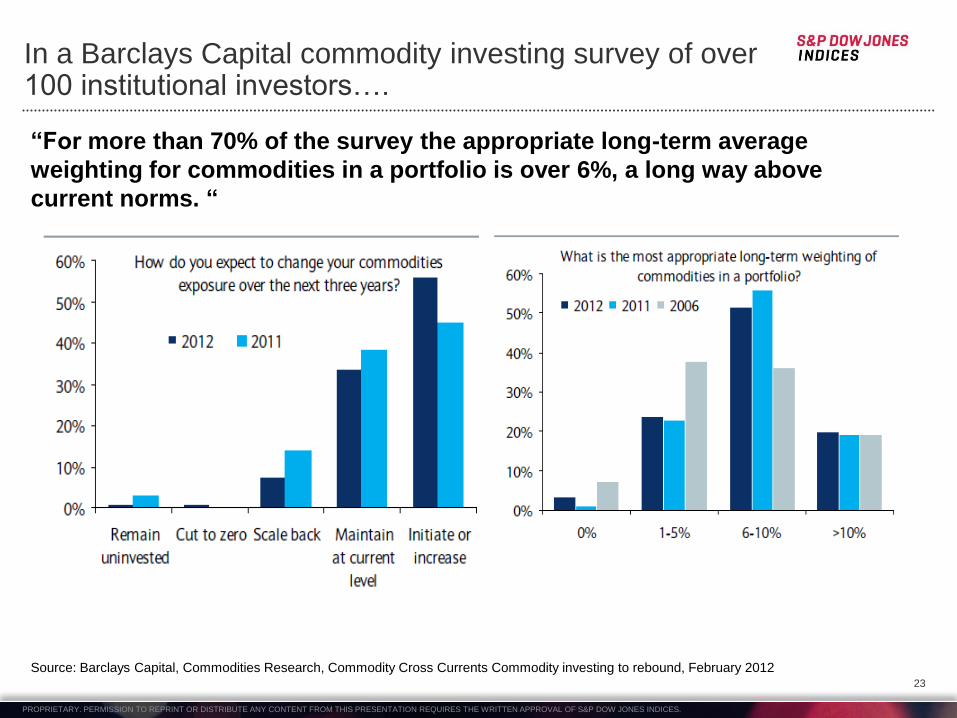
In a Barclays Capital commodity investing survey of over 100 institutional investors….
•commRR_phil_28a
Source: Barclays Capital, Commodities Research, Commodity Cross Currents Commodity investing to rebound, February 2012
“For more than 70% of the survey the appropriate long-term average
weighting for commodities in a portfolio is over 6%, a long way above
current norms. “
23
PROPRIETARY. PERMISSION TO REPRINT OR DISTRIBUTE ANY CONTENT FROM THIS PRESENTATION REQUIRES THE WRITTEN APPROVAL OF S&P DOW JONES INDICES.
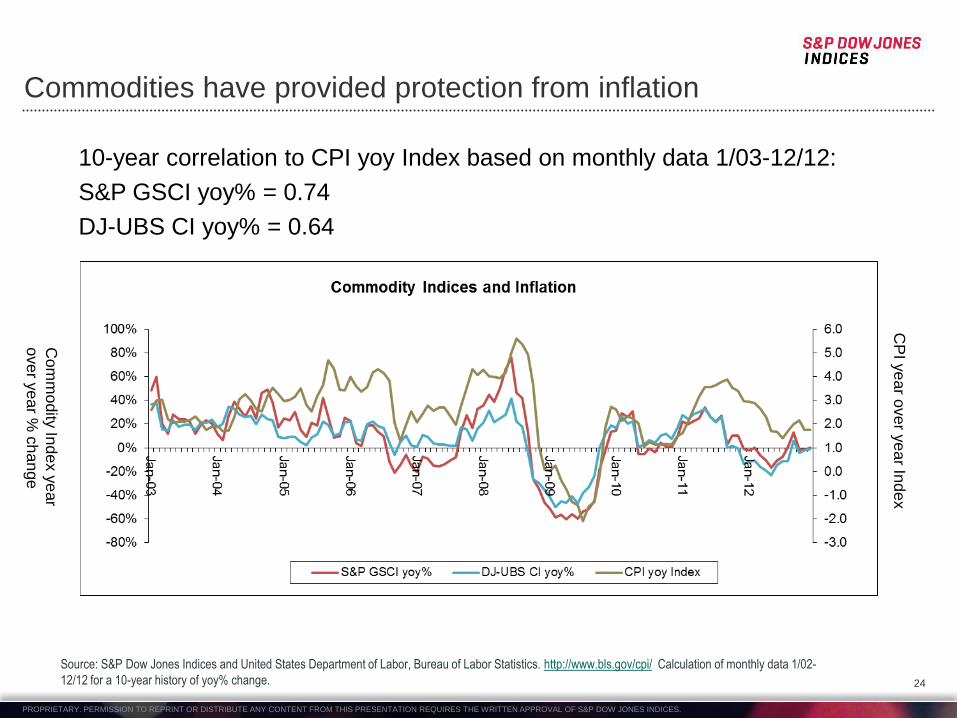
Commodities have provided protection from inflation
10-year correlation to CPI yoy Index based on monthly data 1/03-12/12:
S&P GSCI yoy% = 0.74
DJ-UBS CI yoy% = 0.64
Source: S&P Dow Jones Indices and United States Department of Labor, Bureau of Labor Statistics. http://www.bls.gov/cpi/ Calculation of monthly data 1/02-
12/12 for a 10-year history of yoy% change. 24
Com
mo
dity
Ind
ex y
ea
r
ove
r ye
ar %
ch
an
ge
CP
I ye
ar o
ve
r ye
ar In
de
x
PROPRIETARY. PERMISSION TO REPRINT OR DISTRIBUTE ANY CONTENT FROM THIS PRESENTATION REQUIRES THE WRITTEN APPROVAL OF S&P DOW JONES INDICES.
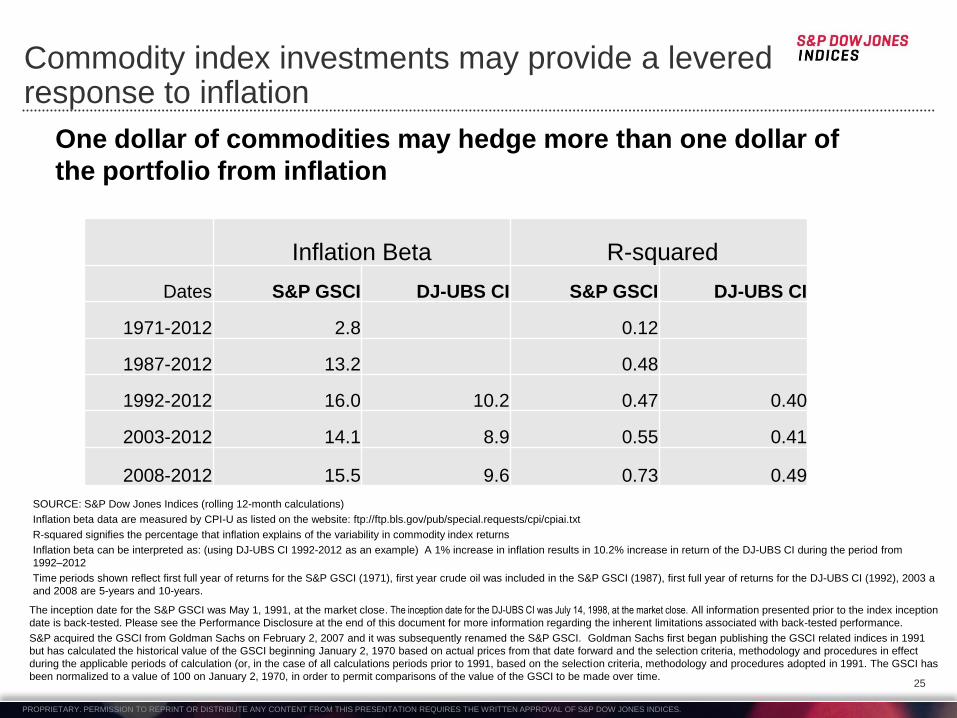
Commodity index investments may provide a levered response to inflation
SOURCE: S&P Dow Jones Indices (rolling 12-month calculations)
Inflation beta data are measured by CPI-U as listed on the website: ftp://ftp.bls.gov/pub/special.requests/cpi/cpiai.txt
R-squared signifies the percentage that inflation explains of the variability in commodity index returns
Inflation beta can be interpreted as: (using DJ-UBS CI 1992-2012 as an example) A 1% increase in inflation results in 10.2% increase in return of the DJ-UBS CI during the period from
1992–2012
Time periods shown reflect first full year of returns for the S&P GSCI (1971), first year crude oil was included in the S&P GSCI (1987), first full year of returns for the DJ-UBS CI (1992), 2003 a
and 2008 are 5-years and 10-years.
The inception date for the S&P GSCI was May 1, 1991, at the market close. The inception date for the DJ-UBS CI was July 14, 1998, at the market close. All information presented prior to the index inception
date is back-tested. Please see the Performance Disclosure at the end of this document for more information regarding the inherent limitations associated with back-tested performance.
S&P acquired the GSCI from Goldman Sachs on February 2, 2007 and it was subsequently renamed the S&P GSCI. Goldman Sachs first began publishing the GSCI related indices in 1991
but has calculated the historical value of the GSCI beginning January 2, 1970 based on actual prices from that date forward and the selection criteria, methodology and procedures in effect
during the applicable periods of calculation (or, in the case of all calculations periods prior to 1991, based on the selection criteria, methodology and procedures adopted in 1991. The GSCI has
been normalized to a value of 100 on January 2, 1970, in order to permit comparisons of the value of the GSCI to be made over time.
One dollar of commodities may hedge more than one dollar of
the portfolio from inflation
25
Inflation Beta R-squared
Dates S&P GSCI DJ-UBS CI S&P GSCI DJ-UBS CI
1971-2012 2.8 0.12
1987-2012 13.2 0.48
1992-2012 16.0 10.2 0.47 0.40
2003-2012 14.1 8.9 0.55 0.41
2008-2012 15.5 9.6 0.73 0.49
PROPRIETARY. PERMISSION TO REPRINT OR DISTRIBUTE ANY CONTENT FROM THIS PRESENTATION REQUIRES THE WRITTEN APPROVAL OF S&P DOW JONES INDICES.
26
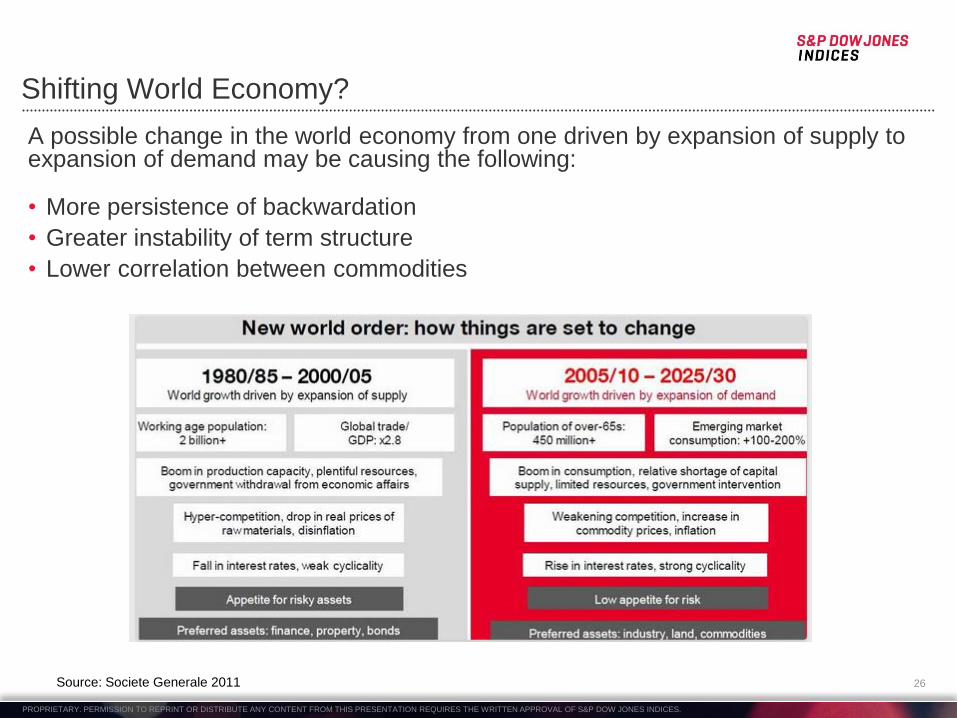
Shifting World Economy?
A possible change in the world economy from one driven by expansion of supply to expansion of demand may be causing the following:
• More persistence of backwardation
• Greater instability of term structure
• Lower correlation between commodities
Source: Societe Generale 2011
PROPRIETARY. PERMISSION TO REPRINT OR DISTRIBUTE ANY CONTENT FROM THIS PRESENTATION REQUIRES THE WRITTEN APPROVAL OF S&P DOW JONES INDICES.
27
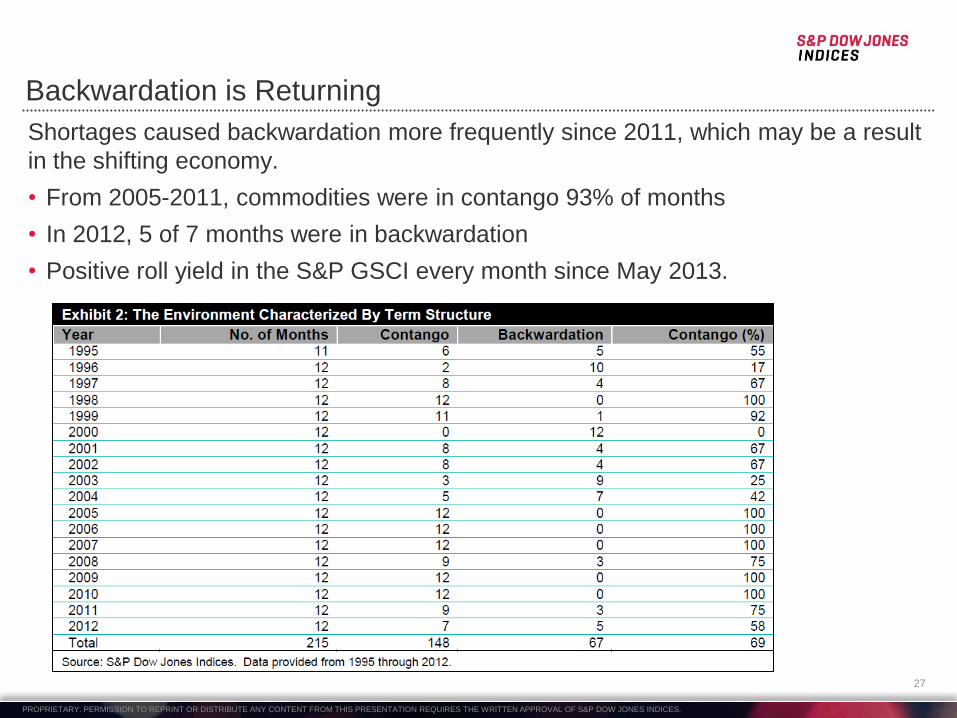
Backwardation is Returning
Shortages caused backwardation more frequently since 2011, which may be a result
in the shifting economy.
• From 2005-2011, commodities were in contango 93% of months
• In 2012, 5 of 7 months were in backwardation
• Positive roll yield in the S&P GSCI every month since May 2013.
PROPRIETARY. PERMISSION TO REPRINT OR DISTRIBUTE ANY CONTENT FROM THIS PRESENTATION REQUIRES THE WRITTEN APPROVAL OF S&P DOW JONES INDICES.
28
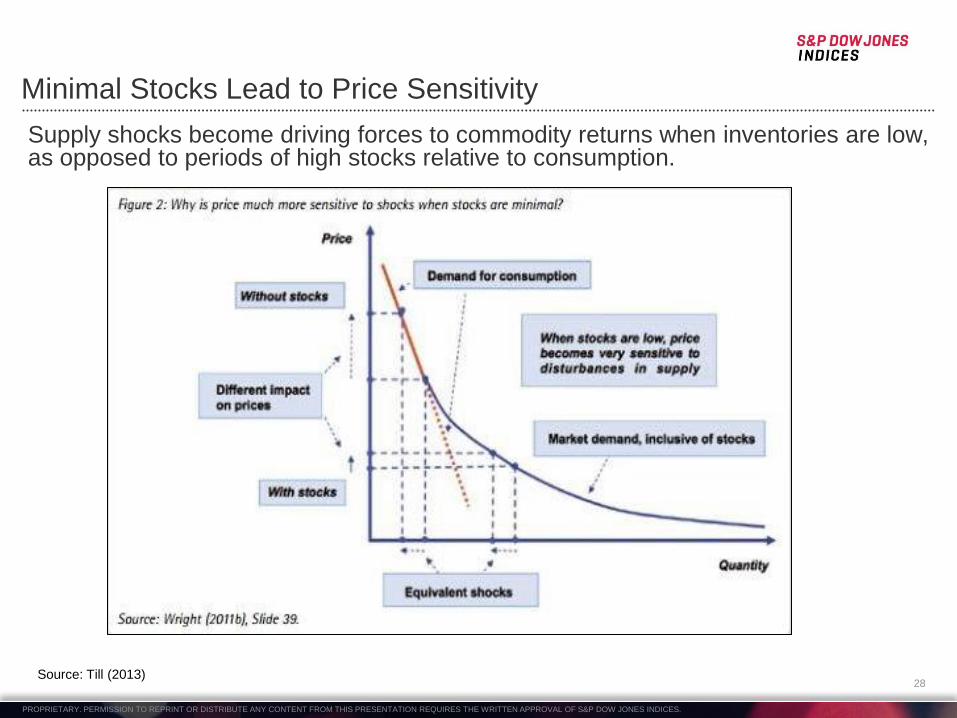
Minimal Stocks Lead to Price Sensitivity
Supply shocks become driving forces to commodity returns when inventories are low, as opposed to periods of high stocks relative to consumption.
Source: Till (2013)
PROPRIETARY. PERMISSION TO REPRINT OR DISTRIBUTE ANY CONTENT FROM THIS PRESENTATION REQUIRES THE WRITTEN APPROVAL OF S&P DOW JONES INDICES.
29
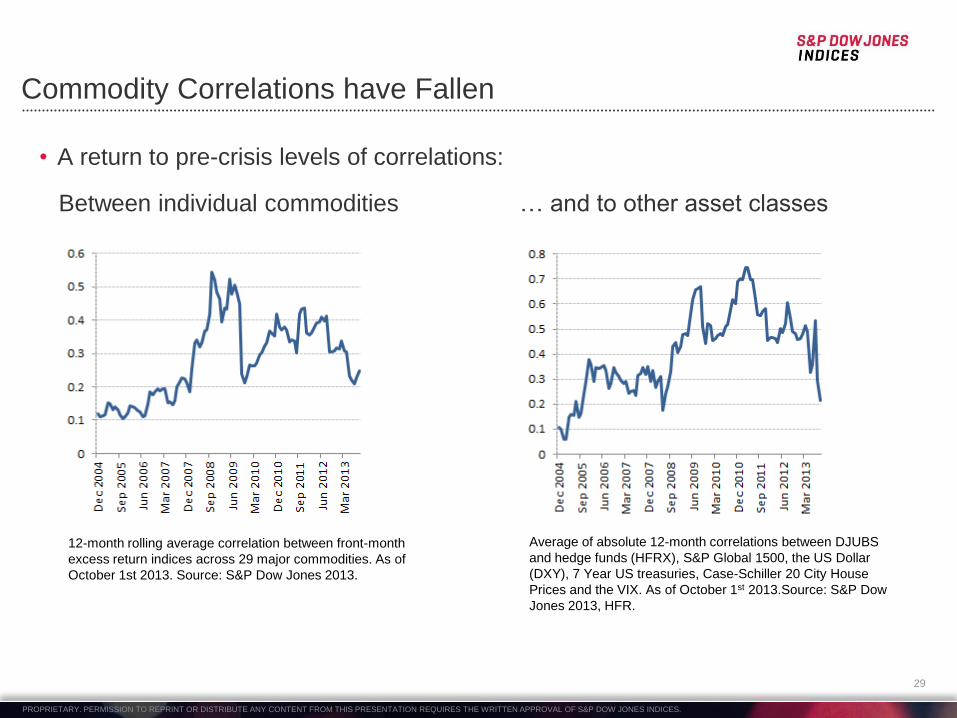
Commodity Correlations have Fallen
Between individual commodities
12-month rolling average correlation between front-month
excess return indices across 29 major commodities. As of
October 1st 2013. Source: S&P Dow Jones 2013.
… and to other asset classes
Average of absolute 12-month correlations between DJUBS
and hedge funds (HFRX), S&P Global 1500, the US Dollar
(DXY), 7 Year US treasuries, Case-Schiller 20 City House
Prices and the VIX. As of October 1st 2013.Source: S&P Dow
Jones 2013, HFR.
• A return to pre-crisis levels of correlations:

PROPRIETARY. PERMISSION TO REPRINT OR DISTRIBUTE ANY CONTENT FROM THIS PRESENTATION REQUIRES THE WRITTEN APPROVAL OF S&P DOW JONES INDICES.
30
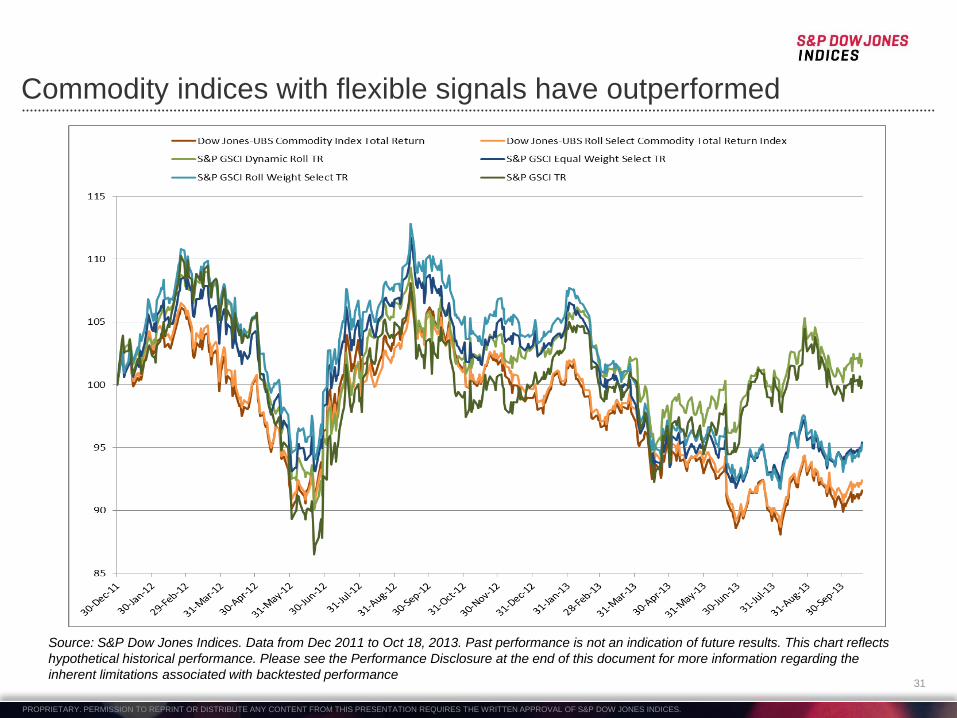
Recent Impacts on Index Performance
First generation indices are outperforming deferred strategies but flexible strategies have performed best.
PROPRIETARY. PERMISSION TO REPRINT OR DISTRIBUTE ANY CONTENT FROM THIS PRESENTATION REQUIRES THE WRITTEN APPROVAL OF S&P DOW JONES INDICES.
31
Commodity indices with flexible signals have outperformed
Source: S&P Dow Jones Indices. Data from Dec 2011 to Oct 18, 2013. Past performance is not an indication of future results. This chart reflects
hypothetical historical performance. Please see the Performance Disclosure at the end of this document for more information regarding the
inherent limitations associated with backtested performance
PROPRIETARY. PERMISSION TO REPRINT OR DISTRIBUTE ANY CONTENT FROM THIS PRESENTATION REQUIRES THE WRITTEN APPROVAL OF S&P DOW JONES INDICES.
32
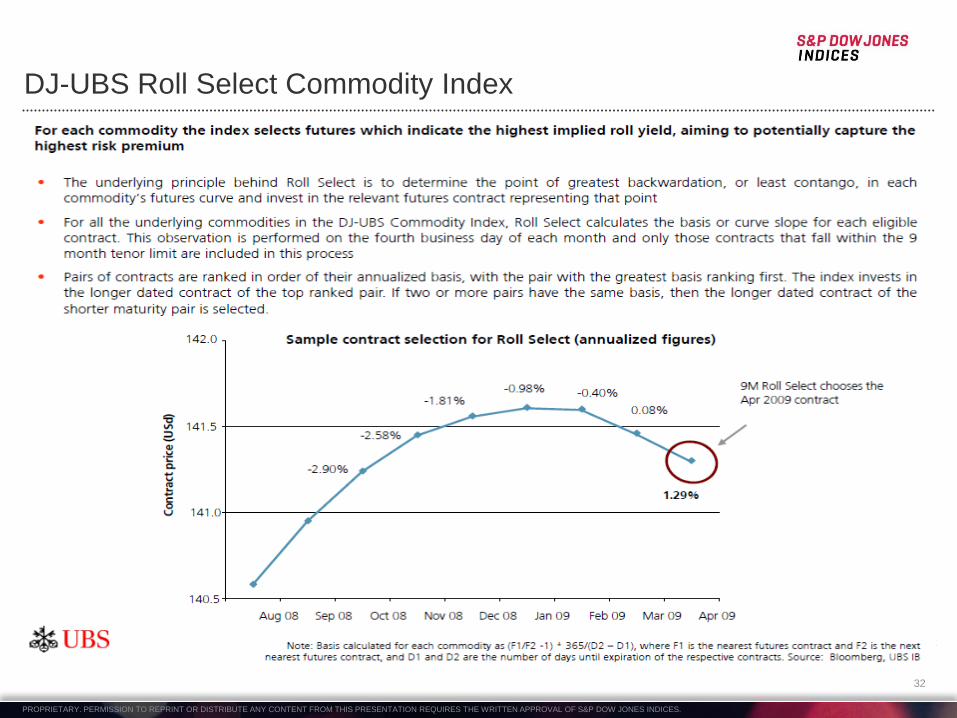
DJ-UBS Roll Select Commodity Index
PROPRIETARY. PERMISSION TO REPRINT OR DISTRIBUTE ANY CONTENT FROM THIS PRESENTATION REQUIRES THE WRITTEN APPROVAL OF S&P DOW JONES INDICES.
33
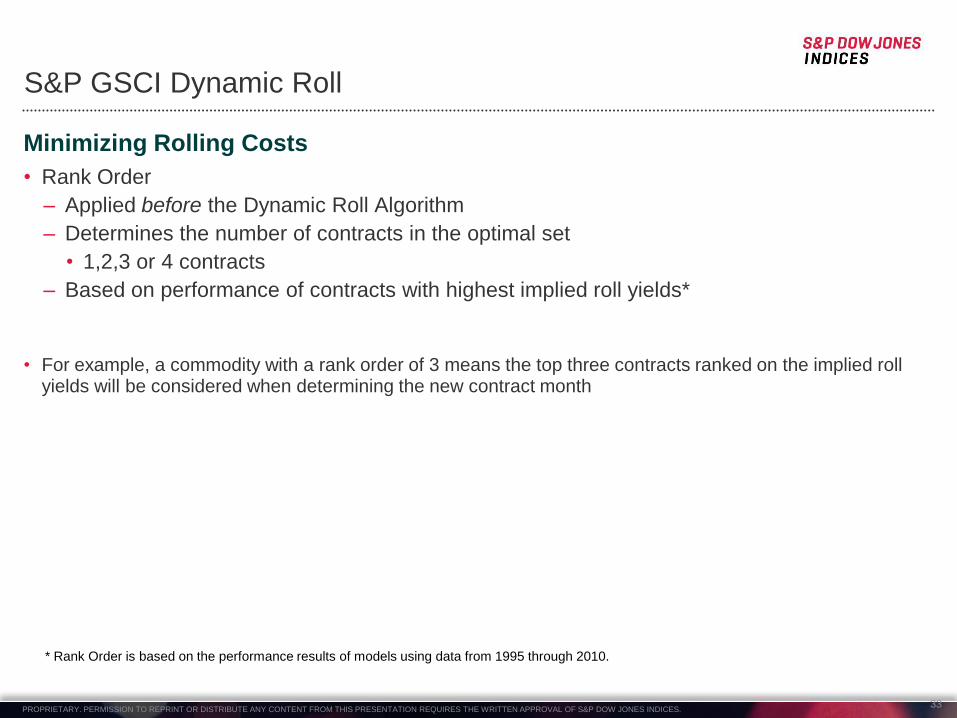
S&P GSCI Dynamic Roll
Minimizing Rolling Costs
• Rank Order
– Applied before the Dynamic Roll Algorithm
– Determines the number of contracts in the optimal set
• 1,2,3 or 4 contracts
– Based on performance of contracts with highest implied roll yields*
• For example, a commodity with a rank order of 3 means the top three contracts ranked on the implied roll yields will be considered when determining the new contract month
* Rank Order is based on the performance results of models using data from 1995 through 2010.
PROPRIETARY. PERMISSION TO REPRINT OR DISTRIBUTE ANY CONTENT FROM THIS PRESENTATION REQUIRES THE WRITTEN APPROVAL OF S&P DOW JONES INDICES.
34
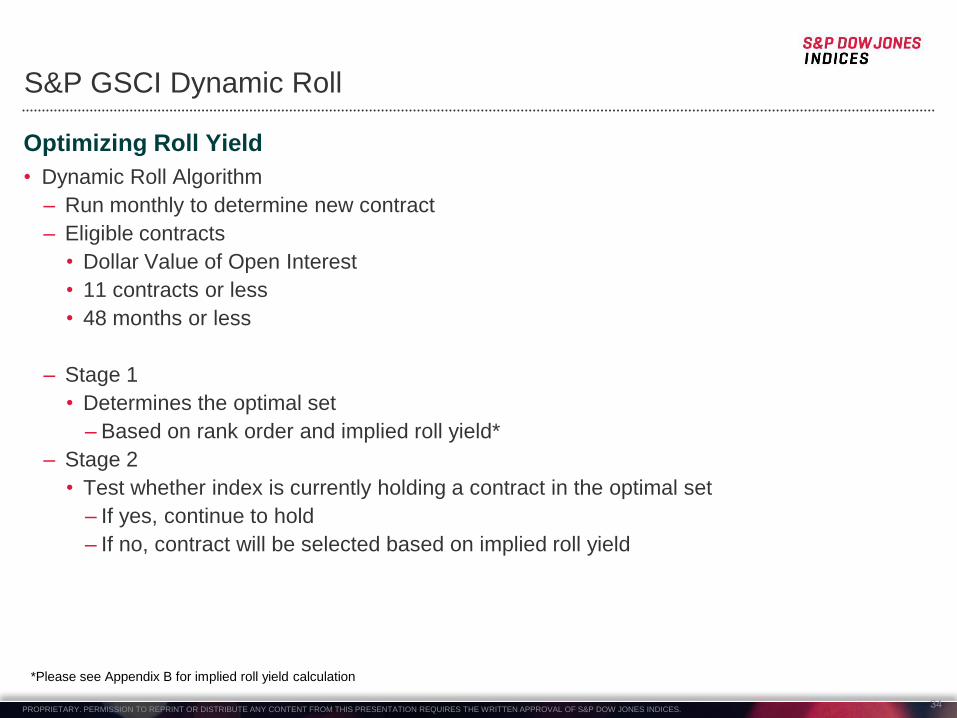
S&P GSCI Dynamic Roll
Optimizing Roll Yield
• Dynamic Roll Algorithm
– Run monthly to determine new contract
– Eligible contracts
• Dollar Value of Open Interest
• 11 contracts or less
• 48 months or less
– Stage 1
• Determines the optimal set
– Based on rank order and implied roll yield*
– Stage 2
• Test whether index is currently holding a contract in the optimal set
– If yes, continue to hold
– If no, contract will be selected based on implied roll yield
*Please see Appendix B for implied roll yield calculation
PROPRIETARY. PERMISSION TO REPRINT OR DISTRIBUTE ANY CONTENT FROM THIS PRESENTATION REQUIRES THE WRITTEN APPROVAL OF S&P DOW JONES INDICES.
35
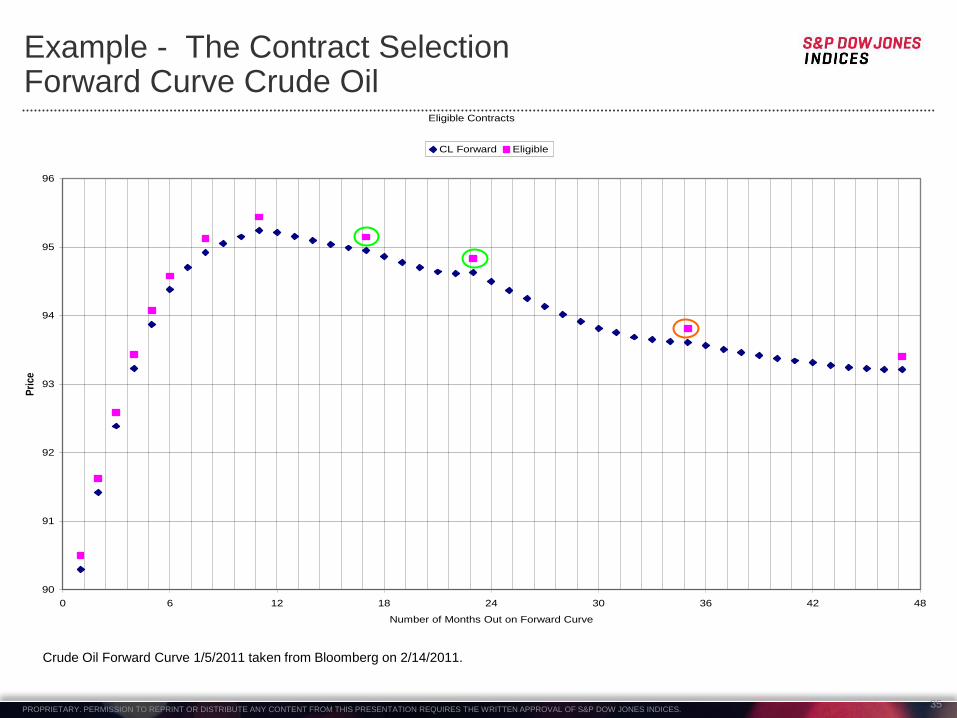
Example - The Contract Selection Forward Curve Crude Oil
Eligible Contracts
90
91
92
93
94
95
96
0 6 12 18 24 30 36 42 48
Number of Months Out on Forward Curve
Pri
ce
CL Forward Eligible
Crude Oil Forward Curve 1/5/2011 taken from Bloomberg on 2/14/2011.
PROPRIETARY. PERMISSION TO REPRINT OR DISTRIBUTE ANY CONTENT FROM THIS PRESENTATION REQUIRES THE WRITTEN APPROVAL OF S&P DOW JONES INDICES.
36
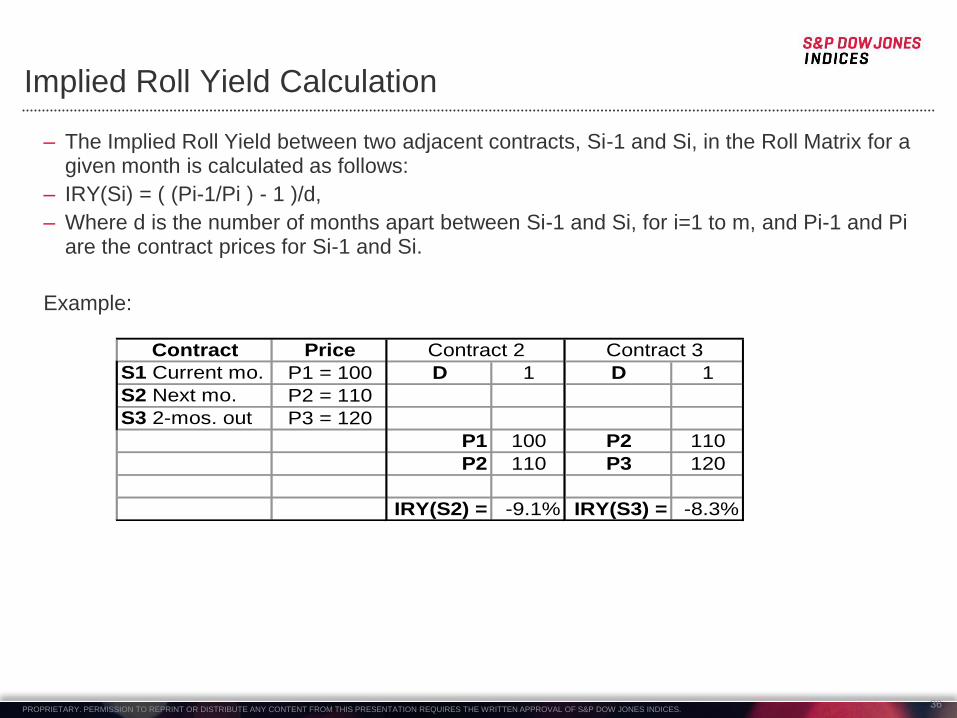
Implied Roll Yield Calculation
– The Implied Roll Yield between two adjacent contracts, Si-1 and Si, in the Roll Matrix for a given month is calculated as follows:
– IRY(Si) = ( (Pi-1/Pi ) - 1 )/d,
– Where d is the number of months apart between Si-1 and Si, for i=1 to m, and Pi-1 and Pi are the contract prices for Si-1 and Si.
Example:
Contract Price
S1 Current mo. P1 = 100 D 1 D 1
S2 Next mo. P2 = 110
S3 2-mos. out P3 = 120
P1 100 P2 110
P2 110 P3 120
IRY(S2) = -9.1% IRY(S3) = -8.3%
Contract 2 Contract 3
PROPRIETARY. PERMISSION TO REPRINT OR DISTRIBUTE ANY CONTENT FROM THIS PRESENTATION REQUIRES THE WRITTEN APPROVAL OF S&P DOW JONES INDICES.
37
Weight Modifications Have Been in High Demand
In order to preserve more liquidity while managing risk both from volatility and rolling, new strategies that focus of modifying weights are at the forefront.
• Forward curves states tend to be persistent when measured by the realized roll yields
• Relative steepness has also been persistent
The possible reason for the persistence in realized roll yield may be, as discussed in Till and Eagleeye (2005), “if there are inadequate inventories for a commodity, only its price can respond to equilibrate supply and demand, given that in the short run, new supplies of physical commodities cannot be mined, grown, and/or drilled. When there is a supply/usage imbalance in a commodity market, its price trend may be persistent….“
Given the logic behind the persistence of term structures of commodity futures, the change in realized roll yield is a reasonable choice as an indicator to determine weight. It is an extension of implied roll yield, the signal for contract selection in the S&P GSCI Dynamic Roll.
Another indexing innovation afforded by the change in realized roll yield is that for the first time, a term structure measurement can be made on a broad basket or sector rather than only a single commodity.
PROPRIETARY. PERMISSION TO REPRINT OR DISTRIBUTE ANY CONTENT FROM THIS PRESENTATION REQUIRES THE WRITTEN APPROVAL OF S&P DOW JONES INDICES.
38
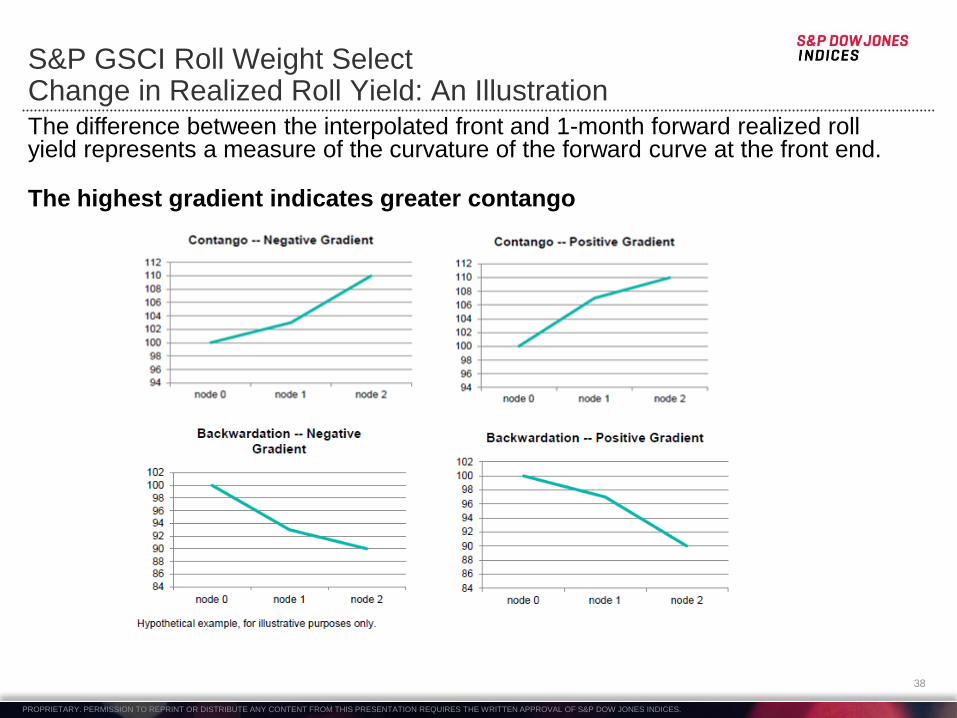
S&P GSCI Roll Weight Select Change in Realized Roll Yield: An Illustration
The difference between the interpolated front and 1-month forward realized roll yield represents a measure of the curvature of the forward curve at the front end.
The highest gradient indicates greater contango
PROPRIETARY. PERMISSION TO REPRINT OR DISTRIBUTE ANY CONTENT FROM THIS PRESENTATION REQUIRES THE WRITTEN APPROVAL OF S&P DOW JONES INDICES.
PROPRIETARY. Permission to reprint or
distribute any content from this
presentation requires the written approval
of Standard & Poor’s.
39
1. Source:http://www.nfa.futures.org/nfa-registration/cta/index.html
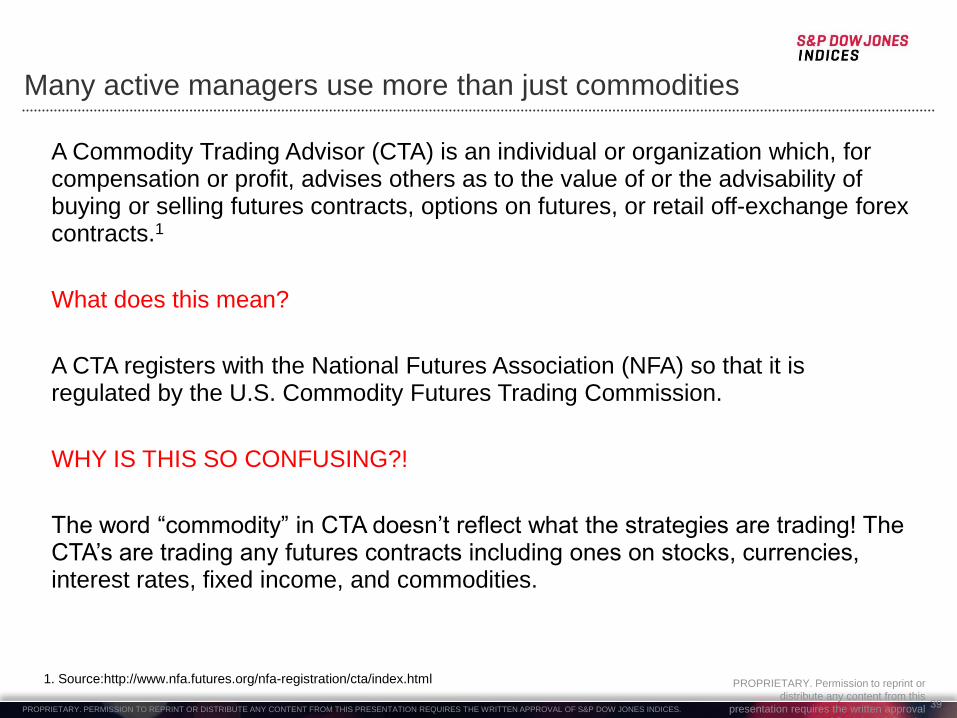
Many active managers use more than just commodities
A Commodity Trading Advisor (CTA) is an individual or organization which, for compensation or profit, advises others as to the value of or the advisability of buying or selling futures contracts, options on futures, or retail off-exchange forex contracts.1
What does this mean?
A CTA registers with the National Futures Association (NFA) so that it is regulated by the U.S. Commodity Futures Trading Commission.
WHY IS THIS SO CONFUSING?!
The word “commodity” in CTA doesn’t reflect what the strategies are trading! The CTA’s are trading any futures contracts including ones on stocks, currencies, interest rates, fixed income, and commodities.
PROPRIETARY. PERMISSION TO REPRINT OR DISTRIBUTE ANY CONTENT FROM THIS PRESENTATION REQUIRES THE WRITTEN APPROVAL OF S&P DOW JONES INDICES.
PROPRIETARY. Permission to reprint or
distribute any content from this
presentation requires the written approval
of Standard & Poor’s.
40
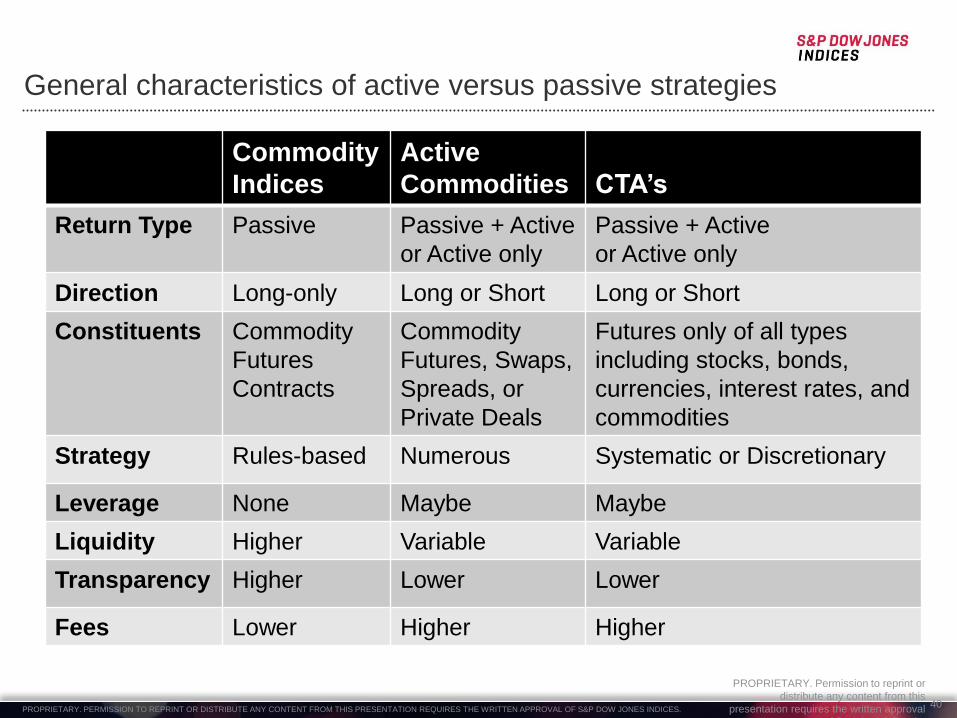
General characteristics of active versus passive strategies
Commodity
Indices
Active
Commodities
CTA’s
Return Type Passive Passive + Active
or Active only
Passive + Active
or Active only
Direction Long-only Long or Short Long or Short
Constituents Commodity
Futures
Contracts
Commodity
Futures, Swaps,
Spreads, or
Private Deals
Futures only of all types
including stocks, bonds,
currencies, interest rates, and
commodities
Strategy Rules-based Numerous Systematic or Discretionary
Leverage None Maybe Maybe
Liquidity Higher Variable Variable
Transparency Higher Lower Lower
Fees Lower Higher Higher
PROPRIETARY. PERMISSION TO REPRINT OR DISTRIBUTE ANY CONTENT FROM THIS PRESENTATION REQUIRES THE WRITTEN APPROVAL OF S&P DOW JONES INDICES.
41
S&P SGMI
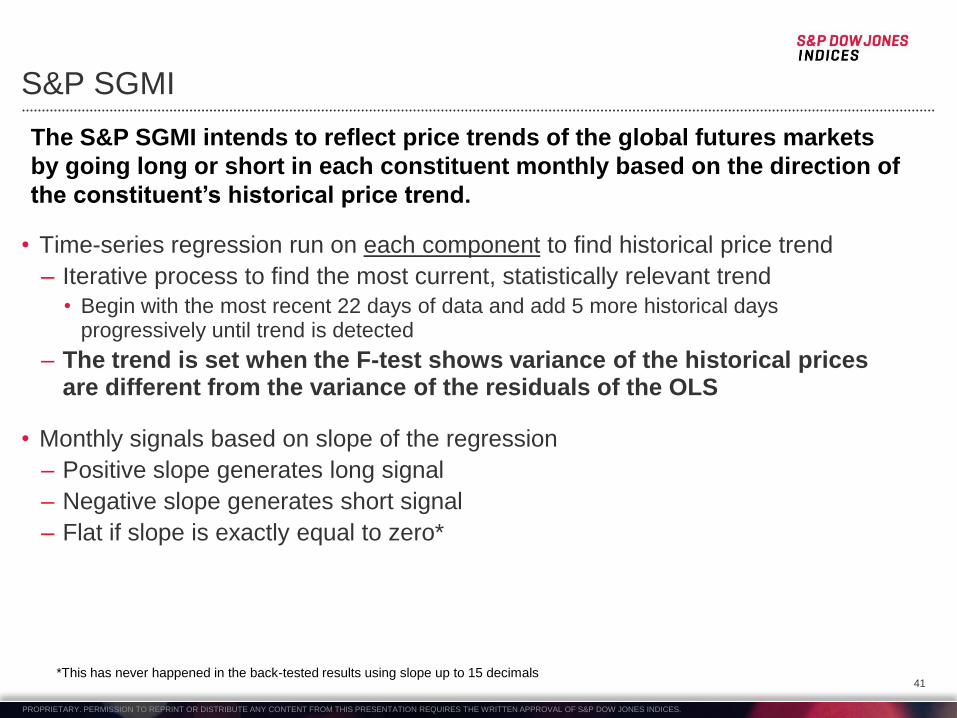
• Time-series regression run on each component to find historical price trend
– Iterative process to find the most current, statistically relevant trend
• Begin with the most recent 22 days of data and add 5 more historical days progressively until trend is detected
– The trend is set when the F-test shows variance of the historical prices are different from the variance of the residuals of the OLS
• Monthly signals based on slope of the regression
– Positive slope generates long signal
– Negative slope generates short signal
– Flat if slope is exactly equal to zero*
*This has never happened in the back-tested results using slope up to 15 decimals
The S&P SGMI intends to reflect price trends of the global futures markets
by going long or short in each constituent monthly based on the direction of
the constituent’s historical price trend.
PROPRIETARY. PERMISSION TO REPRINT OR DISTRIBUTE ANY CONTENT FROM THIS PRESENTATION REQUIRES THE WRITTEN APPROVAL OF S&P DOW JONES INDICES.
42
S&P SGMI: Position direction example
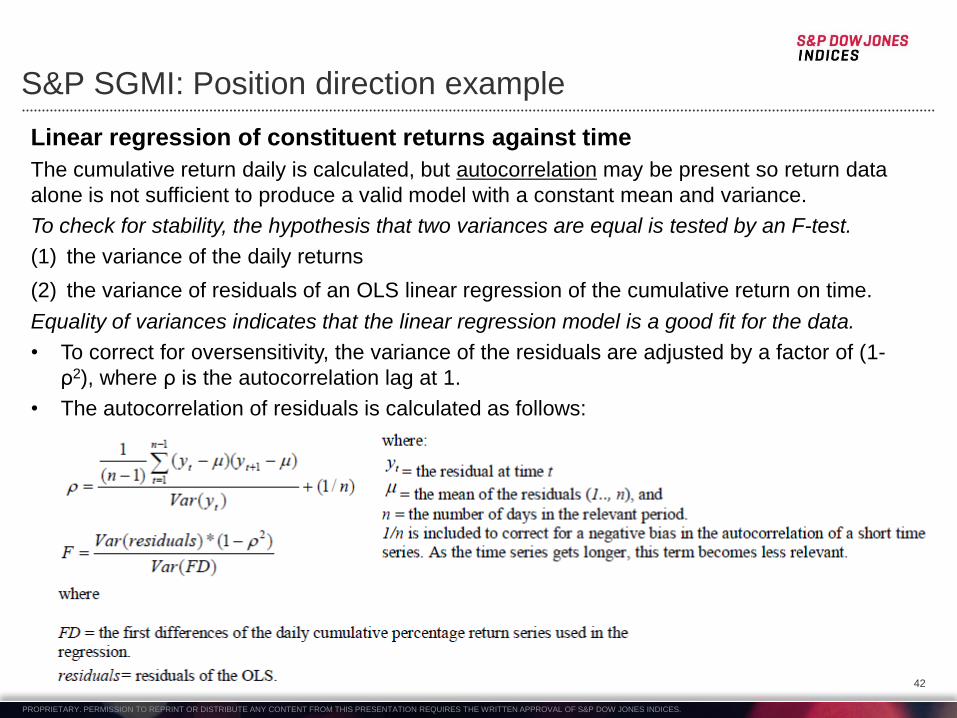
Linear regression of constituent returns against time
The cumulative return daily is calculated, but autocorrelation may be present so return data
alone is not sufficient to produce a valid model with a constant mean and variance.
To check for stability, the hypothesis that two variances are equal is tested by an F-test.
(1) the variance of the daily returns
(2) the variance of residuals of an OLS linear regression of the cumulative return on time.
Equality of variances indicates that the linear regression model is a good fit for the data.
• To correct for oversensitivity, the variance of the residuals are adjusted by a factor of (1-
ρ2), where ρ is the autocorrelation lag at 1.
• The autocorrelation of residuals is calculated as follows:
PROPRIETARY. PERMISSION TO REPRINT OR DISTRIBUTE ANY CONTENT FROM THIS PRESENTATION REQUIRES THE WRITTEN APPROVAL OF S&P DOW JONES INDICES.
43
S&P SGMI: Position direction example
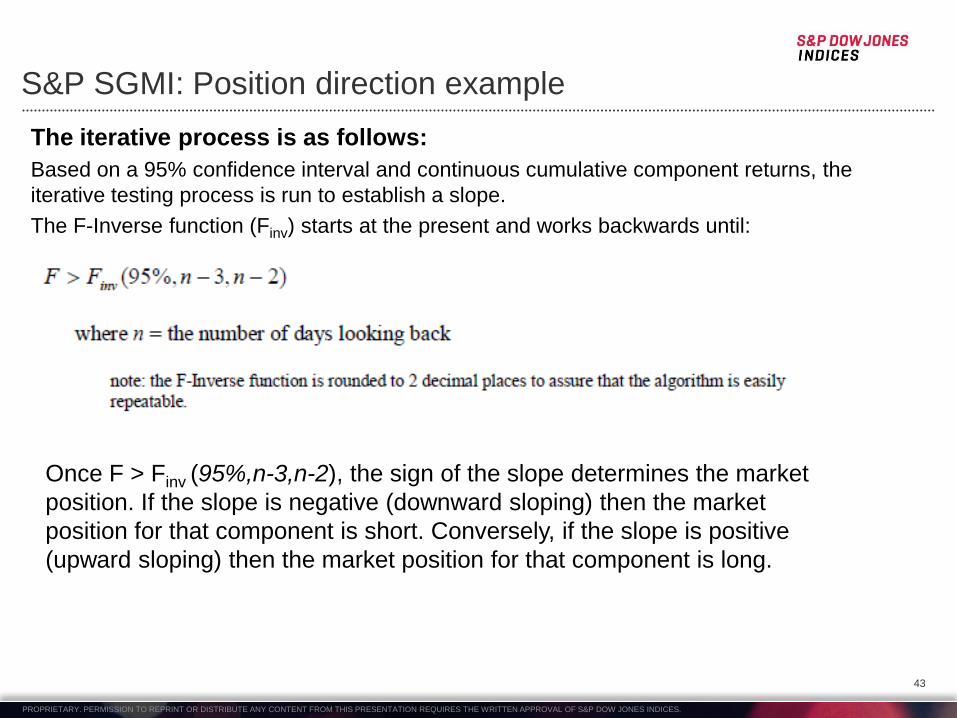
The iterative process is as follows:
Based on a 95% confidence interval and continuous cumulative component returns, the
iterative testing process is run to establish a slope.
The F-Inverse function (Finv) starts at the present and works backwards until:
Once F > Finv (95%,n-3,n-2), the sign of the slope determines the market
position. If the slope is negative (downward sloping) then the market
position for that component is short. Conversely, if the slope is positive
(upward sloping) then the market position for that component is long.
PROPRIETARY. PERMISSION TO REPRINT OR DISTRIBUTE ANY CONTENT FROM THIS PRESENTATION REQUIRES THE WRITTEN APPROVAL OF S&P DOW JONES INDICES.
•PROPRIETARY. Permission to reprint or distribute any content from this
44
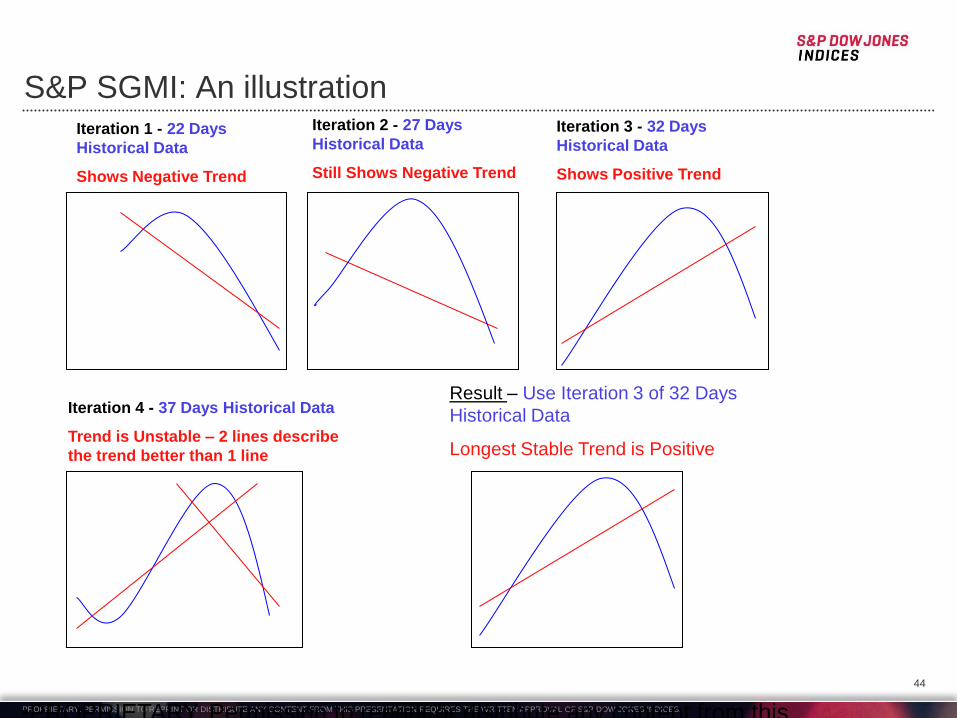
S&P SGMI: An illustration
Iteration 1 - 22 Days
Historical Data
Shows Negative Trend
Iteration 2 - 27 Days
Historical Data
Still Shows Negative Trend
Iteration 4 - 37 Days Historical Data
Trend is Unstable – 2 lines describe
the trend better than 1 line
Result – Use Iteration 3 of 32 Days
Historical Data
Longest Stable Trend is Positive
Iteration 3 - 32 Days
Historical Data
Shows Positive Trend
PROPRIETARY. PERMISSION TO REPRINT OR DISTRIBUTE ANY CONTENT FROM THIS PRESENTATION REQUIRES THE WRITTEN APPROVAL OF S&P DOW JONES INDICES.
45
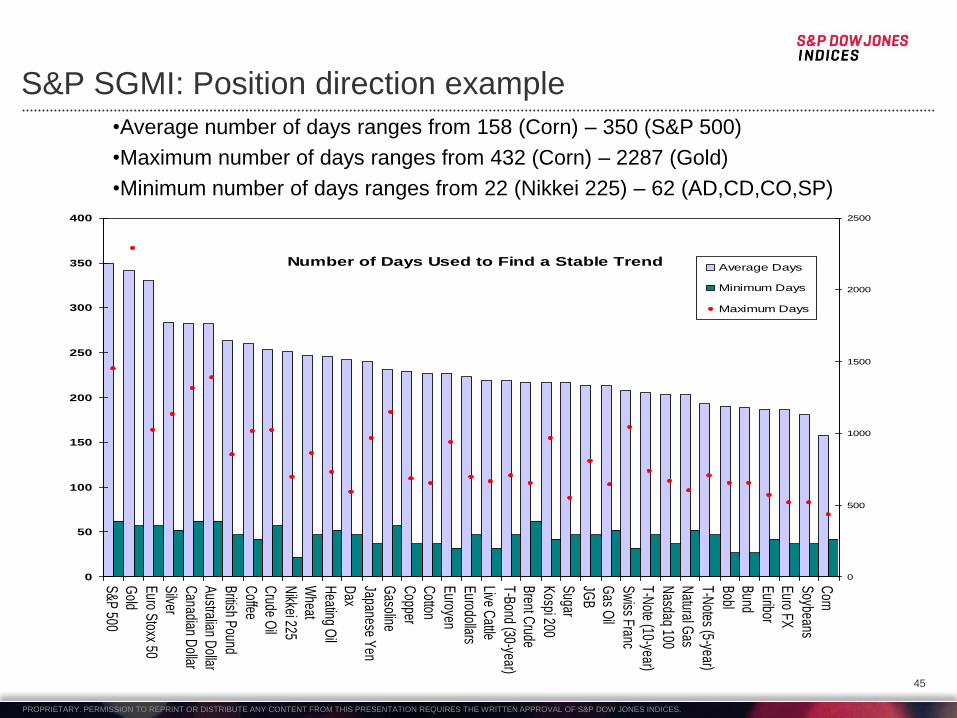
S&P SGMI: Position direction example
Number of Days Used to Find a Stable Trend
0
50
100
150
200
250
300
350
400
S&
P 500
Gold
Euro S
toxx 50
Silver
Canadian D
ollar
Australian D
ollar
British P
ound
Coffee
Crude O
il
Nikkei 225
Wheat
Heating O
il
Dax
Japanese Yen
Gasoline
Copper
Cotton
Euroyen
Eurodollars
Live Cattle
T-Bond (30-year)
Brent C
rude
Kospi 200
Sugar
JGB
Gas O
il
Sw
iss Franc
T-Note (10-year)
Nasdaq 100
Natural G
as
T-Notes (5-year)
Bobl
Bund
Euribor
Euro FX
Soybeans
Corn
0
500
1000
1500
2000
2500
Average Days
Minimum Days
Maximum Days
•Average number of days ranges from 158 (Corn) – 350 (S&P 500)
•Maximum number of days ranges from 432 (Corn) – 2287 (Gold)
•Minimum number of days ranges from 22 (Nikkei 225) – 62 (AD,CD,CO,SP)
PROPRIETARY. PERMISSION TO REPRINT OR DISTRIBUTE ANY CONTENT FROM THIS PRESENTATION REQUIRES THE WRITTEN APPROVAL OF S&P DOW JONES INDICES.
46
Source: Russell Investments // Active Commoditiy Investing. Russell Research by Lee Keyser, Research Analyst
http://www.openworldinvesting.com/files/active_commodity_investing.pdf
Active strategies have many choices of fund structures and implementation options • Long-only products
– utilize curve strategies
– under/overweights to commodity sectors and individual commodities
• Long-neutral products
– tactically allocate to cash
• Long-biased products
– allow limited shorting
• Long-short products
– benchmark-agnostic and seek absolute returns
– use spread trades and outright long or short directional bets
• Specialist managers
– limit investments to specific sectors
• Thematic strategies
– employ long-term macro views on commodity sectors
PROPRIETARY. PERMISSION TO REPRINT OR DISTRIBUTE ANY CONTENT FROM THIS PRESENTATION REQUIRES THE WRITTEN APPROVAL OF S&P DOW JONES INDICES.
PROPRIETARY. Permission to reprint or
distribute any content from this
presentation requires the written approval
of Standard & Poor’s.
47
Source: Russell Investments // Active Commoditiy Investing. Russell Research by Lee Keyser, Research Analyst
http://www.openworldinvesting.com/files/active_commodity_investing.pdf
Risk factors to consider in active commodity investing
• Liquidity
– Large position sizes
– Over-the-counter derivatives
• Collateral management
– Invest collateral opportunistically
– May use leverage
• Credit/counterparty risk
– May use custom derivatives
• Speculative limits
– Size and implementation strategies may be disrupted
• Delivery risk
– Non-commercial players may get “squeezed” during delivery
• Model/analytics risk
– Many risk systems only handle stocks and bonds appropriately

Thank You
Contact Us
Jodie M. Gunzberg, CFA
Head of Commodity Indices
PROPRIETARY. PERMISSION TO REPRINT OR DISTRIBUTE ANY CONTENT FROM THIS PRESENTATION REQUIRES THE WRITTEN APPROVAL OF S&P DOW JONES INDICES.
PROPRIETARY. Permission to reprint or
distribute any content from this
presentation requires the written approval
of Standard & Poor’s.
49
Performance Disclosure
It is not possible to invest directly in an S&P index. Past performance of an index is not an indication of future results.
S&P acquired the GSCI from Goldman Sachs on February 2, 2007 and it was subsequently renamed the S&P GSCI. Goldman Sachs began first publishing the GSCI related indices in 1991 but has calculated the historical value of the GSCI beginning January 2, 1970 based on actual prices from that date forward and the selection criteria, methodology and procedures in effect during the applicable periods of calculation (or, in the case of all calculation periods prior to 1991, based on the selection criteria, methodology and procedures adopted in 1991). The GSCI has been normalized to a value of 100 on January 2, 1970, in order to permit comparisons of the value of the GSCI to be made over time.
The inception dates for the S&P GSCI is May 1, 1991 at the market close.
The inception date for the S&P GSCI Enhanced Index is March 28, 2007 at the market close.
The inception date for the S&P GSCI 3-Month Forward Index is February 3, 2008 at the market close.
The inception date for the S&P GSCI Equal Weight Select Index is September 9, 2010 at the market close.
The inception date for the S&P GSCI Covered Call Select Index is October 7, 2010 at the market close.
The inception date for the S&P Dynamic Futures Index (DFI) is February 19, 2010 at the market close.
The inception date for the S&P/BGCantor 7-10 Years U.S. Treasury Bond Index is February 7, 2009 at the market close.
The inception date for the S&P World Commodity Index (WCI) is May 5, 2010 at the market close.
The inception date for the S&P GSCI Dynamic Roll Index is January 27, 2011 at the market close.
The inception date for the S&P Systematic Global Macro Index (SGMI) is August 9, 2011 at the market close.
The indices were not in existence prior to that date and all data presented prior to that date are back-tested. The back-test calculations are based on the same methodology that was in effect when the indices were officially launched. Complete index methodology details are available at www.indices.standardandpoors.com.
Prospective application of the methodology used to construct the S&P GSCI, S&P GSCI Enhanced Index, S&P GSCI 3-Month Forward Index, S&P Dynamic Futures Index (DFI), S&P Commodity Trading Strategy Index (CTSI), S&P/BGCantor 7-10 Years U.S. Treasury Bond Index, and S&P World Commodity Index (WCI) may not result in performance commensurate with the back-test returns shown. The back-test period does not necessarily correspond to the entire available history of the indices. Please refer to the methodology paper for the indices, available at www.standardandpoors.com for more details about the indices, including the manner in which they are rebalanced, and the timing of such rebalancing, criteria for additions and deletions and index calculation. The indices are rules based, although the Index Committee reserves the right to exercise discretion, when necessary.
The index performance has inherent limitations. The index returns shown do not represent the results of actual trading of investor assets. Standard & Poor’s maintains the indices and calculates the index levels and performance shown or discussed, but does not manage actual assets. Indices are statistical composites and their returns do not reflect payment of any sales charges or fees an investor would pay to purchase the securities they represent. The imposition of these fees and charges would cause actual and back-tested performance to be lower than the performance shown. For example, if an index returned 10% on a US$ 100,000 investment for a 12-month period (or US$ 10,000) and an annual asset-based fee of 1.5% were imposed at the end of the period (or US$ 1,650), the net return would be 8.35% (or US$ 8,350) for the year. Over 3 years, an annual 1.5% fee taken at year end with an assumed 10% return per year would result in a cumulative gross return of 33.1%, a total fee of US$ 5,375, and a cumulative net return of 27.2% (or US$ 27,200).
PROPRIETARY. PERMISSION TO REPRINT OR DISTRIBUTE ANY CONTENT FROM THIS PRESENTATION REQUIRES THE WRITTEN APPROVAL OF S&P DOW JONES INDICES.
General Disclaimer
Copyright © 2013 by S&P Dow Jones Indices LLC, a part of McGraw Hill Financial, Inc., and/or its affiliates. All rights reserved. Standard & Poor’s, S&P, GSCI, and S&P 500 are registered trademarks of Standard & Poor’s Financial Services LLC (“S&P”), a part of McGraw Hill Financial, Inc. Dow Jones is a registered trademark of Dow Jones Trademark Holdings LLC (“Dow Jones”). Trademarks have been licensed to S&P Dow Jones Indices LLC. Redistribution, reproduction and/or photocopying in whole or in part are prohibited without written permission. This document does not constitute an offer of services in jurisdictions where S&P Dow Jones Indices LLC, Dow Jones, S&P or their respective affiliates (collectively “S&P Dow Jones Indices”) do not have the necessary licenses. All information provided by S&P Dow Jones Indices is impersonal and not tailored to the needs of any person, entity or group of persons. S&P Dow Jones Indices receives compensation in connection with licensing its indices to third parties. Past performance of an index is not a guarantee of future results.
It is not possible to invest directly in an index. Exposure to an asset class represented by an index is available through investable instruments based on that index. S&P Dow Jones Indices does not sponsor, endorse, sell, promote or manage any investment fund or other investment vehicle that is offered by third parties and that seeks to provide an investment return based on the performance of any index. S&P Dow Jones Indices makes no assurance that investment products based on the index will accurately track index performance or provide positive investment returns. S&P Dow Jones Indices LLC is not an investment advisor, and S&P Dow Jones Indices makes no representation regarding the advisability of investing in any such investment fund or other investment vehicle. A decision to invest in any such investment fund or other investment vehicle should not be made in reliance on any of the statements set forth in this document. Prospective investors are advised to make an investment in any such fund or other vehicle only after carefully considering the risks associated with investing in such funds, as detailed in an offering memorandum or similar document that is prepared by or on behalf of the issuer of the investment fund or other vehicle. Inclusion of a security within an index is not a recommendation by S&P Dow Jones Indices to buy, sell, or hold such security, nor is it considered to be investment advice.
These materials have been prepared solely for informational purposes based upon information generally available to the public from sources believed to be reliable. No content contained in these materials (including index data, ratings, credit-related analyses and data, model, software or other application or output therefrom) or any part thereof (Content) may be modified, reverse-engineered, reproduced or distributed in any form by any means, or stored in a database or retrieval system, without the prior written permission of S&P Dow Jones Indices. The Content shall not be used for any unlawful or unauthorized purposes. S&P Dow Jones Indices and its third-party data providers and licensors (collectively “S&P Dow Jones Indices Parties”) do not guarantee the accuracy, completeness, timeliness or availability of the Content. S&P Dow Jones Indices Parties are not responsible for any errors or omissions, regardless of the cause, for the results obtained from the use of the Content. THE CONTENT IS PROVIDED ON AN “AS IS” BASIS. S&P DOW JONES INDICES PARTIES DISCLAIM ANY AND ALL EXPRESS OR IMPLIED WARRANTIES, INCLUDING, BUT NOT LIMITED TO, ANY WARRANTIES OF MERCHANTABILITY OR FITNESS FOR A PARTICULAR PURPOSE OR USE, FREEDOM FROM BUGS, SOFTWARE ERRORS OR DEFECTS, THAT THE CONTENT’S FUNCTIONING WILL BE UNINTERRUPTED OR THAT THE CONTENT WILL OPERATE WITH ANY SOFTWARE OR HARDWARE CONFIGURATION. In no event shall S&P Dow Jones Indices Parties be liable to any party for any direct, indirect, incidental, exemplary, compensatory, punitive, special or consequential damages, costs, expenses, legal fees, or losses (including, without limitation, lost income or lost profits and opportunity costs) in connection with any use of the Content even if advised of the possibility of such damages.
S&P Dow Jones Indices keeps certain activities of its business units separate from each other in order to preserve the independence and objectivity of their respective activities. As a result, certain business units of S&P Dow Jones Indices may have information that is not available to other business units. S&P Dow Jones Indices has established policies and procedures to maintain the confidentiality of certain non-public information received in connection with each analytical process.
In addition, S&P Dow Jones Indices provides a wide range of services to, or relating to, many organizations, including issuers of securities, investment advisers, broker-dealers, investment banks, other financial institutions and financial intermediaries, and accordingly may receive fees or other economic benefits from those organizations, including organizations whose securities or services they may recommend, rate, include in model portfolios, evaluate or otherwise address.