Embed Size (px)
Citation preview
Commodity Outlook 2H 2019
Monday, July 15, 2019
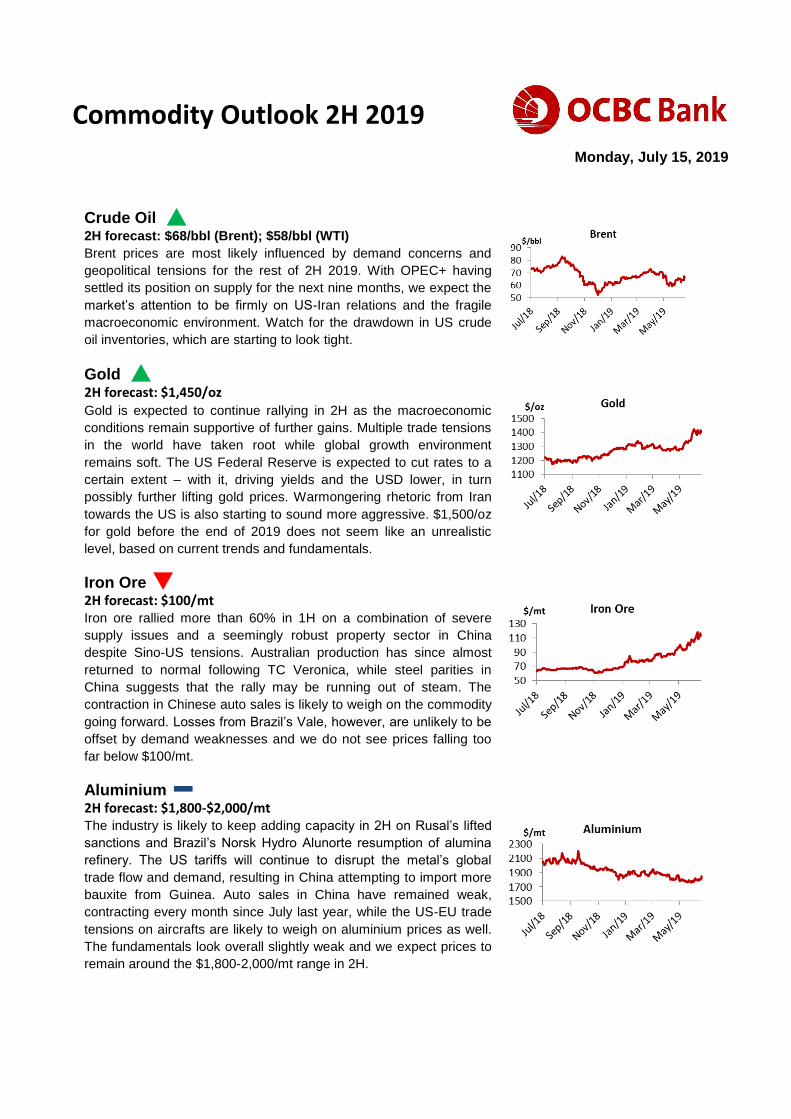
Crude Oil 2H forecast: $68/bbl (Brent); $58/bbl (WTI)
Brent prices are most likely influenced by demand concerns and
geopolitical tensions for the rest of 2H 2019. With OPEC+ having
settled its position on supply for the next nine months, we expect the
market’s attention to be firmly on US-Iran relations and the fragile
macroeconomic environment. Watch for the drawdown in US crude
oil inventories, which are starting to look tight.
Gold 2H forecast: $1,450/oz Gold is expected to continue rallying in 2H as the macroeconomic
conditions remain supportive of further gains. Multiple trade tensions
in the world have taken root while global growth environment
remains soft. The US Federal Reserve is expected to cut rates to a
certain extent – with it, driving yields and the USD lower, in turn
possibly further lifting gold prices. Warmongering rhetoric from Iran
towards the US is also starting to sound more aggressive. $1,500/oz
for gold before the end of 2019 does not seem like an unrealistic
level, based on current trends and fundamentals.
Iron Ore 2H forecast: $100/mt Iron ore rallied more than 60% in 1H on a combination of severe
supply issues and a seemingly robust property sector in China
despite Sino-US tensions. Australian production has since almost
returned to normal following TC Veronica, while steel parities in
China suggests that the rally may be running out of steam. The
contraction in Chinese auto sales is likely to weigh on the commodity
going forward. Losses from Brazil’s Vale, however, are unlikely to be
offset by demand weaknesses and we do not see prices falling too
far below $100/mt.
Aluminium 2H forecast: $1,800-$2,000/mt The industry is likely to keep adding capacity in 2H on Rusal’s lifted
sanctions and Brazil’s Norsk Hydro Alunorte resumption of alumina
refinery. The US tariffs will continue to disrupt the metal’s global
trade flow and demand, resulting in China attempting to import more
bauxite from Guinea. Auto sales in China have remained weak,
contracting every month since July last year, while the US-EU trade
tensions on aircrafts are likely to weigh on aluminium prices as well.
The fundamentals look overall slightly weak and we expect prices to
remain around the $1,800-2,000/mt range in 2H.
Treasury Research & Strategy 2
15 July 2019 Commodity Outlook 2H 2019
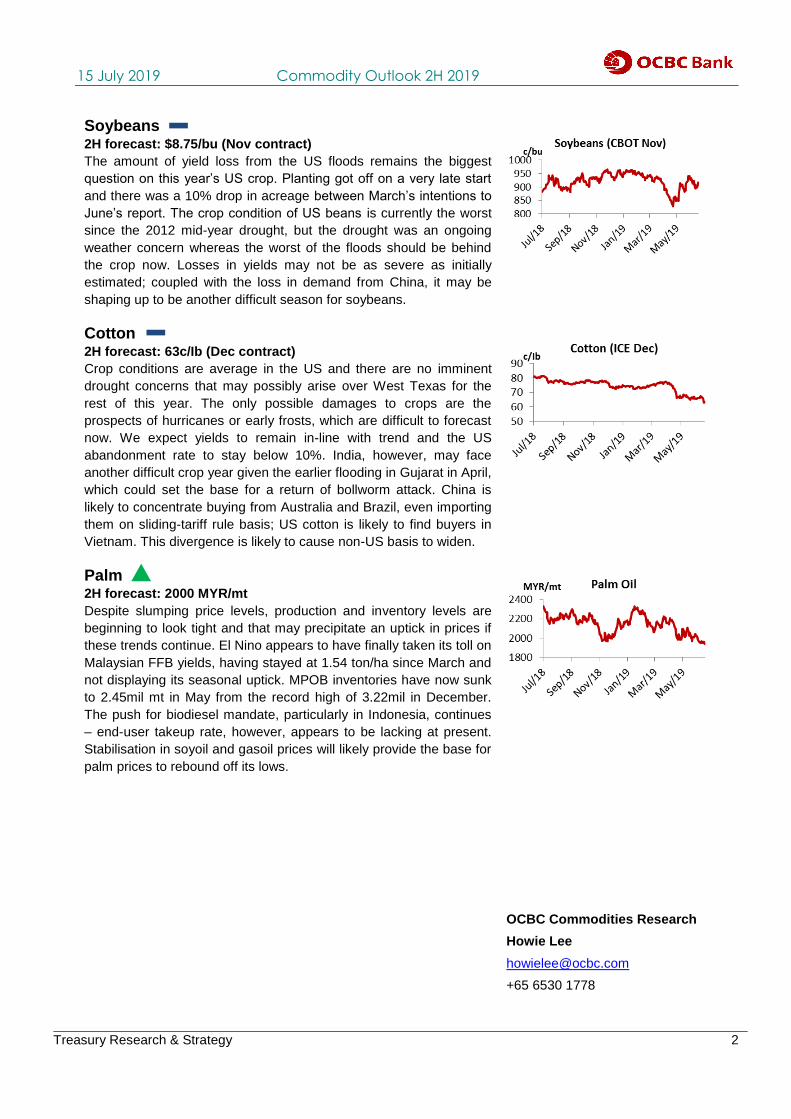
Soybeans 2H forecast: $8.75/bu (Nov contract)
The amount of yield loss from the US floods remains the biggest
question on this year’s US crop. Planting got off on a very late start
and there was a 10% drop in acreage between March’s intentions to
June’s report. The crop condition of US beans is currently the worst
since the 2012 mid-year drought, but the drought was an ongoing
weather concern whereas the worst of the floods should be behind
the crop now. Losses in yields may not be as severe as initially
estimated; coupled with the loss in demand from China, it may be
shaping up to be another difficult season for soybeans.
Cotton 2H forecast: 63c/Ib (Dec contract)
Crop conditions are average in the US and there are no imminent
drought concerns that may possibly arise over West Texas for the
rest of this year. The only possible damages to crops are the
prospects of hurricanes or early frosts, which are difficult to forecast
now. We expect yields to remain in-line with trend and the US
abandonment rate to stay below 10%. India, however, may face
another difficult crop year given the earlier flooding in Gujarat in April,
which could set the base for a return of bollworm attack. China is
likely to concentrate buying from Australia and Brazil, even importing
them on sliding-tariff rule basis; US cotton is likely to find buyers in
Vietnam. This divergence is likely to cause non-US basis to widen.
Palm 2H forecast: 2000 MYR/mt
Despite slumping price levels, production and inventory levels are
beginning to look tight and that may precipitate an uptick in prices if
these trends continue. El Nino appears to have finally taken its toll on
Malaysian FFB yields, having stayed at 1.54 ton/ha since March and
not displaying its seasonal uptick. MPOB inventories have now sunk
to 2.45mil mt in May from the record high of 3.22mil in December.
The push for biodiesel mandate, particularly in Indonesia, continues
– end-user takeup rate, however, appears to be lacking at present.
Stabilisation in soyoil and gasoil prices will likely provide the base for
palm prices to rebound off its lows.
OCBC Commodities Research
Howie Lee
+65 6530 1778
Treasury Research & Strategy 3
15 July 2019 Commodity Outlook 2H 2019
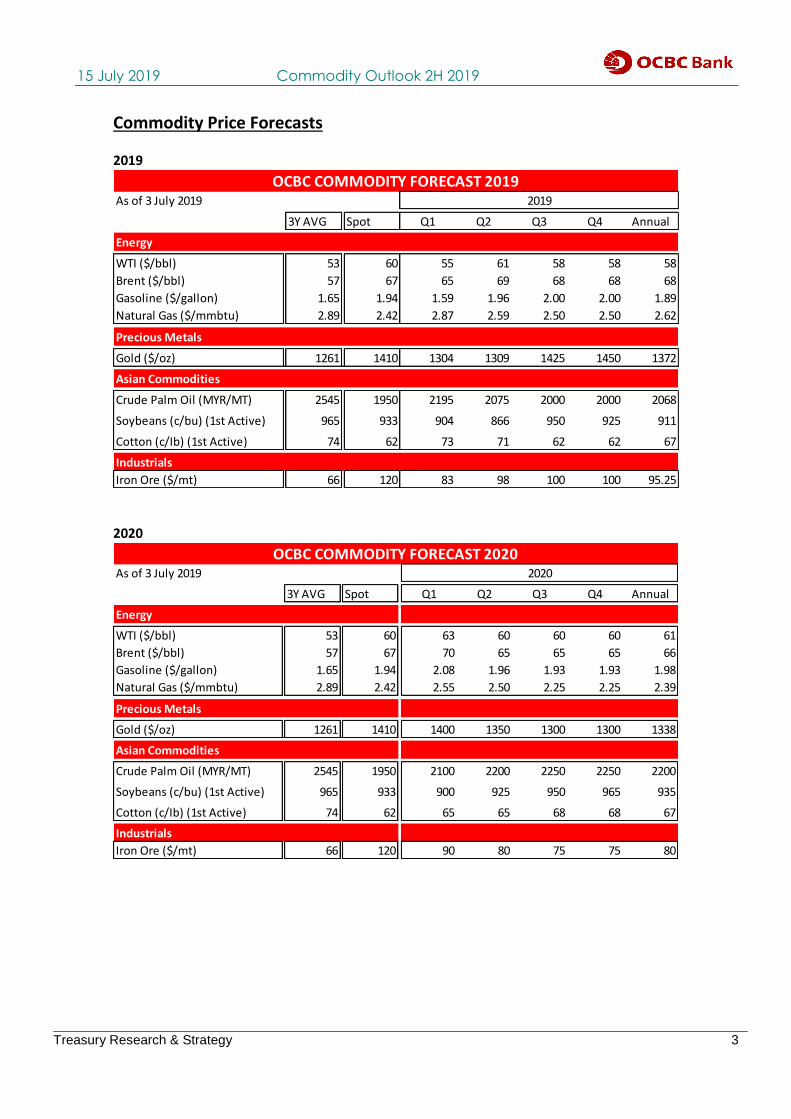
Commodity Price Forecasts 2019
As of 3 July 2019
3Y AVG Spot Q1 Q2 Q3 Q4 Annual
Energy
WTI ($/bbl) 53 60 55 61 58 58 58
Brent ($/bbl) 57 67 65 69 68 68 68
Gasoline ($/gallon) 1.65 1.94 1.59 1.96 2.00 2.00 1.89
Natural Gas ($/mmbtu) 2.89 2.42 2.87 2.59 2.50 2.50 2.62
Precious Metals
Gold ($/oz) 1261 1410 1304 1309 1425 1450 1372
Asian Commodities
Crude Palm Oil (MYR/MT) 2545 1950 2195 2075 2000 2000 2068
Soybeans (c/bu) (1st Active) 965 933 904 866 950 925 911
Cotton (c/Ib) (1st Active) 74 62 73 71 62 62 67
Industrials
Iron Ore ($/mt) 66 120 83 98 100 100 95.25
OCBC COMMODITY FORECAST 20192019
2020
As of 3 July 2019
3Y AVG Spot Q1 Q2 Q3 Q4 Annual
Energy
WTI ($/bbl) 53 60 63 60 60 60 61
Brent ($/bbl) 57 67 70 65 65 65 66
Gasoline ($/gallon) 1.65 1.94 2.08 1.96 1.93 1.93 1.98
Natural Gas ($/mmbtu) 2.89 2.42 2.55 2.50 2.25 2.25 2.39
Precious Metals
Gold ($/oz) 1261 1410 1400 1350 1300 1300 1338
Asian Commodities
Crude Palm Oil (MYR/MT) 2545 1950 2100 2200 2250 2250 2200
Soybeans (c/bu) (1st Active) 965 933 900 925 950 965 935
Cotton (c/Ib) (1st Active) 74 62 65 65 68 68 67
Industrials
Iron Ore ($/mt) 66 120 90 80 75 75 80
OCBC COMMODITY FORECAST 20202020
Treasury Research & Strategy 4
15 July 2019 Commodity Outlook 2H 2019
Crude Oil Prices are likely to stay flat with upside potentials in 2H. A downbeat forecast for global energy demand is likely negated by rising geopolitical tensions and constricted supplies from OPEC+. At present, we see factors as bullish for crude oil and think that fears of severely reduced demand have been overblown. Big 3 expected to produce 4mbp lesser in 2019 Early July saw OPEC+ members agreeing to keep output at current restricted quotas, as the oil bloc seeks to balance a volatile macroeconomic environment that has dampened global energy consumption. Shale production in the US has slowed and its current pace of output is unlikely to materially affect the supply curbs from OPEC this year. Combined oil production from the big 3 – OPEC, Russia and the US – is likely to finish 2019 with a production of at 51.77 mbdp by our estimates, almost -4 mbdp (-7%) lesser than 2018. The loss of 4 mbdp in production will weigh on the market and likely offset the pessimism surrounding energy consumption, keeping prices supported.
'000 bpd 3Q 2018 4Q 2018 1Q 2019 2Q 2019F 3Q 2019F 4Q 2019F
OPEC 32,900 32,550 30,275 30,000 30,000 30,000
Russia 11,285 11,451 11,330 11,200 11,200 11,200
US 11,000 11,650 12,080 12,250 12,550 12,850
Combined 55,185 55,651 53,685 53,450 53,750 54,050
Crude Oil Production by Big 3 Producers
Source: OPEC, Bloomberg, EIA, OCBC Bank
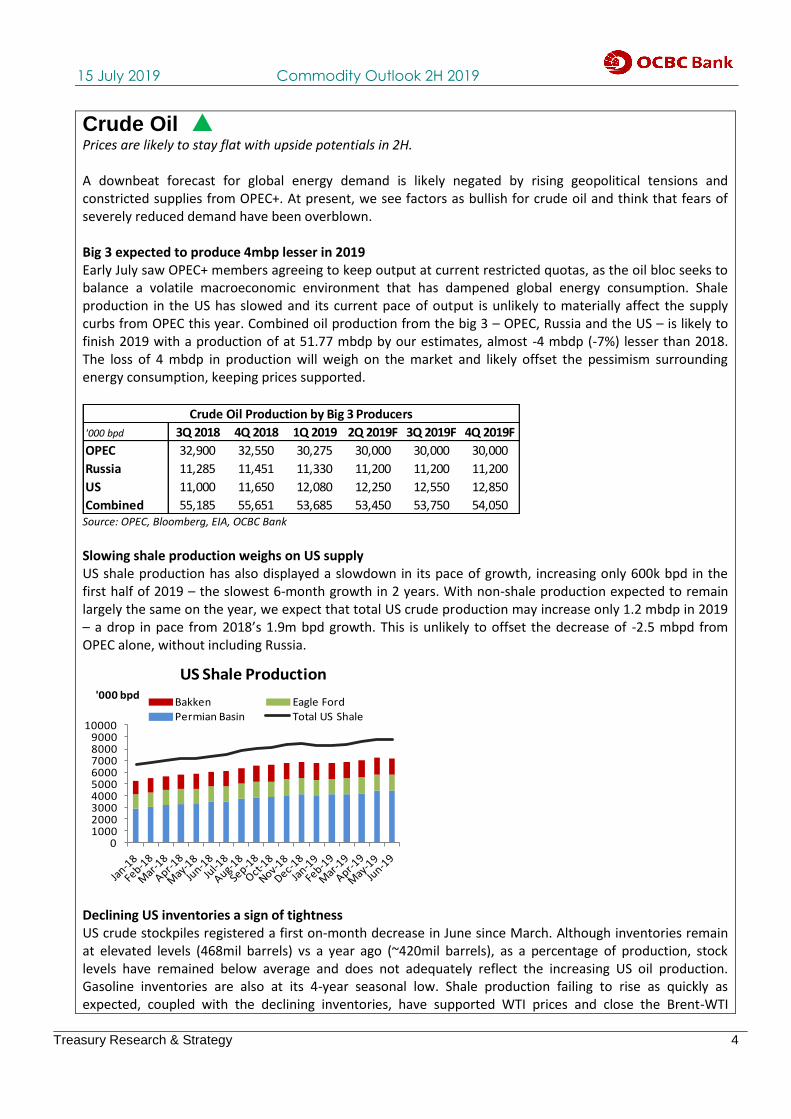
Slowing shale production weighs on US supply US shale production has also displayed a slowdown in its pace of growth, increasing only 600k bpd in the first half of 2019 – the slowest 6-month growth in 2 years. With non-shale production expected to remain largely the same on the year, we expect that total US crude production may increase only 1.2 mbdp in 2019 – a drop in pace from 2018’s 1.9m bpd growth. This is unlikely to offset the decrease of -2.5 mbpd from OPEC alone, without including Russia.
0100020003000400050006000700080009000
10000
'000 bpd
US Shale Production
Bakken Eagle FordPermian Basin Total US Shale
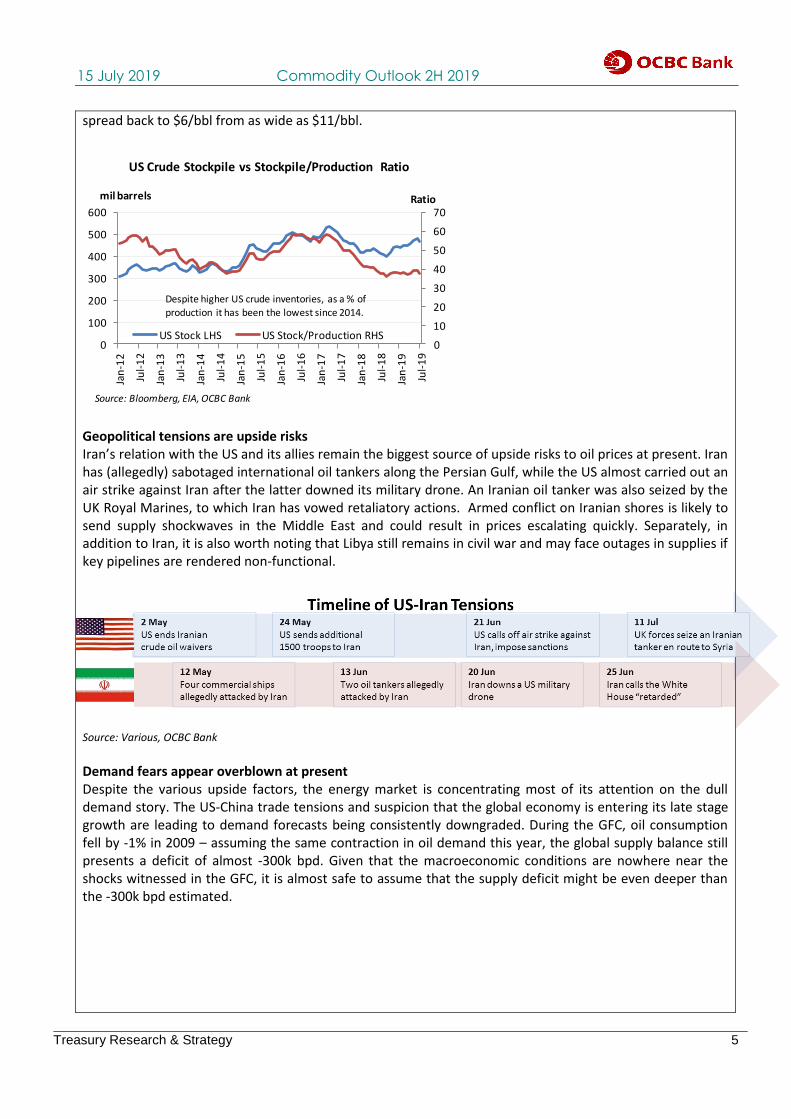
Declining US inventories a sign of tightness US crude stockpiles registered a first on-month decrease in June since March. Although inventories remain at elevated levels (468mil barrels) vs a year ago (~420mil barrels), as a percentage of production, stock levels have remained below average and does not adequately reflect the increasing US oil production. Gasoline inventories are also at its 4-year seasonal low. Shale production failing to rise as quickly as expected, coupled with the declining inventories, have supported WTI prices and close the Brent-WTI
Treasury Research & Strategy 5
15 July 2019 Commodity Outlook 2H 2019
spread back to $6/bbl from as wide as $11/bbl.
0
10
20
30
40
50
60
70
0
100
200
300
400
500
600
Jan
-12
Jul-
12
Jan
-13
Jul-
13
Jan
-14
Jul-
14
Jan
-15
Jul-
15
Jan
-16
Jul-
16
Jan
-17
Jul-
17
Jan
-18
Jul-
18
Jan
-19
Jul-
19
Ratiomil barrels
US Crude Stockpile vs Stockpile/Production Ratio
US Stock LHS US Stock/Production RHS
Despite higher US crude inventories, as a % of production it has been the lowest since 2014.
Source: Bloomberg, EIA, OCBC Bank
Geopolitical tensions are upside risks Iran’s relation with the US and its allies remain the biggest source of upside risks to oil prices at present. Iran has (allegedly) sabotaged international oil tankers along the Persian Gulf, while the US almost carried out an air strike against Iran after the latter downed its military drone. An Iranian oil tanker was also seized by the UK Royal Marines, to which Iran has vowed retaliatory actions. Armed conflict on Iranian shores is likely to send supply shockwaves in the Middle East and could result in prices escalating quickly. Separately, in addition to Iran, it is also worth noting that Libya still remains in civil war and may face outages in supplies if key pipelines are rendered non-functional.
Source: Various, OCBC Bank
Demand fears appear overblown at present Despite the various upside factors, the energy market is concentrating most of its attention on the dull demand story. The US-China trade tensions and suspicion that the global economy is entering its late stage growth are leading to demand forecasts being consistently downgraded. During the GFC, oil consumption fell by -1% in 2009 – assuming the same contraction in oil demand this year, the global supply balance still presents a deficit of almost -300k bpd. Given that the macroeconomic conditions are nowhere near the shocks witnessed in the GFC, it is almost safe to assume that the supply deficit might be even deeper than the -300k bpd estimated.
Treasury Research & Strategy 6
15 July 2019 Commodity Outlook 2H 2019
'000 bpd Trend Worst
Year 2016 2017 2018
Demand 96,737 98,406 99,843 101,153 98,844
Supply 96,920 97,490 100,020 98,419 98,550
OPEC 33,140 32,380 32,550 30,000 30,000
Russia 11,218 10,945 11,451 11,200 11,200
US 8,749 9,742 11,650 12,850 12,850
Other 43,814 44,423 44,369 44,500 44,500
Supply Deficit 183 -916 177 -2,734 -294
2019F
Actual
Global Crude Oil Demand & Supply
Conclusion: prices stable for now but upside potential remains We remain bullish on oil in the following six months as current factors appear to resonate more with the oil bulls. This includes the inability of shale to replace OPEC’s curbs in the short-run; low US inventory-to-production ratio; and Iran as an epicentre for geopolitical tensions. While the market remains fixated with poor demand for now, the momentum behind the soft consumption story appears to lack conviction and is unlikely to present strong bearish pressures on prices.
Treasury Research & Strategy 7
15 July 2019 Commodity Outlook 2H 2019
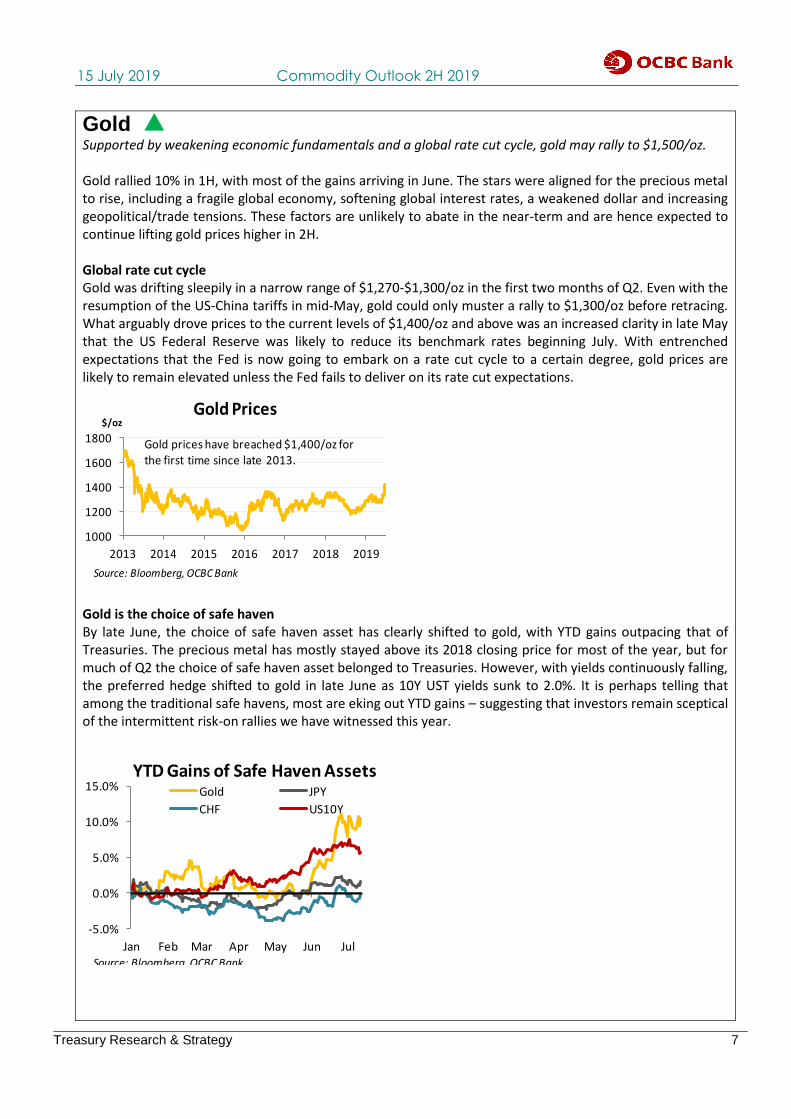
Gold Supported by weakening economic fundamentals and a global rate cut cycle, gold may rally to $1,500/oz. Gold rallied 10% in 1H, with most of the gains arriving in June. The stars were aligned for the precious metal to rise, including a fragile global economy, softening global interest rates, a weakened dollar and increasing geopolitical/trade tensions. These factors are unlikely to abate in the near-term and are hence expected to continue lifting gold prices higher in 2H. Global rate cut cycle Gold was drifting sleepily in a narrow range of $1,270-$1,300/oz in the first two months of Q2. Even with the resumption of the US-China tariffs in mid-May, gold could only muster a rally to $1,300/oz before retracing. What arguably drove prices to the current levels of $1,400/oz and above was an increased clarity in late May that the US Federal Reserve was likely to reduce its benchmark rates beginning July. With entrenched expectations that the Fed is now going to embark on a rate cut cycle to a certain degree, gold prices are likely to remain elevated unless the Fed fails to deliver on its rate cut expectations.
1000
1200
1400
1600
1800
2013 2014 2015 2016 2017 2018 2019
$/ozGold Prices
Source: Bloomberg, OCBC Bank
Gold prices have breached $1,400/oz for the first time since late 2013.
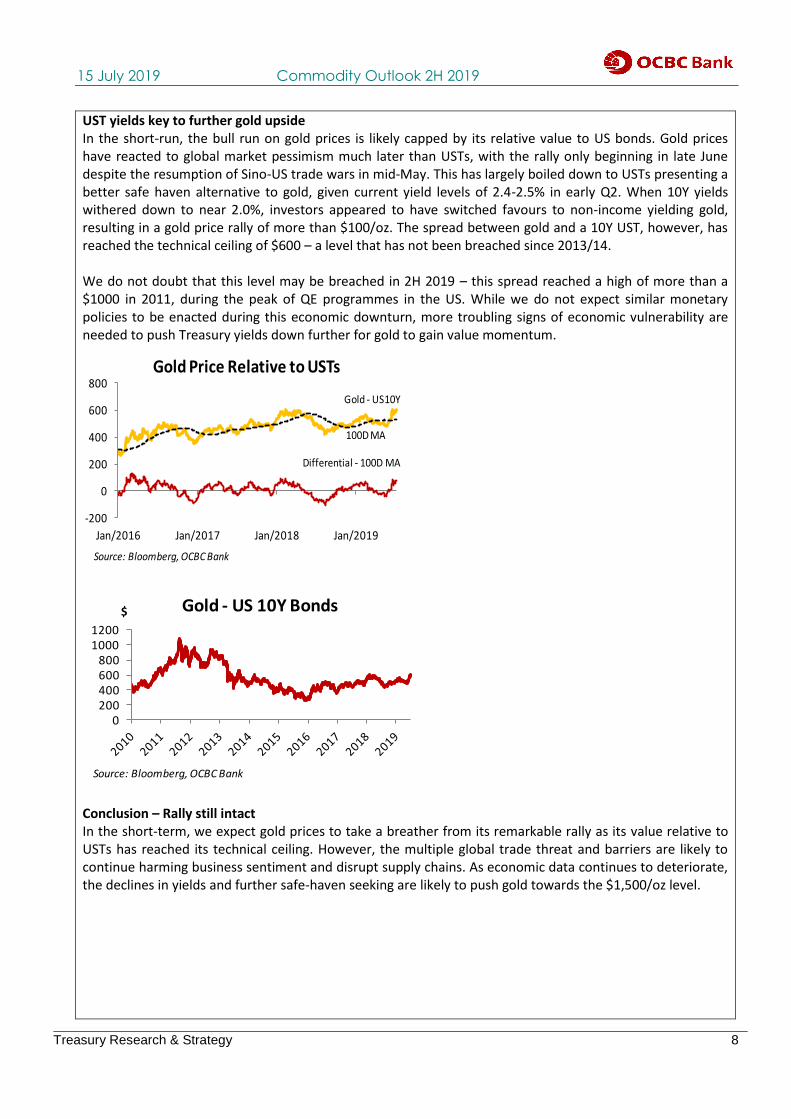
Gold is the choice of safe haven By late June, the choice of safe haven asset has clearly shifted to gold, with YTD gains outpacing that of Treasuries. The precious metal has mostly stayed above its 2018 closing price for most of the year, but for much of Q2 the choice of safe haven asset belonged to Treasuries. However, with yields continuously falling, the preferred hedge shifted to gold in late June as 10Y UST yields sunk to 2.0%. It is perhaps telling that among the traditional safe havens, most are eking out YTD gains – suggesting that investors remain sceptical of the intermittent risk-on rallies we have witnessed this year.
-5.0%
0.0%
5.0%
10.0%
15.0%
Jan Feb Mar Apr May Jun Jul
YTD Gains of Safe Haven AssetsGold JPY
CHF US10Y
Source: Bloomberg, OCBC Bank
Treasury Research & Strategy 8
15 July 2019 Commodity Outlook 2H 2019
UST yields key to further gold upside In the short-run, the bull run on gold prices is likely capped by its relative value to US bonds. Gold prices have reacted to global market pessimism much later than USTs, with the rally only beginning in late June despite the resumption of Sino-US trade wars in mid-May. This has largely boiled down to USTs presenting a better safe haven alternative to gold, given current yield levels of 2.4-2.5% in early Q2. When 10Y yields withered down to near 2.0%, investors appeared to have switched favours to non-income yielding gold, resulting in a gold price rally of more than $100/oz. The spread between gold and a 10Y UST, however, has reached the technical ceiling of $600 – a level that has not been breached since 2013/14. We do not doubt that this level may be breached in 2H 2019 – this spread reached a high of more than a $1000 in 2011, during the peak of QE programmes in the US. While we do not expect similar monetary policies to be enacted during this economic downturn, more troubling signs of economic vulnerability are needed to push Treasury yields down further for gold to gain value momentum.
-200
0
200
400
600
800
Jan/2016 Jan/2017 Jan/2018 Jan/2019
Gold Price Relative to USTs
Differential - 100D MA
Source: Bloomberg, OCBC Bank
Gold - US10Y
100D MA
0200400600800
10001200
$ Gold - US 10Y Bonds
Source: Bloomberg, OCBC Bank
Conclusion – Rally still intact In the short-term, we expect gold prices to take a breather from its remarkable rally as its value relative to USTs has reached its technical ceiling. However, the multiple global trade threat and barriers are likely to continue harming business sentiment and disrupt supply chains. As economic data continues to deteriorate, the declines in yields and further safe-haven seeking are likely to push gold towards the $1,500/oz level.
Treasury Research & Strategy 9
15 July 2019 Commodity Outlook 2H 2019
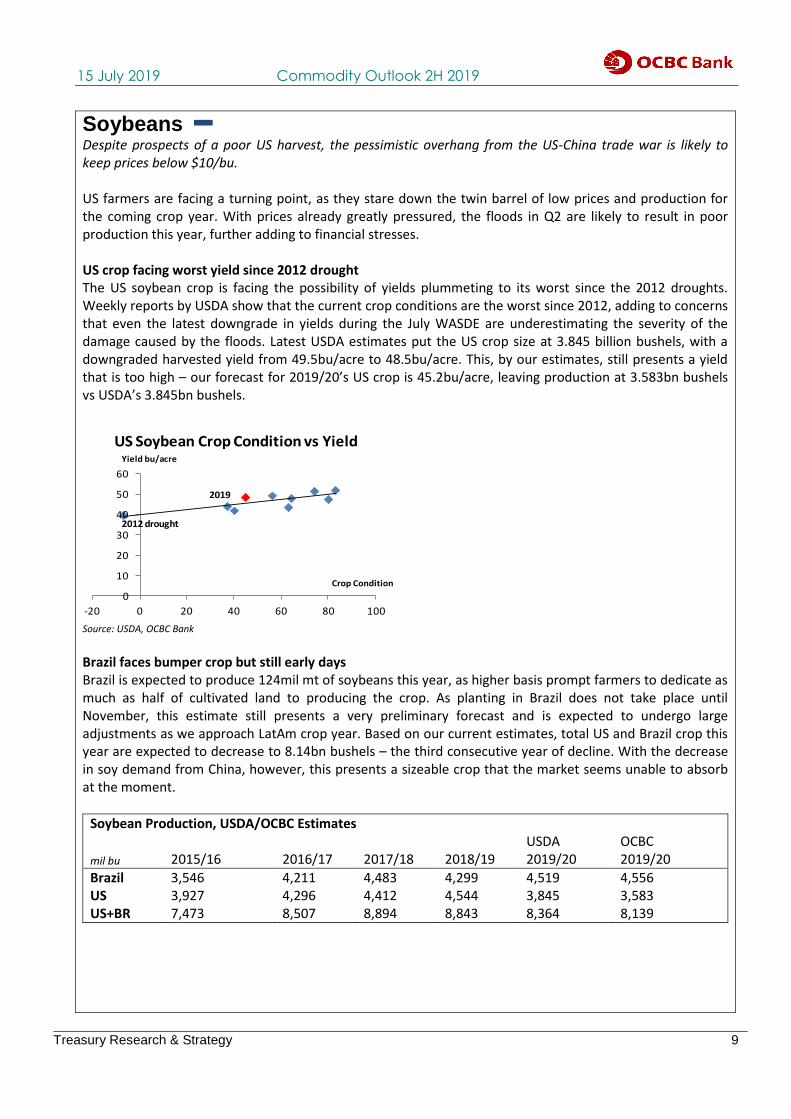
Soybeans Despite prospects of a poor US harvest, the pessimistic overhang from the US-China trade war is likely to keep prices below $10/bu. US farmers are facing a turning point, as they stare down the twin barrel of low prices and production for the coming crop year. With prices already greatly pressured, the floods in Q2 are likely to result in poor production this year, further adding to financial stresses. US crop facing worst yield since 2012 drought The US soybean crop is facing the possibility of yields plummeting to its worst since the 2012 droughts. Weekly reports by USDA show that the current crop conditions are the worst since 2012, adding to concerns that even the latest downgrade in yields during the July WASDE are underestimating the severity of the damage caused by the floods. Latest USDA estimates put the US crop size at 3.845 billion bushels, with a downgraded harvested yield from 49.5bu/acre to 48.5bu/acre. This, by our estimates, still presents a yield that is too high – our forecast for 2019/20’s US crop is 45.2bu/acre, leaving production at 3.583bn bushels vs USDA’s 3.845bn bushels.
0
10
20
30
40
50
60
-20 0 20 40 60 80 100
Yield bu/acre
Crop Condition
US Soybean Crop Condition vs Yield
2012 drought
2019
Source: USDA, OCBC Bank
Brazil faces bumper crop but still early days Brazil is expected to produce 124mil mt of soybeans this year, as higher basis prompt farmers to dedicate as much as half of cultivated land to producing the crop. As planting in Brazil does not take place until November, this estimate still presents a very preliminary forecast and is expected to undergo large adjustments as we approach LatAm crop year. Based on our current estimates, total US and Brazil crop this year are expected to decrease to 8.14bn bushels – the third consecutive year of decline. With the decrease in soy demand from China, however, this presents a sizeable crop that the market seems unable to absorb at the moment.
Soybean Production, USDA/OCBC Estimates
mil bu 2015/16 2016/17 2017/18 2018/19 USDA 2019/20
OCBC 2019/20
Brazil 3,546 4,211 4,483 4,299 4,519 4,556 US 3,927 4,296 4,412 4,544 3,845 3,583 US+BR 7,473 8,507 8,894 8,843 8,364 8,139
Treasury Research & Strategy 10
15 July 2019 Commodity Outlook 2H 2019
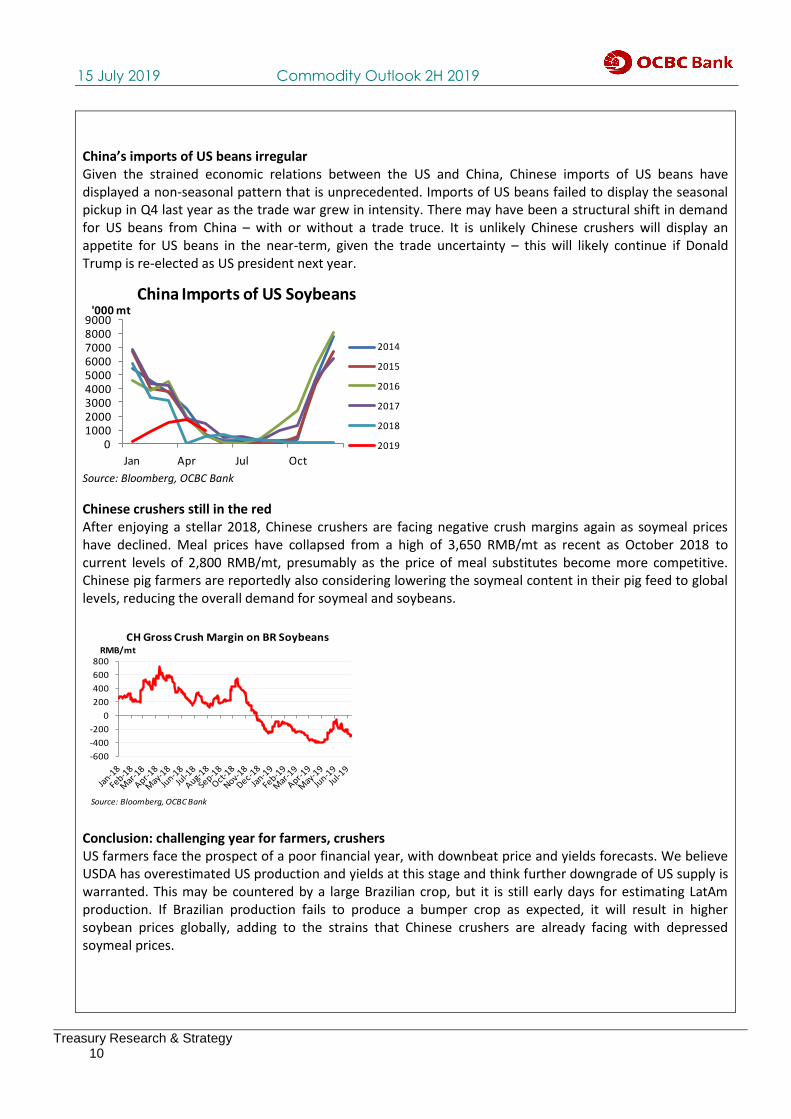
China’s imports of US beans irregular Given the strained economic relations between the US and China, Chinese imports of US beans have displayed a non-seasonal pattern that is unprecedented. Imports of US beans failed to display the seasonal pickup in Q4 last year as the trade war grew in intensity. There may have been a structural shift in demand for US beans from China – with or without a trade truce. It is unlikely Chinese crushers will display an appetite for US beans in the near-term, given the trade uncertainty – this will likely continue if Donald Trump is re-elected as US president next year.
0100020003000400050006000700080009000
Jan Apr Jul Oct
'000 mtChina Imports of US Soybeans
2014
2015
2016
2017
2018
2019
Source: Bloomberg, OCBC Bank
Chinese crushers still in the red After enjoying a stellar 2018, Chinese crushers are facing negative crush margins again as soymeal prices have declined. Meal prices have collapsed from a high of 3,650 RMB/mt as recent as October 2018 to current levels of 2,800 RMB/mt, presumably as the price of meal substitutes become more competitive. Chinese pig farmers are reportedly also considering lowering the soymeal content in their pig feed to global levels, reducing the overall demand for soymeal and soybeans.
-600
-400
-200
0
200
400
600
800RMB/mt
CH Gross Crush Margin on BR Soybeans
Source: Bloomberg, OCBC Bank
Conclusion: challenging year for farmers, crushers US farmers face the prospect of a poor financial year, with downbeat price and yields forecasts. We believe USDA has overestimated US production and yields at this stage and think further downgrade of US supply is warranted. This may be countered by a large Brazilian crop, but it is still early days for estimating LatAm production. If Brazilian production fails to produce a bumper crop as expected, it will result in higher soybean prices globally, adding to the strains that Chinese crushers are already facing with depressed soymeal prices.
Treasury Research & Strategy 11
15 July 2019 Commodity Outlook 2H 2019
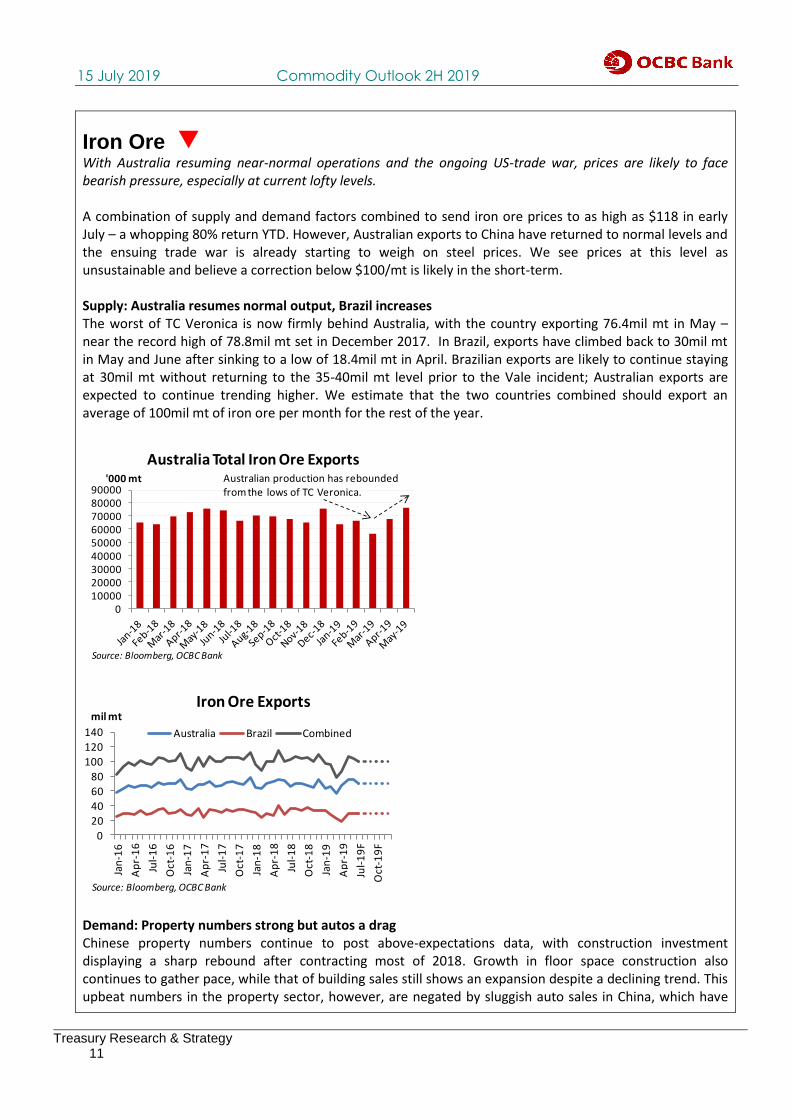
Iron Ore With Australia resuming near-normal operations and the ongoing US-trade war, prices are likely to face bearish pressure, especially at current lofty levels. A combination of supply and demand factors combined to send iron ore prices to as high as $118 in early July – a whopping 80% return YTD. However, Australian exports to China have returned to normal levels and the ensuing trade war is already starting to weigh on steel prices. We see prices at this level as unsustainable and believe a correction below $100/mt is likely in the short-term. Supply: Australia resumes normal output, Brazil increases The worst of TC Veronica is now firmly behind Australia, with the country exporting 76.4mil mt in May – near the record high of 78.8mil mt set in December 2017. In Brazil, exports have climbed back to 30mil mt in May and June after sinking to a low of 18.4mil mt in April. Brazilian exports are likely to continue staying at 30mil mt without returning to the 35-40mil mt level prior to the Vale incident; Australian exports are expected to continue trending higher. We estimate that the two countries combined should export an average of 100mil mt of iron ore per month for the rest of the year.
0100002000030000400005000060000700008000090000
'000 mt
Australia Total Iron Ore Exports
Source: Bloomberg, OCBC Bank
Australian production has reboundedfrom the lows of TC Veronica.
0
20
40
60
80
100
120
140
Jan
-16
Ap
r-1
6
Jul-
16
Oct
-16
Jan
-17
Ap
r-1
7
Jul-
17
Oct
-17
Jan
-18
Ap
r-1
8
Jul-
18
Oct
-18
Jan
-19
Ap
r-1
9
Jul-
19
F
Oct
-19
F
mil mtIron Ore Exports
Australia Brazil Combined
Source: Bloomberg, OCBC Bank
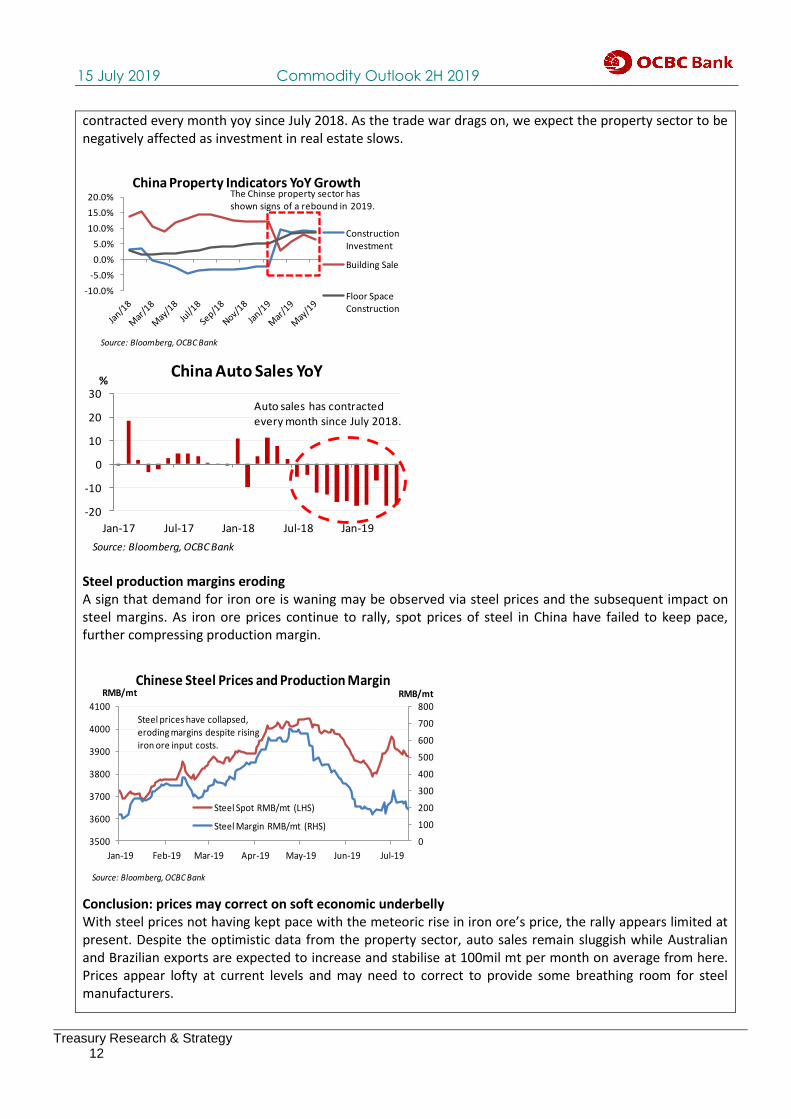
Demand: Property numbers strong but autos a drag Chinese property numbers continue to post above-expectations data, with construction investment displaying a sharp rebound after contracting most of 2018. Growth in floor space construction also continues to gather pace, while that of building sales still shows an expansion despite a declining trend. This upbeat numbers in the property sector, however, are negated by sluggish auto sales in China, which have
Treasury Research & Strategy 12
15 July 2019 Commodity Outlook 2H 2019
contracted every month yoy since July 2018. As the trade war drags on, we expect the property sector to be negatively affected as investment in real estate slows.
-10.0%
-5.0%
0.0%
5.0%
10.0%
15.0%
20.0%
China Property Indicators YoY Growth
Construction Investment
Building Sale
Floor Space Construction
Source: Bloomberg, OCBC Bank
The Chinse property sector hasshown signs of a rebound in 2019.
-20
-10
0
10
20
30
Jan-17 Jul-17 Jan-18 Jul-18 Jan-19
%China Auto Sales YoY
Source: Bloomberg, OCBC Bank
Auto sales has contractedevery month since July 2018.
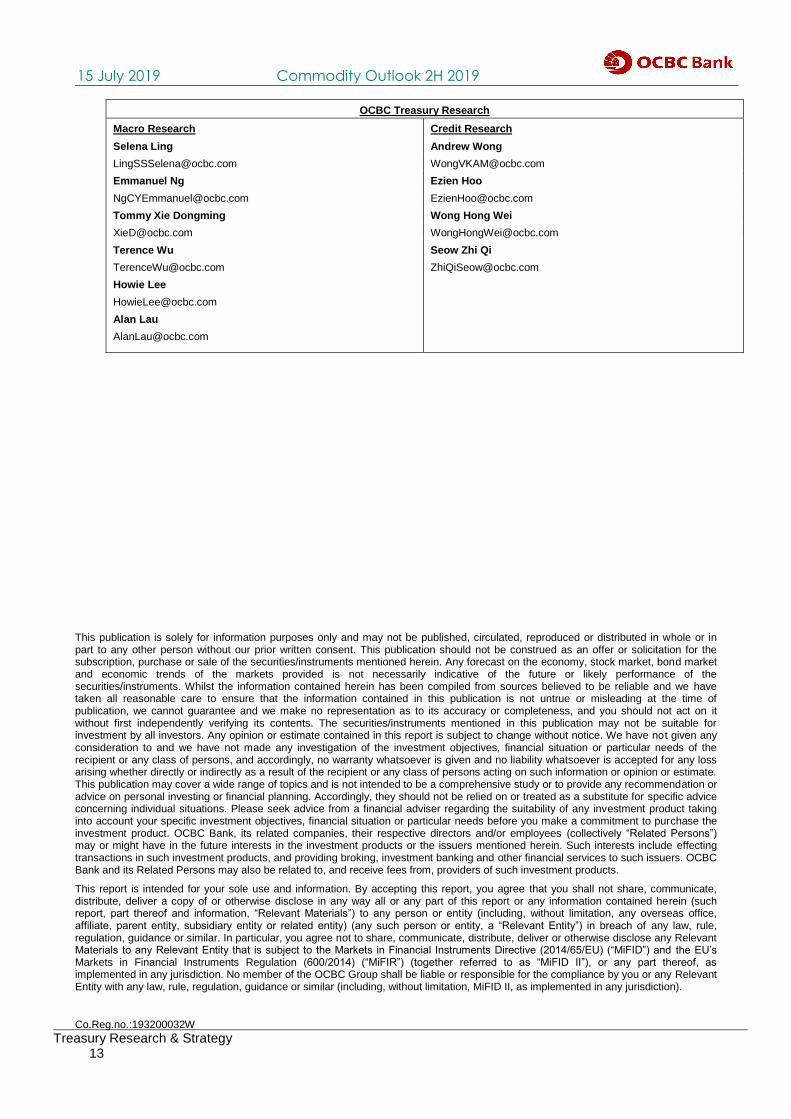
Steel production margins eroding A sign that demand for iron ore is waning may be observed via steel prices and the subsequent impact on steel margins. As iron ore prices continue to rally, spot prices of steel in China have failed to keep pace, further compressing production margin.
0
100
200
300
400
500
600
700
800
3500
3600
3700
3800
3900
4000
4100
Jan-19 Feb-19 Mar-19 Apr-19 May-19 Jun-19 Jul-19
RMB/mtRMB/mtChinese Steel Prices and Production Margin
Steel Spot RMB/mt (LHS)
Steel Margin RMB/mt (RHS)
Source: Bloomberg, OCBC Bank
Steel prices have collapsed,eroding margins despite risingiron ore input costs.
Conclusion: prices may correct on soft economic underbelly With steel prices not having kept pace with the meteoric rise in iron ore’s price, the rally appears limited at present. Despite the optimistic data from the property sector, auto sales remain sluggish while Australian and Brazilian exports are expected to increase and stabilise at 100mil mt per month on average from here. Prices appear lofty at current levels and may need to correct to provide some breathing room for steel manufacturers.
Treasury Research & Strategy 13
15 July 2019 Commodity Outlook 2H 2019
OCBC Treasury Research
Macro Research Credit Research
Selena Ling Andrew Wong
[email protected] [email protected]
Emmanuel Ng Ezien Hoo
[email protected] [email protected]
Tommy Xie Dongming Wong Hong Wei
[email protected] [email protected]
Terence Wu
Howie Lee
Alan Lau
Seow Zhi Qi
This publication is solely for information purposes only and may not be published, circulated, reproduced or distributed in whole or in part to any other person without our prior written consent. This publication should not be construed as an offer or solicitation for the subscription, purchase or sale of the securities/instruments mentioned herein. Any forecast on the economy, stock market, bond market and economic trends of the markets provided is not necessarily indicative of the future or likely performance of the securities/instruments. Whilst the information contained herein has been compiled from sources believed to be reliable and we have taken all reasonable care to ensure that the information contained in this publication is not untrue or misleading at the time of publication, we cannot guarantee and we make no representation as to its accuracy or completeness, and you should not act on it without first independently verifying its contents. The securities/instruments mentioned in this publication may not be suitable for investment by all investors. Any opinion or estimate contained in this report is subject to change without notice. We have not given any consideration to and we have not made any investigation of the investment objectives, financial situation or particular needs of the recipient or any class of persons, and accordingly, no warranty whatsoever is given and no liability whatsoever is accepted for any loss arising whether directly or indirectly as a result of the recipient or any class of persons acting on such information or opinion or estimate. This publication may cover a wide range of topics and is not intended to be a comprehensive study or to provide any recommendation or advice on personal investing or financial planning. Accordingly, they should not be relied on or treated as a substitute for specific advice concerning individual situations. Please seek advice from a financial adviser regarding the suitability of any investment product taking into account your specific investment objectives, financial situation or particular needs before you make a commitment to purchase the investment product. OCBC Bank, its related companies, their respective directors and/or employees (collectively “Related Persons”) may or might have in the future interests in the investment products or the issuers mentioned herein. Such interests include effecting transactions in such investment products, and providing broking, investment banking and other financial services to such issuers. OCBC Bank and its Related Persons may also be related to, and receive fees from, providers of such investment products.
This report is intended for your sole use and information. By accepting this report, you agree that you shall not share, communicate, distribute, deliver a copy of or otherwise disclose in any way all or any part of this report or any information contained herein (such report, part thereof and information, “Relevant Materials”) to any person or entity (including, without limitation, any overseas office, affiliate, parent entity, subsidiary entity or related entity) (any such person or entity, a “Relevant Entity”) in breach of any law, rule, regulation, guidance or similar. In particular, you agree not to share, communicate, distribute, deliver or otherwise disclose any Relevant Materials to any Relevant Entity that is subject to the Markets in Financial Instruments Directive (2014/65/EU) (“MiFID”) and the EU’s Markets in Financial Instruments Regulation (600/2014) (“MiFIR”) (together referred to as “MiFID II”), or any part thereof, as implemented in any jurisdiction. No member of the OCBC Group shall be liable or responsible for the compliance by you or any Relevant Entity with any law, rule, regulation, guidance or similar (including, without limitation, MiFID II, as implemented in any jurisdiction).
Co.Reg.no.:193200032W
![Corral Q2 2017 - Cision · Products prices [USD/Bbl vs Brent dated] 0 5 10 15 20 25 30 Jan Feb Mar Apr May Jun JulAug Sep Oct Nov Dec $/bbl Diesel cracks 5 yr Range (2012-2016) 2016](https://img.pdfslide.net/doc/110x75/5fd56c08c96ba12c1a0e106b/corral-q2-2017-cision-products-prices-usdbbl-vs-brent-dated-0-5-10-15-20-25.jpg)