Embed Size (px)
Citation preview
Measuring the Networked Non-profit
Common Good VermontFairlee, VermontMarch 21, 2013March 21, 2013
#
122/03/2013
News Group International
About UsKatie Paine is Chief Marketing Offi f N GOfficer of News Group an international monitoring, measurement & Social Media company
We provide customized research to help you define and measure your success.
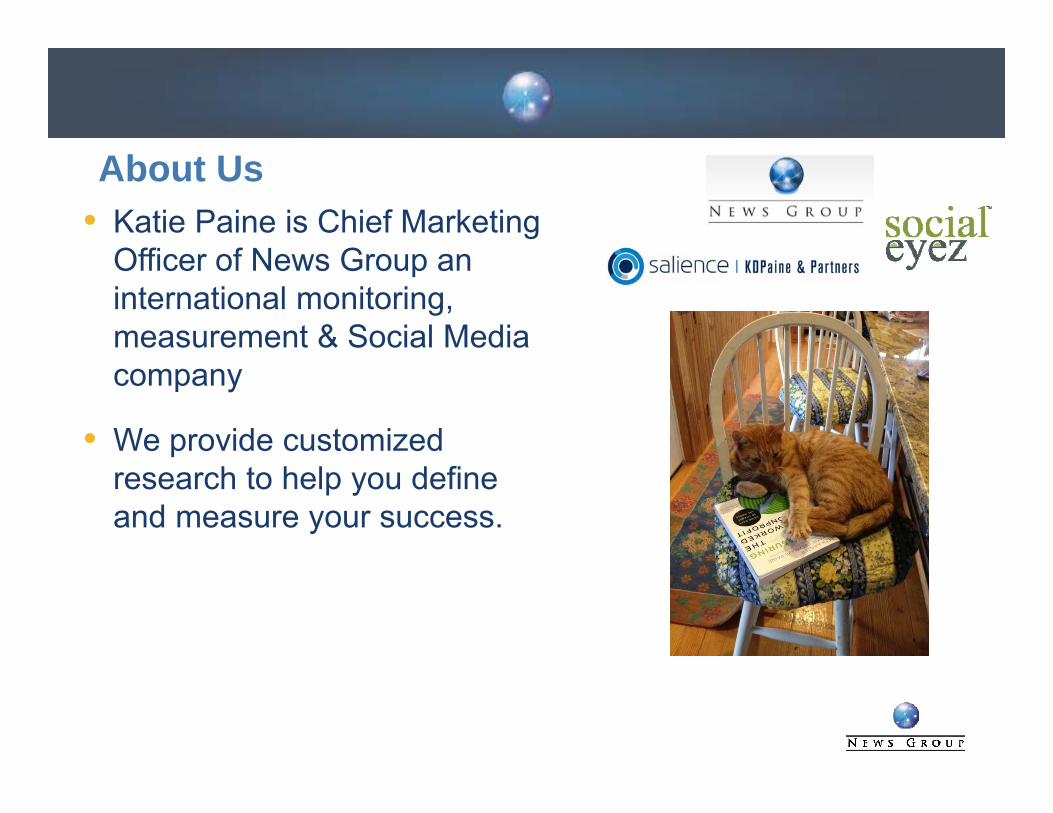
Goal: Become Sally Field
Crawl Walk Run Flyy
• Monitoring/ • Participate • Integrate SM • Tie efforts &Monitoring/Listening
• Establish Rules
Participate• Develop metrics• Begin
measurement
Integrate SM and Metrics into Strategy
• Use Multiple Channels
Tie efforts & metrics to outcomes
• Crowd source• Integrate with
• Follow best practices
gall Mktg
• Continuously improve
3
3 Trends that are changing the nature of communications
Increased emphasis on accountability and outcomes
– Shrinking budgets raise issues of effectiveness and efficiency
– Proliferation of options
– Corporate leaders moving to non-profit world
Big data raises expectations
– Social media makes it seem easy
– Assumes answers are just a matter of data crunching
TTransparency
– Sharing in public
Need for benchmarks– Need for benchmarks
– The Rise of the Networked Nonprofit
What you thought was important, probably isn’t any more
72% of adults say that the most common way to get news from friends and family is word of mouth.mouth.
15% of adults get news from family and friends through social media
Local TV affiliates lost more than 6% of their prime time audiences in 2012.
People turn to local media outlets for sports, traffic & weather, not news.
5
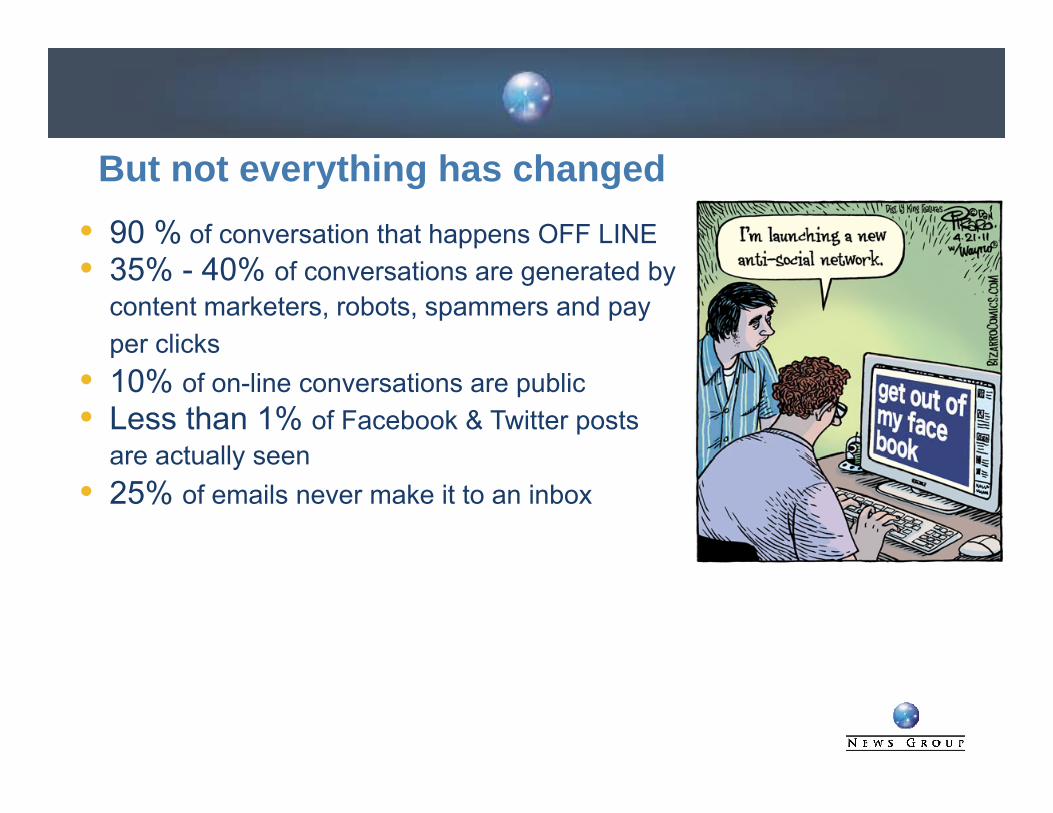
90 % of conversation that happens OFF LINE
But not everything has changed
35% - 40% of conversations are generated by content marketers, robots, spammers and pay per clicksp10% of on-line conversations are public Less than 1% of Facebook & Twitter posts are actually seenare actually seen 25% of emails never make it to an inbox
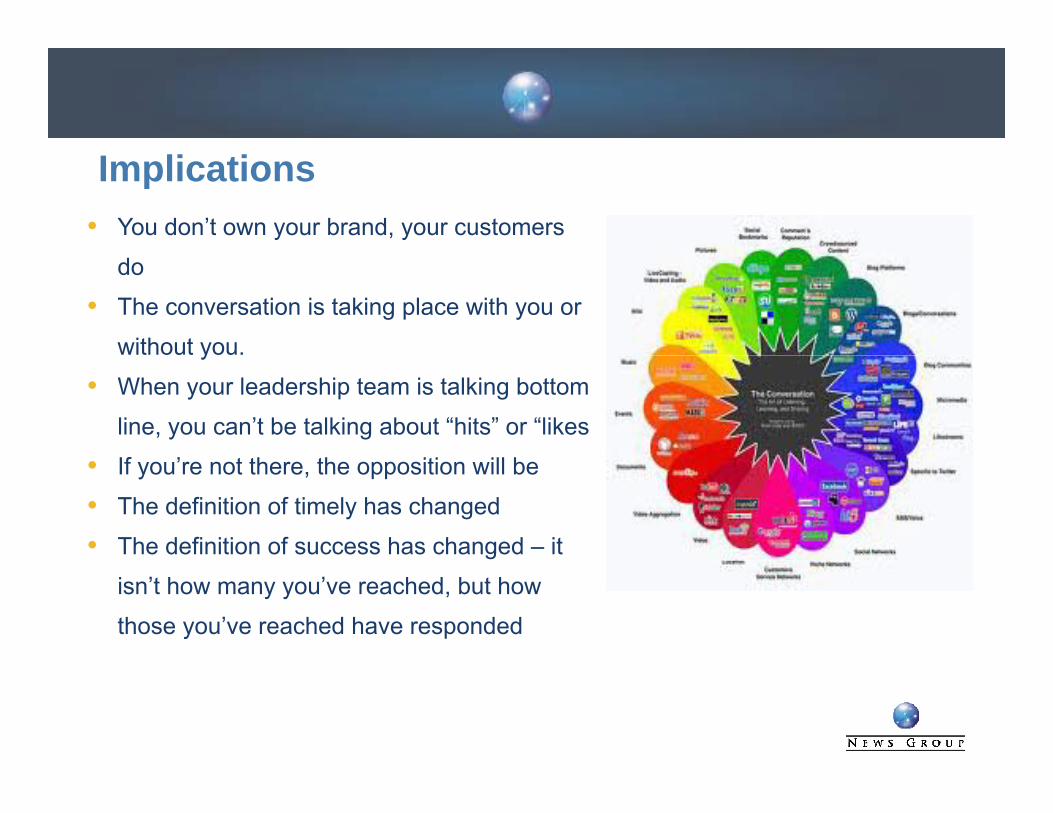
ImplicationsYou don’t own your brand, your customers
do
The conversation is taking place with you or
without you. y
When your leadership team is talking bottom
line, you can’t be talking about “hits” or “likes
If ’ t th th iti ill bIf you’re not there, the opposition will be
The definition of timely has changed
The definition of success has changed – it
isn’t how many you’ve reached, but how
those you’ve reached have responded
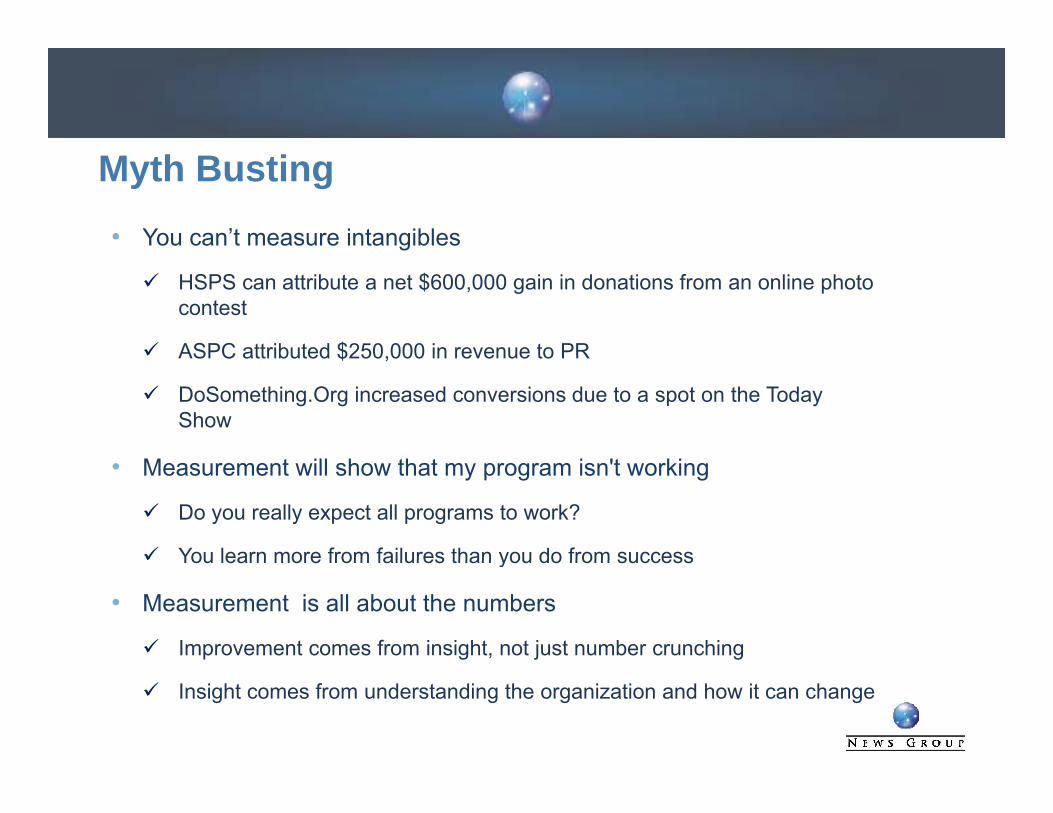
• You can’t measure intangibles
Myth Busting
HSPS can attribute a net $600,000 gain in donations from an online photo contest
ASPC attributed $250 000 in revenue to PRASPC attributed $250,000 in revenue to PR
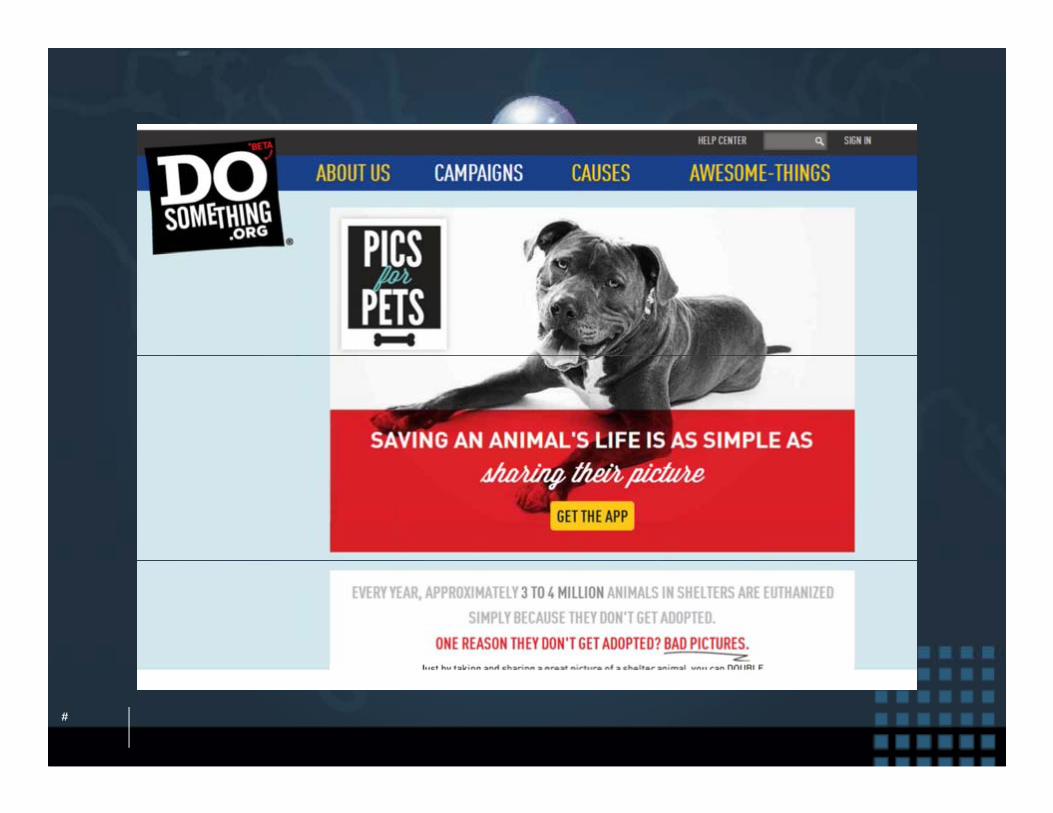
DoSomething.Org increased conversions due to a spot on the Today Show
• Measurement will show that my program isn't working
Do you really expect all programs to work?
You learn more from failures than you do from successYou learn more from failures than you do from success
• Measurement is all about the numbers
Improvement comes from insight, not just number crunching
Insight comes from understanding the organization and how it can change
8
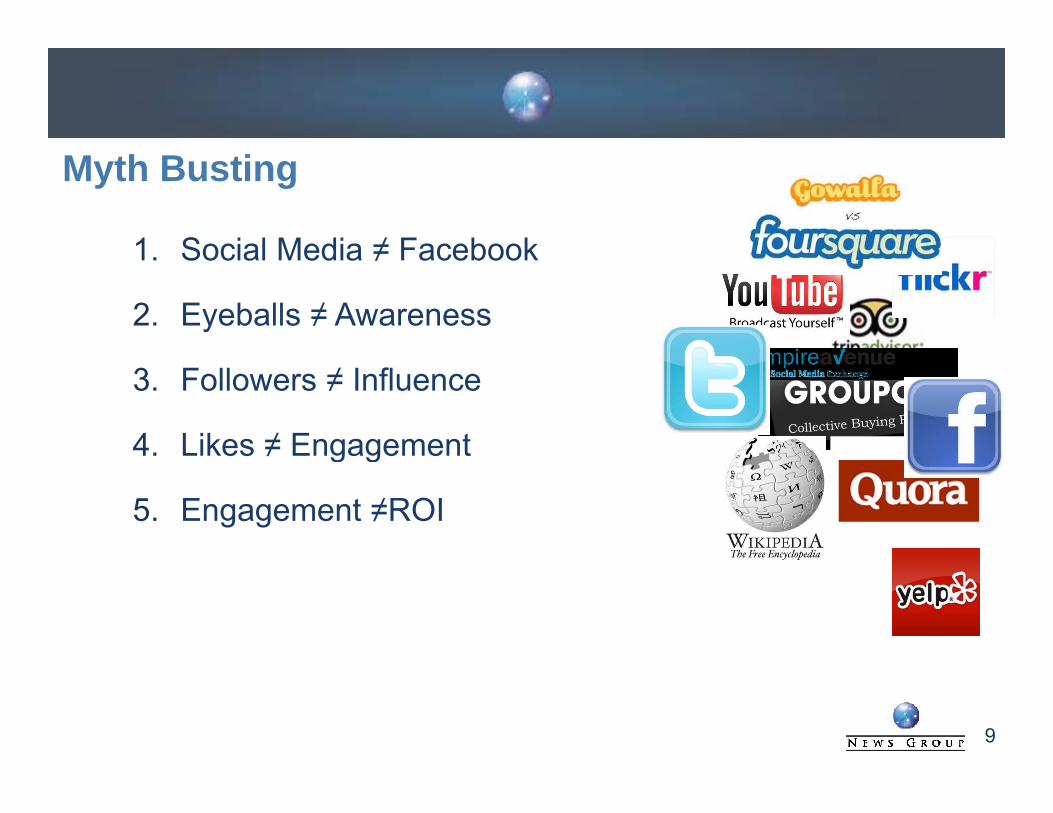
Myth Busting
1 Social Media ≠ Facebook1. Social Media ≠ Facebook
2. Eyeballs ≠ Awareness
3. Followers ≠ Influence
4. Likes ≠ Engagement g g
5. Engagement ≠ROI
9
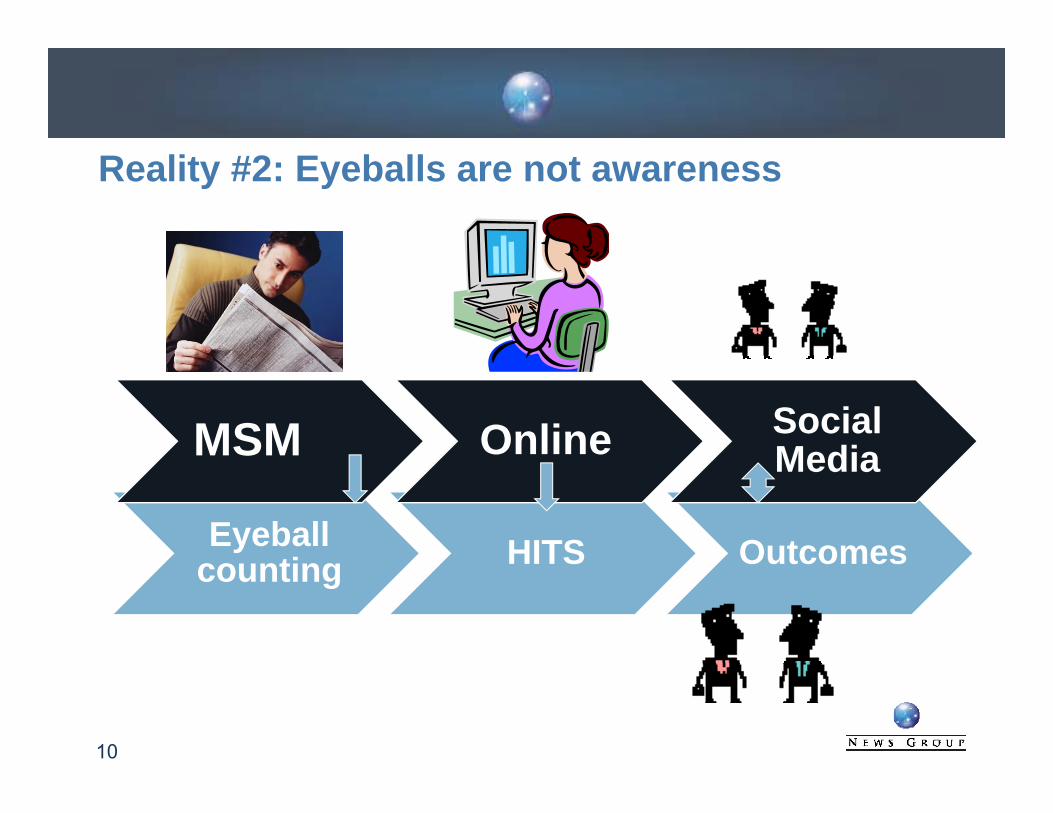
Reality #2: Eyeballs are not awareness
MSM Online Social Media
Eyeball ti HITS Outcomes
Media
counting HITS Outcomes
10
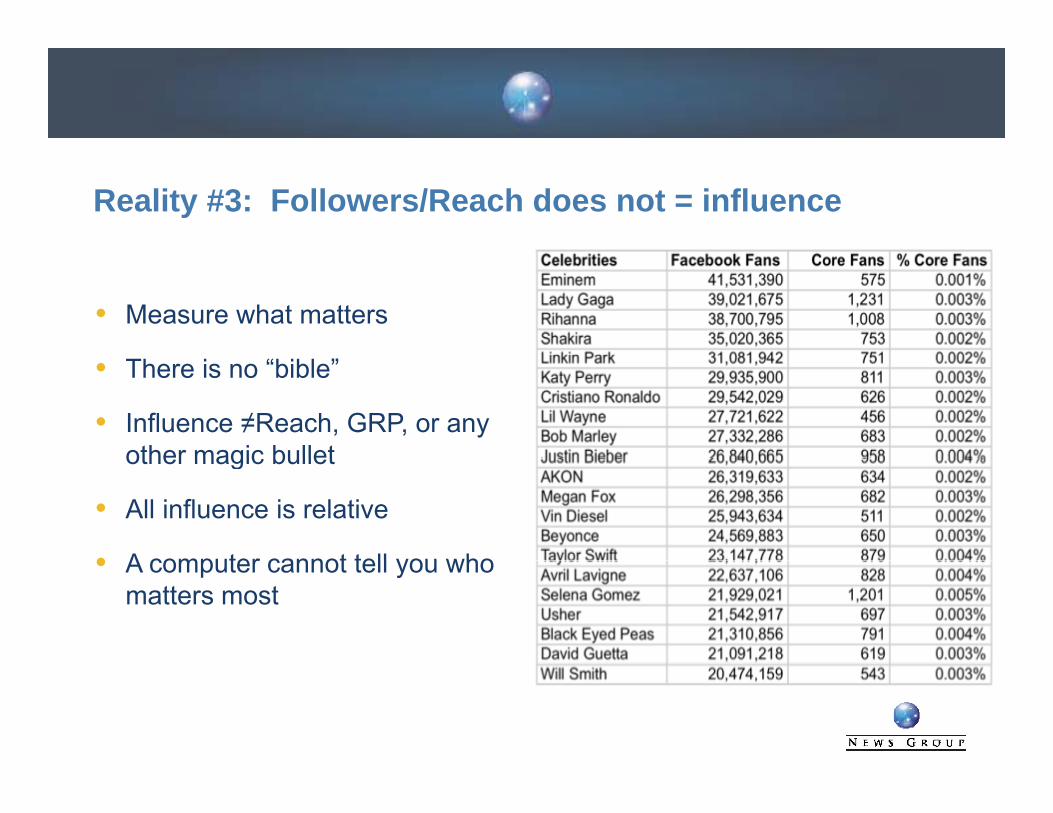
Reality #3: Followers/Reach does not = influence
Measure what matters
There is no “bible”
Influence ≠Reach, GRP, or any other magic bulletother magic bullet
All influence is relative
A computer cannot tell you whoA computer cannot tell you who matters most
It’s all about measuring relationships
12News Group International
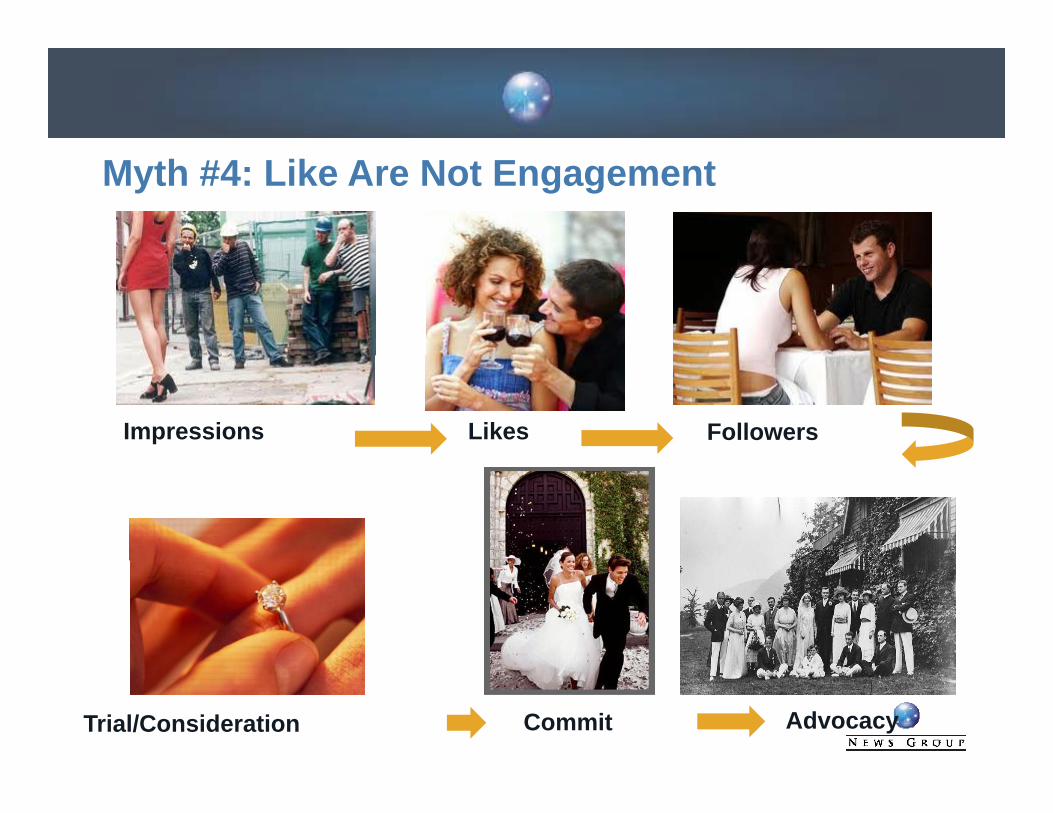
Myth #4: Like Are Not Engagement
LikesImpressions Followers
Trial/Consideration Commit Advocacy
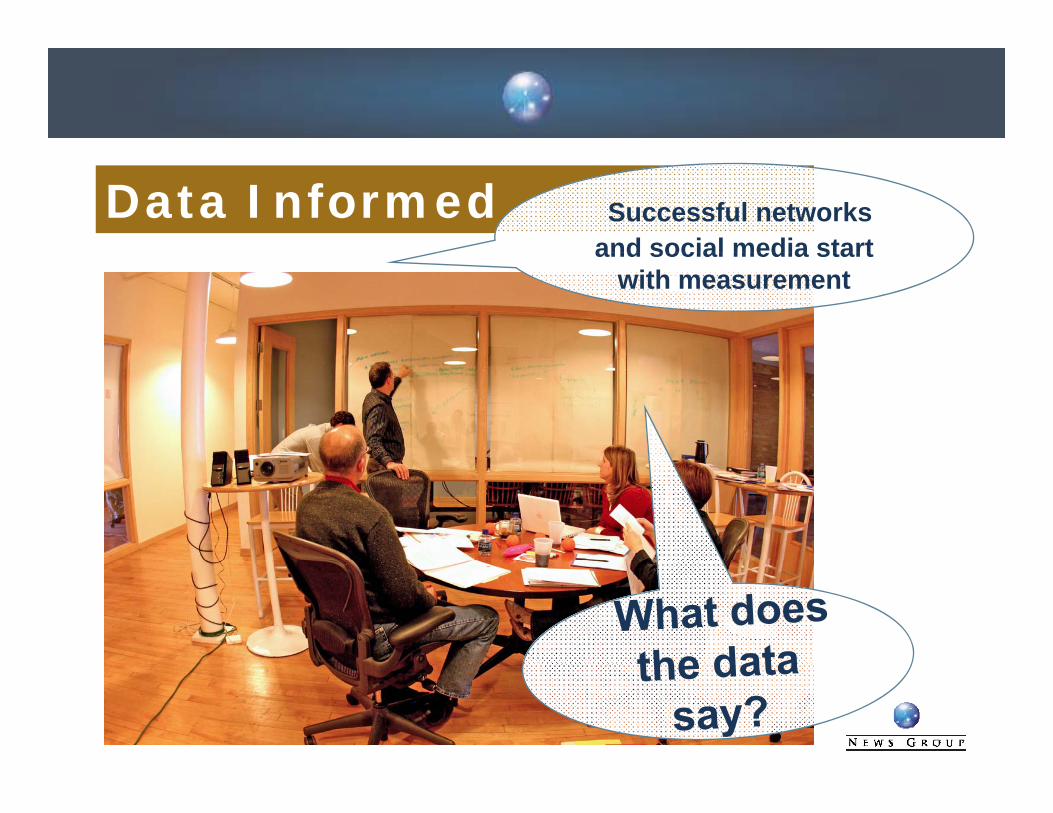
Data Informed Successful networks and social media startand social media start
with measurement
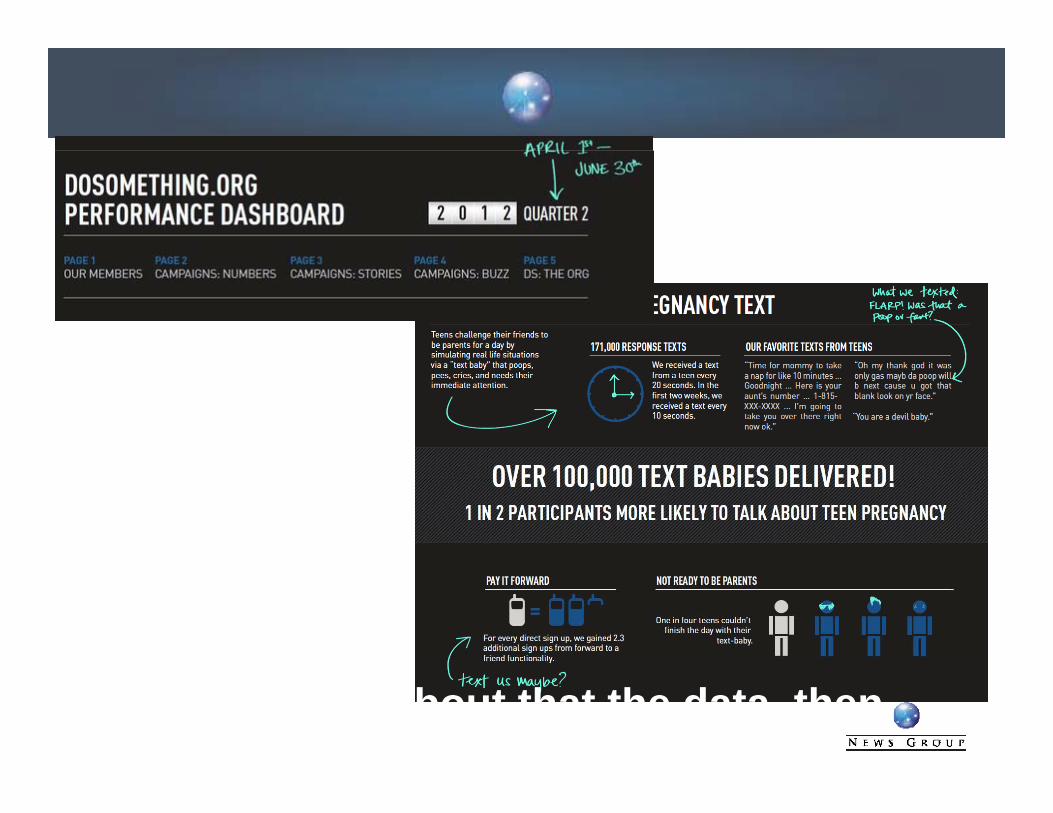
More time think about that the data, then collect it
#
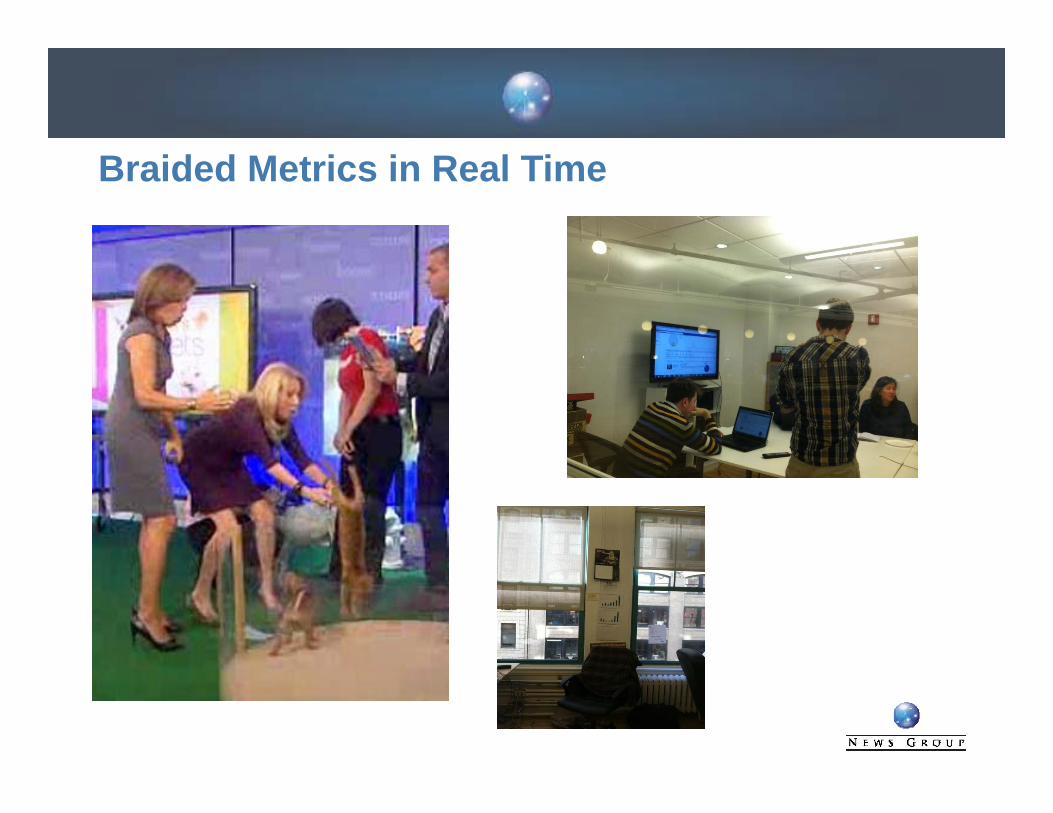
Braided Metrics in Real Time
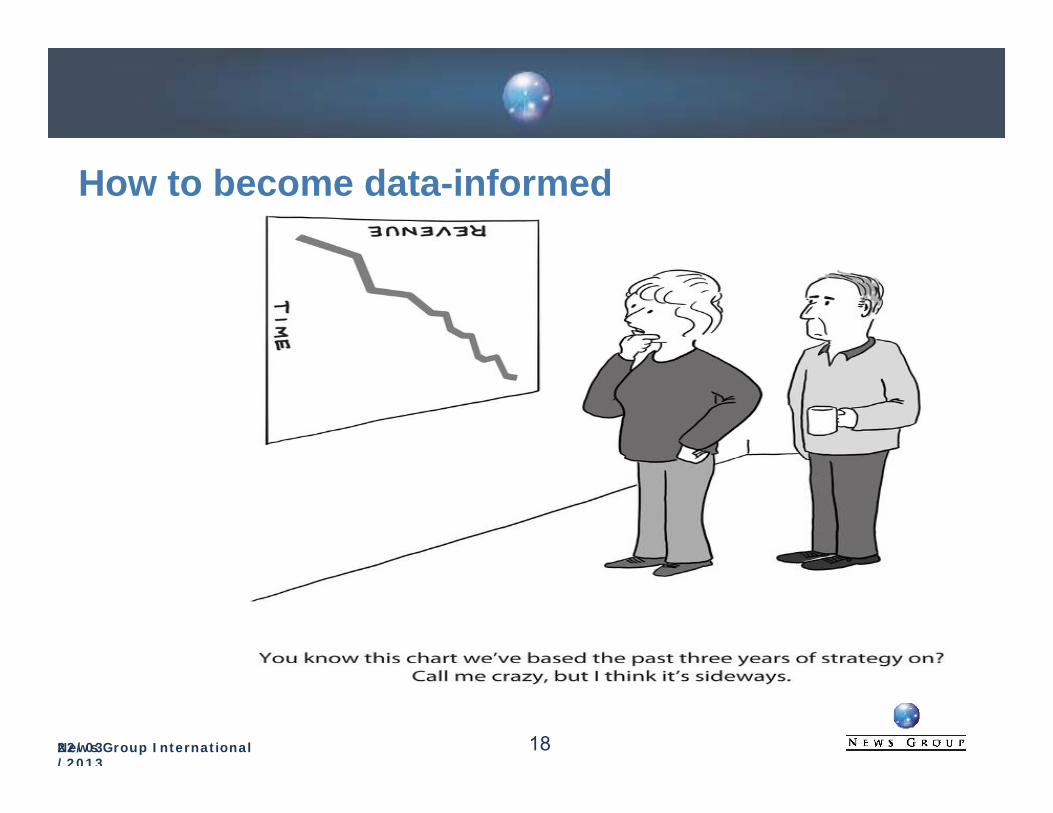
How to become data-informed
1822/03/2013News Group International
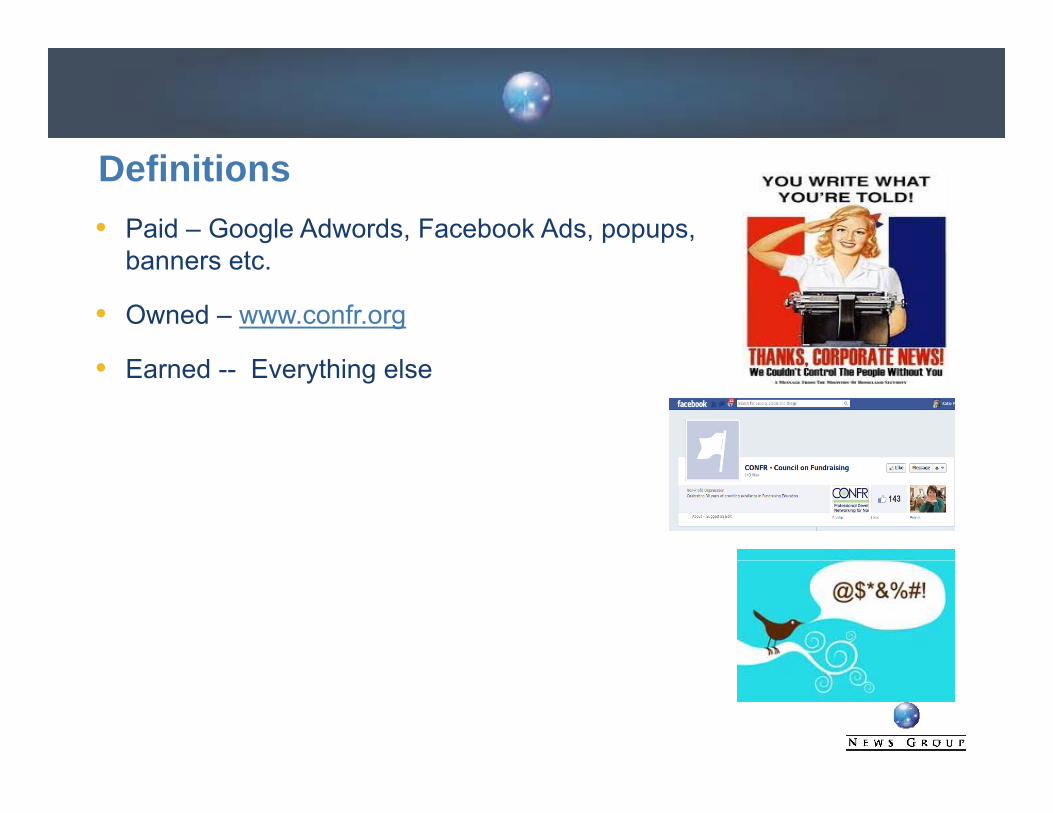
DefinitionsPaid – Google Adwords, Facebook Ads, popups, b tbanners etc.
Owned – www.confr.org
Earned -- Everything else
Definitions Monitoring – process by which data are systematically and regularly collected about a program over timeregularly collected about a program over time.
Measurement – a way of giving an activity a precise dimension, generally by comparison to some standard; usually done in a g y y p yquantifiable or numerical manner; see also: data, scale
Evaluation –a form of research that determines the relative effectiveness of a public relations campaign or program byeffectiveness of a public relations campaign or program by measuring program*
*IPR Dictionary of Measurement Terms, Dr. Donald Stacks www..instituteforpr.org
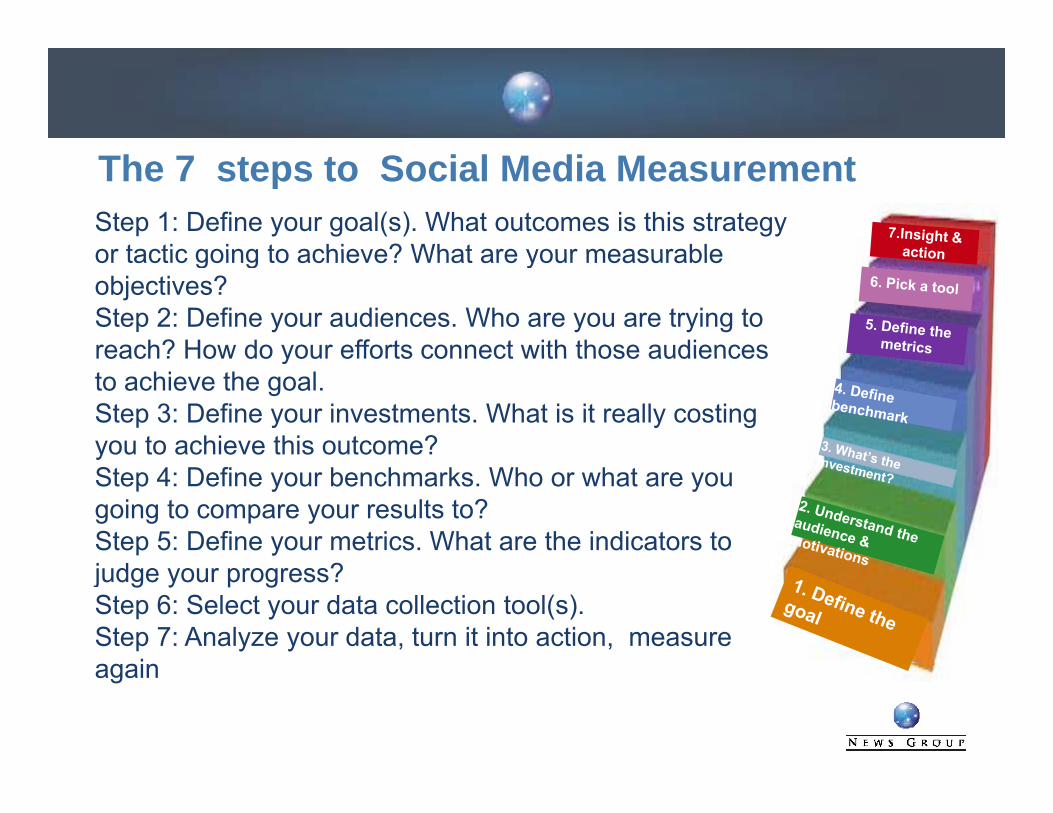
The 7 steps to Social Media Measurement Step 1: Define your goal(s). What outcomes is this strategy or tactic going to achieve? What are your measurableor tactic going to achieve? What are your measurable objectives?Step 2: Define your audiences. Who are you are trying to reach? How do your efforts connect with those audiencesreach? How do your efforts connect with those audiences to achieve the goal. Step 3: Define your investments. What is it really costing you to achieve this outcome? yStep 4: Define your benchmarks. Who or what are you going to compare your results to?Step 5: Define your metrics. What are the indicators to judge your progress?Step 6: Select your data collection tool(s). Step 7: Analyze your data, turn it into action, measure
iagain
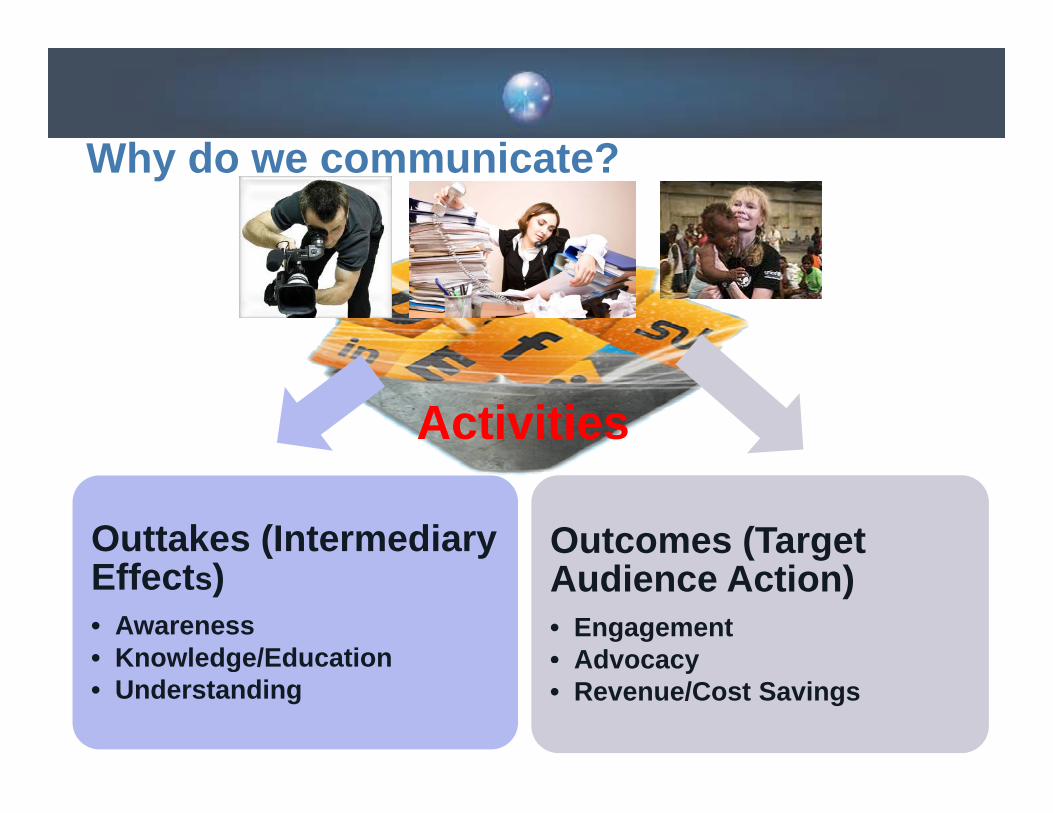
Wh do e comm nicate?Why do we communicate?
Activities
Outtakes (Intermediary Outcomes (Target Effects) • Awareness• Knowledge/Education
( gAudience Action)• Engagement• AdvocacyKnowledge/Education
• Understanding Advocacy
• Revenue/Cost Savings
Step 1: Define the goals: Why Social Media? What return is expected? – Define in terms of the mission.What problems is Social Media supposed to
l ?solve? What were you hired to do? What difference are you expected to make?you expected to make? If you are celebrating complete 100% success a year from now, what is different about the y ,organization?If your Social Media is eliminated, what would be diff ?different?
23
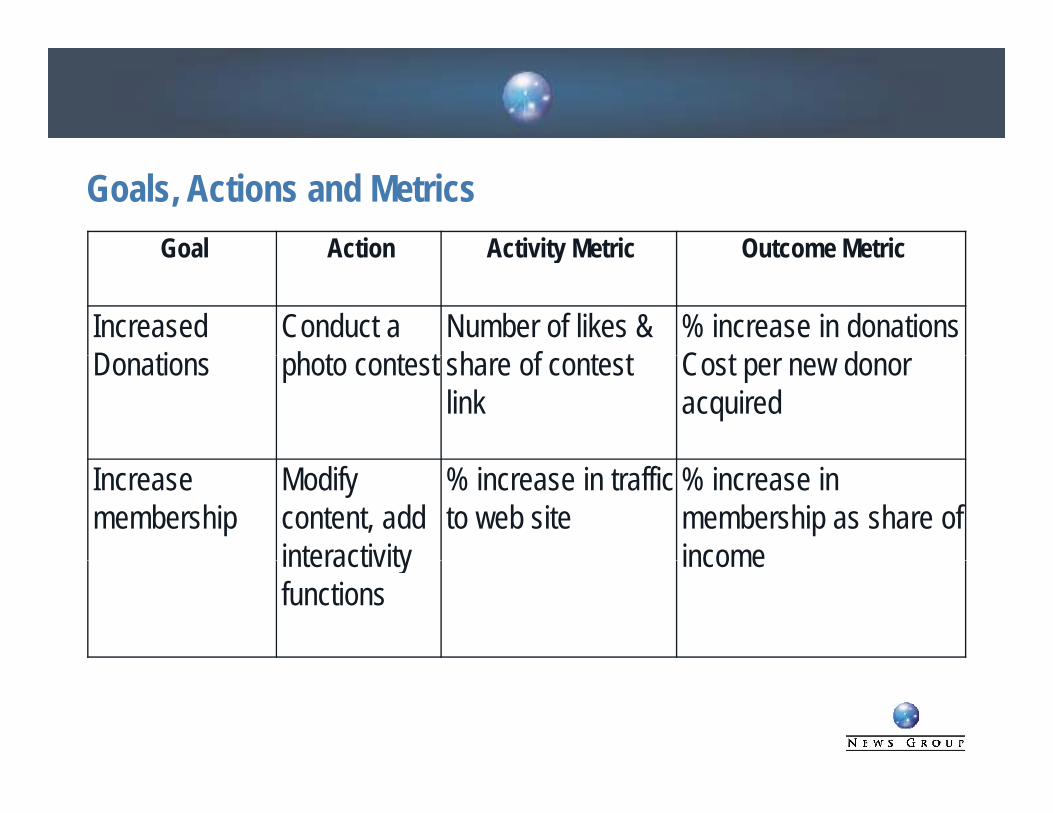
Goals, Actions and Metrics Goal Action Activity Metric Outcome Metric Goal Action Activity Metric Outcome Metric
Increased D ti
Conduct a h t t t
Number of likes & h f t t
% increase in donationsC t d Donations photo contest share of contest
linkCost per new donor acquired
Increase membership
Modify content, add interactivity
% increase in traffic to web site
% increase in membership as share of income interactivity
functionsincome
Step 2: Don’t ask me, ask your stakeholders
What you need to listen for: – What keeps them up at night?– What are they currently
seeing? Wh d th f– Where do they go for information?
– What influences theirWhat influences their decisions?
– What’s important to them?p– What makes them act?
25
Step 3: Establish benchmarks
Past PerformanceWhoever you compete with for share of walletWhatever keeps your leadership team up at night
Step 5: Define your investment
Be honest Social Media is not “free”Be honest – Social Media is not free
Be transparent
Don’t forget opportunity costs
Step 4: Why you need a Kick-Butt I dIndex
The Perfect KPI
Is actionable
Is there when you need it
Specific to your priorityp y p y
Continuously improves your processes
Gets you where you want to goGets you where you want to go
You become what you measure, so pick your KPI carefully
28
Step 6: Pick the right measurement tools
If you want to measure messaging, y g g,positioning, themes, sentiment: Content analysis
If t tIf you want to measure awareness, perception, relationships, preference: Survey research
If you want to measure engagement, action, purchase: Web analytics
If you want predictions and correlations youIf you want predictions and correlations you need two out of three
29
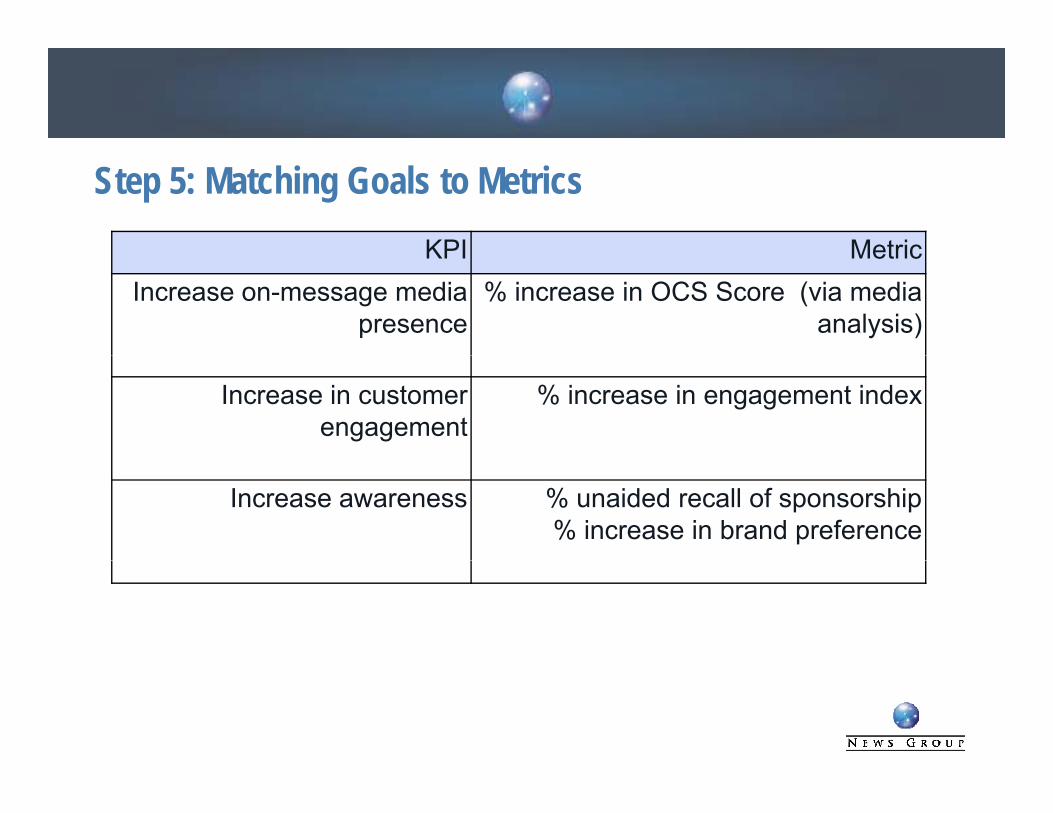
Step 5: Matching Goals to Metrics KPI MetricKPI Metric
Increase on-message media presence
% increase in OCS Score (via media analysis)
Increase in customer engagement
% increase in engagement index
Increase awareness % unaided recall of sponsorship% increase in brand preference
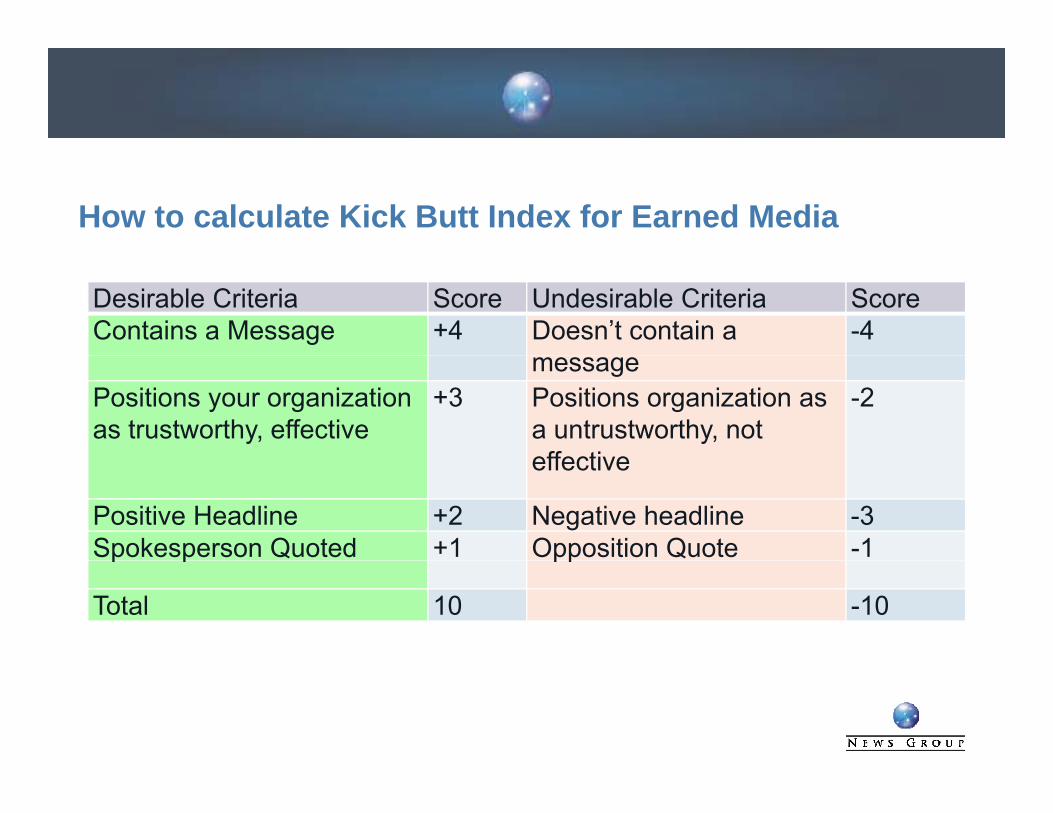
How to calculate Kick Butt Index for Earned Media
Desirable Criteria Score Undesirable Criteria ScoreContains a Message +4 Doesn’t contain a -4
messagePositions your organization as trustworthy, effective
+3 Positions organization as a untrustworthy, not effective
-2
effective
Positive Headline +2 Negative headline -3Spokesperson Quoted +1 Opposition Quote -1p p pp
Total 10 -10
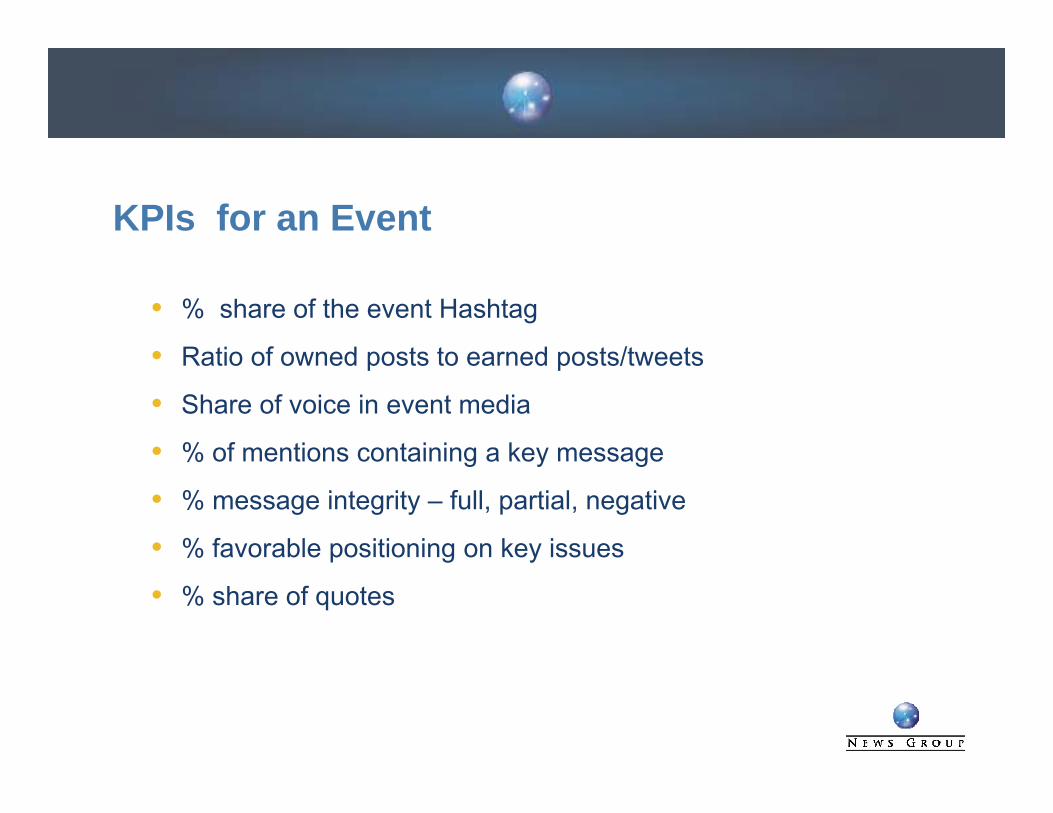
KPIs for an Event
% share of the event Hashtag
Ratio of owned posts to earned posts/tweetsRatio of owned posts to earned posts/tweets
Share of voice in event media
% of mentions containing a key message% of mentions containing a key message
% message integrity – full, partial, negative
% favorable positioning on key issuesp g y
% share of quotes
32
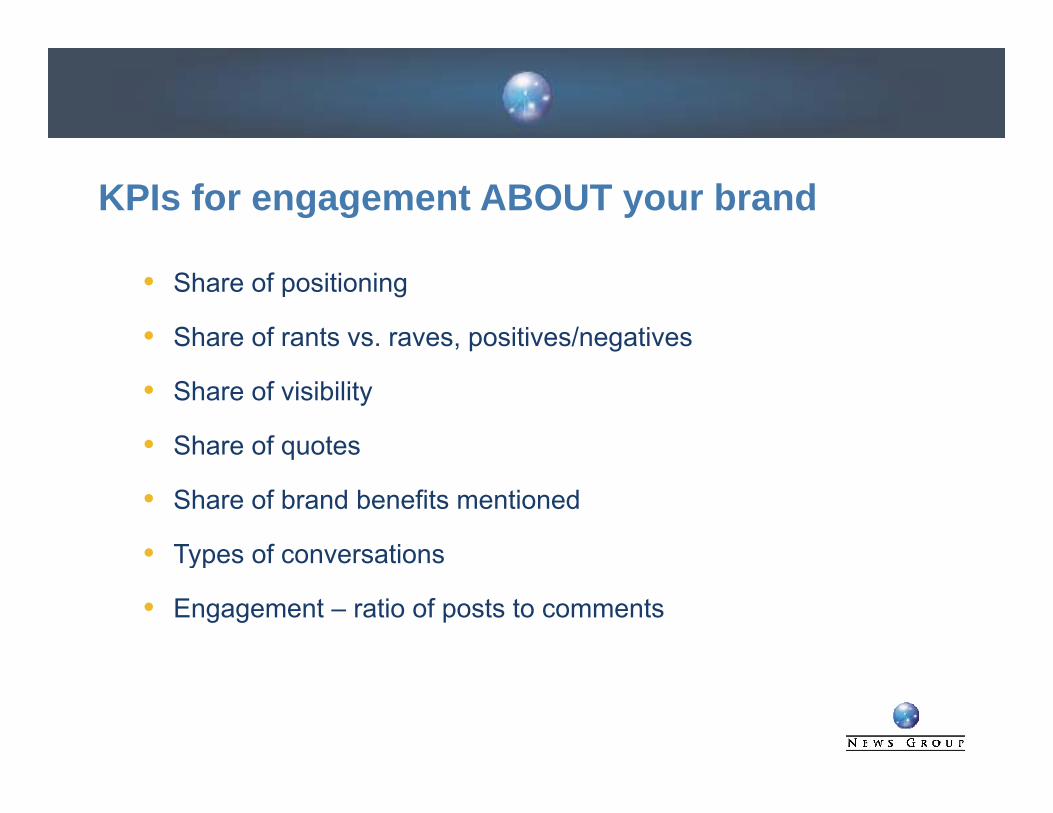
KPIs for engagement ABOUT your brand
Share of positioning
Share of rants vs. raves, positives/negatives
Share of visibility
Share of quotesq
Share of brand benefits mentioned
Types of conversationsTypes of conversations
Engagement – ratio of posts to comments
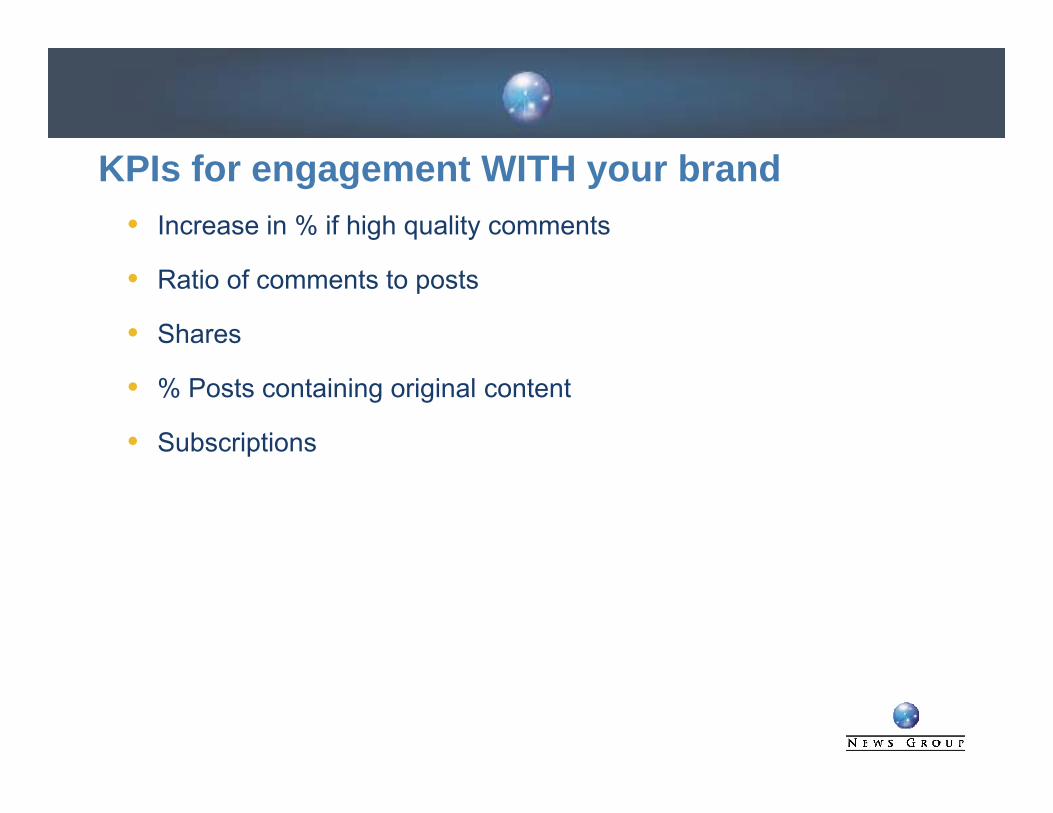
KPIs for engagement WITH your brand Increase in % if high quality comments
Ratio of comments to posts
Shares
% Posts containing original content
Subscriptions
Objective KPI Tool Increase inquiries web % increase in traffic Web Analytics: Google
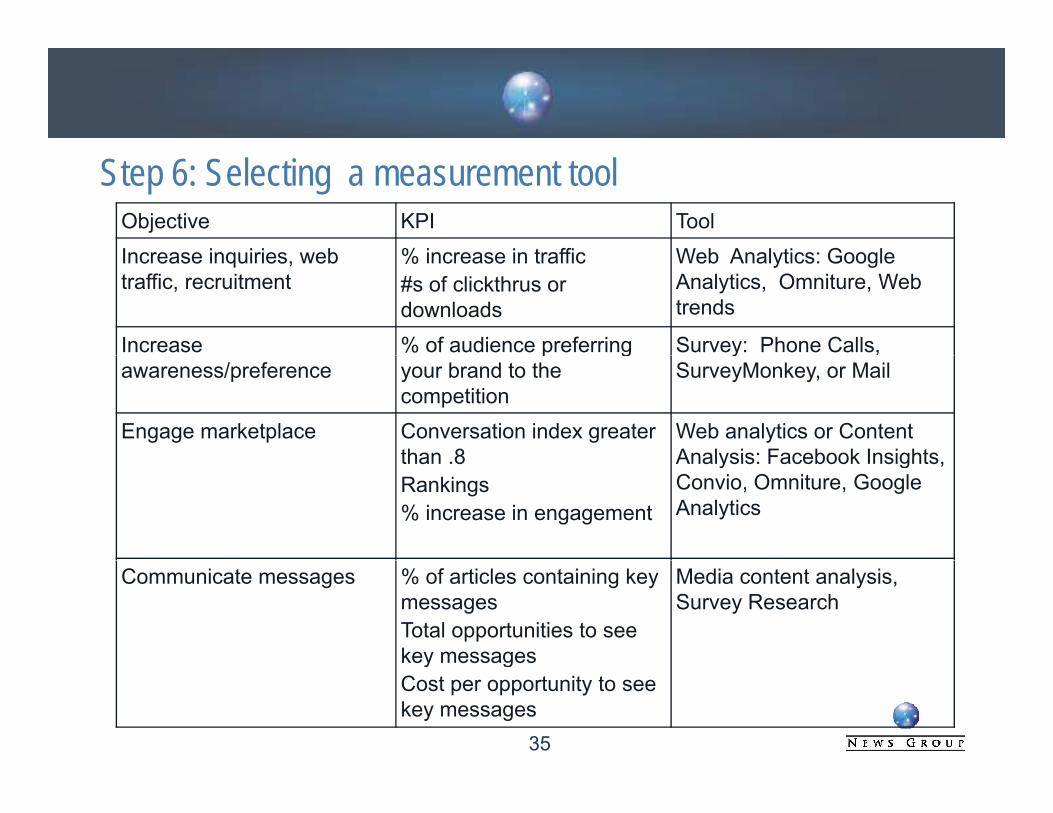
Step 6: Selecting a measurement tool
Increase inquiries, web traffic, recruitment
% increase in traffic#s of clickthrus or downloads
Web Analytics: Google Analytics, Omniture, Web trends
Increase % of audience preferring Survey: Phone Calls, awareness/preference
p gyour brand to the competition
ySurveyMonkey, or Mail
Engage marketplace Conversation index greater than 8
Web analytics or Content Analysis: Facebook Insightsthan .8
Rankings % increase in engagement
Analysis: Facebook Insights, Convio, Omniture, Google Analytics
Communicate messages % of articles containing key messagesTotal opportunities to see key messages
Media content analysis, Survey Research
ey essagesCost per opportunity to see key messages
35
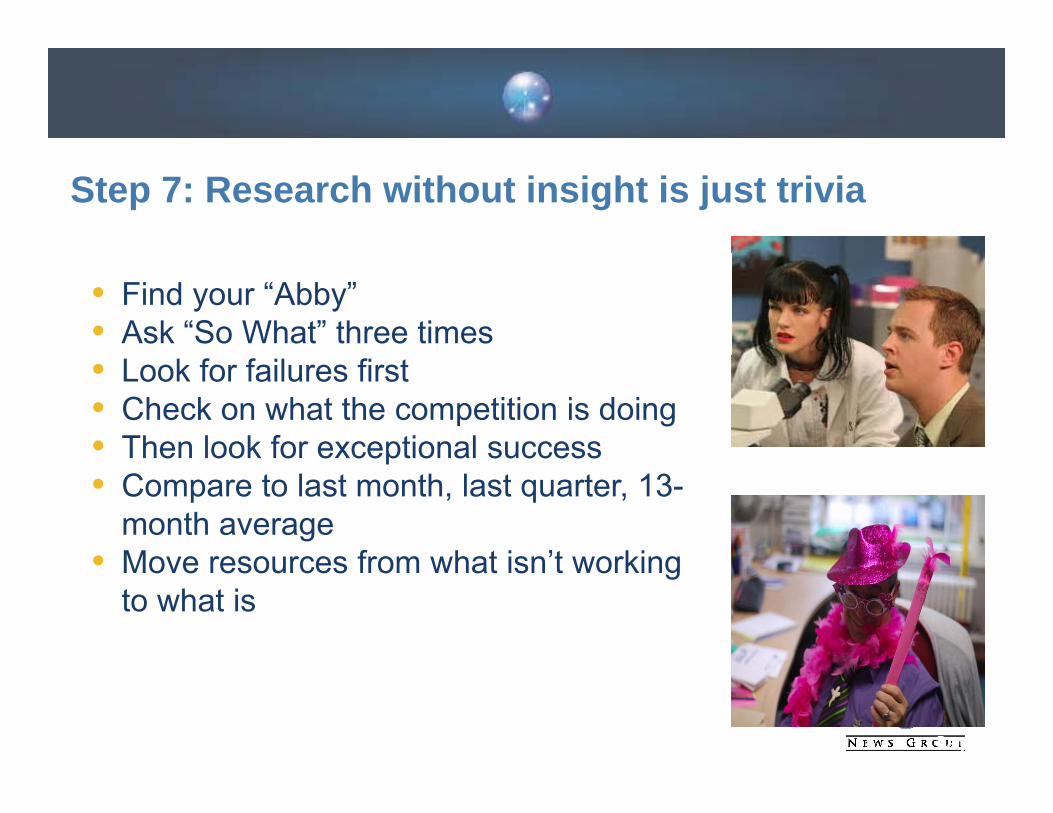
Step 7: Research without insight is just trivia
Find your “Abby”Ask “So What” three timesLook for failures firstCheck on what the competition is doing Then look for exceptional successThen look for exceptional successCompare to last month, last quarter, 13-month averageMove resources from what isn’t workingMove resources from what isn t working to what is
Page 36
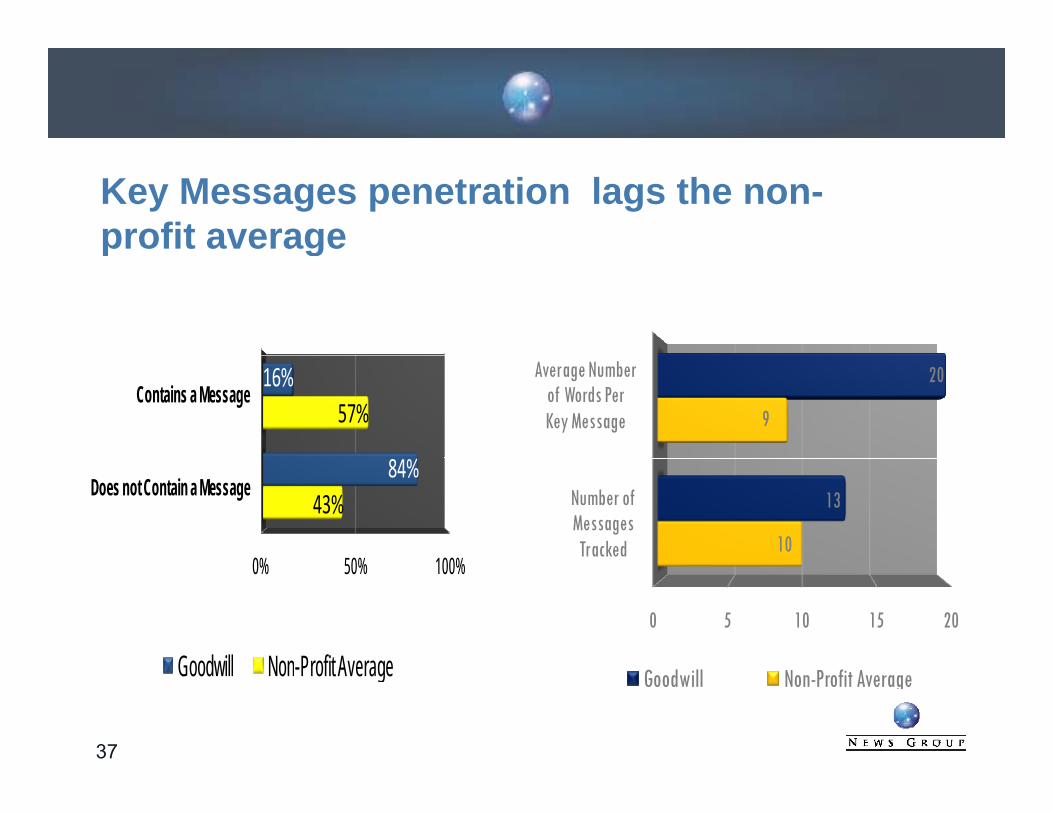
Key Messages penetration lags the non-profit average p g
Contains a Message57%
16% Average Number of Words Per Key Message 9
20
0% 50% 100%
Does not Contain a Message43%
84%Number of Messages Tracked 10
13
0% 50% 100%
Goodwill Non Profit Average0 5 10 15 20
Goodwill Non-Profit Average
37
Goodwill Non-Profit Average
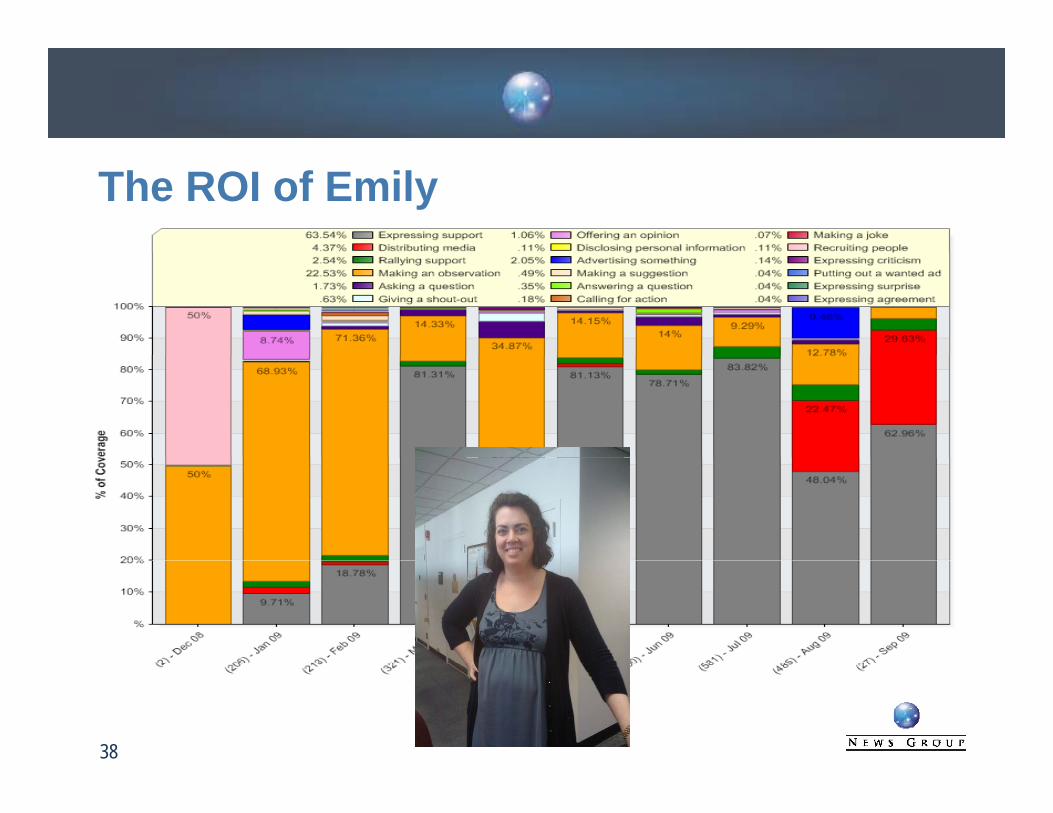
The ROI of Emily
38
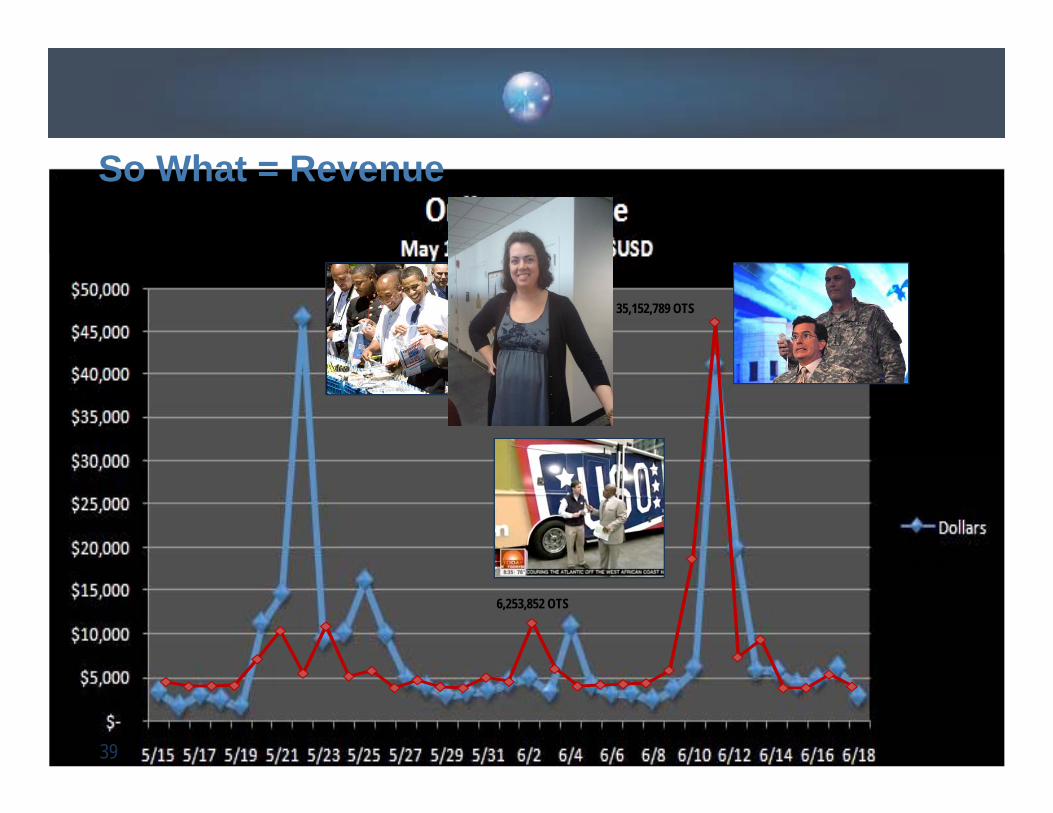
So What = Revenue
35,152,789 OTS
R d li Red line indicates media impressions6,253,852 OTS
39
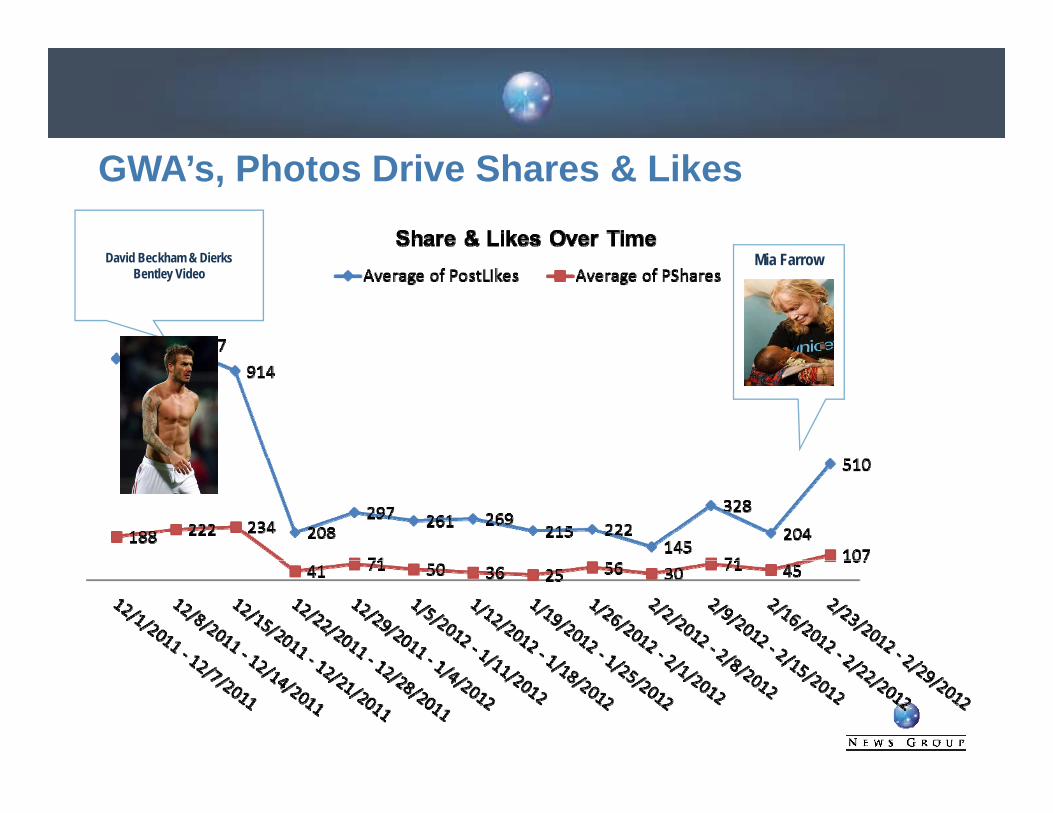
GWA’s, Photos Drive Shares & Likes
D id B kh & Di k Mia FarrowDavid Beckham & Dierks Bentley Video
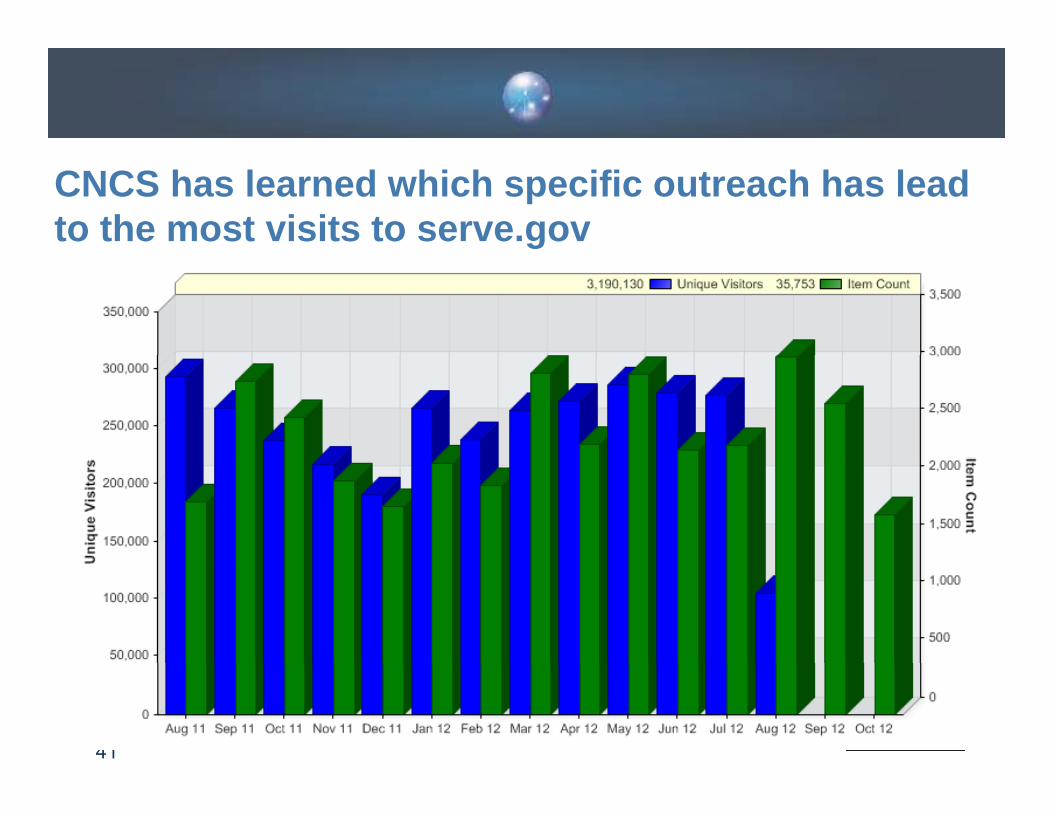
CNCS has learned which specific outreach has lead to the most visits to serve.gov
41
Thank You!For information about social media measurement standards go to www smmstandards orgwww.smmstandards.org
For more information on measurement, read my blog: http://kdpaine.blogs.com or subscribe to The Measurement Standard:
www.themeasurementstandard.com
For a copy of this presentation go to: http://www.kdpaine.compy p g p p
Follow me on Twitter: KDPaine
Friend me on Facebook: Katie PaineFriend me on Facebook: Katie Paine
Or call us at 1-603-752-0111