Embed Size (px)
Citation preview

Common myths, truths and fears that need to be
overthrown when deciding about rural broadband projects
Salzburg, 27th of May 2014
Goran Živec, Vahta d.o.o.
Creative Commons CC0

Since 2003: ICT Technology Network - a consortium of cca. 45 leading Slovenian companies and research institutions in the field of ICT (tripple helix structure)
Main activities:•innovation systems in the field of ICT •academia-industry networking•national and EU project management•internationalization & promotion•business model and strategy development
WWW.PPP4BROADBAND.EU

OAN in Slovenia
• White spot <2Mbit• GOŠO1 (1, 2, 3)-15.921 WS• GOŠO2 (1)-13.497 WS• Home passed 120.000 in
suburban and rural areas
Until recently, only white spots could be connected.

Myths, truths, fears
Myth – any broadband is good!Truth – FTTH is expensive!Fear – there will be low interest for broadband in rural areas!
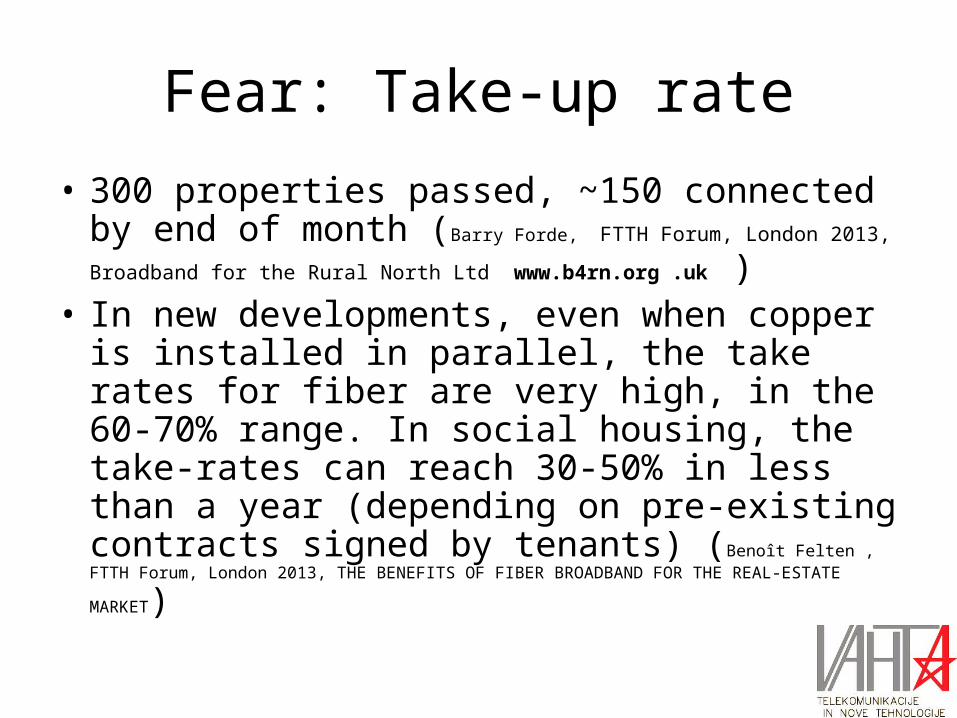
Fear: Take-up rate
• 300 properties passed, ~150 connected by end of month (Barry Forde, FTTH Forum, London 2013, Broadband for the Rural North
Ltd www.b4rn.org .uk )• In new developments, even when copper is
installed in parallel, the take rates for fiber are very high, in the 60-70% range. In social housing, the take-rates can reach 30-50% in less than a year (depending on pre-existing contracts signed by tenants) (Benoît Felten , FTTH Forum, London 2013, THE BENEFITS OF FIBER
BROADBAND FOR THE REAL-ESTATE MARKET)

OANTake-up rate in Slovenija
Operacije GOŠO 1No.
municipalities
White spots start 2011
Connected WS 31.3.2014 Percent
TOTAL GOŠO 1 20 15.957 9.760 61,16%
Operacije GOŠO 2No.
municipalities
White spots start 2013
Connected WS 31.3.2014 Percent
TOTAL GOŠO 2 23 13.497 3.168 23,47%TOTAL GOŠO 1 AND GOŠO 2 43 29.454 12.928 43,89%
Operacije GOŠO 2 ConsortiumN. of muni WS passed
Connected on 31.3.2014 Percent
Občina Mokronog - Trebelno
Trebnje, Mirna, Mirna Peč, Šentrupert, Žužemberk, Sevnica 7 5585 1885 33,75%
Občina SežanaIlirska Bistrica, Hrpelje-Kozina, Komen 3 3535 875 24,75%
Občina Pivka - 1 1011 200 19,78%
Mozirje
Gornji Grad, Rečica ob Savinji, Luče, Ljubno, Solčava, Vransko, Prebold, Polzela, Tabor, Apače 11 2339 31 1,33%
Slovenske Konjice - 1 1027 177 17,23%
SKUPAJ GOŠO 2 23 13497 3168 23,47%
THE RELATIVE UTILITY OF BROADBAND TO RURAL AREAS IS MUCH BIGGER THAN TO URBAN AREAS!IT IS CRITICAL TO ASSURE AS MUCH SERVICE PROVIDERS AS POSSIBLE - SERVICE IS THE KEY!IN RURAL AREAS, COOPERATION WITH LOCAL INHABITANTS AND LOCAL AUTHORITIES IS A MUST!

Truth: FTTH is expensiveFiber projects can have a higher initial investment, but if total cost is considered, they might be already the most convenient!The initial investment can be heavily lowered (more than halved) if the reuse of existing infrastructure and the concurrent execution of works with other infrastructure is possible (EU regulation).As fiber brings much lower operational costs, on long term (20years) the projects are less sensitive to economic environment.
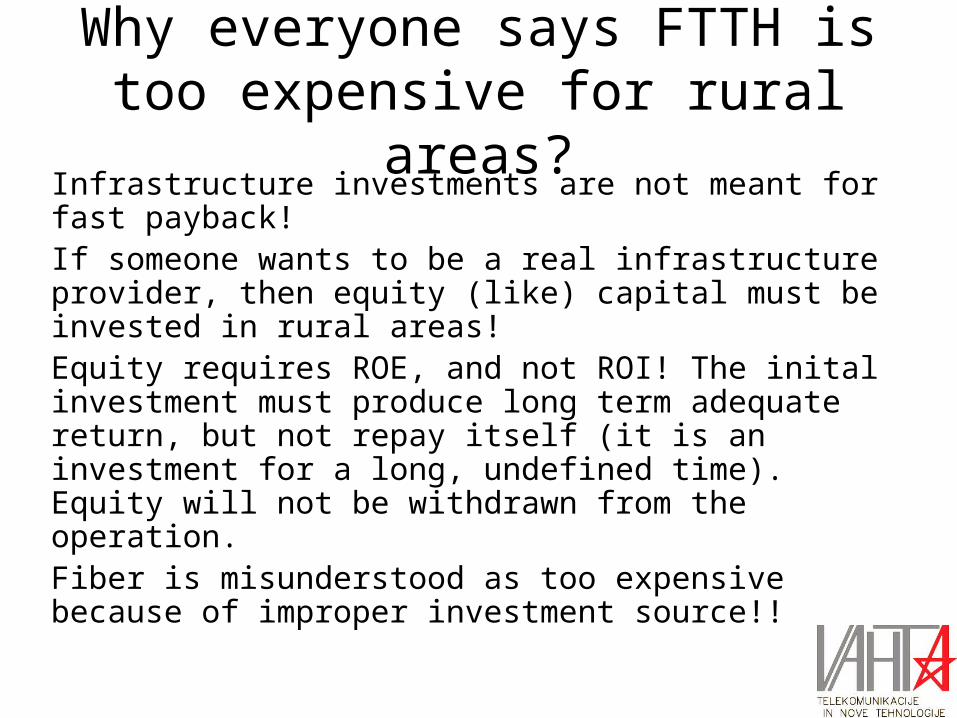
Why everyone says FTTH is too expensive for rural areas?
Infrastructure investments are not meant for fast payback!If someone wants to be a real infrastructure provider, then equity (like) capital must be invested in rural areas!Equity requires ROE, and not ROI! The inital investment must produce long term adequate return, but not repay itself (it is an investment for a long, undefined time). Equity will not be withdrawn from the operation.Fiber is misunderstood as too expensive because of improper investment source!!

Cost per HH passed and cost per HH connected?!
Example: OŠO projects in SloveniaAn area with more than 100.000 HH was covered (mostly FTTH, with fiber connectivity 200m or less from the HH), using total of 110M EUR (PPPs, with 81M EU and national funds), 29.000HH out of those 100.000 did not have access to 2 Mbps (clear market failure). At the moment, 13.000 of those are connected.How much did we spend per HH? 110M/13k? 81M/13k? 110M/29k? Or 110M/100k?!

Is Broadband risky for equity investors?
Source of graph and formula: Wikipedia, „CAPM“
Higher risk => Higher expected return
Telecommunication company Beta (βu) valueMagyar telekom telecommunica 0.72Telefonica O2 Czech Republic 0.82TeliaSonera 0.62Telekom Austria AG 0.69Koninklijke KPN NV 0.52Swisscom AG-REG 0.50Telecom Italia SPA 0.64Telefonica SA 0.73Telenor ASA 0.63Hellenic Telecommun Organiza 0.79TDC A/S 0.40Vodofone Group PLC 0.76Telekomunikacja Polska SA 0.81Belgacom SA 0.61Portugal Telecom SGPS SA-REG 0.68Eesti Telekom 0.67Deutsche Telekom AG-REG 0.69France Telecom SA 0.59Norht-West Telecom-CLS 0.42Mobistar SA 0.61
Bloomberg industry data, 2008
Industry Name Number of firms Beta D/E Ratio Tax rate Unlevered beta
Utility (General) 20 0,56 69,35% 29,93% 0,38Power 106 0,68 85,11% 16,03% 0,40Utility (Water) 20 0,75 57,90% 14,52% 0,50Telecom. Services 82 0,94 71,23% 8,40% 0,57Coal & Related Energy 45 1,28 86,63% 2,44% 0,69Retail (Distributors) 87 1,00 43,82% 16,18% 0,73Healthcare Equipment 193 0,85 17,26% 5,80% 0,73Retail (General) 21 0,98 35,62% 25,03% 0,77Computer Services 129 0,92 20,48% 9,94% 0,78Chemical (Basic) 47 1,01 29,67% 6,27% 0,79Tobacco 12 0,94 20,83% 14,23% 0,80Real Estate (Development) 22 0,99 24,90% 3,00% 0,80Electronics 191 1,02 16,01% 7,52% 0,89Electrical Equipment 135 1,14 13,74% 7,49% 1,01Building Materials 37 1,27 30,05% 16,33% 1,02Biotechnology 349 1,12 9,15% 1,13% 1,02Telecom. Equipment 131 1,14 10,77% 6,90% 1,04Heavy Construction 46 1,67 56,30% 19,40% 1,15Total Market 7766 1,01 74,28% 10,32% 0,60
Source: Damodaran, Stern Univ, 2014
Broadband is infrastructure, and has low risk.
Fixed broadband is THE ONLY industry, where natural monopoly is possible without paynig concessions!

Myth: any broadband is good!• For every one percentage point increase in broadband penetration
in a state, employment is projected to increase by 0.2 to 0.3 percent per year. Source: The Effects of Broadband Deployment on Output and Employment: A Cross-sectional Analysis of U.S. Data. Robert Crandall, William Lehr and Robert Litan, the Brookings Institution, 2007
• An increase in the broadband penetration rate by 10 percentage points raises annual growth in per-capita GDP by 0.9 to 1.5 percentage points. Source: Broadband Infrastructure and Economic Growth, 2009. Nina Czernich Oliver Falck, Tobias Kretschmer and Ludger Woessmann
• According to the U.S. Department of Commerce, between 1998 – 2002 communities that gained access to broadband service experienced an employment growth increase of 1% to 1.4%, a business establishment increase of 0.5% to 1.2%, and a rental value increase of 6%
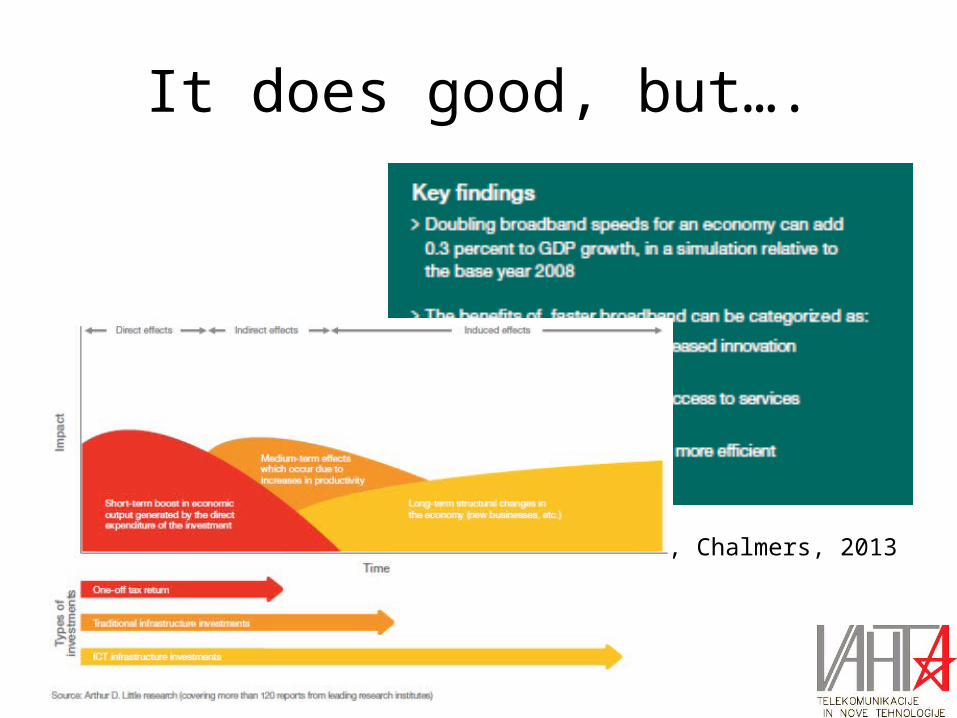
Ericsson, Arthur D Little, Chalmers, 2013
It does good, but….

…not necessarily!Im
pact
Time
1. Short term, initial investment stimulated increase,2. Mid term, productivity increase,3. Long term, structural change induced increase.
THE OVERALL EFFECT OF A BROADBAND PROJECT IS THE SUM OF THE THREE!THE THIRD COMPONENT HAS THE GREATEST AREA (EFFECT).
EXTEND THE TIMELINE
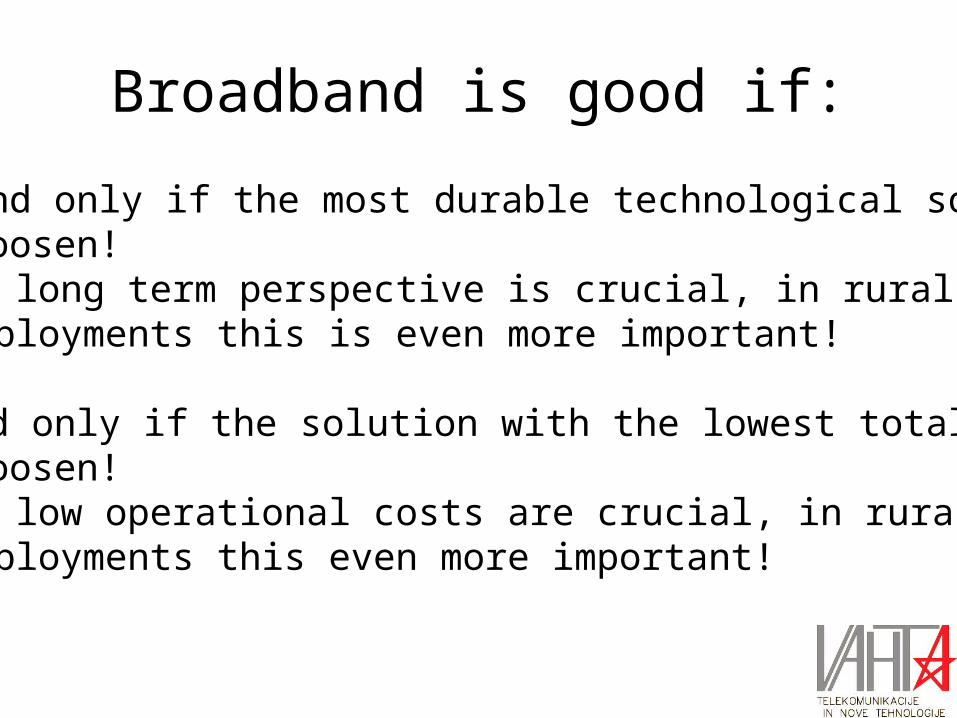
Broadband is good if:
- If and only if the most durable technological solution is choosen!
As long term perspective is crucial, in rural deployments this is even more important!
-If and only if the solution with the lowest total cost is choosen!
As low operational costs are crucial, in rural deployments this even more important!

Final thoughts I
• Because of the (extremely) low population density, generalisation from projects in urban areas cannot be done!
• For the sustainability of the rural broadband projects, operational costs are very important (including the cost for mandatory equipment substitution). A long term planning is therefor required.

Final thoughts II
• If the total cost (investment plus operational) is calculated, in deep rural areas FTTH is the most economic solution.
• For the initial investment, it‘s not a problem of cost, but of the financing source.
• The recent Regulative from EU Commission about GBER (21.5.2014) might be a real game changer, as under certain conditions, Broadband projects smaller than 150M are relieved from state aid aproval.

Fibre to the people initiative• Open, inclusive and future oriented Europe needs pervasive, very high speed
connectivity for every citizen. Recent trends are showing an alarming intention of the industry to consider European rural areas as less important, deeming any
solution is good enough for „those few elder farmers who live there“.• European rural areas are not only agriculture! Half of EU citizens live in rural areas!• This means half of those Europeans who pay taxes and have the right to vote! • We, people who live in rural areas, demand proper, future oriented, fibre
broadband connectivity!• We do not accept any second-choice solution as good-enough, like wireless or
similar!• To those, who argue that it cannot be done, we answer: „If you don‘t know how to
do it, this doesn‘t mean it cannot be done. We will do it by ourselves!“.
• Fibre to the people!