Embed Size (px)
Citation preview
MARKS: 150
Time : 3 hours
This question paper consists of 15 pages and 3 annexures.
GRADE 12
2015 SEPTEMBER EXAMINATION
MATHEMATICAL LITERACY
PAPER 1
COMMON PAPER
CAPE WINELANDS EDUCATION
DISTRICT
Grade 12 Mathematical Literacy P1 SEPTEMBER 2015
2
INSTRUCTIONS AND INFORMATION
1. This question paper consists of FIVE questions. Answer ALL the questions.
2.
QUESTION 1.4.6 needs to be answered on the attached ANNEXURE A and
QUESTION 4.4.2 on ANNEXURE C. Write your name in the space provided on the
ANNEXURES and hand in the ANNEXURES together with your ANSWER BOOK.
3 Number the answers correctly according to the numbering system used in this question
paper.
4. Start EACH question on a NEW page.
5. You may use an approved calculator (non-programmable and non-graphical), unless
stated otherwise.
6. Show ALL the calculations clearly.
7. Round off ALL final answers appropriately according to the given context, unless stated
otherwise.
8. Indicate units of measurement, where applicable.
9. Write neatly and legibly.
Grade 12 Mathematical Literacy P1 SEPTEMBER 2015
3
31.40%
26.70%
24.70%
17.20%
34.0%
19.8%
26.4%
19.8%
Personal income tax
Company Tax
VAT
Other
Main Sources of Income Tax
2013-2014 2009-2010
QUESTION 1 [45]
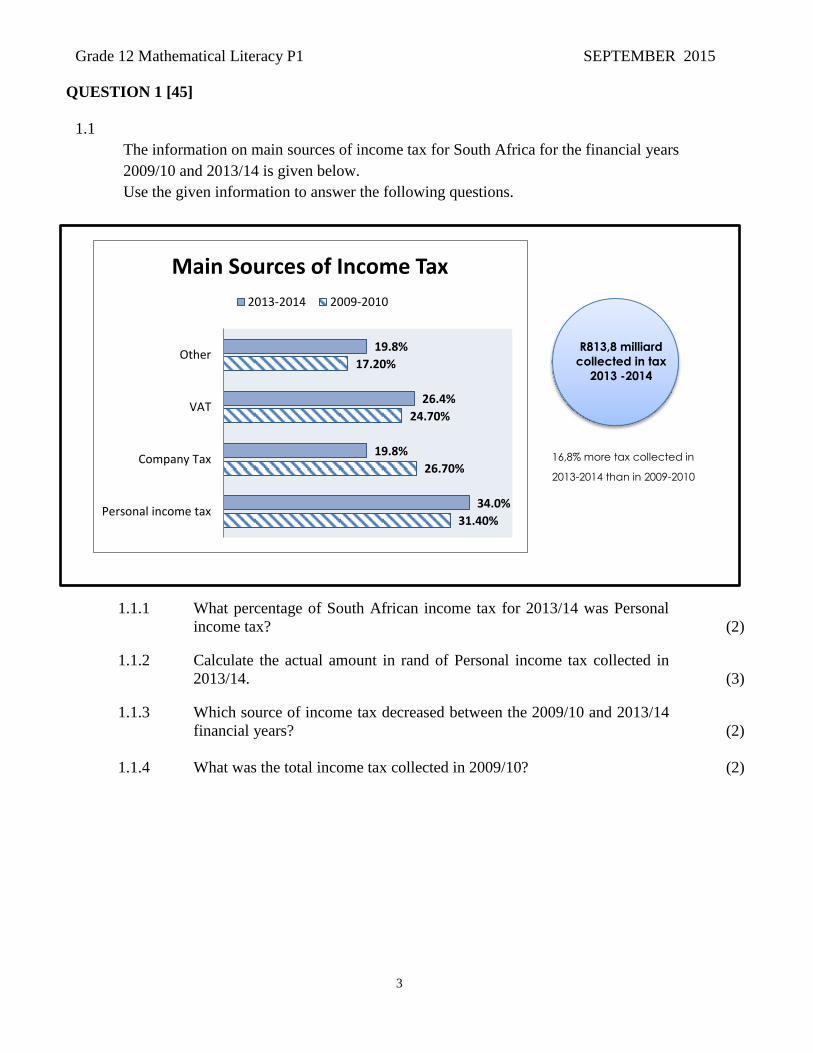
1.1
The information on main sources of income tax for South Africa for the financial years
2009/10 and 2013/14 is given below.
Use the given information to answer the following questions.
1.1.1 What percentage of South African income tax for 2013/14 was Personal
income tax?
(2)
1.1.2 Calculate the actual amount in rand of Personal income tax collected in
2013/14.
(3)
1.1.3 Which source of income tax decreased between the 2009/10 and 2013/14
financial years?
(2)
1.1.4 What was the total income tax collected in 2009/10? (2)
R813,8 milliard
collected in tax
2013 -2014
16,8% more tax collected in
2013-2014 than in 2009-2010

Grade 12 Mathematical Literacy P1 SEPTEMBER 2015
4
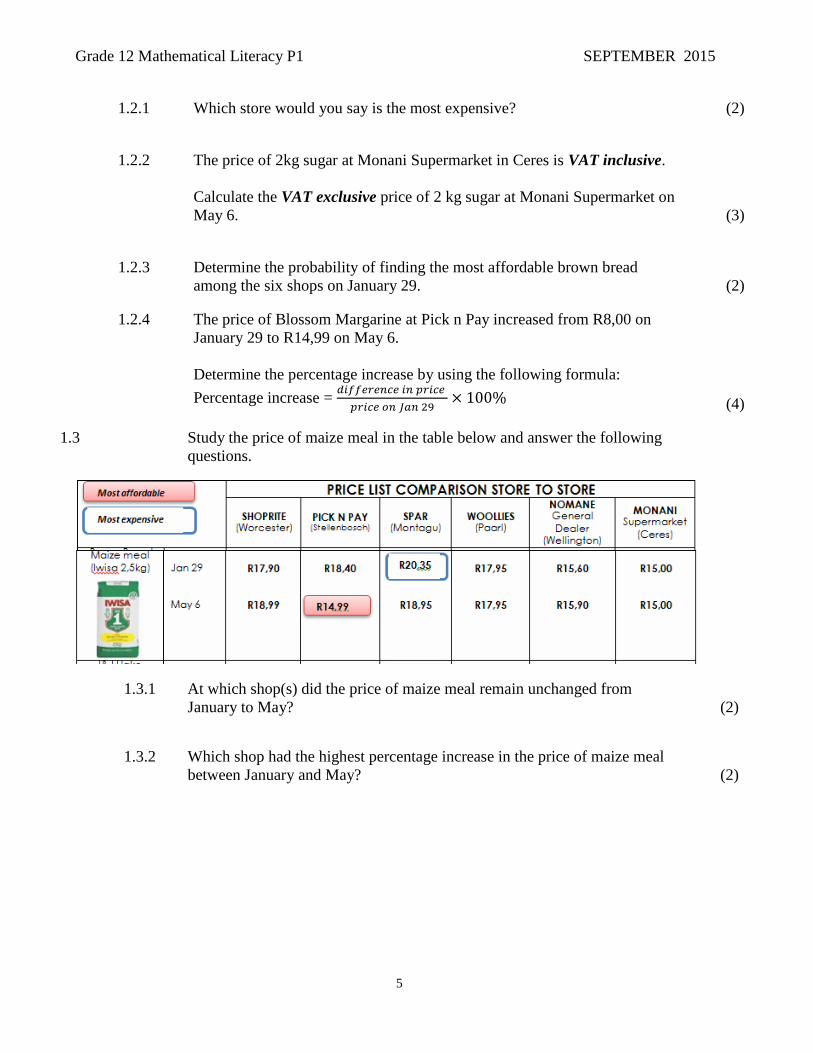
1.2 The following newspaper article compares the selling prices of certain items at
different shops.
The shops are:
Shoprite (Worcester); Pick n Pay(Stellenbosch); Spar(Montagu); Woollies(Paarl);
Nomane (General Dealer in Wellington) and Monani Super Market in Ceres.
Grade 12 Mathematical Literacy P1 SEPTEMBER 2015
5
1.2.1 Which store would you say is the most expensive? (2)
1.2.2
The price of 2kg sugar at Monani Supermarket in Ceres is VAT inclusive.
Calculate the VAT exclusive price of 2 kg sugar at Monani Supermarket on
May 6. (3)
1.2.3
Determine the probability of finding the most affordable brown bread
among the six shops on January 29. (2)
1.2.4 The price of Blossom Margarine at Pick n Pay increased from R8,00 on
January 29 to R14,99 on May 6.
Determine the percentage increase by using the following formula:
Percentage increase = 𝑑𝑖𝑓𝑓𝑒𝑟𝑒𝑛𝑐𝑒 𝑖𝑛 𝑝𝑟𝑖𝑐𝑒
𝑝𝑟𝑖𝑐𝑒 𝑜𝑛 𝐽𝑎𝑛 29× 100% (4)
1.3 Study the price of maize meal in the table below and answer the following
questions.
1.3.1 At which shop(s) did the price of maize meal remain unchanged from
January to May?
(2)
1.3.2 Which shop had the highest percentage increase in the price of maize meal
between January and May?
(2)
Grade 12 Mathematical Literacy P1 SEPTEMBER 2015
6
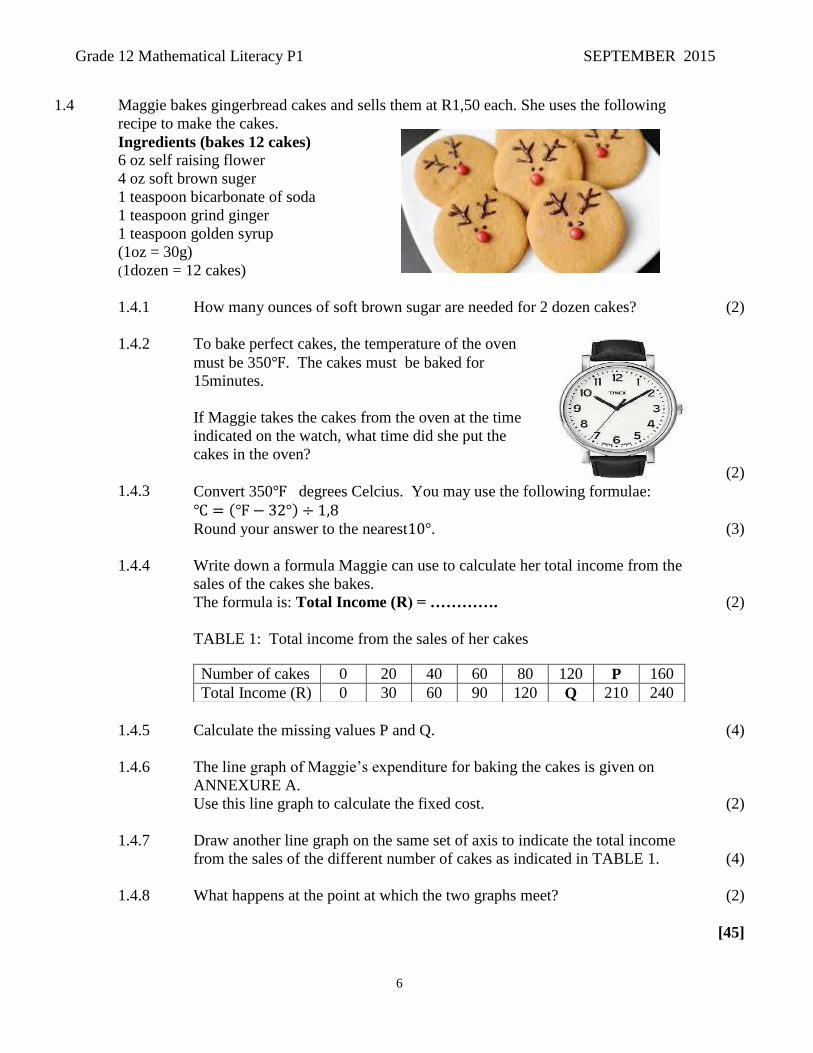
1.4 Maggie bakes gingerbread cakes and sells them at R1,50 each. She uses the following
recipe to make the cakes.
Ingredients (bakes 12 cakes)
6 oz self raising flower
4 oz soft brown suger
1 teaspoon bicarbonate of soda
1 teaspoon grind ginger
1 teaspoon golden syrup
(1oz = 30g)
(1dozen = 12 cakes)
1.4.1 How many ounces of soft brown sugar are needed for 2 dozen cakes? (2)
1.4.2 To bake perfect cakes, the temperature of the oven
must be 350℉. The cakes must be baked for
15minutes.
If Maggie takes the cakes from the oven at the time
indicated on the watch, what time did she put the
cakes in the oven?
(2)
1.4.3 Convert 350℉ degrees Celcius. You may use the following formulae:
℃ = (℉ − 32°) ÷ 1,8
Round your answer to the nearest10°. (3)
1.4.4 Write down a formula Maggie can use to calculate her total income from the
sales of the cakes she bakes.
The formula is: Total Income (R) = …………. (2)
TABLE 1: Total income from the sales of her cakes
Number of cakes 0 20 40 60 80 120 P 160
Total Income (R) 0 30 60 90 120 Q 210 240
1.4.5 Calculate the missing values P and Q. (4)
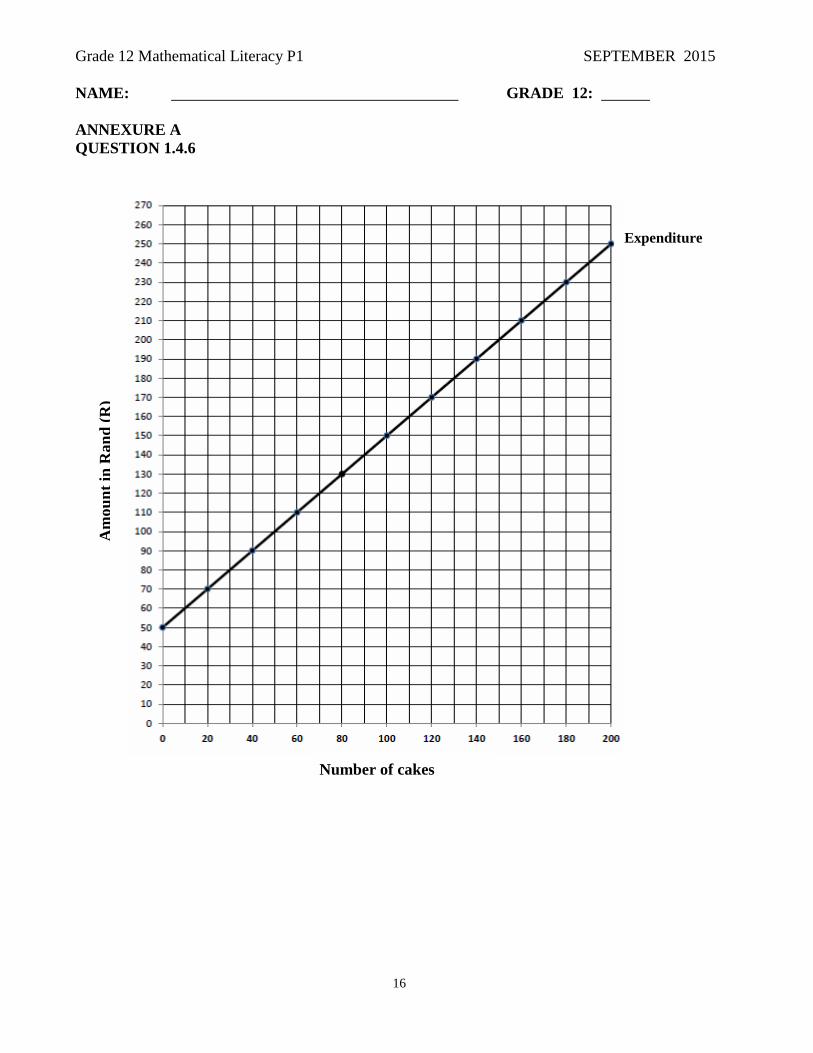
1.4.6 The line graph of Maggie’s expenditure for baking the cakes is given on
ANNEXURE A.
Use this line graph to calculate the fixed cost. (2)
1.4.7 Draw another line graph on the same set of axis to indicate the total income
from the sales of the different number of cakes as indicated in TABLE 1. (4)
1.4.8 What happens at the point at which the two graphs meet? (2)
[45]
Grade 12 Mathematical Literacy P1 SEPTEMBER 2015
7
The sports organiser of Mzila Secondary School conducted a survey on weight status of girls at
the school. He calculated the Body Mass Index (BMI) of a sample of the girls’ population at the
school. There are 365 girls at the school.
The table below shows the age, height, mass and BMI of the sample.
TABLE 2: The age, mass and height of surveyed female learners
LEARNER Age
(Years) Height(m) Mass (kg) BMI
Luvo 14 1.65 65 23,9
Glynis 18 1,7 72 P
Doris 16 1,62 68 25,9
Yolanda 16 1,5 65 Q
Qutsa 18 1,55 72 29,96
Tsakane 15 1,56 66 27,1
Refelwe 16 1,55 62 25,8
Nora 17 1,58 63 25,2
Siba 15 R 69 27
Sive 16 1,55 53 22,1
Yonela 17 1,66 81 29,4
Amanda 19 1,63 71 26,7
2.1 Answer the following questions.
2.1.1 Is the sample representative? Justify your answer. (3)
2.1.2
Determine the range of ages of girls in the sample.
(2)
2.1.3 Use the formula: BMI = weight (kg)
Height (m)2 to calculate:
(a) P
(b) Q
(c) R
(2)
(2)
(3)
QUESTION 2 [24]
Grade 12 Mathematical Literacy P1 SEPTEMBER 2015
8
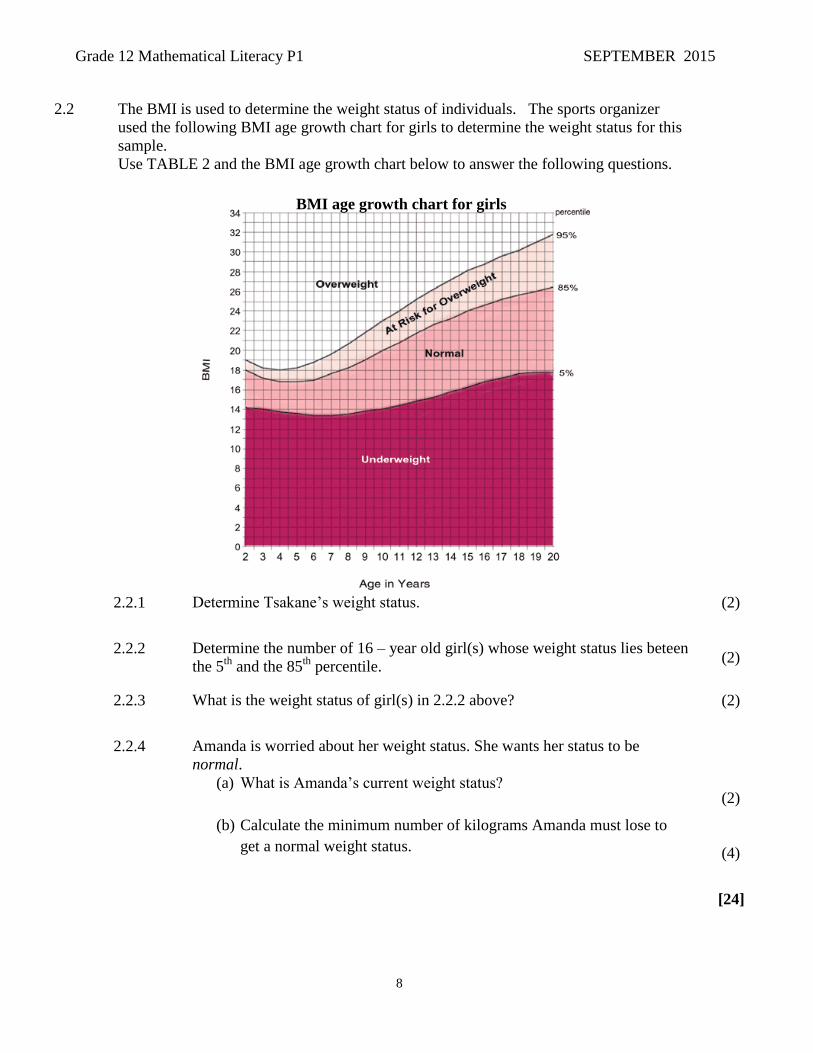
2.2 The BMI is used to determine the weight status of individuals. The sports organizer
used the following BMI age growth chart for girls to determine the weight status for this
sample.
Use TABLE 2 and the BMI age growth chart below to answer the following questions.
2.2.1 Determine Tsakane’s weight status. (2)
2.2.2 Determine the number of 16 – year old girl(s) whose weight status lies beteen
the 5th
and the 85th
percentile. (2)
2.2.3 What is the weight status of girl(s) in 2.2.2 above? (2)
2.2.4 Amanda is worried about her weight status. She wants her status to be
normal.
(a) What is Amanda’s current weight status?
(b) Calculate the minimum number of kilograms Amanda must lose to
get a normal weight status.
(2)
(4)
[24]
BMI age growth chart for girls
Grade 12 Mathematical Literacy P1 SEPTEMBER 2015
9
QUESTION 3 [20]
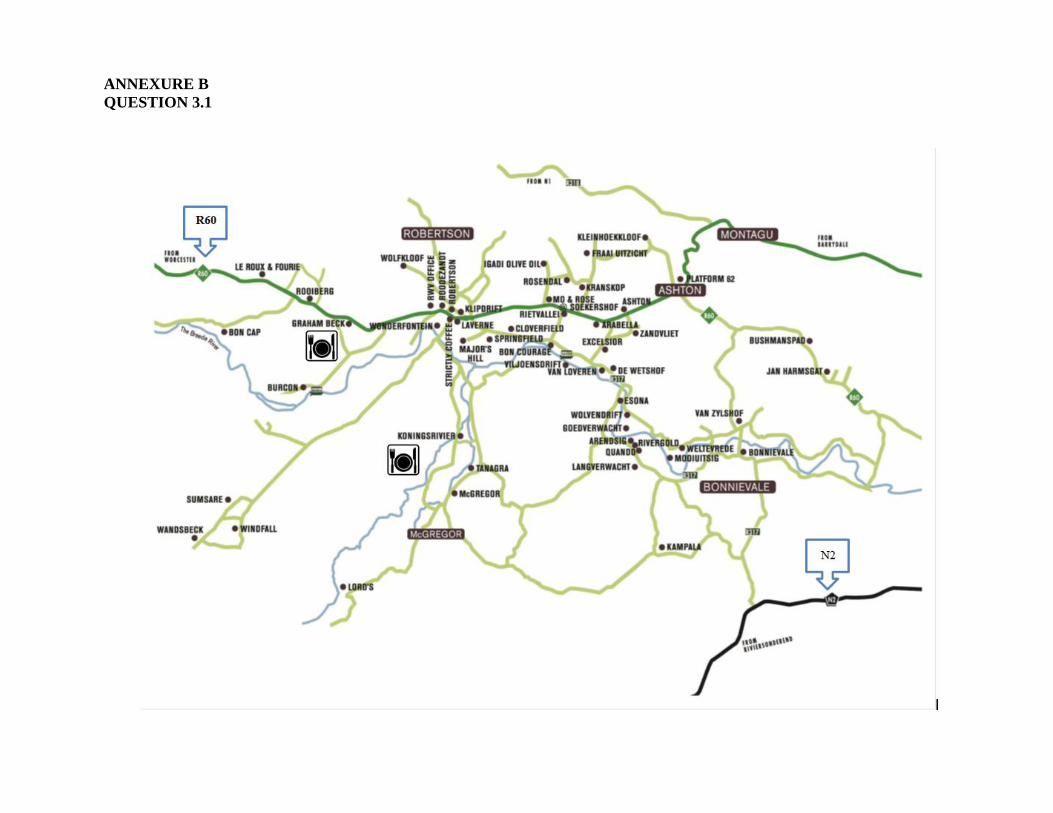
3.1 Refer to the map of wine cellars in the Western Cape on ANNEXURE B and answer
the questions that follow.
3.1.1 On which road does the Le Roux and Fourie wine farm lie? (2)
3.1.2 What river is adjacent to the Bon Cap wine farm? (2)
3.1.3 Name TWO farms where a restaurant is indicated. (2)
3.1.4 Which national road is indicated on this map? (2)
3.1.5 The actual distance between Ashton and Robertson is 17,3 km. On this
map the distance between Ashton and Robertson is 6,4cm. Determine the
scale of the map. Round your answer correct to the nearest 10 000. (4)
3.1.6 A family arrived in Robertson at 10:15. What time did they leave from
Ashton if they travelled for 52 minutes? (2)
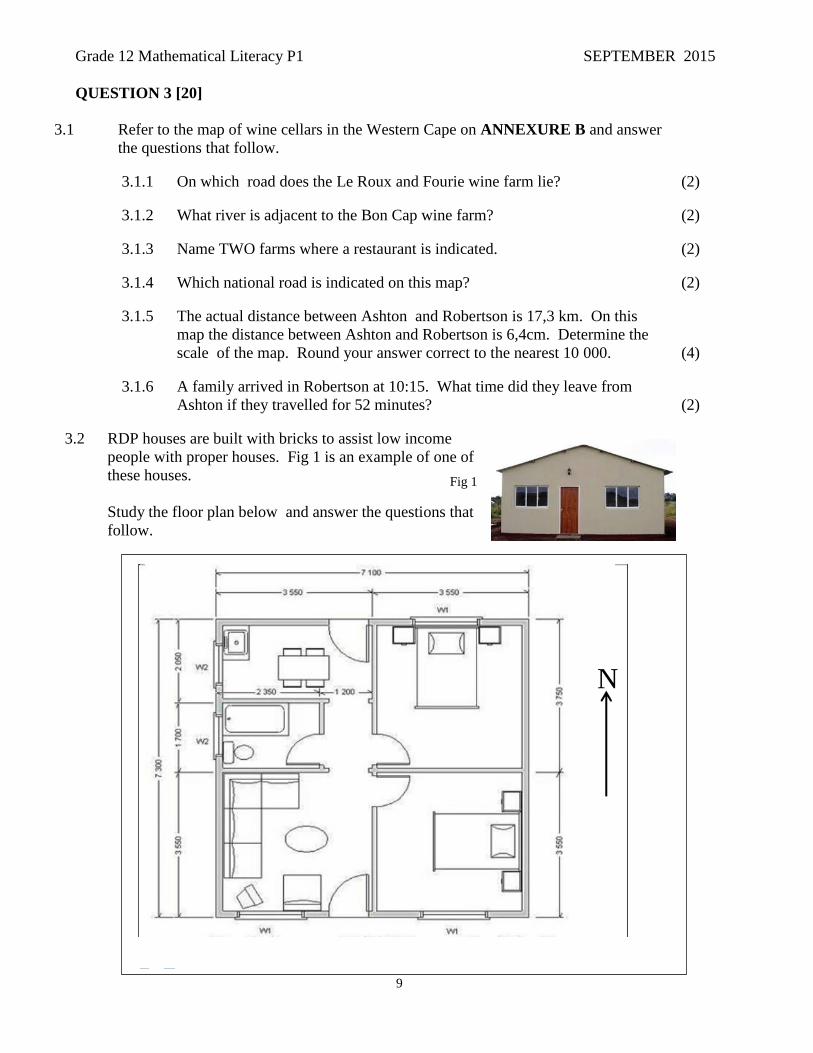
3.2 RDP houses are built with bricks to assist low income
people with proper houses. Fig 1 is an example of one of
these houses.
Study the floor plan below and answer the questions that
follow.
N
Fig 1
Grade 12 Mathematical Literacy P1 SEPTEMBER 2015
10
3.2.1 How many windows and doors have an eastern elevation? (2)
3.2.2 How many doors are indicated on this plan? (2)
3.2.3 Which elevation (view) is illustrated in figure 1? (2)
[20]
QUESTION 4 [38]
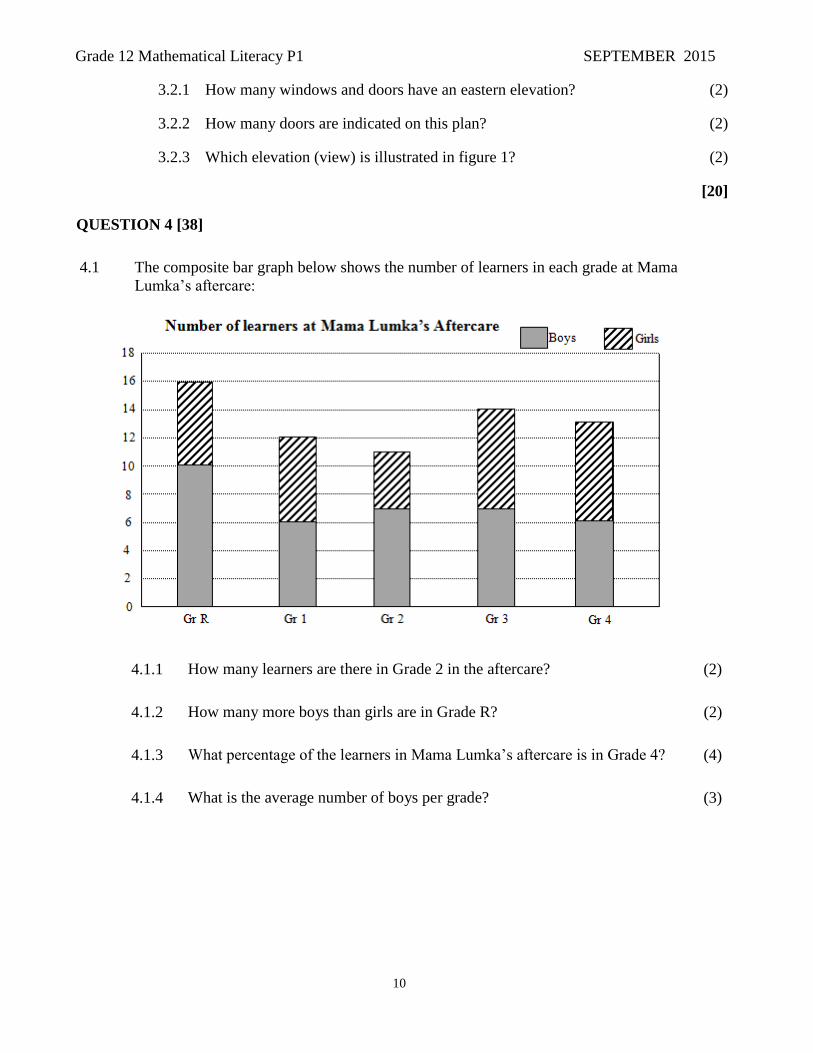
4.1 The composite bar graph below shows the number of learners in each grade at Mama
Lumka’s aftercare:
4.1.1 How many learners are there in Grade 2 in the aftercare? (2)
4.1.2 How many more boys than girls are in Grade R? (2)
4.1.3 What percentage of the learners in Mama Lumka’s aftercare is in Grade 4? (4)
4.1.4 What is the average number of boys per grade? (3)
Grade 12 Mathematical Literacy P1 SEPTEMBER 2015
11
4000 4400 4800 5200 5600 6000 6400 6800 7200 7600 8000 8400 8800 9000
A
B
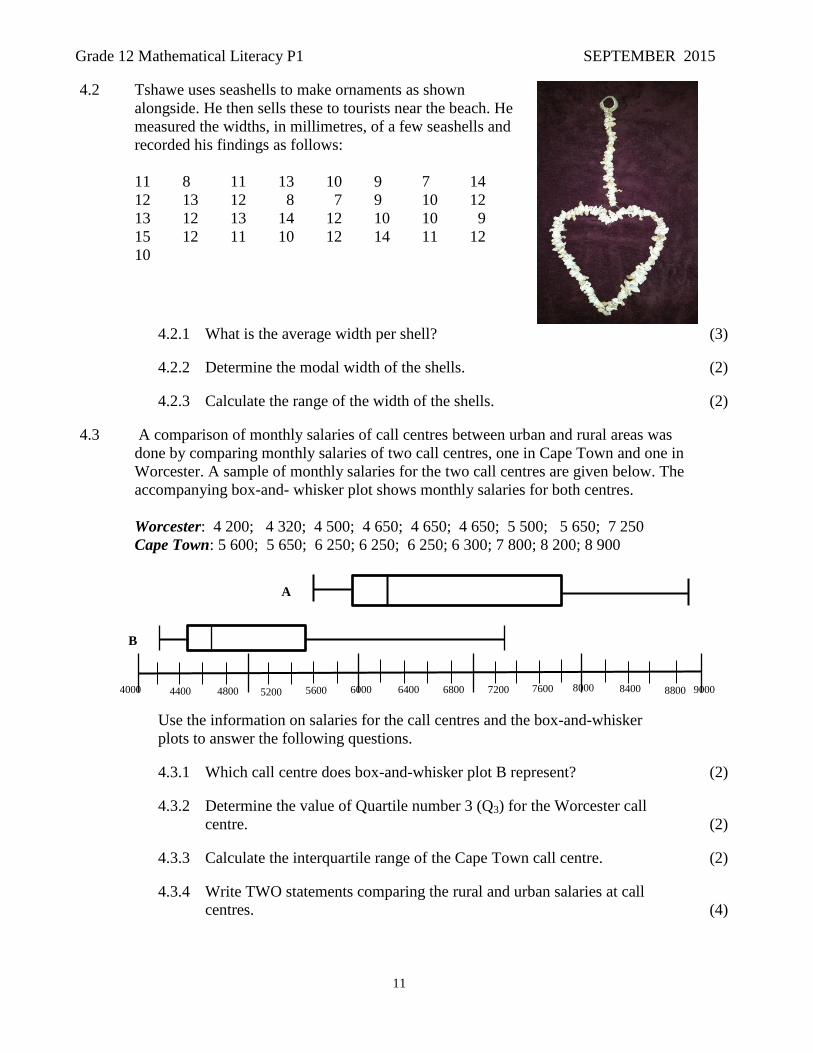
4.2 Tshawe uses seashells to make ornaments as shown
alongside. He then sells these to tourists near the beach. He
measured the widths, in millimetres, of a few seashells and
recorded his findings as follows:
11 8 11 13 10 9 7 14
12 13 12 8 7 9 10 12
13 12 13 14 12 10 10 9
15 12 11 10 12 14 11 12
10
4.2.1 What is the average width per shell? (3)
4.2.2 Determine the modal width of the shells. (2)
4.2.3 Calculate the range of the width of the shells. (2)
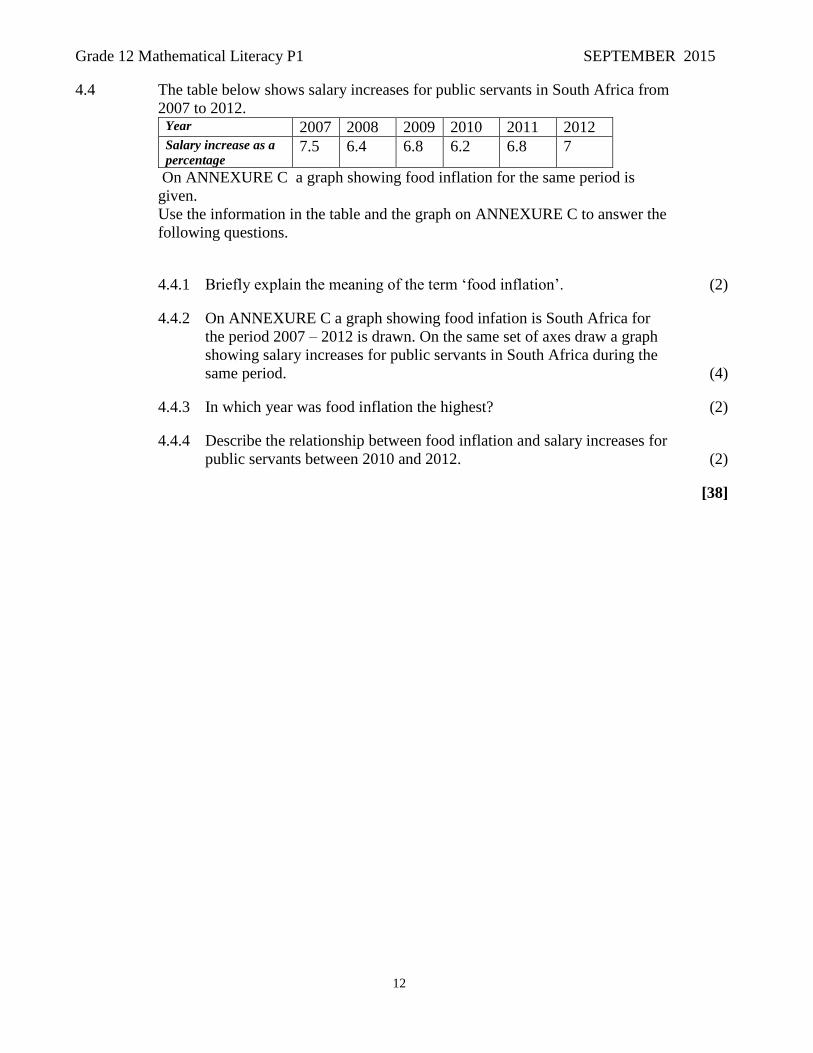
4.3
A comparison of monthly salaries of call centres between urban and rural areas was
done by comparing monthly salaries of two call centres, one in Cape Town and one in
Worcester. A sample of monthly salaries for the two call centres are given below. The
accompanying box-and- whisker plot shows monthly salaries for both centres.
Worcester: 4 200; 4 320; 4 500; 4 650; 4 650; 4 650; 5 500; 5 650; 7 250
Cape Town: 5 600; 5 650; 6 250; 6 250; 6 250; 6 300; 7 800; 8 200; 8 900
Use the information on salaries for the call centres and the box-and-whisker
plots to answer the following questions.
4.3.1 Which call centre does box-and-whisker plot B represent? (2)
4.3.2 Determine the value of Quartile number 3 (Q3) for the Worcester call
centre. (2)
4.3.3 Calculate the interquartile range of the Cape Town call centre. (2)
4.3.4 Write TWO statements comparing the rural and urban salaries at call
centres. (4)
Grade 12 Mathematical Literacy P1 SEPTEMBER 2015
12
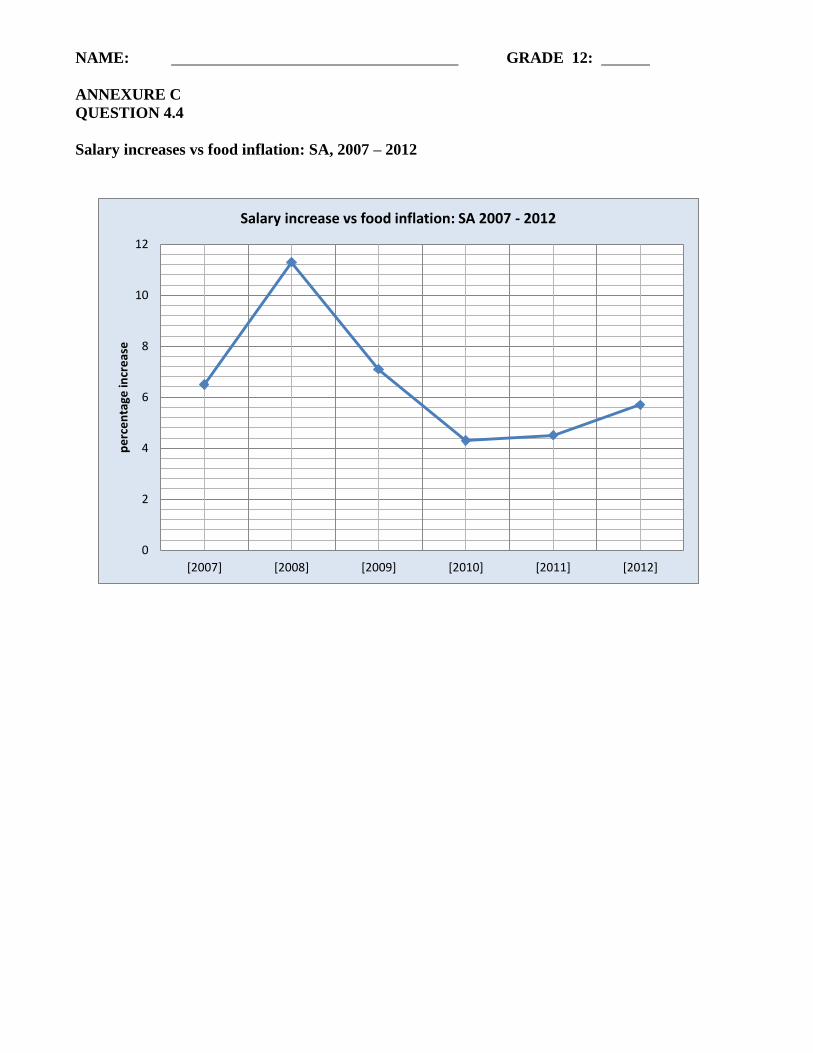
4.4 The table below shows salary increases for public servants in South Africa from
2007 to 2012. Year 2007 2008 2009 2010 2011 2012 Salary increase as a
percentage 7.5 6.4 6.8 6.2 6.8 7
On ANNEXURE C a graph showing food inflation for the same period is
given.
Use the information in the table and the graph on ANNEXURE C to answer the
following questions.
4.4.1 Briefly explain the meaning of the term ‘food inflation’. (2)
4.4.2 On ANNEXURE C a graph showing food infation is South Africa for
the period 2007 – 2012 is drawn. On the same set of axes draw a graph
showing salary increases for public servants in South Africa during the
same period. (4)
4.4.3 In which year was food inflation the highest? (2)
4.4.4 Describe the relationship between food inflation and salary increases for
public servants between 2010 and 2012. (2)
[38]

Grade 12 Mathematical Literacy P1 SEPTEMBER 2015
13
QUESTION 5 [23]
5.1
Nomsa applied for a personal loan at a local bank to start her own business. Use the information
below to answer the questions that follow:
5.1.1 What is the total amount of the loan? (2)
5.1.2 What will her monthly instalment be? (2)
5.1.3 For how many years will she pay off this loan? (2)
5.1.4 Show how the total repayable amount was calculated as R142 194,00. (3)
5.1.5 Calculate the total of interest, fees and credit life insurance added to this
loan. (3)
Grade 12 Mathematical Literacy P1 SEPTEMBER 2015
14
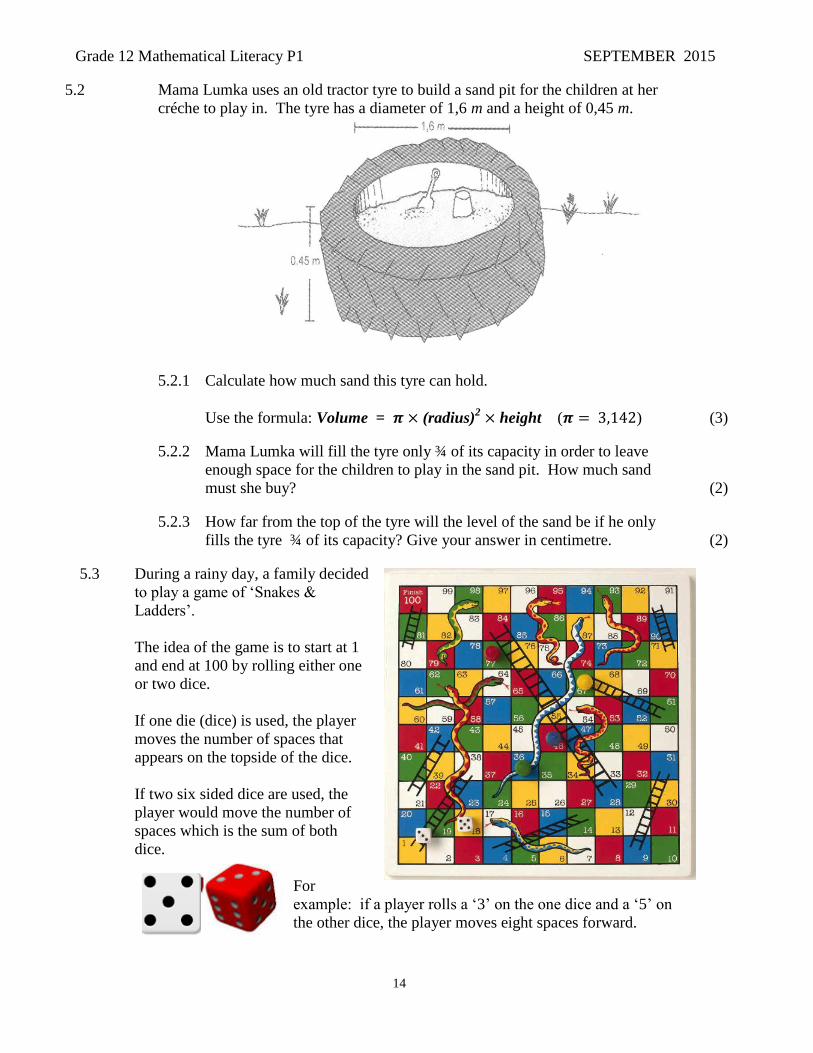
5.2 Mama Lumka uses an old tractor tyre to build a sand pit for the children at her
créche to play in. The tyre has a diameter of 1,6 m and a height of 0,45 m.
5.2.1 Calculate how much sand this tyre can hold.
Use the formula: Volume = 𝝅 × (radius)2 × height (𝝅 = 3,142) (3)
5.2.2 Mama Lumka will fill the tyre only ¾ of its capacity in order to leave
enough space for the children to play in the sand pit. How much sand
must she buy? (2)
5.2.3 How far from the top of the tyre will the level of the sand be if he only
fills the tyre ¾ of its capacity? Give your answer in centimetre. (2)
5.3 During a rainy day, a family decided
to play a game of ‘Snakes &
Ladders’.
The idea of the game is to start at 1
and end at 100 by rolling either one
or two dice.
If one die (dice) is used, the player
moves the number of spaces that
appears on the topside of the dice.
If two six sided dice are used, the
player would move the number of
spaces which is the sum of both
dice.
For
example: if a player rolls a ‘3’ on the one dice and a ‘5’ on
the other dice, the player moves eight spaces forward.

Grade 12 Mathematical Literacy P1 SEPTEMBER 2015
15
5.3.1
If the game was played with one dice, determine the probability of Peter
rolling a ‘5’ on the dice. (2)
5.3.2
When playing with two dice, what is the probability of Peter landing on
number 37 if he is currently on number 36? Explain your answer. (2)
[23]
TOTAL:150
Grade 12 Mathematical Literacy P1 SEPTEMBER 2015
16
NAME: GRADE 12:
ANNEXURE A
QUESTION 1.4.6
Number of cakes
Am
ou
nt
in R
an
d (
R)
Expenditure
ANNEXURE B
QUESTION 3.1
NAME: GRADE 12:
ANNEXURE C
QUESTION 4.4
Salary increases vs food inflation: SA, 2007 – 2012
0
2
4
6
8
10
12
[2007] [2008] [2009] [2010] [2011] [2012]
pe
rce
nta
ge in
cre
ase
Salary increase vs food inflation: SA 2007 - 2012