Embed Size (px)
Citation preview

Commonality in Liquidity: Evidence from the First Transatlantic Exchange
Pankaj Jain Department of Finance, Insurance and Real Estate
The University of Memphis U.S. Securities and Exchange Commission
Email: [email protected]
Mohamed Mekhaimer Department of Finance, Insurance and Real Estate
The University of Memphis Email: [email protected]
Sandra Mortal
Department of Finance, Insurance and Real Estate The University of Memphis
Email: [email protected]
This Draft: January 2014
Comments/Corrections welcome
Abstract
In this paper, we use the introduction of the first transatlantic exchange, NYSE Arca Europe
(NAE), to examine the impact of transatlantic trading on commonality in liquidity. We find that
transatlantic trading bring up a new source of commonality in liquidity, after controlling for
home market co-movement. Using a control sample, we show that the new source of
commonality cannot be attributed to regional or market-specific factors. The results reveal that
the magnitude of common liquidity factor for NAE market is greater than the respective home
market common factor. We also show that co-movement with NAE deceases with the firm size.
Keywords: Commonality in Liquidity, Multi-Market Trading, Stock Market Integration, NYSE
Arca Europe, NYSE-Euronext.
JEL Classification: G11, G12, G14

1. Introduction
The evolution of competition and integration of financial markets in recent years
have shaken the stock exchange landscape, particularly in the USA and Europe0F
1. While
the words of former CEO of New York Stock Exchange John Thain “Every country has a
flag, an army and an exchange” were true ten years back, today, we have a different
landscape with international stock exchange groups such as NYSE-Euronext and
NASDAQ-OMX, London Stock Exchange-Borsa Italiana Groups, in addition to
Alternative Trading Systems (ATS) and Multi-lateral Trading Facilities (MTF) that are
powered, regulated and have staff and customers from different countries all over the
world. In such an integrated complex stock market environment, the significance of a
single physical national stock exchange has eroded significantly and multi-market trading
becomes more common. In this paper, we take advantage of the introduction of the first
transatlantic exchange, NYSE Arca Europe (NAE), to investigate the effect of multi-
market trading on commonality in liquidity1F
2.
We find that trading in multi-market trading setting bring up a new source of
commonality, in addition to the reported home market commonality (Chordia, Roll, and
Subrahmanyam 2000; Hasbrouck and Seppi 2001; Huberman and Halka, 2001; Kamara,
1 Aggarwal and Dahiya (2005) provide a discussion of the main drivers of world stock market integration. Shahrawat (2008) show that, only between 2005 and 2007 the global exchange market saw 15 major M&A deals, valued at $42 billion. He further states that the two common aspects of these transactions are the combination of exchanges across countries and the coming together of firms trading different products. About 33% of the 15 transactions were cross-border deals, and over 50% of them were between firms trading different products. 2 NYSE Arca Europe is a traditional Multi Trading Facility (MTF) that aims to extend the exchange's European reach beyond Euronext-listed securities to compete with pan-European MTFs. Before March 09, 2009, stocks traded in NAE were traded only on its home exchange. After March 2009, these stocks are traded not only on the home exchange, but also traded on NAE.
Lou and Sadka, 2008; Brockman, Chung and Perignon 2009, Corwin and Lipson 2011)2F
3.
Simply stated, changes in NYSE Arca Europe individual firm’s liquidity are significantly
influenced by a common liquidity factor in the transatlantic market NAE after controlling
for the home market co-movement. In addition, we find that firm size plays an important
role in commonality in liquidity. Consistent with Brockman, Chung and Perignon (2009)
we find that firm co-movement with NAE market wide liquidity decreases with firm size.
Moreover, the results reveal that, for most of the studied markets, the magnitude of
common liquidity factor for NAE market is greater than the respective home market
common factor. With respect to systematic liquidity risk, one can conclude that using the
home market portfolio only to assess the systematic liquidity risk does not capture the
true market portfolio that affect the systematic liquidity risk.
The introduction of the Multi-Lateral Trading Facility (MTF) NYSE Arca Europe
provides an ideal setting to answer our research questions. The market provides its
traders, for the first time, the opportunity to trade U.S. stocks during European trading
hours, along with other 12 European countries in the same market3F
4. Before March 09,
2009, stocks traded in NAE were traded only on its home exchange, while, after March
2009 these stocks are traded not only on the home exchange but also traded on NAE. In
addition, NAE is fully integrated with NYSE- Euronext systems. Existing NYSE
Euronext members can trade on the same platform simply by extending their
3 Current literature on multi-market trading focuses on either the market quality of traded stocks or the distribution of trading volume among competing markets (Pagano 1989; Chowdry and Nanda 1991; Baruch, Karolyi and Lemmon 2007; Menkveld 2008; Moulton and Wei 2009; Halling, Moulton and Panayides 2013). However, to date, our knowledge lacks any empirical evidence of how commonality in liquidity is affected by multi-market trading or changes in stock market design. 4 Section 3 provides, in more details, the institutional details of NYSE Arca Europe market.
1
membership4F
5. Such a unique setting enables us to also investigate whether the indirect
access given to NYSE and Euronext can add a new source of commonality to NAE
traded stocks. Our results suggest that commonality in liquidity of NAE traded stocks is
not affected by the indirect access of NYSE-Euronext traders.
Prior research suggests that market-specific factors are possible sources of
commonality in liquidity. For example Chordia, Roll and Subrahmanyam (2001) and
Brockman, Chung and Perignon (2009) show that unemployment and GDP
announcements have significant effects on commonality in liquidity. In addition, Karoyli,
Lee and van Dijk (2012) find that commonality in liquidity is high during periods of high
market volatility or large market decline5F
6. One of the key advantages of using NAE
setting is that it combines stocks from different countries that do not share the same
macro-economic and other market-specific factors. This means that we cannot simply
extrapolate the reported commonality to market specific factors6F
7. However, around 90%
of stocks traded in NAE are from Europe, which might reflect a regional source of
commonality, other than trading on NAE (Brockman, Chung and Perignon, 2009)7F
8. To
rule out this possibility, we construct a control sample of firms that is also listed in the
respective home stock exchange but not traded in NYSE Arca Europe market. Our results
5 NYSE, Euronext and NYSE Arca Europe are connected through the universal trading platform. In February 2008 NYSE Euronext began a two-year program to decommission of four platforms and create Universal Trading Platform (UTP) to support all of its markets. The ultimate goal of such project is that NYSE-Euronext, at the end, will have global network for both European and US customers. Appendices A and B show the integration process as well as the relationship between the three connected market NYSE, Euronext and NYSE Arca Europe. 6 The findings of Chordia, Roll and Subrahmanyam (2001), Brockman, Chung and Perignon (2009) and Karoyli, Lee and van Dijk (2012) are consistent with Bunnermeier and Pederson (2009) provide a model that links an asset’s market liquidity and traders’ funding constraints (i.e., the ease with which they can obtain funding). They predict that large market declines or high volatility would affect liquidity provision and hence increase commonality in liquidity. 7 In addition, we cannot attribute changes in liquidity commonality to factors such as common language, trading times, legal system and others because these factors were already in place before our main event. 8 Brockman, Chung and Perignon, (2009) document a regional co-movement in European stocks; however, they did not explain the source behind it.
2
confirm that only stocks traded in NAE show a significant liquidity co-movement with
NAE aggregate market liquidity.
Another possible explanation proposes that commonality in liquidity is primarily
driven by correlated trading behavior within groups of traders and the prevalent increase
in basket trading. Kamara, Lou and Sadka (2008) and Karoyli, Lee and van Dijk (2012)
provide empirical evidence that the increase in commonality in liquidity can be attributed
to the correlated trading decisions of institutional traders in the U.S. and international
stock market respectively. Consistent with these results, Corwin and Lipson (2011) also
show that commonality in liquidity is driven by program and institutional traders. In
addition, the model of Gorton and Pennacchi (1993) predicts that equity basket trading
increases the commonality in liquidity for the constitute stocks in the basket, but reduces
liquidity commonality for individually traded stocks. Kamara, Lou and Sadka (2008)
confirmed this prediction and find that index traders have increased the commonality in
liquidity in the US market.
Our results are consistent with the correlated trading behavior and basket trading
explanation. Using our experimental setting, we show that trading a basket of equity
stocks that are combined from 13 different countries, NAE market, add a new source of
commonality in liquidity, in addition to the home market liquidity co-movement. These
results support the prediction of Gorton and Pennacchi (1993) that basket trading increase
commonality in liquidity. Moreover, our results can also be attributed to the correlated
trading decisions of specific groups of traders (Kamara, Lou, and Sadka, 2008; Koch,
Ruenzi, and Starks, 2009; Corwin and Lipson, 2011; Karoyli, Lee and Van Dijk, 2012).
Although, NAE stocks do not share the same home market, location, macro-economic or
3

other market specific factors, they do share the same investors’ pool. This existence of a
common investors’ pool suggests that commonality in liquidity in NAE might be driven
by the correlated trading decisions of specific groups of traders8F
9.
Our analysis is closely related to Brockman, Chung and Perignon (2009) and
Karoyli, Lee and Van Dijk, (2012). Brockman, Chung and Perignon (2009) conduct a
comprehensive study of commonality in liquidity using data from 47 stock exchanges.
They find that firm-level changes in liquidity are significantly influenced by exchange-
level changes across most of the world’s stock exchange9F
10. Karoyli, Lee and Van Dijk,
(2012) examine the main drivers of commonality in liquidity in the international stock
market. They document that correlated trading behavior of international and institutional
investors and common investor sentiment are the main drivers of commonality in
liquidity. Although, both studies investigate the commonality in liquidity in the
international stock market, none of them have studied the effect of multi-market trading
on commonality in liquidity. In this paper we extend the empirical model of Chordia,
Roll, and Subrahmanyam (2000) to show that multi-market trading can add a new source
of commonality in liquidity.
Studying the determinants of commonality in liquidity is important for various
reasons. Systematic liquidity risk is priced i.e., stocks whose returns are more sensitive to
fluctuations in aggregate liquidity earn higher returns than stocks that exhibit lower
sensitivity (Brennan and Subrahmanyam, 1996; Pastor and Stambaugh, 2003; Acharya
9 We do not have data that will allow us to directly test the correlated trading behavior and determine the specific group of investors that drive commonality in liquidity. 10 Brockman, Chung and Perignon (2009) find evidence of a distinct global component in commonality in liquidity. They further show that both developed and emerging markets are susceptible to global commonality, although developed markets are more sensitive to liquidity spillover effects than are emerging markets. However, they do not test the multi-market trading environment or explain the source behind the global commonality component.
4

and Pedersen, 2005; Chen, 2005; Sadka, 2006). The commonality in liquidity the various
firms are exposed to has important implications on the optimal diversification strategy
and portfolio choices of investors (Longstaff, 2001 and 2005; Amihud, Mendelson, and
Wood 1990). Moreover, variations in systematic and total liquidity volatility affect the
ability of arbitrageurs and other traders to exploit and eliminate ‘‘mispricing’’ (see, e.g.,
Kamara, 1988; Amihud and Mendelson, 1991; Pontiff, 1996; Korajczyk and Sadka,
2004; Sadka and Scherbina, 2007).
2. Related Literature
The liquidity of a stock and how it evolves over time are of important concern to
many investors. Most of the early liquidity studies analyze firm-specific determinants of
liquidity. This line of research has shown that variations in price, volume, and volatility
explain much of the cross-sectional of stock market liquidity (Benston and Hagerman,
1974; Stoll, 1978; Barclay and Smith, 1988; Brockman and Chung, 1999). Liquidity is
more than just an attribute that belongs to a single asset. According to Amihud and
Mendelson, 1986; Brennan and Subrahmanyam, 1996; Liu, 2006, investors prefer assets
that are either liquid or assets that are not exposed to systematic liquidity risk. Other
studies find that a stock’s exposure to systematic liquidity risk and whether its liquidity
dries up at inopportune times matter for investors (e.g., Pastor and Stambaugh, 2003;
Acharya and Pedersen, 2005; Sadka, 2006; Korajczyk and Sadka, 2008; Lee, 2011).
It is now widely accepted that the liquidity changes over time and these time
variations are governed by a significant common component in the liquidity across assets.
Chordia, Roll, and Subrahmanyam 2000; Hasbrouck and Seppi 2001; Huberman and
Halka, 2001; Kamara, Lou and Sadka, 2008; Corwin and Lipson 2011; demonstrate that
5

liquidity has a common systematic factor in US market. In addition, there is also number
of papers that document the existence of commonality in liquidity in the international
context (Domowitz, Hansch and Wang, 2005; Brockman, Chung and Perignon, 2009;
Karoyli, Lee and van Dijk, 2012). Commonality in liquidity gains in importance because;
systematic liquidity variation is a priced source of risk. Amihud and Mendelson, (1986)
Brennan and Subrahmanyam, (1996) Pastor and Stambaugh (2003), Acharya and
Pedersen (2005), Chen (2005), and Sadka (2006) provide evidence of a premium for
systematic liquidity risk (Stocks whose returns are more sensitive to fluctuations in
aggregate liquidity earn higher returns than stocks that exhibit lower sensitivity).
There are several reasons why the evolution of systematic liquidity across firms is
an interesting topic of financial research. First, the divergence of liquidity in the cross
section of firms has important implications for the ability to diversify return volatility and
aggregate liquidity shocks across firms. Longstaff (2001 and 2005) show that asset
illiquidity has a significant effect on the optimal portfolio choices of investors leading
them to abandon diversification strategy. Second, it has implications for the efficient
functioning of financial markets: Amihud, Mendelson, and Wood (1990) find that sudden
unanticipated declines in liquidity have played a key role in the stock market crash of
October 1987. Third, variations in (systematic and total) liquidity volatility affect the
ability of arbitrageurs and derivative traders to exploit and eliminate ‘‘mispricing’’ (see,
e.g., Kamara, 1988; Amihud and Mendelson, 1991; Pontiff, 1996; Mitchell and Pulvino,
2001; Lesmond, Schill, and Zhou, 2004; Korajczyk and Sadka, 2004; Sadka and
Scherbina, 2007). Last, since liquidity is associated with the price discovery process and,
can thus affect the systematic and idiosyncratic volatility of stock returns (O’Hara, 2003),
6
our study may also have implications for the recently documented pricing of idiosyncratic
return volatility (Goyal and Santa-Clara, 2003; Ghysels, Santa-Clara, and Valkanov,
2006; Ang, Hodrick, Xing, and Zhang, 2006).
Several alternative explanations for commonality in liquidity have been proposed
in literature. First, commonality in liquidity could be driven by style investing. Barberis
and Shleifer (2003) develop a model of asset prices where some investors categorize
assets into different styles, moving funds between style categories based on relative
performance. This type of style investing leads to common factors in the order flow of
securities within the same style and reduces the correlations between stocks in different
styles. Barberis and Shleifer suggest that style investing provides a reasonable
explanation for many empirical findings related to commonality. A second explanation is
based on habitat investing, as described in Lee, Shleifer, and Thaler (1991). They argue
that some securities maybe held by only particular subsets of investors. As the sentiment
or risk preferences of these investors change, their resulting trades may lead to common
factors in the order flow of the securities they hold.
Notably, style and habitat-based explanations suggest that common factors reflect
correlated trading decisions within specific groups of traders. Kamara, Lou, and Sadka
(2008) provide evidence that the increase in commonality in liquidity among U.S. large
cap stocks in particular over the past 25 years can be attributed to the increasing
importance of institutional and index related trading for these stocks, consistent with
Gorton and Pennacchi’s (1993) result that basket trading increases commonality. Koch,
Ruenzi, and Starks (2009) also show that stocks with higher mutual fund ownership and
stocks owned by mutual funds with high turnover or funds that experience liquidity
7

shocks exhibit greater commonality in liquidity. The intuition is that growing institutional
ownership may give rise to correlated trading across stocks, which, in turn, creates
common buying or selling pressure and thus higher levels of common variation in
liquidity. Consistent with the previous arguments Corwin and Lipson (2011) find that
program trades and other institutional trades are the primary drivers of commonality in
order flow. Their results suggest that commonality is driven by the correlated trading
decisions of professional traders, as executed through program trades, and not by
correlated trading among retail traders.
On the other hand, Previous literature suggests that commonality in liquidity may
be driven by funding constraints of financial intermediaries. For example, Brunnermeier
and Pederson (2009) predict that large market declines or high volatility adversely affect
the funding liquidity of financial intermediaries that act as liquidity suppliers of financial
markets. As a consequence these intermediaries reduce the provision of liquidity across
many securities, which results in a decrease in market liquidity and increase in
commonality in liquidity. Coughenour and Saad (2004) argue that common market
makers, induce common liquidity movements because they share the same firm share
capital and information, the manner which they provide liquidity is likely to be
correlated. Their evidence indicates that individual stock liquidity co-varies with
specialist portfolio liquidity, unique from information causing the co-variation with
market liquidity. However, liquidity provision is not limited to market-makers, as
investors on both the buy and sell sides can choose to either provide liquidity in the form
of limit orders or take liquidity in the form of market orders. As a result, commonality in
liquidity may be driven by both the direction of trade and the type of order decision. This
8

idea is formalized by Domowitz, Hansch, and Wang (2005); they show that return
commonality is driven by order flow while liquidity commonality is driven by order type.
3. Institutional details
Stock exchanges are now increasingly changing their business model and
restructuring themselves across the world due to the simultaneous convergence of a
number of powerful developments. The most notable of these developments has been the:
(i) rapid advancement and innovation in technology that has facilitated trading access and
speed; (ii) growing market competition and integration; (iii) regulatory changes that
enhance competition and transparency of the stock markets such as RegNMS, RegATS in
the US, and MiFID I and MiFID II in Europe.
Together these developments have eroded the significance of physical national
stock exchanges and their trading floors. The market pressure to cut costs and become
more competitive have forced stock exchanges, across the globe, to think more in
strategic moves to expand its activities into different geographical markets and to provide
their customers with range of financial products. Consequently, exchanges are now
reinventing their business strategy, through stock market exchange mergers and
consolidation to enhance its competitive position. In this paper, we furnish a better
understanding of how multimarket trading and changes in stock design can affect the
systemic liquidity risk. In this paper we use the introduction of the Multi-lateral Trading
Facility (MTF) NYSE Arca Europe (NAE) in 2009 and the indirect access of NYSE and
Euronext through the Universal Trading Platform (UTP) as exogenous events to examine
the dynamics of commonality in liquidity.
9
3.1. NYSE and Euronext Merger
The New York Stock Exchange’s (NYSE’s) $11billion acquisition of Euronext
gave the group control of several major markets in Europe and US, supported by four
underlying trading platform: Arca (for Arca stocks and Arca derivatives) and traditional
NYSE order book in the US, the Nouveau Systeme de Cotation (NSC) supporting the
Euronext markets and Liffe Connect for the derivative market. In February 2008 NYSE
Euronext began a two-year program to decommission these four platforms and create
Universal Trading Platform (UTP) to support all of its markets. The ultimate goal of such
project is that NYSE-Euronext, at the end, will have global network for both European
and US customers. This means that from one single connection, customers will be able to
access all NYSE Euronext trading and market data services. Appendix B figure 1 shows
the consolidation process of NYSE-Euronext group.
Developing one platform that is sufficiently flexible to suit a different exchange's
global needs is an audacious plan. As for the construction of the UTP, Euronext may
have been NYSE's biggest single corporate transaction, but it was only part of a strategy
to build scale and technology capabilities through acquisition. A few weeks after the
closure of the Euronext deal in April 2007, NYSE acquired TransactTools, a provider of
enterprise messaging, in mid-2008, it acquired Wombat Financial Software, a market data
distribution technology provider, all of this in addition to acquiring Archipelago, in 2006,
for handling high-volume trading. According to Exchange officials, the UTP brings
together the fruits of all of those acquisitions to present customers with a more
competitive global offering. The result of that best-of-breed approach is a platform that
can delivers latency of 150-400 microseconds, with sub-millisecond round-trip times
10
available to customers in co-location with the search engine. The UTP Capacity is able to
handle 100,000 orders per second. Appendix (B) figure 2 shows the key components of
the universal trading platform.
3.2. Introduction of NYSE-Arca Europe
NYSE-Euronext decides to roll out the UTP to Europe first because competition
is developing faster in that market and they need to have the best platform to compete for
market share. As UTP rolls out across the Atlantic to the US markets, the European
division of NYSE Euronext focused on extending the use of UTP and introduces a new
major venture “NYSE Arca Europe”. NYSE Arca Europe is a more traditional Multi
Trading Facility (MTF) that aims to extend the exchange's European reach beyond
Euronext-listed securities to compete with pan-European MTFs. According to Roland
Bellegarde, NYSE- Euronext group executive vice president and head of European
execution for the cash markets, connectivity will be the unique selling point for NYSE
Arca Europe. The conjecture of bringing a complete set of connectivity is to provide all
existing customers, who are already connected to the regulated market, with a new
connection to NYSE Arca Europe using the same platform. NYSE Arca Europe will have
limbs in multiple jurisdictions. Powered by the UTP in Paris, it will be regulated in the
Netherlands with staff and customers in London. The key strategy of adding the new
venture, NYSE Arca Europe is to leverage on existing technology and connectivity, in
addition to finding ways of providing innovation and competitive advantages.
NYSE Arca Europe extends the trading scope of NYSE-Euronext group of
regulated markets by adding blue-chip stocks from Austria, Czech Republic, Denmark,
Finland, Germany, Hungary, Ireland, Italy, Norway, Spain, Sweden, Switzerland, United
11
Kingdom and United States. NYSE Arca Europe is fully integrated with NYSE Euronext
systems; it is accessible through the SFTI global network. Existing NYSE Euronext
members can trade on the same platform simply by extending their membership.
The impacts of such stock exchange restructuring are largely unknown. There are
many aspects of interest in such an analysis, both economic and regulatory issues which
affect investors, firms, financial intermediaries and the overall economy. Thus, any
profound study of the effects of stock exchange merger is bound to be selective and
incomplete in its coverage. We find the introduction of NYSE-Arca Europe event is a
great opportunity to investigate how the changes commonality in liquidity resulted from
trading in NAE and sharing the same trading system with NYSE and Euronext.
4. Data and Methodology
We compile data from Thomson Reuters DataStream; we collect daily total return
index (RI), the trading volume (VO; expressed as thousands of shares), the daily-adjusted
price (P; in local currency), Number of shares outstanding (NOSH), and Market value
(MV) for individual stocks from their home stock exchange. We use the instrument list
available at NYSE website to determine stocks traded in NYSE Arca Europe10F
11. Our
sample starts with 1009 firms from 15 European and American stock exchanges. We
exclude securities from our sample if the exchange code in NYSE Arca Europe
instrument list does not match the exchange code in DataStream database11F
12. We end up
11 NYSE Arca Europe instrument list is available at the following link: https://europeanequities.nyx.com/markets/nyse-arca-europe. The data set includes Security name, Country Issuer, Country Code, Currency, Primary Market and International Securities Identification Number (ISIN). 12 Karolyi, lee and Dijk (2012) exclude depository receipts (DRs), real estate investment trusts (REITs), preferred stocks, investment funds and other stocks with special features. Robustness confirms are not affected by removing stock with special features such as REITs. Following Karolyi, lee and Dijk (2012) we also include dead stocks in the sample to limit the effect of survivorship bias.
12
with a final sample of 995 securities from 15 different exchanges. Our sample covers the
period of January 2005 till December 2012.
Following Ince and Porter (2006) who call for caution in handling data errors in
Datastream, we adopt the following screening. We discard daily observations with
trading volume VOi,t that are greater than number of sharesNOSHi,t. We set daily return
to missing if the value of the total return index is below 0.01. In addition, we also discard
stock –day observations if:
�1 + Ri,t� × �1 + Ri,t−1� − 1 ≤ 0.5 Equation (1)
Where Ri,t and Ri,t−1 are the stock return of firm i in day t and t-1, respectively, and at
least one is greater than or equal 300%. Moreover, we winsorize the daily observations in
top or the bottom 1% to remove the effect of extreme values.
4.1. Commonality in Liquidity
We use daily turnover and Amihud (2002) liquidity measure as our main proxy of
stock market liquidity. Empirical research evidence from the U.S indicates that this
measure is strongly positively related to microstructure estimates of illiquidity, including
the bid-ask spread, price impact and fixed trading costs. Goyenko, Holden and Trzcinka
(2009) investigate to what extent different liquidity measures capture the high frequency
measures of transaction costs based on U.S data. The Amihud performs well relative to
other proxies. In addition Hasbrouck (2009) reports that Amihud is the most strongly
correlated measure with TAQ high frequency price impact coefficients. For international
context, Lesmond (2005) show that Amihud measure has a high correlation with bid-ask
spread in 23 emerging markets. An important advantage of Amihud illiquidity that we
can calculate based on daily data. Karoyli, Lee and Van Dijk (2012) use the Amihud to
13
investigate the time series variation in commonality in the liquidity of individuals stocks
around the world.
Many empirical studies rely on the Amihud liquidity measure to capture
systematic liquidity risk and even commonality in liquidity among stocks. Acharya and
Pedersen (2005) employ the measure in their investigation of the role of liquidity risk in
asset prices. Watanabe and Watanabe (2008) use Amihud liquidity to uncover time
variation in liquidity betas and the liquidity risk premium. Avramov, Chordia and Goyal
(2006) use it in their analysis of the relation between liquidity and short-run stock return
reversals.
We follow Karoyli, Lee and Van Dijk (2012) to calculate Amihud liquidity
measure. We add a constant to the Amihud measure and take logs, to reduce the impact
of outliers. We also multiply the result by -1 to arrive at a variable that is increasing in
the liquidity of individual stocks. We calculate Amihud illiquidity measure using the
following equation.
𝐴𝑚𝑖ℎ𝑢𝑑𝑖,𝑑,𝑡 = −𝐿𝑜𝑔(1 + 𝑅𝑖,𝑑,𝑡𝑃𝑖,𝑑,𝑡 𝑉𝑂𝑖,𝑑,𝑡
) Equation (2)
where 𝐿𝑖𝑞𝑢𝑖𝑑𝑖𝑡𝑦𝑖,𝑑 is the Amihud liquidity proxy, 𝑅𝑖,𝑑,𝑡 is the return in local currency,
𝑃𝑖,𝑑,𝑡 is the price in local currency, and 𝑉𝑂𝑖,𝑑,𝑡 is the trading volume. The subscript i is
for the trader security, d is the domestic market and t is day t.
In addition, we construct a daily turnover measure for stock i on day t, using the
following equation.
𝑇𝑢𝑟𝑛𝑜𝑣𝑒𝑟𝑖,𝑑,𝑡 = 𝐿𝑜𝑔(1 + 𝑉𝑂𝑖,𝑑,𝑡𝑁𝑂𝑆𝐻𝑖,𝑦
) Equation (3)
where 𝑇𝑢𝑟𝑛𝑜𝑣𝑒𝑟𝑖,𝑑,𝑡 and 𝑉𝑂𝑖,𝑑,𝑡 are the daily turnover and trading volume stock i on the
domestic market d and day t. 𝑁𝑂𝑆𝐻𝑖,𝑦 is the number of shares outstanding at the
14
beginning of the year y. We measure turnover in logs to account for non-stationarity. A
similar approach has been used by, among others, Karoyli, Lee and Van Dijk (2012) and
Griffin, Nardari and Stulz (2007). We winsorize the daily observations in top or the
bottom 1% to remove the effect of extreme values.
In this study we investigate the effect of the introduction of NYSE Arca Europe
Multi-Trading facility and sharing the Universal Trading platform with big established
markets such as NYSE and Euronext on the dynamics and changes commonality in
liquidity. Our analysis is divided into two main empirical tests. In the first test we
examine the relative change of commonality in liquidity for home versus NYSE Arca
Europe markets. The test aims to examine whether commonality in liquidity has a natural
boundary at the home exchange frontier, or whether it spills over onto others exchanges.
Before March 09, 2009, stocks traded in NAE were traded only on its home market.
The introduction of NYSE Arca Europe a secondary market is a great opportunity
to investigate the changes in the dynamic of commonality in liquidity. The stocks traded
in NAE are from 13 different countries that do not share the same market characteristics;
this cross-sectional variation helps rule out the effect macro-economic or other market
specific sources of commonality. In addition, changes commonality in liquidity cannot be
traced to factors such as common language, common trading times, common legal system
and others because these factors were already in place before the event. However, we
suggest that stock market integration and multimarket trading might provide a possible
source of illiquidity risk that is not been studied before.
This line of inquiry is highly connected to Brockman, Chung and Perignon (2009)
that suggests that there is a global component in the total commonality in liquidity in
15
addition to the local commonality.12F
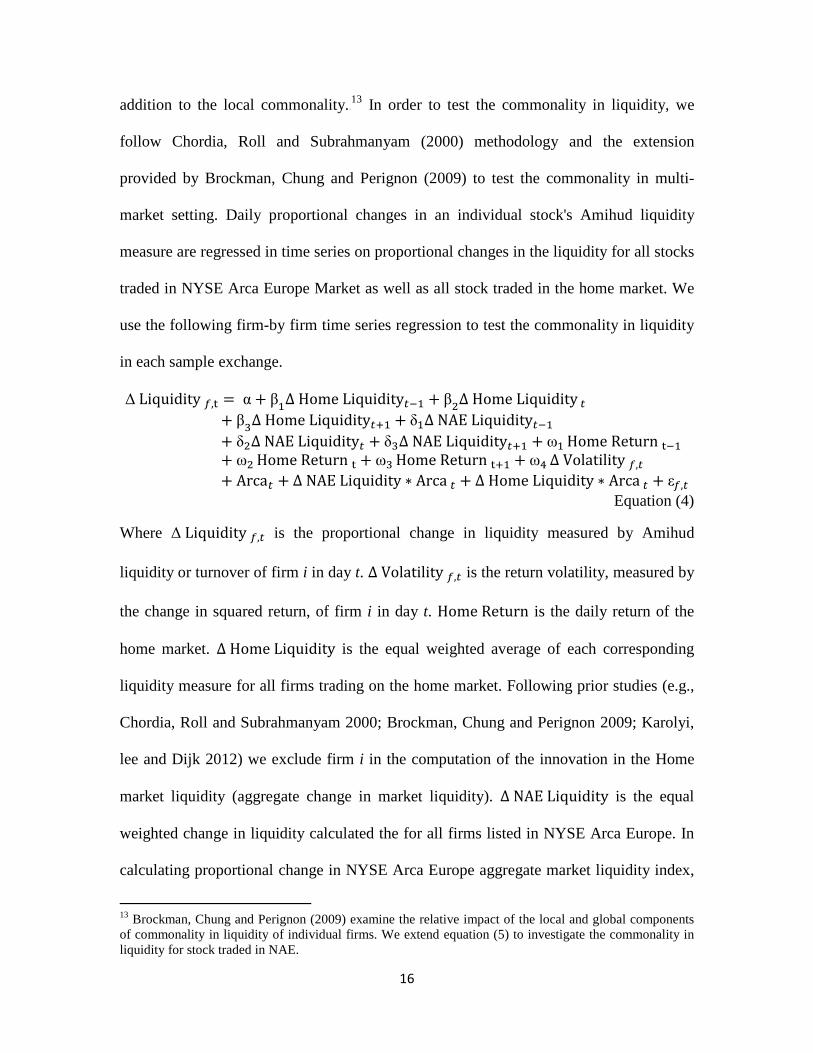
13 In order to test the commonality in liquidity, we
follow Chordia, Roll and Subrahmanyam (2000) methodology and the extension
provided by Brockman, Chung and Perignon (2009) to test the commonality in multi-
market setting. Daily proportional changes in an individual stock's Amihud liquidity
measure are regressed in time series on proportional changes in the liquidity for all stocks
traded in NYSE Arca Europe Market as well as all stock traded in the home market. We
use the following firm-by firm time series regression to test the commonality in liquidity
in each sample exchange.
Δ Liquidity 𝑓,t = α + β1∆ Home Liquidity𝑡−1 + β2∆ Home Liquidity 𝑡+ β3∆ Home Liquidity𝑡+1 + δ1∆ NAE Liquidity𝑡−1+ δ2∆ NAE Liquidity𝑡 + δ3∆ NAE Liquidity𝑡+1 + ω1 Home Return t−1+ ω2 Home Return t + ω3 Home Return t+1 + ω4 ∆ Volatility 𝑓,𝑡+ Arca𝑡 + ∆ NAE Liquidity ∗ Arca 𝑡 + ∆ Home Liquidity ∗ Arca 𝑡 + ε𝑓,𝑡
Equation (4)
Where Δ Liquidity 𝑓,𝑡 is the proportional change in liquidity measured by Amihud
liquidity or turnover of firm i in day t. ∆ Volatility 𝑓,𝑡 is the return volatility, measured by
the change in squared return, of firm i in day t. Home Return is the daily return of the
home market. ∆ Home Liquidity is the equal weighted average of each corresponding
liquidity measure for all firms trading on the home market. Following prior studies (e.g.,
Chordia, Roll and Subrahmanyam 2000; Brockman, Chung and Perignon 2009; Karolyi,
lee and Dijk 2012) we exclude firm i in the computation of the innovation in the Home
market liquidity (aggregate change in market liquidity). ∆ NAE Liquidity is the equal
weighted change in liquidity calculated the for all firms listed in NYSE Arca Europe. In
calculating proportional change in NYSE Arca Europe aggregate market liquidity index,
13 Brockman, Chung and Perignon (2009) examine the relative impact of the local and global components of commonality in liquidity of individual firms. We extend equation (5) to investigate the commonality in liquidity for stock traded in NAE.
16
we exclude all firms listed in (NAE) from the home market to avoid double counting of
firms. Arca is a dummy variable for the date of NYSE Arca Europe market start trading
using UTP, that takes the value 0 for all dates before UTP and 1 afterwards.
∆ NAE Liquidity ∗ Arca is the interaction terms between the Arca variable and the
contemporaneous proportional change in liquidity index for NYSE Arca Europe.
Home Liquidity ∗ Arca is the interaction term between the Arca and the
contemporaneous proportional change in liquidity for the home market.
Following Chordia, Roll and Subrahmanyam (2000) and Brockman, Chung and
Perignon (2009), we include one lead and one lag of the home and NYSE Arca Europe
market average liquidity plus the contemptuous, leading and lagged home market return
and the contemptuous change in individual stocks. The lead and lags are deigned to
capture any lagged adjustment in commonality, while the market return is intended to
remove spurious dependence induced by an association between returns and liquidity
measures. Finally the squared stock return is included to account for stock market
volatility.
4.1.1. Control Sample
It is important to note that different trends in commonality in liquidity across
stocks may of course be unrelated to being traded in multimarket setting or the market
integration events. In other words, it need to be quantified whether these events are
directly associated with any possible changes in the dynamic of commonality in liquidity.
To investigate this issue we construct a control sample of firms that is also listed in the
home stock exchange but not traded in NYSE Arca Europe market. This approach allows
us to rule out the possibility that the observed changes in commonality in liquidity are
17
due to macro-economic variables or other unobserved trends. For example, if the
integration and multimarket setting events are truly influential, one should expect that
NAE traded firms to react more strongly to the events than other home exchange firms
that are not traded in NYSE Arca Europe. The control sample is constructed based on the
nearest average of Amihud liquidity measure for the period before the launch of NYSE
Arca Europe on March 9 of 200913F
14. Table one present descriptive statistics for both the
original and control sample.
4.2. Excluding London firms
London stock exchange has 387 traded in NYSE Arca Europe. This might be a
possible cause of the commonality in liquidity in the transatlantic exchange. To forestall
this possibility, we recreate NYSE Arca Europe index to include all firms traded under
the NAE excluding firms listed in London stock exchange. By removing these firms we
rule out the possibility that commonality in liquidity is actually caused by a set of firms
and not because the transatlantic exchange.
4.3. Firm size and commonality in liquidity.
Chordia, Roll and Subrahmanyam (2000) documents that smaller stocks are less
sensitive to market-wide shocks in spreads in the US market. On the other hand,
Brockman Chung and Perignon global commonality in liquidity contrast sharply the
results of the US market. They find that second-smallest firm size quintile have the
highest sensitivity to commonality in liquidity. We participate in this debate by
investigating the relation between firm size and commonality in liquidity in NYSE Arca
14 We also tried matching sample based on the nearest average of Amihud liquidity measure and the Market value at the year of the event 2009 and our results are the same.
18
Europe. For each exchange, we divide NYSE Arca Europe traded stocks into 10 size-
deciles based on the market value in, the year of the event, 2009.
5. Empirical Results
5.1. Descriptive statistics
Table 1 presents descriptive statistics for stocks traded on NYSE Arca Europe and
respective statistics of the control sample. Our sample consists of 995 firms from 15
different stock exchanges. We report, for each sample exchange, the name, country,
number of firms traded in NAE, the average of Amihud (2002) liquidity measure,
Proportional change in Amihud, daily turnover and proportionate change in daily
turnover. All averages are calculated over the period of January 2005 till December 2012.
By construction, Amihud liquidity measure is negative with greater value indicating a
greater liquidity. It is important to note that the direct comparison of level of Amihud
liquidity measure is not possible because of the differences in currency units across
countries. However, for the regression analysis, we have used the proportionate changes
in Amihud to measure the co-movement in liquidity that makes the comparison possible.
The number of actively traded stocks varies from a low of 8 stocks from Prague
stock exchange to a high of 387 stocks from London stock exchange. We combine
exchanges that have less than 20 stocks traded in NAE in the others category. It includes
18 firms from NASDAQ, 17 firms from Dublin stock exchange, 15 firms Budapest stock
exchange and 8 firms from Prague stock exchange. To account for other factors that
might affect stock market commonality, we create a control sample based on our variable
of interest, proportionate change in daily turnover and the change in Amihud (2002)
liquidity measure. To make the sample of stocks traded and untraded in NAE more
19

comparable, we match them based on exchange, and nearest average of proportionate
change in liquidity measure. The average proportionate change of the liquidity measure is
calculated based on the period before the launch of NAE, from January 2005 to March
2009.
Insert Table 1
5.2. Commonality in liquidity
The trading of shares of the same firm in multiple markets has become common
over time and expanded very fast over last few years in Europe. As more shares of the
same firm are traded in multiple markets, it is increasingly important for traders,
policymakers, market operators and issuers to understand the possible consequences of
the Multi-trading decision. The main purpose of this paper is to help market participants
to understand how changes in market design can affect liquidity co-variation, shed more
light on diversification challenges that face stock market participants and enable them to
bear systematic illiquidity risk with greater efficiency. Previous literature provides
evidence of a premium for such a systematic liquidity risk (Amihud and Mendelson,
1986; Brennan and Subrahmanyam, 1996; Pastor and Stambaugh, 2003; Acharya and
Pedersen, 2005; Chen 2005; and Sadka 2006).
In this section we present the regression analysis for the commonality in liquidity
for stocks traded in NAE. We extend the empirical model of Chordia, Roll and
subrahmanyam (2000) to investigate the commonality in liquidity in a multi-trading
environment as discussed in section (4). To test our main hypothesis, daily proportional
changes in an individual stock's liquidity measure are regressed in time series on
proportional changes in the liquidity for all stocks traded in NYSE Arca Europe Market
as well as all stock traded in the home market. In table 1, each column shows the cross-
20
sectional averages of time series slope coefficients with t-statistics in parentheses for each
sample exchange. Our main variable of interest is the interaction term between the NYSE
Arca Europe of the concurrent change in equal weighted average of our liquidity measure
and the Arca dummy variable. A positive and significant coefficients would mean that
NAE market liquidity exert a substantial influence on firm f’s liquidity.
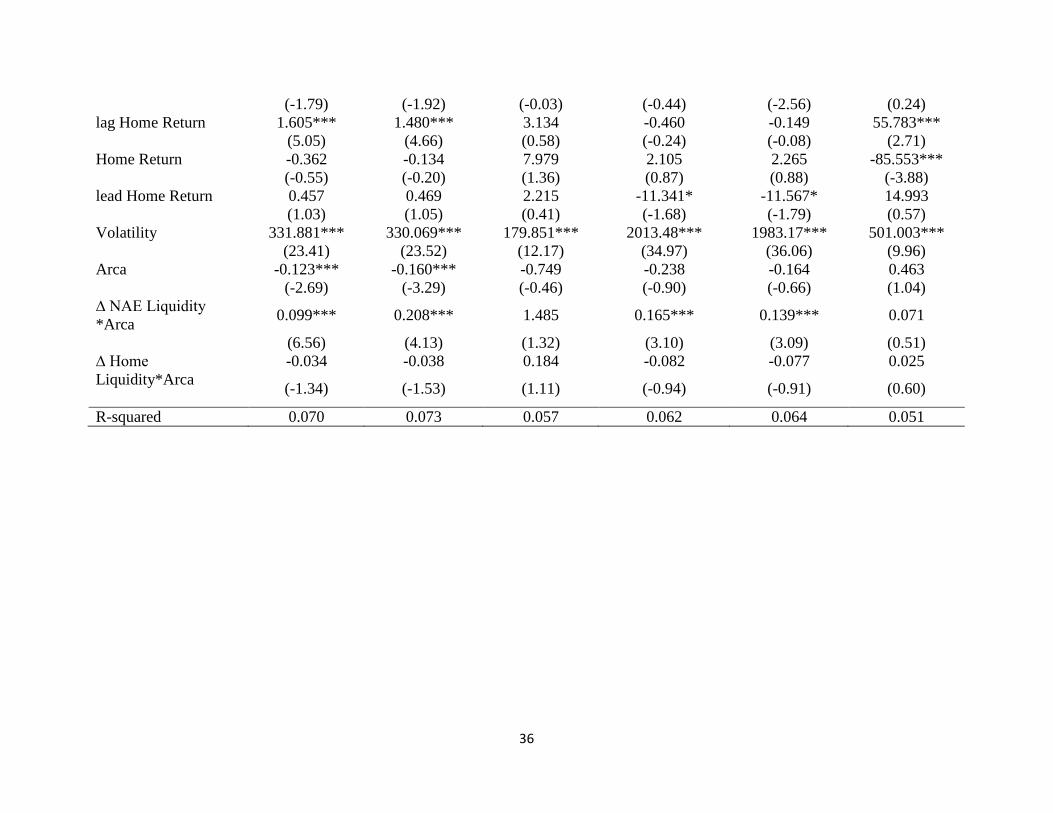
Insert Table 2
Our results show that the interaction term is positive and significant for the whole
sample of firms traded under the transatlantic exchange. Both daily turnover and Amihud
(2002) liquidity measures show positive and significant coefficients for the interaction
term between the change in NAE liquidity and the Arca dummy variable. These results
show that transatlantic trading brings a new source of commonality to firms traded, in
addition to the home market commonality. In model two we excluded all firms that are
listed in London stock exchange. Our results are still robust and consistent which means
that London firms do not dominate the NAE index. We run the same model for the
control sample to investigate whether this transatlantic commonality is caused by any
other source. Our results indicate that other control firms do not face the same
commonality in liquidity as the NAE firms.
In table 3, we report the exchange-by-exchange regression analysis. Our results
show that all exchanges have faced the new source of commonality except for Frankfurt
stock exchange. All exchanges have positive and significant coefficient for the interaction
term between NAE liquidity and Arca dummy variable. These findings provide a strong
support for the postulation that; changes in an individual firm’s liquidity are significantly
influenced by a common liquidity factor in NAE market. These results confirm that
21

commonality in liquidity does not have natural boundary at the home exchange frontier.
It can spill over onto others exchanges due to sharing the same base of investors. Our
results cannot be attributed to market-specific characteristics or macro-economic
variables; because stocks traded in NAE are combined from 13 different countries that do
not share the same market characteristics. However, NAE stocks only share the same
investors’ pool. The results are consistent with style and habitat-based explanations. It
suggests that commonality in liquidity is driven by the correlated trading decisions of
specific groups of traders (Kamara, Lou, and Sadka, 2008; Koch, Ruenzi, and Starks,
2009; Corwin and Lipson, 2011; Karoyli, Lee and Van Dijk, 2012). In addition, the
results are consistent with Gorton and Pennacchi’s (1993) result that basket trading
increases commonality.
On the other hand, the Home Liquidity*Arca interaction term has mixed results
with a negative sign for most of the sample exchanges. The coefficients of
Liquidity*Arca interaction term are statistically significant for six exchanges Frankfurt,
Helsinki, Madrid, NYSE, Stockholm and Swiss stock exchange. Using our results we can
conclude that transatlantic trading bring up a new source of commonality and also
reduces the co-movement with the home market liquidity for some of the studied
exchanges. These results are of a great importance, it shows that there is a shift of the co-
movement between individual firms and home market index toward an increase in
commonality NAE liquidity index. Or in other words, it shows that we have a new source
of systematic liquidity risk coming from the multi market trading of NAE stocks.
Table 2 also reveals that the coefficients of concurrent change in liquidity of the
home market are positive for all exchanges, except Oslo stock exchange, and statistically
22
significant for some of the investigated markets. These results are in agreement with
Brockman, Chung and Perignon (2009), Karoyli, Lee and Van Dijk (2012) that
commonality in liquidity is an international phenomenon and not limited to the US
market. Also, we have found that the coefficients of concurrent change in liquidity of the
NAE market are positive for all sample exchanges. The coefficients are statistically
significant for 9 exchanges of our sample.
Insert Table 3
To investigate whether our results are directly associated with multi-market
trading or market integration events, we create a control sample that has similar
characteristics before the launch of NAE market and also listed in the same home
exchange. Table 4 shows the results for the control sample. We find that the coefficient
NAE interaction term is statistically insignificant for the whole sample and only two
markets show a statistically positive co-movement with the NAE market. The coefficients
of Frankfurt and Helsinki stock exchanges show a positive and significant coefficient for
the NAE liquidity*Arca term. Our results are strong enough to rule out the possibility
that the commonality in liquidity is driven by any market specific or macro-economic
variables. These results are in line with our main hypothesis that liquidity in commonality
is mainly driven by correlated trading behavior among market participants.
Insert Table 4
To confirm our results, we follow Karoyli, Lee and Van Dijk, (2012) to use the
Amihud (2002) to test the commonality in liquidity. Firm by firm Proportionate Changes
in daily Amihud (2002) are regressed, in time series, on proportional changes in the
liquidity for all stocks traded in NYSE Arca Europe market as well as all stock traded in
23

the home market. Table 5 reported the results for NAE original stocks, while Table 6
reports the control sample results. We find that only the original sample shows positive
and significant coefficients for the NAE interaction term for most of the investigated
exchanges. However we could not conclude that the control sample co-move with the
NAE market. The coefficients of interaction term in the control sample show mixed
results. Few exchanges show a positive and statistically significant coefficient. Hence we
can conclude that only stocks traded in NAE co-move with the aggregate liquidity co-
movement of the whole market, but there is no evidence that other stocks traded on the
same home market co-move with aggregate liquidity co-movement of NAE market.
These results confirm the findings of table 2 and 3. It shows that correlated trading
behavior can increase the co-movement in liquidity.
Insert Table 5
Insert Table 6
5.3. Excluding London firms
London stock exchange has 387 traded in NYSE Arca Europe. The dominance of London
stock exchange might be the actual cause of the commonality in liquidity in the
transatlantic exchange. To forestall this possibility, we recreate NYSE Arca Europe index
to include all firms traded under the NAE excluding firms listed in London stock
exchange. By removing these firms we rule out the possibility that commonality in
liquidity is actually caused by a set of firms and not because the transatlantic exchange.
Table 7 and table 8 report the regression analysis for NAE commonality in liquidity
excluding London firms from the NAE index using daily turnover and Amihud (2002)
respectively.
24
The results show that the commonality in liquidity even stronger after excluding London
stock exchange firms from the index. The R-square is higher for most of the exchanges.
In addition, our variable of interest NAE liquidity*Arca is positive and statistically
significant for all sample exchanges except others category. The same results is found
using Amihud (2002).
Insert Table 7
Insert Table 8
5.4. Commonality in liquidity by firm size.
In table 9 and table 10, we examine the relationship between firm size and
commonality in liquidity. We form portfolio deciles on an exchange-by-exchange basis
(i.e., deciles are first formed separately within each exchange and then combined, pooling
all firms in the same decile across exchanges). Prior literature yields contradicting
explanations. One stream of literature suggests that, smaller stocks are less sensitive to
market-wide shocks in liquidity. Chordia, Roll and Subrahmanyam (2000), documents
that firm co-movement with the market wide liquidity increase with firm size. They
attribute the increased co-movement of large firms to the greater prevalence of
institutional herd trading in larger firms. Kamara, Lou and Sadka (2008), find that the
sensitivity of the stock’s liquidity to market liquidity has increased significantly for large-
cap firms, but decreased significantly for small-cap firms over time. They also show that
this trend can be explained by the patterns of institutional ownership over their sample
period. Another stream of literature argues that small-cap firms have the highest co-
movement with the market wide liquidity shocks. Brockman Chung and Perignon (2009)
contrast sharply the results of the US market. They find that second-smallest firm size
25
quintile have the highest sensitivity to commonality in liquidity.
In table 9 and we show that firm size play an important role in determining the
commonality in liquidity. All deciles show positive and statistically significant
coefficients for NAE interaction term. NAE interaction term has decreased significantly
with firm size. We find that the second decile has the highest coefficient of NAE
interaction term (0.186) followed by decile number 4 with a coefficient of (0.124). Our
results are consistent with the international evidence of Brockman, Chung and Perignon
(2009) that small firms have higher comovment in liquidity. It shows that co-movement
is more prevalent to smaller firms than large firms. However, we do not have trader level
data to investigate the reason behind this co-movement trend.
Insert Table 9
In table 10, we find a different pattern. However, the third decile shows the
highest coefficient of NAE Liquidity*Arca term (0.570) some of the small deciles do not
show a significant coefficients. On the other hand all large deciles are positive and
statistically significant.
Insert Table 10
5.5. Direct Vs. Indirect Access.
We examine whether firms that are traded in NAE, which also share the Universal
Trading Platform with NYSE and Euronext markets would co-move with these big
established markets. NYSE and Euronext traders have indirect access to NAE stocks
through the same trading platform, where they just need to extend their membership to
NAE market. With an increasingly changing stock exchange industry, this question is
very important to investigate the effect of indirect access or using the same trading
26
platform on the systemic risk profile and commonality in liquidity. One of the key
advantages our paper is the investigation of the effect of market integration on
commonality in liquidity, through sharing the same trading platform and extending
market access to traders from other well established markets. According to NYSE-
Euornext officials, connectivity will be a unique selling point to NYSE Arca Europe.
They aim to provide NYSE-Euronext existing customers, who already connected to the
regulated market, with a new connection to NYSE Arca Europe using the same platform,
Universal Trading Platform. NAE provides a direct access to NAE stocks to NAE
subscribed customers, in addition to indirect access to customers of NYSE-Euonext
regulated markets. Such a unique structure of NAE provides us with a unique opportunity
to investigate the effect of market design changes on the commonality in liquidity.
Δ Liquidity 𝑓,t = α + β1∆ Home Liquidity𝑡−1 + β2∆ Home Liquidity 𝑡+ β3∆ Home Liquidity𝑡+1 + δ1∆ NAE Liquidity𝑡−1+ δ2∆ NAE Liquidity𝑡 + δ3∆ NAE Liquidity𝑡+1+ ∅1∆ Indirect Access Liquidity𝑡−1 + ∅2∆ Indirect Access Liquidity𝑡+ ∅3∆ Indirect Access Liquidity𝑡+1 + ω1 Home Return t−1+ ω2 Home Return t + ω3 Home Return t+1 + ω4 ∆ Volatility 𝑓,𝑡+ Arca𝑡 + ∆ NAE Liquidity ∗ Arca 𝑡 + ∆ Home Liquidity ∗ Arca 𝑡+ ∆ Indirect Access ∗ Arca 𝑡 + ε𝑓,𝑡
Equation (5)
To test the difference between direct and indirect access of NAE traders, we use
equation 5 that extend our original model, to account for both direct and indirect access in
the same model. In investigating the indirect access we separate NYSE traders from
Euronext traders, as each one of the markets has its own pool traders. Untabulated results
show that the coefficients of Euronext interaction term are mostly negative. However, the
negative sign of the coefficients imply that NAE stocks and Euronext are substitutes to
each other; we could not conclude that there is a negative co-movement between NAE
27
and Euronext because the reported coefficients are not statistically significant. In
addition, the results reveal the same trend for NYSE. The coefficients of the NYSE
interaction term are mixed and there is no evidence that NYSE Arca Europe stocks co-
move with the NYSE aggregate liquidity co-movement. The coefficients of NAE
interaction term are not affected by adding market with indirect access. Hence, our results
reveal that neither extending the membership with other markets nor the using the same
trading platform can affect the systematic liquidity risk. These results are in favor of the
style and habitat-based explanation of commonality in liquidity. It suggests that
commonality in liquidity is affected only if we have the same set of traders and is not
driven by sharing the platform of extending trading membership with other markets.
6. Conclusion
In this paper, we take advantage of the introduction of the first transatlantic
exchange, NYSE Arca Europe (NAE), to investigate the effect of multi-market trading on
commonality in liquidity. We find that trading in multi-market trading setting bring up a
new source of commonality, in addition to the reported home market commonality
(Chordia, Roll, and Subrahmanyam 2000; Hasbrouck and Seppi 2001; Huberman and
Halka, 2001; Kamara, Lou and Sadka, 2008; Brockman, Chung and Perignon 2009,
Corwin and Lipson 2011). Simply stated, changes in NYSE Arca Europe individual
firm’s liquidity are significantly influenced by a common liquidity factor in the
transatlantic market NAE after controlling for the home market co-movement. In
addition, we find that firm size plays an important role in commonality in liquidity.
Consistent with Brockman, Chung and Perignon (2009) we find that firm co-movement
with NAE market wide liquidity decreases with firm size. Moreover, the results reveal
28
that, for most of the studied markets, the magnitude of common liquidity factor for NAE
market is greater than the respective home market common factor. With respect to
systematic liquidity risk, one can conclude that using the home market portfolio only to
assess the systematic liquidity risk does not capture the true market portfolio that affect
the systematic liquidity risk.
Our results are consistent with the correlated trading behavior and basket trading
explanation. Using our experimental setting, we show that trading a basket of equity
stocks that are combined from 13 different countries, NAE market, add a new source of
commonality in liquidity, in addition to the home market liquidity co-movement. These
results support the prediction of Gorton and Pennacchi (1993) that basket trading increase
commonality in liquidity. Moreover, our results can also be attributed to the correlated
trading decisions of specific groups of traders (Kamara, Lou, and Sadka, 2008; Koch,
Ruenzi, and Starks, 2009; Corwin and Lipson, 2011; Karoyli, Lee and Van Dijk, 2012).
Although, NAE stocks do not share the same home market, location, macro-economic or
other market specific factors, they do share the same investors’ pool. This existence of a
common investors’ pool suggests that commonality in liquidity in NAE might be driven
by the correlated trading decisions of specific groups of traders or market participants.
29

References
Acharya, V.V., Pedersen, L., 2005. Asset pricing with liquidity risk. Journal of Financial Economics 77 (2), 375–410. Aggarwal, R., 2006. Demutualization and cross-country merger of exchanges.The Journal of Financial Transformation 18, 143-150. Amihud, Y., 2002. Illiquidity and stock returns: cross-section and time series effects. Journal of Financial Markets 5, 31–56. Amihud, Y., Mendelson, H., 1986. Asset pricing and the bid-ask spread. Journal of Financial Economics 17, 223–249. Amihud, Y., Mendelson, H., 1991. Liquidity, maturity and the yields on U.S. government securities. Journal of Finance 46 (4), 1411–1425. Amihud, Y., Mendelson, H., Wood, R.A., 1990. Liquidity and the 1987 stock market crash. Journal of Portfolio Management 16 (3), 65–69. Ang, A., Hodrick, R.J., Xing, Y., Zhang, X., 2006. The cross-section of volatility and expected returns. Journal of Finance 61 (1), 259–299. Avramov, D., Chordia, T., Goyal, A., 2006. Liquidity and autocorrelations in individual stock returns. Journal of Finance 61, 2365–2394. Barberis, N., Shleifer, A., 2003. Style investing. Journal of Financial Economics 68, 161–199. Barberis, N., Shleifer, A., Wurgler, J., 2005. Comovement. Journal of Financial Economics 75, 283–317. Baruch, S., Karoyli, A., Lemmon, M., 2007. Multimarket trading and liquidity theory and evidence. Journal of Finance 62, 2169-2201. Brennan, M.J., Subrahmanyam, A., 1996. Market microstructure and asset pricing: on the compensation for illiquidity in stock returns. Journal of Financial Economics 41, 441–464. Brockman, P.,Chung,D.Y.,Pe´ rignon, C.,2009.Commonalityinliquidity: a global perspective. Journal of Financial and Quantitative Analysis 44, 851–882. Brunnermeier, K., Pedersen, H., 2009. Market liquidity and funding liquidity. Review of Financial Studies 22, 2201–2238. Chen, J., 2005. Pervasive liquidity risk and asset pricing. Unpublished working paper. Columbia University. Chordia, T., Roll, R., Subrahmanyam, A., 2000. Commonality in liquidity. Journal of Financial Economics 56, 3–28. Chowdhry, B., Nanda, V., 1991. Multimarket trading and market liquidity. Review of Financial Studies 4, 483–511. Corwin, S., Lipson, M., 2011. Order characteristics and sources of commonality in prices and liquidity. Journal of Financial Markets 14, 47-81.
30

Coughenour, J.F., Saad, M.M., 2004. Common market makers and commonality in liquidity. Journal of Financial Economics 73, 37–70. Domowitz, I., Hansch, O., Wang, X., 2005. Liquidity commonality and return co-movement. Journal of Financial Markets 8, 351–376. Ghysels, E., Santa-Clara, P., Valkanov, R., 2005. There is a risk-return tradeoff after all. Journal of Financial Economics 76 (3), 509–548. Gorton, G.B., Pennacchi, G.G., 1993. Security baskets and index-linked securities. Journal of Business 66 (1), 1–27. Goyenko, R., Holden, C.W., Trzcinka, C.A., 2009. Do liquidity measures measure liquidity? Journal of Financial Economics 92, 153–181. Griffin, J., Nardari, F., Stulz, R.M., 2007. Do investors trade more when stocks have performed well? Evidence from 46 countries. Review of Financial Studies 20, 905–951. Halling, M., Moulton, P., Panayides, M., 2013. Volume Dynamics and Multimarket Trading. Journal of Financial and Quantitative Analysis 48, 489-518. Hasbrouck, J., 2009. Trading costs and returns for U.S. equities: estimat- ing effective costs from daily data. Journal of Finance 64, 1445–1477. Hasbrouck, J., Seppi, D.J., 2001. Common factors in prices, order flows, and liquidity. Journal of Financial Economics 59, 383–411. Huberman, G., Halka, D., 2001. Systematic liquidity. Journal of Financial Research 24, 161–178. Ince, O., and Porter, R. B., 2006. Individual equity return data from Thomson DataStream: Handle with Care. Journal of Financial Research, 29: 463–479. Kamara, A., 1988. Market trading structures and asset pricing: evidence from the Treasury-bill markets. Review of Financial Studies 1 (4), 357–375. Kamara, A., Lou, X., Sadka. R., 2008. The divergence of liquidity commonality in the cross-section of stocks. Journal of Financial Economics 89, 444-466. Karolyi, A., Lee, K., van Dijk, M., 2012. Understanding commonality in liquidity around the world. Journal of Financial Economics 105, 82-112. Koch, A., Ruenzi, S., Starks, L., 2009. Commonality in liquidity: a demand- side explanation. Unpublished working paper. University of Texas at Austin and University of Mannheim. Korajczyk, R.A., Sadka, R., 2004. Are momentum profits robust to trading costs? Journal of Finance 59, 1039–1082. Korajczyk, R.A., Sadka, R., 2008. Pricing the commonality across alternative measures of liquidity. Journal of Financial Economics
87, 45–72.
Lee, C., Shleifer, A., Thaler, R., 1991. Investor sentiment and the closed-end fund puzzle. Journal of Finance 46, 75–110.
31

Lesmond, D.A., 2005. Liquidity of emerging markets. Journal of Financial Economics 77, 411–452. Lesmond, D.A., Schill, M.J., Zhou, C., 2004. The illusory nature of momentum profits. Journal of Financial Economics 71 (2), 349–380. Longstaff, F.A., 2001. Optimal portfolio choice and the valuation of illiquid securities. Review of Financial Studies 14 (2), 407–431. Longstaff, F. A. 2009. Portfolio claustrophobia: Asset pricing in markets with illiquid assets. The American Economic Review, 1119-1144. Menkveld, A., 2008. Splitting orders in overlapping markets: A study of cross-listed stocks. Journal of Financial Intermediation 17, 145-174. Mitchell, M., Pulvino, T., 2001. Characteristics of risk and return in risk arbitrage. Journal of Finance 56 (6), 2135–2175.
Moulton, P., Wei, L., 2009. A tale of two time zones: The impact of substitutes on cross-listed stock liquidity. Journal of Financial Markets, 12, 570-591. O’Hara, M., 2003. Presidential address: liquidity and price discovery. Journal of Finance 58 (4), 1335–1354. Pagano, M., 1989. Trading volume and asset liquidity. Quarterly Journal of Economics, 104 , 255-274. Pastor, L., Stambaugh, R.F., 2003. Liquidity risk and expected stock returns. Journal of Political Economy 111, 642–685. Pontiff, J., 1996. Costly arbitrage: evidence from closed-end funds. Quarterly Journal of Economics 111 (4), 1135–1151. Sadka, R., 2006. Momentum and post-earnings-announcement drift anomalies: the role of liquidity risk. Journal of Financial Economics 80, 309–349. Sadka, R., Scherbina, A., 2007. Analyst disagreement, mispricing, and liquidity. Journal of Finance 62, 2367–2403.
Shahrawat, D. 2008. Where exchange consolidation is headed: five players that will dominate the market. Tower Group. Watanabe, A., Watanabe, M., 2008. Time-varying liquidity risk and the cross-section of stock returns. Review of Financial Studies 21, 2449–2486.
32
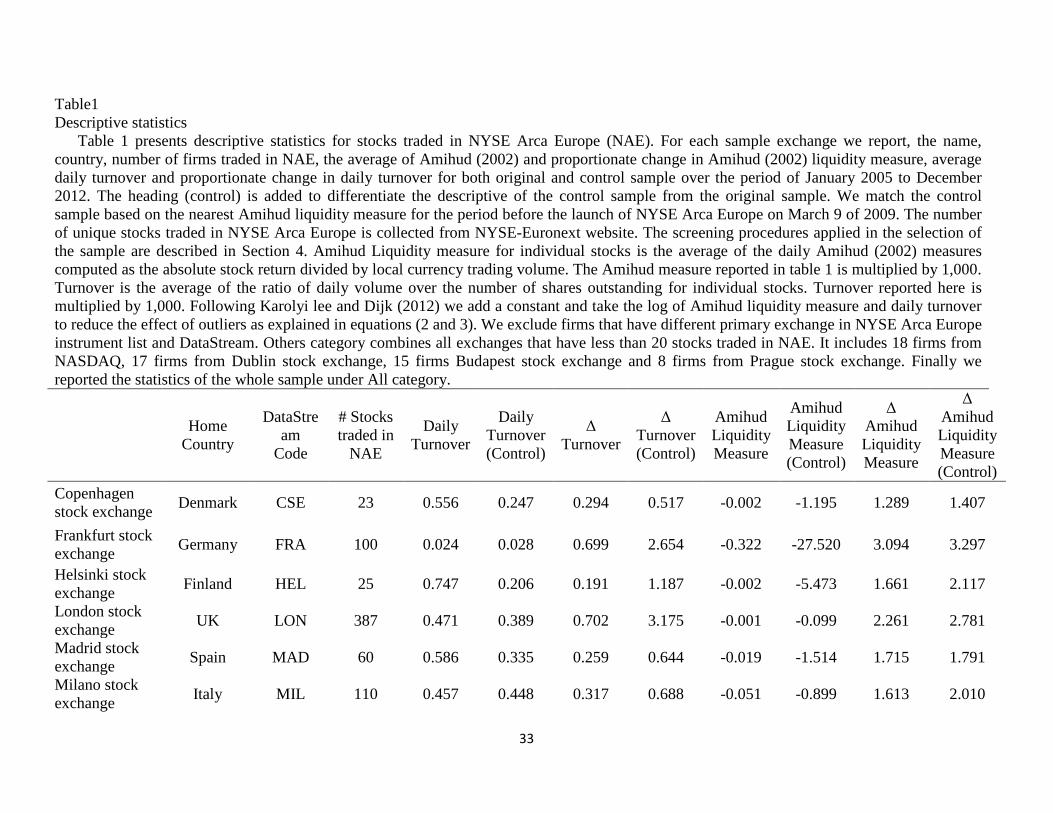
Table1 Descriptive statistics
Table 1 presents descriptive statistics for stocks traded in NYSE Arca Europe (NAE). For each sample exchange we report, the name, country, number of firms traded in NAE, the average of Amihud (2002) and proportionate change in Amihud (2002) liquidity measure, average daily turnover and proportionate change in daily turnover for both original and control sample over the period of January 2005 to December 2012. The heading (control) is added to differentiate the descriptive of the control sample from the original sample. We match the control sample based on the nearest Amihud liquidity measure for the period before the launch of NYSE Arca Europe on March 9 of 2009. The number of unique stocks traded in NYSE Arca Europe is collected from NYSE-Euronext website. The screening procedures applied in the selection of the sample are described in Section 4. Amihud Liquidity measure for individual stocks is the average of the daily Amihud (2002) measures computed as the absolute stock return divided by local currency trading volume. The Amihud measure reported in table 1 is multiplied by 1,000. Turnover is the average of the ratio of daily volume over the number of shares outstanding for individual stocks. Turnover reported here is multiplied by 1,000. Following Karolyi lee and Dijk (2012) we add a constant and take the log of Amihud liquidity measure and daily turnover to reduce the effect of outliers as explained in equations (2 and 3). We exclude firms that have different primary exchange in NYSE Arca Europe instrument list and DataStream. Others category combines all exchanges that have less than 20 stocks traded in NAE. It includes 18 firms from NASDAQ, 17 firms from Dublin stock exchange, 15 firms Budapest stock exchange and 8 firms from Prague stock exchange. Finally we reported the statistics of the whole sample under All category.
Home Country
DataStream
Code
# Stocks traded in
NAE
Daily Turnover
Daily Turnover (Control)
Δ Turnover
Δ Turnover (Control)
Amihud Liquidity Measure
Amihud Liquidity Measure (Control)
Δ Amihud Liquidity Measure
Δ Amihud Liquidity Measure (Control)
Copenhagen stock exchange Denmark CSE 23 0.556 0.247 0.294 0.517 -0.002 -1.195 1.289 1.407
Frankfurt stock exchange Germany FRA 100 0.024 0.028 0.699 2.654 -0.322 -27.520 3.094 3.297
Helsinki stock exchange Finland HEL 25 0.747 0.206 0.191 1.187 -0.002 -5.473 1.661 2.117
London stock exchange UK LON 387 0.471 0.389 0.702 3.175 -0.001 -0.099 2.261 2.781
Madrid stock exchange Spain MAD 60 0.586 0.335 0.259 0.644 -0.019 -1.514 1.715 1.791
Milano stock exchange Italy MIL 110 0.457 0.448 0.317 0.688 -0.051 -0.899 1.613 2.010
33
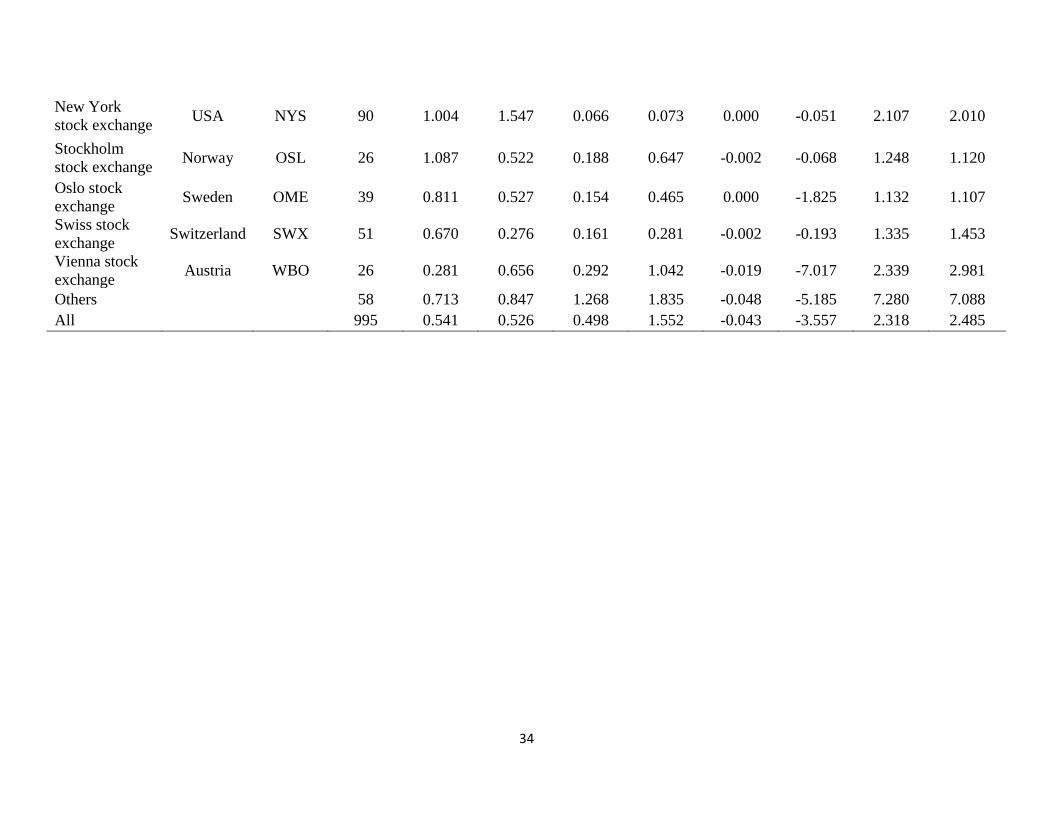
New York stock exchange USA NYS 90 1.004 1.547 0.066 0.073 0.000 -0.051 2.107 2.010
Stockholm stock exchange Norway OSL 26 1.087 0.522 0.188 0.647 -0.002 -0.068 1.248 1.120
Oslo stock exchange Sweden OME 39 0.811 0.527 0.154 0.465 0.000 -1.825 1.132 1.107
Swiss stock exchange Switzerland SWX 51 0.670 0.276 0.161 0.281 -0.002 -0.193 1.335 1.453
Vienna stock exchange Austria WBO 26 0.281 0.656 0.292 1.042 -0.019 -7.017 2.339 2.981
Others 58 0.713 0.847 1.268 1.835 -0.048 -5.185 7.280 7.088 All 995 0.541 0.526 0.498 1.552 -0.043 -3.557 2.318 2.485
34
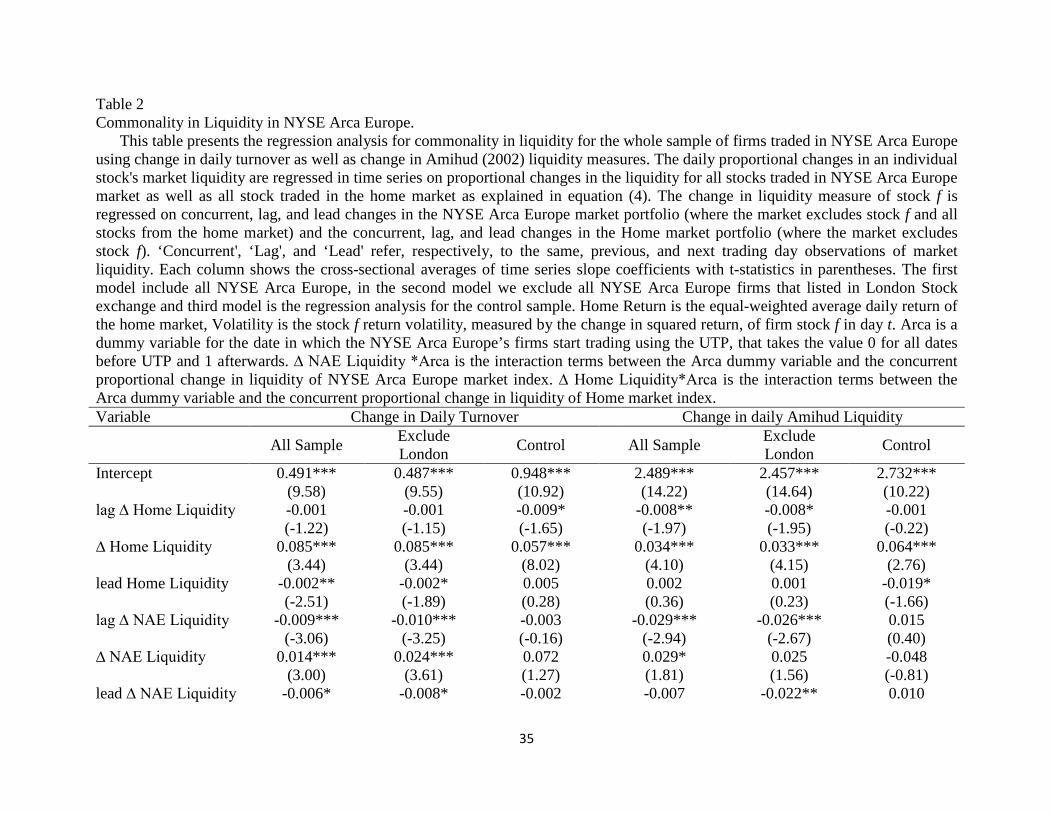
Table 2 Commonality in Liquidity in NYSE Arca Europe.
This table presents the regression analysis for commonality in liquidity for the whole sample of firms traded in NYSE Arca Europe using change in daily turnover as well as change in Amihud (2002) liquidity measures. The daily proportional changes in an individual stock's market liquidity are regressed in time series on proportional changes in the liquidity for all stocks traded in NYSE Arca Europe market as well as all stock traded in the home market as explained in equation (4). The change in liquidity measure of stock f is regressed on concurrent, lag, and lead changes in the NYSE Arca Europe market portfolio (where the market excludes stock f and all stocks from the home market) and the concurrent, lag, and lead changes in the Home market portfolio (where the market excludes stock f). ‘Concurrent', ‘Lag', and ‘Lead' refer, respectively, to the same, previous, and next trading day observations of market liquidity. Each column shows the cross-sectional averages of time series slope coefficients with t-statistics in parentheses. The first model include all NYSE Arca Europe, in the second model we exclude all NYSE Arca Europe firms that listed in London Stock exchange and third model is the regression analysis for the control sample. Home Return is the equal-weighted average daily return of the home market, Volatility is the stock f return volatility, measured by the change in squared return, of firm stock f in day t. Arca is a dummy variable for the date in which the NYSE Arca Europe’s firms start trading using the UTP, that takes the value 0 for all dates before UTP and 1 afterwards. ∆ NAE Liquidity *Arca is the interaction terms between the Arca dummy variable and the concurrent proportional change in liquidity of NYSE Arca Europe market index. ∆ Home Liquidity*Arca is the interaction terms between the Arca dummy variable and the concurrent proportional change in liquidity of Home market index. Variable Change in Daily Turnover Change in daily Amihud Liquidity
All Sample Exclude London Control All Sample Exclude
London Control
Intercept 0.491*** 0.487*** 0.948*** 2.489*** 2.457*** 2.732***
(9.58) (9.55) (10.92) (14.22) (14.64) (10.22) lag ∆ Home Liquidity -0.001 -0.001 -0.009* -0.008** -0.008* -0.001
(-1.22) (-1.15) (-1.65) (-1.97) (-1.95) (-0.22) ∆ Home Liquidity 0.085*** 0.085*** 0.057*** 0.034*** 0.033*** 0.064***
(3.44) (3.44) (8.02) (4.10) (4.15) (2.76) lead Home Liquidity -0.002** -0.002* 0.005 0.002 0.001 -0.019*
(-2.51) (-1.89) (0.28) (0.36) (0.23) (-1.66) lag ∆ NAE Liquidity -0.009*** -0.010*** -0.003 -0.029*** -0.026*** 0.015
(-3.06) (-3.25) (-0.16) (-2.94) (-2.67) (0.40) ∆ NAE Liquidity 0.014*** 0.024*** 0.072 0.029* 0.025 -0.048
(3.00) (3.61) (1.27) (1.81) (1.56) (-0.81) lead ∆ NAE Liquidity -0.006* -0.008* -0.002 -0.007 -0.022** 0.010
35
(-1.79) (-1.92) (-0.03) (-0.44) (-2.56) (0.24) lag Home Return 1.605*** 1.480*** 3.134 -0.460 -0.149 55.783***
(5.05) (4.66) (0.58) (-0.24) (-0.08) (2.71) Home Return -0.362 -0.134 7.979 2.105 2.265 -85.553***
(-0.55) (-0.20) (1.36) (0.87) (0.88) (-3.88) lead Home Return 0.457 0.469 2.215 -11.341* -11.567* 14.993
(1.03) (1.05) (0.41) (-1.68) (-1.79) (0.57) Volatility 331.881*** 330.069*** 179.851*** 2013.48*** 1983.17*** 501.003***
(23.41) (23.52) (12.17) (34.97) (36.06) (9.96) Arca -0.123*** -0.160*** -0.749 -0.238 -0.164 0.463
(-2.69) (-3.29) (-0.46) (-0.90) (-0.66) (1.04) ∆ NAE Liquidity *Arca 0.099*** 0.208*** 1.485 0.165*** 0.139*** 0.071
(6.56) (4.13) (1.32) (3.10) (3.09) (0.51) ∆ Home Liquidity*Arca
-0.034 -0.038 0.184 -0.082 -0.077 0.025
(-1.34) (-1.53) (1.11) (-0.94) (-0.91) (0.60)
R-squared 0.070 0.073 0.057 0.062 0.064 0.051
36
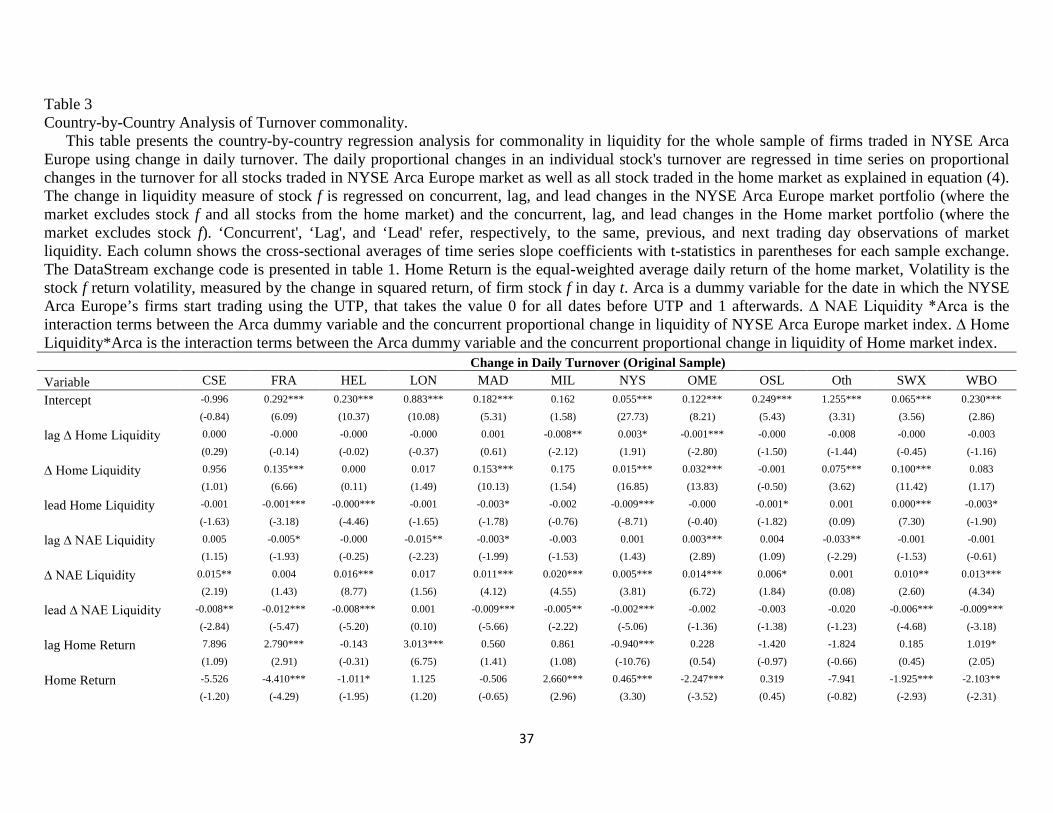
Table 3 Country-by-Country Analysis of Turnover commonality.
This table presents the country-by-country regression analysis for commonality in liquidity for the whole sample of firms traded in NYSE Arca Europe using change in daily turnover. The daily proportional changes in an individual stock's turnover are regressed in time series on proportional changes in the turnover for all stocks traded in NYSE Arca Europe market as well as all stock traded in the home market as explained in equation (4). The change in liquidity measure of stock f is regressed on concurrent, lag, and lead changes in the NYSE Arca Europe market portfolio (where the market excludes stock f and all stocks from the home market) and the concurrent, lag, and lead changes in the Home market portfolio (where the market excludes stock f). ‘Concurrent', ‘Lag', and ‘Lead' refer, respectively, to the same, previous, and next trading day observations of market liquidity. Each column shows the cross-sectional averages of time series slope coefficients with t-statistics in parentheses for each sample exchange. The DataStream exchange code is presented in table 1. Home Return is the equal-weighted average daily return of the home market, Volatility is the stock f return volatility, measured by the change in squared return, of firm stock f in day t. Arca is a dummy variable for the date in which the NYSE Arca Europe’s firms start trading using the UTP, that takes the value 0 for all dates before UTP and 1 afterwards. ∆ NAE Liquidity *Arca is the interaction terms between the Arca dummy variable and the concurrent proportional change in liquidity of NYSE Arca Europe market index. ∆ Home Liquidity*Arca is the interaction terms between the Arca dummy variable and the concurrent proportional change in liquidity of Home market index. Change in Daily Turnover (Original Sample) Variable CSE FRA HEL LON MAD MIL NYS OME OSL Oth SWX WBO Intercept -0.996 0.292*** 0.230*** 0.883*** 0.182*** 0.162 0.055*** 0.122*** 0.249*** 1.255*** 0.065*** 0.230***
(-0.84) (6.09) (10.37) (10.08) (5.31) (1.58) (27.73) (8.21) (5.43) (3.31) (3.56) (2.86)
lag ∆ Home Liquidity 0.000 -0.000 -0.000 -0.000 0.001 -0.008** 0.003* -0.001*** -0.000 -0.008 -0.000 -0.003
(0.29) (-0.14) (-0.02) (-0.37) (0.61) (-2.12) (1.91) (-2.80) (-1.50) (-1.44) (-0.45) (-1.16)
∆ Home Liquidity 0.956 0.135*** 0.000 0.017 0.153*** 0.175 0.015*** 0.032*** -0.001 0.075*** 0.100*** 0.083
(1.01) (6.66) (0.11) (1.49) (10.13) (1.54) (16.85) (13.83) (-0.50) (3.62) (11.42) (1.17)
lead Home Liquidity -0.001 -0.001*** -0.000*** -0.001 -0.003* -0.002 -0.009*** -0.000 -0.001* 0.001 0.000*** -0.003*
(-1.63) (-3.18) (-4.46) (-1.65) (-1.78) (-0.76) (-8.71) (-0.40) (-1.82) (0.09) (7.30) (-1.90)
lag ∆ NAE Liquidity 0.005 -0.005* -0.000 -0.015** -0.003* -0.003 0.001 0.003*** 0.004 -0.033** -0.001 -0.001
(1.15) (-1.93) (-0.25) (-2.23) (-1.99) (-1.53) (1.43) (2.89) (1.09) (-2.29) (-1.53) (-0.61)
∆ NAE Liquidity 0.015** 0.004 0.016*** 0.017 0.011*** 0.020*** 0.005*** 0.014*** 0.006* 0.001 0.010** 0.013***
(2.19) (1.43) (8.77) (1.56) (4.12) (4.55) (3.81) (6.72) (1.84) (0.08) (2.60) (4.34)
lead ∆ NAE Liquidity -0.008** -0.012*** -0.008*** 0.001 -0.009*** -0.005** -0.002*** -0.002 -0.003 -0.020 -0.006*** -0.009***
(-2.84) (-5.47) (-5.20) (0.10) (-5.66) (-2.22) (-5.06) (-1.36) (-1.38) (-1.23) (-4.68) (-3.18)
lag Home Return 7.896 2.790*** -0.143 3.013*** 0.560 0.861 -0.940*** 0.228 -1.420 -1.824 0.185 1.019*
(1.09) (2.91) (-0.31) (6.75) (1.41) (1.08) (-10.76) (0.54) (-0.97) (-0.66) (0.45) (2.05)
Home Return -5.526 -4.410*** -1.011* 1.125 -0.506 2.660*** 0.465*** -2.247*** 0.319 -7.941 -1.925*** -2.103**
(-1.20) (-4.29) (-1.95) (1.20) (-0.65) (2.96) (3.30) (-3.52) (0.45) (-0.82) (-2.93) (-2.31)
37
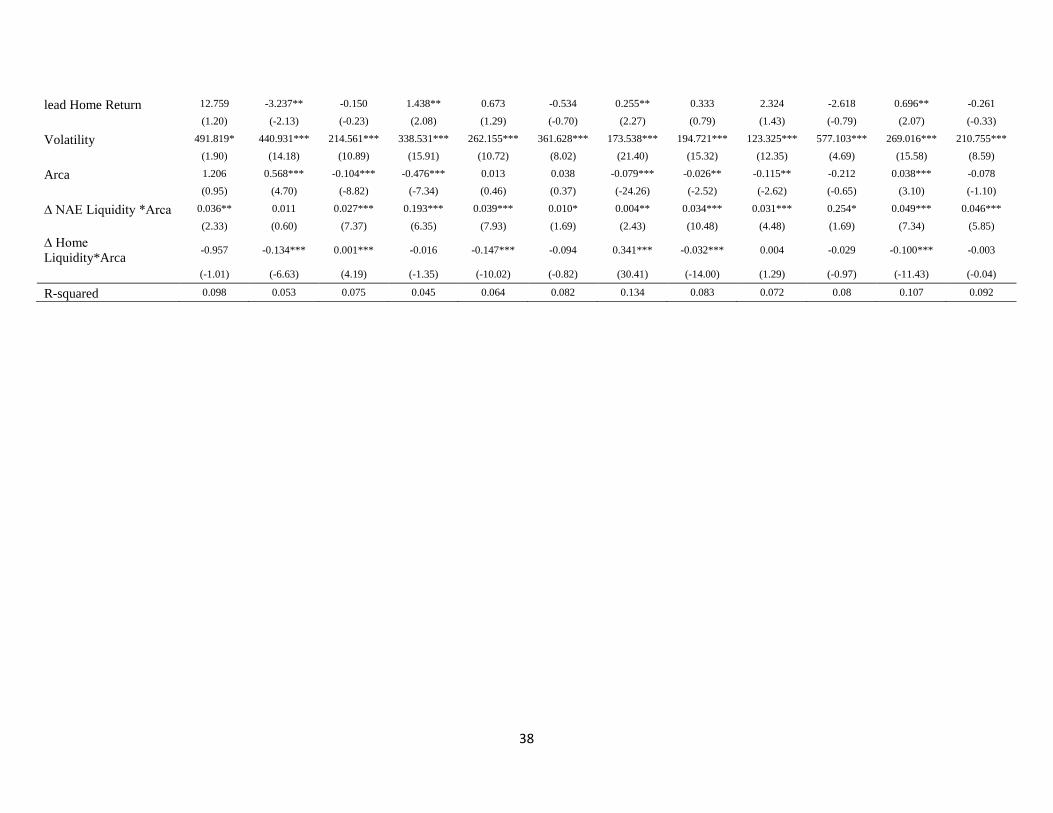
lead Home Return 12.759 -3.237** -0.150 1.438** 0.673 -0.534 0.255** 0.333 2.324 -2.618 0.696** -0.261
(1.20) (-2.13) (-0.23) (2.08) (1.29) (-0.70) (2.27) (0.79) (1.43) (-0.79) (2.07) (-0.33)
Volatility 491.819* 440.931*** 214.561*** 338.531*** 262.155*** 361.628*** 173.538*** 194.721*** 123.325*** 577.103*** 269.016*** 210.755***
(1.90) (14.18) (10.89) (15.91) (10.72) (8.02) (21.40) (15.32) (12.35) (4.69) (15.58) (8.59)
Arca 1.206 0.568*** -0.104*** -0.476*** 0.013 0.038 -0.079*** -0.026** -0.115** -0.212 0.038*** -0.078
(0.95) (4.70) (-8.82) (-7.34) (0.46) (0.37) (-24.26) (-2.52) (-2.62) (-0.65) (3.10) (-1.10)
∆ NAE Liquidity *Arca 0.036** 0.011 0.027*** 0.193*** 0.039*** 0.010* 0.004** 0.034*** 0.031*** 0.254* 0.049*** 0.046***
(2.33) (0.60) (7.37) (6.35) (7.93) (1.69) (2.43) (10.48) (4.48) (1.69) (7.34) (5.85)
∆ Home Liquidity*Arca -0.957 -0.134*** 0.001*** -0.016 -0.147*** -0.094 0.341*** -0.032*** 0.004 -0.029 -0.100*** -0.003
(-1.01) (-6.63) (4.19) (-1.35) (-10.02) (-0.82) (30.41) (-14.00) (1.29) (-0.97) (-11.43) (-0.04)
R-squared 0.098 0.053 0.075 0.045 0.064 0.082 0.134 0.083 0.072 0.08 0.107 0.092
38
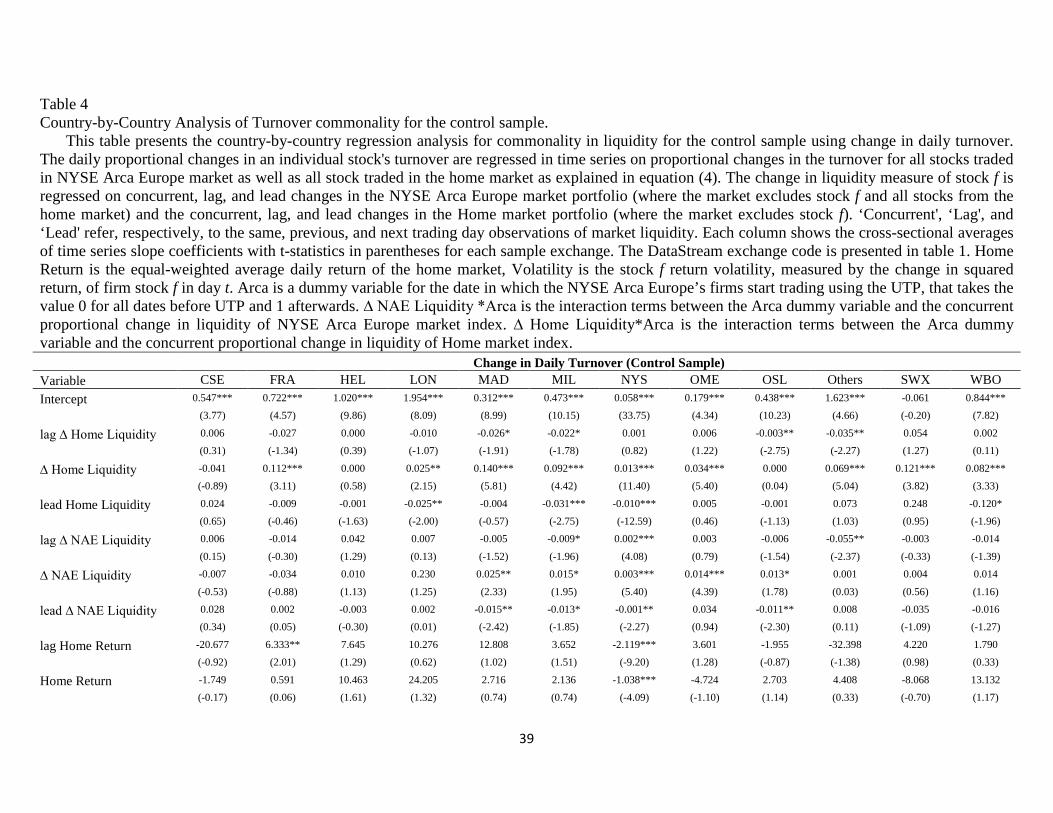
Table 4 Country-by-Country Analysis of Turnover commonality for the control sample.
This table presents the country-by-country regression analysis for commonality in liquidity for the control sample using change in daily turnover. The daily proportional changes in an individual stock's turnover are regressed in time series on proportional changes in the turnover for all stocks traded in NYSE Arca Europe market as well as all stock traded in the home market as explained in equation (4). The change in liquidity measure of stock f is regressed on concurrent, lag, and lead changes in the NYSE Arca Europe market portfolio (where the market excludes stock f and all stocks from the home market) and the concurrent, lag, and lead changes in the Home market portfolio (where the market excludes stock f). ‘Concurrent', ‘Lag', and ‘Lead' refer, respectively, to the same, previous, and next trading day observations of market liquidity. Each column shows the cross-sectional averages of time series slope coefficients with t-statistics in parentheses for each sample exchange. The DataStream exchange code is presented in table 1. Home Return is the equal-weighted average daily return of the home market, Volatility is the stock f return volatility, measured by the change in squared return, of firm stock f in day t. Arca is a dummy variable for the date in which the NYSE Arca Europe’s firms start trading using the UTP, that takes the value 0 for all dates before UTP and 1 afterwards. ∆ NAE Liquidity *Arca is the interaction terms between the Arca dummy variable and the concurrent proportional change in liquidity of NYSE Arca Europe market index. ∆ Home Liquidity*Arca is the interaction terms between the Arca dummy variable and the concurrent proportional change in liquidity of Home market index. Change in Daily Turnover (Control Sample) Variable CSE FRA HEL LON MAD MIL NYS OME OSL Others SWX WBO Intercept 0.547*** 0.722*** 1.020*** 1.954*** 0.312*** 0.473*** 0.058*** 0.179*** 0.438*** 1.623*** -0.061 0.844***
(3.77) (4.57) (9.86) (8.09) (8.99) (10.15) (33.75) (4.34) (10.23) (4.66) (-0.20) (7.82)
lag ∆ Home Liquidity 0.006 -0.027 0.000 -0.010 -0.026* -0.022* 0.001 0.006 -0.003** -0.035** 0.054 0.002
(0.31) (-1.34) (0.39) (-1.07) (-1.91) (-1.78) (0.82) (1.22) (-2.75) (-2.27) (1.27) (0.11)
∆ Home Liquidity -0.041 0.112*** 0.000 0.025** 0.140*** 0.092*** 0.013*** 0.034*** 0.000 0.069*** 0.121*** 0.082***
(-0.89) (3.11) (0.58) (2.15) (5.81) (4.42) (11.40) (5.40) (0.04) (5.04) (3.82) (3.33)
lead Home Liquidity 0.024 -0.009 -0.001 -0.025** -0.004 -0.031*** -0.010*** 0.005 -0.001 0.073 0.248 -0.120*
(0.65) (-0.46) (-1.63) (-2.00) (-0.57) (-2.75) (-12.59) (0.46) (-1.13) (1.03) (0.95) (-1.96)
lag ∆ NAE Liquidity 0.006 -0.014 0.042 0.007 -0.005 -0.009* 0.002*** 0.003 -0.006 -0.055** -0.003 -0.014
(0.15) (-0.30) (1.29) (0.13) (-1.52) (-1.96) (4.08) (0.79) (-1.54) (-2.37) (-0.33) (-1.39)
∆ NAE Liquidity -0.007 -0.034 0.010 0.230 0.025** 0.015* 0.003*** 0.014*** 0.013* 0.001 0.004 0.014
(-0.53) (-0.88) (1.13) (1.25) (2.33) (1.95) (5.40) (4.39) (1.78) (0.03) (0.56) (1.16)
lead ∆ NAE Liquidity 0.028 0.002 -0.003 0.002 -0.015** -0.013* -0.001** 0.034 -0.011** 0.008 -0.035 -0.016
(0.34) (0.05) (-0.30) (0.01) (-2.42) (-1.85) (-2.27) (0.94) (-2.30) (0.11) (-1.09) (-1.27)
lag Home Return -20.677 6.333** 7.645 10.276 12.808 3.652 -2.119*** 3.601 -1.955 -32.398 4.220 1.790
(-0.92) (2.01) (1.29) (0.62) (1.02) (1.51) (-9.20) (1.28) (-0.87) (-1.38) (0.98) (0.33)
Home Return -1.749 0.591 10.463 24.205 2.716 2.136 -1.038*** -4.724 2.703 4.408 -8.068 13.132
(-0.17) (0.06) (1.61) (1.32) (0.74) (0.74) (-4.09) (-1.10) (1.14) (0.33) (-0.70) (1.17)
39
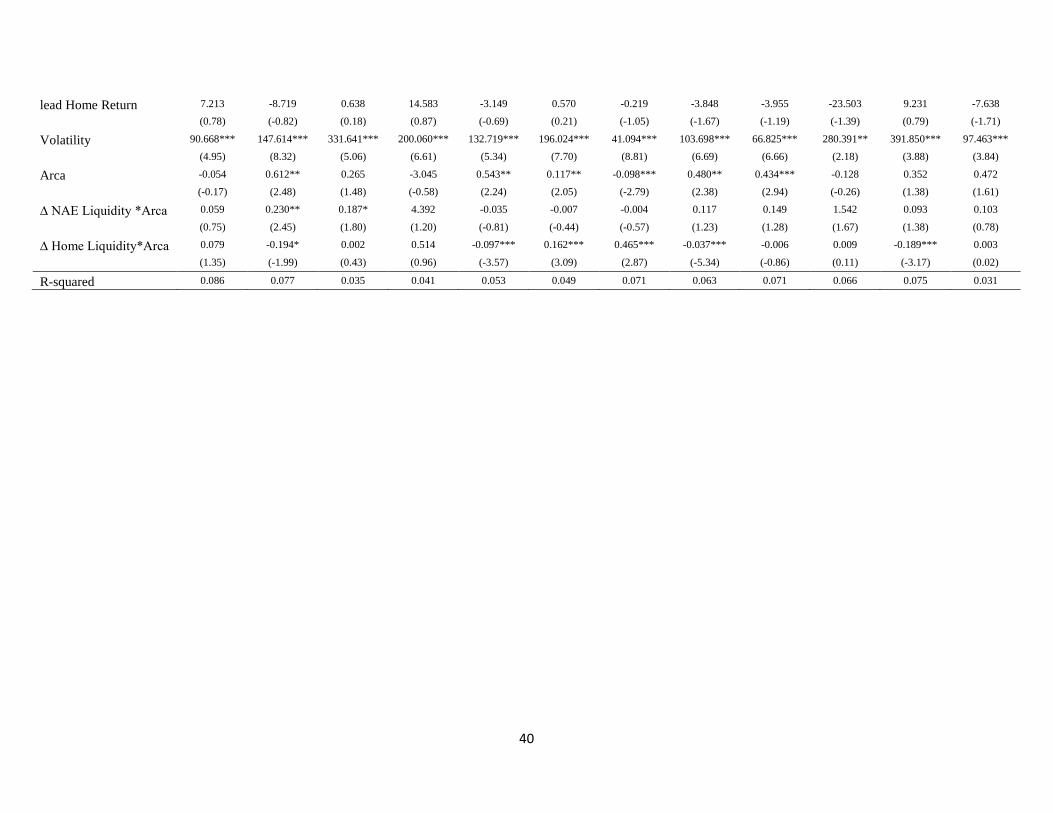
lead Home Return 7.213 -8.719 0.638 14.583 -3.149 0.570 -0.219 -3.848 -3.955 -23.503 9.231 -7.638
(0.78) (-0.82) (0.18) (0.87) (-0.69) (0.21) (-1.05) (-1.67) (-1.19) (-1.39) (0.79) (-1.71)
Volatility 90.668*** 147.614*** 331.641*** 200.060*** 132.719*** 196.024*** 41.094*** 103.698*** 66.825*** 280.391** 391.850*** 97.463***
(4.95) (8.32) (5.06) (6.61) (5.34) (7.70) (8.81) (6.69) (6.66) (2.18) (3.88) (3.84)
Arca -0.054 0.612** 0.265 -3.045 0.543** 0.117** -0.098*** 0.480** 0.434*** -0.128 0.352 0.472
(-0.17) (2.48) (1.48) (-0.58) (2.24) (2.05) (-2.79) (2.38) (2.94) (-0.26) (1.38) (1.61)
∆ NAE Liquidity *Arca 0.059 0.230** 0.187* 4.392 -0.035 -0.007 -0.004 0.117 0.149 1.542 0.093 0.103
(0.75) (2.45) (1.80) (1.20) (-0.81) (-0.44) (-0.57) (1.23) (1.28) (1.67) (1.38) (0.78)
∆ Home Liquidity*Arca 0.079 -0.194* 0.002 0.514 -0.097*** 0.162*** 0.465*** -0.037*** -0.006 0.009 -0.189*** 0.003
(1.35) (-1.99) (0.43) (0.96) (-3.57) (3.09) (2.87) (-5.34) (-0.86) (0.11) (-3.17) (0.02)
R-squared 0.086 0.077 0.035 0.041 0.053 0.049 0.071 0.063 0.071 0.066 0.075 0.031
40
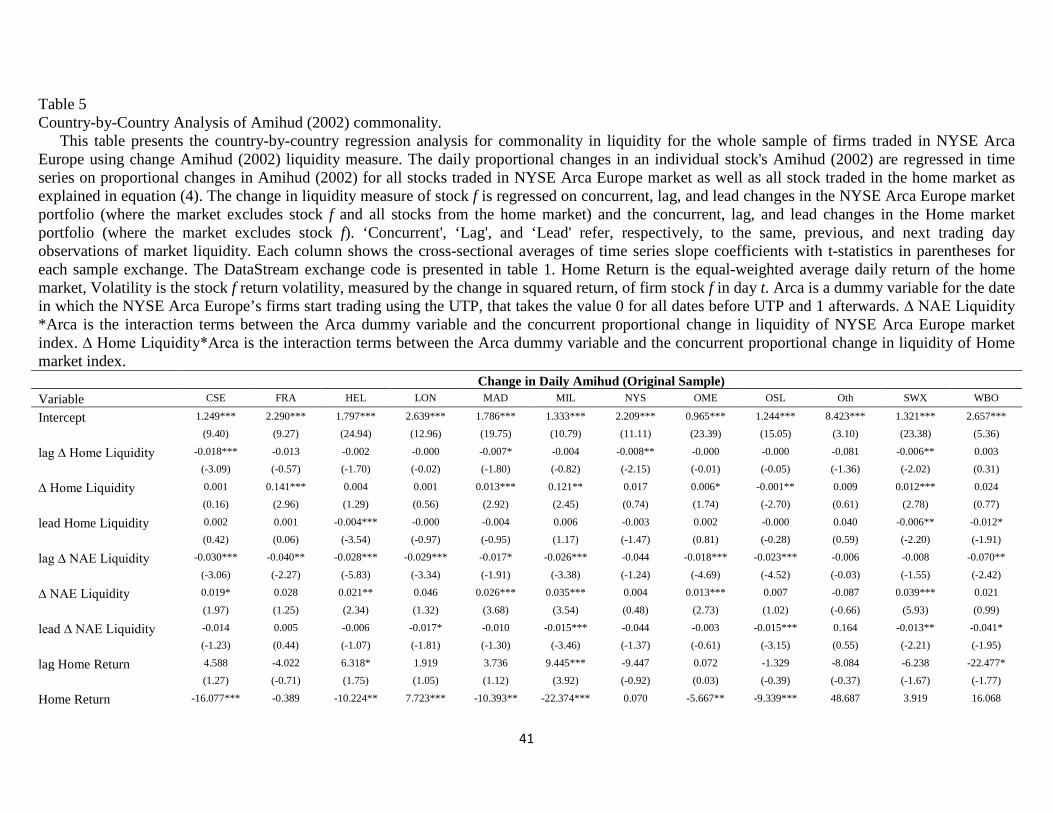
Table 5 Country-by-Country Analysis of Amihud (2002) commonality.
This table presents the country-by-country regression analysis for commonality in liquidity for the whole sample of firms traded in NYSE Arca Europe using change Amihud (2002) liquidity measure. The daily proportional changes in an individual stock's Amihud (2002) are regressed in time series on proportional changes in Amihud (2002) for all stocks traded in NYSE Arca Europe market as well as all stock traded in the home market as explained in equation (4). The change in liquidity measure of stock f is regressed on concurrent, lag, and lead changes in the NYSE Arca Europe market portfolio (where the market excludes stock f and all stocks from the home market) and the concurrent, lag, and lead changes in the Home market portfolio (where the market excludes stock f). ‘Concurrent', ‘Lag', and ‘Lead' refer, respectively, to the same, previous, and next trading day observations of market liquidity. Each column shows the cross-sectional averages of time series slope coefficients with t-statistics in parentheses for each sample exchange. The DataStream exchange code is presented in table 1. Home Return is the equal-weighted average daily return of the home market, Volatility is the stock f return volatility, measured by the change in squared return, of firm stock f in day t. Arca is a dummy variable for the date in which the NYSE Arca Europe’s firms start trading using the UTP, that takes the value 0 for all dates before UTP and 1 afterwards. ∆ NAE Liquidity *Arca is the interaction terms between the Arca dummy variable and the concurrent proportional change in liquidity of NYSE Arca Europe market index. ∆ Home Liquidity*Arca is the interaction terms between the Arca dummy variable and the concurrent proportional change in liquidity of Home market index. Change in Daily Amihud (Original Sample) Variable CSE FRA HEL LON MAD MIL NYS OME OSL Oth SWX WBO
Intercept 1.249*** 2.290*** 1.797*** 2.639*** 1.786*** 1.333*** 2.209*** 0.965*** 1.244*** 8.423*** 1.321*** 2.657***
(9.40) (9.27) (24.94) (12.96) (19.75) (10.79) (11.11) (23.39) (15.05) (3.10) (23.38) (5.36)
lag ∆ Home Liquidity -0.018*** -0.013 -0.002 -0.000 -0.007* -0.004 -0.008** -0.000 -0.000 -0.081 -0.006** 0.003
(-3.09) (-0.57) (-1.70) (-0.02) (-1.80) (-0.82) (-2.15) (-0.01) (-0.05) (-1.36) (-2.02) (0.31)
∆ Home Liquidity 0.001 0.141*** 0.004 0.001 0.013*** 0.121** 0.017 0.006* -0.001** 0.009 0.012*** 0.024
(0.16) (2.96) (1.29) (0.56) (2.92) (2.45) (0.74) (1.74) (-2.70) (0.61) (2.78) (0.77)
lead Home Liquidity 0.002 0.001 -0.004*** -0.000 -0.004 0.006 -0.003 0.002 -0.000 0.040 -0.006** -0.012*
(0.42) (0.06) (-3.54) (-0.97) (-0.95) (1.17) (-1.47) (0.81) (-0.28) (0.59) (-2.20) (-1.91)
lag ∆ NAE Liquidity -0.030*** -0.040** -0.028*** -0.029*** -0.017* -0.026*** -0.044 -0.018*** -0.023*** -0.006 -0.008 -0.070**
(-3.06) (-2.27) (-5.83) (-3.34) (-1.91) (-3.38) (-1.24) (-4.69) (-4.52) (-0.03) (-1.55) (-2.42)
∆ NAE Liquidity 0.019* 0.028 0.021** 0.046 0.026*** 0.035*** 0.004 0.013*** 0.007 -0.087 0.039*** 0.021
(1.97) (1.25) (2.34) (1.32) (3.68) (3.54) (0.48) (2.73) (1.02) (-0.66) (5.93) (0.99)
lead ∆ NAE Liquidity -0.014 0.005 -0.006 -0.017* -0.010 -0.015*** -0.044 -0.003 -0.015*** 0.164 -0.013** -0.041*
(-1.23) (0.44) (-1.07) (-1.81) (-1.30) (-3.46) (-1.37) (-0.61) (-3.15) (0.55) (-2.21) (-1.95)
lag Home Return 4.588 -4.022 6.318* 1.919 3.736 9.445*** -9.447 0.072 -1.329 -8.084 -6.238 -22.477*
(1.27) (-0.71) (1.75) (1.05) (1.12) (3.92) (-0.92) (0.03) (-0.39) (-0.37) (-1.67) (-1.77)
Home Return -16.077*** -0.389 -10.224** 7.723*** -10.393** -22.374*** 0.070 -5.667** -9.339*** 48.687 3.919 16.068
41
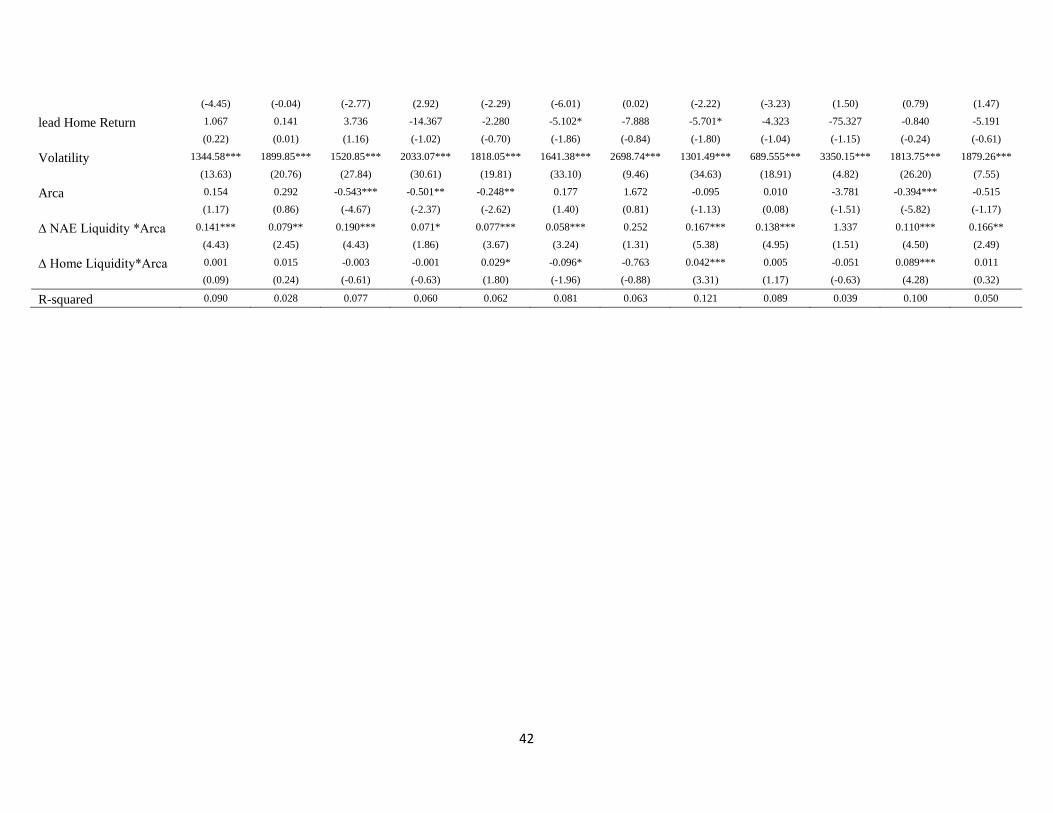
(-4.45) (-0.04) (-2.77) (2.92) (-2.29) (-6.01) (0.02) (-2.22) (-3.23) (1.50) (0.79) (1.47)
lead Home Return 1.067 0.141 3.736 -14.367 -2.280 -5.102* -7.888 -5.701* -4.323 -75.327 -0.840 -5.191
(0.22) (0.01) (1.16) (-1.02) (-0.70) (-1.86) (-0.84) (-1.80) (-1.04) (-1.15) (-0.24) (-0.61)
Volatility 1344.58*** 1899.85*** 1520.85*** 2033.07*** 1818.05*** 1641.38*** 2698.74*** 1301.49*** 689.555*** 3350.15*** 1813.75*** 1879.26***
(13.63) (20.76) (27.84) (30.61) (19.81) (33.10) (9.46) (34.63) (18.91) (4.82) (26.20) (7.55)
Arca 0.154 0.292 -0.543*** -0.501** -0.248** 0.177 1.672 -0.095 0.010 -3.781 -0.394*** -0.515
(1.17) (0.86) (-4.67) (-2.37) (-2.62) (1.40) (0.81) (-1.13) (0.08) (-1.51) (-5.82) (-1.17)
∆ NAE Liquidity *Arca 0.141*** 0.079** 0.190*** 0.071* 0.077*** 0.058*** 0.252 0.167*** 0.138*** 1.337 0.110*** 0.166**
(4.43) (2.45) (4.43) (1.86) (3.67) (3.24) (1.31) (5.38) (4.95) (1.51) (4.50) (2.49)
∆ Home Liquidity*Arca 0.001 0.015 -0.003 -0.001 0.029* -0.096* -0.763 0.042*** 0.005 -0.051 0.089*** 0.011
(0.09) (0.24) (-0.61) (-0.63) (1.80) (-1.96) (-0.88) (3.31) (1.17) (-0.63) (4.28) (0.32)
R-squared 0.090 0.028 0.077 0.060 0.062 0.081 0.063 0.121 0.089 0.039 0.100 0.050
42
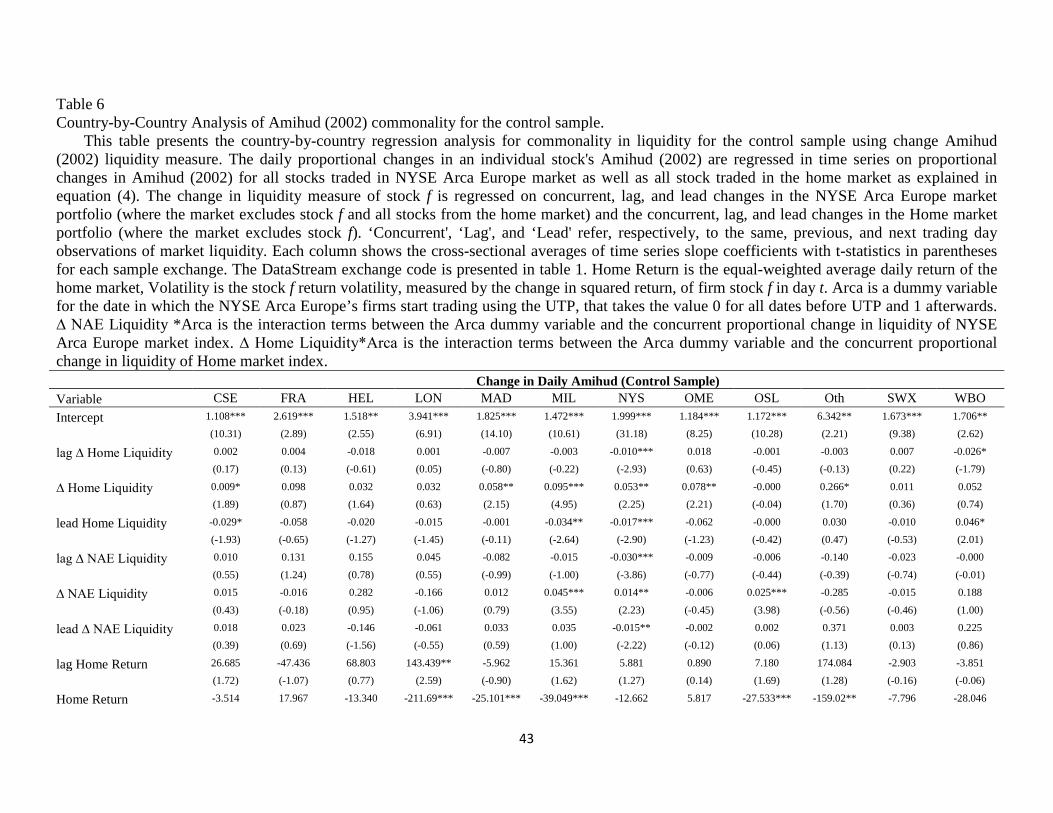
Table 6 Country-by-Country Analysis of Amihud (2002) commonality for the control sample.
This table presents the country-by-country regression analysis for commonality in liquidity for the control sample using change Amihud (2002) liquidity measure. The daily proportional changes in an individual stock's Amihud (2002) are regressed in time series on proportional changes in Amihud (2002) for all stocks traded in NYSE Arca Europe market as well as all stock traded in the home market as explained in equation (4). The change in liquidity measure of stock f is regressed on concurrent, lag, and lead changes in the NYSE Arca Europe market portfolio (where the market excludes stock f and all stocks from the home market) and the concurrent, lag, and lead changes in the Home market portfolio (where the market excludes stock f). ‘Concurrent', ‘Lag', and ‘Lead' refer, respectively, to the same, previous, and next trading day observations of market liquidity. Each column shows the cross-sectional averages of time series slope coefficients with t-statistics in parentheses for each sample exchange. The DataStream exchange code is presented in table 1. Home Return is the equal-weighted average daily return of the home market, Volatility is the stock f return volatility, measured by the change in squared return, of firm stock f in day t. Arca is a dummy variable for the date in which the NYSE Arca Europe’s firms start trading using the UTP, that takes the value 0 for all dates before UTP and 1 afterwards. ∆ NAE Liquidity *Arca is the interaction terms between the Arca dummy variable and the concurrent proportional change in liquidity of NYSE Arca Europe market index. ∆ Home Liquidity*Arca is the interaction terms between the Arca dummy variable and the concurrent proportional change in liquidity of Home market index. Change in Daily Amihud (Control Sample) Variable CSE FRA HEL LON MAD MIL NYS OME OSL Oth SWX WBO Intercept 1.108*** 2.619*** 1.518** 3.941*** 1.825*** 1.472*** 1.999*** 1.184*** 1.172*** 6.342** 1.673*** 1.706**
(10.31) (2.89) (2.55) (6.91) (14.10) (10.61) (31.18) (8.25) (10.28) (2.21) (9.38) (2.62)
lag ∆ Home Liquidity 0.002 0.004 -0.018 0.001 -0.007 -0.003 -0.010*** 0.018 -0.001 -0.003 0.007 -0.026*
(0.17) (0.13) (-0.61) (0.05) (-0.80) (-0.22) (-2.93) (0.63) (-0.45) (-0.13) (0.22) (-1.79)
∆ Home Liquidity 0.009* 0.098 0.032 0.032 0.058** 0.095*** 0.053** 0.078** -0.000 0.266* 0.011 0.052
(1.89) (0.87) (1.64) (0.63) (2.15) (4.95) (2.25) (2.21) (-0.04) (1.70) (0.36) (0.74)
lead Home Liquidity -0.029* -0.058 -0.020 -0.015 -0.001 -0.034** -0.017*** -0.062 -0.000 0.030 -0.010 0.046*
(-1.93) (-0.65) (-1.27) (-1.45) (-0.11) (-2.64) (-2.90) (-1.23) (-0.42) (0.47) (-0.53) (2.01)
lag ∆ NAE Liquidity 0.010 0.131 0.155 0.045 -0.082 -0.015 -0.030*** -0.009 -0.006 -0.140 -0.023 -0.000
(0.55) (1.24) (0.78) (0.55) (-0.99) (-1.00) (-3.86) (-0.77) (-0.44) (-0.39) (-0.74) (-0.01)
∆ NAE Liquidity 0.015 -0.016 0.282 -0.166 0.012 0.045*** 0.014** -0.006 0.025*** -0.285 -0.015 0.188
(0.43) (-0.18) (0.95) (-1.06) (0.79) (3.55) (2.23) (-0.45) (3.98) (-0.56) (-0.46) (1.00)
lead ∆ NAE Liquidity 0.018 0.023 -0.146 -0.061 0.033 0.035 -0.015** -0.002 0.002 0.371 0.003 0.225
(0.39) (0.69) (-1.56) (-0.55) (0.59) (1.00) (-2.22) (-0.12) (0.06) (1.13) (0.13) (0.86)
lag Home Return 26.685 -47.436 68.803 143.439** -5.962 15.361 5.881 0.890 7.180 174.084 -2.903 -3.851
(1.72) (-1.07) (0.77) (2.59) (-0.90) (1.62) (1.27) (0.14) (1.69) (1.28) (-0.16) (-0.06)
Home Return -3.514 17.967 -13.340 -211.69*** -25.101*** -39.049*** -12.662 5.817 -27.533*** -159.02** -7.796 -28.046
43
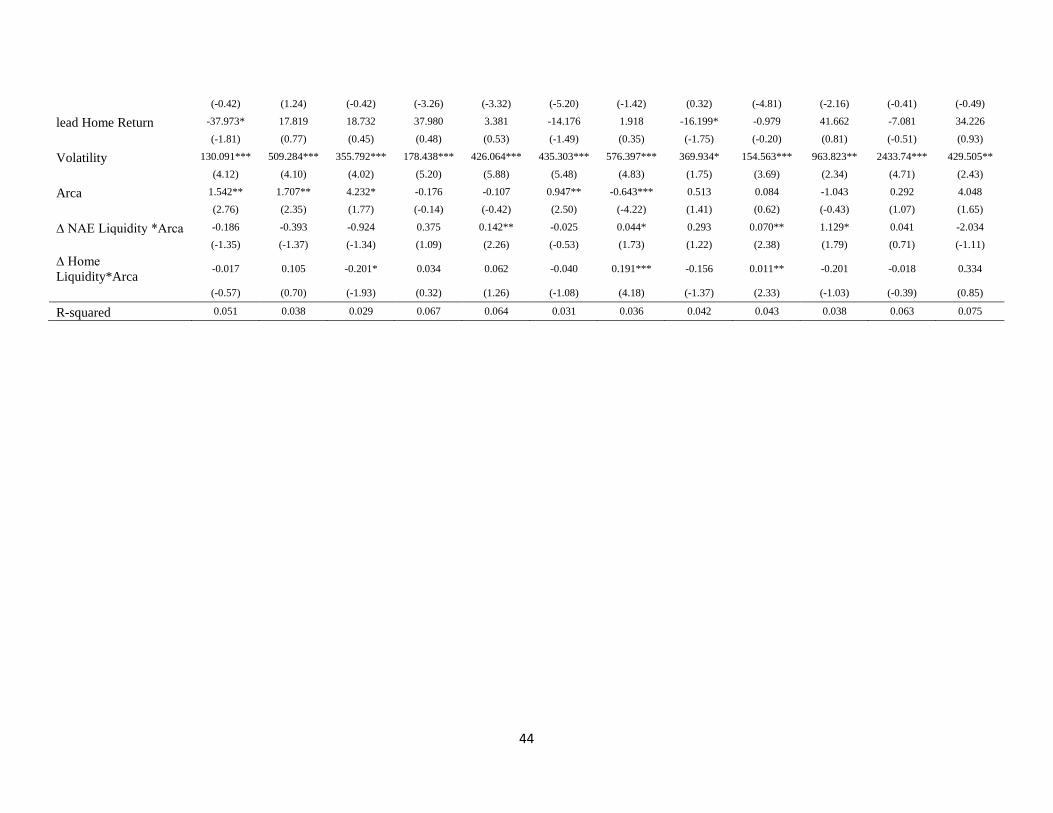
(-0.42) (1.24) (-0.42) (-3.26) (-3.32) (-5.20) (-1.42) (0.32) (-4.81) (-2.16) (-0.41) (-0.49)
lead Home Return -37.973* 17.819 18.732 37.980 3.381 -14.176 1.918 -16.199* -0.979 41.662 -7.081 34.226
(-1.81) (0.77) (0.45) (0.48) (0.53) (-1.49) (0.35) (-1.75) (-0.20) (0.81) (-0.51) (0.93)
Volatility 130.091*** 509.284*** 355.792*** 178.438*** 426.064*** 435.303*** 576.397*** 369.934* 154.563*** 963.823** 2433.74*** 429.505**
(4.12) (4.10) (4.02) (5.20) (5.88) (5.48) (4.83) (1.75) (3.69) (2.34) (4.71) (2.43)
Arca 1.542** 1.707** 4.232* -0.176 -0.107 0.947** -0.643*** 0.513 0.084 -1.043 0.292 4.048
(2.76) (2.35) (1.77) (-0.14) (-0.42) (2.50) (-4.22) (1.41) (0.62) (-0.43) (1.07) (1.65)
∆ NAE Liquidity *Arca -0.186 -0.393 -0.924 0.375 0.142** -0.025 0.044* 0.293 0.070** 1.129* 0.041 -2.034
(-1.35) (-1.37) (-1.34) (1.09) (2.26) (-0.53) (1.73) (1.22) (2.38) (1.79) (0.71) (-1.11) ∆ Home Liquidity*Arca -0.017 0.105 -0.201* 0.034 0.062 -0.040 0.191*** -0.156 0.011** -0.201 -0.018 0.334
(-0.57) (0.70) (-1.93) (0.32) (1.26) (-1.08) (4.18) (-1.37) (2.33) (-1.03) (-0.39) (0.85)
R-squared 0.051 0.038 0.029 0.067 0.064 0.031 0.036 0.042 0.043 0.038 0.063 0.075
44
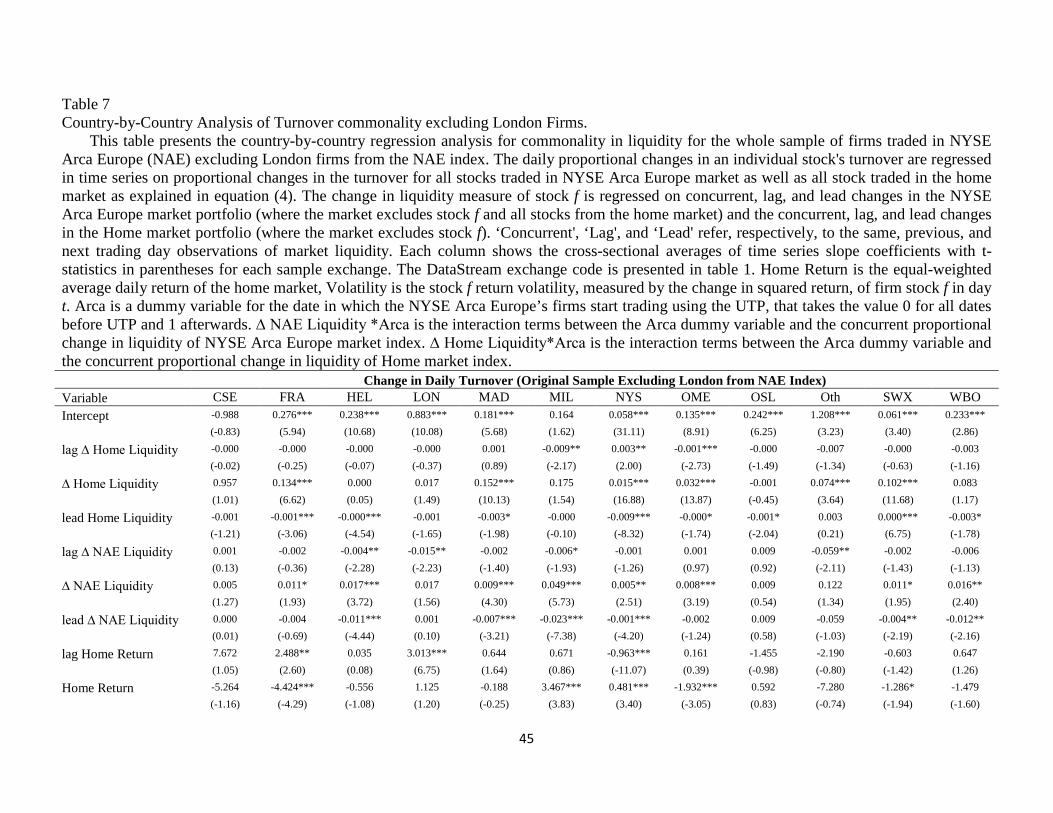
Table 7 Country-by-Country Analysis of Turnover commonality excluding London Firms.
This table presents the country-by-country regression analysis for commonality in liquidity for the whole sample of firms traded in NYSE Arca Europe (NAE) excluding London firms from the NAE index. The daily proportional changes in an individual stock's turnover are regressed in time series on proportional changes in the turnover for all stocks traded in NYSE Arca Europe market as well as all stock traded in the home market as explained in equation (4). The change in liquidity measure of stock f is regressed on concurrent, lag, and lead changes in the NYSE Arca Europe market portfolio (where the market excludes stock f and all stocks from the home market) and the concurrent, lag, and lead changes in the Home market portfolio (where the market excludes stock f). ‘Concurrent', ‘Lag', and ‘Lead' refer, respectively, to the same, previous, and next trading day observations of market liquidity. Each column shows the cross-sectional averages of time series slope coefficients with t-statistics in parentheses for each sample exchange. The DataStream exchange code is presented in table 1. Home Return is the equal-weighted average daily return of the home market, Volatility is the stock f return volatility, measured by the change in squared return, of firm stock f in day t. Arca is a dummy variable for the date in which the NYSE Arca Europe’s firms start trading using the UTP, that takes the value 0 for all dates before UTP and 1 afterwards. ∆ NAE Liquidity *Arca is the interaction terms between the Arca dummy variable and the concurrent proportional change in liquidity of NYSE Arca Europe market index. ∆ Home Liquidity*Arca is the interaction terms between the Arca dummy variable and the concurrent proportional change in liquidity of Home market index. Change in Daily Turnover (Original Sample Excluding London from NAE Index) Variable CSE FRA HEL LON MAD MIL NYS OME OSL Oth SWX WBO Intercept -0.988 0.276*** 0.238*** 0.883*** 0.181*** 0.164 0.058*** 0.135*** 0.242*** 1.208*** 0.061*** 0.233***
(-0.83) (5.94) (10.68) (10.08) (5.68) (1.62) (31.11) (8.91) (6.25) (3.23) (3.40) (2.86)
lag ∆ Home Liquidity -0.000 -0.000 -0.000 -0.000 0.001 -0.009** 0.003** -0.001*** -0.000 -0.007 -0.000 -0.003
(-0.02) (-0.25) (-0.07) (-0.37) (0.89) (-2.17) (2.00) (-2.73) (-1.49) (-1.34) (-0.63) (-1.16)
∆ Home Liquidity 0.957 0.134*** 0.000 0.017 0.152*** 0.175 0.015*** 0.032*** -0.001 0.074*** 0.102*** 0.083
(1.01) (6.62) (0.05) (1.49) (10.13) (1.54) (16.88) (13.87) (-0.45) (3.64) (11.68) (1.17)
lead Home Liquidity -0.001 -0.001*** -0.000*** -0.001 -0.003* -0.000 -0.009*** -0.000* -0.001* 0.003 0.000*** -0.003*
(-1.21) (-3.06) (-4.54) (-1.65) (-1.98) (-0.10) (-8.32) (-1.74) (-2.04) (0.21) (6.75) (-1.78)
lag ∆ NAE Liquidity 0.001 -0.002 -0.004** -0.015** -0.002 -0.006* -0.001 0.001 0.009 -0.059** -0.002 -0.006
(0.13) (-0.36) (-2.28) (-2.23) (-1.40) (-1.93) (-1.26) (0.97) (0.92) (-2.11) (-1.43) (-1.13)
∆ NAE Liquidity 0.005 0.011* 0.017*** 0.017 0.009*** 0.049*** 0.005** 0.008*** 0.009 0.122 0.011* 0.016**
(1.27) (1.93) (3.72) (1.56) (4.30) (5.73) (2.51) (3.19) (0.54) (1.34) (1.95) (2.40)
lead ∆ NAE Liquidity 0.000 -0.004 -0.011*** 0.001 -0.007*** -0.023*** -0.001*** -0.002 0.009 -0.059 -0.004** -0.012**
(0.01) (-0.69) (-4.44) (0.10) (-3.21) (-7.38) (-4.20) (-1.24) (0.58) (-1.03) (-2.19) (-2.16)
lag Home Return 7.672 2.488** 0.035 3.013*** 0.644 0.671 -0.963*** 0.161 -1.455 -2.190 -0.603 0.647
(1.05) (2.60) (0.08) (6.75) (1.64) (0.86) (-11.07) (0.39) (-0.98) (-0.80) (-1.42) (1.26)
Home Return -5.264 -4.424*** -0.556 1.125 -0.188 3.467*** 0.481*** -1.932*** 0.592 -7.280 -1.286* -1.479
(-1.16) (-4.29) (-1.08) (1.20) (-0.25) (3.83) (3.40) (-3.05) (0.83) (-0.74) (-1.94) (-1.60)
45
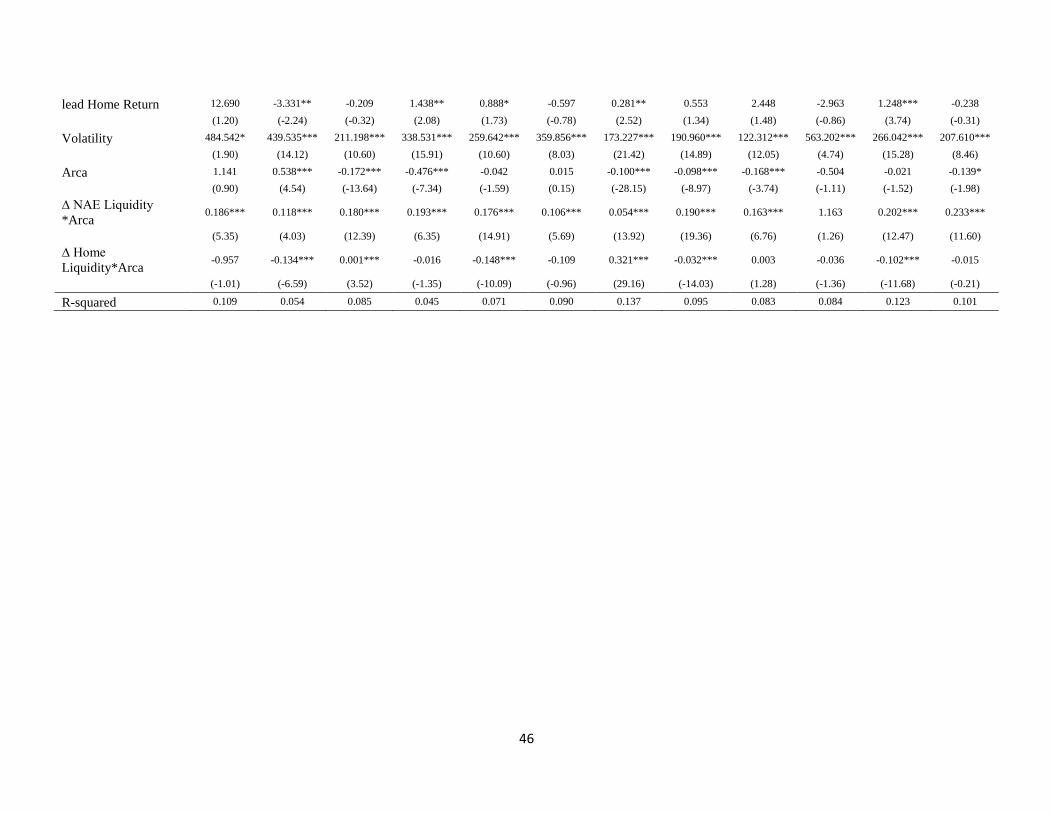
lead Home Return 12.690 -3.331** -0.209 1.438** 0.888* -0.597 0.281** 0.553 2.448 -2.963 1.248*** -0.238
(1.20) (-2.24) (-0.32) (2.08) (1.73) (-0.78) (2.52) (1.34) (1.48) (-0.86) (3.74) (-0.31)
Volatility 484.542* 439.535*** 211.198*** 338.531*** 259.642*** 359.856*** 173.227*** 190.960*** 122.312*** 563.202*** 266.042*** 207.610***
(1.90) (14.12) (10.60) (15.91) (10.60) (8.03) (21.42) (14.89) (12.05) (4.74) (15.28) (8.46)
Arca 1.141 0.538*** -0.172*** -0.476*** -0.042 0.015 -0.100*** -0.098*** -0.168*** -0.504 -0.021 -0.139*
(0.90) (4.54) (-13.64) (-7.34) (-1.59) (0.15) (-28.15) (-8.97) (-3.74) (-1.11) (-1.52) (-1.98)
∆ NAE Liquidity *Arca 0.186*** 0.118*** 0.180*** 0.193*** 0.176*** 0.106*** 0.054*** 0.190*** 0.163*** 1.163 0.202*** 0.233***
(5.35) (4.03) (12.39) (6.35) (14.91) (5.69) (13.92) (19.36) (6.76) (1.26) (12.47) (11.60)
∆ Home Liquidity*Arca -0.957 -0.134*** 0.001*** -0.016 -0.148*** -0.109 0.321*** -0.032*** 0.003 -0.036 -0.102*** -0.015
(-1.01) (-6.59) (3.52) (-1.35) (-10.09) (-0.96) (29.16) (-14.03) (1.28) (-1.36) (-11.68) (-0.21)
R-squared 0.109 0.054 0.085 0.045 0.071 0.090 0.137 0.095 0.083 0.084 0.123 0.101
46
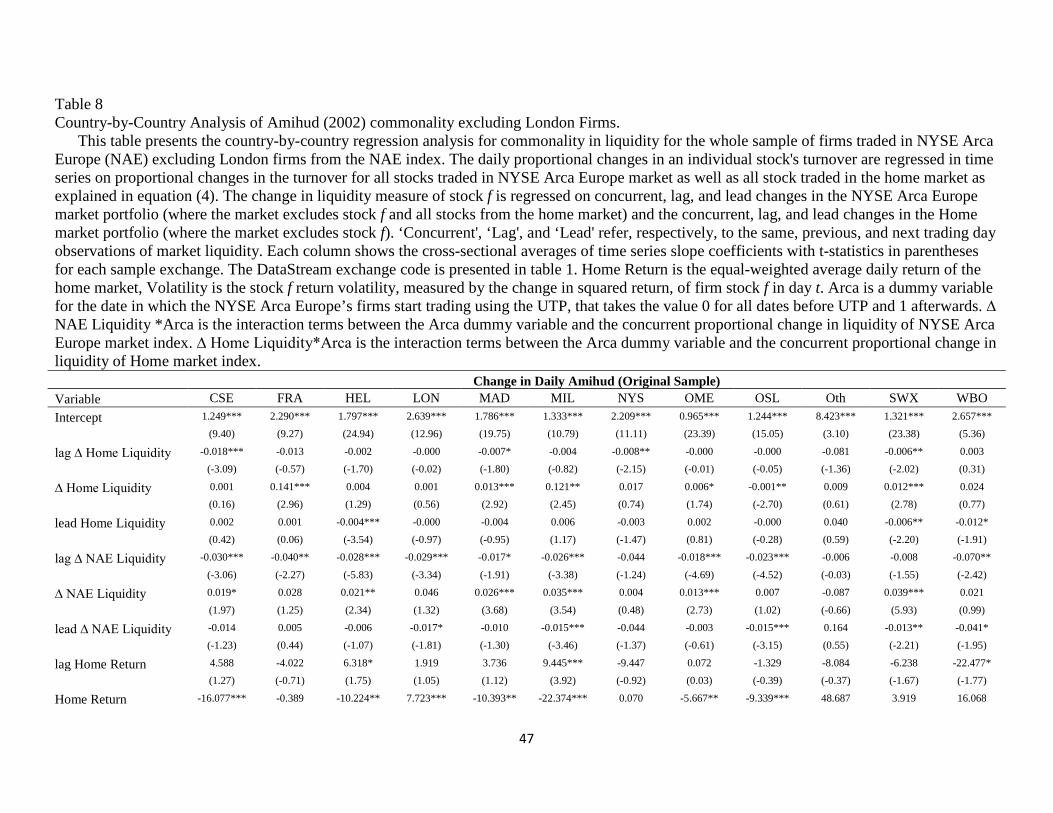
Table 8 Country-by-Country Analysis of Amihud (2002) commonality excluding London Firms.
This table presents the country-by-country regression analysis for commonality in liquidity for the whole sample of firms traded in NYSE Arca Europe (NAE) excluding London firms from the NAE index. The daily proportional changes in an individual stock's turnover are regressed in time series on proportional changes in the turnover for all stocks traded in NYSE Arca Europe market as well as all stock traded in the home market as explained in equation (4). The change in liquidity measure of stock f is regressed on concurrent, lag, and lead changes in the NYSE Arca Europe market portfolio (where the market excludes stock f and all stocks from the home market) and the concurrent, lag, and lead changes in the Home market portfolio (where the market excludes stock f). ‘Concurrent', ‘Lag', and ‘Lead' refer, respectively, to the same, previous, and next trading day observations of market liquidity. Each column shows the cross-sectional averages of time series slope coefficients with t-statistics in parentheses for each sample exchange. The DataStream exchange code is presented in table 1. Home Return is the equal-weighted average daily return of the home market, Volatility is the stock f return volatility, measured by the change in squared return, of firm stock f in day t. Arca is a dummy variable for the date in which the NYSE Arca Europe’s firms start trading using the UTP, that takes the value 0 for all dates before UTP and 1 afterwards. ∆ NAE Liquidity *Arca is the interaction terms between the Arca dummy variable and the concurrent proportional change in liquidity of NYSE Arca Europe market index. ∆ Home Liquidity*Arca is the interaction terms between the Arca dummy variable and the concurrent proportional change in liquidity of Home market index. Change in Daily Amihud (Original Sample) Variable CSE FRA HEL LON MAD MIL NYS OME OSL Oth SWX WBO Intercept 1.249*** 2.290*** 1.797*** 2.639*** 1.786*** 1.333*** 2.209*** 0.965*** 1.244*** 8.423*** 1.321*** 2.657***
(9.40) (9.27) (24.94) (12.96) (19.75) (10.79) (11.11) (23.39) (15.05) (3.10) (23.38) (5.36)
lag ∆ Home Liquidity -0.018*** -0.013 -0.002 -0.000 -0.007* -0.004 -0.008** -0.000 -0.000 -0.081 -0.006** 0.003
(-3.09) (-0.57) (-1.70) (-0.02) (-1.80) (-0.82) (-2.15) (-0.01) (-0.05) (-1.36) (-2.02) (0.31)
∆ Home Liquidity 0.001 0.141*** 0.004 0.001 0.013*** 0.121** 0.017 0.006* -0.001** 0.009 0.012*** 0.024
(0.16) (2.96) (1.29) (0.56) (2.92) (2.45) (0.74) (1.74) (-2.70) (0.61) (2.78) (0.77)
lead Home Liquidity 0.002 0.001 -0.004*** -0.000 -0.004 0.006 -0.003 0.002 -0.000 0.040 -0.006** -0.012*
(0.42) (0.06) (-3.54) (-0.97) (-0.95) (1.17) (-1.47) (0.81) (-0.28) (0.59) (-2.20) (-1.91)
lag ∆ NAE Liquidity -0.030*** -0.040** -0.028*** -0.029*** -0.017* -0.026*** -0.044 -0.018*** -0.023*** -0.006 -0.008 -0.070**
(-3.06) (-2.27) (-5.83) (-3.34) (-1.91) (-3.38) (-1.24) (-4.69) (-4.52) (-0.03) (-1.55) (-2.42)
∆ NAE Liquidity 0.019* 0.028 0.021** 0.046 0.026*** 0.035*** 0.004 0.013*** 0.007 -0.087 0.039*** 0.021
(1.97) (1.25) (2.34) (1.32) (3.68) (3.54) (0.48) (2.73) (1.02) (-0.66) (5.93) (0.99)
lead ∆ NAE Liquidity -0.014 0.005 -0.006 -0.017* -0.010 -0.015*** -0.044 -0.003 -0.015*** 0.164 -0.013** -0.041*
(-1.23) (0.44) (-1.07) (-1.81) (-1.30) (-3.46) (-1.37) (-0.61) (-3.15) (0.55) (-2.21) (-1.95)
lag Home Return 4.588 -4.022 6.318* 1.919 3.736 9.445*** -9.447 0.072 -1.329 -8.084 -6.238 -22.477*
(1.27) (-0.71) (1.75) (1.05) (1.12) (3.92) (-0.92) (0.03) (-0.39) (-0.37) (-1.67) (-1.77)
Home Return -16.077*** -0.389 -10.224** 7.723*** -10.393** -22.374*** 0.070 -5.667** -9.339*** 48.687 3.919 16.068
47
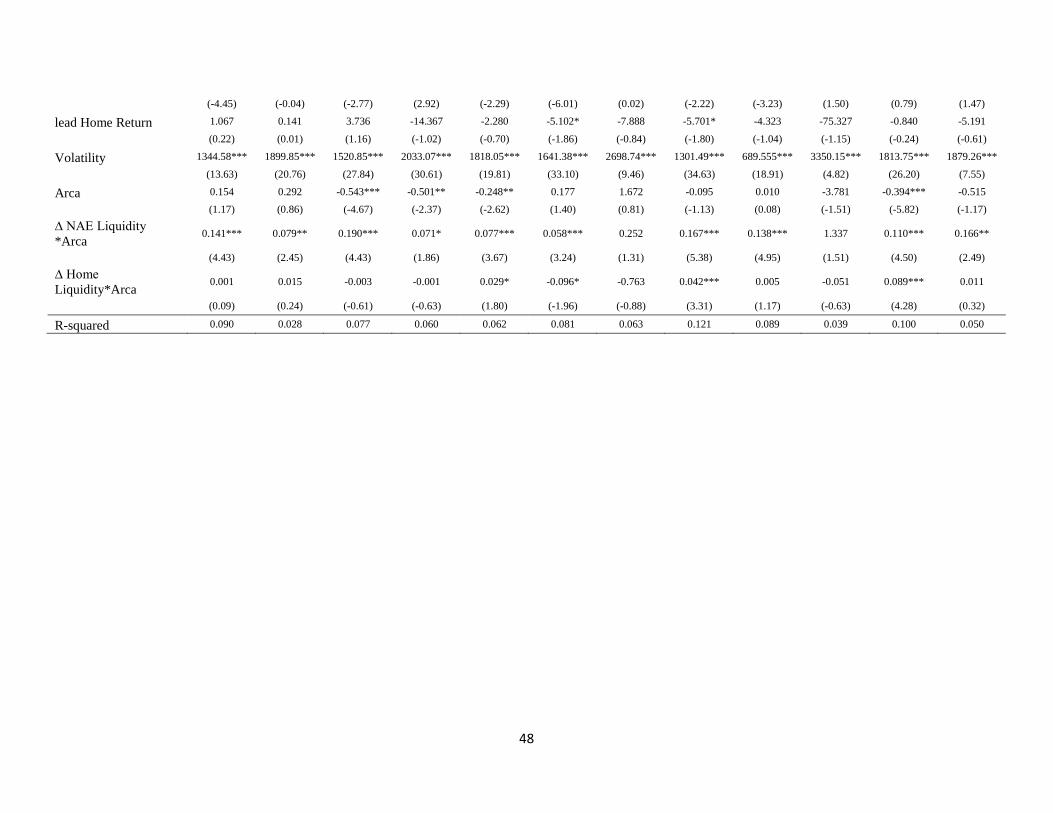
(-4.45) (-0.04) (-2.77) (2.92) (-2.29) (-6.01) (0.02) (-2.22) (-3.23) (1.50) (0.79) (1.47)
lead Home Return 1.067 0.141 3.736 -14.367 -2.280 -5.102* -7.888 -5.701* -4.323 -75.327 -0.840 -5.191
(0.22) (0.01) (1.16) (-1.02) (-0.70) (-1.86) (-0.84) (-1.80) (-1.04) (-1.15) (-0.24) (-0.61)
Volatility 1344.58*** 1899.85*** 1520.85*** 2033.07*** 1818.05*** 1641.38*** 2698.74*** 1301.49*** 689.555*** 3350.15*** 1813.75*** 1879.26***
(13.63) (20.76) (27.84) (30.61) (19.81) (33.10) (9.46) (34.63) (18.91) (4.82) (26.20) (7.55)
Arca 0.154 0.292 -0.543*** -0.501** -0.248** 0.177 1.672 -0.095 0.010 -3.781 -0.394*** -0.515
(1.17) (0.86) (-4.67) (-2.37) (-2.62) (1.40) (0.81) (-1.13) (0.08) (-1.51) (-5.82) (-1.17) ∆ NAE Liquidity *Arca 0.141*** 0.079** 0.190*** 0.071* 0.077*** 0.058*** 0.252 0.167*** 0.138*** 1.337 0.110*** 0.166**
(4.43) (2.45) (4.43) (1.86) (3.67) (3.24) (1.31) (5.38) (4.95) (1.51) (4.50) (2.49) ∆ Home Liquidity*Arca 0.001 0.015 -0.003 -0.001 0.029* -0.096* -0.763 0.042*** 0.005 -0.051 0.089*** 0.011
(0.09) (0.24) (-0.61) (-0.63) (1.80) (-1.96) (-0.88) (3.31) (1.17) (-0.63) (4.28) (0.32)
R-squared 0.090 0.028 0.077 0.060 0.062 0.081 0.063 0.121 0.089 0.039 0.100 0.050
48
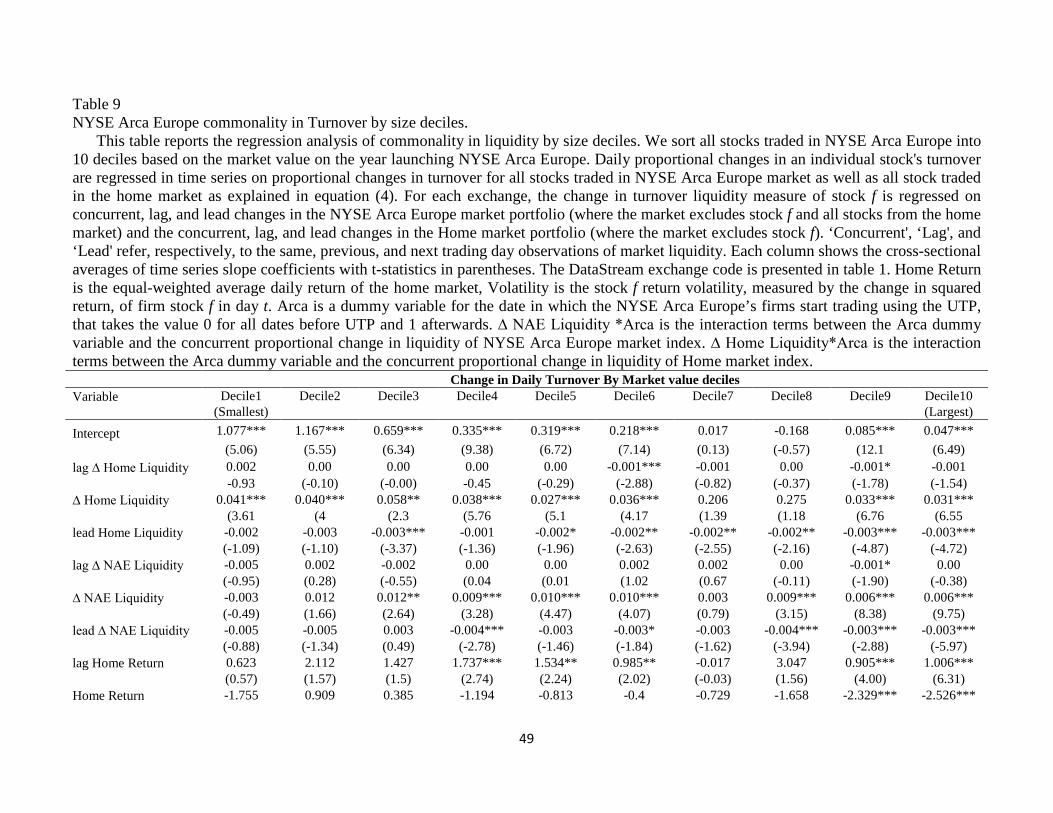
Table 9 NYSE Arca Europe commonality in Turnover by size deciles.
This table reports the regression analysis of commonality in liquidity by size deciles. We sort all stocks traded in NYSE Arca Europe into 10 deciles based on the market value on the year launching NYSE Arca Europe. Daily proportional changes in an individual stock's turnover are regressed in time series on proportional changes in turnover for all stocks traded in NYSE Arca Europe market as well as all stock traded in the home market as explained in equation (4). For each exchange, the change in turnover liquidity measure of stock f is regressed on concurrent, lag, and lead changes in the NYSE Arca Europe market portfolio (where the market excludes stock f and all stocks from the home market) and the concurrent, lag, and lead changes in the Home market portfolio (where the market excludes stock f). ‘Concurrent', ‘Lag', and ‘Lead' refer, respectively, to the same, previous, and next trading day observations of market liquidity. Each column shows the cross-sectional averages of time series slope coefficients with t-statistics in parentheses. The DataStream exchange code is presented in table 1. Home Return is the equal-weighted average daily return of the home market, Volatility is the stock f return volatility, measured by the change in squared return, of firm stock f in day t. Arca is a dummy variable for the date in which the NYSE Arca Europe’s firms start trading using the UTP, that takes the value 0 for all dates before UTP and 1 afterwards. ∆ NAE Liquidity *Arca is the interaction terms between the Arca dummy variable and the concurrent proportional change in liquidity of NYSE Arca Europe market index. ∆ Home Liquidity*Arca is the interaction terms between the Arca dummy variable and the concurrent proportional change in liquidity of Home market index. Change in Daily Turnover By Market value deciles Variable Decile1 Decile2 Decile3 Decile4 Decile5 Decile6 Decile7 Decile8 Decile9 Decile10 (Smallest) (Largest) Intercept 1.077*** 1.167*** 0.659*** 0.335*** 0.319*** 0.218*** 0.017 -0.168 0.085*** 0.047***
(5.06) (5.55) (6.34) (9.38) (6.72) (7.14) (0.13) (-0.57) (12.1 (6.49)
lag ∆ Home Liquidity 0.002 0.00 0.00 0.00 0.00 -0.001*** -0.001 0.00 -0.001* -0.001
-0.93 (-0.10) (-0.00) -0.45 (-0.29) (-2.88) (-0.82) (-0.37) (-1.78) (-1.54)
∆ Home Liquidity 0.041*** 0.040*** 0.058** 0.038*** 0.027*** 0.036*** 0.206 0.275 0.033*** 0.031***
(3.61 (4 (2.3 (5.76 (5.1 (4.17 (1.39 (1.18 (6.76 (6.55
lead Home Liquidity -0.002 -0.003 -0.003*** -0.001 -0.002* -0.002** -0.002** -0.002** -0.003*** -0.003***
(-1.09) (-1.10) (-3.37) (-1.36) (-1.96) (-2.63) (-2.55) (-2.16) (-4.87) (-4.72)
lag ∆ NAE Liquidity -0.005 0.002 -0.002 0.00 0.00 0.002 0.002 0.00 -0.001* 0.00
(-0.95) (0.28) (-0.55) (0.04 (0.01 (1.02 (0.67 (-0.11) (-1.90) (-0.38)
∆ NAE Liquidity -0.003 0.012 0.012** 0.009*** 0.010*** 0.010*** 0.003 0.009*** 0.006*** 0.006***
(-0.49) (1.66) (2.64) (3.28) (4.47) (4.07) (0.79) (3.15) (8.38) (9.75)
lead ∆ NAE Liquidity -0.005 -0.005 0.003 -0.004*** -0.003 -0.003* -0.003 -0.004*** -0.003*** -0.003***
(-0.88) (-1.34) (0.49) (-2.78) (-1.46) (-1.84) (-1.62) (-3.94) (-2.88) (-5.97)
lag Home Return 0.623 2.112 1.427 1.737*** 1.534** 0.985** -0.017 3.047 0.905*** 1.006***
(0.57) (1.57) (1.5) (2.74) (2.24) (2.02) (-0.03) (1.56) (4.00) (6.31)
Home Return -1.755 0.909 0.385 -1.194 -0.813 -0.4 -0.729 -1.658 -2.329*** -2.526***
49
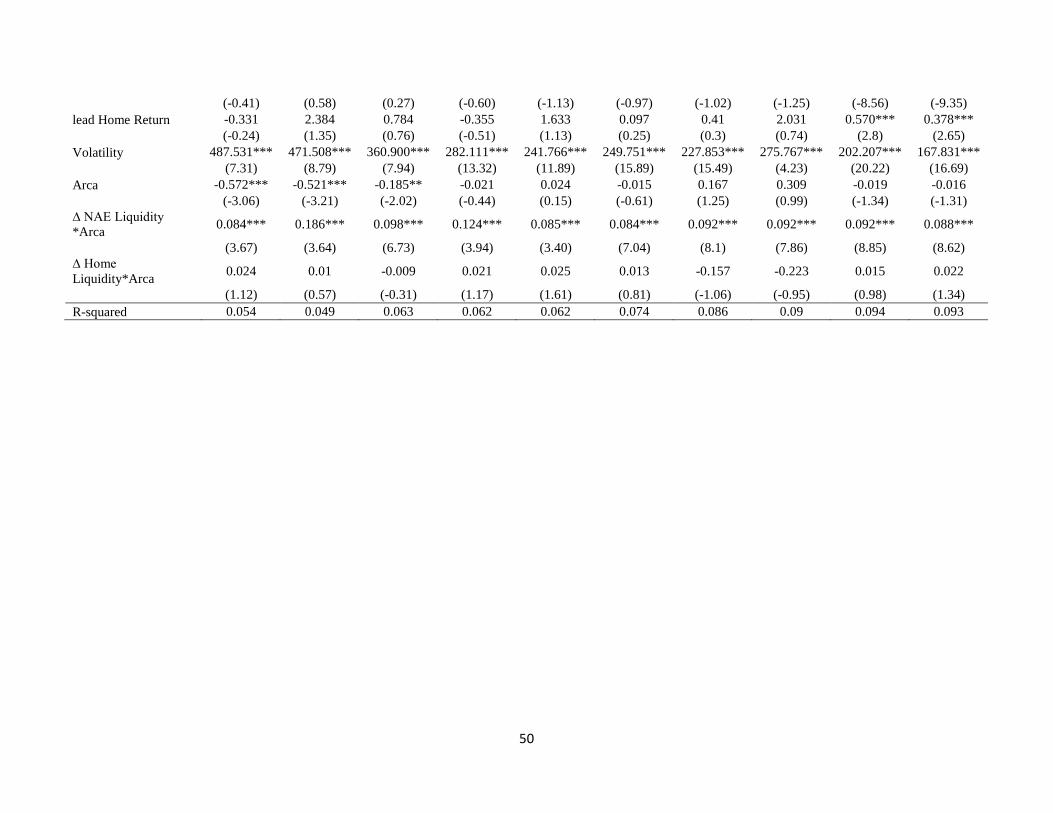
(-0.41) (0.58) (0.27) (-0.60) (-1.13) (-0.97) (-1.02) (-1.25) (-8.56) (-9.35)
lead Home Return -0.331 2.384 0.784 -0.355 1.633 0.097 0.41 2.031 0.570*** 0.378***
(-0.24) (1.35) (0.76) (-0.51) (1.13) (0.25) (0.3) (0.74) (2.8) (2.65)
Volatility 487.531*** 471.508*** 360.900*** 282.111*** 241.766*** 249.751*** 227.853*** 275.767*** 202.207*** 167.831***
(7.31) (8.79) (7.94) (13.32) (11.89) (15.89) (15.49) (4.23) (20.22) (16.69)
Arca -0.572*** -0.521*** -0.185** -0.021 0.024 -0.015 0.167 0.309 -0.019 -0.016
(-3.06) (-3.21) (-2.02) (-0.44) (0.15) (-0.61) (1.25) (0.99) (-1.34) (-1.31)
∆ NAE Liquidity *Arca 0.084*** 0.186*** 0.098*** 0.124*** 0.085*** 0.084*** 0.092*** 0.092*** 0.092*** 0.088***
(3.67) (3.64) (6.73) (3.94) (3.40) (7.04) (8.1) (7.86) (8.85) (8.62)
∆ Home Liquidity*Arca 0.024 0.01 -0.009 0.021 0.025 0.013 -0.157 -0.223 0.015 0.022
(1.12) (0.57) (-0.31) (1.17) (1.61) (0.81) (-1.06) (-0.95) (0.98) (1.34)
R-squared 0.054 0.049 0.063 0.062 0.062 0.074 0.086 0.09 0.094 0.093
50
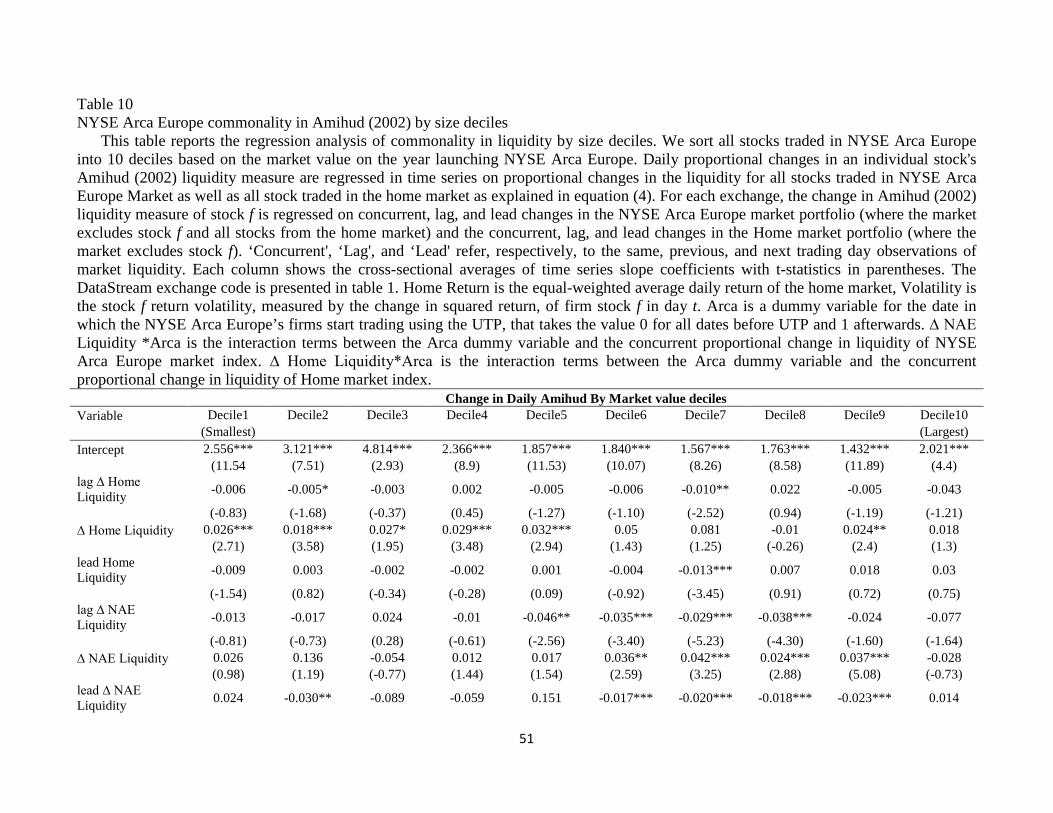
Table 10 NYSE Arca Europe commonality in Amihud (2002) by size deciles
This table reports the regression analysis of commonality in liquidity by size deciles. We sort all stocks traded in NYSE Arca Europe into 10 deciles based on the market value on the year launching NYSE Arca Europe. Daily proportional changes in an individual stock's Amihud (2002) liquidity measure are regressed in time series on proportional changes in the liquidity for all stocks traded in NYSE Arca Europe Market as well as all stock traded in the home market as explained in equation (4). For each exchange, the change in Amihud (2002) liquidity measure of stock f is regressed on concurrent, lag, and lead changes in the NYSE Arca Europe market portfolio (where the market excludes stock f and all stocks from the home market) and the concurrent, lag, and lead changes in the Home market portfolio (where the market excludes stock f). ‘Concurrent', ‘Lag', and ‘Lead' refer, respectively, to the same, previous, and next trading day observations of market liquidity. Each column shows the cross-sectional averages of time series slope coefficients with t-statistics in parentheses. The DataStream exchange code is presented in table 1. Home Return is the equal-weighted average daily return of the home market, Volatility is the stock f return volatility, measured by the change in squared return, of firm stock f in day t. Arca is a dummy variable for the date in which the NYSE Arca Europe’s firms start trading using the UTP, that takes the value 0 for all dates before UTP and 1 afterwards. ∆ NAE Liquidity *Arca is the interaction terms between the Arca dummy variable and the concurrent proportional change in liquidity of NYSE Arca Europe market index. ∆ Home Liquidity*Arca is the interaction terms between the Arca dummy variable and the concurrent proportional change in liquidity of Home market index. Change in Daily Amihud By Market value deciles Variable Decile1 Decile2 Decile3 Decile4 Decile5 Decile6 Decile7 Decile8 Decile9 Decile10 (Smallest) (Largest) Intercept 2.556*** 3.121*** 4.814*** 2.366*** 1.857*** 1.840*** 1.567*** 1.763*** 1.432*** 2.021***
(11.54 (7.51) (2.93) (8.9) (11.53) (10.07) (8.26) (8.58) (11.89) (4.4)
lag ∆ Home Liquidity -0.006 -0.005* -0.003 0.002 -0.005 -0.006 -0.010** 0.022 -0.005 -0.043
(-0.83) (-1.68) (-0.37) (0.45) (-1.27) (-1.10) (-2.52) (0.94) (-1.19) (-1.21)
∆ Home Liquidity 0.026*** 0.018*** 0.027* 0.029*** 0.032*** 0.05 0.081 -0.01 0.024** 0.018
(2.71) (3.58) (1.95) (3.48) (2.94) (1.43) (1.25) (-0.26) (2.4) (1.3)
lead Home Liquidity -0.009 0.003 -0.002 -0.002 0.001 -0.004 -0.013*** 0.007 0.018 0.03
(-1.54) (0.82) (-0.34) (-0.28) (0.09) (-0.92) (-3.45) (0.91) (0.72) (0.75)
lag ∆ NAE Liquidity -0.013 -0.017 0.024 -0.01 -0.046** -0.035*** -0.029*** -0.038*** -0.024 -0.077
(-0.81) (-0.73) (0.28) (-0.61) (-2.56) (-3.40) (-5.23) (-4.30) (-1.60) (-1.64)
∆ NAE Liquidity 0.026 0.136 -0.054 0.012 0.017 0.036** 0.042*** 0.024*** 0.037*** -0.028
(0.98) (1.19) (-0.77) (1.44) (1.54) (2.59) (3.25) (2.88) (5.08) (-0.73)
lead ∆ NAE Liquidity 0.024 -0.030** -0.089 -0.059 0.151 -0.017*** -0.020*** -0.018*** -0.023*** 0.014
51
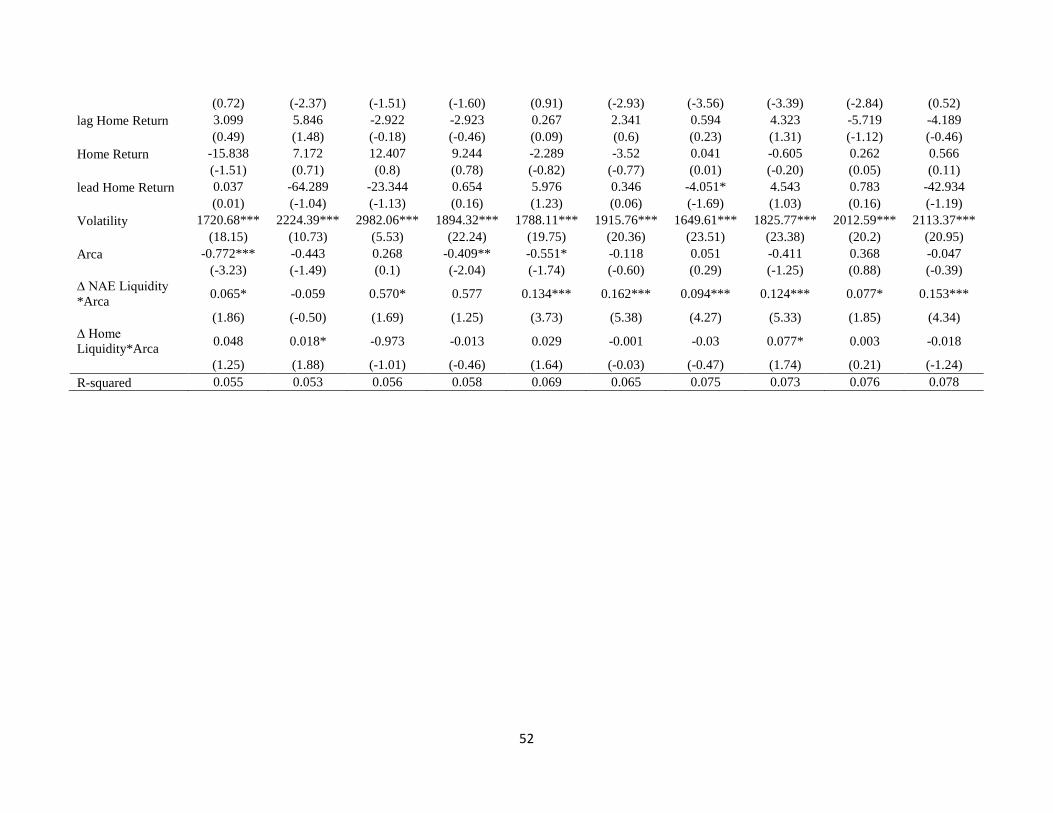
(0.72) (-2.37) (-1.51) (-1.60) (0.91) (-2.93) (-3.56) (-3.39) (-2.84) (0.52)
lag Home Return 3.099 5.846 -2.922 -2.923 0.267 2.341 0.594 4.323 -5.719 -4.189
(0.49) (1.48) (-0.18) (-0.46) (0.09) (0.6) (0.23) (1.31) (-1.12) (-0.46)
Home Return -15.838 7.172 12.407 9.244 -2.289 -3.52 0.041 -0.605 0.262 0.566
(-1.51) (0.71) (0.8) (0.78) (-0.82) (-0.77) (0.01) (-0.20) (0.05) (0.11)
lead Home Return 0.037 -64.289 -23.344 0.654 5.976 0.346 -4.051* 4.543 0.783 -42.934
(0.01) (-1.04) (-1.13) (0.16) (1.23) (0.06) (-1.69) (1.03) (0.16) (-1.19)
Volatility 1720.68*** 2224.39*** 2982.06*** 1894.32*** 1788.11*** 1915.76*** 1649.61*** 1825.77*** 2012.59*** 2113.37***
(18.15) (10.73) (5.53) (22.24) (19.75) (20.36) (23.51) (23.38) (20.2) (20.95)
Arca -0.772*** -0.443 0.268 -0.409** -0.551* -0.118 0.051 -0.411 0.368 -0.047
(-3.23) (-1.49) (0.1) (-2.04) (-1.74) (-0.60) (0.29) (-1.25) (0.88) (-0.39)
∆ NAE Liquidity *Arca 0.065* -0.059 0.570* 0.577 0.134*** 0.162*** 0.094*** 0.124*** 0.077* 0.153***
(1.86) (-0.50) (1.69) (1.25) (3.73) (5.38) (4.27) (5.33) (1.85) (4.34)
∆ Home Liquidity*Arca 0.048 0.018* -0.973 -0.013 0.029 -0.001 -0.03 0.077* 0.003 -0.018
(1.25) (1.88) (-1.01) (-0.46) (1.64) (-0.03) (-0.47) (1.74) (0.21) (-1.24)
R-squared 0.055 0.053 0.056 0.058 0.069 0.065 0.075 0.073 0.076 0.078
52
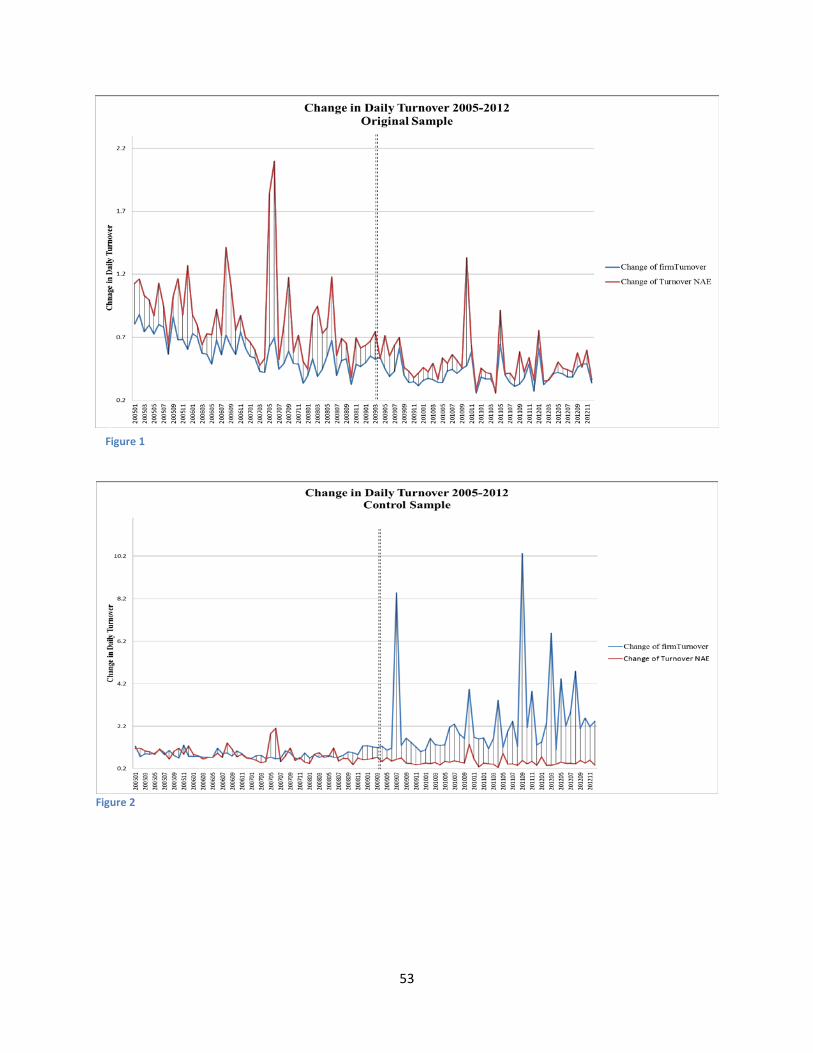
Figure 2
Figure 1
53
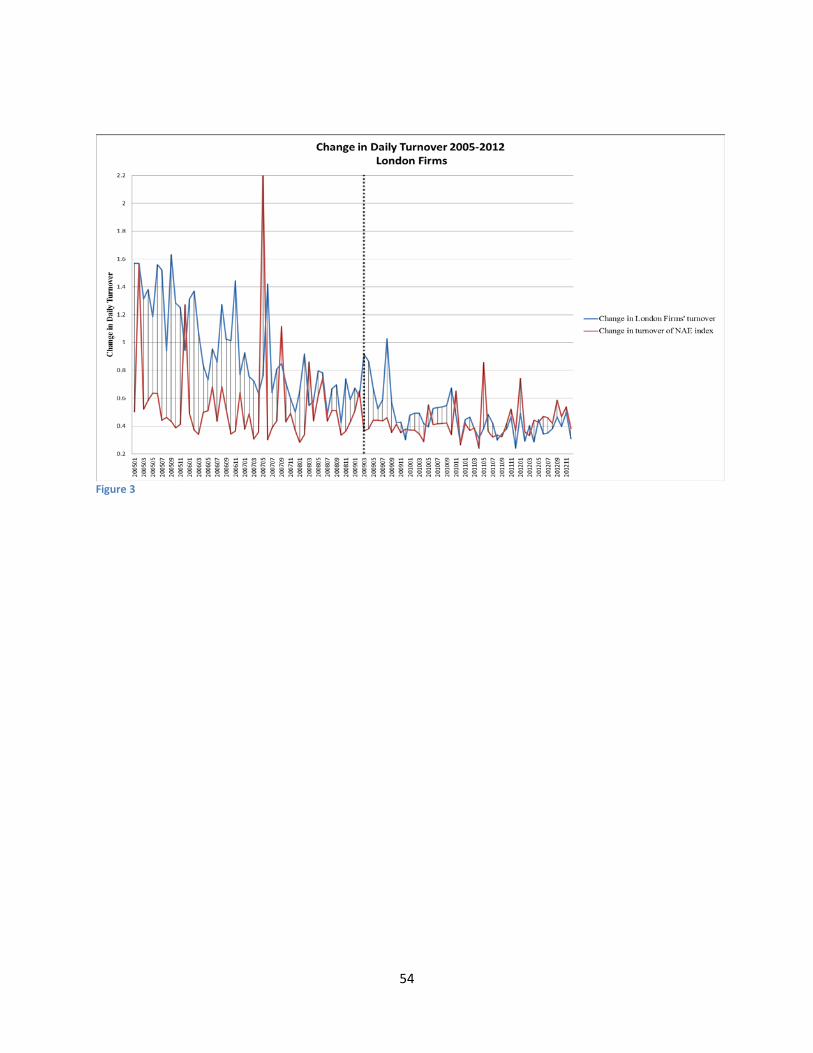
Figure 3
54
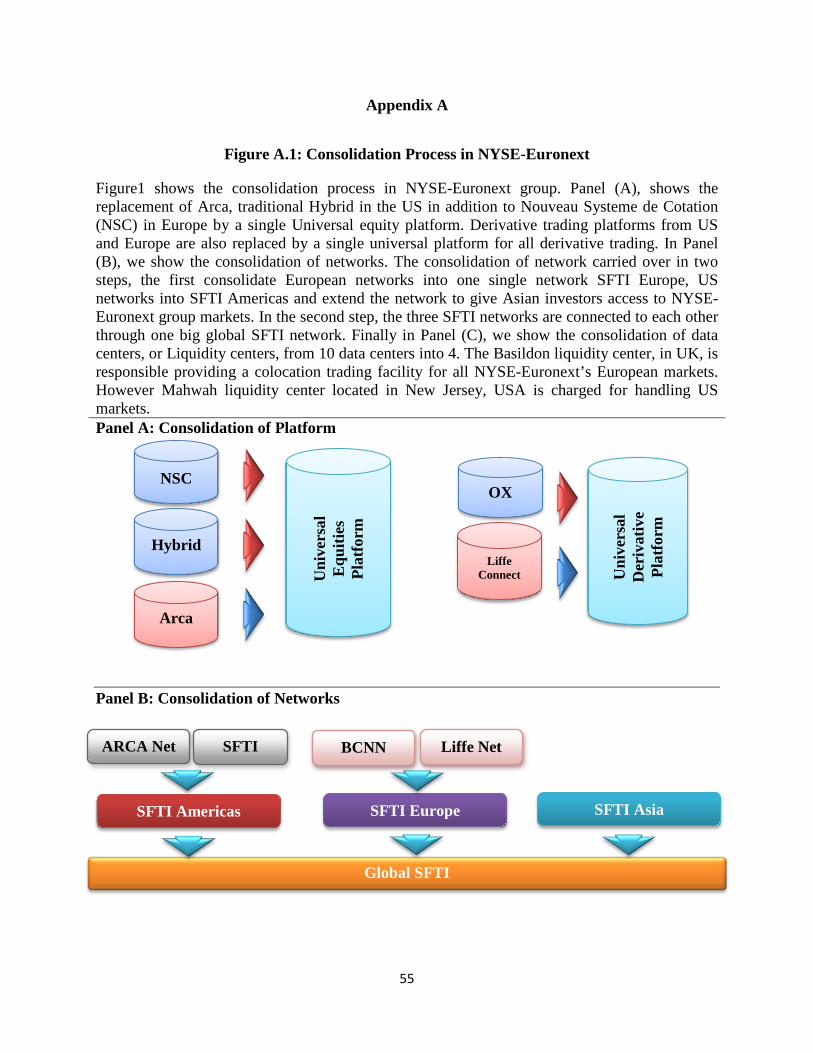
Appendix A
Figure A.1: Consolidation Process in NYSE-Euronext
Figure1 shows the consolidation process in NYSE-Euronext group. Panel (A), shows the replacement of Arca, traditional Hybrid in the US in addition to Nouveau Systeme de Cotation (NSC) in Europe by a single Universal equity platform. Derivative trading platforms from US and Europe are also replaced by a single universal platform for all derivative trading. In Panel (B), we show the consolidation of networks. The consolidation of network carried over in two steps, the first consolidate European networks into one single network SFTI Europe, US networks into SFTI Americas and extend the network to give Asian investors access to NYSE- Euronext group markets. In the second step, the three SFTI networks are connected to each other through one big global SFTI network. Finally in Panel (C), we show the consolidation of data centers, or Liquidity centers, from 10 data centers into 4. The Basildon liquidity center, in UK, is responsible providing a colocation trading facility for all NYSE-Euronext’s European markets. However Mahwah liquidity center located in New Jersey, USA is charged for handling US markets. Panel A: Consolidation of Platform
Panel B: Consolidation of Networks
SFTI Americas SFTI Europe
Global SFTI
SFTI Asia
Uni
vers
al
Equ
ities
Pl
atfo
rm
NSC
Hybrid
Arca
OX
Liffe Connect
Uni
vers
al
Der
ivat
ive
Plat
form
ARCA Net SFTI BCNN Liffe Net
55
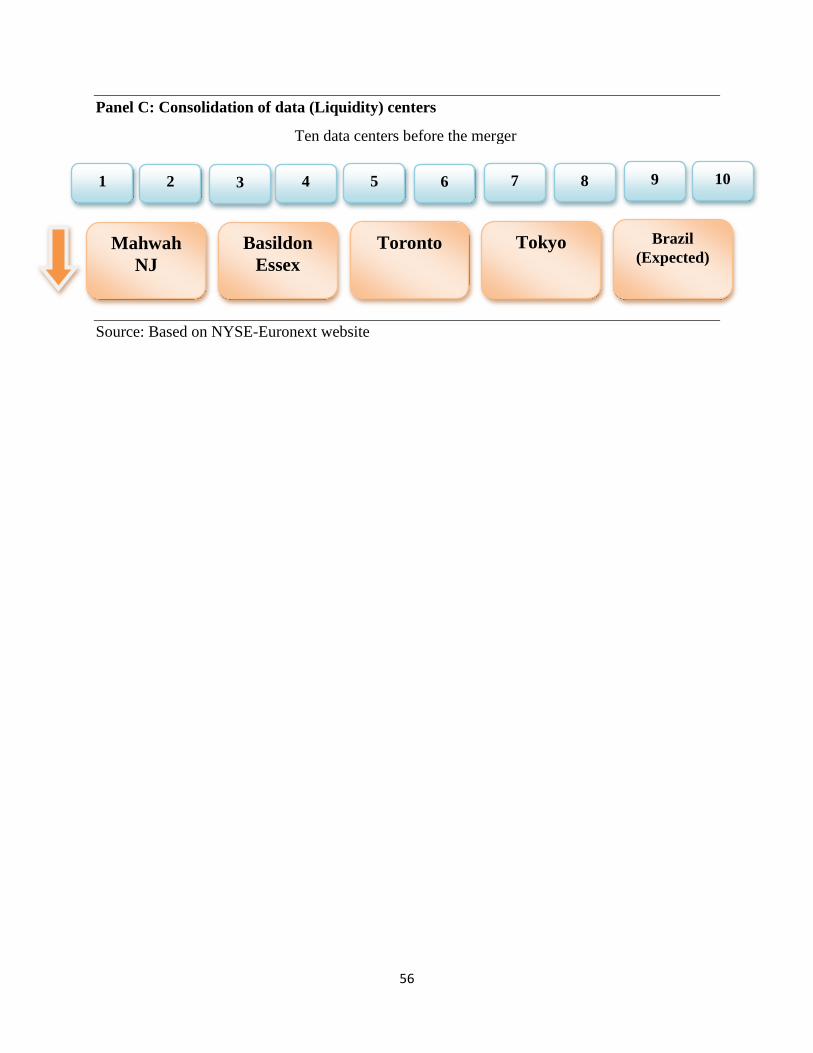
Panel C: Consolidation of data (Liquidity) centers
Source: Based on NYSE-Euronext website
2 6 7 8 9 10 3 4 5 1
Toronto Tokyo Basildon Essex
Brazil (Expected)
Mahwah NJ
Ten data centers before the merger
56
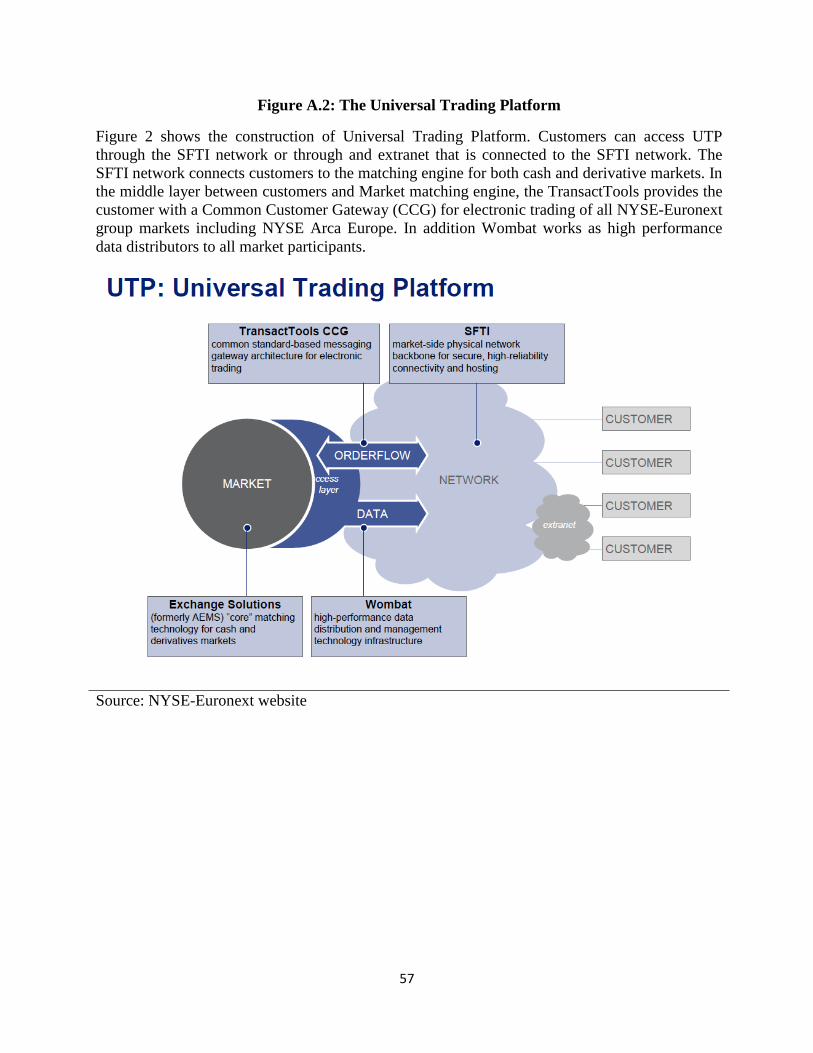
Figure A.2: The Universal Trading Platform
Figure 2 shows the construction of Universal Trading Platform. Customers can access UTP through the SFTI network or through and extranet that is connected to the SFTI network. The SFTI network connects customers to the matching engine for both cash and derivative markets. In the middle layer between customers and Market matching engine, the TransactTools provides the customer with a Common Customer Gateway (CCG) for electronic trading of all NYSE-Euronext group markets including NYSE Arca Europe. In addition Wombat works as high performance data distributors to all market participants.
Source: NYSE-Euronext website
57
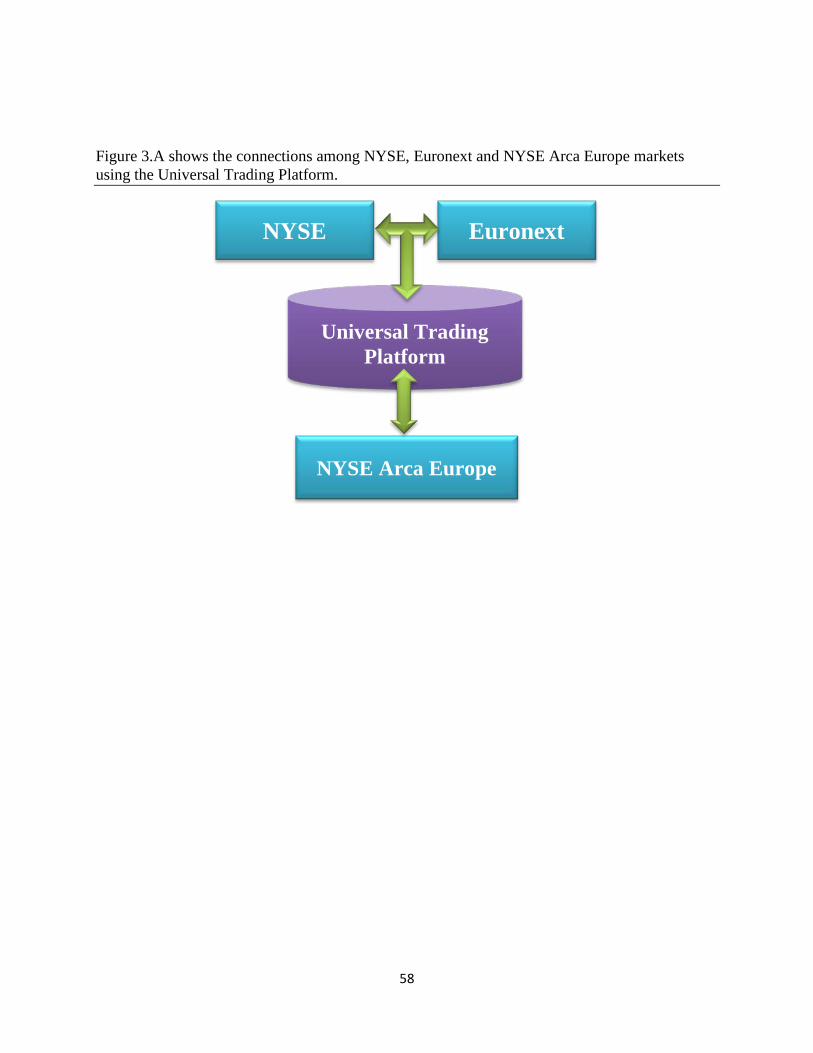
Figure 3.A shows the connections among NYSE, Euronext and NYSE Arca Europe markets using the Universal Trading Platform.
NYSE Euronext
Universal Trading Platform
NYSE Arca Europe
58


![Commonality and Individuality in Writing[1]](https://img.pdfslide.net/doc/110x75/577ce72f1a28abf1039487c6/commonality-and-individuality-in-writing1.jpg)