Embed Size (px)
Citation preview

This document is confidential and proprietary in its entirety. It may be copied and distributed solely for the purpose of evaluation.
© 2013 Navigant Consulting, Inc.
Commonwealth Accelerated
Renewable Thermal Strategy
Final Report
Prepared for:
Massachusetts Department of Energy Resources
Navigant Consulting, Inc.
77 South Bedford Street
Burlington, MA 01803
781-270-0101
www.navigant.com
January 2014

Massachusetts DOER i
Consulting Services for Commonwealth Accelerated Renewable Thermal Strategy
Scope of Service #: RFQQ-ENE-2013-101
Table of Contents
List of Acronyms ........................................................................................................................ v
Executive Summary ................................................................................................................... 1
1 Introduction ....................................................................................................................... 5
1.1 Background ............................................................................................................................................... 5 1.2 Objectives and Goals ............................................................................................................................... 6 1.3 Technologies ............................................................................................................................................. 6
2 Approach............................................................................................................................. 8
2.1 Customer Class Analysis ........................................................................................................................ 9 2.2 Potential Analysis .................................................................................................................................. 13
2.2.1 Model Background ................................................................................................................... 13 2.2.2 Scenario Analysis ..................................................................................................................... 15
2.3 Stakeholder Advisory Group ............................................................................................................... 17 2.4 Cluster Development and Strategy Prioritization Framework........................................................ 18
3 Customer Class Analysis Results ................................................................................ 21
3.1 Customer Classes Prioritization ........................................................................................................... 21 3.2 Potential Analysis Results .................................................................................................................... 22
3.2.1 Energy Impact ........................................................................................................................... 24 3.2.2 Economic Impact ...................................................................................................................... 25 3.2.3 Environmental Impact ............................................................................................................. 29
3.3 Analysis Conclusions ............................................................................................................................ 31
4 Analysis of Strategies in Other Jurisdictions ............................................................ 38
5 Market Barriers ................................................................................................................ 41
6 Recommended Strategy Pathway for Massachusetts ............................................... 42
6.1 Keystone Strategy: Develop Statewide Renewable Thermal Goals ................................................ 43 6.2 Cornerstone Strategies .......................................................................................................................... 44
6.2.1 Leverage, coordinate, and expand efforts across state agencies to meet short-term goals
............................................................................................................................................... 44 6.2.2 Launch comprehensive RT technology information campaign with MassSave ............. 45 6.2.3 Support implementation of long-term, stable performance-based RT incentives .......... 46 6.2.4 Integrate RT in state and public buildings via “Leading by Example” and/or other state
energy programs ................................................................................................................. 47 6.2.5 Integrate RT into the Stretch Energy Code and other building energy codes ................. 48

Massachusetts DOER ii
Consulting Services for Commonwealth Accelerated Renewable Thermal Strategy
Scope of Service #: RFQQ-ENE-2013-101
6.2.6 Provide low-cost financing for renewable thermal through the MassSave HEAT loan
program ................................................................................................................................ 49 6.3 Building Block Strategies ...................................................................................................................... 51
6.3.1 Develop "Thermalize" program, modeled after the successful Massachusetts Solarize
program ................................................................................................................................ 51 6.3.2 Develop comprehensive, online database with technology case studies and
performance metrics ........................................................................................................... 52 6.3.3 Provide data to assist developers and installers identify “high value” renewable
thermal customers .............................................................................................................. 53 6.3.4 Create tool that helps customers self-screen for suitability of RT technologies .............. 54 6.3.5 Support technology exchanges with “state-of-the-art” manufacturers ............................ 55 6.3.6 Create Renewable Thermal Industry Advisory Forum ...................................................... 56 6.3.7 Review market enabling guidance regarding fuel choices and associated GHG
emissions .............................................................................................................................. 57 6.3.8 Institute technical and sales training programs ................................................................... 58 6.3.9 Engage heating oil and propane industry to explore RT business opportunities ........... 59 6.3.10 Integrate renewable thermal into energy protection and assistance programs for low-
income families ................................................................................................................... 60 6.3.11 Integrate RT and EE into community college and vocational school curricula ............. 61
Appendix A MA Market Segment Data ....................................................................... 63
Appendix B MA Customer Classes ............................................................................... 65
Appendix C Technology Assumptions ......................................................................... 66
Appendix D Existing RT Support Programs and Activities ..................................... 69
Appendix E Modeling Scenario Details ....................................................................... 70
Appendix F CARTS Stakeholder Contributors .......................................................... 72
Appendix G Renewable Thermal Impact Analysis Methodology .......................... 73
G.1 GHG Emissions Impact ........................................................................................................................ 73 G.2 Fossil Fuel Demand Impact ................................................................................................................. 74 G.3 Jobs Impact ............................................................................................................................................ 75 G.4 Tax Revenue Impact ............................................................................................................................. 79
Appendix H Slides from Second Stakeholder Meeting ............................................ 81
Appendix I Complete List of Strategies ...................................................................... 90
Massachusetts DOER iii
Consulting Services for Commonwealth Accelerated Renewable Thermal Strategy
Scope of Service #: RFQQ-ENE-2013-101
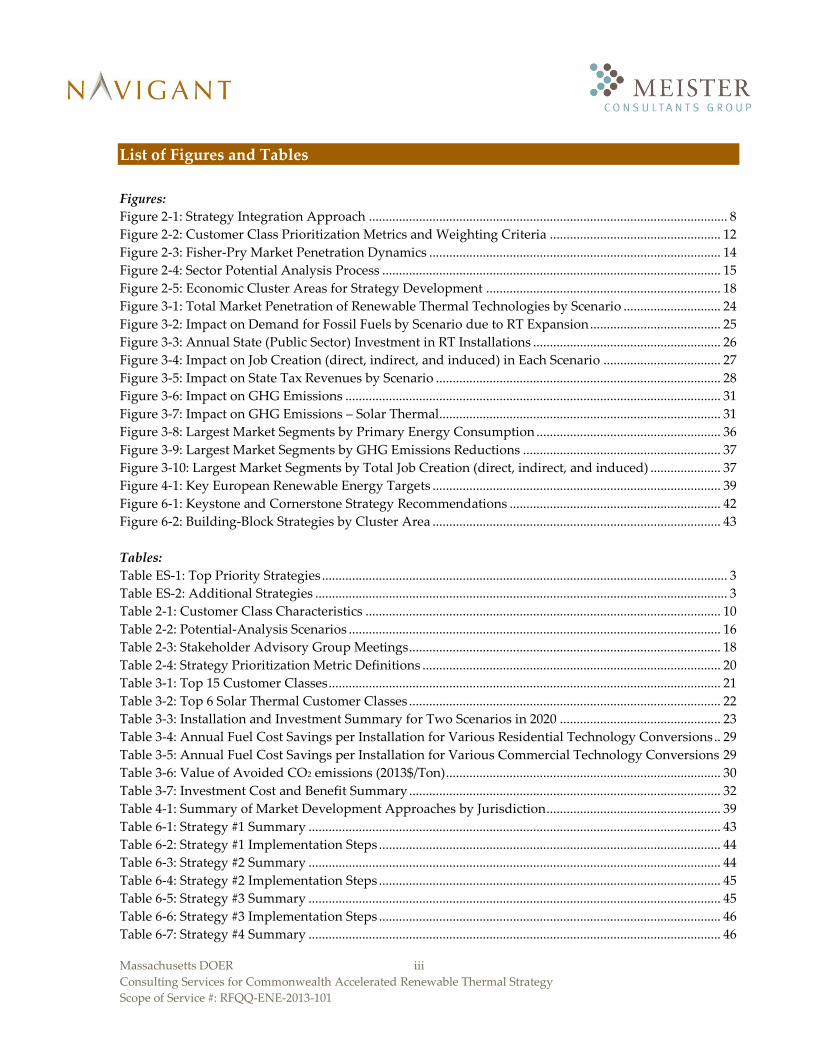
List of Figures and Tables
Figures:
Figure 2-1: Strategy Integration Approach ........................................................................................................... 8 Figure 2-2: Customer Class Prioritization Metrics and Weighting Criteria ................................................... 12 Figure 2-3: Fisher-Pry Market Penetration Dynamics ....................................................................................... 14 Figure 2-4: Sector Potential Analysis Process ..................................................................................................... 15 Figure 2-5: Economic Cluster Areas for Strategy Development ...................................................................... 18 Figure 3-1: Total Market Penetration of Renewable Thermal Technologies by Scenario ............................. 24 Figure 3-2: Impact on Demand for Fossil Fuels by Scenario due to RT Expansion ....................................... 25 Figure 3-3: Annual State (Public Sector) Investment in RT Installations ........................................................ 26 Figure 3-4: Impact on Job Creation (direct, indirect, and induced) in Each Scenario ................................... 27 Figure 3-5: Impact on State Tax Revenues by Scenario ..................................................................................... 28 Figure 3-6: Impact on GHG Emissions ................................................................................................................ 31 Figure 3-7: Impact on GHG Emissions – Solar Thermal.................................................................................... 31 Figure 3-8: Largest Market Segments by Primary Energy Consumption ....................................................... 36 Figure 3-9: Largest Market Segments by GHG Emissions Reductions ........................................................... 37 Figure 3-10: Largest Market Segments by Total Job Creation (direct, indirect, and induced) ..................... 37 Figure 4-1: Key European Renewable Energy Targets ...................................................................................... 39 Figure 6-1: Keystone and Cornerstone Strategy Recommendations ............................................................... 42 Figure 6-2: Building-Block Strategies by Cluster Area ...................................................................................... 43
Tables:
Table ES-1: Top Priority Strategies ......................................................................................................................... 3 Table ES-2: Additional Strategies ........................................................................................................................... 3 Table 2-1: Customer Class Characteristics .......................................................................................................... 10 Table 2-2: Potential-Analysis Scenarios ............................................................................................................... 16 Table 2-3: Stakeholder Advisory Group Meetings ............................................................................................. 18 Table 2-4: Strategy Prioritization Metric Definitions ......................................................................................... 20 Table 3-1: Top 15 Customer Classes ..................................................................................................................... 21 Table 3-2: Top 6 Solar Thermal Customer Classes ............................................................................................. 22 Table 3-3: Installation and Investment Summary for Two Scenarios in 2020 ................................................ 23 Table 3-4: Annual Fuel Cost Savings per Installation for Various Residential Technology Conversions .. 29 Table 3-5: Annual Fuel Cost Savings per Installation for Various Commercial Technology Conversions 29 Table 3-6: Value of Avoided CO2 emissions (2013$/Ton) .................................................................................. 30 Table 3-7: Investment Cost and Benefit Summary ............................................................................................. 32 Table 4-1: Summary of Market Development Approaches by Jurisdiction .................................................... 39 Table 6-1: Strategy #1 Summary ........................................................................................................................... 43 Table 6-2: Strategy #1 Implementation Steps ...................................................................................................... 44 Table 6-3: Strategy #2 Summary ........................................................................................................................... 44 Table 6-4: Strategy #2 Implementation Steps ...................................................................................................... 45 Table 6-5: Strategy #3 Summary ........................................................................................................................... 45 Table 6-6: Strategy #3 Implementation Steps ...................................................................................................... 46 Table 6-7: Strategy #4 Summary ........................................................................................................................... 46

Massachusetts DOER iv
Consulting Services for Commonwealth Accelerated Renewable Thermal Strategy
Scope of Service #: RFQQ-ENE-2013-101
Table 6-8: Strategy #4 Implementation Steps ...................................................................................................... 47 Table 6-9: Strategy #5 Summary ........................................................................................................................... 47 Table 6-10: Strategy #5 Implementation Steps .................................................................................................... 48 Table 6-11: Strategy #6 Summary ......................................................................................................................... 48 Table 6-12: Strategy #6 Implementation Steps .................................................................................................... 49 Table 6-13: Strategy #7 Summary ......................................................................................................................... 49 Table 6-14: Strategy #7 Implementation Steps .................................................................................................... 50 Table 6-15: Strategy #8 Summary ......................................................................................................................... 51 Table 6-16: Strategy #8 Implementation Steps .................................................................................................... 52 Table 6-17: Strategy #9 Summary ......................................................................................................................... 52 Table 6-18: Strategy #9 Implementation Steps .................................................................................................... 53 Table 6-19: Strategy #10 Summary ....................................................................................................................... 53 Table 6-20: Strategy #10 Implementation Steps .................................................................................................. 54 Table 6-21: Strategy #11 Summary ....................................................................................................................... 54 Table 6-22: Strategy #11 Implementation Steps .................................................................................................. 55 Table 6-23: Strategy #12 Summary ....................................................................................................................... 55 Table 6-24: Strategy #12 Implementation Steps .................................................................................................. 56 Table 6-25: Strategy #13 Summary ....................................................................................................................... 56 Table 6-26: Strategy #13 Implementation Steps .................................................................................................. 57 Table 6-27: Strategy #14 Summary ....................................................................................................................... 57 Table 6-28: Strategy #14 Implementation Steps .................................................................................................. 58 Table 6-29: Strategy #15 Summary ....................................................................................................................... 58 Table 6-30: Strategy #15 Implementation Steps .................................................................................................. 59 Table 6-31: Strategy #16 Summary ....................................................................................................................... 59 Table 6-32: Strategy #16 Implementation Steps .................................................................................................. 60 Table 6-33: Strategy #17 Summary ....................................................................................................................... 60 Table 6-34: Strategy #17 Implementation Steps .................................................................................................. 61 Table 6-35: Strategy #18 Summary ....................................................................................................................... 61 Table 6-36: Strategy #18 Implementation Steps .................................................................................................. 62

Massachusetts DOER v
Consulting Services for Commonwealth Accelerated Renewable Thermal Strategy
Scope of Service #: RFQQ-ENE-2013-101
List of Acronyms
BAU – Business as Usual
BF – Biofuels
BG – Biogas
BMCH – Biomass Chips
BMP – Biomass Pellets
CARTS – Commonwealth Accelerated Renewable Thermal Strategy
CBECS – Commercial Building Energy Consumption Survey (EIA)
ccASHP – Cold-Climate Air Source Heat Pump
DOER – Department of Energy Resources
EEA – Executive Office of Energy and Environmental Affairs
EIA – Energy Information Administration
EU – European Union
FIT – Feed-in Tariff
FO – Fuel Oil
GHG – Green House Gas
GSHP – Geothermal Heat Pump
GWSA – Global Warming Solutions Act
HSS – High State Support
LPG – Liquefied Petroleum Gas (Propane)
MA – Massachusetts
MassCEC – Massachusetts Clean Energy Center
MCG – Meister Consultants Group
NCI – Navigant Consulting Inc.
RECS – Residential Energy Consumption Survey (EIA)
RT – Renewable Thermal
SAG – Stakeholder Advisory Group
ST – Solar Thermal

Massachusetts DOER 1
Consulting Services for Commonwealth Accelerated Renewable Thermal Strategy
Scope of Service #: RFQQ-ENE-2013-101
Executive Summary
The Massachusetts Department of Energy Resources (DOER) is a state agency whose mission is to
analyze and develop policies and programs to ensure Massachusetts' citizens have adequate and diverse
energy supplies, at a reasonable cost, with minimal impact on the environment. DOER initiated the
Commonwealth Accelerated Renewable Thermal Strategy (CARTS) program and retained a team
consisting of Navigant Consulting Inc. (Navigant) and Meister Consultants Group (MCG) to identify the
best strategies to rapidly spur renewable thermal (RT) market growth in Massachusetts. This team was
tasked with analyzing the impacts of accelerated market growth on the Commonwealth; researching
best-practices from other jurisdictions; and developing a strategy to guide DOER’s market development
efforts. The CARTS program covered the following high-efficiency technologies: cold climate air-source
heat pumps, biomass pellet\chip boilers and furnaces (chips were only considered for use in larger
building applications), ground-source heat pumps, solar thermal systems, biofuels, and biogas. Through
prior analysis, DOER identified the main opportunities as being in heat pumps, biomass, and solar
thermal, with a secondary role for biofuels and biogas.
The primary objectives of the CARTS program were to identify ways to reduce GHG emissions, expand
economic development opportunities, and reduce heating and cooling costs for consumers. GHG
emissions reductions are driven by the Massachusetts Global Warming Solutions Act (GWSA) of 2008,
which set statewide limits on GHG emissions for both 2020 and 2050. In 2010, the Executive Office of
Energy and Environmental Affairs published the Massachusetts Clean Energy and Climate Plan for 2020,
which laid out a broad, statewide plan to achieve both GWSA emission limits.1 This plan includes a
hard target for GHG emissions reductions attributable to solar thermal systems (0.1% below 1990 levels
in 2020) and an indicative target for all RT equipment (2% below 1990 levels in 2020, inclusive of solar
thermal).
The CARTS team followed a systematic approach to analyzing the heating and cooling market in
Massachusetts and developing appropriate strategies to spur RT market growth. The team modeled the
Massachusetts market and analyzed the energy (including consumer fuel savings), environmental (GHG
emission reductions), and economic (job growth and state tax revenues) impacts of potential RT growth
scenarios. In parallel, the team also reviewed successful policies from other jurisdictions and identified
programs and approaches that are applicable to Massachusetts. Throughout the CARTS analysis, the
team solicited feedback and guidance from a group of stakeholders.
The CARTS team identified key conclusions from modeling the Massachusetts heating and cooling
market and analyzing potential RT growth scenarios, as described in detail in section 3.3 . Six of these
takeaways include:
The net present value (NPV) of benefits from RT investment may reach 2.4X to 3.2X the NPV
of costs – Under business as usual, the net present value (NPV) of benefits to the state for
investments until 2030 total $5.1 billion to $7.5 billion (including continued savings for 10 years
1 “Massachusetts Clean Energy and Climate Plan for 2020”, December 2010, Available at:
www.mass.gov/eea/docs/eea/energy/2020-clean-energy-plan.pdf

Massachusetts DOER 2
Consulting Services for Commonwealth Accelerated Renewable Thermal Strategy
Scope of Service #: RFQQ-ENE-2013-101
beyond the last year of investment). The range is due to the upper and lower range used for
estimating the value of avoided GHG emissions. The NPV of the costs (including all consumer
and incentive investment) in RT installations through 2030 total $3.9 billion. Under very high
state support assumptions, Massachusetts could expect benefits to increase to roughly $23 billion
to $31.3 billion at a cost of $9.8 billion in investment. This represents a 2.4X to 3.2X benefit to
cost ratio. Even when excluding the avoided cost of GHG emissions, the benefits outweigh the
investment cost by a factor of 2.3X in the high support scenario.
Meeting 2020 GHG goals requires aggressive state support – Under business as usual
conditions, RT technologies may not achieve significant market penetration until well after 2020.
Massachusetts will only achieve the 2020 GHG emissions reduction goal through very
aggressive growth, targeted at accelerating adoption of RT technologies over the next 6 years.
Meeting 2020 GHG targets can put MA on a trajectory to meet 30-32% of thermal energy from
RT technologies by 2030 – With aggressive support for RT technologies and business-as-usual
rates of conversion to natural gas, the state may serve a maximum of 32% of thermal loads with
RT (up to 15,000 MWth of capacity). This penetration will decrease if natural gas conversion
rates increase.
Massachusetts should support a portfolio of all RT technologies – Meeting customer’s
differing needs necessitates deployment of all RT technologies. While all RT technologies have
merits across different applications, efficient heat pumps in residential applications and clean
biomass in commercial buildings, present the highest fuel cost savings to customers. However,
to most cost-effectively across the economy achieve GHG emission reduction targets, including
and especially the 2050 GHG emission limit, the state should also support solar thermal market
growth, as solar thermal systems reduce more GHG emissions on a per installation basis.
Priority customer classes for RT adoption are residences and businesses currently using
heating oil or electricity for space heating and domestic hot water – Customer classes were
prioritized based on an analysis of payback times associated with the RT investments,
achievable GHG emission reductions, segment size, and income level. The most important
customer classes for targeting purposes are:
o Commercial, Large Buildings, Using Fuel Oil / Electricity
o Residential, High Income, Using Fuel Oil
o Residential, Low Income, Using Fuel Oil / Electric
Priority customers will likely be living in areas not served by natural gas utilities, outside of gas
service areas, or a long distance from gas distribution. Currently about 1.2 million households in
Massachusetts are not using natural gas for space heating.
Natural gas customers should be targeted, but present a cost-competitiveness challenge – In
many regions across the state, natural gas (NG) is the biggest competitor for RT technologies due
to its current low price. Since it is least likely that current NG customers (particularly residential
customers) will convert to RT, Massachusetts should target non-NG customers who have access
to convert to NG, and convert them to RT. The team estimates that by aggressively targeting
potential natural gas customers, the state can convert approximately 4,500 customers to RT
technologies by 2020.
Based on energy potential modeling, the experience in other jurisdictions, and input from the
stakeholder advisory group and DOER a set of appropriate strategies were identified to address the
barriers and challenges facing the Massachusetts RT market. Grouped in topic area clusters

Massachusetts DOER 3
Consulting Services for Commonwealth Accelerated Renewable Thermal Strategy
Scope of Service #: RFQQ-ENE-2013-101
(Governance, Innovation, Financing…) the team compiled and prioritized a list of 66 unique market
development strategies. From this long list, Table ES-1 lists the top seven priority strategies. These are
identified to be central to growing the market at an accelerated pace. A second tier of additional
strategies is included in Table ES-2.
The strategies are discussed in more detail in section 6 of this report, including how they were
prioritized. This is a recommended list of strategies that does not reflect a commitment by DOER or
others to implement specific strategies.
Table ES-1: Top Priority Strategies
Topic Area Strategy
Governance Develop statewide renewable thermal goals for each technology
Governance Leverage, coordinate, and expand efforts across state agencies to meet short-term goals
Marketing Launch comprehensive RT technology information campaign with MassSave
Governance Support implementation of long-term, stable performance-based RT incentives
Governance Integrate RT in state and public buildings via “Leading by Example” and/or other state
energy programs
Governance Integrate RT into the Stretch Energy Code and other building energy codes
Finance Develop low-cost financing for renewable thermal through the MassSave HEAT loan
program
Table ES-2: Additional Strategies
Topic Area Strategy
Marketing Develop "Thermalize" program, modeled after the successful Massachusetts Solarize
program
Marketing Develop comprehensive, online database with case studies and technology performance
metrics
Marketing Provide data to assist developers and installers to identify “high value” renewable
thermal customers
Marketing Create tool that helps customers self-screen for suitability of RT technologies
Innovation Support technology exchanges with “state-of-the-art” manufacturers
Resource and
Logistics Create Renewable Thermal Industry Advisory Forum
Governance Review market enabling guidance regarding fuel choices and associated GHG emissions
Massachusetts DOER 4
Consulting Services for Commonwealth Accelerated Renewable Thermal Strategy
Scope of Service #: RFQQ-ENE-2013-101
Topic Area Strategy
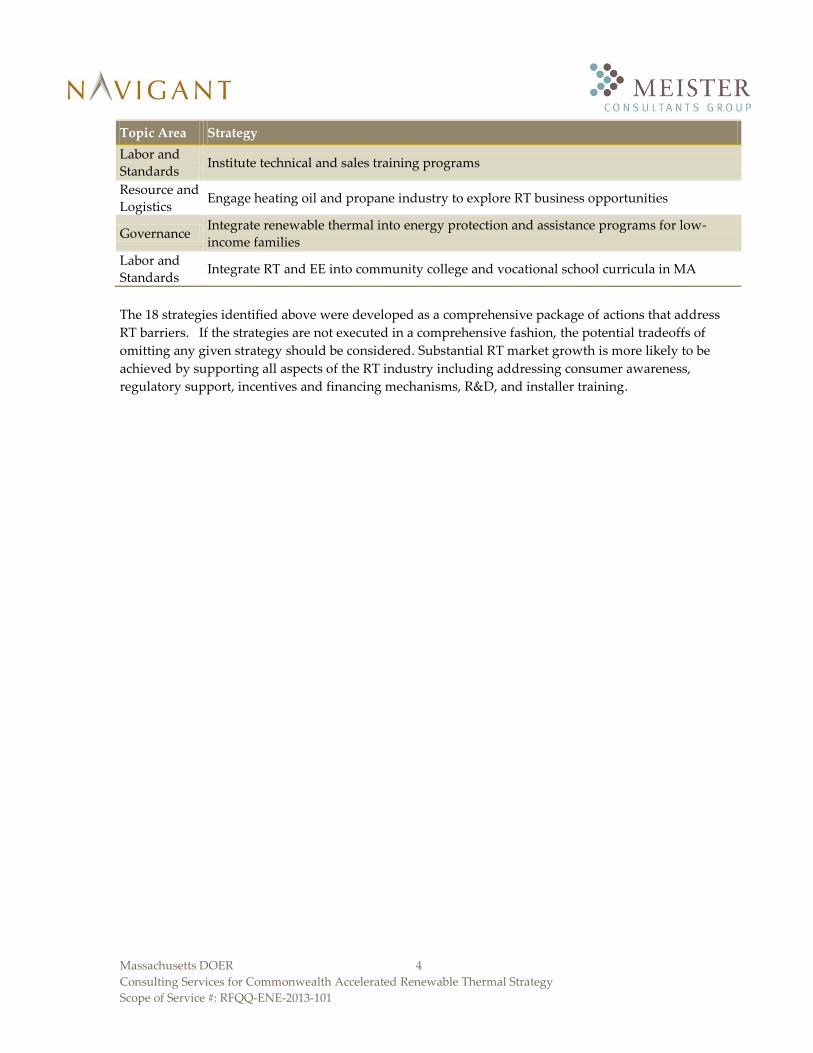
Labor and
Standards Institute technical and sales training programs
Resource and
Logistics Engage heating oil and propane industry to explore RT business opportunities
Governance Integrate renewable thermal into energy protection and assistance programs for low-
income families
Labor and
Standards Integrate RT and EE into community college and vocational school curricula in MA
The 18 strategies identified above were developed as a comprehensive package of actions that address
RT barriers. If the strategies are not executed in a comprehensive fashion, the potential tradeoffs of
omitting any given strategy should be considered. Substantial RT market growth is more likely to be
achieved by supporting all aspects of the RT industry including addressing consumer awareness,
regulatory support, incentives and financing mechanisms, R&D, and installer training.

Massachusetts DOER 5
Consulting Services for Commonwealth Accelerated Renewable Thermal Strategy
Scope of Service #: RFQQ-ENE-2013-101
1 Introduction
1.1 Background
The Massachusetts Department of Energy Resources (DOER) is a state agency whose mandate is to
analyze and develop policies and programs to ensure that Massachusetts' citizens have adequate and
diverse energy supplies, at a reasonable cost, with minimal impact on the environment. To that end,
DOER strives to create a clean energy future for the Commonwealth, economically and environmentally,
including:
Accelerating the deployment of cost-effective energy efficiency;
Increasing the development of clean energy resources;
Implementing strategies to assure reliable supplies and improve the cost of clean energy
relative to fossil-fuel based generation; and
Supporting MA clean energy companies and spurring MA clean energy employment.
The market for renewable heating and cooling and thermal energy recovery in Massachusetts is
growing, but small. Increasing the market share of renewable heating and cooling technologies at an
accelerated pace will enable the Commonwealth to address a series of important challenges. These
include reducing the state’s dependency on heating sources that are either costly (oil, propane,
electricity), constrained (natural gas), or both. Renewable heating and cooling technologies can help
Massachusetts meet greenhouse gas (GHG) emission reduction targets, increase energy efficiency, and
improve air quality.
However, realizing the full benefits of renewable heating and cooling in time to meet the challenges
described above requires a comprehensive approach to market development. As a result, DOER
initiated the Commonwealth Accelerated Renewable Thermal Strategy (CARTS) program and retained a
team consisting of Navigant Consulting Inc. (Navigant) and Meister Consultants Group (MCG) to
identify the best strategies to spur renewable thermal (RT) market growth in Massachusetts. The team
was tasked with analyzing the energy, economic, and environmental impacts of accelerated market
growth on the Commonwealth; researching best-practices from other jurisdictions; and developing a
strategy to help guide DOER’s market development efforts. Potential strategies covered a broad scope,
including:
Financial incentives or programs to help overcome high first costs;
Expanded consumer awareness;
Integration of RT technologies into building codes and renovation requirements; and
Workforce training initiatives to build capacity within the renewable thermal market.
This report documents the analysis the CARTS team conducted and presents key findings that will help
inform DOER’s and the Executive Office for Energy and Environmental Affairs (EEA) decision-making
process. It builds on DOER’s prior analysis of the RT opportunity in the state in two studies:
“Massachusetts Renewable Heating and Cooling: Opportunities and Impacts Study,” March
2012, prepared by Meister Consultants Group.

Massachusetts DOER 6
Consulting Services for Commonwealth Accelerated Renewable Thermal Strategy
Scope of Service #: RFQQ-ENE-2013-101
“Heating and Cooling in the Massachusetts Alternative Portfolio Standard,” Report to the
Legislature by DOER, December 2012, prepared with assistance from Meister Consultants
Group and the Massachusetts Clean Energy Center (MassCEC).
This report will help DOER accelerate expansion of the renewable thermal market to meet the state’s
energy, economic, and environmental goals.
1.2 Objectives and Goals
The primary objective of the CARTS program was to develop a pathway to accelerate growth of the
renewable thermal market in Massachusetts. The program focused on mechanisms to achieve three
goals:
1. Reduce GHG Emissions – The Massachusetts Global Warming Solutions Act (GWSA) of 2008 set
statewide limits on GHG emissions for both 2020 and 2050. In 2010, the Executive Office of
Energy and Environmental Affairs published the Massachusetts Clean Energy and Climate Plan for
2020, which laid out a broad, statewide plan to achieve both GWSA goals.2 The targets related
to RT for 2020 include:
a. Renewable thermal technologies can account for a 2% reduction in GHG emissions
below the 1990 emissions level.
b. Solar thermal systems should contribute a 0.1% reduction in GHG emissions below the
1990 emissions level.
The economy-wide target for 2050, covering all sectors, is to reduce GHG emissions 80% below
the 1990 emissions level.
2. Increase Economic Development Opportunities – Massachusetts has established itself as a
leader in energy efficiency by supporting continued investment in the industry. RT
technologies present a key opportunity to create in-state jobs and support businesses in
Massachusetts through accelerated renewable thermal market growth. Massachusetts
consumers benefit further as RT technologies and locally sourced fuel (in the case of biomass)
offset fossil fuel imports.
3. Reduce Heating and Cooling Expenditures for Consumers – Renewable thermal technologies
have the potential to reduce energy costs for Massachusetts residents and provide savings to
these consumers over the long-term. Of particular importance to DOER is equitable access to
these cost-saving technologies for all the state’s residents and businesses.
1.3 Technologies
The main renewable thermal technologies considered by the Massachusetts state agencies are:
High-efficiency, cold-climate air-source heat pumps (ccASHP) – only those high-efficiency
systems that overcome electric generation and grid losses to generate net primary energy
benefits.
2 “Massachusetts Clean Energy and Climate Plan for 2020”, December 2010, Available at:
www.mass.gov/eea/docs/eea/energy/2020-clean-energy-plan.pdf

Massachusetts DOER 7
Consulting Services for Commonwealth Accelerated Renewable Thermal Strategy
Scope of Service #: RFQQ-ENE-2013-101
High-efficiency ground-source heat pumps (GSHP) – only those high-efficiency systems that
overcome electric generation and grid losses to generate net primary energy benefits (also
known as geothermal heat pumps, GHP).
High-efficiency, sustainable biomass thermal (BM) – including both pellets (BMP) and chips
(BMCH) from sustainably sourced wood or other solid biomass materials; chips are used in
commercial applications only
Solar thermal (ST) – focusing on systems serving both space and domestic water heating
Biofuels (BF) – liquid advanced biofuels, defined as those that reduce lifecycle GHG emissions
by 50% or more3, primarily for blending into existing fuel oil supplies at low percentages
Biogas (BG) – biogases from landfills, anaerobic digestion, or gasification, for select industrial
applications or gas distribution injection
Through preceding analysis (MCG reports), DOER and MassCEC identified these as the main RT
technologies with the key opportunities lying with HP, BMP and ST, and with a secondary role for BG
and BF. All of the technologies have a vendor/installer base in the state. This base is small compared to
traditional heating and cooling technologies, but it is growing. For a comprehensive discussion of the
technologies and markets, see the “Massachusetts Renewable Heating and Cooling: Opportunities and
Impacts Study.”4 This report focuses on strategies designed to help Massachusetts accelerate growth of
the renewable thermal market, and achieve the goals stated above.
3 Section 211(o)(1) of the Clean Air Act, last amended by the Energy Independence and Security Act of 2007 4 “Massachusetts Renewable Heating and Cooling: Opportunities and Impacts Study,” March 2012, prepared by
Meister Consultants Group for the Massachusetts Department of Energy Resources.

Massachusetts DOER 8
Consulting Services for Commonwealth Accelerated Renewable Thermal Strategy
Scope of Service #: RFQQ-ENE-2013-101
2 Approach
The team developed a multi-pronged approach to drive strategy development. Figure 2-1 shows the
CARTS components and the approach for integrating them into a viable strategy. These components
serve the following needs:
Customer class analysis – To characterize market segments (e.g., large commercial buildings
burning heating oil) and individual customer classes (i.e., one for each competing RT technology
in each market segment), and to identify the priority customer classes with the greatest potential
to help achieve market growth and greenhouse gas (GHG) emissions reduction goals.
Potential analysis – To evaluate the energy, environmental, and economic impacts over time in
Massachusetts via four different market-growth scenarios; this analysis utilized a market growth
and impact analysis model to determine impacts of each scenario on key metrics.
Stakeholder advisory group (SAG) – To provide strategy inputs, feedback on the potential
analysis, and overall review to help ensure that strategic program outputs are optimal and
viable.
Jurisdiction analysis – To understand the characteristics of successful programs in other states
and countries, including the market context and key success factors that would be applicable to
Massachusetts.
Jurisdiction Analysis
Stakeholder Advisory Group
Customer Class Analysis
Integrated Commonwealth Strategy
Class Definition
Class Prioritization
Strategy Brainstorm
Interviews & Discussion
Cluster-Based Research
Analysis & Recommendations
Potential Analysis
Sector Potential
Energy Potential
IntegrationCluster-Based
Strategy Refinement
Role/timeline Definitions
Figure 2-1: Strategy Integration Approach
The following three subsections (sections 2.1 through 2.3) describe the approach for the Customer Class
Analysis, the Potential Analysis, and the Stakeholder Advisory Group. Section 2.4 describes the
economic cluster-based framework used to categorize and define CARTS strategies. This framework
provided the basis for strategy characterization throughout this project. Section 2.4 also describes the

Massachusetts DOER 9
Consulting Services for Commonwealth Accelerated Renewable Thermal Strategy
Scope of Service #: RFQQ-ENE-2013-101
strategy development process used to define, develop, and prioritize the final strategies presented in
section 6.
2.1 Customer Class Analysis
The team used the five characteristics listed in Table 2-1 to divide the MA market into distinct market
segments and customer classes. Each market segment, or portion of building stock in the State, is
defined by current thermal fuel, building sector (i.e., residential or commercial), and building size (for
commercial) or income level (for residential). Appendix A lists all market segments along with relevant
size and consumption data). Each market segment represents a competitive market for heating and
cooling equipment, in which each potential RT technology represents a single customer class. For
example, within small commercial buildings using heating oil (a market segment), there are four
different RT customer classes, one for each RT technology. The market segments are valuable as a basis
for discussing market development strategies, while the customer classes are used in market growth and
impact modeling to understand the potential market penetration of each RT technology.

Massachusetts DOER 10
Consulting Services for Commonwealth Accelerated Renewable Thermal Strategy
Scope of Service #: RFQQ-ENE-2013-101
Table 2-1: Customer Class Characteristics
Key Criteria Definition
Sector Commercial and Residential (single- and multi-family together)
Income Level A /
Building Size B
Residential: High/Low Income (split at $60,000 annual income)
Commercial: Large/Small Bldgs. (split at 15,000 ft2)
Access to
Natural Gas
All MA buildings – split by access to natural gas distribution network
Percentage Basis, Per DOER Natural Gas Distribution Data
Offsetting Fuel
Type Electric, Fuel Oil, Natural Gas, Propane (LPG)
Target
Renewable
Thermal Tech
Renewable Thermal Technologies:
• High-efficiency, cold-climate air-source heat pumps (ccASHP)
• Sustainable biomass pellets (BMP)
• Sustainable biomass chips (large-commercial only) (BMCH)
• High-efficiency ground-source heat pumps (GSHP)
• Solar thermal combination space and water heating (ST)
Additional technologies for independent customer class review:
• Biofuels – for mixing with existing fuel oil supplies
• Biogas – for industrial applications or injection in NG distribution network
A: Residential buildings are broken into high and low-income customers because DOER may consider providing
additional assistance to low-income customers in order to assure equitable access to renewable thermal technology.
Income level split based on Massachusetts Low-Income Home Energy Assistance Program (LIHEAP) eligibility
requirements. The annual income cutoff for LIHEAP eligibility is roughly $60,000, for a household of four.5
B: Commercial buildings size is split at 15,000 ft2 feet; that is roughly the average commercial building size.6
The team used the characteristics in Table 2-1 to develop 54 customer classes representing the segments
of the market that DOER was interested in (See Appendix B for a complete list of customer classes and
Appendix C for assumptions on each technology). These customer classes include each of the RT
technologies that are competitive for customers using electricity, fuel oil, or propane, but only include
two RT technologies, ccASHP and GSHP, for customers using natural gas. As part of a preliminary
scoping evaluation, the team reviewed MCG’s incremental lifecycle cost estimates for each technology
and offsetting fuel combination. MCG concluded that commercial-scale GSHP (MCG did not analyze
ccASHP for a lack of reliable cost data) were the only technologies that could achieve savings when
replacing natural gas.7 Therefore, the team determined that the heat pump technologies (GSHP and
ccASHP) are currently the only RT technologies realistically capable of competing with natural gas in
small or large commercial buildings. This same assumption is used for all modeling scenarios.
5 Massachusetts Low-Income Home Energy Assistance Program (LIHEAP), details available at:
www.massresources.org/liheap-eligibility.html#eligible. 6 U.S. Energy Information Administration, Commercial Building Energy Consumption Survey (CBECS), Available
at: www.eia.gov/consumption/commercial/ 7 “Massachusetts Renewable Heating and Cooling: Opportunities and Impacts Study, Meister Consultants Group,
March 2012, Available at: www.mass.gov/eea/docs/doer/renewables/renewable-thermal-study.pdf

Massachusetts DOER 11
Consulting Services for Commonwealth Accelerated Renewable Thermal Strategy
Scope of Service #: RFQQ-ENE-2013-101
Additional research on the RT R&D pipeline could lead to new insights into realistic cost adjustments for
future use in this model, but are not included at this time.
This study assumes that all residential and commercial heat pumps will provide both heating and
cooling, i.e., no heat pump owners will forego the cooling capability in the summer. The study assumes
that those residential users without cooling who install a GSHP or ccASHP would otherwise have
installed a conventional cooling system. Therefore their payback periods are based on the incremental
cost of the heat pump over a conventional heating and cooling system. Certainly, if a resident purchased
a heat pump but would not otherwise have invested in a conventional cooling system, their payback
period would be significantly longer since it would account solely for heating energy savings. Analysis
of such customers was not considered in this study.
The team evaluated biogas and biofuel strategies qualitatively rather than including them in the
customer class analysis, since these technologies are not adopted via the same pathways as the other
technologies. Biofuels are typically blended with traditional heating fuels at central locations and
delivered to customers using existing fuel distribution networks. Biogas is generated in landfills and
through anaerobic digestion (e.g. on livestock farms or wastewater treatment plants) or through
gasification, and is generally used onsite or in district heating systems. It can also be mixed with natural
gas, after being cleaned up and injected in the natural gas distribution grid. The qualitative assessment
of biogas and biofuels led to the inclusion of a number of specific strategies in this report (see section 6
for additional discussion).
The team developed a prioritization process to evaluate each of the 54 customer classes and identify the
top priority customer classes for DOER to target. The team rated each customer class using the criteria,
rating scales, and weighting factors shown in Figure 2-2 to calculate a total score for each class. All 54
customer classes were then prioritized based on these scores. The rating scales for each characteristic,
except “Income Level”, were established to create relatively even distributions of customer classes across
the rating scales. Income level uses a binary rating scale, which only rewards residential low-income
customer classes. Such a scale boosts the overall prioritization of low-income customer classes by
recognizing the general need for providing equitable access to high-efficiency heating and cooling
equipment to all consumers. The team developed the weighting factors and validated them through
discussion with the stakeholders and DOER to ensure confidence with the prioritization framework. The
weighting factors reflect the team’s interest in targeting customer classes and RT technologies that most
cost-effectively (low payback time) achieve a significant GHG impact across Massachusetts (segment size
and GHG emission reductions).

Massachusetts DOER 12
Consulting Services for Commonwealth Accelerated Renewable Thermal Strategy
Scope of Service #: RFQQ-ENE-2013-101
The Top Priority
Customer Classes
Prioritization Criteria Wgt
Cost Benefit: Payback Analysis
40%
GHG Emissions Reductions
30%
Segment Size(MMBtu)
20%
Income Level 10%
Customer Class Characteristics
Residential Commercial Rating Scales
Income Level / Building Size
High/Low Income
Large/Small Bldgs.
5 = Residential Low-Income0 = All Other Classes
Cost BenefitSimple Payback Period, without
incentives
5 = < 2 years4 = < 3.5 years3 = < 6 years2 = < 9 years1 = > 9 years
GHG EmissionsReductions
Low/Med/High reductionscalculated based on technology and
offsetting fuel, using data from MCG Heating and Cooling
Opportunities and Impacts Study
Residential:High = > 15 Tons/Yr ΔCO2eMed = 6-15 Tons/Yr ΔCO2eLow = < 6 Tons/Yr ΔCO2eCommercial:High = > 120 Tons/Yr ΔCO2eMed = 50-120 Tons/Yr ΔCO2eLow = < 50 Tons/Yr ΔCO2e
Segment SizeTotal primary thermal energy consumption (MMBtu) of all
buildings in the market segment
5= > 35 MM4= >12 MM3= >3 MM2= >700,0001= <700,000
Figure 2-2: Customer Class Prioritization Metrics and Weighting Criteria
In gathering data for each customer class, the team built on Meister Consultants Group’s (MCG)
previous work on renewable thermal technologies for DOER. The payback periods for each renewable
thermal technology were calculated based on cost and performance data published by MCG, and the
GHG emission calculations were built off GHG emissions reduction factors provided by MCG.8, 9 See
Appendix C for detailed tables. The statewide market segment size data for residential and commercial
customer classes was extracted from the Residential Energy Consumption Survey (RECS) and the
Commercial Buildings Energy Consumption Survey (CBECS) respectively. 10, 11 Appendix A shows all
relevant RECS and CBECS data used in this analysis.
8 “Massachusetts Renewable Heating and Cooling: Opportunities and Impacts Study, Meister Consultants Group,
March 2012, Available at: www.mass.gov/eea/docs/doer/renewables/renewable-thermal-study.pdf 9 “Heating and Cooling in the Massachusetts Alternative Portfolio Standard”, Massachusetts Department of Energy
Resources, with assistance from Massachusetts Clean energy Center and Meister Consultants Group, December
2012, Available at: www.mass.gov/eea/docs/doer/pub-info/heating-and-cooling-in-aps.pdf 10 U.S. Energy Information Administration, Residential Energy Consumption Survey (RECS), Available at:
www.eia.gov/consumption/residential/ 11 U.S. Energy Information Administration, Commercial Building Energy Consumption Survey (CBECS), Available
at: www.eia.gov/consumption/commercial/
Massachusetts DOER 13
Consulting Services for Commonwealth Accelerated Renewable Thermal Strategy
Scope of Service #: RFQQ-ENE-2013-101
2.2 Potential Analysis
2.2.1 Model Background
To determine the future impacts in Massachusetts from expanding the RT market, the team modeled the
growth of RT technologies in the state between now and 2030. The model is a Fisher-Pry-based
technology adoption model that calculates the market growth of RT technologies. It uses a lowest-cost
approach (to consumers) to develop expected market growth curves based on maximum achievable
market penetration and market saturation time, as defined below.12
Market Penetration – The percentage of a market that purchases or adopts a specific product or
technology. The Fisher-Pry model estimates the achievable market penetration based on the
simple payback period of the technology.
Market Saturation Time – The duration (in years) for a technology to increase market
penetration from 10% to 90%.
The Fisher-Pry model estimates market saturation time based on 12 different market input factors; those
with the most substantial impact include:
Payback Period – Years required for the cumulative cost savings to equal or surpass the
incremental first cost of equipment.
Market Risk – Risk associated with uncertainty and instability in the marketplace, which can be
due to uncertainty over costs, industry viability, or even customer awareness, confidence, or
brand reputation. An example of a high market risk environment is a jurisdiction lacking long-
term, stable guarantees for incentives.
Technology Risk – Measures how well-proven and readily available the technology is. For
example, technologies which are completely new to the industry are higher risk, whereas
technologies that are only new to a specific market (or application) and have been proven
elsewhere would be lower risk.
Government Regulation – Measure of government involvement in the market. A government
stated goal is an example of low government involvement, whereas a government mandated
minimum efficiency requirement is an example of high involvement, having a significant impact
on the market.
The model uses these factors to determine market growth instead of relying on individual assumptions
about annual market growth for each technology or various supply and/or demand curves that may
sometimes be used in market penetration modeling. With this approach, the model does not account for
other more qualitative limiting market factors, such as the ability to train quality installers or
manufacture equipment at a sufficient rate to meet the growth rates.
The model is an imitative model that uses equations developed from historical penetration rates of real
products. It has been validated in this industry via comparison to historical data for solar photovoltaics.
The Fisher-Pry market growth curves have been developed and refined over time based on empirical
adoption data for a wide range of technologies. Some of the original technologies used to develop the
12 Michelfelder and Morrin, “Overview of New Product Diffusion Sales Forecasting Models” provides a summary of
product diffusion models, including Fisher-Pry. Available:
law.unh.edu/assets/images/uploads/pages/ipmanagement-new-product-diffusion-sales-forecasting-models.pdf

Massachusetts DOER 14
Consulting Services for Commonwealth Accelerated Renewable Thermal Strategy
Scope of Service #: RFQQ-ENE-2013-101
Fisher-Pry model include: water-based versus oil-based paints, plastic versus metal in cars, synthetic
rubber for natural rubber, organic versus inorganic insecticides, and jet-engine aircraft for piston-engine
aircraft.13 Figure 2-3 shows four example market growth curves from the model, each with different
market saturation times (5, 10, 15, & 20 years) and increasing achievable market penetration. Although
increased market penetration (reduced payback period) can go hand-in-hand with reduced saturation
time, these plots are intended to illustrate that to reach near-term goals, reducing market saturation time
is more important than maximizing the long-term achievable market penetration. However, with
increased long-term maximum achievable penetration, it may be possible to achieve the same near-term
market growth goals with a longer (and less burdensome) market saturation time.
Figure 2-3: Fisher-Pry Market Penetration Dynamics
Decreasing saturation time requires different activities than increasing the maximum achievable
penetration, which is influenced primarily by the payback period. Reducing market saturation time can
be done by changing one or more of the 12 market saturation factors in the model. For example, to
reduce technology risk, the state could fund or otherwise support demonstration projects to help
validate the technology to industry and potential buyers. Alternatively, the state could fund an
information campaign to reduce market risk by increasing awareness and helping to dispel any myths or
incorrect perceptions that could hurt the growth of the technology. Note that these activities will not (in
any substantial fashion) reduce payback times to help drive up the max achievable penetration, but are
still very important in developing a viable market and accelerating growth.
The model is designed to analyze the adoption of a single technology entering a market, but this analysis
had to account for multiple technologies competing for each market segment. Accordingly, the team
calculated the market penetration for every customer class, ignoring competition from other
technologies. Then, to account for competition among technologies within a market segment (e.g., solar
thermal and biomass in low-income households with electric heating), the team first assumed that the
technology that achieves the highest market penetration in each market segment would roughly
13 Fisher, J. C. and R. H. Pry, "A Simple Substitution Model of Technological Change", Technological
Forecasting and Social Change, 3 (March 1971), 75-88.

Massachusetts DOER 15
Consulting Services for Commonwealth Accelerated Renewable Thermal Strategy
Scope of Service #: RFQQ-ENE-2013-101
approximate the maximum achievable market penetration for all RT technologies. To estimate the
penetration of each individual technology in each market segment, the team divided the market
penetration of that highest penetrating technology among all of the competing customer classes based on
the relative payback period of each customer class. Customer classes with shorter payback periods
therefore received proportionally larger shares of the market.
Because the model ties penetration to each technology’s payback period, it does not reflect any given
policy unless that policy specifically drives one of the key input factors (see below). For example,
specific levels of investment in marketing and communications are not reflected directly by the model,
but are instead reflected qualitatively in a reduction in market risk. Further, if a given distribution is
desired between RT technologies, for example, as a policy decision, that must be achieved by adjusting
the payback period or other input factors to the model.
Figure 2-4 outlines the process used to analyze the market growth of each customer class.
Figure 2-4: Sector Potential Analysis Process
The team used building survey data (see Appendix A) and natural gas market growth projections to
estimate the sizes of each market segment by year.14 The team developed these natural gas market
growth projections based on historical natural gas distribution data provided by DOER.
2.2.2 Scenario Analysis
In coordination with stakeholders, four scenarios were developed for future technology penetration.
The scenarios differ in their level of state support and their treatment of natural gas customers, and are
defined by the various levers that agencies have to influence the penetration of renewable thermal
technologies. These scenarios do not attempt to modify any federal programs or incentive levels,
although in the High State Support (HSS) scenario, federal incentives are assumed to be extended past
their scheduled expiration date.
14 Residential Energy Consumption Survey (RECS) data available from: www.eia.gov/consumption/residential/ and
Commercial Building Energy Consumption Survey (CBECS) data available from:
www.eia.gov/consumption/commercial/

Massachusetts DOER 16
Consulting Services for Commonwealth Accelerated Renewable Thermal Strategy
Scope of Service #: RFQQ-ENE-2013-101
The Business as Usual (BAU) scenario represents a projection of market growth based on current levels
of support, and represents a baseline for this study. The other scenarios show what impact may occur by
emphasizing different types and levels of state support. For example, the HSS scenario represents one
combination of levels and types of support that will achieve the 2020 GHG emissions reductions goals.
HSS was developed on an iterative basis whereby incentive levels were increased and market saturation
variables adjusted in order to achieve the 2020 goals. These scenarios do not consider the political
environment and make no claim about the viability of obtaining the necessary funding, training quality
installers at a sufficient rate, or overcoming other potential market constraints. The team assumes that as
part of the comprehensive strategy, such barriers can be addressed. Table 2-2 outlines the four analysis
scenarios. See Appendix D for an overview of current incentives.
Table 2-2: Potential-Analysis Scenarios
Scenario Description
Business as
Usual
(BAU)
Objective: Determine a baseline set of impacts on the state due to existing policies and
programs
Characterization:
• Continuation of today’s policies and existing levels of market support
Assumptions:
• Incentive discontinuation on current schedule
• Federal renewable energy tax credits expire in 2016 as scheduled
• Annual growth of NG segment for residential and commercial customers
continuing at current pace (applies only to population within NG service
territory)15
High State
Support
(HSS)
Objective: Determine what level/type of support is required to reach 2020 GHG goals
Characterization:
• Strong state support for prioritized customer classes
• Encourages aggressive market development across sectors
• Incentive levels set to ensure that 2020 GHG goals are met, with the same level of
support continuing to 2030
• Represents shortest payback time (to consumers) approach to meeting 2020 goals
Assumptions:
• Continuation of all current incentives (federal and state)
• Market development activities (e.g., marketing campaigns, installer training,
financing support) will reduce the market saturation time for prioritized customer
classes from 20 years to 10 years
• Adds additional 25% incentive on top of existing incentives (on total installed
cost) to reduce up-front cost for prioritized customer classes
• NG market segment growth consistent with BAU
15 Data for natural gas conversions up to 2025 provided by Sussex Economic Advisors, November 2013.
Extrapolation to 2030 by Navigant.

Massachusetts DOER 17
Consulting Services for Commonwealth Accelerated Renewable Thermal Strategy
Scope of Service #: RFQQ-ENE-2013-101
Scenario Description
Accelerated
NG Expansion
& HSS
(NG-HSS)
Objective: determine the impact on the RT market of a simultaneous push to expand
NG in the state
Characterization:
• Based on HSS scenario level of support for RT
• Market size decreases over time as portion of available market converts to NG
Assumptions:
• Accelerated annual growth of NG segment for residential and commercial
customers up to 2025 (assuming equipment incentives for conversion to gas and
regulatory approval of main expansion policies). BAU growth of the NG segment
following 2025 up to 2030 (applies only to population within NG service
territory)16
• NG growth in each market sector scaled based on historical NG conversion rates
(i.e. commercial sector growth expected to be much slower than residential
growth)
Cusp-
Customer
Targeting and
BAU
(CC-BAU)
Objective: Determine the potential impact of directly targeting customers who may be
on the cusp of converting to NG 17
Characterization:
• Based on BAU scenario level of support for RT
• Base market size does not decrease over time (due to customers converting to NG)
by accounting for aggressive targeting of natural gas cusp-customers
Assumptions:
• 0% annual conversion to NG – equal across market segments
In each of these different scenarios, the team calculated impacts on GHG emissions, job creation, and
state tax revenues. The detailed assumptions for each scenario are outlined below in Table E-1 through
Table E-4 in Appendix E.
2.3 Stakeholder Advisory Group
The team assembled a Stakeholder Advisory Group (SAG) made up of a broad range of stakeholders.
The SAG served multiple purposes:
» Support development of a robust and actionable roadmap in order to significantly accelerate
development of renewable thermal in Massachusetts
» Provide feedback on market development, energy and customer class projections and
underlying assumptions based on current market experience and information
» Prioritize RT market barriers and propose recommendations to support development of
Massachusetts renewable thermal policies and programs
» Identify collaborative opportunities for RT market development with Mass DOER, other state
agencies, industry, environmental, and other stakeholder groups
16 Ibid. 17 NG cusp-customers are those customers who do not use NG as their primary heating fuel but are located on-main,
either with or without a service line. These customers generally face relatively low costs to convert to NG and are
therefore the most likely customers to convert.
Massachusetts DOER 18
Consulting Services for Commonwealth Accelerated Renewable Thermal Strategy
Scope of Service #: RFQQ-ENE-2013-101
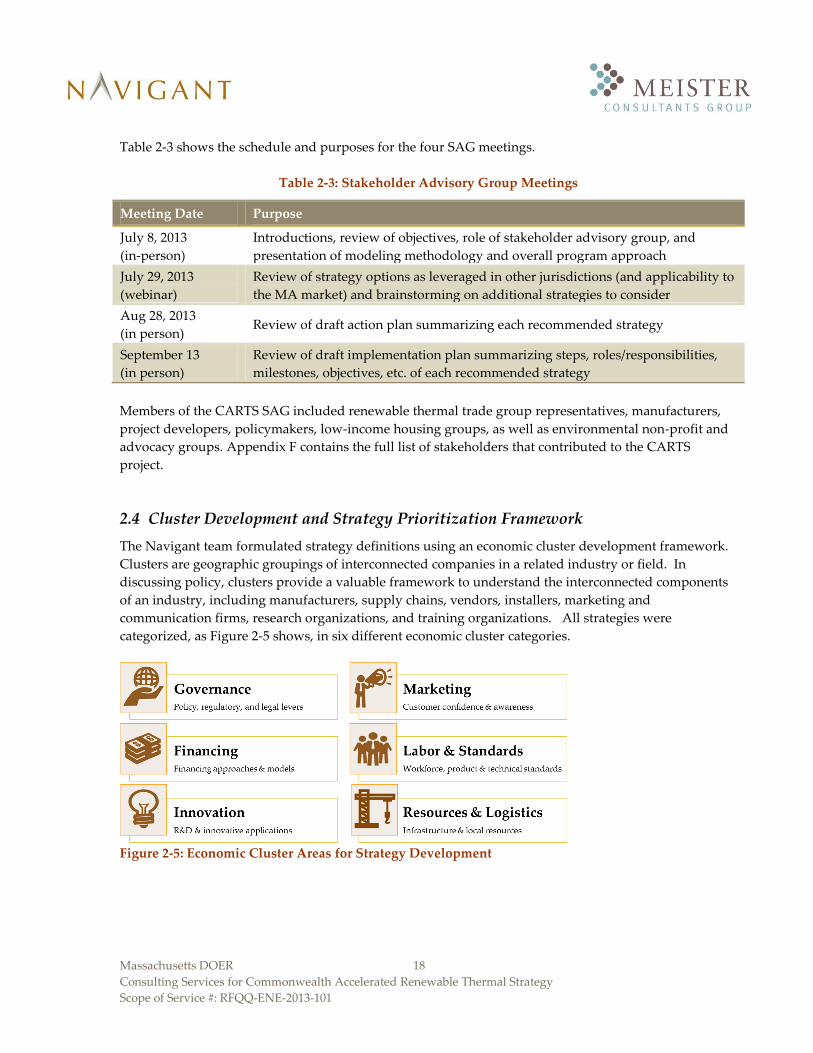
Table 2-3 shows the schedule and purposes for the four SAG meetings.
Table 2-3: Stakeholder Advisory Group Meetings
Meeting Date Purpose
July 8, 2013
(in-person)
Introductions, review of objectives, role of stakeholder advisory group, and
presentation of modeling methodology and overall program approach
July 29, 2013
(webinar)
Review of strategy options as leveraged in other jurisdictions (and applicability to
the MA market) and brainstorming on additional strategies to consider
Aug 28, 2013
(in person) Review of draft action plan summarizing each recommended strategy
September 13
(in person)
Review of draft implementation plan summarizing steps, roles/responsibilities,
milestones, objectives, etc. of each recommended strategy
Members of the CARTS SAG included renewable thermal trade group representatives, manufacturers,
project developers, policymakers, low-income housing groups, as well as environmental non-profit and
advocacy groups. Appendix F contains the full list of stakeholders that contributed to the CARTS
project.
2.4 Cluster Development and Strategy Prioritization Framework
The Navigant team formulated strategy definitions using an economic cluster development framework.
Clusters are geographic groupings of interconnected companies in a related industry or field. In
discussing policy, clusters provide a valuable framework to understand the interconnected components
of an industry, including manufacturers, supply chains, vendors, installers, marketing and
communication firms, research organizations, and training organizations. All strategies were
categorized, as Figure 2-5 shows, in six different economic cluster categories.
Figure 2-5: Economic Cluster Areas for Strategy Development

Massachusetts DOER 19
Consulting Services for Commonwealth Accelerated Renewable Thermal Strategy
Scope of Service #: RFQQ-ENE-2013-101
The team developed the initial strategies through a combination of different activities:
Individual stakeholder discussions – One-on-one discussions with various members of the
SAG to aggregate opinions and perspectives on how the state may be able to help specific
industry areas or the RT industry as a whole.
Group stakeholder dialogue – Facilitated dialogue during each of the stakeholder meetings (see
section 2.3, above) to capture feedback on key barriers to focus on, the top cluster areas to
address, and the level of consensus around various brainstormed ideas.
Internal research – Literature review and brainstorming by team members to leverage past
experience in development and review of successful strategies for expansion of renewable and
energy efficiency technologies.
Jurisdiction analysis – Lessons learned from detailed analysis of successful renewable thermal
programs in other jurisdictions, including an applicability cross-check, to ensure
appropriateness of such strategies in Massachusetts (see section 4).
DOER input – Feedback and commentary from key DOER policymakers who have specialized
knowledge of available policy avenues and other levers by which the state can drive RT growth.
Modeling results/conclusions – key qualitative conclusions shaped many aspects of the strategy
recommendations. Quantitative conclusions will guide DOER in comparing impacts of
expansion in RT and NG industries and in determining appropriate levels of support, including
incentives.
The team characterized each strategy in detail and validated this content at each step via review with
DOER and the SAG members, both individually and as a group. Each strategy definition is grounded in
practical input from many of those organizations that may ultimately be responsible for implementation.
The relevant details articulated in each strategy include an objective, applicable barrier(s), background,
pathway, specific steps with dates, milestones, and identification of lead and supporting organizations.
In total, the team defined an inventory of 66 unique strategies. Weighted scores were calculated for each
of these strategies for prioritization purposes. The weighted scores built on four different metrics:
Time to Impact – expected duration from initiation to realization of benefits;
Expected Impact Level – relative ability of the strategy to accelerate MA market penetration;
Minimum Resources Required – the approximate minimum financial investment needed from
all contributors to have an impact; and
Expected Stakeholder Support – the expected level of interest from industry leaders and their
willingness to step up and play an active role in implementation.
Table 2-4 shows the definitions and weights for each of the metrics. The metrics and weights were
defined based on discussions between DOER and the Navigant Team, and were refined through
discussions with the SAG. Each column contains a different metric that was scored on a scale of 1 to 5.
The scores for each column were then weighted according to the percentages listed in the final row of
each column.

Massachusetts DOER 20
Consulting Services for Commonwealth Accelerated Renewable Thermal Strategy
Scope of Service #: RFQQ-ENE-2013-101
Table 2-4: Strategy Prioritization Metric Definitions
Time to
Impact Expected Impact Level*
Min. Resources
Required
Expected Stakeholder
Support
Sco
re
5 Immediate
(<1.5 years)
Very High – Large impacts on 2 factors
or impacts 3+ factors (must impact cost-
effectiveness)
$50,000 Very High
4 Short
(1.5-3 yrs)
High – Impacts two factors (must
impact cost-effectiveness) $150,000 High
3 Med
(3-5 yrs) Med – Impacts one or more factors $500,000 Med
2 Med-Long
(5-8 yrs) Low – Small impact on one factor $1MM Low
1 Long
(>8 yrs) Very Low or None $2MM Very Low or None
Weight 35% 35% 20% 10%
*Impact level factors include: cost effectiveness, market risk, technology risk, government regulation
The team presented the top preliminary strategies to the SAG during the third meeting and then a more
detailed and updated version of the top recommended strategies, which incorporated SAG feedback, in
the fourth meeting (see Section 2.3 above for the meeting schedule). Section 6 presents the recommended
strategic pathway in detail, including 18 individual strategies.

Massachusetts DOER 21
Consulting Services for Commonwealth Accelerated Renewable Thermal Strategy
Scope of Service #: RFQQ-ENE-2013-101
3 Customer Class Analysis Results
3.1 Customer Classes Prioritization
Using the customer class characterization and prioritization process described in section 2.1 the team
developed the prioritized list of the top 15 customer classes in Table 3-1, used for all scenarios. The
prioritization does not change between scenarios because the ultimate goal for GHG reductions in 2020
remains the same and the prioritization framework remains a valuable and relevant approach in any
scenario. Table 3-2 shows the top six solar thermal customer classes. The customer classes listed in these
two tables represent the priority market segments and technologies for an accelerated market expansion
of RT and SHW respectively. The team focused on targeting these customer classes throughout the
modeling and strategy development stages of the study
Table 3-1: Top 15 Customer Classes
Offsetting Fuel
Building Sector
Income Level / Bldg. Size
Target Renewable
Thermal Tech
Payback Score BAU
(0 - 5)
GHG Emissions Reductions
(Low/Med/Hi)
Final Score
(0 - 5)
Electric Residential Low Income GSHP 5 High 4.6
Electric Residential Low Income ccASHP 5 High 4.6
Electric Commercial Large Bldgs BMP 5 High 4.3
Fuel Oil Residential Low Income GSHP 5 Med 4.3
Electric Commercial Small Bldgs BMP 5 High 4.1
Electric Residential High Income ccASHP 5 High 4.1
Electric Residential High Income GSHP 5 High 4.1
Fuel Oil Commercial Large Bldgs BMP 5 Med 4.0
Fuel Oil Residential High Income GSHP 5 Med 4.0
Electric Commercial Large Bldgs BMCH 4 High 3.9
Electric Residential Low Income BMP 3 High 3.8
Fuel Oil Commercial Small Bldgs BMP 5 Med 3.8
Electric Commercial Large Bldgs GSHP 3 High 3.5
Electric Commercial Large Bldgs Solar Thermal 3 High 3.5
Electric Residential Low Income Solar Thermal 2 High 3.4

Massachusetts DOER 22
Consulting Services for Commonwealth Accelerated Renewable Thermal Strategy
Scope of Service #: RFQQ-ENE-2013-101
Table 3-2: Top 6 Solar Thermal Customer Classes
Offsetting Fuel
Building Sector
Income Level / Bldg. Size
Target Renewable
Thermal Tech
Payback Score BAU
(0 - 5)
GHG Emissions Reductions
(Low/Med/Hi)
Final Score
(0 - 5)
Electric Commercial Large Bldgs Solar Thermal 3 High 3.5
Electric Residential Low Income Solar Thermal 2 High 3.4
Electric Commercial Small Bldgs Solar Thermal 3 High 3.3
Electric Residential High Income Solar Thermal 2 High 2.9
Fuel Oil Commercial Large Bldgs Solar Thermal 2 Med 2.8
Fuel Oil Residential Low Income Solar Thermal 1 Med 2.7
3.2 Potential Analysis Results
Using the Fisher-Pry technology adoption model (see section 2.2.1, above), the team projected market
growth of the RT market in Massachusetts between 2015 and 2030. Table 3-3 summarizes the overall
impacts of RT market growth in Massachusetts under the HSS Scenario, which meets state GHG
emissions reduction goals for 2020. The CARTS model, which optimizes outputs based on the lowest
cost to consumers, requires 144,000 cumulative installations by 2020, which amounts to 3,000 MWth,
with a total investment (i.e., total value of all projects) of $4.5 billion. Detailed data are not currently
available on current installations of RT technologies in Massachusetts. The publicly available MassCEC
data for the Commonwealth Solar Hot Water Program shows that 314 residences over 1.5 years received
awards under this program, 44 (14%) of which were identified as combination heat and hot water
systems.18 Installations of other RT technologies in the state are expected to be on the same order of
magnitude as those for solar thermal.
For comparison, Table 3-3 shows an example of an alternate CARTS scenario that also meets 2020 goals
for GHG emissions reductions, but relies more heavily on solar thermal, with less than half of the total
installed capacity and 17% less overall investment. SHW delivers higher GHG emission reductions per
installation than heat pumps, which explains why the overall number of installations and the total
investment volume is lower. However, the total funding required by the state is higher in this alternate
scenario because solar thermal has generally higher first-costs than other RT technologies.
18 Residential data available at: www.masscec.com/content/commonwealth-solar-hot-water-residential-awarded-
projects-database. The systems come online over the course of approximately 1.5 years. Commercial data available
at: www.masscec.com/content/commonwealth-solar-hot-water-commercial-awarded-projects-database

Massachusetts DOER 23
Consulting Services for Commonwealth Accelerated Renewable Thermal Strategy
Scope of Service #: RFQQ-ENE-2013-101
Table 3-3: Installation and Investment Summary for Two Scenarios in 2020
CARTS
Scenario
Distribution of
Installed Capacity by
Sector
(% Residential/
%Commercial)
Cumulative
Installations
Cumulative
Installed
Capacity
(MWTh)
Cumulative Investment
Value (Millions $2013)
Total Funded by
State
HSS Scenario 57%/43% 144,000 3,000 $4,500 $1,100 (24%)
HSS w/Solar
Emphasis* 57%/43% 95,000 1,400 $3,700 $1,300 (35%)
*This scenario is only one of many alternate results which could ultimately meet the State’s GHG emission reduction
goals. The HSS w/Solar Emphasis Scenario (row 1) is not detailed in the remainder of this report.
From these data, it is clear that meeting the 2020 goals will be a challenge and will require aggressive RT
support. The HSS scenario represents ramping up to approximately 45,300 RT system installations per
year in 2020, or 38,000 more per year than the BAU scenario (7,300 per year). By comparison, the team
estimates that in total between 130,000 and 170,000 heating systems are replaced in the state each year.19
Of these, approximately 46%, or 70,000 are for non-natural gas systems each year.20
Figure 3-1 shows the market growth of all renewable thermal technologies in Massachusetts under each
of the four scenarios. This figure presents market penetration in terms of the percentage of the total
thermal load in the state. The HSS and Accelerated NG Expansion & HSS scenarios both meet MA GHG
goals for 2020 (see section 3.2.3 for detailed GHG emissions results). The model assumed continuation of
policies without changes after 2020, which produces continued rapid market growth through 2030.
However, it is conceivable that many policies or market factors could change, producing very different
energy, economic, and environmental impacts. Some of these potential changes include:
Reductions in installed cost via economies of scale, contractor experience, or technical
innovations.
Reductions in incentive levels, depending on state policies in 2020 and progress towards future
goals. If such reductions are combined with cost reductions, consumers could still see the same
costs. Cost dynamics will likely affect each RT technology differently.
Increases in RT technology awareness and development of an RT brand that can drive sales by
capitalizing on non-energy benefits and leveraging a sustainability image.
19 Estimated assuming roughly 2,590,000 residential households and commercial buildings in MA (based on RECS
and CBECS data), using conventional heating systems with an average useable life of 15-20 years; note that EIA data
show some boilers may last as long at 20-30 years, meaning fewer annual installations and slower turnover of the
installed stock of boilers (data available: www.eia.gov/analysis/studies/buildings/equipcosts/pdf/appendix-a.pdf) 20 Split based on number of buildings in MA from CBECS and RECS. See Appendix A.

Massachusetts DOER 24
Consulting Services for Commonwealth Accelerated Renewable Thermal Strategy
Scope of Service #: RFQQ-ENE-2013-101
Figure 3-1: Total Market Penetration of Renewable Thermal Technologies by Scenario
The team analyzed the impact of renewable thermal market growth on the state economy, government,
environment, and utilities. The results of this analysis are presented in sections 3.2.1 through 3.2.3
Appendix G describes the methodologies used for each analysis.
3.2.1 Energy Impact
Renewable thermal market growth is expected to reduce the demand for fossil fuels for heating and
cooling in the state. Figure 3-2 shows the estimated statewide reduction in fossil fuel demand (fuel oil,
natural gas, propane, and electricity via power generation) due to renewable thermal technologies under
each scenario. Additionally, this figure shows the net reductions in fossil fuel expenditures by
consumers (data labels). Under the High State Support scenario, RT technologies will reduce MA
residents’ expenditures on fossil fuel by roughly $560 million per year by 2020, while BAU will reduce
expenditures by roughly $99 million per year. For the equipment installed by 2030, including the
additional benefits accrued for an additional 10 years of equipment operation, the HSS scenario
produces a present value reduction in expenditures of $22 billion compared to $4.8 billion under BAU.21
This analysis assumes a site-to-source electricity conversion (due to generation and transmission losses)
of 3.1 for the duration of the study, thereby assuming that the electricity generation fuel mix remains
constant through 2030.22
21 Net Present Value calculation assumes a 7% nominal discount rate and 2.5% inflation. 22 Site-to-source conversion based on EIA nation-wide assumption of 3.1; conversion factor varies due to fuel mix.
See buildingsdatabook.eren.doe.gov/TableView.aspx?table=3.1.4

Massachusetts DOER 25
Consulting Services for Commonwealth Accelerated Renewable Thermal Strategy
Scope of Service #: RFQQ-ENE-2013-101
Figure 3-2: Impact on Demand for Fossil Fuels by Scenario due to RT Expansion
3.2.2 Economic Impact
To reach the market growth rates and GHG emissions targets, the HSS scenario requires a cumulative
$1.2 billion state investment between now and 2020, which represents a net present value of $900 million
(or a net present value by 2030 of $2.4 billion).23 Figure 3-3 shows the annual state (public sector)
investment levels over time for both the BAU scenario, which does not meet GHG emissions goals, and
for the HSS scenario. These investments account for costs of offsetting high first costs via incentives but
does not account for the other required market development activities (e.g., contractor training or
marketing) whose costs are less clear. While the example investment is a rebate to directly offset the
costs to the consumer, the investments could come in other forms, such as research and development
funding to reduce equipment costs at an equivalent level to a rebate.
23 Net Present Value calculation assumes a 7% nominal discount rate and 2.5% inflation.

Massachusetts DOER 26
Consulting Services for Commonwealth Accelerated Renewable Thermal Strategy
Scope of Service #: RFQQ-ENE-2013-101
Figure 3-3: Annual State (Public Sector) Investment in RT Installations
In each of the scenarios, the team analyzed the impact of renewable thermal market growth on the state
economy, in terms of increased job creation (Figure 3-4), and on the state government, in terms of
changes in state tax revenue (Figure 3-5). In 2020, under the HSS scenario, the state investment in RT
industry growth should create (or maintain) nearly 14,000 full-time-equivalent jobs (FTE) and generate
over $35 million in additional tax revenues annually (compared to BAU). The jobs include those for
installation and maintenance of equipment, as well as those in the related fuel industries and other
indirect and induced jobs that are produced as a result of increased cash flows in the economy. See
Appendix G (section G.3) for detailed discussion of job creation methodology.
In both the “High State Support” (HSS) and “Accelerated NG Expansion & HSS” scenarios, the RT
growth rate slows from 2020 to 2030. This is a direct result of the top customer classes’ accelerated
market saturation time (10 years in HSS versus 20 years for BAU, where market saturation time is
defined as the duration between 10% and 90% penetration in a select market segment). Therefore, by
2030 each technology will have attained more than half of its achievable market penetration and the
annual growth rate for these technologies will begin to decrease. This effect is exhibited in the annual
state investment, job creation, and tax revenue analyses, which are heavily based on the number of
installations per year. The trend of slowing growth by 2030 may be reversed if strong state support
continues through 2030 and drives a greater-than-expected equipment-cost reduction (either by
increased incentives or through equipment/industry maturation). If cost reductions accelerate, the
payback period will decrease, and the peak achievable market penetration will increase, ultimately
pushing the plateauing portion of the market penetration curve into the future, and at a higher
penetration level. (See theoretical penetration curves in Figure 2-3 for reference.)

Massachusetts DOER 27
Consulting Services for Commonwealth Accelerated Renewable Thermal Strategy
Scope of Service #: RFQQ-ENE-2013-101
Figure 3-4: Impact on Job Creation (direct, indirect, and induced) in Each Scenario
The state tax revenue analysis accounts for the impact of renewable thermal market growth on state sales
tax revenue (from sales of RT equipment), state personal income tax revenue (due to RT market related
job growth), and state personal tax credits (for residential solar thermal). Since this analysis is comprised
of multiple factors, some of which have a negative impact on state tax revenues, the results are not as
directly linked to market penetration as the results of the job creation analysis. Yet it is clear that in the
“High State Support” and “Accelerated NG Expansion & HSS” scenarios the 2030 results are
substantially impacted by the reduced annual growth of RT technologies as the technologies surpass
50% of the achievable penetration in a given market segment and growth begins to slow accordingly.
Note also that sales taxes are directly impacted by the cost of the equipment and the average equipment
cost differs between scenarios. The BAU equipment costs are higher because of the relatively high
volumes of solar thermal, while the HSS scenario sees greater volumes of the lower-cost technologies
due to the lowest-cost optimizing nature of the Fisher-Pry model.

Massachusetts DOER 28
Consulting Services for Commonwealth Accelerated Renewable Thermal Strategy
Scope of Service #: RFQQ-ENE-2013-101
Figure 3-5: Impact on State Tax Revenues by Scenario
The tax revenue increases represent a small portion of the benefits to the state; as shown in Figure 3-2
above, RT technologies also reduce annual fuel costs for state residents. On an individual consumer
basis, RT technologies can have substantial impacts on annual heating and cooling expenditures. The
range of savings varies significantly depending on the consumer’s current thermal fuel and the desired
RT technology. Table 3-4 and Table 3-5 show the annual fuel savings for each fuel and technology
combination. Note that the savings estimates in these tables only reflect fuel costs and do not include
maintenance costs. In both commercial and residential applications, the saving among RT technologies
is highest for heat pumps. Biomass produces lower savings due to lower efficiencies and absence of
savings for space cooling. Solar thermal produces lower savings because, unlike the other systems, the
team assumes that it only provides 40% of the total building thermal load. This assumption is consistent
with past DOER analysis.24
24 “Massachusetts Renewable Heating and Cooling: Opportunities and Impacts Study,” March 2012, prepared by
Meister Consultants Group for the Massachusetts Department of Energy Resources.

Massachusetts DOER 29
Consulting Services for Commonwealth Accelerated Renewable Thermal Strategy
Scope of Service #: RFQQ-ENE-2013-101
Table 3-4: Annual Fuel Cost Savings per Installation for Various Residential Technology Conversions
Residential
Annual Fuel Cost Savings by RT Technology
Biomass ccASHP GSHP Solar
Thermal Natural Gas
Fuel Oil $1,649 $1,934 $2,464 $1,215 $1,698
Electricity $2,883 $3,168 $3,698 $1,680 $2,932
LPG $921 $1,206 $1,736 $941 $970
Natural Gas -$49 $236 $766 $576 N/A
Table 3-5: Annual Fuel Cost Savings per Installation for Various Commercial Technology
Conversions
Commercial
Annual Fuel Cost Savings by RT Technology
Biomass ccASHP GSHP Solar
Thermal Natural Gas
Fuel Oil $9,850 $12,641 $16,341 $8,778 $12,090
Electricity $19,356 $22,146 $25,847 $12,606 $21,596
LPG $4,953 $7,744 $11,445 $6,806 $7,194
Natural Gas -$2,240 $550 $4,251 $3,909 N/A
See Appendix C for data on installed costs and other assumptions for each technology.
3.2.3 Environmental Impact
In the environmental impact analysis the team estimated the reduction in statewide GHG emissions
attributable to renewable thermal market growth. Massachusetts has identified two GHG emissions
reduction targets in the Massachusetts Clean Energy and Climate Plan for 2020. These targets include: (1)
Renewable thermal technologies could all together account for a 2% reduction in GHG emissions below
the 1990 emissions level, and (2) Solar thermal systems should contribute at least a 0.1% reduction in
GHG emissions below the 1990 level (see discussion in section 1.2).25 Figure 3-6 below presents GHG
reduction estimates and costs of avoided CO2 emissions for all renewable thermal technologies, and
Figure 3-7 shows estimates for solar thermal systems alone.
In both analyses the state will not achieve the 2020 GHG emissions targets under the “BAU” scenario. In
order to achieve these goals the state will need to provide substantial support for all renewable thermal
technologies, as reflected in the performance of the “High State Support” scenario.
25 “Massachusetts Clean Energy and Climate Plan for 2020”, December 2010, Available at:
www.mass.gov/eea/docs/eea/energy/2020-clean-energy-plan.pdf

Massachusetts DOER 30
Consulting Services for Commonwealth Accelerated Renewable Thermal Strategy
Scope of Service #: RFQQ-ENE-2013-101
Figure 3-6 also shows that if the state decided to provide both high state support for RT technologies and
support for accelerated expansion of natural gas the state would still reach its 2020 GHG emissions
targets. However, by 2030 the state would achieve roughly 2% fewer reductions in GHG emissions due
to the expansion of natural gas competing with RT market growth.
The team estimated the value of avoided CO2 emissions based on the discussion of the additional cost of
CO2-emissions in the 2013 Avoided Energy Supply Cost report by Synapse. Given the ongoing
discussion about the exact valuation of avoided GHG emissions, a range of CO2-values is used in the
CARTS analysis. The “RGGI-only” scenario in the Synapse report provides a lower bound of the CO2-
values. The Long Term Marginal Abatement Cost identified by Synapse serves here as an upper bound.
See the values in Table 3-6. For the years following 2030 the values were kept constant at their 2030
levels.
Table 3-6: Value of Avoided CO2 emissions (2013$/Ton)26
Year 2015 2020 2030
RGGI Only scenario $5.28 $10.55 $10.55
Long Term Marginal Abatement Cost $100 $100 $100
Using the values outlined above, the Net Present Value (NPV) of the cumulative benefits from avoided
GHG emissions was calculated27, taking into account the RT equipment installed between 2015 and 2030,
and 10 years of continued operation after 2030. For the HSS scenario this results in an avoided cost of
CO2 NPV between $944 million (RGGI values) and $8.99 billion (marginal abatement cost). Under BAU
the NPV of the avoided CO2-emissions is between $283 million and $2.71 billion respectively.
26 “Avoided Energy Supply Costs in New England: 2013 Report”, Synapse Energy Economics Inc., July 2013 27 Net Present Value calculation assumes a 7% nominal discount rate and 2.5% inflation.

Massachusetts DOER 31
Consulting Services for Commonwealth Accelerated Renewable Thermal Strategy
Scope of Service #: RFQQ-ENE-2013-101
Figure 3-6: Impact on GHG Emissions
Figure 3-7: Impact on GHG Emissions – Solar Thermal
3.3 Analysis Conclusions
Strategies should focus on the 2020 GHG targets, which present the most immediate challenge given the
short timeline, but long-term challenges should also be addressed in order to foster a strong industry.

Massachusetts DOER 32
Consulting Services for Commonwealth Accelerated Renewable Thermal Strategy
Scope of Service #: RFQQ-ENE-2013-101
The following key findings are a result of the customer class modeling. These findings directly informed
the Navigant Team’s strategy development:
RT must be part of the equation to meet GHG targets – To achieve the MA GHG emissions
reduction targets for buildings without RT technologies, the state would have to convert
approximately 20% of the customers using fuel oil (FO) or electricity for heating in the state to
natural gas by 2020. This is believed to be an unrealistic target due to the high cost of extending
gas mains to this number of customers. Such expansion is not achievable without substantial
expansion of gas mains to less densely populated areas. As NG begins to saturate the high-
density neighborhoods/towns in the state, expansion of gas mains becomes more costly per
potential conversion. RT technologies provide much greater reduction in GHG emissions per
installation, thereby requiring fewer installations to reach GHG targets than for the equivalent
impacts from NG fired-equipment.
The net present value (NPV) of benefits from RT investment may reach 2.4X to 3.2X the NPV
of costs – Under BAU, the net present value (NPV) of benefits to the state for investments until
2030 total $5.1 billion to $7.5 billion; this includes customer fuel savings and the state’s avoided
cost of CO2 emissions through 2040 (assuming savings continue for 10 years beyond the last year
of investment). The NPV of the costs (including all consumer and incentive investment) in RT
installations through 2030 total $3.9 billion in BAU. Under the HSS scenario, Massachusetts
could expect benefits to increase to roughly $23 billion to $31 billion at a cost of $9.8 billion in
investment. This represents a 2.4X to 3.2X benefit to cost ratio. Table 3-7 summarizes the costs
and benefits of investments in RT technologies under both the BAU and HSS scenarios. Note
that even when excluding the avoided cost of GHG emissions, the benefits outweigh the
investment cost by a factor of 2.3X in the HSS scenario.
Table 3-7: Investment Cost and Benefit Summary
Annual Total Investment, MM
2013$
Annual State Investment, MM
2013$ (% of total) Annual Number of Installations
Year 2015 2020 2030 2015 2020 2030 2015 2020 2030
BAU 100 222 875 2 (2%) 5 (2%) 19 (2%) 3,150 7,300 27,500
HSS 217 1,361 855 52 (24%) 341 (25%) 194 (23%) 7,150 45,300 28,350
NPV Total Cost,
MM 2013$
NPV Total Benefit,
MM 2013$
NPV CO2 Avoided,
MM 2013$ CO2 cost assumption
Year 2015 - 2030 2015 - 2040 2015 - 2040
BAU 3,900 5,100 283 RGGI CO2 cost
7,529 2,712 Marginal abatement CO2 cost
HSS 9,800 23,250 944 RGGI CO2 cost
31,300 8,994 Marginal abatement CO2 cost
Meeting 2020 GHG goals would require the aggressive support shown in the “High State
Support” scenario – Under the BAU scenario, RT technologies do not achieve significant market
penetration until well after 2020. The HSS scenario meets the 2% GHG emissions reduction goal

Massachusetts DOER 33
Consulting Services for Commonwealth Accelerated Renewable Thermal Strategy
Scope of Service #: RFQQ-ENE-2013-101
by 2020, and it does so through aggressive growth in the next 6 years. The HSS scenario requires
approximately 45,300 installations per year in 2020, roughly a six-fold increase over the number
of installations in 2020 under the BAU scenario (7,300 per year). Such growth will clearly require
significant investment from the Commonwealth both in terms of incentives and market
development activities. To achieve the 2020 GHG goals, the HSS scenario requires a 25%
incentive for RT technologies, in addition to existing incentives. The HSS scenario also requires
support for market development activities (e.g., marketing campaigns, installer training, and
financing support) targeted at substantially reducing market saturation time for RT technologies.
Without market development support, such rapid growth can be stalled due to lack of
experienced, trained installers and contractors and limited availability of supply chains for
equipment, parts, and fuel in the case of biomass.
Meeting 2020 GHG targets can put MA on a potential trajectory to meet 30-32% of thermal
energy from RT technology by 2030 – Under the HSS scenario (i.e., aggressive support for RT
technologies, and business-as-usual rates of conversion to natural gas), the state may be able to
serve up to 32% of thermal loads with RT technology (up to 15,000 MWth of capacity) by 2030.
As shown in the Accelerated NG & HSS scenario, the load served by RT will be reduced by up to
2% if natural gas conversion rates increase. The European jurisdictions described in Section 4,
have RT targets ranging from 12% to 39% in 2020.
Market development based on lowest overall investment does not equate to the lowest cost to
customers – As shown in Table 3-3, above, by projecting RT market growth based on the lowest
cost opportunity for customers, the resulting total investment required to meet GHG goals (i.e.,
HSS scenario) is higher than a scenario in which total cost is optimized. By emphasizing solar
thermal development, for example, the state could potentially achieve market growth targets
with less total investment, but with higher cost to individual consumers and/or higher total
investment by the state (due to higher required incentive levels).
Accelerated penetration is more important than increasing peak achievable penetration –
Accelerating penetration (via reduced saturation time) has a more significant impact on
increasing near-term market penetration than does increasing the long-term achievable peak
penetration (reducing payback period). For example, reducing the payback period by 25% for
all customer classes in the BAU scenario results in a 6% increase in the cumulative number of RT
installations by 2020. However, reducing the saturation time by 25% (independently of the
payback period) for all customer classes in the BAU scenario results in a 50% increase in the
cumulative number of RT installations by 2020. Therefore, reducing market saturation time has
a larger impact on near-term market penetration than strictly reducing payback period.
Although, payback period does impact saturation time, saturation time can also be reduced by
other market factors as well, as described in section 2.2 above. It should also be noted that the
cost of reducing market saturation time is difficult to project and is not equivalent to the cost of
reducing payback period.
Key growth acceleration levers can reduce market saturation time – The following are the four
key market factors that have the greatest impact on saturation time and for which DOER or
other stakeholders can influence (in descending order – see definitions in section 2.2, above):
1. Payback Period
2. Market Risk
3. Technology Risk

Massachusetts DOER 34
Consulting Services for Commonwealth Accelerated Renewable Thermal Strategy
Scope of Service #: RFQQ-ENE-2013-101
4. Government Regulation
The state should balance industry development and reaching GHG targets – Strategies should
balance the need to reach 2020 GHG targets with the desire to build a long-lasting and healthy
renewable thermal market that can achieve 2050 targets. Market development strategies will
help accelerate adoption and contribute towards reaching the 2020 goals. In order to achieve the
2050 goals, the state will also need to support strategies focused on cost reduction, to increase
the maximum achievable market penetration of RT technologies. Cost reduction in particular
will help foster organic growth of the RT market which will be crucial in reducing the market’s
reliance on state funding and establishing a robust industry capable of long-term growth.
Strategies that focus solely on large customers that can provide a high impact through few
installations will not help build as strong of an industry as strategies that target high volumes of
customers (e.g., residential or small commercial). Further, strategies that help develop the
industry will support greater job growth and more equitable access to RT technology.
Massachusetts should support a portfolio of all RT technologies – Massachusetts has set a
GHG emissions goal specifically for solar thermal, of 0.1% reduction in emissions below 1990
emissions level by 2020. Solar thermal systems provide the best GHG emissions reductions on a
per installation basis out of all of the RT technologies. However, the economics for solar thermal
are weaker than for biomass and heat pumps, which could achieve higher market penetration.
To help reach the overall GHG goals for 2020, other RT technologies that provide lower first
costs should be supported. Biomass (both pellets and chips) will be particularly beneficial in
commercial applications, while heat pumps present the highest priority opportunity in
residential applications. (Refer to Table 3-1 and Table 3-2, above, for the prioritized customer
classes.)
RT (particularly solar) innovations (technical and other) should be supported – RT
technologies, especially solar, have opportunities for cost reductions that can improve cost
competitiveness. In particular, advances in low-cost collectors, thermal storage systems (and/or
integrated high-efficiency backups), and PV-driven heat pumps, may enable solar to penetrate
key sectors where it has been limited in the past. By allocating near-term funds towards
reducing RT first-costs through technological innovations and R&D initiatives, state investments
for incentives can potentially be reduced in the medium term (i.e., 2020-2030 and beyond). Such
an approach reduces the longer-term burden for up-front incentives and could mitigate the
burden of trying to achieve such drastic reductions in saturation time (i.e., acceleration of
equipment turnover/conversion). As discussed in section 2.2 , if the state can increase the
maximum achievable market penetration of RT technologies (primarily achieved through first-
cost reduction) then it may be possible to capture the necessary market share (to reach the 2020
GHG goals) with a slightly longer market saturation time. Investment in R&D will help
aggressive growth beyond 2020. As shown in section 3.2.2 above, current projections show a
tapering of growth by 2030 as the RT market starts approaching the top of the market
penetration S-curve, leading to reduced annual market growth. This reduction in growth is most
evident in the 2030 results of the potential analyses, which are based on annual installation
volumes (such as job creation and state tax revenue).
RT R&D initiatives should focus on equipment and technology innovation, soft cost reductions
(costs associated with acquisition, installation, financing, and permitting), and new applications
for RT systems. To contribute to the 2020 goal, innovations must be commercialized and

Massachusetts DOER 35
Consulting Services for Commonwealth Accelerated Renewable Thermal Strategy
Scope of Service #: RFQQ-ENE-2013-101
available for sale to the public in the next 3-5 years. For example, in August of 2012, the
National Renewable Energy Laboratory (NREL) identified a few key opportunity areas for
additional innovations for solar thermal, including: polymer heat exchangers, storage tanks, and
piping; integrated valve packages; lower-cost mounting methods; and reduced installation costs
through lighter components and greater use of plug-and-play configurations.28 Such advances
will help the industry to develop strong organic growth and increase the long-term achievable
penetration.
Natural gas customers should be targeted but present a cost-competitiveness challenge –
Massachusetts home/building owners heating with fuel oil, electricity, or propane are priority
targets due to the greater cost effectiveness of installing RT in their buildings relative to those
using natural gas. However, natural gas is the most widely used heating fuel in Massachusetts,
and excluding those customers reduces the potential market for RT. A larger pool of potential
customers attracts investment in the RT industry and provides a longer and wider pipeline of
opportunities for achieving favorable returns on the investment. Converting natural gas heating
to RT shields these customers against potential natural gas price increases in the future, and is
consistent with reaching the Commonwealth’s longer term GHG target of -80% by 2050. Non-
energy benefits of RT technologies such as improved ventilation or energy resilience can help
drive early adoption by natural gas customers, especially among high-income residential
customers.
1. Cusp natural gas customers – If Massachusetts can aggressively target fuel oil, electric,
and propane heating customers on the cusp of converting to natural gas (i.e., those who
have access to a natural gas main, but who currently do not use the fuel for heating or at
all), and convert them to renewable thermal rather than natural gas, we expect the
market penetration of RT to increase by ~0.1% over the BAU scenario (adding ~4,500
new customers) by 2020. This increase in penetration would result in an additional
0.04% reduction in GHG emissions.
2. Existing natural gas customers – The best RT options for competing with existing
natural gas customer classes are commercial scale ccASHP and GSHP due to their ability
to serve cooling needs as well as heating needs. However, even for heat pumps, as they
are burdened with a high first cost, it will be difficult to achieve significant market
penetration without strong state support, so non-energy benefits should be highlighted
for marketing/sales purposes (including high level of comfort with consistent
temperatures throughout, and lower GHG emissions). In the BAU scenario, by 2020, we
estimate that 300 large and small commercial natural gas customers will convert to RT
(representing ~0.01% of the building stock statewide). If MA were to provide high state
support for these customer classes we would expect conversation to RT by 1,400
customers (representing ~0.06% of the building stock statewide. Based on these findings
we recommend that DOER first target the cusp natural gas customers (lower hanging
fruit) but also support careful targeting of current natural gas customers.
Natural gas expansion will impact RT growth – Expansion of natural gas distribution as
modeled will lessen the GHG emissions reductions attributable to RT technologies (i.e., less
progress towards reduction goals). The team modeled the impact on GHG emissions for both
28 K. Hudon et. Al. “Low-Cost Solar Water Heating Research and Development Roadmap,” August 2012, available
at: www.nrel.gov/docs/fy12osti/54793.pdf

Massachusetts DOER 36
Consulting Services for Commonwealth Accelerated Renewable Thermal Strategy
Scope of Service #: RFQQ-ENE-2013-101
the High State Support scenario, and the Accelerated NG Expansion & HSS scenario. Based on
the difference in results for both scenarios, accelerated NG expansion will decrease the impact
on GHG emissions in the High State Support scenario by up to 2% in 2020 and 5% in 2030.
Relative to 1990 GHG emissions levels, this corresponds to a difference of 0.05% for 2020 and a
0.57% difference in 2030 (analysis does not account for GHG emissions reductions due to NG
conversions). While these data indicate that natural gas expansion undercuts investments and
gains in GHG emissions reductions through RT expansion, the impacts are geographically
limited. For example, gas expansion will not occur in rural areas where the population density
is insufficient to support expansion of gas mains; gas distribution expansion is expected to focus
primarily on areas with existing gas mains. RT markets on the other hand are not limited by
population density.
Top market segments – The most important market segments for targeting purposes (aside from
existing natural gas customer classes) are:
o Commercial, Large, Fuel Oil / Electric
o Residential, High Income, Fuel Oil
o Residential, Low Income, Fuel Oil / Electric
This is based on the following indicators:
The largest market segments by primary energy consumption are (see Figure 3-8):
1. Commercial, Large, Fuel Oil
2. Residential, High Income, Fuel Oil
3. Commercial, Large, Electric
4. Residential, Low Income, Fuel Oil
Figure 3-8: Largest Market Segments by Primary Energy Consumption
The market segments with the highest potential impact on GHG emissions are (see Figure
3-9):
1. Commercial, Large, Electric
2. Commercial, Large, Fuel Oil
3. Residential, High Income, Fuel Oil
4. Residential, Low Income, Electric

Massachusetts DOER 37
Consulting Services for Commonwealth Accelerated Renewable Thermal Strategy
Scope of Service #: RFQQ-ENE-2013-101
Figure 3-9: Largest Market Segments by GHG Emissions Reductions
The market segments with the highest potential impact on job creation are (see Figure 3-10):
1. Commercial, Large, Fuel Oil
2. Residential, High Income, Fuel Oil
3. Commercial, Large, Electric
4. Residential, Low Income, Fuel Oil
Figure 3-10: Largest Market Segments by Total Job Creation (direct, indirect, and induced)

Massachusetts DOER 38
Consulting Services for Commonwealth Accelerated Renewable Thermal Strategy
Scope of Service #: RFQQ-ENE-2013-101
4 Analysis of Strategies in Other Jurisdictions
To inform renewable thermal market development strategies in the Commonwealth, the CARTS team
assessed international best practices across four key jurisdictions. Three of the jurisdictions assessed –
Upper Austria, Denmark, and Germany – have strong, well-established renewable heating and cooling
markets. The fourth jurisdiction – the United Kingdom – represents an emerging market, with robust
renewable thermal policies in place, and strong growth expected in the future.
All of the international jurisdictions analyzed are located in the European Union, and as such, are subject
to European Union (EU)-wide energy, climate, and building requirements. The EU established the so-
called “20-20-20” targets, which aim to reduce greenhouse gases by 20%, increase renewable energy use
to 20%, and create a 20% improvement in energy efficiency across all member states by 2020.
To meet the 20-20-20 targets, each of the member states has taken on binding targets for raising their
share of renewable energy and reducing their greenhouse gas emissions. Country targets are set based
upon the relative wealth of EU countries and, in the case of renewable energy, each countries’ initial
starting point. For example, Sweden has a target of 49% renewable energy generation by 2020, whereas
Malta is expected only to achieve 10% renewable generation. Energy efficiency requirements are also
established for each of the member states.
Member states are given a certain degree of flexibility in determining how to reach their respective
country targets. To this end, each of the member states submits a National Renewable Energy Action
Plan (NREAP) to the EU Commission, which details their renewable energy plan. Depending upon their
resources and priorities, member states focus to a greater or lesser extent on developing renewables in
the electricity, heating, or transportation sectors. Thus, while EU member countries are not required to
establish binding renewable thermal targets, renewable heating and cooling plays a significant role in
the national energy policy strategy. Figure 4-1 illustrates renewable energy goals developed as part of
the NREAP process and submitted to the European Commission by Austria, Germany, the United
Kingdom, and Denmark.

Massachusetts DOER 39
Consulting Services for Commonwealth Accelerated Renewable Thermal Strategy
Scope of Service #: RFQQ-ENE-2013-101
Figure 4-1: Key European Renewable Energy Targets
Additionally, EU energy efficiency legislation (the Energy Performance of Buildings Directive) has
significantly tightened energy efficiency requirements for buildings over the years and links building
energy performance to heating, cooling and power production. Member states must ensure that new
construction and major building renovations are “nearly zero-energy." Accordingly, new construction
and building renovations must consider integration of renewable heating and cooling technologies
among other alternative energy or advanced energy efficiency technologies.
Finally, EU member countries also have wide latitude to develop policies and market development
programs to respond to local resources available, industry needs, as well as political realities. As
described in Table 4-1, EU jurisdictions have deployed a wide range of market development goals and
approaches, customized to the needs and requirements of local markets.
Table 4-1: Summary of Market Development Approaches by Jurisdiction
Jurisdiction Market Development Approaches
State of Upper
Austria (Austria)
• Goal: 100% renewable heating and electricity by 2030
• Stable long-term incentives (rebates) in place since 1980s
• Strong cluster development approach (Oekoenergie cluster), developed to
develop new (biomass) markets for local farmers
• Strong manufacturing base and export market

Massachusetts DOER 40
Consulting Services for Commonwealth Accelerated Renewable Thermal Strategy
Scope of Service #: RFQQ-ENE-2013-101
Jurisdiction Market Development Approaches
Denmark
• Goal: 39% renewable heat by 2020
• Large district heating network serves majority of population (especially around
Copenhagen)
• Heating grid was historically dependent upon oil and fossil fuels and subject to
significant disruptions during 1970’s oil crisis. Tax policies since 1980s leveled
playing field between renewables and fossil fuels.
• In 2012, Denmark became the first country in the world to ban oil and gas-fired
heating systems. By 2016, Denmark will prohibit installation of new oil heating in
existing buildings if district heating is available.
• Integration of biomass, SHW, and heat pumps into district heating (as well as
natural gas) limits volatility of oil on heating prices
Germany
• Goal: 14% renewable heating by 2020
• Largest SHW market in Europe and largest consumer of bioenergy
• Legislatively mandated renewable heating and cooling target
• Rebate program has a mix of “bonus” incentives to encourage innovation and
efficiency for renewable thermal
United Kingdom
• Goal: 12% renewable heat by 2020
• Historically has had a small renewable heating market
• Developed first feed-in tariff for heat (Renewable Heat Incentive) in order to
quickly scale innovation and deployment of renewable heating technologies
• Developed detailed heat metering requirements to monitor performance
• Strong emerging market for renewable thermal
While policy and program mechanisms across the jurisdictions varied (e.g. deploying rebates vs. feed-in
tariffs), several best practices are observed across the jurisdictions. These include:
Development of renewable heating and cooling action plans and/or targets
Implementation of stable, long-term incentive programs to improve cost-effectiveness
Creation of industry-led marketing programs to increase public awareness (often co-financed
with public and private sector funds)
Integration of renewable heating and cooling with energy efficiency marketing, outreach, and
financing programs
Integration of renewable heating and cooling technologies into building codes
Development of performance monitoring requirements, either via regular inspections or
metering/monitoring technologies
A comprehensive assessment of market development strategies implemented across the four
international jurisdictions is provided in Appendix H (Slides from second stakeholder meeting).

Massachusetts DOER 41
Consulting Services for Commonwealth Accelerated Renewable Thermal Strategy
Scope of Service #: RFQQ-ENE-2013-101
5 Market Barriers
This report focuses on strategies designed to help Massachusetts accelerate growth of the renewable
thermal market, and achieve the Commonwealth’s 2020 GHG emissions goals. It builds on two previous
Massachusetts market and technology reports, which assessed the barriers, opportunities, technical
requirements, and economics of renewable heating and cooling technologies.29, 30 The CARTS study, like
past market assessments, was developed in close collaboration with regional stakeholders, including
broad input from manufacturers and developers, trade groups, environmental advocates, building
managers, government agencies, and technical experts, among others.
In evaluating the current state of the market, CARTS stakeholders confirmed past findings and reported
that five major barriers impact renewable thermal market growth in Massachusetts:
High capital costs: relative to conventional fossil fuel systems, renewable thermal technologies
tend to have significantly higher upfront costs.
Lack of policy support: renewable thermal technologies tend not to receive public policy support
relative to renewable electricity or renewable transport fuels.
Poor public awareness: there tends to be poor awareness of the economic (lifecycle), GHG, and
societal benefits of renewable thermal systems among policymakers and the general public.
Similarly, there tends to be a lack of consumer confidence in renewable thermal technologies.
Opaque regulatory standards: renewable thermal technologies tend to face confusing or unclear
regulatory standards.
Workforce development: many renewable thermal industry stakeholders report challenges
hiring adequately trained personnel.
Stakeholders reported that high capital costs, lack of policy support, and poor public awareness
represent the most significant barriers to market development. Accordingly, stakeholders emphasized
the need to develop strong governance, marketing, and financing strategies (see “Cluster Development
Framework” in Section 2.4) to address these barriers. This feedback formed the basis for developing the
“cornerstone strategies” detailed in Section 6.
Detailed renewable thermal market development strategies, which were shaped by stakeholders
throughout the CARTS process, are described in Section 6. Additionally, it is worth noting that
stakeholders provided important feedback on the development and implementation of the renewable
thermal market models, including the customer class, sector potential, and energy potential analyses.
Appendix G describes the modeling methodologies, which were developed in close collaboration with
the stakeholder advisory group.
29 Meister Consultants Group. (2012). Massachusetts Renewable Heating and Cooling: Opportunities and Impacts Study.
Prepared for Massachusetts Department of Energy Resources and Massachusetts Clean Energy Center. Retrieved
from www.masscec.com. 30 Executive Office of Energy and Environmental Affairs, Department of Energy Resources. (2012). Heating and
Cooling in the Massachusetts Alternative Portfolio Standard. Prepared for the Massachusetts Legislature. Prepared with
assistance from Massachusetts Department of Energy Resources and Meister Consultants Group. Retrieved from
www.mass.gov.

Massachusetts DOER 42
Consulting Services for Commonwealth Accelerated Renewable Thermal Strategy
Scope of Service #: RFQQ-ENE-2013-101
6 Recommended Strategy Pathway for Massachusetts
As discussed in Section 2.4, the Navigant team developed the set of 66 strategies discussed below
through a combination of avenues, including stakeholder discussions (individual and group meetings),
internal research, jurisdiction analysis, DOER input, and results of the modeling analysis (see section 3).
Appendix I lists the complete set of strategies. Through the prioritization process described in Section
2.4, the team identified:
1 keystone strategy;
6 cornerstone strategies;
11 building block strategies; and
48 other strategies that remain of interest and may continue to support targeted actions by
DOER or others.
Figure 6-1 lists the recommended keystone and cornerstone strategies for use in expanding the RT
industry in the state and helping achieve the 2020 GHG emission reduction targets (see section 1.2. The
keystone strategy is a key underlying strategy that ties together the efforts of all other strategies, while
the cornerstone strategies provide a solid footing in key cluster areas on which the state can build a
comprehensive RT program.
Figure 6-1: Keystone and Cornerstone Strategy Recommendations
The team’s 11 recommended building-block strategies can support the primary objectives and build on
the cornerstone strategies. These building blocks are not an a la carte selection of options, but rather a
comprehensive set of strategies that the Navigant team has identified for execution to ensure that the
state reaches its 2020 GHG targets. These strategies do not represent a commitment by DOER and are
instead a recommendation to DOER developed through the process described in section 2.4. If for any

Massachusetts DOER 43
Consulting Services for Commonwealth Accelerated Renewable Thermal Strategy
Scope of Service #: RFQQ-ENE-2013-101
reason the strategies are not to be executed in a comprehensive fashion, care should be taken in
understanding the tradeoffs of omitting any given strategy. Figure 6-2 lists each of the building block
strategies.
Figure 6-2: Building-Block Strategies by Cluster Area
The subsections below describe each of the strategies in detail.
6.1 Keystone Strategy: Develop Statewide Renewable Thermal Goals
Table 6-1: Strategy #1 Summary
Cluster Area Time Responsibilities
Governance Start: Dec 2013
End: Ongoing reporting
Proposed Lead Organization: DOER
Additional Participants: Executive Office EEA, MassDEP,
MassCEC, trade groups, consultants
Objective: Clearly communicate Massachusetts’ commitment to drive renewable thermal market growth
Background: Stakeholders have repeatedly mentioned the value of statewide goals in helping to drive
investment and resources in renewable energy and energy efficiency. Goals provide long-term
indications to investors that the state has concrete targets and, if done in a simple fashion, help to convey
realistic estimates of the financial size of the opportunity in the state. Targets can also work as a
marketing tool to help promote the industry in the state and increase awareness among consumers. For
example, goal setting in the PV industry in Massachusetts, along with the support necessary to meet

Massachusetts DOER 44
Consulting Services for Commonwealth Accelerated Renewable Thermal Strategy
Scope of Service #: RFQQ-ENE-2013-101
those goals, has helped to accelerate the state past its goals nearly four years early and become the
seventh highest ranked state in the nation for installed solar capacity.31
Pathway: DOER should establish market development goals (i.e., capacity (MWth) or market value ($)
by 2020) for each renewable thermal technology. Goals should account for key policy drivers and
customer class analysis insights and should be based on the renewable thermal GHG emission
reductions targets in the Massachusetts Clean Energy and Climate Plan for 202032. Goals should be
adjusted over time in order to respond to market conditions.
Table 6-2: Strategy #1 Implementation Steps
Steps Deliverable/Milestone
1. Estimate GHG reductions and associated dollar-value of projects
for typical residential and commercial installations for each
technology
2. Review key policy underlying policy goals and achievable impacts
from available incentive funds
3. Propose 2020 high/low technology (MWth) and market ($) goals for
RT technologies (e.g. between 100 and 200 MWth installed by 2020)
and review with market leaders
4. Publicly communicate state’s commitment to achieving RT goals
5. Monitor, report, and update market growth goals over time (see
strategy #2)
1. Dec 2013: estimate market
growth and GHG emission
reduction potential for
each technology
2. Dec 2013: establish
statewide goals
3. Mar 2014: launch quarterly
reporting program (see
strategy #2)
6.2 Cornerstone Strategies
6.2.1 Leverage, coordinate, and expand efforts across state agencies to meet short-term goals
Table 6-3: Strategy #2 Summary
Cluster Area Time Responsibilities
Governance Start: Dec 2013
End: Ongoing
Proposed Lead Organization: DOER
Additional Participants: MassDEP, MassCEC, DCAMM,
Utility PAs
Objective: Coordinate implementation of state agency programs to accelerate RT technology
deployment in the short-term.
31 For additional updates on PV goals, see the Northeast Sustainable Energy Association (NESEA) website at:
www.nesea.org/renewable-energy/massachusetts-rockets-past-solar-goals-patrick-shoots-for-the-sky/ 32 2% reduction in GHG emissions below the 1990 emissions level for all renewable thermal technologies, including
at least a 0.1% reduction in GHG emissions levels for solar thermal technologies; see section 1.2, above, for
additional discussion of GHG targets. “Massachusetts Clean Energy and Climate Plan for 2020”, December 2010,
Available at: www.mass.gov/eea/docs/eea/energy/2020-clean-energy-plan.pdf

Massachusetts DOER 45
Consulting Services for Commonwealth Accelerated Renewable Thermal Strategy
Scope of Service #: RFQQ-ENE-2013-101
Background: Presently the state has many different incentive and market development programs hosted
by different agencies, including MassCEC, Mass DOER, MassDEP, as well as MassSave. It is important
to understand the aggregate effect of these different programs on the development of the renewable
thermal markets. Coordination among key actors in Massachusetts can provide valuable benefits. As
part of coordination, additional analysis is needed to understand the sensitivity to various incentive
levels and to determine levels needed to reach specific target customer groups.
Pathway: Key agency leaders at DOER, MassDEP, MassCEC, as well as the utility Program
Administrators (PA) should meet on a monthly basis to track progress toward statewide renewable
thermal goals, coordinate implementation of market development programs (e.g. incentive levels and
structures, regulation, performance requirements, marketing, etc.), and adjust programs as necessary to
achieve goals. The group could also address industry research needs, such as thermal energy metering
assessment and technology validation (e.g. ccASHP performance testing).
Table 6-4: Strategy #2 Implementation Steps
Steps Deliverable/Milestone
1. Establish monthly meetings for state agencies
2. Analyze impacts of existing state incentives and regulations and
adjust programs to achieve near-term goals
3. Implement quarterly market progress reports, assessing market
development metrics for each technology (e.g. # of installations,
installed costs, expected payback, incentives awarded, performance
monitoring results, etc.)
4. Manage/adjust agency programs to respond to market needs
1. Dec 2013: start monthly
meetings
2. Mar 2014: launch
quarterly reporting
program
6.2.2 Launch comprehensive RT technology information campaign with MassSave
Table 6-5: Strategy #3 Summary
Cluster Area Time Responsibilities
Marketing
Start: Dec 2013
End: Review May
2015
Proposed Lead Organization: DOER, Utility PAs
Additional Participants: DPU, Trade groups, Environmental
groups
Objective: Expand awareness of RT technologies by leveraging existing customer outreach/information
programs like MassSave
Background: Customers lack awareness of renewable thermal technologies and, as a result, tend not to
ask energy auditors or HVAC contractors how or if they can install these technologies for their home or
business. Developing demand among consumers by helping them understand the benefits is important
in promoting organic industry growth. As discussed in section 2.2.1, above, customer education is
essential to reduce market risk and accelerate RT market growth. The modeling results and the
fundamental theory of the Fisher-Pry market penetration model emphasize the need for all such

Massachusetts DOER 46
Consulting Services for Commonwealth Accelerated Renewable Thermal Strategy
Scope of Service #: RFQQ-ENE-2013-101
activities which shorten the market saturation time. (See additional discussion of market risk and market
saturation time in section 3.3.)
Pathway: Develop a communication campaign with MassSave to increase awareness of renewable
thermal technologies. This should include approaches that increase widespread consumer awareness by
integrating RT into MassSave’s wide-reaching, mass-media communications (e.g. bill stuffers and
billboards) and one-on-one customer engagement (e.g. sales trainings for contractors). In all cases,
communication should include expanded communication around existing RT opportunities (e.g., ASHP
rebates, HEAT loans), as well as introduction of new RT opportunities.
Table 6-6: Strategy #3 Implementation Steps
Steps Deliverable/Milestone
1. Coordinate with utility program administrators (PAs) to determine
the best ways to expand MassSave marketing and auditing efforts
(and strategy # 7 for financing) to include all RT. Specifically discuss
funding options that address/avoid fuel switching issues.
2. Partner with other environmental and state energy organizations to
collaborate on RT marketing efforts
3. Identify target markets and optimal marketing channels for each RT
technology and launch new or improved marketing campaigns
4. Monitor the impact of expanded marketing efforts for RT
technologies
1. Dec 2013: Concrete plans
for MassSave expansion
2. Mar 2014: Industry
partnerships established
3. May 2014: New or
improved marketing
campaigns launched
4. May 2015: 1 yr program
evaluation
6.2.3 Support implementation of long-term, stable performance-based RT incentives
Table 6-7: Strategy #4 Summary
Cluster Area Time Responsibilities
Governance Start: Dec 2013
End: Ongoing
Proposed Lead Organization: DOER
Additional Participants: Mass Renewable Thermal Coalition
Objective: Improve cost effectiveness and reward reliable performance by implementing a performance-
based incentive
Background: Other jurisdictions have shown that performance-based incentives (PBI) for renewable
energy technologies have been successful in increasing market adoption. PBI programs reward better
performing technologies and appliances, which are important from an energy efficiency, emissions
reduction, and rate/tax payer point of view. One example of a RT PBI is the United Kingdom’s
Renewable Heat Incentive, which is structured as a feed-in tariff (FIT, see Table 4-1, above). Leveraging
lessons learned from international jurisdictions, Massachusetts policymakers should implement a PBI to
drive market growth for renewable thermal technologies in the Commonwealth.
Pathway: Implement a long-term, performance-based incentive for RT technologies to help improve cost
effectiveness and increase market penetration. Performance-based incentives, by definition, should

Massachusetts DOER 47
Consulting Services for Commonwealth Accelerated Renewable Thermal Strategy
Scope of Service #: RFQQ-ENE-2013-101
promote long-term energy efficient performance that will reliably meet long-term expectations for GHG
emissions reductions and do so by improving cost-effectiveness of the products. For example, senate bill
(SB) 1593 “An Act relative to credit for thermal energy generated with renewable fuels” would allow
renewable thermal technologies to qualify in the Alternative Portfolio Standard. Enacted in 2008, the
APS currently provides support for a range of alternative electricity technologies, but not thermal energy
(heat/cooling). This bill would allow renewable thermal technologies to qualify for the APS, providing a
production based incentive revenue stream.
Table 6-8: Strategy #4 Implementation Steps
Steps Deliverable/Milestone
1. Determine necessary actions to ensure that clean and energy
efficient RT technologies become eligible for a performance
based incentive.
2. Support political processes in legislature for SB 1593 and/or
other policies encouraging performance based incentives
3. Engage with DOER on regulatory implementation efforts.
4. Evaluate the incentive levels periodically and adjust them
based on market conditions to avoid over- or under-
stimulating the market.
1. Dec 2013 – engage in legislative
discussions and amendments
2. Schedule TBD – adoption of
legislation by full legislature
3. Schedule TBD – DOER to
implement regulation
4. Schedule TBD – periodic incentive
level updates
6.2.4 Integrate RT in state and public buildings via “Leading by Example” and/or other state energy
programs
Table 6-9: Strategy #5 Summary
Cluster Area Time Responsibilities
Governance Start: Dec 2013
End: TBD
Proposed Lead Organization: DOER, Executive Office of
Energy and Environmental Affairs , Executive Office for
Administration and Finance
Additional Participants: MassDEP, DCAMM, OSD, CLF
Objective: Reduce GHG emissions from state buildings and provide a clear signal to the marketplace of
state support for renewable thermal
Background: The "Leading by Example" (LBE) program sets aggressive targets for buildings and
facilities owned and operated by Massachusetts state agencies regarding GHG emission reductions,
energy conservation, and renewable energy. This program has been a key driver in accelerating energy
efficiency and renewable energy in the state. Currently, the LBE program includes targets for renewable
electricity (30% renewable electricity by 2020) and energy efficiency (35% energy consumption
reductions by 2020). Targets do not currently exist for renewable thermal technologies. By incorporating
renewable thermal targets into state buildings, the Commonwealth provides a clear signal to the market,
gathers important operational data on RT technologies, and pilots a program that could be expanded
into the building code across the state.
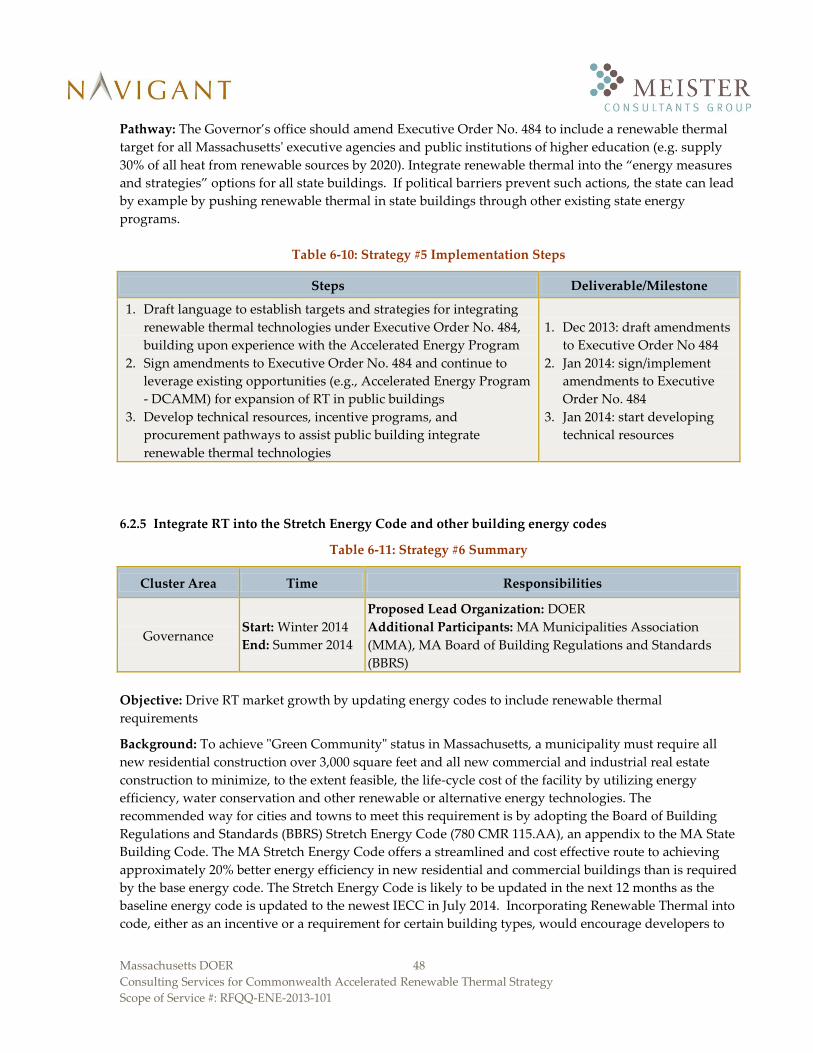
Massachusetts DOER 48
Consulting Services for Commonwealth Accelerated Renewable Thermal Strategy
Scope of Service #: RFQQ-ENE-2013-101
Pathway: The Governor’s office should amend Executive Order No. 484 to include a renewable thermal
target for all Massachusetts' executive agencies and public institutions of higher education (e.g. supply
30% of all heat from renewable sources by 2020). Integrate renewable thermal into the “energy measures
and strategies” options for all state buildings. If political barriers prevent such actions, the state can lead
by example by pushing renewable thermal in state buildings through other existing state energy
programs.
Table 6-10: Strategy #5 Implementation Steps
Steps Deliverable/Milestone
1. Draft language to establish targets and strategies for integrating
renewable thermal technologies under Executive Order No. 484,
building upon experience with the Accelerated Energy Program
2. Sign amendments to Executive Order No. 484 and continue to
leverage existing opportunities (e.g., Accelerated Energy Program
- DCAMM) for expansion of RT in public buildings
3. Develop technical resources, incentive programs, and
procurement pathways to assist public building integrate
renewable thermal technologies
1. Dec 2013: draft amendments
to Executive Order No 484
2. Jan 2014: sign/implement
amendments to Executive
Order No. 484
3. Jan 2014: start developing
technical resources
6.2.5 Integrate RT into the Stretch Energy Code and other building energy codes
Table 6-11: Strategy #6 Summary
Cluster Area Time Responsibilities
Governance Start: Winter 2014
End: Summer 2014
Proposed Lead Organization: DOER
Additional Participants: MA Municipalities Association
(MMA), MA Board of Building Regulations and Standards
(BBRS)
Objective: Drive RT market growth by updating energy codes to include renewable thermal
requirements
Background: To achieve "Green Community" status in Massachusetts, a municipality must require all
new residential construction over 3,000 square feet and all new commercial and industrial real estate
construction to minimize, to the extent feasible, the life-cycle cost of the facility by utilizing energy
efficiency, water conservation and other renewable or alternative energy technologies. The
recommended way for cities and towns to meet this requirement is by adopting the Board of Building
Regulations and Standards (BBRS) Stretch Energy Code (780 CMR 115.AA), an appendix to the MA State
Building Code. The MA Stretch Energy Code offers a streamlined and cost effective route to achieving
approximately 20% better energy efficiency in new residential and commercial buildings than is required
by the base energy code. The Stretch Energy Code is likely to be updated in the next 12 months as the
baseline energy code is updated to the newest IECC in July 2014. Incorporating Renewable Thermal into
code, either as an incentive or a requirement for certain building types, would encourage developers to

Massachusetts DOER 49
Consulting Services for Commonwealth Accelerated Renewable Thermal Strategy
Scope of Service #: RFQQ-ENE-2013-101
incorporate cost-effective renewable thermal technologies into buildings. As of May 2013, 132
communities, covering more than 50% of the population, had adopted the Stretch Energy Code and
adoption continues to expand.33 DOER should explore potential for increasing energy efficiency
requirements of the stretch code to encourage use of cost-effective renewable thermal technologies for
new construction or major renovation in the private sector.
Pathway: New stretch energy code requirements can accelerate the integration of RT technologies either
by:
A) Enabling credit for renewable thermal use, or
B) Establishing a requirement for certain buildings to use renewable thermal sources.
Seek public comment on revised stretch energy code requirements to encourage developers to use RT
and EE. This can be further supported by the Green Communities program - with accompanying
technical assistance, outreach, and incentives for participating communities. DOER and stakeholders
should identify and integrate RT into other building energy codes such as the International Green
Construction Code or the Collaboration for High Performance Schools (CHPS) code.
Table 6-12: Strategy #6 Implementation Steps
Steps Deliverable/Milestone
1. Work with BBRS to determine options for incorporating RT into the
Stretch Energy Code, evaluating technical impacts and requirements
(e.g. engage consultants/researchers as needed). Additionally, evaluate
options for integrating RT into the Intl Green Construction Code or
CHPS.
2. Draft preliminary language for public comment period and for final
code update. Review with stakeholders to ensure broad public support
during comment period and acceptance in the new code.
3. Facilitate completion of code update
4. Provide support as needed to connect MMA with necessary resources
and to market the new code
1. Winter 2014: participate
in public comment
period
2. Next steps TBD
6.2.6 Provide low-cost financing for renewable thermal through the MassSave HEAT loan program
Table 6-13: Strategy #7 Summary
Cluster Area Time Responsibilities
Financing Start: Jan 2014
End: Dec 2014
Proposed Lead Organization: DOER, utility PAs
Additional Participants: MassCEC, trade groups
Objective: Provide low or 0% financing for renewable heating and cooling systems
33 Stretch Code Adoption, By Community, pdf available: www.mass.gov/eea/docs/doer/green-communities/grant-
program/stretch-code-towns-adoption-by-community-map-and-list.pdf

Massachusetts DOER 50
Consulting Services for Commonwealth Accelerated Renewable Thermal Strategy
Scope of Service #: RFQQ-ENE-2013-101
Background: MassSave, the utility sponsored EE financing program, works with local lenders to provide
zero interest or low-interest unsecured loans for SHW and other energy efficiency improvements. As
part of the program, the utilities provide funds to buy down the cost of interest for the loans. The HEAT
loan program has helped provide more than $125 Million in loans to state residents in the last six years
and has proven to be highly effective in reducing cost barriers for the adoption of high-efficiency
equipment.34 As discussed in section 2.2.1, above (model background), and in section 3.3, above
(analysis conclusions), reducing first-cost barriers is essential to increase the maximum achievable
penetration of a technology, and is a vital component of a comprehensive RT strategy. Currently, SHW
and heat pumps are considered eligible EE measures and customers may finance these technologies
under the HEAT loan. Biomass thermal, by contrast, is viewed as renewable generation and is not
currently eligible.
Pathway: DOER and stakeholders should work together to enable financing of renewable heating and
cooling systems under the existing HEAT loan program. Barriers identified to date include: utility fuel-
switching guidelines that prevent many renewable thermal systems from receiving financing, loan caps
that prevent customers from financing renewable thermal systems in addition to EE retrofits, and poor
awareness (or confusion) regarding eligibility of RT technologies. All RT technologies should be eligible
for financing under both the residential and commercial HEAT loan programs.
Table 6-14: Strategy #7 Implementation Steps
Steps Deliverable/Milestone
1. Clarify existing MassSave rules for financing renewable
thermal systems with utility PAs for both residential and
commercial systems
2. Develop working group (see strategy #13) to identify funding
sources to buy down points on loans for technologies that are
not currently covered by MassSave (e.g. high efficiency, low
emission biomass) and to identify any additional barriers that
prevent low-cost financing for RT
3. Develop rules/guidelines with utility PAs to address barriers.
4. Fully integrate renewable thermal systems into the MassSave
HEAT loan
1. Jan 2014: clarify existing
MassSave rules for financing
renewable thermal systems
2. Apr 2014: develop working
group to identify barriers to
integrating all renewable thermal
technologies into HEAT loan (see
strategy #13)
3. Dec 2014: issue final guidelines
for HEAT loan financing for
renewable thermal technologies
34 From the website of the program’s implementation contractor, Conservation Services Group: www.csgrp.com/the-
mass-save-heat-loan-program-energy-efficiency-financing-case-study/

Massachusetts DOER 51
Consulting Services for Commonwealth Accelerated Renewable Thermal Strategy
Scope of Service #: RFQQ-ENE-2013-101
6.3 Building Block Strategies
6.3.1 Develop "Thermalize" program, modeled after the successful Massachusetts Solarize program
Table 6-15: Strategy #8 Summary
Cluster Area Time Responsibilities
Marketing Start: Dec 2013
End: Review Mar 2015
Proposed Lead Organization: MassCEC
Additional Participants: DOER, local communities
Objective: Increase RT awareness and reduce costs via competition and facilitation of customer
acquisition
Background: The Solarize Mass program is a grassroots education campaign, driven mainly by
volunteers, that increases the adoption of small-scale solar electricity in communities through a
competitive tiered pricing structure. It has led to more than 900 residents and business owners signing
contracts for small-scale electricity systems, while speaking with thousands more about the economic
and environmental benefits of solar electricity and energy efficiency.35 Solarize Mass for solar PV has
been designed and implemented by MassCEC in collaboration with the Green Communities Division of
DOER. Several solarize-style customer-aggregation pilot projects for renewable thermal technologies
have been developed around the country. These programs have met with varying levels of success,
providing customers’ installed cost discounts ranging from 5% to 30%.36
Pathway: Develop a program similar to Solarize MA to increase awareness and encourage/enable
adoption of solar thermal, biomass thermal, or heat pumps across the Commonwealth. Support
MassCEC, and use lessons learned from the prior small, successful pilot.
35 MassCEC webpage: www.masscec.com/solarizemass 36 Known solarize-style pilot projects that have supported renewable thermal technologies include the Minnesota
Renewable Energy Society’s “Make Mine Solar Hot Water” program, the “Solar Addison County” program run by
the Vermont Public Interest Research Group (VPIRG), a solar thermal pilot program in Lancaster, Mass. offered by
BEAM Engineering, and the “Model Neighborhood Project” offered by the Northern Forest Center.

Massachusetts DOER 52
Consulting Services for Commonwealth Accelerated Renewable Thermal Strategy
Scope of Service #: RFQQ-ENE-2013-101
Table 6-16: Strategy #8 Implementation Steps
Steps Deliverable/Milestone
1. Coordinate with Mass CEC to leverage experience and
mechanisms from Solarize program to develop a plan for
“Thermalize MA” program; identify initial target communities
based on prevalence of oil/electric resistance heating.
2. Engage local installers and manufacturers to develop competitive
procurement arrangements for RT equipment
3. Launch “Thermalize MA” program and sponsor grassroots
support for RT installations via educational workshops and
community outreach
4. Set up monitoring committee to evaluate the progress of the
program, identify new target communities and publicize
program results
1. Dec 2013: Detailed plan for
launching and managing
“Thermalize MA” program
2. Mar 2014: Procurement and
installation contracts
developed
3. Jun 2014: “Thermalize MA”
program launched
4. Mar 2015: 1 year program
evaluation
6.3.2 Develop comprehensive, online database with technology case studies and performance metrics
Table 6-17: Strategy #9 Summary
Cluster Area Time Responsibilities
Marketing
Start: Dec 2013
End: Aug 2014
(ongoing updates)
Proposed Lead Organization: DOER
Additional Participants: BTEC, SEIA, NEGPA, IGSHPA,
Mitsubishi, MassCEC
Objective: Improve consumer confidence in renewable thermal technology applications and
performance
Background: Because many traditional HVAC installers and building owners are unfamiliar with RT
technologies, they typically express skepticism regarding the operational success of RT. Providing access
to case studies and state-sanctioned performance data can assist customers gain greater confidence in RT
technologies.
Pathway: DOER, MassCEC, and trade groups should collect and analyze performance data of renewable
thermal systems, making it publicly available to consumers, HVAC contractors, plumbers, architects,
and other trades. State agencies can assist in streamlining an effective technology evaluation process
(such as certification, qualification, etc.), potentially on a regional or national basis. Performance data
should be accompanied by case studies, describing applications, costs, maintenance requirements, and
customer experiences. Data should be accessible via mobile devices to facilitate sales by contractors with
potential customers.

Massachusetts DOER 53
Consulting Services for Commonwealth Accelerated Renewable Thermal Strategy
Scope of Service #: RFQQ-ENE-2013-101
Table 6-18: Strategy #9 Implementation Steps
Steps Deliverable/Milestone
1. Identify funding/resources from government and industry
sources to sponsor project
2. Collect available performance data for renewable thermal
systems (from MassCEC, DOER, and industry leaders)
3. Hire 3rd party vendor to aggregate data, create case studies,
and develop online presence
4. Market results to consumers/trades (see strategy #3)
5. Manage and update online platform on quarterly basis
1. Dec 2013: Identify funding and
resources
2. Dec 2013: Complete collection of
sample data
3. Jan 2014: Issue RFP for services and
select 3rd party vendor (by March)
4. Aug 2014: Launch online platform
5. Ongoing: platform updates
6.3.3 Provide data to assist developers and installers identify “high value” renewable thermal
customers
Table 6-19: Strategy #10 Summary
Cluster Area Time Responsibilities
Marketing
Start: Feb 2014
End: Aug 2014
(periodic updates)
Proposed Lead Organization: MassCEC
Additional Participants: DOER, MassDEP, MassGIS,
DCAMM
Objective: Assist project developers to identify “high value” customers that are likely to adopt
renewable thermal technologies
Background: Project developers report significant challenges in identifying "high-value" customers, or
those likely to adopt renewable thermal technologies. This is a particular challenge for biomass thermal
customers in new regions where a so-called 'hub and spoke' distribution model for pellet/chip
distribution has not yet been established. Recent studies of renewable energy technologies indicate that
customer acquisition costs are a significant cost center for businesses. High-value customers vary based
upon technology requirements, though they generally include customers that face high heating costs and
do not have easy access to natural gas. This may be, in many ways, considered training for project
developers.
Pathway: MassCEC should develop GIS tools to help stakeholders (communities, developers, building
owners, etc.) identify opportunities for renewable thermal installations. For each renewable thermal
technology, the GIS tool should screen buildings for key technical and development requirements,
including accessibility of natural gas, distance to fuel producers (for biomass chips/pellets), and space
requirements, among others. Tool outputs should include estimates of project size, energy production,
and cost-effectiveness.

Massachusetts DOER 54
Consulting Services for Commonwealth Accelerated Renewable Thermal Strategy
Scope of Service #: RFQQ-ENE-2013-101
Table 6-20: Strategy #10 Implementation Steps
Steps Deliverable/Milestone
1. Identify funding/resources from government and industry
sources to sponsor project
2. Hire 3rd party vendor to aggregate data, develop methodology,
and create tool
3. Integrate tool into Thermalize program (see strategy #8), training
programs (see strategy #15 and #18), and information campaigns
(see strategy #3)
1. Feb 2014: issue RFP for
services
2. Apr 2014: select 3rd party
vendor
3. Aug 2014: launch online GIS
tool
6.3.4 Create tool that helps customers self-screen for suitability of RT technologies
Table 6-21: Strategy #11 Summary
Cluster Area Time Responsibilities
Marketing Start: Dec 2013
End: Jul 2014 (ongoing updates)
Proposed Lead Organization: DOER
Additional Participants: MassCEC
Objective: Reduce acquisition costs through self-screening and help connect consumers and contractors
Background: Customers lack knowledge about renewable heating technologies, and thus selecting the
appropriate technology is hard. Solar PV sites such as Geostellar provide recommendations to customers
for solar PV systems based on their building characteristics. A similar process or questionnaire could be
developed to match renewable heating technologies.
Pathway: The DOER could develop a questionnaire with basic questions tailored to major end-user
categories (residential, commercial, industrial). Based on answers, customers could be directed to
appropriate renewable heating and cooling resources, and information on local installers and rebates.

Massachusetts DOER 55
Consulting Services for Commonwealth Accelerated Renewable Thermal Strategy
Scope of Service #: RFQQ-ENE-2013-101
Table 6-22: Strategy #11 Implementation Steps
Steps Deliverable/Milestone
1. Collaborate with stakeholders and industry experts to develop
framework for screening tool and identify key inputs, outputs and
underlying algorithm
2. Contract software developer or university to build web-based,
publically available software tool enabling simple self-screening of
RT technologies
3. Share beta copy of tool with stakeholders and refine based on
feedback
4. Validate program, and release to public
5. Support and promote screening tool with public awareness
campaigns (see strategy #3) and establish a monitoring team to
continually update and validate the tool as new technologies arise.
1. Dec 2013: Tool framework
2. Jan 2014: Software
development contract
awarded
3. Mar 2014: Beta copy
distributed to stakeholders
4. Jul 2014: Validated tool
released to public
5. Ongoing: Tool support and
promotion
6.3.5 Support technology exchanges with “state-of-the-art” manufacturers
Table 6-23: Strategy #12 Summary
Cluster Area Time Responsibilities
Innovation
Start: Jan 2014
End: Jul 2014
(ongoing support)
Proposed Lead Organization: MassCEC and trade groups
Additional Participants: DOER, MassDEP, international
partners, Barr Foundation, MA Office of International Trade
and Investment (MOITI)
Objective: Increase customer access to state-of-the-art, high efficiency, and low-emissions renewable
thermal systems
Background: Due to large home markets and tighter emission and efficiency regulations, many
European and Asian manufacturers can provide high efficiency, low-emission and cost-effective
renewable thermal systems to U.S. customers. A number of foreign manufacturers are already
distributing products in Massachusetts and across New England. This includes high efficiency, low
emission biomass heating systems, or solar cooling systems, as well as high efficiency heat pumps.
Upper Austria has proven the benefit of a cluster development approach (Oekoenergie cluster) to drive
innovation; Massachusetts can leverage this expertise and help build a new innovation cluster (see
section 4).
Pathway: Encourage exchanges and partnerships between regional U.S. installers and European and
Asian manufacturers in order to increase customer access to state-of-the-art systems. If the process is
well guided, these exchanges can also drive innovation and economic growth in Massachusetts through
partnerships between local and international manufacturers. Ensure that codes do not restrict importing
of more state-of-the-art technology.

Massachusetts DOER 56
Consulting Services for Commonwealth Accelerated Renewable Thermal Strategy
Scope of Service #: RFQQ-ENE-2013-101
Table 6-24: Strategy #12 Implementation Steps
Steps Deliverable/Milestone
1. Develop special incentive category to encourage use of high
efficiency, low emission systems and announce renewable
thermal goals (see strategy #1)
2. Identify European/Asian manufacturers interested in the U.S.
market and regional U.S. installers/developers interested in
offering European/Asian products
3. Provide introductions, develop events, and launch
international exchange program to encourage collaboration
4. Provide technical assistance to help developers and
manufacturers integrate European/Asian products into the
Massachusetts market
1. Jan 2014: Establish special
incentives and announce
renewable thermal goals (see
strategy #1)
2. Mar 2014: develop technical
assistance program for
international manufacturers
3. Jul 2014: Launch international
exchange program
4. Ongoing: technical assistance
6.3.6 Create Renewable Thermal Industry Advisory Forum
Table 6-25: Strategy #13 Summary
Cluster Area Time Responsibilities
Governance Start: Jan 2014
End: Ongoing
Proposed Lead Organization: DOER
Additional Participants: MassCEC, trade groups, MassDEP,
CLF, international partners
Objective: Address common needs and coordinate actions across technology sectors to drive
comprehensive renewable thermal market growth
Background: Similar to the support structure that trade associations can provide to a single industry, the
RT industry as a whole needs joint support. While some issues and challenges are best addressed by one
individual industry, many challenges that the RT sectors face are shared, and can be most effectively
addressed in a joint fashion. The development of a RT stakeholder advisory group affords opportunity
to address ongoing issues, including governance, marketing, workforce development, and other
concerns.
Pathway: The forum should address challenges shared across renewable thermal sectors. It should assist
stakeholders identify common priorities, develop working groups, and implement projects that support
industry growth.

Massachusetts DOER 57
Consulting Services for Commonwealth Accelerated Renewable Thermal Strategy
Scope of Service #: RFQQ-ENE-2013-101
Table 6-26: Strategy #13 Implementation Steps
Steps Deliverable/Milestone
1. Identify funding/resources and stakeholders
from government, industry, and non-profits to
sponsor the initiative
2. Identify common priorities and develop
renewable thermal working groups
3. Implement projects/initiatives to address
priorities
1. Jan 2014: identify industry and government
funding to support the forum
2. Mar 2014: host kick-off meeting with key
stakeholders; host monthly meetings thereafter
3. Apr 2014: identify/develop working groups to
address key priorities
4. Jul 2014: launch projects to address priorities
(e.g. international exchanges, see
recommendation #12)
6.3.7 Review market enabling guidance regarding fuel choices and associated GHG emissions
Table 6-27: Strategy #14 Summary
Cluster Area Time Responsibilities
Governance Start: Dec 2013
End: Apr 2014
Proposed Lead Organization: DOER
Additional Participants: DPU, EEAC, Utility PAs
Objective: Determine pathways to support fuel neutral incentives for customers who want to purchase
RT equipment
Background: Energy efficiency rebates and financing from MassSave are not available to customers who
would be switching thermal fuel sources by buying the incentivized equipment, also known as "fuel
switching". This limits important opportunities for implementing energy efficiency as well as renewable
heating and cooling technologies for Massachusetts customers, especially those using oil or propane.
Potential biomass customers are among the most inhibited since biomass thermal inherently requires
fuel switching.
Pathway: DOER should review its guidelines on fuel neutrality with regards to RT technology
programs. Included in the review should be an evaluation of minimum required efficiencies for RT
equipment for those consumers who switch fuels by upgrading to RT. The required efficiency should
ensure that the switch in fuel has a net improvement in primary (source) fuel consumption and
associated GHG emissions. Challenges to address include both incentive funding (see strategy #2) and
marketing/communication funding (see strategy #3).

Massachusetts DOER 58
Consulting Services for Commonwealth Accelerated Renewable Thermal Strategy
Scope of Service #: RFQQ-ENE-2013-101
Table 6-28: Strategy #14 Implementation Steps
Steps Deliverable/Milestone
1. Conduct outreach to key stakeholders (e.g., utilities, DPU) to
identify key barriers for each RT technology. For each distinct
barrier, evaluate potential impacts (GHG emissions, RT penetration,
etc.) of alleviating the barrier.
2. Evaluate minimum efficiencies for each RT technology to ensure net
benefit in GHG emissions for each switch (e.g., gas to electric,
electric to biomass, etc.).
3. Determine pathways to alleviating key barriers that include
minimum efficiency requirements. For example, identification of
alternative funding sources for select fuel switching customers.
4. Implement fuel neutral financing mechanisms that address the key
barriers first. Monitor effectiveness and update policies over time.
1. Dec 2013: Comprehensive
understanding of barriers
2. Jan 2014: Min efficiency
specs for all RT tech (e.g.
matrix format)
3. April 2014:
Recommendations for
next steps in
policy/funding
4. 2015 program year or
sooner if possible:
ongoing monitoring
6.3.8 Institute technical and sales training programs
Table 6-29: Strategy #15 Summary
Cluster Area Time Responsibilities
Labor and
Standards
Start: Dec 2013
End: Ongoing
Proposed Lead Organization: MassCEC or Trade Groups
Additional Participants: Manufacturers, trade associations,
independent training and certification organizations,
community colleges, vocational schools
Objective: Boost RT industry expertise with a particular focus on installers and on the point of
transaction
Background: Installer training programs in RT are fragmented and are insufficient to be able to support
accelerated RT industry growth. (See discussion of market saturation time in section 2.2.1, above.) As
discussed in section 3.3, above, the modeling results highlight the need for such training in order to
reduce market and technology risk. GSHP training programs have historically been difficult because
there is no clear leading trade association responsible for training; GSHPA and NEGPA have helped to
fill that gap. For ASHP, a number of manufacturers provide training, and in some cases, it is required for
the installer to be able to offer an extended warranty (this represented the most established program due
to the well-established nature of ASHP manufacturers).. The biomass industry lacks key funds to be able
to invest in large-scale training programs. More outreach is needed to understand from biomass
industry trade groups how the state can assist developing training programs. Further, the industry
needs to educate architects, developers, energy auditors, installation contractors, and other key building
players on RT technologies in order to increase awareness and options.
Pathway: Support training on RT technologies for two constituencies:

Massachusetts DOER 59
Consulting Services for Commonwealth Accelerated Renewable Thermal Strategy
Scope of Service #: RFQQ-ENE-2013-101
A) Technical designers & installers – technical design/installation skills to ensure reliable, efficient,
and as-expected operation. As appropriate, tie-in with installer certification and inspector
training.
B) RT salespeople, architects, developers, auditors, appraisers – boost business development
expertise for salespeople and other industry players who may impact brand perceptions, costs,
and marketability.
Coordinate with manufacturer-based installer trainings and trade association trainings; develop
additional training avenues in areas where such training support is lacking or nonexistent.
Table 6-30: Strategy #15 Implementation Steps
Steps Deliverable/Milestone
1. Reach out to manufacturers, trade organizations, and other
independent training organizations to determine scope of
existing programs
2. Identify target RT audiences and associated needs (key training
objectives)
3. Determine need for new programs or if existing programs can
be expanded
4. Bring in instructors, develop course/seminar content, identify
optimal format
5. Initiate training programs and update/refine programs to
ensure high quality, appropriate content and impact
1. Dec 2013: Understanding of
existing training landscape
2. Jan 2014: Complete
characterization of training
needs and objectives
3. Jun 2014: Complete training
materials and plan
4. Jan 2015 and ongoing: Training
begins and updated
periodically
6.3.9 Engage heating oil and propane industry to explore RT business opportunities
Table 6-31: Strategy #16 Summary
Cluster Area Time Responsibilities
Resources and
Logistics
Start: Dec 2013
End: Fall 2014
Proposed Lead Organization: DOER
Additional Participants: MEMA, PGANE, Interested
companies, New England Fuel Institute (NEFI)
Objective: Leverage the energy experience and skilled labor force in the oil heat and propane industry to
help develop the RT industry.
Background: Previously, the state has had some success in working with oil heat companies (e.g.,
Sandri) to integrate SHW and biomass thermal into their product offerings. In Vermont, some oil
companies have integrated heat pumps into their product portfolios. Oil heat distributors and installers
represent key sectors in the Commonwealth and could play an important role in supporting RT market
growth. RT can also represent an important new market opportunity for oil heat businesses. Installers of
oil heating equipment have a substantial knowledge of HVAC equipment, building systems, the supply

Massachusetts DOER 60
Consulting Services for Commonwealth Accelerated Renewable Thermal Strategy
Scope of Service #: RFQQ-ENE-2013-101
chain for fuel distribution, as well as an established customer base. Oil dealers have expressed an interest
in supporting blending biofuels with heating oil.
Pathway: Evaluate potential for future collaboration with propane and oil heat distribution companies
as an avenue for increasing biomass installation and fuel distribution infrastructure. Investigate
opportunities, challenges, and needs of oil heat companies interested in expanding product offerings to
include renewable thermal. Key starting points may include focused dialogue, market opportunity
analyses, as well as incentives (grants) to support purchase of biomass fuel distribution trucks and other
infrastructure.
Table 6-32: Strategy #16 Implementation Steps
Steps Deliverable/Milestone
1. Engage with key players in the oil and propane distribution
and equipment industries to gauge interest in RT technologies
and explore key pathways.
2. Develop a plan for oil heat and propane industry
participation, including identification of key partners for
marketing, education/training, etc.
3. In parallel, leverage existing marketing channels (see Strategy
#3) to promote RT technologies and support training (see
Strategy #15).
4. Expand participation beyond key partners to encourage
participation by a broader portion of the industry
1. Dec 2013: Knowledge of viability
and pathways for oil/propane-
industry participation
2. Mar 2014: Complete RT plan for
oil/propane industry
3. Jun 2014: Active oil-heat/propane
industry participation in training
& marketing
4. Fall 2014: Increased participation
from other industry players
6.3.10 Integrate renewable thermal into energy protection and assistance programs for low-income
families
Table 6-33: Strategy #17 Summary
Cluster Area Time Responsibilities
Governance Start: Jan 2014
End: Sept 2015
Proposed Lead Organization: DOER
Additional Participants: LIHEAP program, Good Neighbor
Energy Fund, Local Emergency Fuel Assistance Program,
Citizens Energy Heat Assistance Program, LEAN, Dept. of
Housing and Community Dev. (DHCD)
Objective: Provide energy protection and assistance for low-income consumers using non-regulated
heating fuels like biodiesel or biomass chips and pellets.
Background: Regulated fuels, like electricity and gas, cannot be cut off in times of need and do not
require action on the part of the consumer to bring them into the home. Unregulated fuels, such as
heating oil, can be cut off during the heating season if families cannot afford to pay for fuel delivery.

Massachusetts DOER 61
Consulting Services for Commonwealth Accelerated Renewable Thermal Strategy
Scope of Service #: RFQQ-ENE-2013-101
Accelerating the market for renewable thermal conversions necessitates taking into account how this
may affect low-income family’s fuel certainty. This will depend on the fuel displaced and the RT
technologies utilized. Some technologies may enhance fuel certainty, whereas others may introduce
different fuel risks. For example, heat pumps use electricity for heating, which comes with the
protection of that regulated fuel. A family converting from oil to heat pumps should see their energy
protection increase. Adding solar hot water to supplement existing heating systems will reduce the
amount of oil that families would have to buy, but would not change the risk of supply disruption.
Finally, families that convert to biomass would shift from oil supply risk or the protection of electric
heating to risks related to wood delivery. Since RT technology programs would be designed to generate
savings, however, families that adopt RT technologies would be more able to pay for their fuel supply
overall, thereby decreasing their fuel risk.
Pathway: DOER should work with existing energy protection and assistance programs in order to
include unregulated renewable thermal technologies and fuels. This may include working with LIHEAP,
the Good Neighbor Energy Fund, the Local Emergency Fuel Assistance, or Citizens Energy Heat
Assistance Programs to allocate funding to support customers using renewable thermal technologies.
Table 6-34: Strategy #17 Implementation Steps
Steps Deliverable/Milestone
1. Identify and reach out to energy protection and
assistance funding program managers in
Massachusetts
2. Analyze barriers and opportunities for extending these
programs to include renewable heating and cooling
technologies and fuels
3. Create recommendations and pathways for extending
programs to renewable thermal technologies
4. Implement pilot programs
5. Evaluate program results and expand pilot programs
1. Jan 2014: reach out to energy protection
and assistance program managers
2. May 2014: analyze barriers and
opportunities and develop
recommendations
3. Sept 2014: implement recommendations
and run pilot programs
4. May 2015: evaluate results of pilot
programs
5. Sept 2015: expand pilot programs
6.3.11 Integrate RT and EE into community college and vocational school curricula
Table 6-35: Strategy #18 Summary
Cluster Area Time Responsibilities
Labor and
Standards
Start: Dec 2013
End: Sept 2014
Proposed Lead Organization: Trade associations or DOER
Additional Participants: DOER, manufacturers, independent
training and certification organizations, community colleges,
vocational schools,
Objective: Support long-term industry development through training college and vocational school
students in energy efficient and renewable technologies

Massachusetts DOER 62
Consulting Services for Commonwealth Accelerated Renewable Thermal Strategy
Scope of Service #: RFQQ-ENE-2013-101
Background: While training of existing contractors and installers is the top priority, training for students
is important for long-term development of the industry. Such a program can tie into the "Clean Heat
101" program. There may be natural connection for such an effort in coordination with the “Pathways
Out of Poverty Program” that provides grant funding for job training programs for low-income
individuals in the clean energy sector. The State already has other efforts underway in this area that
could be leveraged. For example, in 2009, MassCEC awarded 6 grants for development of training
programs for high school students, college students, educators, and workforce professionals. These
grants resulted in development of more than 30 lesson plans, certificates and training programs.37
Pathway: Support organizations that develop curricula specifically for energy efficiency and renewable
heating and cooling technologies. Develop relationships with community colleges and vocational
schools to identify optimal approaches for integration of RT curricula. Conduct ongoing updates and
refinements to programs to ensure content covers state-of-the-art and most comprehensively prepares
graduates for a variety of career paths in RT technology.
Table 6-36: Strategy #18 Implementation Steps
Steps Deliverable/Milestone
1. Identify candidate schools that are well positioned for new
curricula in sustainable energy technologies
2. Support development of new curricula and training programs in
energy efficiency techniques and renewable heating and cooling
technologies
3. Help schools setup partnerships with renewable energy industry
groups, manufactures, and installers to encourage employment of
these students in the industry
1. Dec 2013: Candidate
schools identified
2. May 2014: Initiate
development of new
curricula
3. Sept 2014: Industry
partnerships established
37 MassCEC Clean Energy Workforce Training Capacity Building Curricula, information available:
www.masscec.com/content/clean-energy-workforce-training-capacity-building-curricula

Massachusetts DOER 63
Consulting Services for Commonwealth Accelerated Renewable Thermal Strategy
Scope of Service #: RFQQ-ENE-2013-101
Appendix A MA Market Segment Data
Table A-1 and Table A-2 lists the relevant CBECS and RECS data used in this analysis for each of 16
defined market segments.38, 39 RECS data was available specifically for MA; however, CBECS data were
available only for New England as a whole. The team scaled the CBECS data for New England based on
the population of Massachusetts relative to the population of New England.40
Table A-1: Massachusetts Building Stock Data by Market Segment – Residential Buildings
Market Segment Attributes Annual Market Segment Data
Building
Sector
Thermal
Fuel
Income
Level /
Bldg Size
HouseholdsA
Avg. Primary
Thermal Energy
Use
(MMBtu/Bldg)
Total Primary
Thermal
Energy Use
(MMBtu)
% of Total MA
Primary
Thermal Energy
Use per year
Residential
Electricity Low-Income 185,356 58 10,763,001 2.5%
High-Income 71,286 76 5,442,778 1.3%
Fuel Oil Low-Income 375,134 91 34,197,607 7.9%
High-Income 389,531 116 45,224,862 10.4%
Propane Low-Income 50,536 49 2,482,183 0.6%
High-Income 10,513 75 786,601 0.2%
Natural Gas Low-Income 793,852 84 66,941,600 15.5%
High-Income 543,354 101 54,873,900 12.6%
Total: 2,419,562 N/A 220,712,532 51%
Note A: Massachusetts residential households are split roughly 50/50 between single family homes and apartments in multi-family buildings (RECS).
38 U.S. Energy Information Administration, Residential Energy Consumption Survey (RECS), Available at:
www.eia.gov/consumption/residential/ 39 U.S. Energy Information Administration, Commercial Building Energy Consumption Survey (CBECS), Available
at: www.eia.gov/consumption/commercial/ 40 Rhode Island Department of Labor and Training, Labor Market Information, Available at:
www.dlt.ri.gov/lmi/census/pop/neweng.htm

Massachusetts DOER 64
Consulting Services for Commonwealth Accelerated Renewable Thermal Strategy
Scope of Service #: RFQQ-ENE-2013-101
Table A-2: Massachusetts Building Stock Data by Market Segment – Commercial Buildings
Market Segment Attributes Annual Market Segment Data
Building
Sector
Thermal
Fuel
Income
Level /
Bldg. Size
Number of
Comm
Buildings
Avg. Primary
Thermal Energy
Use
(MMBtu/Bldg)
Total Primary
Thermal
Energy Use
(MMBtu)
% of Total MA
Primary
Thermal Energy
Use per year
Commercial
Electricity Small Bldg. 17,867 333 5,945,377 1.4%
Large Bldg. 5,287 6,342 33,531,201 7.7%
Fuel Oil Small Bldg. 46,264 471 21,798,230 5.0%
Large Bldg. 6,128 8,102 49,651,083 11.5%
Propane Small Bldg. 2,469 233 574,480 0.1%
Large Bldg. 2,166 6,557 14,205,789 3.3%
Natural Gas Small Bldg. 26,709 421 11,248,553 2.6%
Large Bldg. 6,775 11,127 75,389,400 17.4%
Total: 113,665 N/A 212,344,113 49%

Massachusetts DOER 65
Consulting Services for Commonwealth Accelerated Renewable Thermal Strategy
Scope of Service #: RFQQ-ENE-2013-101
Appendix B MA Customer Classes
Table B-1 lists all of the 54 customer classes characterized as part of the CARTS modeling process.
Table B-1: List of All 54 Customer Classes
Offsetting
Fuel
Building
Sector
Income
Level /
Bldg. Size
Target
RT Tech
Electricity Commercial Large ccASHP
Electricity Commercial Large BMCH
Electricity Commercial Large BMP
Electricity Commercial Large GSHP
Electricity Commercial Large ST
Electricity Commercial Small ccASHP
Electricity Commercial Small BMP
Electricity Commercial Small GSHP
Electricity Commercial Small ST
Electricity Residential High ccASHP
Electricity Residential High BMP
Electricity Residential High GSHP
Electricity Residential High ST
Electricity Residential Low ccASHP
Electricity Residential Low BMP
Electricity Residential Low GSHP
Electricity Residential Low ST
Fuel Oil Commercial Large ccASHP
Fuel Oil Commercial Large BMCH
Fuel Oil Commercial Large BMP
Fuel Oil Commercial Large GSHP
Fuel Oil Commercial Large ST
Fuel Oil Commercial Small ccASHP
Fuel Oil Commercial Small BMP
Fuel Oil Commercial Small GSHP
Fuel Oil Commercial Small ST
Fuel Oil Residential High ccASHP
Fuel Oil Residential High BMP
Fuel Oil Residential High GSHP
Fuel Oil Residential High ST
Fuel Oil Residential Low ccASHP
Fuel Oil Residential Low BMP
Fuel Oil Residential Low GSHP
Fuel Oil Residential Low ST
LPG Commercial Large ccASHP
LPG Commercial Large BMP
LPG Commercial Large GSHP
Offsetting
Fuel
Building
Sector
Income
Level /
Bldg. Size
Target
RT Tech
LPG Commercial Large ST
LPG Commercial Small ccASHP
LPG Commercial Small BMP
LPG Commercial Small GSHP
LPG Commercial Small ST
LPG Residential High ccASHP
LPG Residential High BMP
LPG Residential High GSHP
LPG Residential High ST
LPG Residential Low ccASHP
LPG Residential Low BMP
LPG Residential Low GSHP
LPG Residential Low ST
Nat. Gas Commercial Large ccASHP
Nat. Gas Commercial Large GSHP
Nat. Gas Commercial Small ccASHP
Nat. Gas Commercial Small GSHP

Massachusetts DOER 66
Consulting Services for Commonwealth Accelerated Renewable Thermal Strategy
Scope of Service #: RFQQ-ENE-2013-101
Appendix C Technology Assumptions
Table C-1: Cost and Efficiency Assumptions41
Technology Sector
Total Installed Cost
(Heating and DHW)
Installed Cost
(Cooling) Efficiency Fuel Btu Content Fuel Cost
Fuel cost
Escalator
Natural Gas
Residential $10,275 $6,000 85% (heating)
COP = 2.5 (cool) 1 MMBtu/Mcf $13.83 per Mcf 0.97%
Commercial $44,000 $116,000 (heating &
cooling)
85% (heating)
COP = 2.5 (cool) 1 MMBtu/Mcf $11.07 per Mcf 0.97%
Electric
Residential $10,275 $6,000 99% (heating)
COP = 2.5 (cool)
0.0034
MMBtu/kWh
$0.155 per
kWh 3%
Commercial $44,000 $116,000 (heating &
cooling)
99% (heating)
COP = 2.5 (cool)
0.0034
MMBtu/kWh
$0.145 per
kWh 3%
Fuel Oil
Residential $10,275 $6,000 85% (heating)
COP = 2.5 (cool)
0.1387
MMBtu/Gal $3.94 per Gal 3.22%
Commercial $44,000 $116,000 (heating &
cooling)
85% (heating)
COP = 2.5 (cool)
0.1387
MMBtu/Gal $3.55 per Gal 3.22%
Solar Thermal
Residential $31,600 N/A 5,400% (accounts for
pump electricity)
0.0034
MMBtu/kWh
$0.155 per
kWh 3%
Commercial $202,200 N/A 6,800% (accounts for
pump electricity)
0.0034
MMBtu/kWh
$0.145 per
kWh 3%
GSHP
Residential $27,724 Included in heating
cost COP = 4
0.0034
MMBtu/kWh
$0.155 per
kWh 3%
Commercial $213,758 Included in heating
cost COP = 4
0.0034
MMBtu/kWh
$0.145 per
kWh 3%
41 Unless noted otherwise, all assumptions in table based on data provided by MCG from the “Heating and Cooling in the Massachusetts Alternative Portfolio Standard”,
Massachusetts Department of Energy Resources, with assistance from Massachusetts Clean energy Center and Meister Consultants Group, December 2012, Available at:
www.mass.gov/eea/docs/doer/pub-info/heating-and-cooling-in-aps.pdf
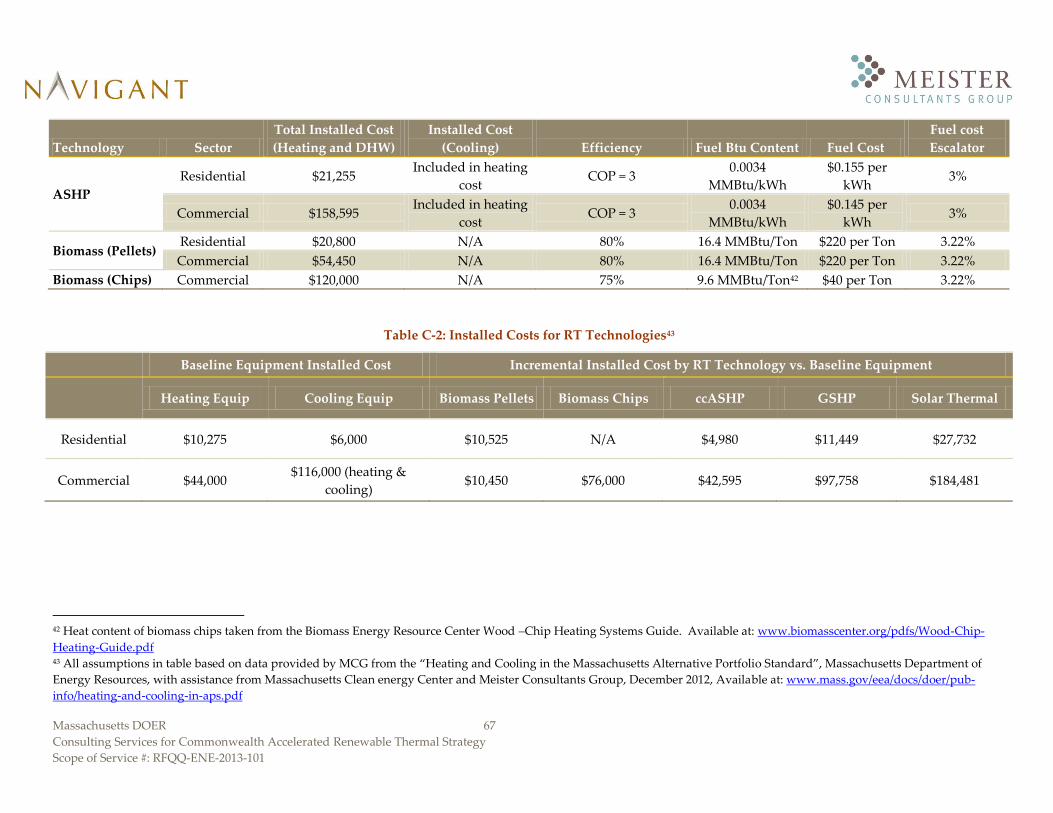
Massachusetts DOER 67
Consulting Services for Commonwealth Accelerated Renewable Thermal Strategy
Scope of Service #: RFQQ-ENE-2013-101
Technology Sector
Total Installed Cost
(Heating and DHW)
Installed Cost
(Cooling) Efficiency Fuel Btu Content Fuel Cost
Fuel cost
Escalator
ASHP
Residential $21,255 Included in heating
cost COP = 3
0.0034
MMBtu/kWh
$0.155 per
kWh 3%
Commercial $158,595 Included in heating
cost COP = 3
0.0034
MMBtu/kWh
$0.145 per
kWh 3%
Biomass (Pellets) Residential $20,800 N/A 80% 16.4 MMBtu/Ton $220 per Ton 3.22%
Commercial $54,450 N/A 80% 16.4 MMBtu/Ton $220 per Ton 3.22%
Biomass (Chips) Commercial $120,000 N/A 75% 9.6 MMBtu/Ton42 $40 per Ton 3.22%
Table C-2: Installed Costs for RT Technologies43
Baseline Equipment Installed Cost Incremental Installed Cost by RT Technology vs. Baseline Equipment
Heating Equip Cooling Equip Biomass Pellets Biomass Chips ccASHP GSHP Solar Thermal
Residential $10,275 $6,000 $10,525 N/A $4,980 $11,449 $27,732
Commercial $44,000 $116,000 (heating &
cooling) $10,450 $76,000 $42,595 $97,758 $184,481
42 Heat content of biomass chips taken from the Biomass Energy Resource Center Wood –Chip Heating Systems Guide. Available at: www.biomasscenter.org/pdfs/Wood-Chip-
Heating-Guide.pdf 43 All assumptions in table based on data provided by MCG from the “Heating and Cooling in the Massachusetts Alternative Portfolio Standard”, Massachusetts Department of
Energy Resources, with assistance from Massachusetts Clean energy Center and Meister Consultants Group, December 2012, Available at: www.mass.gov/eea/docs/doer/pub-
info/heating-and-cooling-in-aps.pdf
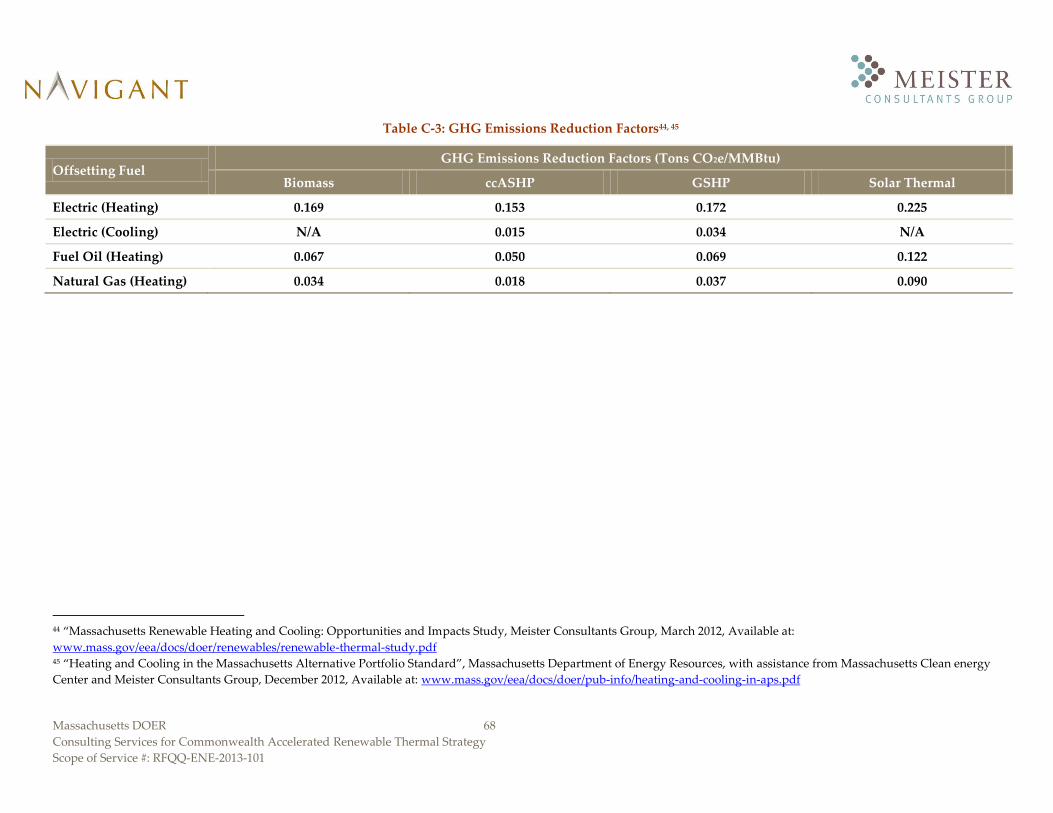
Massachusetts DOER 68
Consulting Services for Commonwealth Accelerated Renewable Thermal Strategy
Scope of Service #: RFQQ-ENE-2013-101
Table C-3: GHG Emissions Reduction Factors44, 45
Offsetting Fuel GHG Emissions Reduction Factors (Tons CO2e/MMBtu)
Biomass ccASHP GSHP Solar Thermal
Electric (Heating) 0.169 0.153 0.172 0.225
Electric (Cooling) N/A 0.015 0.034 N/A
Fuel Oil (Heating) 0.067 0.050 0.069 0.122
Natural Gas (Heating) 0.034 0.018 0.037 0.090
44 “Massachusetts Renewable Heating and Cooling: Opportunities and Impacts Study, Meister Consultants Group, March 2012, Available at:
www.mass.gov/eea/docs/doer/renewables/renewable-thermal-study.pdf 45 “Heating and Cooling in the Massachusetts Alternative Portfolio Standard”, Massachusetts Department of Energy Resources, with assistance from Massachusetts Clean energy
Center and Meister Consultants Group, December 2012, Available at: www.mass.gov/eea/docs/doer/pub-info/heating-and-cooling-in-aps.pdf

Massachusetts DOER 69
Consulting Services for Commonwealth Accelerated Renewable Thermal Strategy
Scope of Service #: RFQQ-ENE-2013-101
Appendix D Existing RT Support Programs and Activities
Table D-1, Table D-2, and Table D-3 list the existing incentive programs and grant activities that are
relevant for Massachusetts’s homes and businesses. Additionally the DOER and MassCEC are running
pilot programs for biomass, heat pump and district heating installations in residential and commercial
buildings. While significant in volume, they are not listed here as they are limited in time.
Table D-1: Existing Federal Financing Programs and Incentives
Program/Incentive RT Technologies Notes
REAP Loan Guarantees Solar, Biomass,
GSHP (Non-residential)
DOE Loan Guarantees Solar, Biomass,
GSHP
Qualified Energy Conservation Bonds (QECB) Solar, Biomass,
GSHP, Biogas
Energy Efficient Residential Mortgages (FHA) Solar
Residential Renewable Energy Tax Credit Solar, GSHP 30% (Residential)
Business Energy Investment Tax Credit (ITC) Solar, GSHP 10% GSHP, 30% ST
(Non-residential)
Table D-2: Existing Massachusetts Residential Programs and Other Activities
Program/Incentive RT Technologies Notes
Renewable Energy Equipment Sales Tax Exemption Solar, GSHP 100% Exemption
Personal Tax Credit Solar 15% or $1,000 Max
Commonwealth Solar Hot Water Rebate Solar 25% or $3,500 Max
Renewable Energy Property Tax Exemption Solar 100% for 20 years
Mass Save HEAT loan Solar, ASHP, GSHP 0% interest loan
Mass Save rebate ASHP Up to $500
Table D-3: Existing Massachusetts Non-Residential Programs and Other Activities
Program/Incentive RT Technologies Notes
Excise Tax Deduction Solar 100% Deduction
Commonwealth Organics-to-Energy Program Biomass
Renewable Energy Property Tax Exemption Solar 100% for 20 years
Commonwealth Solar Hot Water Commercial Program Solar

Massachusetts DOER 70
Consulting Services for Commonwealth Accelerated Renewable Thermal Strategy
Scope of Service #: RFQQ-ENE-2013-101
Appendix E Modeling Scenario Details
Table E-1: BAU Scenario Details
Program Title Residential Commercial
Sta
te
Renewable Energy Income Tax Credit
(15% or $1,000 Max) ST
Commonwealth Solar Hot Water Rebate Program
(25% or $3,500 Max) ST
Mass Save Rebate ($500) ccASHP
Commonwealth Solar Hot Water Rebate Program
(25% or $50,000 Max) ST ST
Fed
eral
Residential Renewable Energy Tax Credit (30%) GSHP, ST
Business Energy Investment Tax Credit (ITC) (10% GSHP, 30% ST) GSHP, ST
Table E-2: High State Support Scenario Details
Program Title Residential Commercial
Sta
te
All BAU Incentives
Additional RT Rebate (25% of installed cost) for top priority
customer classes All All
RT Market Development Activities (targeted at reducing RT market
saturation time from 20 years to 10 years) All All
Fed
eral
All BAU Incentives (assuming federal incentives are extended
through 2030)
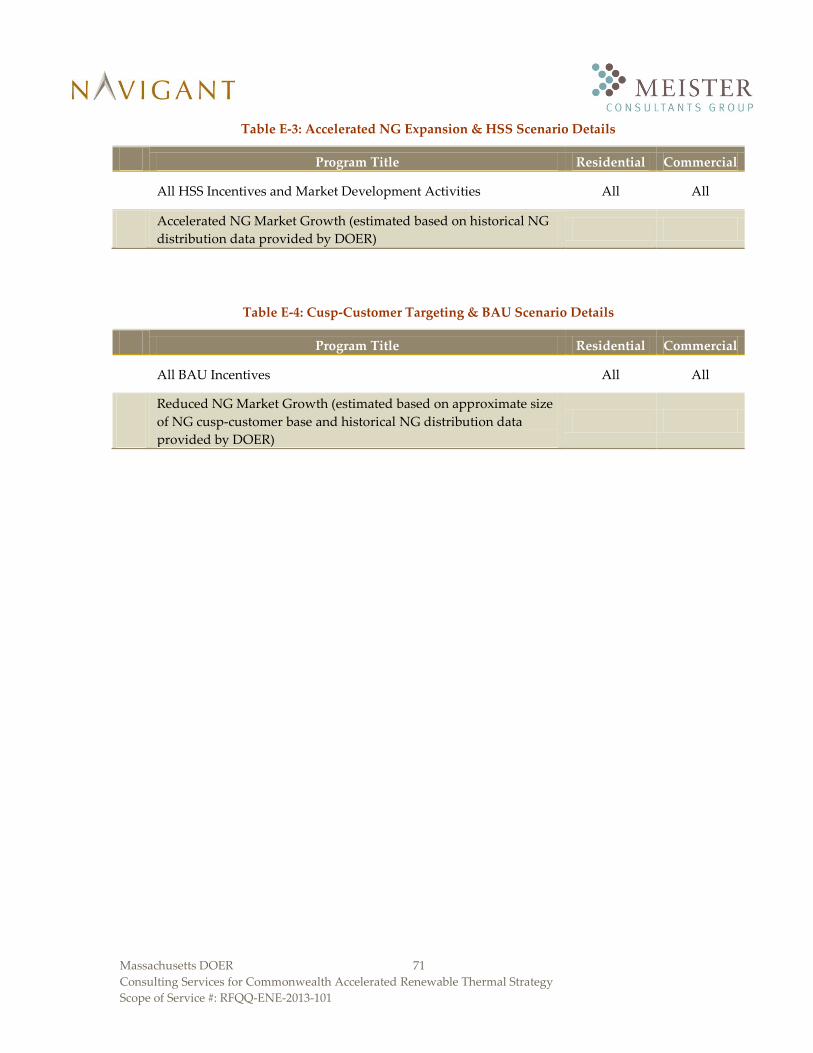
Massachusetts DOER 71
Consulting Services for Commonwealth Accelerated Renewable Thermal Strategy
Scope of Service #: RFQQ-ENE-2013-101
Table E-3: Accelerated NG Expansion & HSS Scenario Details
Program Title Residential Commercial
All HSS Incentives and Market Development Activities All All
Accelerated NG Market Growth (estimated based on historical NG
distribution data provided by DOER)
Table E-4: Cusp-Customer Targeting & BAU Scenario Details
Program Title Residential Commercial
All BAU Incentives All All
Reduced NG Market Growth (estimated based on approximate size
of NG cusp-customer base and historical NG distribution data
provided by DOER)

Massachusetts DOER 72
Consulting Services for Commonwealth Accelerated Renewable Thermal Strategy
Scope of Service #: RFQQ-ENE-2013-101
Appendix F CARTS Stakeholder Contributors
Table F-1: Stakeholder Advisory Group Members
Name Organization
Carrie Hitt Solar Energy Industries Association (SEIA)
Charlie Niebling Biomass Thermal Energy Council
Chris Beebe BEAM Engineering
Chris Williams Heat Spring
Darien Crimmin Winn Development
David Lis NEEP
David O’Conner ML Strategies / Renewable Thermal Coalition
Joe Cefaly Mitsubishi
John Wells ABCD and Low-Income Energy Affordability Network (LEAN)
Katherine Stainken Solar Energy Industries Association (SEIA)
Kathleen Arthur NStar
Lisa Barrett Conservation Services Group
Mike Hogan Paradigm Partners
Sue Reid Conservation Law Foundation

Massachusetts DOER 73
Consulting Services for Commonwealth Accelerated Renewable Thermal Strategy
Scope of Service #: RFQQ-ENE-2013-101
Appendix G Renewable Thermal Impact Analysis Methodology
In the final task of the customer class analysis, the team conducted economic and environmental impact
analyses to determine how growth of the renewable thermal market would impact consumers, utilities,
the environment, state government revenues, and the state’s economy. The methodology for each of
these analyses is described in greater detail in sections G.1 through G.3 below.
G.1 GHG Emissions Impact
In 2010, Massachusetts identified GHG emissions reductions goals in the Massachusetts Clean Energy and
Climate Plan for 2020. The primary goal is to reduce the GHG emissions in the commonwealth by 25%
percent below the 1990 emissions level by 2020. Within this goal, Massachusetts has set two sub targets
related to renewable thermal technologies. These include: (1) Renewable thermal technologies should
account for a 2% reduction in GHG emissions below the 1990 emissions level, and (2) Solar thermal
systems should contribute a 0.1% reduction in GHG emissions below the 1990 level.46 The team modeled
the impact of renewable thermal market growth on reducing GHG emissions in the commonwealth,
under all four scenarios and compared the results to these targets.
Figure G-1 below outlines the process used to calculate GHG emissions reductions estimates for each
customer class. These estimates were based on annual energy consumption, offsetting fuel type, and
GHG emissions reduction factors for each technology (in terms of tons of CO2e/MMBtu). The GHG
emissions reduction factors represent the difference between the expected GHG emissions of the
renewable system and the GHG emissions of the fossil fuel system being replaced. GHG emissions
factors were adopted from Meister Consultants Group’s (MCG) previous work on the subject.47 For the
heat pumps and solar thermal systems, these factors were strictly based on GHG emitted, however for
biomass systems, GHG emissions factors also had to take into account the carbon sequestered by
sustainably managed forests, as described by MCG:
“GHG reductions from biomass pellet heating systems are calculated by estimating GHG
emissions avoided from fossil fuel systems. Emission reduction estimates for biomass
heating are based on the Manomet study and ongoing regulatory development by DOER,
which take into account the carbon debt and dividends of various biomass feedstock”47
The team used market penetration estimates for each customer class and scenario to determine the
achievable market size for renewable technologies, by year. Then the team estimated the total thermal
energy consumption of each customer class. Finally, approximate GHG emissions reductions were
46 “Massachusetts Clean Energy and Climate Plan for 2020”, December 2010, Available at:
www.mass.gov/eea/docs/eea/energy/2020-clean-energy-plan.pdf 47 “Massachusetts Renewable Heating and Cooling: Opportunities and Impacts Study, Meister Consultants Group,
March 2012, Available at: www.mass.gov/eea/docs/doer/renewables/renewable-thermal-study.pdf - the Manomet
study referred to in the quote is the “2010 Manomet Study of Woody Biomass Energy”, Manomet Center for
Conservation Sciences, 2010

Massachusetts DOER 74
Consulting Services for Commonwealth Accelerated Renewable Thermal Strategy
Scope of Service #: RFQQ-ENE-2013-101
calculated for each customer class (in terms of tons of CO2e) by multiplying the thermal consumption of
each class by the appropriate GHG emissions reduction factors introduced above.
Calculate GHG Emissions Reductions (Tons CO2e)
Avg Thermal Energy Consumption of Class (MMBtu Output)
Input: Achievable Market Size from Fisher-Pry Analysis (# of Bldgs.)
1
2
4
GHG Emissions Reductions Factors(Tons CO2e/MMBtu Output)
3
Figure G-1: GHG Emissions Reduction Analysis Process
The team compared the GHG emissions reduction projections to the GHG emissions goals set by the
state by examining the GHG emissions reduction estimates as a percentage of the 1990 GHG emissions
levels in the state and comparing these estimates to the 2020 targets. This data was used to aid the team
in selecting priority customer classes and developing appropriate strategies to help Massachusetts reach
these goals. Section 3.2.3 documents the results of this analysis.
G.2 Fossil Fuel Demand Impact
The team estimated the impact of renewable thermal technologies on the demand for fossil fuels for
heating and cooling purposes using the methodology shown in Figure G-2. The results of the market
penetration analysis were used to determine the achievable market size for each customer class, by year.
Then the team estimated both the current and future fossil fuel consumption (in terms of MMBtu of
primary thermal energy) for each customer class. The team was able to determine the relative % change
in demand for fossil fuels for heating and cooling as a result of growth of the renewable thermal market
by comparing the projected consumption of fossil fuel in years 2015, 2020, and 2030, to the estimated
consumption today.
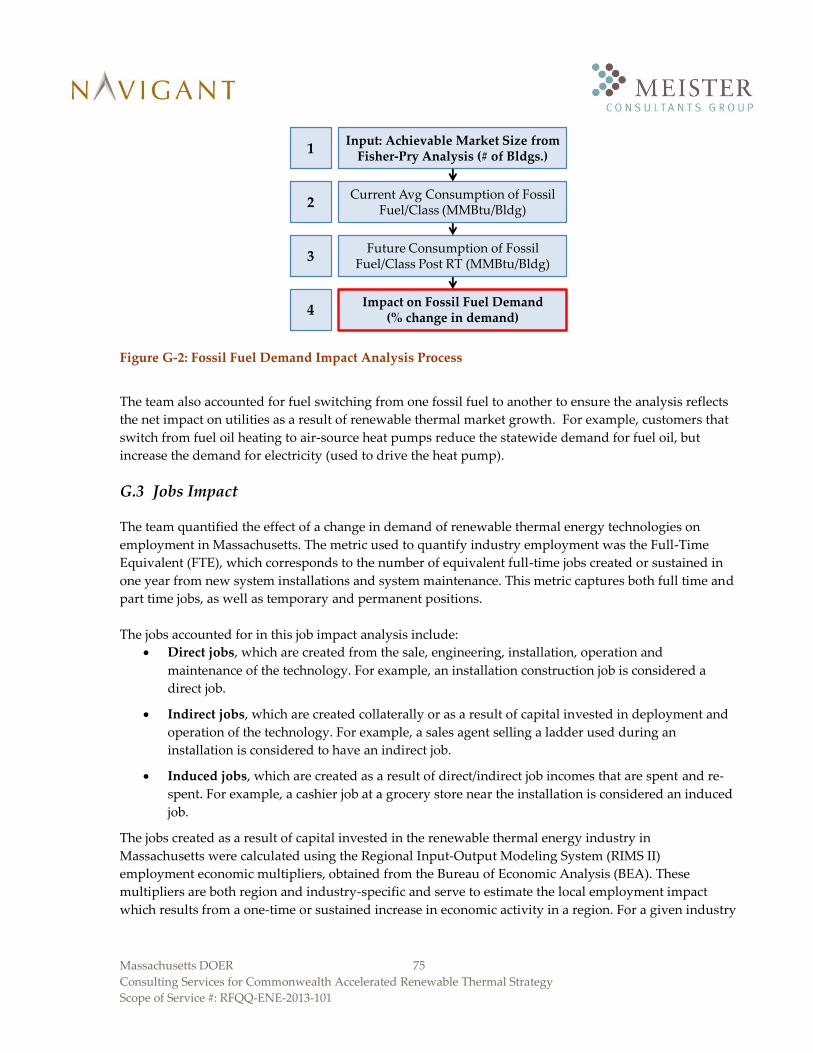
Massachusetts DOER 75
Consulting Services for Commonwealth Accelerated Renewable Thermal Strategy
Scope of Service #: RFQQ-ENE-2013-101
Impact on Fossil Fuel Demand(% change in demand)
Current Avg Consumption of Fossil Fuel/Class (MMBtu/Bldg)
Input: Achievable Market Size from Fisher-Pry Analysis (# of Bldgs.)
1
2
4
Future Consumption of Fossil Fuel/Class Post RT (MMBtu/Bldg)
3
Figure G-2: Fossil Fuel Demand Impact Analysis Process
The team also accounted for fuel switching from one fossil fuel to another to ensure the analysis reflects
the net impact on utilities as a result of renewable thermal market growth. For example, customers that
switch from fuel oil heating to air-source heat pumps reduce the statewide demand for fuel oil, but
increase the demand for electricity (used to drive the heat pump).
G.3 Jobs Impact
The team quantified the effect of a change in demand of renewable thermal energy technologies on
employment in Massachusetts. The metric used to quantify industry employment was the Full-Time
Equivalent (FTE), which corresponds to the number of equivalent full-time jobs created or sustained in
one year from new system installations and system maintenance. This metric captures both full time and
part time jobs, as well as temporary and permanent positions.
The jobs accounted for in this job impact analysis include:
Direct jobs, which are created from the sale, engineering, installation, operation and
maintenance of the technology. For example, an installation construction job is considered a
direct job.
Indirect jobs, which are created collaterally or as a result of capital invested in deployment and
operation of the technology. For example, a sales agent selling a ladder used during an
installation is considered to have an indirect job.
Induced jobs, which are created as a result of direct/indirect job incomes that are spent and re-
spent. For example, a cashier job at a grocery store near the installation is considered an induced
job.
The jobs created as a result of capital invested in the renewable thermal energy industry in
Massachusetts were calculated using the Regional Input-Output Modeling System (RIMS II)
employment economic multipliers, obtained from the Bureau of Economic Analysis (BEA). These
multipliers are both region and industry-specific and serve to estimate the local employment impact
which results from a one-time or sustained increase in economic activity in a region. For a given industry

Massachusetts DOER 76
Consulting Services for Commonwealth Accelerated Renewable Thermal Strategy
Scope of Service #: RFQQ-ENE-2013-101
and state, RIMS II gives three employment economic multipliers: one for direct jobs48, one for indirect
jobs and one for induced jobs created or sustained. The job numbers for different job ‘types’ were
summed to get a total number of jobs created or sustained.
The calculation methodology used to estimate the total number of jobs created or sustained in a given
year by customer class followed the following 4 steps:
1. Market Projections and Costs – Navigant first projected a technology’s annual installations, under
different scenarios. Navigant also determined typical installation, O&M, and fuel costs.
2. Calculate Direct Jobs Created or Sustained– Navigant then calculated direct employment impacts
using the methodology in Figure G-3.
Figure G-3: Direct Jobs Calculations
3. Calculate Indirect & Induced Jobs Created or Sustained – Navigant calculated both indirect and
induced employment impacts using a different set of RIMS II economic multipliers which are based
on direct jobs. The methodology in Figure G-4 was used for calculating indirect or induced jobs.
Figure G-4: Indirect and Induced Jobs Calculations
48 A job refers to an FTE

Massachusetts DOER 77
Consulting Services for Commonwealth Accelerated Renewable Thermal Strategy
Scope of Service #: RFQQ-ENE-2013-101
4. Calculate the Total Jobs Created or Sustained– Finally, Navigant calculated the total number of jobs
created from the deployment of a given renewable thermal energy technology by summing up the
direct, indirect and induced jobs previously calculated.
The number of local jobs created was calculated along a technology’s value chain, including
manufacturing, installation, operations and maintenance. As such, jobs can be divided in four main job-
sources, as Table G-1 shows, each of which has its own assumptions for each technology.
Table G-1: Job Source by Location in the Value Chain
Value Chain Description
Manufacturing
Market research shows that the only renewable thermal technology of
interest with a non-negligible manufacturing base in MA is solar thermal.
Approximately one third of MA solar hot water systems have components
that were manufactured in Massachusetts49 All other renewable thermal
technologies were assumed to have insignificant in-state manufacturing.
Thus, manufacturing jobs created in MA were only calculated for solar.
Installation
(including sales,
engineering, and design)
For each technology, it was assumed that the jobs created or sustained from
a technology’s installation would be created in Massachusetts. An
underlying assumption is that each technology’s Massachusetts’ installer
base would expand to meet market demand in-state.
Fuel Production
This is primarily relevant for, and was only calculated for, biomass pellets
and chips. Although wood pellet/chip production is an important industry
in the Northeast (driven by operations in NH, NY, and PA, as illustrated in
Figure G-5) currently MA does not have wood pellet/chip production
operations. Thus, the biomass production jobs (from logging, transportation,
etc.) were calculated for the Northeast.
Operations &
Maintenance
For each technology, it was assumed that the jobs created or sustained from
a technology’s O&M requirements would be created in Massachusetts.
49 “Massachusetts Renewable Heating and Cooling: Opportunities and Impacts Study, Meister Consultants Group,
March 2012, Available at: www.mass.gov/eea/docs/doer/renewables/renewable-thermal-study.pdf

Massachusetts DOER 78
Consulting Services for Commonwealth Accelerated Renewable Thermal Strategy
Scope of Service #: RFQQ-ENE-2013-101
Figure G-5: Biomass Pellet Production Capabilities in the Northeast50
Using the methodology described above, jobs created and sustained from the deployment of thermal
energy technologies were calculated by customer class for three different years: 2015, 2020 and 2030.
Under alternative scenarios, the job numbers from different segments of a technology’s value chain were
aggregated so as to report a single job number per customer class. The job number given on a per year
basis represents the total number of jobs created or sustained in that year as a result of the deployment of
a technology in given customer class. It includes both temporary positions, resulting from the
installation of renewable thermal technologies, and permanent positions, resulting from the O&M or fuel
requirements once a technology is installed.
50 Data extracted from “Massachusetts Renewable Heating and Cooling: Opportunities and Impacts Study, Meister
Consultants Group, March 2012, Available at: www.mass.gov/eea/docs/doer/renewables/renewable-thermal-
study.pdf

Massachusetts DOER 79
Consulting Services for Commonwealth Accelerated Renewable Thermal Strategy
Scope of Service #: RFQQ-ENE-2013-101
G.4 Tax Revenue Impact
The team explored the effect of growing the renewable thermal market on state tax revenues, including
both positive and negative impacts on state tax revenues via three primary tax mechanisms:
1. Sales Tax – Massachusetts currently offers a 100% sales tax exemption for the purchase of
residential solar thermal or GSHP equipment, representing lost tax revenues for the state.51
However, the state will also gain sales tax revenue through the purchase of other renewable
thermal equipment, for which the exemption does not exist. Figure G-6 illustrates the
methodology that the team used to model the impact of renewable thermal market growth on
sales tax revenue. The team first determined the total taxable revenue for each customer class by
multiplying the achievable market size times the average equipment cost for each class. Then
this revenue was multiplied by the Massachusetts state sales tax rate (6.25%), except for those
classes which have the sales tax exemption, in which case we used a negative sales tax rate, to
determine the net impact on sales tax revenue for the state.52
Figure G-6: Impact on State Sales Tax Revenue Methodology
2. Additional Income Tax Revenues (due to new jobs) – Growth of the renewable thermal market
is expected to spur job creation in Massachusetts (see section G.3 below). As a result, the team
anticipates the state will gain income tax revenue from the additional in-state jobs that are
created. Figure G-7 shows the methodology that was used to calculate the additional income tax
revenue that the state would receive from increased job growth. The team started with the
estimates for the total number of jobs created for each customer class (see section G.3 below).
The total number of jobs was then multiplied by the average salary for each new job and the
personal income tax rate for Massachusetts (5.25%) to determine the total tax revenue
attributable to each customer class.53 The team assumed an average salary of $48,380 which
represents the average salary for a construction worker in Massachusetts.54
51 Data available at: www.dsireusa.org/incentives/incentive.cfm?Incentive_Code=MA05F&re=1&ee=1 52 Data available at: www.mass.gov/dor/all-taxes/sales-and-use/ 53 Data Available at: www.taxadmin.org/fta/rate/ind_inc.pdf 54 Data available at: www.bls.gov/oes/current/oes472061.htm

Massachusetts DOER 80
Consulting Services for Commonwealth Accelerated Renewable Thermal Strategy
Scope of Service #: RFQQ-ENE-2013-101
Total Jobs Created
$48,380 (AvgSalary per Job)
Additional Income Tax
Revenue
5.25% (MA Personal Income
Tax Rate)
Figure G-7: Impact on State Income Tax Revenue Methodology
3. Personal Income Tax Credits – The commonwealth provides personal tax credits to residential
customers who install solar thermal systems on their primary residence. The tax credit is worth
15% of the net expenditure for the installation of the solar thermal system, up to $1,000.55 The
team incorporated this tax credit in the analysis, as shown in Figure G-8. For the analysis the
team assumed that all solar thermal customers would receive the maximum $1,000 dollar credit.
For those customer classes which are eligible for the tax credit (residential solar thermal), $1,000
was subtracted from the additional income tax revenues gained by additional job creation to
account for lost revenues due to this tax credit.
Net Change in Income Tax Revenue ($)
$1,000 (SWH Personal Income
Tax Credit)
Additional Income Tax Revenue (New Jobs)
Figure G-8: Personal Income Tax Credit Impact Methodology
The team analyzed each of the above tax mechanisms for all 54 customer classes. Finally, the impacts
from all three of the analyses above were aggregated to determine the net change in state tax revenues
that is attributable to the growth of the renewable thermal market in Massachusetts.
55 Data available at: www.dsireusa.org/incentives/incentive.cfm?Incentive_Code=MA06F&re=1&ee=1

Massachusetts DOER 81
Consulting Services for Commonwealth Accelerated Renewable Thermal Strategy
Scope of Service #: RFQQ-ENE-2013-101
Appendix H Slides from Second Stakeholder Meeting

Massachusetts DOER 82
Consulting Services for Commonwealth Accelerated Renewable Thermal Strategy
Scope of Service #: RFQQ-ENE-2013-101

Massachusetts DOER 83
Consulting Services for Commonwealth Accelerated Renewable Thermal Strategy
Scope of Service #: RFQQ-ENE-2013-101

Massachusetts DOER 84
Consulting Services for Commonwealth Accelerated Renewable Thermal Strategy
Scope of Service #: RFQQ-ENE-2013-101

Massachusetts DOER 85
Consulting Services for Commonwealth Accelerated Renewable Thermal Strategy
Scope of Service #: RFQQ-ENE-2013-101

Massachusetts DOER 86
Consulting Services for Commonwealth Accelerated Renewable Thermal Strategy
Scope of Service #: RFQQ-ENE-2013-101

Massachusetts DOER 87
Consulting Services for Commonwealth Accelerated Renewable Thermal Strategy
Scope of Service #: RFQQ-ENE-2013-101

Massachusetts DOER 88
Consulting Services for Commonwealth Accelerated Renewable Thermal Strategy
Scope of Service #: RFQQ-ENE-2013-101

Massachusetts DOER 89
Consulting Services for Commonwealth Accelerated Renewable Thermal Strategy
Scope of Service #: RFQQ-ENE-2013-101

Massachusetts DOER 90
Consulting Services for Commonwealth Accelerated Renewable Thermal Strategy
Scope of Service #: RFQQ-ENE-2013-101
Appendix I Complete List of Strategies
Table I-1: Top Priority Strategies, including Keystone, Cornerstone, and Building Blocks
Cluster Area Strategy # Strategy
Governance 1 Develop statewide renewable thermal goals for each technology
Governance 2 Leverage, coordinate, and expand efforts across state agencies to meet short-
term goals
Marketing 3 Launch comprehensive RT technology information campaign with
MassSave
Governance 4 Support implementation of long-term, stable performance-based RT
incentives
Governance 5 Lead by example via “Leading by Example” and/or through other state
energy program pathways
Governance 6 Integrate RT into the Stretch Energy Code and other building energy codes
Finance 7 Provide low-cost financing for renewable thermal through the MassSave
HEAT loan program
Marketing 8 Develop "Thermalize" program, modeled after the successful Massachusetts
Solarize program
Marketing 9 Develop comprehensive, online database with case studies and technology
performance metrics
Marketing 10 Provide data to assist developers and installers identify “high value”
renewable thermal customers
Marketing 11 Create tool that helps customers self-screen for suitability of RT technologies
Innovation 12 Support technology exchanges with “state-of-the-art” manufacturers
Resource and
Logistics 13 Create Renewable Thermal Industry Advisory Forum
Governance 14 Review market enabling guidance regarding fuel choices and associated
GHG emissions
Labor and
Standards 15 Institute technical and sales training programs
Resource and
Logistics 16
Engage heating oil and propane industry to explore RT business
opportunities
Governance 17 Integrate renewable thermal into energy protection and assistance programs
for low-income families
Labor and
Standards 18
Integrate RT and EE into community college and vocational school curricula
in MA

Massachusetts DOER 91
Consulting Services for Commonwealth Accelerated Renewable Thermal Strategy
Scope of Service #: RFQQ-ENE-2013-101
Table I-2: Other Finance Strategies
Finance Strategies
Statewide RT financing portal
Increase incentives for combined heat and power units using renewable fuels
Explore potential for supporting 3rd party ownership market in Massachusetts
Green Bank
Enhance/Expand PACE Financing
Support installation of anaerobic digestion equipment
Support grants for biofuel blending equipment at terminals
Facilitate implementation of utility on-bill financing
Securitization of RT investments
Table I-3: Other Governance Strategies
Governance Strategies
Assess impact of local property tax policies on RT technologies
Assess potential for infrastructure development of large-scale biogas plants that inject biogas directly
into the gas grid
Conduct study of RT technology inspection and permitting requirements and develop streamlined
"model rule"
Reduce permitting fees and property taxes for green buildings and/or buildings that exceed state energy
code standards
Support efforts to harmonize U.S. and international safety, emission, and product standards for Biomass
Support efforts to harmonize U.S. and international safety, emission, and product standards for Solar
Thermal
Create coalition of stakeholders to advocate on behalf of RT during International Code Council updates
Address code requirements that inhibit adoption of high efficiency heat pumps in Massachusetts
Study potential to harmonize biomass thermal air emission requirements across New England
Table I-4: Other Innovation Strategies
Innovation Strategies
Evaluate code opportunities to require low-temp distribution in new construction and renovations
Improve installers process and project management
Develop competitive bulk purchasing (reverse) auctions - give installers access to equipment based on
participation and sharing of best practices.

Massachusetts DOER 92
Consulting Services for Commonwealth Accelerated Renewable Thermal Strategy
Scope of Service #: RFQQ-ENE-2013-101
Innovation Strategies
Crowd-sourcing
Regional bulk purchasing
Develop a grant program for graduate students
Crowd-funding
Reduce costs through larger scale operations via a regional installer licensing scheme
Commercial demonstration sites
Evaluate options to prevent voiding of warranties by using high blends of biofuels
Develop innovation challenges
Implement tax breaks for manufacturers to locate in-state
Table I-5: Other Labor and Standards Strategies
Labor and Standards Strategies
Provide external technical review of projects as requirement for incentive
Implement Design/Installation Standards, such as ISO-13256 (pump design standard)
Metering standards: develop comprehensive metering standards for all RT systems in Massachusetts
Create an installer/product certification scheme that provides quality assurance by vetting technologies
and installers.
Institute biofuel blend reporting requirements
Table I-6: Other Marketing Strategies
Marketing Strategies
Support marketing efforts emphasizing cooling benefits of heat pumps (in addition to heating benefits)
Outreach with trade groups marketing benefits of renewable technologies
Provide technical support for biomass heating education campaign
Implement Annual 'Best in Class' Awards
Support biofuel marketing/awareness efforts
Integrate RT in LEED certification for homes
Table I-7: Other Resource and Logistics Strategies
Resource and Logistics Strategies
Integrate RT technologies into existing district heating systems
Evaluate level of infrastructure needed to cover the state
Evaluate need for, and support creation of trade association
Massachusetts DOER 93
Consulting Services for Commonwealth Accelerated Renewable Thermal Strategy
Scope of Service #: RFQQ-ENE-2013-101
Resource and Logistics Strategies
Provide technical assistance and stakeholder engagement services to support local communities identify
suitable sites for AD
Expand grant opportunities to build biomass distribution infrastructure
Sustainable Biomass Certification
Support regional development of a standard certification for advanced biofuels
National R&D effort - out of scope