Embed Size (px)
Citation preview
2/10/2017
1
COMMONWEALTH BUDGET SEMINAR
2017-18Jay Himes, Executive Director, PASBO
Mark DiRocco, Executive Director, PASAJeff Ammerman, Director of Member Assistance, PASBO
Hannah Barrick, Director of Advocacy, PASBO
2
2/10/2017
2
3
4
2/10/2017
3
5
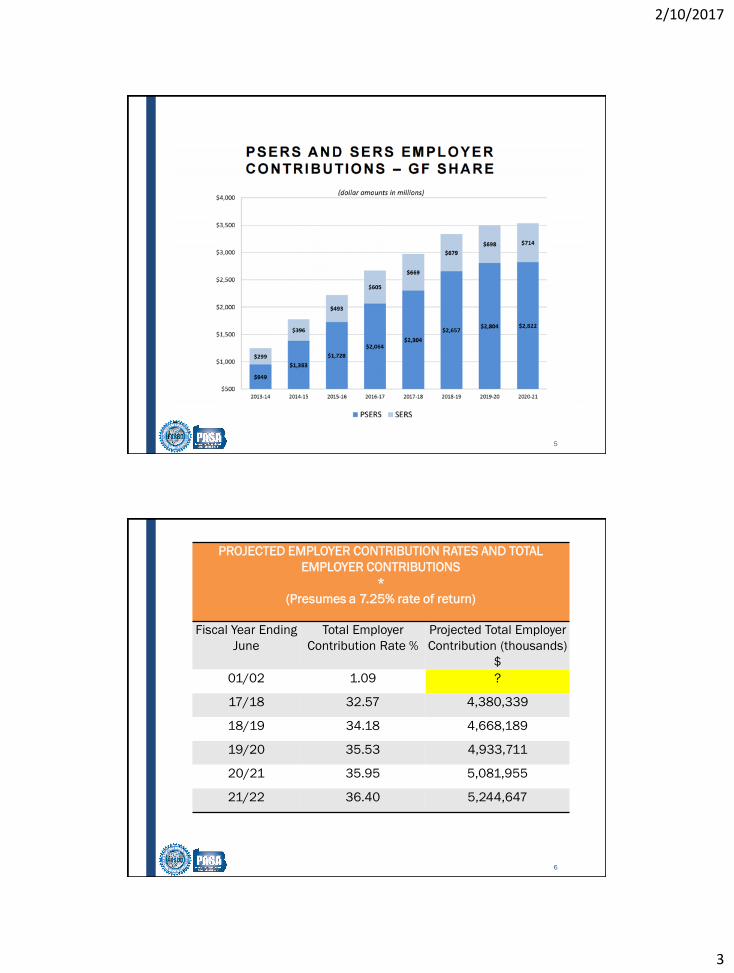
PROJECTED EMPLOYER CONTRIBUTION RATES AND TOTAL
EMPLOYER CONTRIBUTIONS
*
(Presumes a 7.25% rate of return)
Fiscal Year Ending
June
Total Employer
Contribution Rate %
Projected Total Employer
Contribution (thousands)
$
01/02 1.09 ?
17/18 32.57 4,380,339
18/19 34.18 4,668,189
19/20 35.53 4,933,711
20/21 35.95 5,081,955
21/22 36.40 5,244,647
6
2/10/2017
4
7
8
2/10/2017
5
9
10
2/10/2017
6
11
12
2/10/2017
7
13
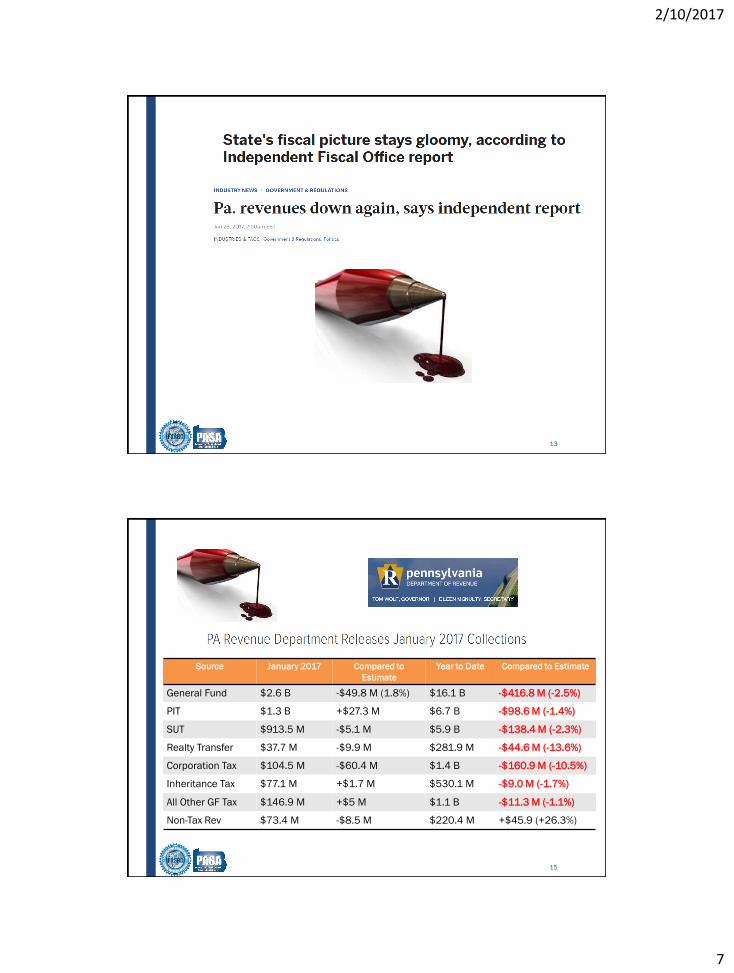
Source January 2017 Compared to
Estimate
Year to Date Compared to Estimate
General Fund $2.6 B -$49.8 M (1.8%) $16.1 B -$416.8 M (-2.5%)
PIT $1.3 B +$27.3 M $6.7 B -$98.6 M (-1.4%)
SUT $913.5 M -$5.1 M $5.9 B -$138.4 M (-2.3%)
Realty Transfer $37.7 M -$9.9 M $281.9 M -$44.6 M (-13.6%)
Corporation Tax $104.5 M -$60.4 M $1.4 B -$160.9 M (-10.5%)
Inheritance Tax $77.1 M +$1.7 M $530.1 M -$9.0 M (-1.7%)
All Other GF Tax $146.9 M +$5 M $1.1 B -$11.3 M (-1.1%)
Non-Tax Rev $73.4 M -$8.5 M $220.4 M +$45.9 (+26.3%)
15
2/10/2017
8
16
17
2/10/2017
9
18
19
2/10/2017
10
20
21
2/10/2017
11
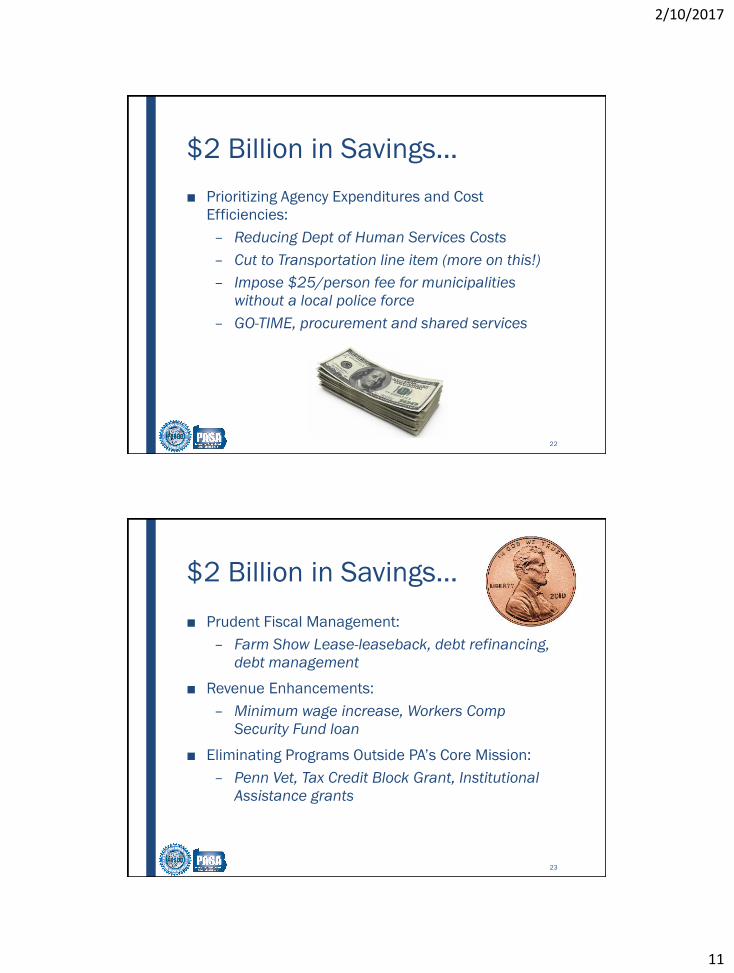
$2 Billion in Savings…
■ Prioritizing Agency Expenditures and Cost
Efficiencies:
– Reducing Dept of Human Services Costs
– Cut to Transportation line item (more on this!)
– Impose $25/person fee for municipalities
without a local police force
– GO-TIME, procurement and shared services
22
■ Prudent Fiscal Management:
– Farm Show Lease-leaseback, debt refinancing,
debt management
■ Revenue Enhancements:
– Minimum wage increase, Workers Comp
Security Fund loan
■ Eliminating Programs Outside PA’s Core Mission:
– Penn Vet, Tax Credit Block Grant, Institutional
Assistance grants
$2 Billion in Savings…
23
2/10/2017
12
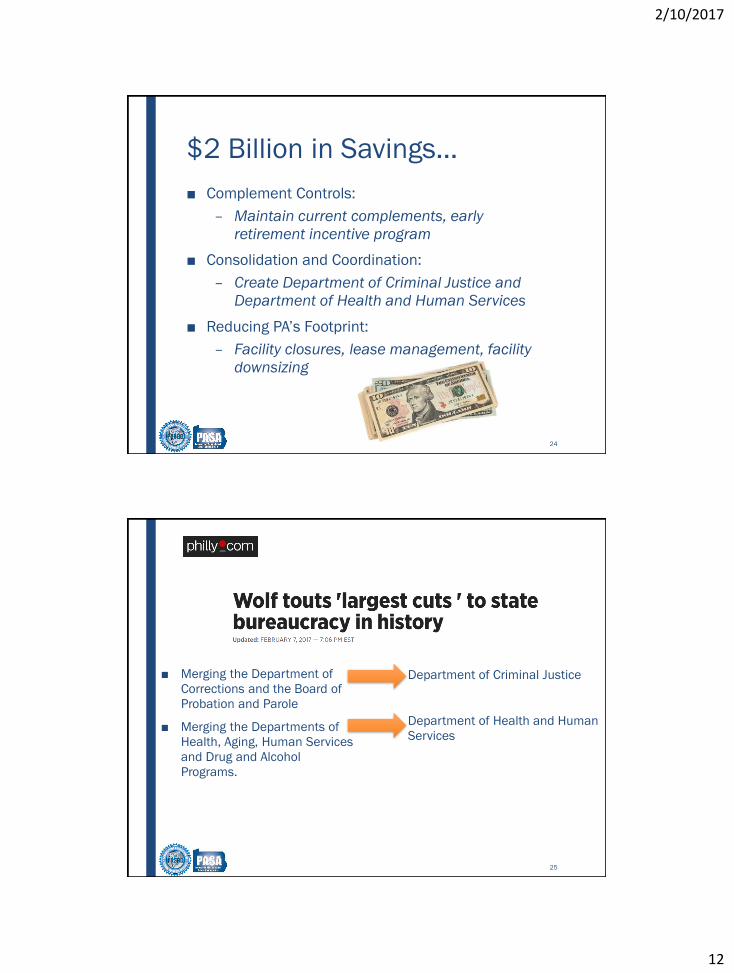
■ Complement Controls:
– Maintain current complements, early
retirement incentive program
■ Consolidation and Coordination:
– Create Department of Criminal Justice and
Department of Health and Human Services
■ Reducing PA’s Footprint:
– Facility closures, lease management, facility
downsizing
$2 Billion in Savings…
24
■ Merging the Department of
Corrections and the Board of
Probation and Parole
■ Merging the Departments of
Health, Aging, Human Services
and Drug and Alcohol
Programs.
Department of Criminal Justice
Department of Health and Human
Services
25
2/10/2017
13
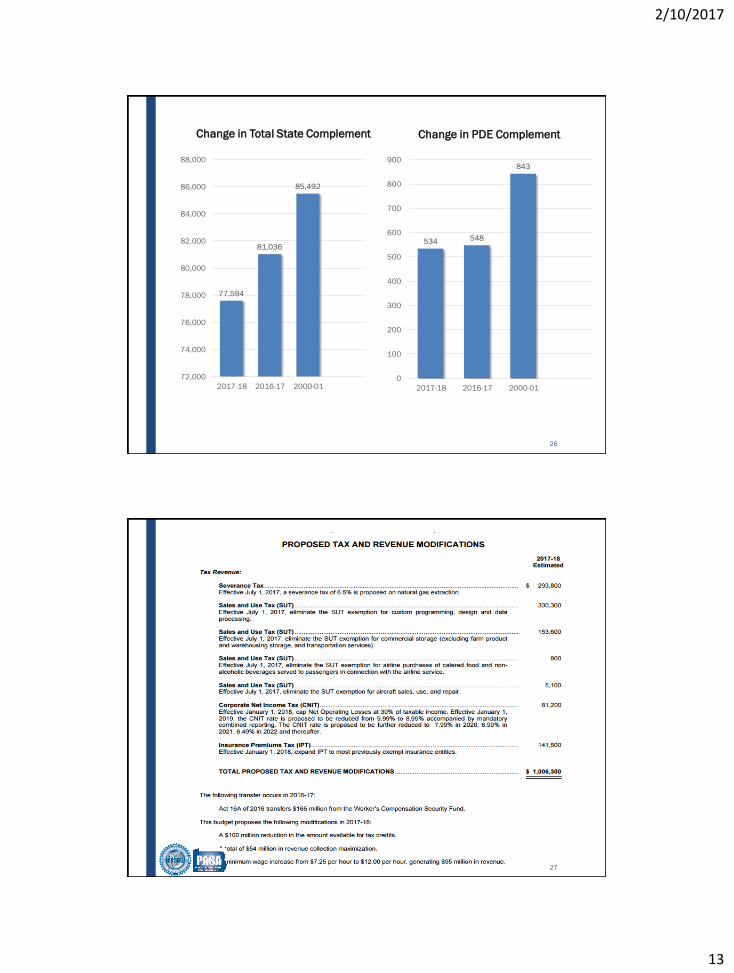
77,594
81,036
85,492
72,000
74,000
76,000
78,000
80,000
82,000
84,000
86,000
88,000
2017-18 2016-17 2000-01
534 548
843
0
100
200
300
400
500
600
700
800
900
2017-18 2016-17 2000-01
26
Change in Total State Complement Change in PDE Complement
27
2/10/2017
14
28
29
2/10/2017
15
30
31
2/10/2017
16
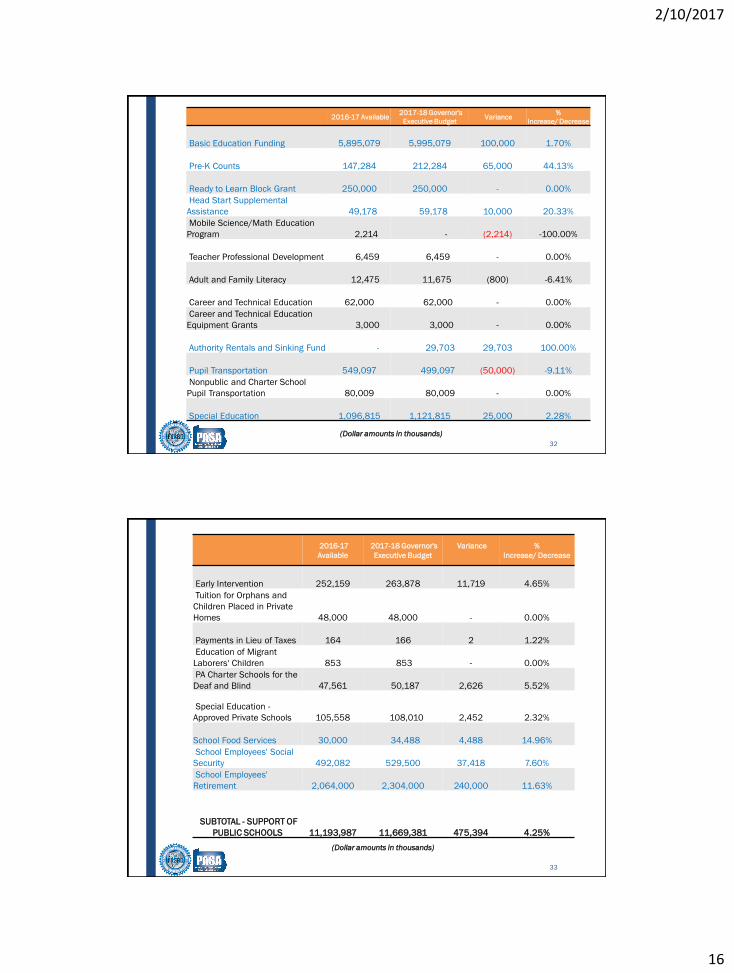
2016-17 Available 2017-18 Governor's
Executive Budget Variance
%
Increase/ Decrease
Basic Education Funding 5,895,079 5,995,079 100,000 1.70%
Pre-K Counts 147,284 212,284 65,000 44.13%
Ready to Learn Block Grant 250,000 250,000 - 0.00%
Head Start Supplemental
Assistance 49,178 59,178 10,000 20.33%
Mobile Science/Math Education
Program 2,214 - (2,214) -100.00%
Teacher Professional Development 6,459 6,459 - 0.00%
Adult and Family Literacy 12,475 11,675 (800) -6.41%
Career and Technical Education 62,000 62,000 - 0.00%
Career and Technical Education
Equipment Grants 3,000 3,000 - 0.00%
Authority Rentals and Sinking Fund - 29,703 29,703 100.00%
Pupil Transportation 549,097 499,097 (50,000) -9.11%
Nonpublic and Charter School
Pupil Transportation 80,009 80,009 - 0.00%
Special Education 1,096,815 1,121,815 25,000 2.28%
32
(Dollar amounts in thousands)
2016-17
Available
2017-18 Governor's
Executive Budget
Variance %
Increase/ Decrease
Early Intervention 252,159 263,878 11,719 4.65%
Tuition for Orphans and
Children Placed in Private
Homes 48,000 48,000 - 0.00%
Payments in Lieu of Taxes 164 166 2 1.22%
Education of Migrant
Laborers' Children 853 853 - 0.00%
PA Charter Schools for the
Deaf and Blind 47,561 50,187 2,626 5.52%
Special Education -
Approved Private Schools 105,558 108,010 2,452 2.32%
School Food Services 30,000 34,488 4,488 14.96%
School Employees' Social
Security 492,082 529,500 37,418 7.60%
School Employees'
Retirement 2,064,000 2,304,000 240,000 11.63%
SUBTOTAL - SUPPORT OF
PUBLIC SCHOOLS 11,193,987 11,669,381 475,394 4.25%
33
(Dollar amounts in thousands)
2/10/2017
17
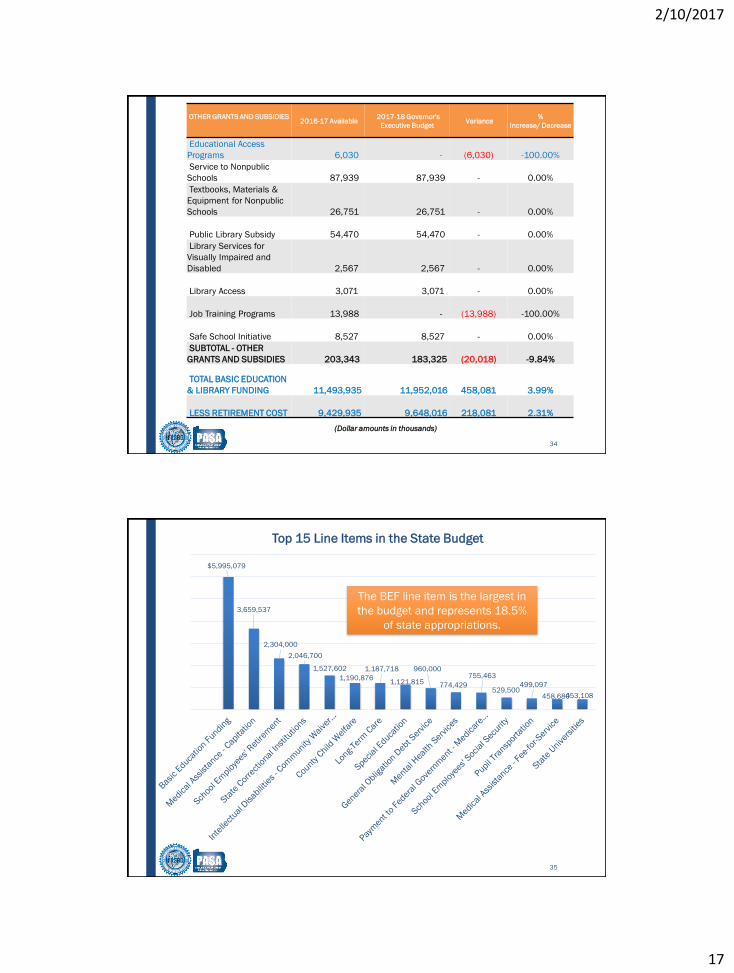
OTHER GRANTS AND SUBSIDIES 2016-17 Available
2017-18 Governor's
Executive Budget Variance
%
Increase/ Decrease
Educational Access
Programs 6,030 - (6,030) -100.00%
Service to Nonpublic
Schools 87,939 87,939 - 0.00%
Textbooks, Materials &
Equipment for Nonpublic
Schools 26,751 26,751 - 0.00%
Public Library Subsidy 54,470 54,470 - 0.00%
Library Services for
Visually Impaired and
Disabled 2,567 2,567 - 0.00%
Library Access 3,071 3,071 - 0.00%
Job Training Programs 13,988 - (13,988) -100.00%
Safe School Initiative 8,527 8,527 - 0.00%
SUBTOTAL - OTHER
GRANTS AND SUBSIDIES 203,343 183,325 (20,018) -9.84%
TOTAL BASIC EDUCATION
& LIBRARY FUNDING 11,493,935 11,952,016 458,081 3.99%
LESS RETIREMENT COST 9,429,935 9,648,016 218,081 2.31%
34
(Dollar amounts in thousands)
35
$5,995,079
3,659,537
2,304,000
2,046,700
1,527,602
1,190,876
1,187,718
1,121,815
960,000
774,429
755,463
529,500499,097
458,680453,108
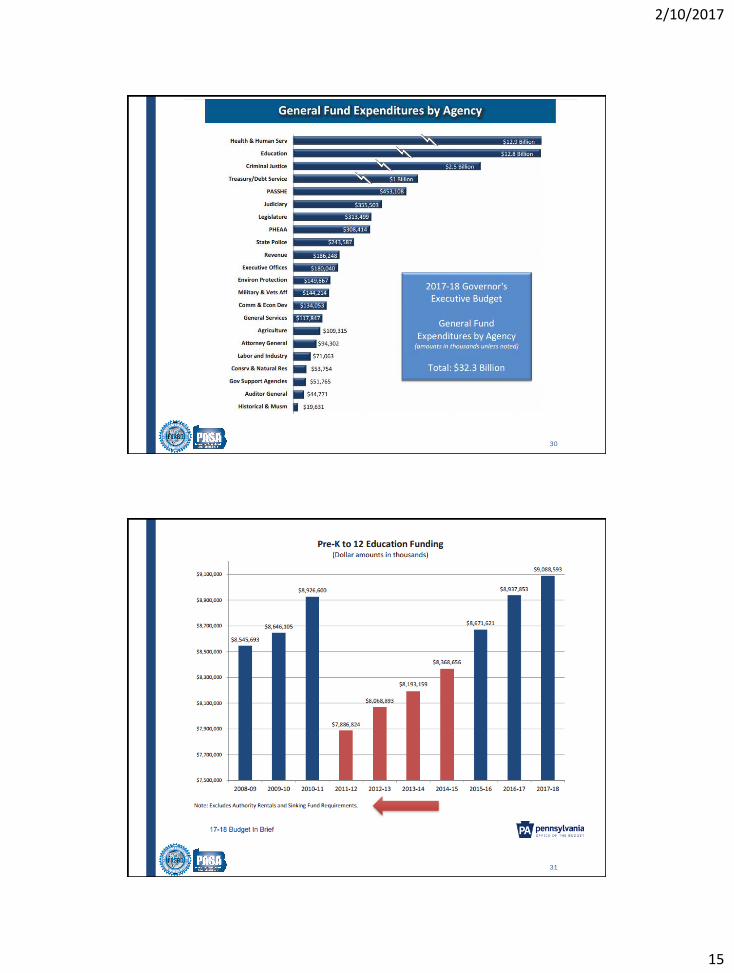
Top 15 Line Items in the State Budget
The BEF line item is the largest in
the budget and represents 18.5%
of state appropriations.
2/10/2017
18
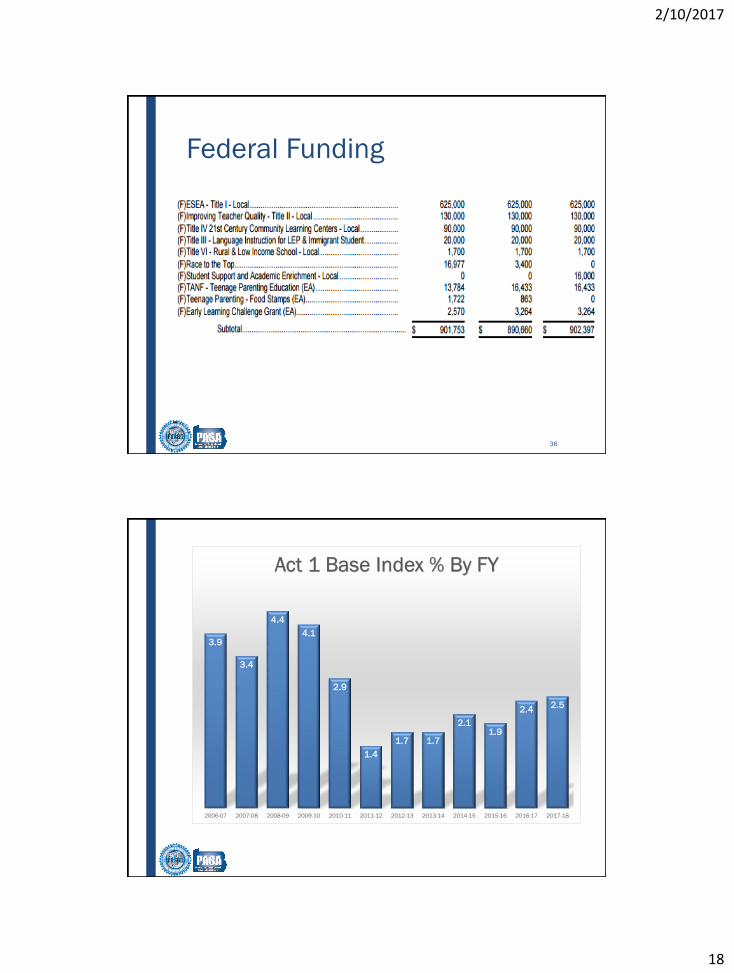
Federal Funding
36
3.9
3.4
4.4
4.1
2.9
1.4
1.7 1.7
2.11.9
2.42.5
2006-07 2007-08 2008-09 2009-10 2010-11 2011-12 2012-13 2013-14 2014-15 2015-16 2016-17 2017-18
Act 1 Base Index % By FY
37
2/10/2017
19
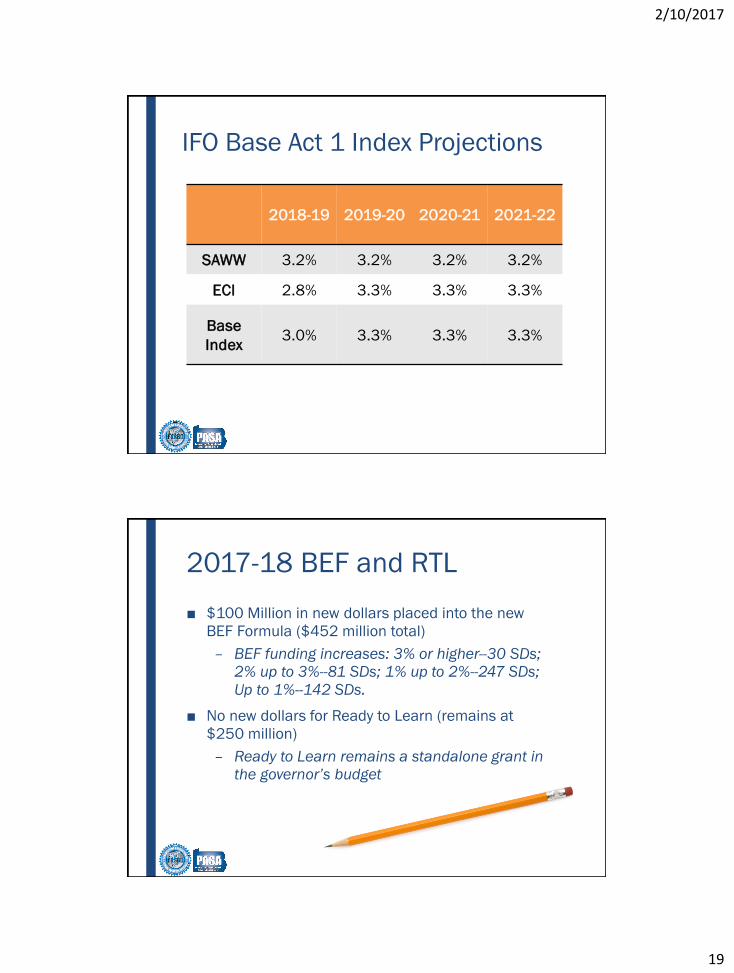
IFO Base Act 1 Index Projections
38
2018-19 2019-20 2020-21 2021-22
SAWW 3.2% 3.2% 3.2% 3.2%
ECI 2.8% 3.3% 3.3% 3.3%
Base
Index3.0% 3.3% 3.3% 3.3%
2017-18 BEF and RTL
■ $100 Million in new dollars placed into the new
BEF Formula ($452 million total)
– BEF funding increases: 3% or higher--30 SDs;
2% up to 3%--81 SDs; 1% up to 2%--247 SDs;
Up to 1%--142 SDs.
■ No new dollars for Ready to Learn (remains at
$250 million)
– Ready to Learn remains a standalone grant in
the governor’s budget
39
2/10/2017
20
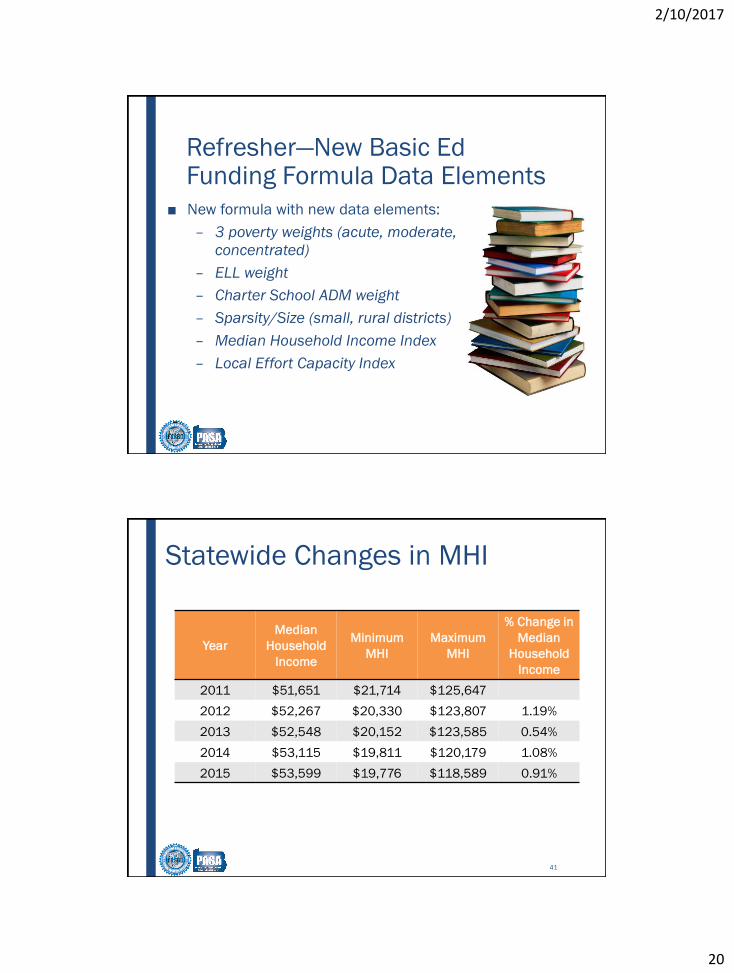
Refresher—New Basic Ed Funding Formula Data Elements
■ New formula with new data elements:
– 3 poverty weights (acute, moderate,
concentrated)
– ELL weight
– Charter School ADM weight
– Sparsity/Size (small, rural districts)
– Median Household Income Index
– Local Effort Capacity Index
40
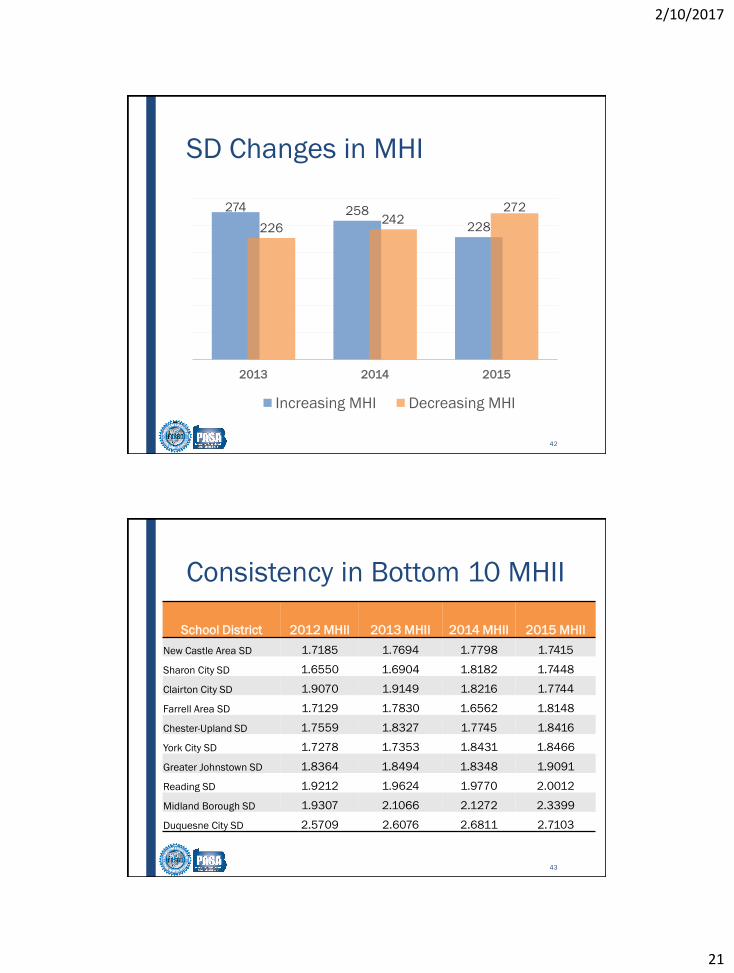
Statewide Changes in MHI
Year
Median
Household
Income
Minimum
MHI
Maximum
MHI
% Change in
Median
Household
Income
2011 $51,651 $21,714 $125,647
2012 $52,267 $20,330 $123,807 1.19%
2013 $52,548 $20,152 $123,585 0.54%
2014 $53,115 $19,811 $120,179 1.08%
2015 $53,599 $19,776 $118,589 0.91%
41
2/10/2017
21
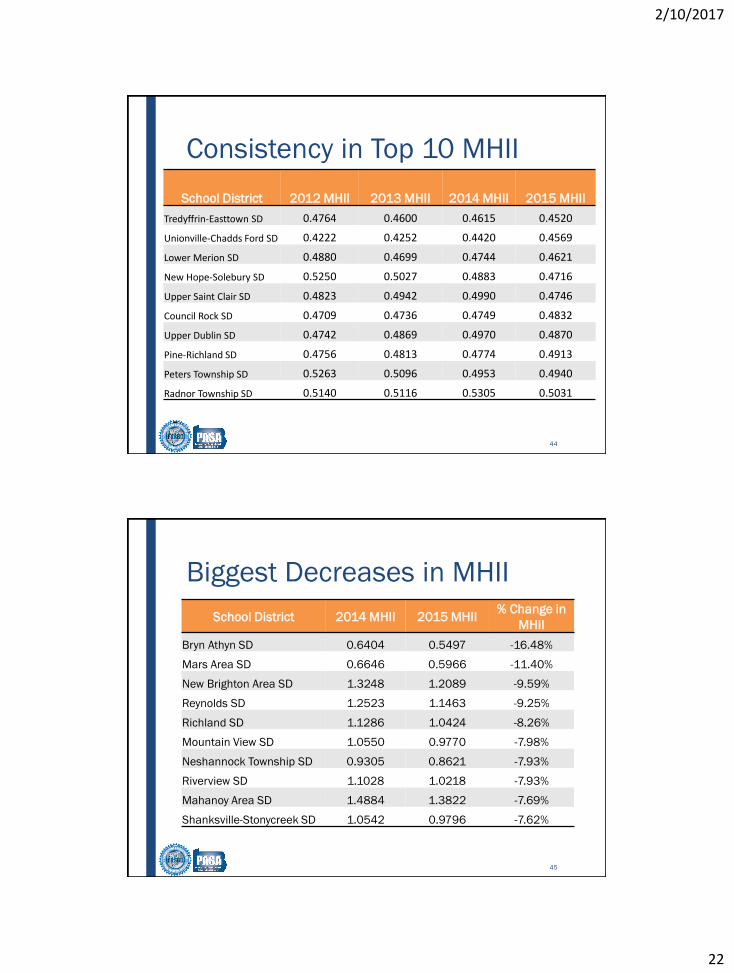
SD Changes in MHI
274 258
228226242
272
2013 2014 2015
Increasing MHI Decreasing MHI
42
Consistency in Bottom 10 MHII
School District 2012 MHII 2013 MHII 2014 MHII 2015 MHII
New Castle Area SD 1.7185 1.7694 1.7798 1.7415
Sharon City SD 1.6550 1.6904 1.8182 1.7448
Clairton City SD 1.9070 1.9149 1.8216 1.7744
Farrell Area SD 1.7129 1.7830 1.6562 1.8148
Chester-Upland SD 1.7559 1.8327 1.7745 1.8416
York City SD 1.7278 1.7353 1.8431 1.8466
Greater Johnstown SD 1.8364 1.8494 1.8348 1.9091
Reading SD 1.9212 1.9624 1.9770 2.0012
Midland Borough SD 1.9307 2.1066 2.1272 2.3399
Duquesne City SD 2.5709 2.6076 2.6811 2.7103
43
2/10/2017
22
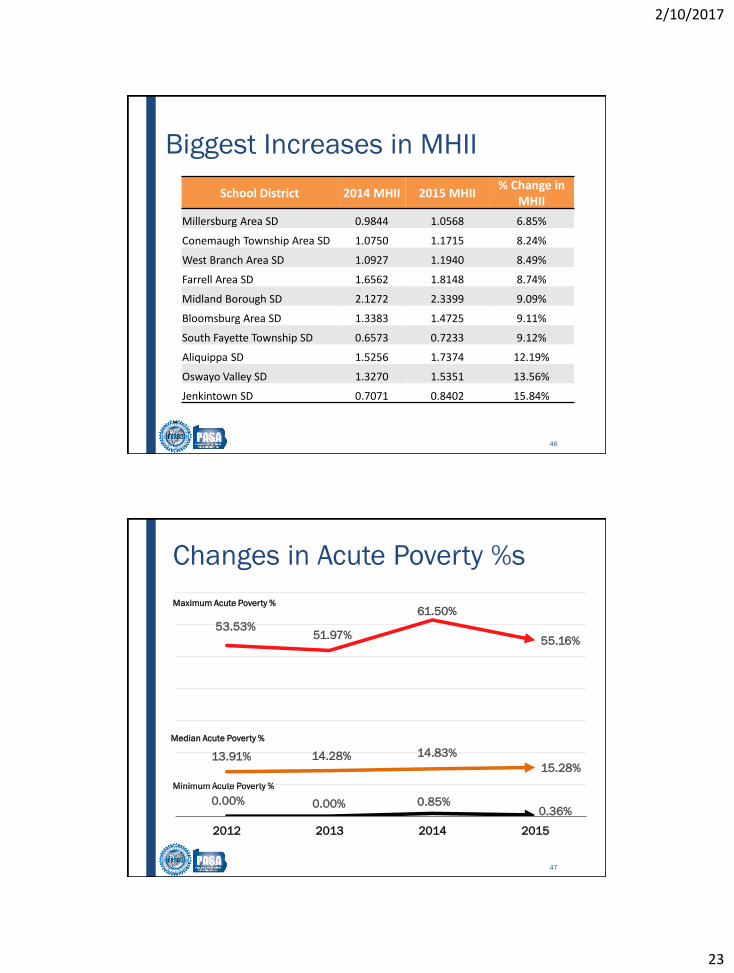
Consistency in Top 10 MHII
School District 2012 MHII 2013 MHII 2014 MHII 2015 MHII
Tredyffrin-Easttown SD 0.4764 0.4600 0.4615 0.4520
Unionville-Chadds Ford SD 0.4222 0.4252 0.4420 0.4569
Lower Merion SD 0.4880 0.4699 0.4744 0.4621
New Hope-Solebury SD 0.5250 0.5027 0.4883 0.4716
Upper Saint Clair SD 0.4823 0.4942 0.4990 0.4746
Council Rock SD 0.4709 0.4736 0.4749 0.4832
Upper Dublin SD 0.4742 0.4869 0.4970 0.4870
Pine-Richland SD 0.4756 0.4813 0.4774 0.4913
Peters Township SD 0.5263 0.5096 0.4953 0.4940
Radnor Township SD 0.5140 0.5116 0.5305 0.5031
44
Biggest Decreases in MHII
School District 2014 MHII 2015 MHII% Change in
MHII
Bryn Athyn SD 0.6404 0.5497 -16.48%
Mars Area SD 0.6646 0.5966 -11.40%
New Brighton Area SD 1.3248 1.2089 -9.59%
Reynolds SD 1.2523 1.1463 -9.25%
Richland SD 1.1286 1.0424 -8.26%
Mountain View SD 1.0550 0.9770 -7.98%
Neshannock Township SD 0.9305 0.8621 -7.93%
Riverview SD 1.1028 1.0218 -7.93%
Mahanoy Area SD 1.4884 1.3822 -7.69%
Shanksville-Stonycreek SD 1.0542 0.9796 -7.62%
45
2/10/2017
23
Biggest Increases in MHII
School District 2014 MHII 2015 MHII% Change in
MHII
Millersburg Area SD 0.9844 1.0568 6.85%
Conemaugh Township Area SD 1.0750 1.1715 8.24%
West Branch Area SD 1.0927 1.1940 8.49%
Farrell Area SD 1.6562 1.8148 8.74%
Midland Borough SD 2.1272 2.3399 9.09%
Bloomsburg Area SD 1.3383 1.4725 9.11%
South Fayette Township SD 0.6573 0.7233 9.12%
Aliquippa SD 1.5256 1.7374 12.19%
Oswayo Valley SD 1.3270 1.5351 13.56%
Jenkintown SD 0.7071 0.8402 15.84%
46
Changes in Acute Poverty %s
Maximum Acute Poverty %
Median Acute Poverty %
Minimum Acute Poverty %
13.91% 14.28% 14.83%
15.28%
0.00% 0.00% 0.85%0.36%
53.53%51.97%
61.50%
55.16%
2012 2013 2014 2015
47
2/10/2017
24
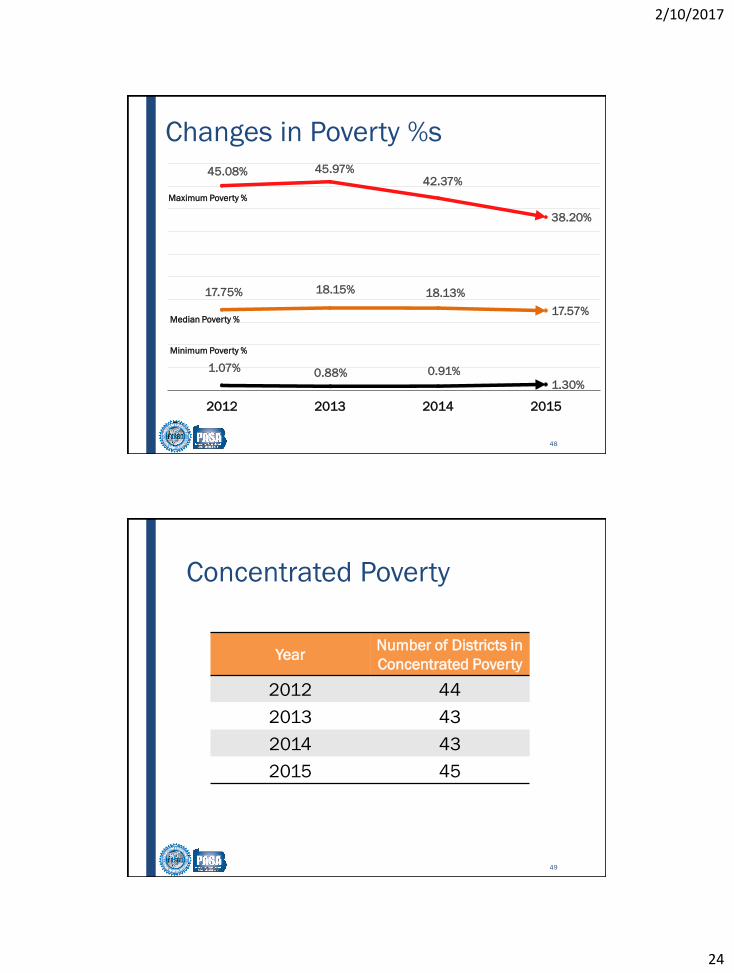
Changes in Poverty %s
17.75% 18.15% 18.13%
17.57%
1.07% 0.88% 0.91%
1.30%
45.08% 45.97%42.37%
38.20%
2012 2013 2014 2015
Maximum Poverty %
Median Poverty %
Minimum Poverty %
48
Concentrated Poverty
YearNumber of Districts in
Concentrated Poverty
2012 44
2013 43
2014 43
2015 45
49
2/10/2017
25
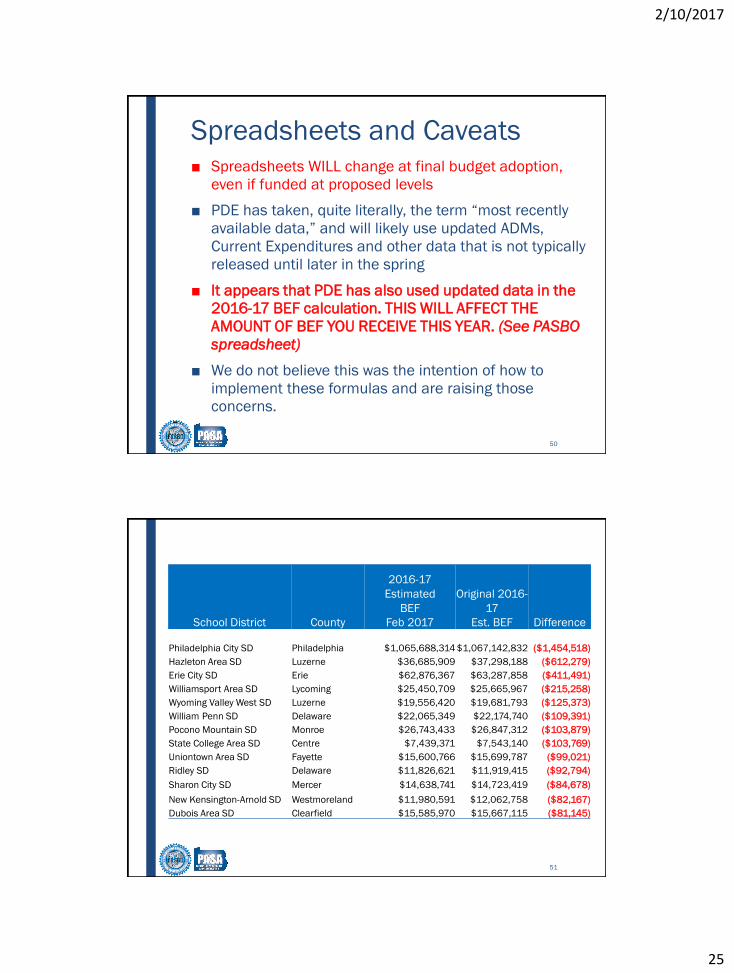
Spreadsheets and Caveats■ Spreadsheets WILL change at final budget adoption,
even if funded at proposed levels
■ PDE has taken, quite literally, the term “most recently
available data,” and will likely use updated ADMs,
Current Expenditures and other data that is not typically
released until later in the spring
■ It appears that PDE has also used updated data in the
2016-17 BEF calculation. THIS WILL AFFECT THE
AMOUNT OF BEF YOU RECEIVE THIS YEAR. (See PASBO
spreadsheet)
■ We do not believe this was the intention of how to
implement these formulas and are raising those
concerns.
50
51
School District County
2016-17
Estimated
BEF
Feb 2017
Original 2016-
17
Est. BEF Difference
Philadelphia City SD Philadelphia $1,065,688,314 $1,067,142,832 ($1,454,518)
Hazleton Area SD Luzerne $36,685,909 $37,298,188 ($612,279)
Erie City SD Erie $62,876,367 $63,287,858 ($411,491)
Williamsport Area SD Lycoming $25,450,709 $25,665,967 ($215,258)
Wyoming Valley West SD Luzerne $19,556,420 $19,681,793 ($125,373)
William Penn SD Delaware $22,065,349 $22,174,740 ($109,391)
Pocono Mountain SD Monroe $26,743,433 $26,847,312 ($103,879)
State College Area SD Centre $7,439,371 $7,543,140 ($103,769)
Uniontown Area SD Fayette $15,600,766 $15,699,787 ($99,021)
Ridley SD Delaware $11,826,621 $11,919,415 ($92,794)
Sharon City SD Mercer $14,638,741 $14,723,419 ($84,678)
New Kensington-Arnold SD Westmoreland $11,980,591 $12,062,758 ($82,167)
Dubois Area SD Clearfield $15,585,970 $15,667,115 ($81,145)
2/10/2017
26
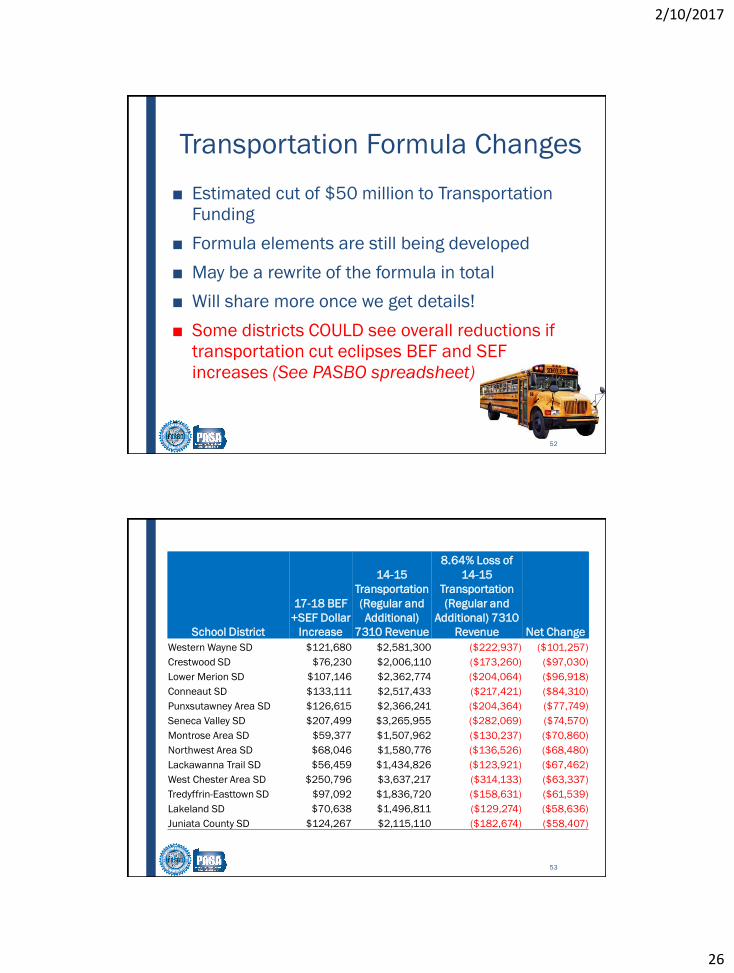
Transportation Formula Changes
■ Estimated cut of $50 million to Transportation
Funding
■ Formula elements are still being developed
■ May be a rewrite of the formula in total
■ Will share more once we get details!
■ Some districts COULD see overall reductions if
transportation cut eclipses BEF and SEF
increases (See PASBO spreadsheet)
52
53
School District
17-18 BEF
+SEF Dollar
Increase
14-15
Transportation
(Regular and
Additional)
7310 Revenue
8.64% Loss of
14-15
Transportation
(Regular and
Additional) 7310
Revenue Net Change
Western Wayne SD $121,680 $2,581,300 ($222,937) ($101,257)
Crestwood SD $76,230 $2,006,110 ($173,260) ($97,030)
Lower Merion SD $107,146 $2,362,774 ($204,064) ($96,918)
Conneaut SD $133,111 $2,517,433 ($217,421) ($84,310)
Punxsutawney Area SD $126,615 $2,366,241 ($204,364) ($77,749)
Seneca Valley SD $207,499 $3,265,955 ($282,069) ($74,570)
Montrose Area SD $59,377 $1,507,962 ($130,237) ($70,860)
Northwest Area SD $68,046 $1,580,776 ($136,526) ($68,480)
Lackawanna Trail SD $56,459 $1,434,826 ($123,921) ($67,462)
West Chester Area SD $250,796 $3,637,217 ($314,133) ($63,337)
Tredyffrin-Easttown SD $97,092 $1,836,720 ($158,631) ($61,539)
Lakeland SD $70,638 $1,496,811 ($129,274) ($58,636)
Juniata County SD $124,267 $2,115,110 ($182,674) ($58,407)
2/10/2017
27
Competitive Bidding
54
■ Auditor General report recommended competitive bidding
of all transportation contracts
■ Audits found that many districts that have not bid their
contracts pay over the formula amount
■ Expecting bills to mandate competitive bidding (3 yrs)
■ Governor Wolf noted this in his budget documents
Another proposal to be aware of…
■ Governor has proposed a minimum wage increase
up to $12/hour
■ If approved, it may have impact on many of your
support staff positions
■ Some increase has been proposed in all three of
the governor’s budgets, but so far, no change has
happened
■ Calculate the cost to your budget if it were to be
approved, and discuss the implications with your
Board
55
2/10/2017
28
Special Education Funding
■ $25 million increase proposed in 2017-
18 (2%)
■ Distributed under the “new” special
education funding formula
■ The “new” special education funding
formula:
– Recognizes that not every district has
16% special education population
– Directs additional resources to
districts with higher cost special
education students
56
SEF Refresher
■ 3 cost categories for special education students
– Category 1: students costing <$25,000
– Category 2: students costing $25,000-$49,999
– Category 3: students costing $50,000 and up
■ Data is reported annually to PDE by school districts
through the Act 16 report (through PIMS)
57
2/10/2017
29
SEF Refresher
■ Appropriate weights are applied to a district’s total
number of students in each category:
– Category 1 Weight: 1.51 (271,977 students)
– Category 2 Weight: 3.77 (20,512 students)
– Category 3 Weight: 7.46 (6,899 students)
58
SEF Refresher
■ Total district weighted student count is adjusted by
3 factors:
– Sparsity/size multiplier
– Equalized millage multiplier
– Aid ratio
■ Each district receives their pro rata share of the
total to be distributed ($88.8 million)
59
2/10/2017
30
Spreadsheets and Caveats
■ Dynamic formula, so the amount a district will receive
in special education funding each year can fluctuate
UP or DOWN
■ 2016-17: It appears that PDE has used updated data
in the 2016-17 SEF calculation. THIS WILL AFFECT
THE AMOUNT OF SEF YOU RECEIVE THIS YEAR (See
PASBO spreadsheet).
■ 2017-18: Data in PDE spreadsheets is
NOT the final data (it is identical to that
used for 16-17)…distribution will
change!
60
Break
61
2/10/2017
31
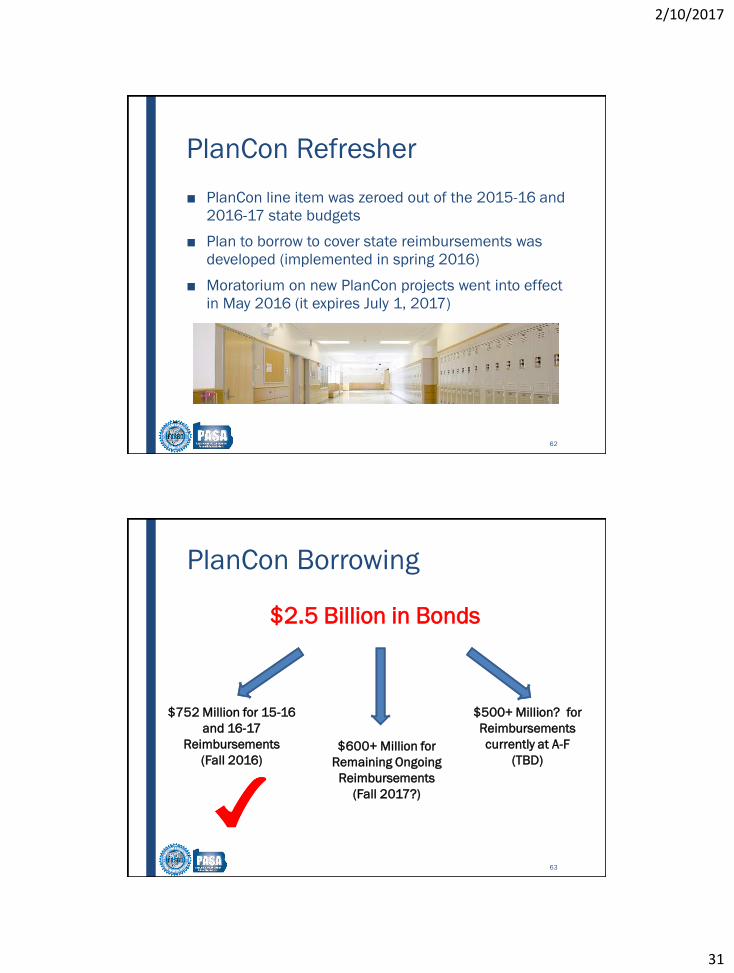
PlanCon Refresher
■ PlanCon line item was zeroed out of the 2015-16 and
2016-17 state budgets
■ Plan to borrow to cover state reimbursements was
developed (implemented in spring 2016)
■ Moratorium on new PlanCon projects went into effect
in May 2016 (it expires July 1, 2017)
62
PlanCon Borrowing
$2.5 Billion in Bonds
$752 Million for 15-16
and 16-17
Reimbursements
(Fall 2016)$600+ Million for
Remaining Ongoing
Reimbursements
(Fall 2017?)
$500+ Million? for
Reimbursements
currently at A-F
(TBD)
63
2/10/2017
32
PlanCon Funding
■ School district reimbursement paid
for with bond proceeds; line item to
pay debt service on bonds
■ Slow “snapback” to $306 million (14-
15 level) over 3 years, providing state
with budgetary relief
■ Expected line item to be $60 million
in 2017-18
64
PlanCon Funding
■ Proposed budget provides $29 million
– Provides state with an additional $30 million in
budget savings
– Interest paid by sales tax revenue
– Impact on reimbursements?
■ Next round of borrowing tentatively Fall 2017??
65
2/10/2017
33
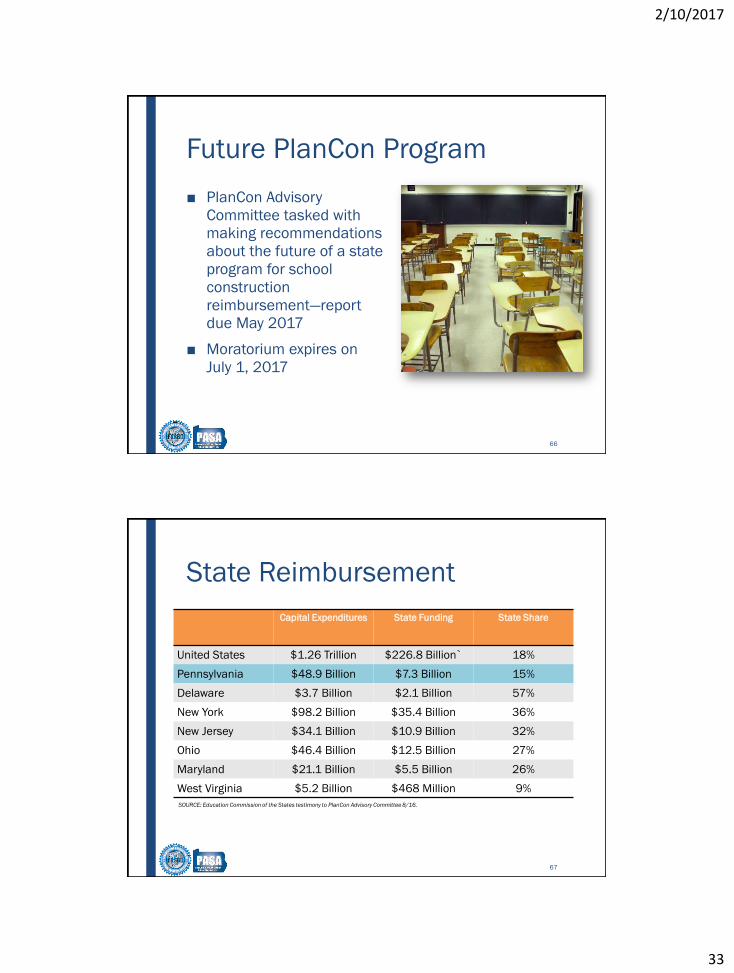
Future PlanCon Program
■ PlanCon Advisory
Committee tasked with
making recommendations
about the future of a state
program for school
construction
reimbursement—report
due May 2017
■ Moratorium expires on
July 1, 2017
66
Capital Expenditures State Funding State Share
United States $1.26 Trillion $226.8 Billion` 18%
Pennsylvania $48.9 Billion $7.3 Billion 15%
Delaware $3.7 Billion $2.1 Billion 57%
New York $98.2 Billion $35.4 Billion 36%
New Jersey $34.1 Billion $10.9 Billion 32%
Ohio $46.4 Billion $12.5 Billion 27%
Maryland $21.1 Billion $5.5 Billion 26%
West Virginia $5.2 Billion $468 Million 9%
SOURCE: Education Commission of the States testimony to PlanCon Advisory Committee 8/16.
State Reimbursement
67
2/10/2017
34
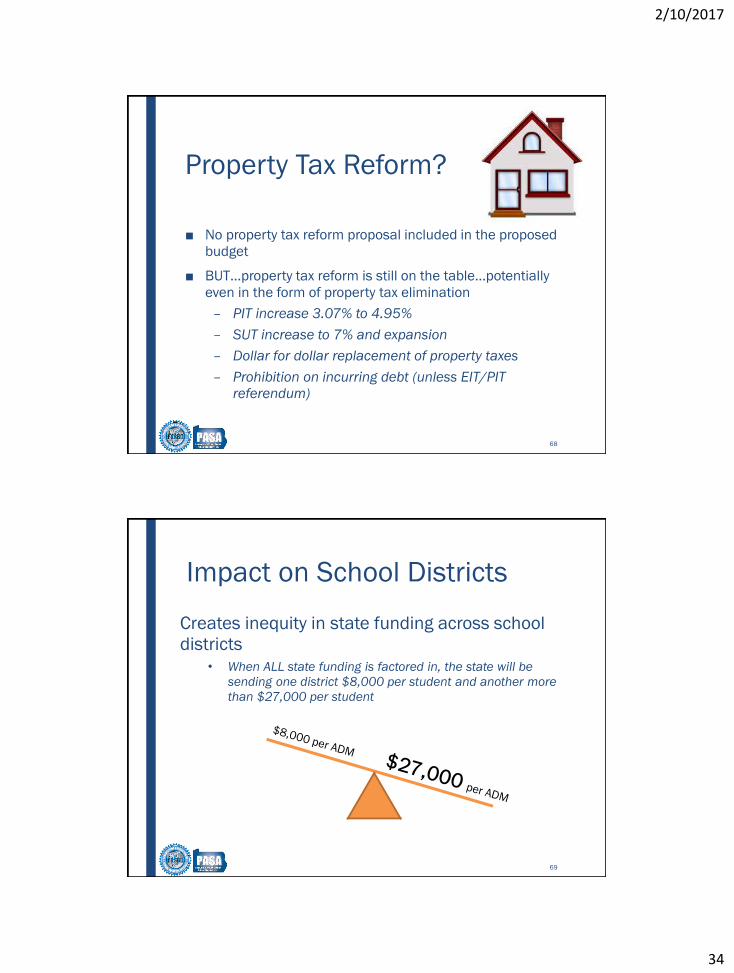
Property Tax Reform?
■ No property tax reform proposal included in the proposed
budget
■ BUT…property tax reform is still on the table…potentially
even in the form of property tax elimination
– PIT increase 3.07% to 4.95%
– SUT increase to 7% and expansion
– Dollar for dollar replacement of property taxes
– Prohibition on incurring debt (unless EIT/PIT
referendum)
68
Impact on School Districts
Creates inequity in state funding across school
districts
• When ALL state funding is factored in, the state will be
sending one district $8,000 per student and another more
than $27,000 per student
69
2/10/2017
35
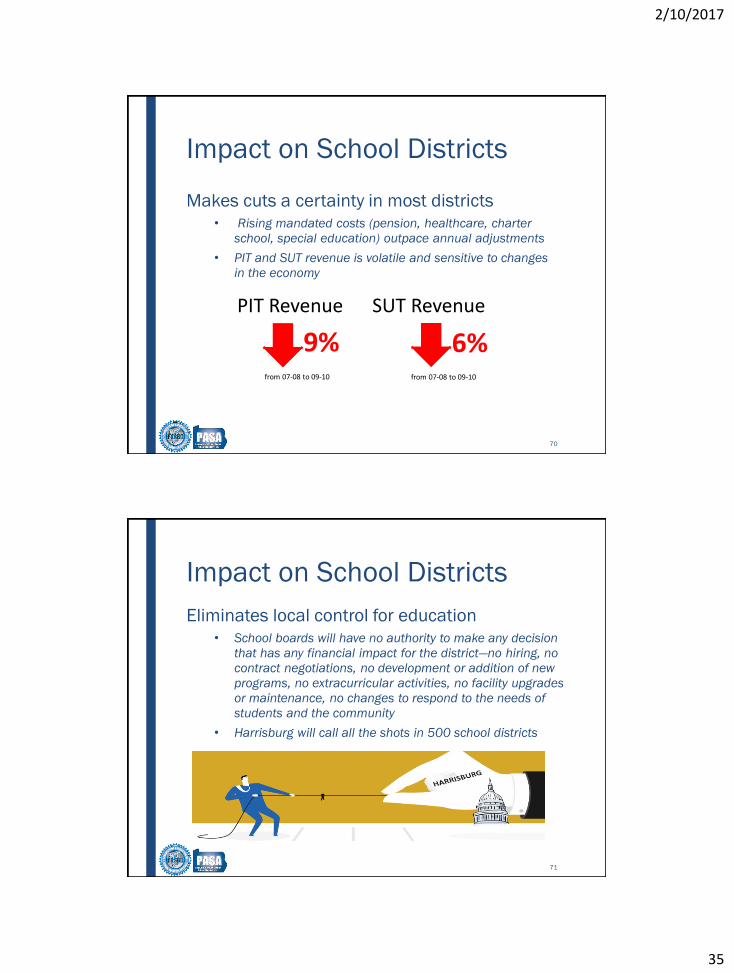
Impact on School Districts
Makes cuts a certainty in most districts
• Rising mandated costs (pension, healthcare, charter
school, special education) outpace annual adjustments
• PIT and SUT revenue is volatile and sensitive to changes
in the economy
from 07-08 to 09-10
9% from 07-08 to 09-10
6%
PIT Revenue SUT Revenue
70
Impact on School Districts
Eliminates local control for education
• School boards will have no authority to make any decision
that has any financial impact for the district—no hiring, no
contract negotiations, no development or addition of new
programs, no extracurricular activities, no facility upgrades
or maintenance, no changes to respond to the needs of
students and the community
• Harrisburg will call all the shots in 500 school districts
71
2/10/2017
36
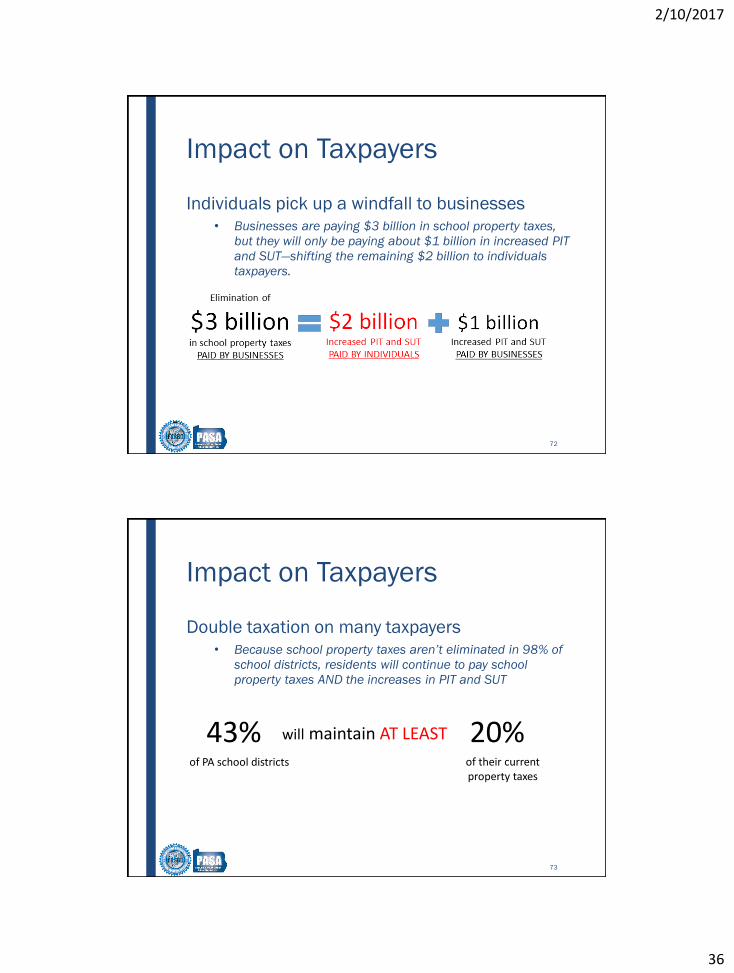
Impact on Taxpayers
Individuals pick up a windfall to businesses
• Businesses are paying $3 billion in school property taxes,
but they will only be paying about $1 billion in increased PIT
and SUT—shifting the remaining $2 billion to individuals
taxpayers.
72
Impact on Taxpayers
Double taxation on many taxpayers
• Because school property taxes aren’t eliminated in 98% of
school districts, residents will continue to pay school
property taxes AND the increases in PIT and SUT
43% 20%of PA school districts
will maintain AT LEAST
of their current property taxes
73
2/10/2017
37
Impact on Taxpayers
Many taxpayers will pay MORE after property
tax elimination
• After figuring in the increases in PIT and SUT, the loss of
the federal income tax deduction, the result of the shift
from businesses and the remaining school property
taxes, taxpayers in 449 school districts (90%) will pay
MORE than they are paying now in school property
taxes.
74
Commitment to Early Childhood Education
$75 Million Increase for Pre-K Counts and Head Start
• $65 million increase for Pre-K Counts Programs.
• $10 million increase in Head Start.
75
2/10/2017
38
Early Childhood Intervention Services
• Partnership between Department of Education and Department of Human Services.
• $11.7 million for early intervention services to offset decreases in federal dollars.
76
Expansion of School Breakfast Program
Expand the School Breakfast Program by $2 million
in state funds to leverage up to $20 million in
federal funds to enhance school breakfast
programs.
• Breakfast in the classroom
• Grab and go breakfast
• Breakfast after the bell
77
2/10/2017
39
Expanding Community School Partnerships
•Community School Student Partnerships
(CSSP) in West Philadelphia neighborhoods.
•As part of Penn’s overall university-assisted
community school network through the Netter
Center for Community Partnerships, CSSP
operates recess, school day, after school and
evening programs across five public schools
in West Philadelphia by recruiting, training,
and coordinating hundreds of Penn student
tutors/mentors.
78
PDE STEM Network
• Pennsylvania Engineering by Design Network
• Pennsylvania is a member of ITEEA’s STEM Center for
Teaching and Learning (SCTL) Engineering by Design (EbD)
State Consortium through a partnership between
Lancaster-Lebanon IU13, the Technology & Engineering
Education Association of Pennsylvania.
• Eligible educators in Pennsylvania are provided online
access to education program at a partner PA college or
university, and participate in EbD professional
development at a partner PA intermediate units.
79
2/10/2017
40
Effort to Improve Persistently Low Performing Schools
• $2 million in new funds to leverage $1 million in
federal funds to assist 3 districts with a total of 15
low performing schools.
• Districts will be identified and offered $200,000 per
school.
80
Pause on Keystone Exams as a Graduation Requirement to 2019
• Act 1 of 2016
• Implement alternative methods for students to
demonstrate proficiency for graduation in addition to the
Keystone Exams, project-based assessments, and other
alternative assessments
• Improve and expedite the evaluation of project-based
assessments.
• Ensure that no student is prohibited from participation in
vocational-technical education or elective courses or
programs as a result of supplemental instruction required
in 22 Pa. Code §§ 4.24(k) and 4.51b(f) (relating to
Keystone Exams). HB 202
81
2/10/2017
41
ESSA: Federal Regulation Changes
•House of Representatives approved the Midnight Rule Relief
Act to expedite the repeal of ESSA Regulations written by the
Obama Administration through the Congressional Review Act.
The Senate must also approve the legislation.
•Once blocked by the Congressional Review Act, executive
branch agencies are prevented from issuing any similar
regulations until another law is passed.
•States may have more flexibility, but less guidance, as they
only have to meet what is written in the ESSA Statute absent
regulations.
82
ESSA and PA Statute
• Many aspects of Pennsylvania’s Assessment System,
Accountability System, and Educator Evaluation System
are in state statute.
• The PA ESSA Plan will need federal approval and
changes to the PA School Code by the legislature.
83
2/10/2017
42
4 Major Components of Pa’s ESSA Plan
Assessments Accountability
Educator Preparation
Educator Evaluation
84
Assessments
What PDE is Considering:
• Can we reduce the amount of time students spend on
statewide PSSA testing (grades 3-8)?
• Is it feasible to test students at multiple times across the
school year instead of only once?
• Can we eliminate double testing for middle school
Algebra I students (would need to add adv. math test in
high school for those students)
85
2/10/2017
43
Accountability - Measures
What PDE is Considering:
Future Ready PA Index to replace SPP
A tool to measure school success
• Increased weight on growth in test scores versus point-in-time achievement
• Local options for additional assessments
• Career ready indicators and meaningful postsecondary student engagement
• More holistic measures of student success
• Measures of both inputs (i.e., course offerings) and outcomes (achievement
scores)
86
Accountability - Intervention
What PDE is Considering:
•Tailored to local context and school based needs
assessment.
•Intervention for lowest performing schools to include BOTH
academic and holistic strategies.
•Level of state intervention to be responsive to student
progress over time.
87
2/10/2017
44
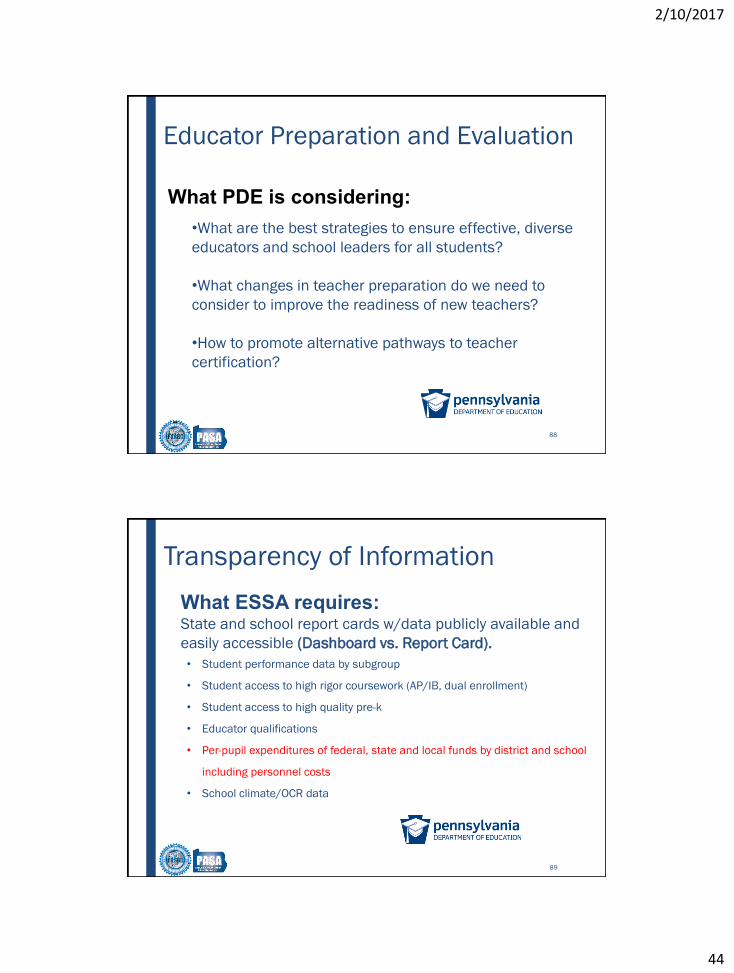
Educator Preparation and Evaluation
What PDE is considering:
•What are the best strategies to ensure effective, diverse
educators and school leaders for all students?
•What changes in teacher preparation do we need to
consider to improve the readiness of new teachers?
•How to promote alternative pathways to teacher
certification?
88
Transparency of Information
What ESSA requires: State and school report cards w/data publicly available and
easily accessible (Dashboard vs. Report Card).
• Student performance data by subgroup
• Student access to high rigor coursework (AP/IB, dual enrollment)
• Student access to high quality pre-k
• Educator qualifications
• Per-pupil expenditures of federal, state and local funds by district and school
including personnel costs
• School climate/OCR data
89
2/10/2017
45
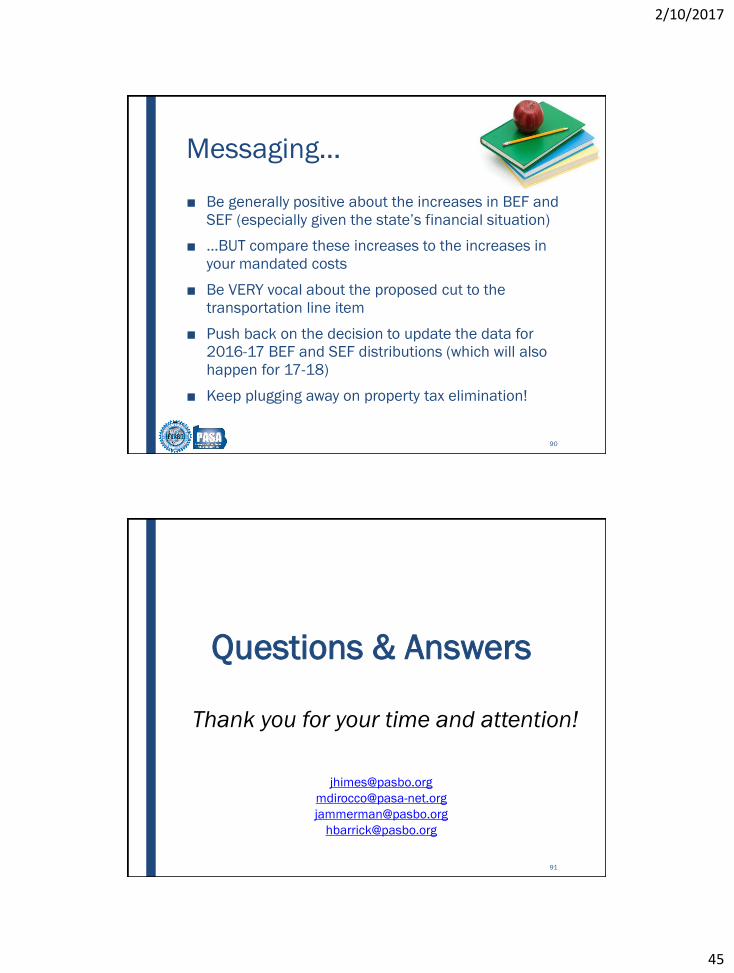
Messaging…
■ Be generally positive about the increases in BEF and
SEF (especially given the state’s financial situation)
■ …BUT compare these increases to the increases in
your mandated costs
■ Be VERY vocal about the proposed cut to the
transportation line item
■ Push back on the decision to update the data for
2016-17 BEF and SEF distributions (which will also
happen for 17-18)
■ Keep plugging away on property tax elimination!
90
91
Thank you for your time and attention!
Questions & Answers
2/10/2017
46
Special Pre-Con Session on Student Transportation at the PASBO 62nd Annual
Conference
Tuesday, March 21, 2017
4:00 p.m.—5:45 p.m.
Westin Hotel
Unveiling the new transportation database from Forecast5
Preparing for a transportation bid/RFP
Changes in the student transportation formula
Mark Your Calendar!
92