Embed Size (px)
Citation preview
1
Communication and Organization in SoftwareDevelopment:
An Empirical Study
Carolyn B. SeamanVictor R. Basili
University of MarylandInstitute for Advanced Computer Studies
Computer Science DepartmentCollege Park, MD, USA
Abstract
The empirical study described in this paper addresses the issue of communication amongmembers of a software development organization. The independent variables are variousattributes of organizational structure. The dependent variable is the effort spent onsharing information which is required by the software development process in use. Theresearch questions upon which the study is based ask whether or not these attributes oforganizational structure have an effect on the amount of communication effort expended.In addition, there are a number of blocking variables which have been identified. Theseare used to account for factors other than organizational structure which may have aneffect on communication effort. The study uses both quantitative and qualitative methodsfor data collection and analysis. These methods include participant observation, structuredinterviews, and graphical data presentation. The results of this study indicate that severalattributes of organizational structure do affect communication effort, but not in a simple,straightforward way. In particular, the distances between communicators in the reportingstructure of the organization, as well as in the physical layout of offices, affects howquickly they can share needed information, especially during meetings. These resultsprovide a better understanding of how organizational structure helps or hinderscommunication in software development.
1. Introduction
Software development managers strive to control all of the factors that might impact thesuccess of their projects. However, the state of the art is such that not all of these factorshave been identified, much less understood well enough to be controlled, predicted, ormanipulated. One factor that has been identified [Curtis88] but is still not well understoodis information flow. It is clear that information flow impacts productivity (becausedevelopers spend time communicating) as well as quality (because developers needinformation from each other in order to carry out their tasks well). The study described inthis paper addresses the productivity aspects of communication by empirically studying theorganizational and process characteristics which influence the amount of effort softwaredevelopers spend in communication activities. This is a first step towards providingmanagement support for control of communication effort.
This research also arises out of an interest in the organizational structure of softwareenterprises and how it affects the way software is developed. Development processesaffect, and are affected by, the organizational structure in which they are executed.
This work was supported in part IBM's Centre for Advanced Studies, and by NASA grant NSG-5123.
2
Communication in software development is one area in which organizational and processissues are intertwined. A process requires that certain types of information be sharedbetween developers and other process participants, thus making information processingdemands on the development organization. The organizational structure, then, can eitherfacilitate or hinder the efficient flow of that information.
The empirical study described here aims to identify the organizational characteristics whichaffect process communication effort, and to determine the degree of effect. The dependentvariable in this study is communication effort, defined as the total effort expended to sharesome type of information. The dependent variables are organizational distance, physicaldistance, and familiarity. All three of these are measures of the organizational structure,defined as the network of relationships between members of the software developmentorganization. The types of relationships upon which these measures are based are,respectively, official relationships, physical proximity, and past and present workingrelationships.
The study combines quantitative and qualitative research methods. Qualitative methods aredesigned to make sense of data represented as words and pictures, not numbers[Gilgun92]. Qualitative methods are especially useful when no well-grounded theories orhypotheses have previously been put forth in an area of study. Quantitative methods aregenerally targeted towards numerical results, and are often used to confirm or testpreviously formulated hypotheses. They can be used in exploratory studies, but onlywhere well-defined quantitative variables are being studied. We combine these paradigmsin order to flexibly explore an area with little previous work, as well as to providequantified insight that can help support the management of software development projects.
The purpose of this report is twofold. First, we wish to describe the methods we haveused to carry out this study, so that other researchers can consider their appropriateness forinvestigating this area. Second, we wish to present a set of useful results, in order forpractitioners and others to gain more understanding of communication and organizationalissues in software development projects. In the subsections which follow, the specificproblem addressed by this study is presented, as well as the research questions and somedefinitions of terms. In section 2, the related work in the literature is outlined. Ourresearch methods are described in detail in section 3, and section 4 presents our results. Insection 5, some of the limitations of this study are presented and packaged as experience tobe used in future efforts to address this issue. Finally, section 6 discusses and summarizesthe results of the study.
1.1. Problem Statement
Software development organizations do not currently know how to ensure an efficient flowof information among developers. They do not know how to assess, with any certainty,the information flow requirements of the development processes they choose. In addition,they do not have a deep understanding of how their organizational context affects the levelof effort needed to meet the process's communication requirements.
The lack of understanding of communication issues has several consequences. First of all,managers have no way to account for communication costs in their project planning, or tobalance those costs with the benefits of communication. Additionally, they do not knowhow to identify or solve communication problems when they arise. Finally, we cannotbegin to learn from experience about communication issues until we identify the importantvariables that affect communication efficiency.
3
1.2. Research Questions
The study of organizational issues and communication in software development is notadvanced to the point where it is possible to formulate well-grounded hypotheses.Therefore, this work is based on the following set of research questions:
• How does the distance between people in the management hierarchy of a softwaredevelopment organization affect the amount of effort they expend to shareinformation?
• How does a group of software developers' familiarity with each other's work affect theamount of effort they expend to share information?
• How does the physical distance between people in a software development organizationaffect the amount of effort they expend to share information?
These questions are all operationally specialized versions of the more general question:
• How does the organizational structure in which software developers work affect theamount of effort it takes them to share needed information?
These research questions lead directly to a set of dependent and independent variables forthe study proposed in this document. The dependent variable is Communication Effort,defined as the amount of effort expended to complete an interaction. Secondly, there is aset of independent variables which represent organizational structure. Three differentmeasures have been chosen which capture the different properties mentioned in the firstthree research questions above. The first, Organizational Distance, measures the distancebetween people in the official management structure of the development organization. Thesecond is Familiarity, which reflects how familiar different developers are with each others'past and present work. Finally, the independent variable Physical Distance is a measure ofphysical proximity. The proposed study will explore the relationship between each of thesethree independent variables, and the dependent variable.
The study design also includes a large set of intervening, or blocking, variables. Thesefactors are believed to have an effect on communication effort, but are not the primaryconcern of this study.
1.3. Definitions
In this section, some important concepts are defined in the context of this study.
organizational structure - the network of all relevant relationships betweenmembers of an organization. These relationships may affect the way peopleperform the process at hand, but they are not defined by the process beingperformed.
process - a pre-defined set of steps carried out in order to produce a software product.process communication - the communication, between members of a development
project, required explicitly by a software development process.communication effort - the amount of effort, in person-minutes, expended to
complete an interaction, including the effort spent requesting the information to beshared, preparing the information, transmitting or transferring the information fromone party to another, and digesting or understanding the information. Thisdefinition includes effort spent on activities not normally considered"communication" activities (e.g.preparing and reading written information).
interaction - an instance of communication, in which two or more people areexplicitly required (by the process they are executing) to share some piece of
4
information. For example, the handoff of a coded component from a developer to atester is an interaction. One developer asking for advice from an expert, no matterhow crucial that advice may be, is not an interaction according to our definition. Aninteraction begins when some party requests information (or when a party beginspreparation of unrequested information) and ends after the information has beenreceived and understood sufficiently for it to be used (e.g. read).
qualitative data - data represented as words and pictures, not numbers [Gilgun92].Qualitative analysis consists of methods designed to make sense of qualitativedata.
quantitative data - data represented as numbers or discrete categories which can bedirectly mapped onto a numeric scale. Quantitative analysis consists ofmethods designed to summarize quantitative data.
participant observation - research that involves social interaction between theresearcher and informants in the milieu of the latter, during which data aresystematically and unobtrusively collected [Taylor84].
structured interviewing - a focused conversation whose purpose is to elicitresponses from the interviewee to questions put by the interviewer [Lincoln85].
coding - a systematic way of developing and refining interpretations of a set of data[Taylor84]. In this work, coding refers specifically to the process of extractingspecific pieces of information from qualitative data in order to provide values forquantitative research variables.
triangulation - the validation of a data item with the use of a second data source, asecond data collection mechanism, or a second researcher [Lincoln85].
member checking - the practice of presenting analysis results to members of thestudied organization in order to verify the researcher's conclusions against thesubjects' reality [Lincoln85].
2. Related Work
The work proposed in this document is supported by the literature in three basic ways.First of all, the research questions in section 1.2 have been raised in various forms in theliterature. The relationship between communication and organizational structure (inorganizations in general) is a strong theme running through the organization theoryliterature, from classic organization theory [Galbraith77, March58], to organizationalgrowth [Stinchcombe90], to the study of technological organizations [Allen85], to businessprocess reengineering [Davenport90, Hammer90]. This relationship has not been exploredin detail in software development organizations. However, several studies have providedevidence of the relevance of both organizational structure (along with other "non-technical"factors) and communication in software development. In particular, at least one study[Curtis88, Krasner87] points to the three aspects of organizational structure which weaddress in our research questions.
Second, our chosen dependent and independent variables have all appeared in some form inthe literature. Our dependent variable, Communication Effort, has been defined to includeboth technical and managerial communication, to reflect only that communication requiredby the development process, but to include all such process communication. Thesedecisions are based on results presented in the organization theory [Ebadi84,MaloneSmith88] and empirical software engineering literature [Ballman94, Bradac94,Perry94]. The three independent variables also appear in these two areas of literature.Organization theory points to the benefits of organizational and physical proximity ofcommunicators [Allen85, Mintzberg79], while empirical software engineering has shownthe drawbacks of organizational and physical distance [Curtis88]. The idea of "familiarity"
5
is referred to in a more general way in the literature. Both areas refer to the importance ofvarious types of relationships between communicators [Allen85, Curtis88]. In particular, asoftware development study [Krasner87] has discovered the importance of "shared internalrepresentations", which have led to our particular definition of Familiarity.
Third, the literature in many areas has helped shape the design of the proposed study byproviding methods and experience. The choice and definition of the unit of analysis, theinteraction (section 3.2), has been influenced by the organization theory [Ebadi84, Liker86]and empirical software engineering literature [Perry94]. The scope of the study, in termsof the types of communication studied, has also been influenced by this literature. Datacollection and analysis methods have come directly from the literature in empirical methods[Lincoln85, Taylor84].
Despite the considerable support in the literature, there are several significant issues whichare not addressed there. Probably the most important is that of intervening, or blocking,variables. Our own experience and intuition strongly suggest that the influence oforganizational structure on communication effort is neither direct nor exclusive. There areother factors that affect the amount of time and effort an interaction takes. We have reliedon our own experience, and on conversations with many experienced managers,developers, and researchers at the study site, to identify these factors.
Another issue which is not resolved in the literature is a satisfactory way of modeling aprocess in terms of its individual interactions. In many cases, a process model or definitiondocument will be written in such a way that the required interactions (as defined in section1.3) are clearly defined. But even when this is the case, it is not clear that the modelaccurately reflects reality. What rules exist for separating one interaction from another?The breakdown of interactions presented in section 3.3.3 went through a number ofiterations until we found a model that both reflected reality and which facilitated thecollection of data.
From research questions to variables to research design, the proposed work is supported inthe literature. We have extended the current state of the literature not only by combiningpieces that have not previously been combined, but also by adding new approaches thatwere necessary to adequately address the issues of interest.
3. Research Methods
This empirical study examines the role of organizational structure in processcommunication among software developers. This section explains in detail the methods weemployed to investigate this issue. In the subsections which follow, we first present anoverview of the research plan and a discussion of our unit of analysis. Then we describethe setting of the study. Finally, the details of data collection, coding, and analysis arepresented.
3.1. Overview
Our research design combines qualitative and quantitative methods. There are a number ofways in which such methods have been combined in studies in the literature. The practiceadopted for this study is to use qualitative methods to collect data which is then quantified,or coded, into variables which are then analyzed using quantitative methods. Examples ofthis practice are found in [Sandelowski92, Schilit82, Schneider85].
6
The data collection procedures used in this study are participant observation [Taylor84] andstructured interviews [Lincoln85]. Development documents from the environments understudy also provide some of the data [Lincoln85]. As described later, the data gathered fromthese different sources overlaps, thus providing a way of triangulating [Lincoln85], orcross-checking the accuracy of the data.
After the data was collected, it was coded in such a way that the result is a set of datapoints, each of which has a set of values corresponding to a set of quantitative researchvariables. For example, although participant observation in general yields qualitative (non-quantified) data, we used this data to count the number of people present at the observedmeeting, to time the different types of interactions that take place, and to determine whattype of communication medium was used. These quantified pieces of data constitute valuesfor the research variables.
The data analysis part of the research design is mostly quantitative. The coded data set wasanalyzed using very simple statistical methods. Histograms were constructed to determinethe distributions of single variables, and scatterplots were used to study the relationshipsbetween pairs of variables. Various subsets of the data were also viewed in this way inorder to gain a deeper understanding of the findings.
3.2. Unit of Analysis
A brief discussion of the unit of analysis is in order. The unit of analysis in this study isthe interaction. In section 1.3, an interaction was defined as an instance of communication,in which two or more people are explicitly required (by the process they are executing) toshare some piece of information. It should be noted that only process-oriented interactionsare considered in this study. For example, a document handoff between different sets ofdevelopers, a review meeting, and a joint decision on how to proceed are all consideredinteractions in this context if they are required as part of some defined process step. Wewould not include, for example, informal (optional) consultations on technical mattersbetween developers, even though this type of communication might be "required" becausea developer cannot accomplish a given task adequately without it. Such informalcommunication is a very important, but we believe separate, area of research.
Most social science research methods assume that the unit of analysis is a person, andmethods are described with this assumption, at least implicitly. However, there are someexamples in the literature of empirical studies which use a unit of analysis other than aperson or group of people. One is Schilit's [Schilit82] study of how workers influence thedecisions of their superiors in organizations. The unit of analysis in this study is called aninteraction, in this case an attempt by a subordinate to influence a superior in some way.The research variables represented characteristics of such interactions, e.g. method ofinfluence. Like our study, this is an example in which the unit of analysis is aphenomenon, or an event, rather than a person. Other examples of non-human units ofanalysis can be found in the research literature on group therapy.
There are several ramifications of using this type of unit of analysis. First of all, the "size"of the study cannot be stated in terms of people. The number of people interviewed orobserved is not a meaningful size measure since not all people involved in interactions areinterviewed, and the same person may be present in a number of observations. The size ofthe study is the number of interactions. Each interaction constitutes one data point, and allof the variables are evaluated with respect to an interaction.
7
Another possible complication with this unit of analysis is the problem of independence.Any analysis method that attempts to describe a relationship between variables has anunderlying requirement that the values (of variables) associated with one data point are notin any way dependent on the values associated with another data point. It can be arguedthat, since different interactions can involve the same people, they may not be independent.It's not clear, however, that independence has this meaning when the unit of analysis is nota person. It can be argued that the properties of people that are relevant in our context arerepresented as variables, and thus any dependence between two data points simply meansthat they share the same values for some variables. In any case, this issue should be takeninto account when assessing the results reported in section 4.
3.3. Study Setting
This study took place at IBM Software Solutions Laboratory in Toronto, Canada. Thedevelopment project studied was DB2, a commercial database system with several versionsfor different platforms. During the month of June 1994, data was collected from (mostlydesign and code) reviews in Toronto. Ten reviews were directly observed, which involvedabout 100 interactions. These observations were followed up with interviews with reviewparticipants in November 1994, and in April 1995. The review process was chosen forstudy because it is well-defined in the DB2 project, it involves a lot of communicationbetween participants, and much of it is observable.
A three-part model of the DB2 development environment was built. The model had severalpurposes. First, it was used to better understand the DB2 review process and the peopleinvolved. Also, it served as a vehicle with which to communicate with developers andothers from whom we were collecting information. Finally, it was used as a framework inwhich to organize the data.
Recall that the issue which motivates this work is the relationship between developmentorganizations and processes. Information flow is one area in which organizational andprocess issues come together. To reflect this, the model of the DB2 environment isorganized in three parts. One part corresponds to the development process under study,one to the organizational structure in which that process is executed, and one to theintersection between the two, which is modeled as a set of interactions. In section 1.3, wedefined an interaction, as it is used here, as an instance of communication in which two ormore process participants must share some piece of information in order to carry out theirprocess responsibilities. The three parts of the model are described in sections 3.3.1through 3.3.3.
3.3.1. Process
The work that goes into each release of DB2 is divided into line items, each of whichcorresponds to a single enhancement, or piece of functionality. Work on a line item mayinvolve modification of any number of software components. For each line item, reviewsare conducted of each major artifact (requirements, design, code, and test cases). In thisstudy, we observed and measured reviews of all types, but mostly design and code.
The review process consists of the following general steps:
Planning - The Author and Line Item Owner (often the same person) decide who shouldbe asked to review the material. The Author then schedules the review meeting anddistributes the material to be reviewed.
8
Preparation - All Reviewers read and review the material. Some Reviewers writecomments on the review material, which they later give to the Author. The ChiefReviewer sometimes checks with each Reviewer before the meeting to make surethey have reviewed the material.
Review Meeting - There are a number of different ways to work through the materialduring the meeting, and to record the defects. In some cases, the Moderatorrecords all defects raised on Major Defect Forms, which were given to the Author atthe end of the meeting. In other reviews, the Moderator does not use the forms, butwrites down detailed notes of all defects, questions, and comments made. In stillothers, the Moderator takes only limited notes and each Reviewer is expected toprovide written comments to the Author. In all cases, the Reviewers make aconsensus decision about whether a re-review is required. Also, at the end of themeeting, the Moderator fills out most of the Review Summary Form and gives it tothe Chief Reviewer.
Rework - The Author performs all the required rework.Follow up - The Chief Reviewer is responsible for making sure that the rework is
reviewed in some manner. This could take place in an informal meeting betweenthe Author, Chief Reviewer, and sometimes the Line Item Owner. In other cases,the Author simply gives the Chief Reviewer the reworked material and the ChiefReviewer reviews it at his or her convenience. After the rework is reviewed, theChief Reviewer completes the Review Summary Form and submits it to the ReleaseTeam.
3.3.2. Organization
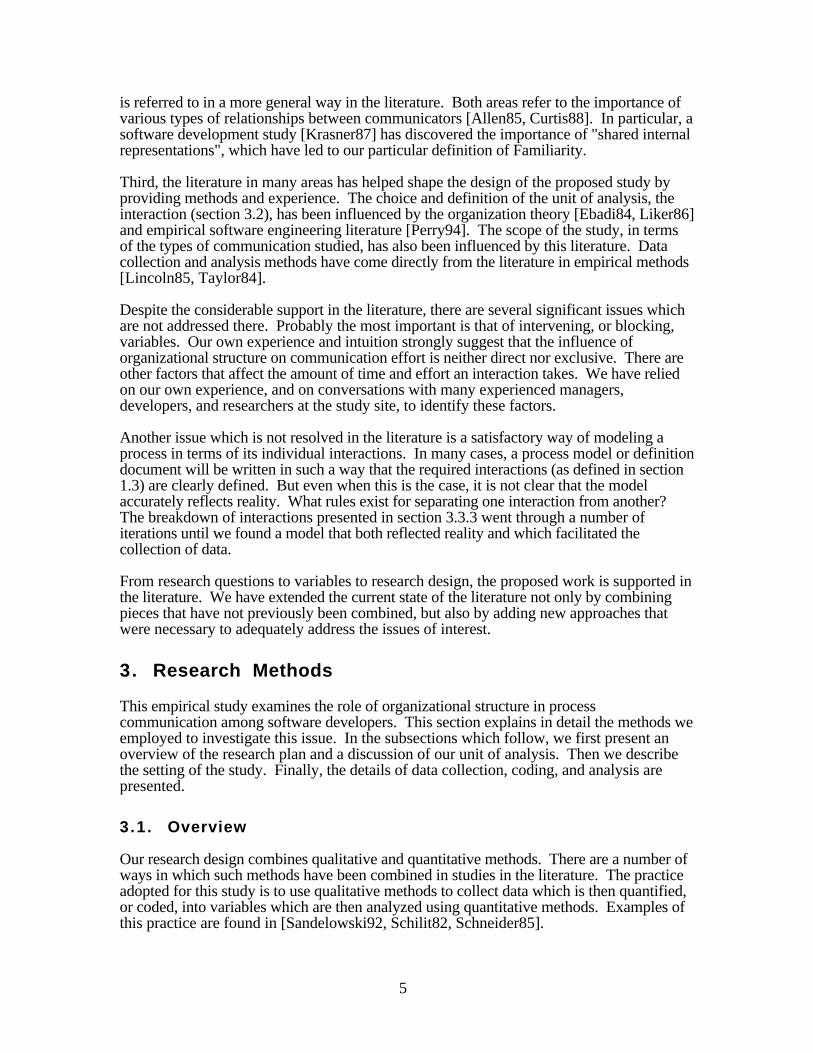
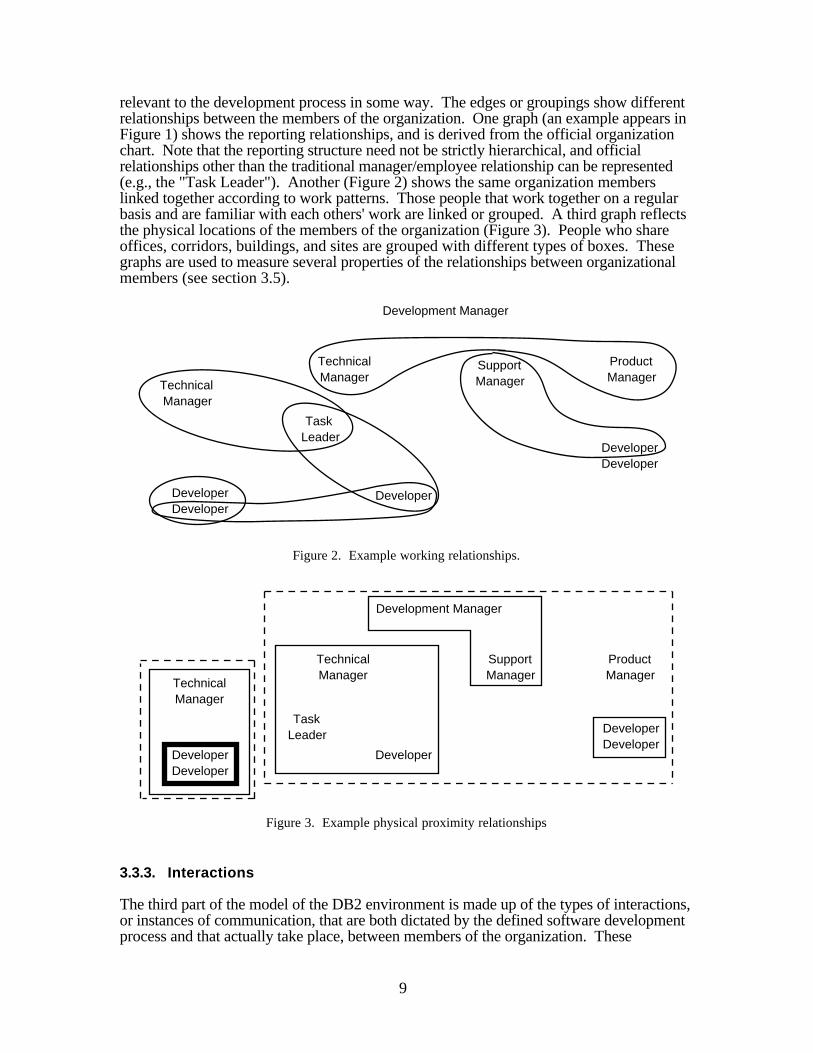
The formal DB2 organization has a basic hierarchical structure. First-line managers are ofthree types. Technical managers manage small teams of programmers who are responsiblefor maintaining specific collections of software components. Groups of developersreporting to a technical manager may be further divided by component and Task Leadersmay be assigned to head each subgroup. Product managers are responsible for managingreleases of DB2 products. Teams reporting to product managers coordinate all the activitiesrequired to get a release out the door. Support managers manage teams that providesupport services, like system test, to all the other teams. There is one second-line managerresponsible for all DB2 development.
Development Manager
TechnicalManager
ProductManager
SupportManager
TechnicalManager
DeveloperDeveloper
Developer
DeveloperDeveloper
TaskLeader
Figure 1. Example reporting relationships.
The part of the three-part model which depicts the organizational structure of the DB2 teamconsists of a set of simple graphs. Each graph shows a different perspective on theorganizational structure. In each, the nodes are the people that constitute the team or are
9
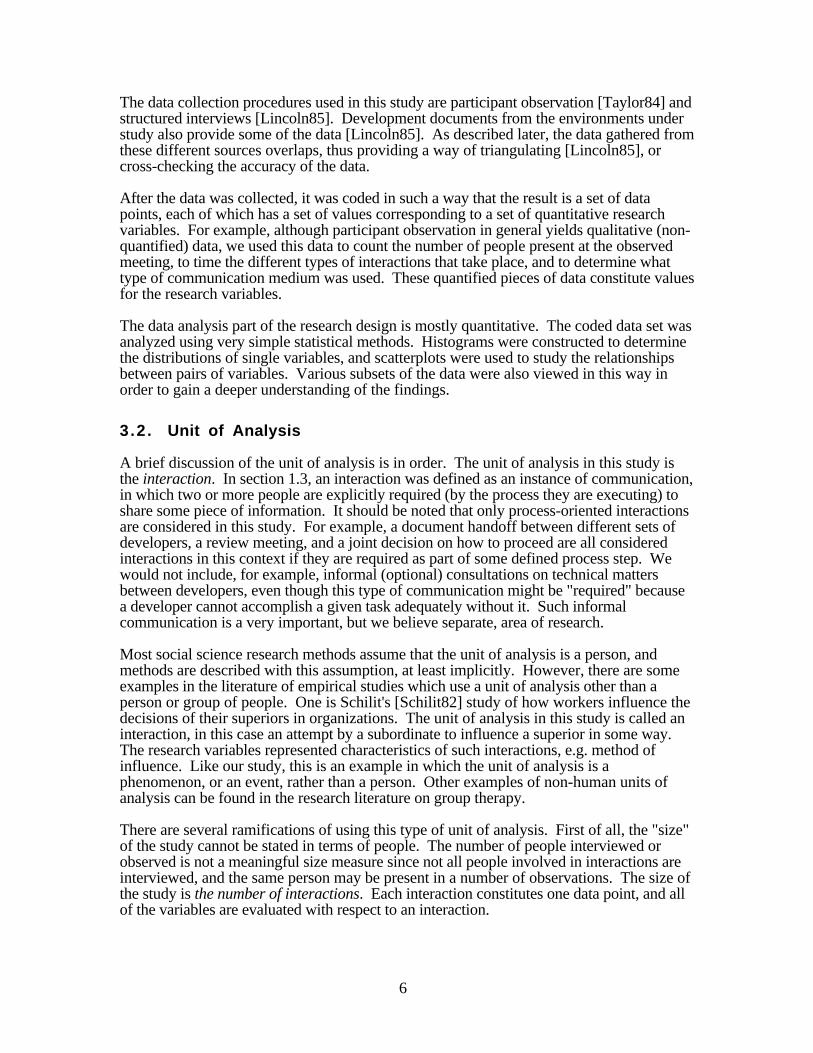
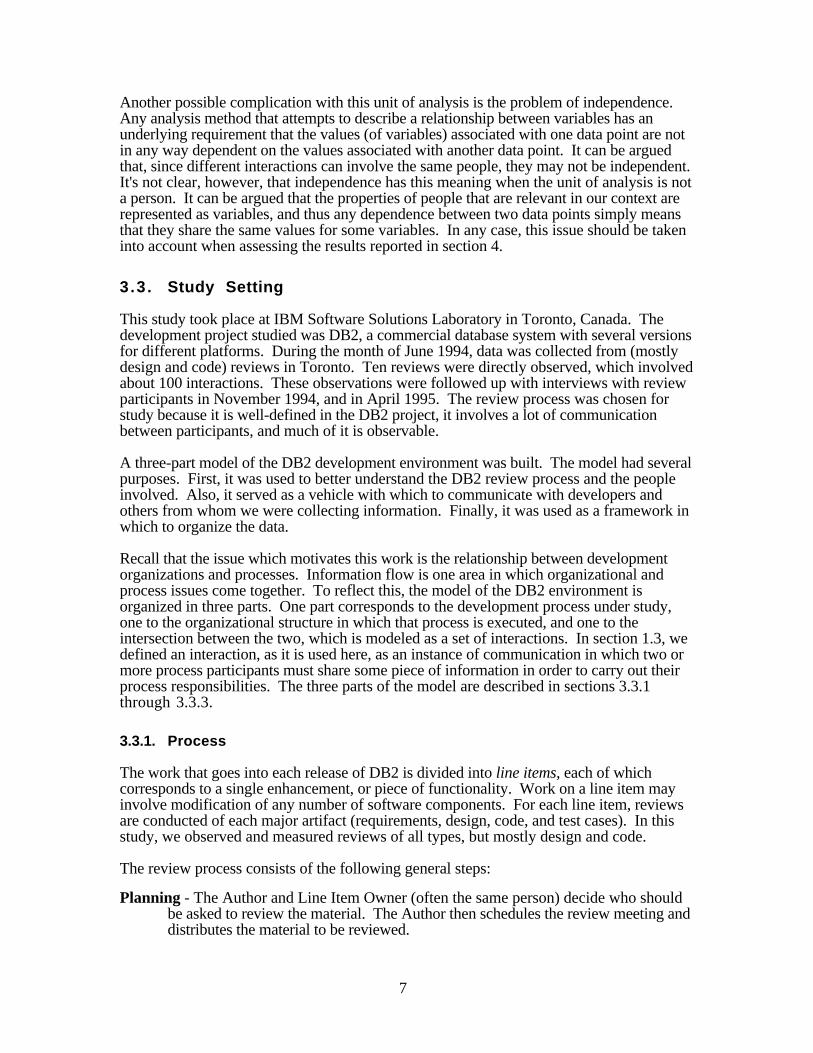
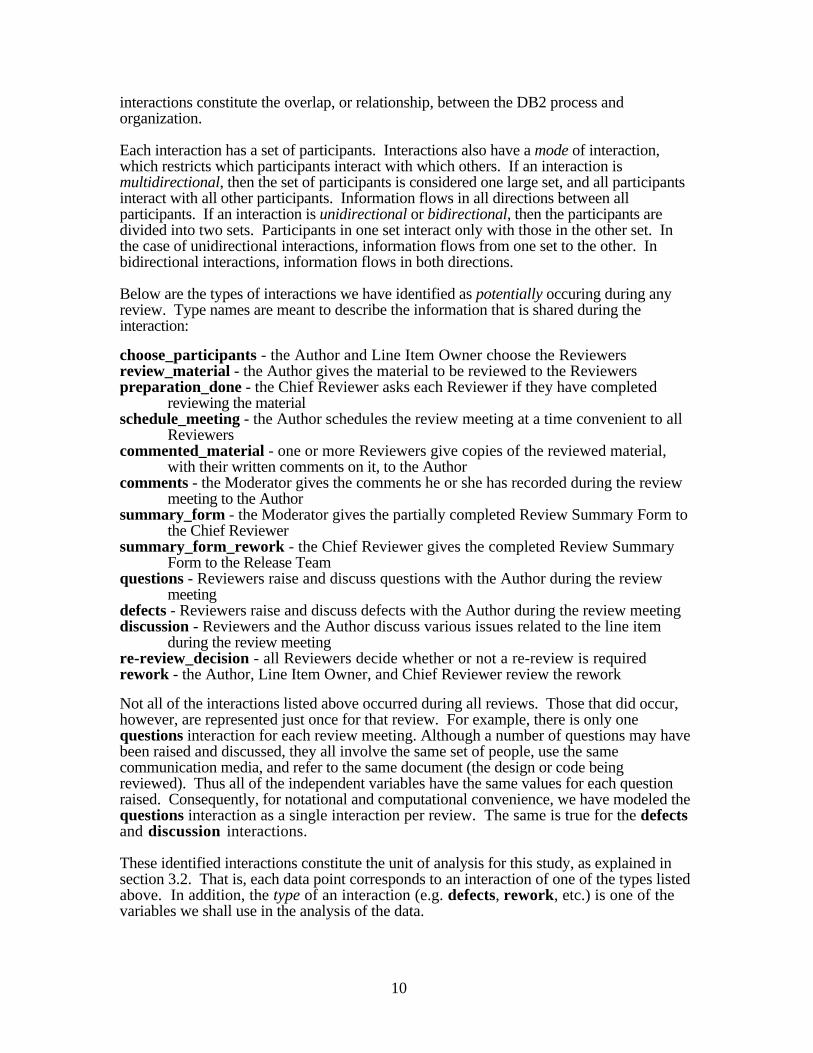
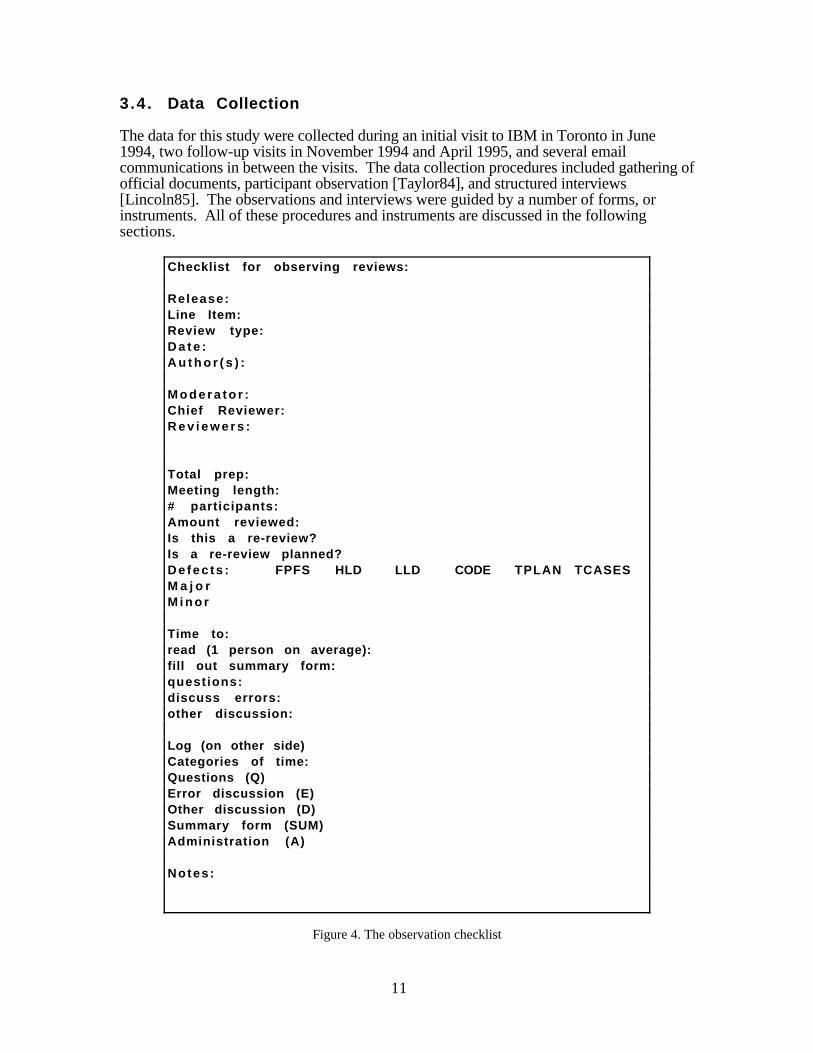
relevant to the development process in some way. The edges or groupings show differentrelationships between the members of the organization. One graph (an example appears inFigure 1) shows the reporting relationships, and is derived from the official organizationchart. Note that the reporting structure need not be strictly hierarchical, and officialrelationships other than the traditional manager/employee relationship can be represented(e.g., the "Task Leader"). Another (Figure 2) shows the same organization memberslinked together according to work patterns. Those people that work together on a regularbasis and are familiar with each others' work are linked or grouped. A third graph reflectsthe physical locations of the members of the organization (Figure 3). People who shareoffices, corridors, buildings, and sites are grouped with different types of boxes. Thesegraphs are used to measure several properties of the relationships between organizationalmembers (see section 3.5).
Development Manager
TechnicalManager
ProductManager
SupportManagerTechnical
Manager
Task Leader
DeveloperDeveloper
Developer
DeveloperDeveloper
Figure 2. Example working relationships.
Development Manager
TechnicalManager
ProductManager
SupportManager
TechnicalManager
DeveloperDeveloper
Developer
DeveloperDeveloper
TaskLeader
Figure 3. Example physical proximity relationships
3.3.3. Interactions
The third part of the model of the DB2 environment is made up of the types of interactions,or instances of communication, that are both dictated by the defined software developmentprocess and that actually take place, between members of the organization. These
10
interactions constitute the overlap, or relationship, between the DB2 process andorganization.
Each interaction has a set of participants. Interactions also have a mode of interaction,which restricts which participants interact with which others. If an interaction ismultidirectional, then the set of participants is considered one large set, and all participantsinteract with all other participants. Information flows in all directions between allparticipants. If an interaction is unidirectional or bidirectional, then the participants aredivided into two sets. Participants in one set interact only with those in the other set. Inthe case of unidirectional interactions, information flows from one set to the other. Inbidirectional interactions, information flows in both directions.
Below are the types of interactions we have identified as potentially occuring during anyreview. Type names are meant to describe the information that is shared during theinteraction:
choose_participants - the Author and Line Item Owner choose the Reviewersreview_material - the Author gives the material to be reviewed to the Reviewerspreparation_done - the Chief Reviewer asks each Reviewer if they have completed
reviewing the materialschedule_meeting - the Author schedules the review meeting at a time convenient to all
Reviewerscommented_material - one or more Reviewers give copies of the reviewed material,
with their written comments on it, to the Authorcomments - the Moderator gives the comments he or she has recorded during the review
meeting to the Authorsummary_form - the Moderator gives the partially completed Review Summary Form to
the Chief Reviewersummary_form_rework - the Chief Reviewer gives the completed Review Summary
Form to the Release Teamquestions - Reviewers raise and discuss questions with the Author during the review
meetingdefects - Reviewers raise and discuss defects with the Author during the review meetingdiscussion - Reviewers and the Author discuss various issues related to the line item
during the review meetingre-review_decision - all Reviewers decide whether or not a re-review is requiredrework - the Author, Line Item Owner, and Chief Reviewer review the rework
Not all of the interactions listed above occurred during all reviews. Those that did occur,however, are represented just once for that review. For example, there is only onequestions interaction for each review meeting. Although a number of questions may havebeen raised and discussed, they all involve the same set of people, use the samecommunication media, and refer to the same document (the design or code beingreviewed). Thus all of the independent variables have the same values for each questionraised. Consequently, for notational and computational convenience, we have modeled thequestions interaction as a single interaction per review. The same is true for the defectsand discussion interactions.
These identified interactions constitute the unit of analysis for this study, as explained insection 3.2. That is, each data point corresponds to an interaction of one of the types listedabove. In addition, the type of an interaction (e.g. defects, rework, etc.) is one of thevariables we shall use in the analysis of the data.
11
3.4. Data Collection
The data for this study were collected during an initial visit to IBM in Toronto in June1994, two follow-up visits in November 1994 and April 1995, and several emailcommunications in between the visits. The data collection procedures included gathering ofofficial documents, participant observation [Taylor84], and structured interviews[Lincoln85]. The observations and interviews were guided by a number of forms, orinstruments. All of these procedures and instruments are discussed in the followingsections.
Checklist for observing reviews:
Release:Line Item:Review type:D a t e :A u t h o r ( s ) :
M o d e r a t o r :Chief Reviewer:R e v i e w e r s :
Total prep:Meeting length:# participants:Amount reviewed:Is this a re-review?Is a re-review planned?Defec ts : FPFS HLD LLD CODE TPLAN TCASESM a j o rM i n o r
Time to:read (1 person on average):fill out summary form:questions:discuss errors:other discussion:
Log (on other side)Categories of time:Questions (Q)Error discussion (E)Other discussion (D)Summary form (SUM)Administration (A)
Notes:
Figure 4. The observation checklist
12
3.4.1. Documents
The official documents of an organization are valuable sources of information because theyare relatively available, stable, rich, and non-reactive, at least in comparison to human datasources [Lincoln85]. The model of the DB2 environment (described in section 3.3) reliedinitially on two confidential IBM documents, a review process document and the officialorganization chart.Other documents which provided data later were copies of the Review Summary Forms foreach review that was observed. Most of the information on these forms had already beencollected during the observations of the reviews, so the forms served as a validation(triangulation) instrument.
3.4.2. Observations
Participant observation, as defined in [Taylor84], refers to "research that involves socialinteraction between the researcher and informants in the milieu of the latter, during whichdata are systematically and unobtrusively collected." Examples of studies based onparticipant observation are found in [Barley90, Perry94, Sandelowski92, Sullivan85]. Inthese examples, observations were conducted in the subjects' workplaces, homes, andtherapists' offices. The idea, in all these cases, was to capture firsthand behaviors andinteractions that might not be noticed otherwise.
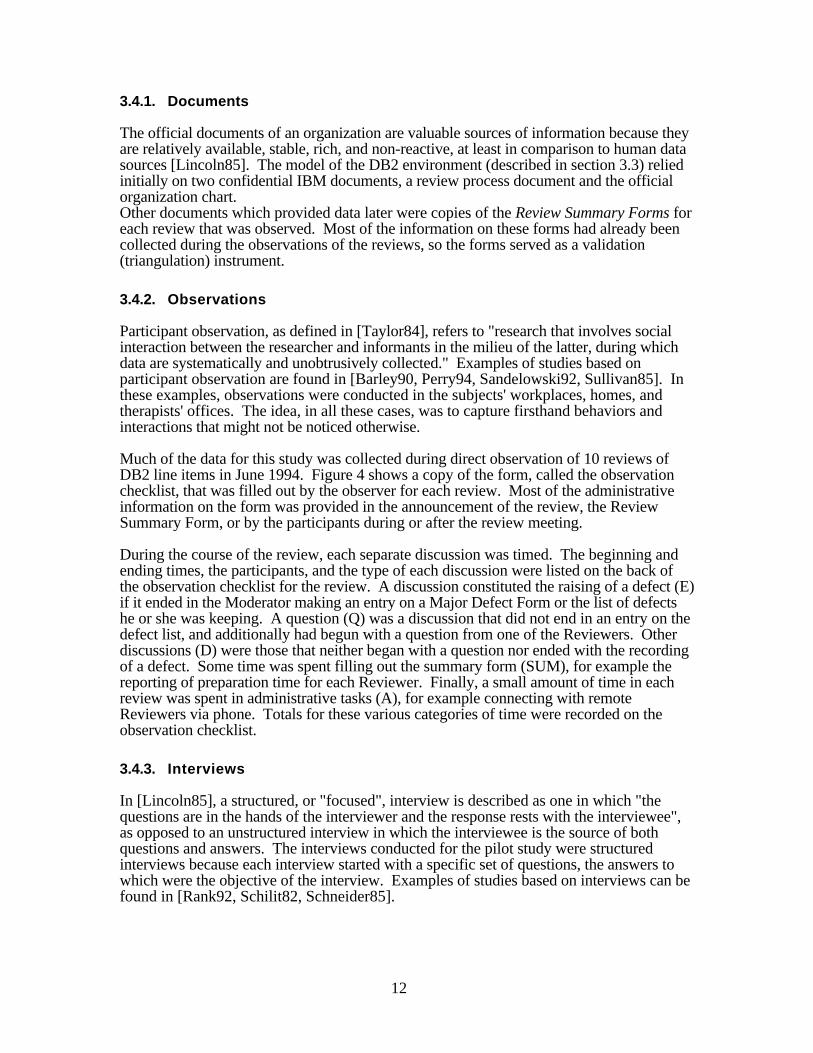
Much of the data for this study was collected during direct observation of 10 reviews ofDB2 line items in June 1994. Figure 4 shows a copy of the form, called the observationchecklist, that was filled out by the observer for each review. Most of the administrativeinformation on the form was provided in the announcement of the review, the ReviewSummary Form, or by the participants during or after the review meeting.
During the course of the review, each separate discussion was timed. The beginning andending times, the participants, and the type of each discussion were listed on the back ofthe observation checklist for the review. A discussion constituted the raising of a defect (E)if it ended in the Moderator making an entry on a Major Defect Form or the list of defectshe or she was keeping. A question (Q) was a discussion that did not end in an entry on thedefect list, and additionally had begun with a question from one of the Reviewers. Otherdiscussions (D) were those that neither began with a question nor ended with the recordingof a defect. Some time was spent filling out the summary form (SUM), for example thereporting of preparation time for each Reviewer. Finally, a small amount of time in eachreview was spent in administrative tasks (A), for example connecting with remoteReviewers via phone. Totals for these various categories of time were recorded on theobservation checklist.
3.4.3. Interviews
In [Lincoln85], a structured, or "focused", interview is described as one in which "thequestions are in the hands of the interviewer and the response rests with the interviewee",as opposed to an unstructured interview in which the interviewee is the source of bothquestions and answers. The interviews conducted for the pilot study were structuredinterviews because each interview started with a specific set of questions, the answers towhich were the objective of the interview. Examples of studies based on interviews can befound in [Rank92, Schilit82, Schneider85].
13
Interview Guide for John Doe, MM/DD/YY
1. How much of your prep time is spent filling out the defect form? Recording minor defects?
2. How much time is taken up by scheduling and distributing materials?
3. How long was the followup meeting?
4. Do you work much with the other participants, aside from reviews?
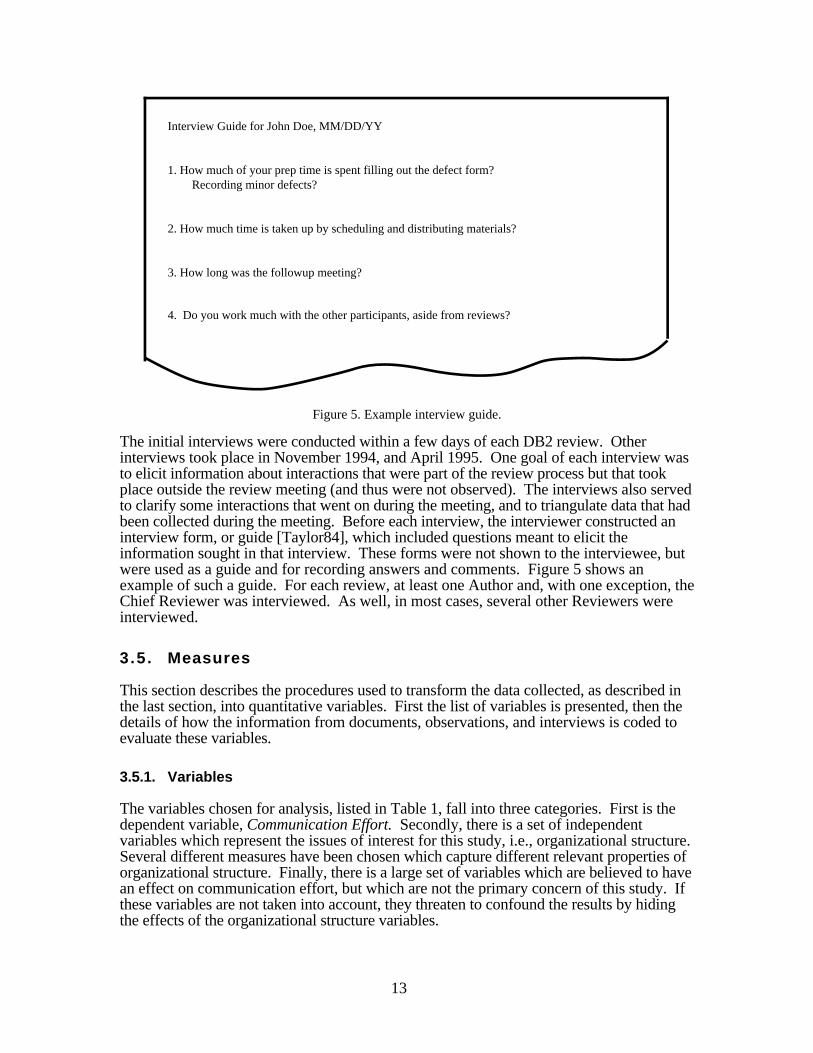
Figure 5. Example interview guide.
The initial interviews were conducted within a few days of each DB2 review. Otherinterviews took place in November 1994, and April 1995. One goal of each interview wasto elicit information about interactions that were part of the review process but that tookplace outside the review meeting (and thus were not observed). The interviews also servedto clarify some interactions that went on during the meeting, and to triangulate data that hadbeen collected during the meeting. Before each interview, the interviewer constructed aninterview form, or guide [Taylor84], which included questions meant to elicit theinformation sought in that interview. These forms were not shown to the interviewee, butwere used as a guide and for recording answers and comments. Figure 5 shows anexample of such a guide. For each review, at least one Author and, with one exception, theChief Reviewer was interviewed. As well, in most cases, several other Reviewers wereinterviewed.
3.5. Measures
This section describes the procedures used to transform the data collected, as described inthe last section, into quantitative variables. First the list of variables is presented, then thedetails of how the information from documents, observations, and interviews is coded toevaluate these variables.
3.5.1. Variables
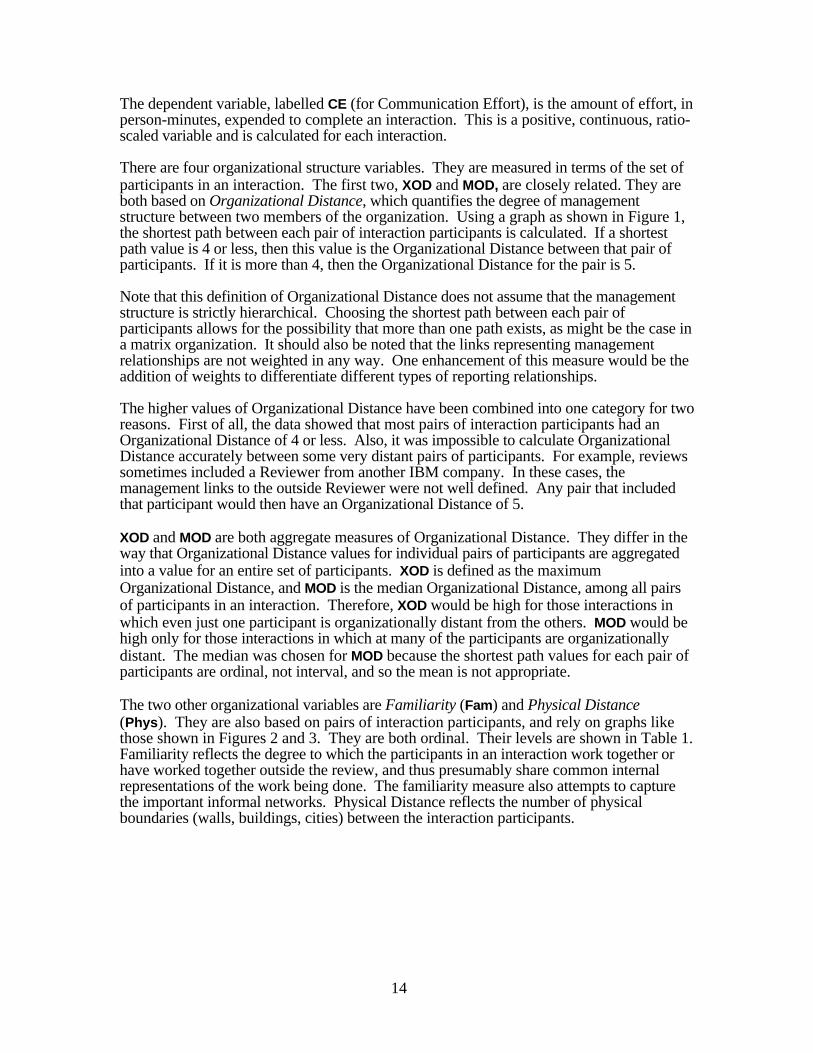
The variables chosen for analysis, listed in Table 1, fall into three categories. First is thedependent variable, Communication Effort. Secondly, there is a set of independentvariables which represent the issues of interest for this study, i.e., organizational structure.Several different measures have been chosen which capture different relevant properties oforganizational structure. Finally, there is a large set of variables which are believed to havean effect on communication effort, but which are not the primary concern of this study. Ifthese variables are not taken into account, they threaten to confound the results by hidingthe effects of the organizational structure variables.
14
The dependent variable, labelled CE (for Communication Effort), is the amount of effort, inperson-minutes, expended to complete an interaction. This is a positive, continuous, ratio-scaled variable and is calculated for each interaction.
There are four organizational structure variables. They are measured in terms of the set ofparticipants in an interaction. The first two, XOD and MOD, are closely related. They areboth based on Organizational Distance, which quantifies the degree of managementstructure between two members of the organization. Using a graph as shown in Figure 1,the shortest path between each pair of interaction participants is calculated. If a shortestpath value is 4 or less, then this value is the Organizational Distance between that pair ofparticipants. If it is more than 4, then the Organizational Distance for the pair is 5.
Note that this definition of Organizational Distance does not assume that the managementstructure is strictly hierarchical. Choosing the shortest path between each pair ofparticipants allows for the possibility that more than one path exists, as might be the case ina matrix organization. It should also be noted that the links representing managementrelationships are not weighted in any way. One enhancement of this measure would be theaddition of weights to differentiate different types of reporting relationships.
The higher values of Organizational Distance have been combined into one category for tworeasons. First of all, the data showed that most pairs of interaction participants had anOrganizational Distance of 4 or less. Also, it was impossible to calculate OrganizationalDistance accurately between some very distant pairs of participants. For example, reviewssometimes included a Reviewer from another IBM company. In these cases, themanagement links to the outside Reviewer were not well defined. Any pair that includedthat participant would then have an Organizational Distance of 5.
XOD and MOD are both aggregate measures of Organizational Distance. They differ in theway that Organizational Distance values for individual pairs of participants are aggregatedinto a value for an entire set of participants. XOD is defined as the maximumOrganizational Distance, and MOD is the median Organizational Distance, among all pairsof participants in an interaction. Therefore, XOD would be high for those interactions inwhich even just one participant is organizationally distant from the others. MOD would behigh only for those interactions in which at many of the participants are organizationallydistant. The median was chosen for MOD because the shortest path values for each pair ofparticipants are ordinal, not interval, and so the mean is not appropriate.
The two other organizational variables are Familiarity (Fam) and Physical Distance(Phys). They are also based on pairs of interaction participants, and rely on graphs likethose shown in Figures 2 and 3. They are both ordinal. Their levels are shown in Table 1.Familiarity reflects the degree to which the participants in an interaction work together orhave worked together outside the review, and thus presumably share common internalrepresentations of the work being done. The familiarity measure also attempts to capturethe important informal networks. Physical Distance reflects the number of physicalboundaries (walls, buildings, cities) between the interaction participants.
15
LevelsVariable Name Label Code M e a n i n g Data Source(s)
Communication Effort(ratio)
CE - amount of effort, in person-minutes, expended to complete theinteraction
observations; 6/94 and5/95 interviews;Review Summary Forms
Organizational Distance(ordinal)
MOD 1-4 value of the median shortest pathbetween participants inmanagement structure if it isbetween 1 and 4
organization charts;observations; 6/94 and5/95 interviews
5 value of the median shortest pathbetween participants inmanagement structure if it isgreater than 4
XOD 1-4 value of the maximum shortestpath between participants inmanagement structure if it isbetween 1 and 4
organization charts;observations; 6/94 and5/95 interviews
5 value of the maximum shortestpath between participants inmanagement structure if it isgreater than 4
Familiarity(ordinal)
Fam 1 pairs of participants who arefamiliar with each others' work<= 10%
6/94 and 5/95interviews
2 10% < pairs of participants whoare familiar with each others' work<= 20%
3 20% < pairs of participants whoare familiar with each others' work<= 50%
4 pairs of participants who arefamiliar with each others' work> 50%
Physical Distance Phys 1 all participants in same office observations;(ordinal) 2 all participants on same corridor,
but not all in same officeonline directory;5/95 interviews
3 all participants in Toronto but notall on same corridor
4 at least one pair of participants atdifferent sites
Number of Participants(absolute)
N - number of people participating inan interaction
observations; ReviewSummary Forms
Skill Level K 1 low 11/94 interviews(ordinal) 2 medium
3 highRequest Medium Mr 0 no request made observation; 5/95(nominal) 1 verbal request interviews
2 electronic requestPreparation Medium Mp 1 a written, paper form observation; 5/95(nominal) 2 verbal, with no notes shared interviews
3 a brief written message4 a structured written document5 an unstructured written document
Transfer Medium Mt 1 face-to-face meeting observation; 5/95(nominal) 2 conference call interviews
3 video conference4 electronic transfer5 paper6 2-way phone call
16
LevelsVariable Name Label Code M e a n i n g Data Source(s)
Information size Size 1 very small observation; 6/94(ordinal) 2 <= 3 pages interviews; Review
3 < 1 KLOC or 4-9 pages Summary Forms4 1-2 KLOC or 10-25 pages5 > 2 KLOC or > 25 pages
Technicality Tech 1 non-technical dictated by type of(ordinal) 2 mixed interaction
3 technicalComplexity Comp 1 very easy 6/94 interviews(ordinal) 2 easier than average
3 average4 more difficult than average5 very difficult
Structure Struct 1 highly structured observation(ordinal) 2 mixed
3 unstructuredInformation Use Use 1 informational dictated by type of(nominal) 2 decisional interaction
3 directional4 functional
Interaction Type Type see Section 3.3.3
Table 1. Variables used in this study
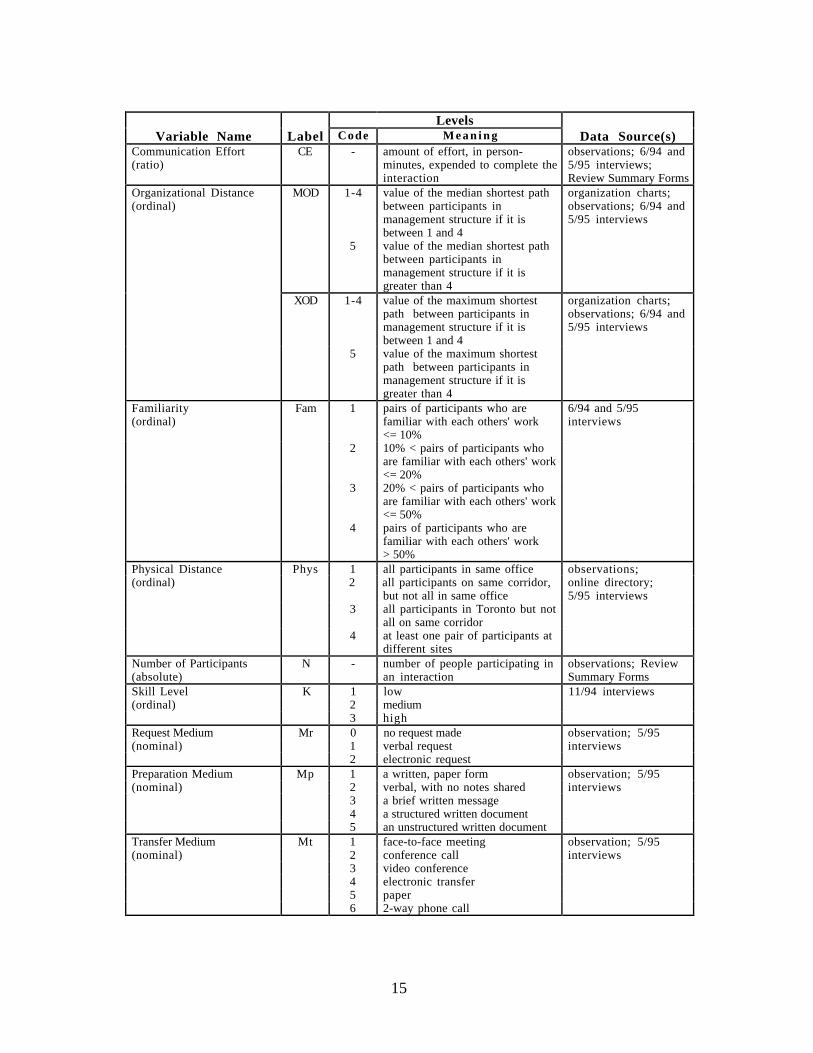
The set of blocking variables is large. The first is the size of the set of interactionparticipants. This variable, labelled N, is simply the number of people who expend effortin an interaction.
Another blocking variable is skill level, K. This variable reflects the level of skillpossessed by the person most responsible for an activity, relative to the skills required tocomplete the activity. The assumption is that the more skilled a person is, the less he or shewill depend on other people, and consequently the less time he or she will spend incommunication. Many very simple interactions have a high (3) value for K, because suchinteractions do not require much skill. For other interactions, which are more technical innature, K is set equal to the skill level of the Chief Reviewer.
We also wish to block according to the type of communication media used in an interaction.Three different parts of an interaction have been identified that require (potentially different)communication media. The first is the medium used to request information. Since manyinteractions involve unsolicited information, there is no request and thus no medium forthis purpose. In the interactions we studied, when such a request was made, it was madeeither verbally or via email. Thus this variable, labelled Mr, is coded as either a 0 (n/a), 1(verbal), or 2 (email).
The second part of an interaction which is affected by the choice of communication mediumis the preparation of the information to be shared. In the interactions studied, informationwas prepared in one of five different ways. Some information required simply thecompletion of a paper form. Other information was to be shared verbally, and requiredonly that the sender prepare his or her thoughts. In this case, written notes might beprepared, but were not shared with other participants in the interaction. The thirdpreparation medium is the writing of a brief, informal message. Fourth is the preparationof a formal document which follows a defined format and structure. Finally, someinteractions required the information in the form of an unstructured document. The
17
blocking variable Mp, the medium used to prepare the information to be shared, is coded asa 1 (form), 2 (verbal), 3 (message), 4 (structured document), or 5 (unstructureddocument).
Finally, an interaction requires a communication medium to transfer the informationbetween participants. The "transfer" media that were used in the interactions studied wereface-to-face meetings, conference calls, video conferences, electronic transfer (email, ftp,etc.), paper, and normal phone calls. These values of the variable, labelled Mt are codedwith numbers 1 through 6, respectively.
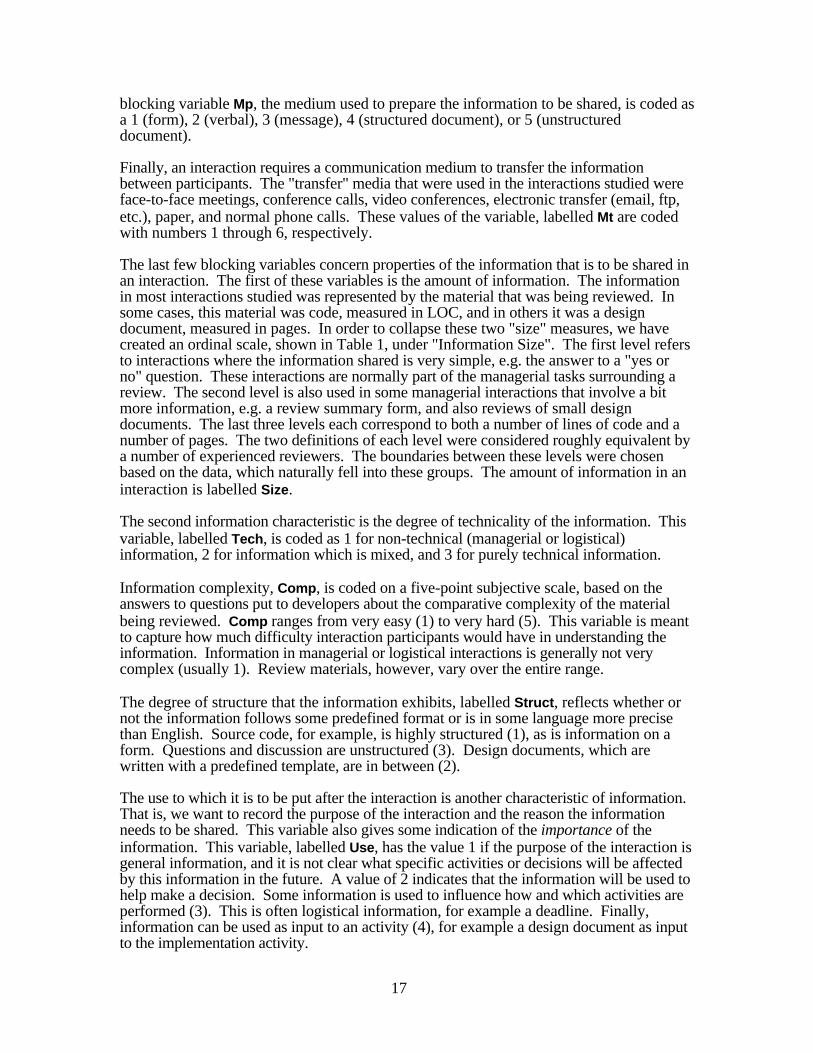
The last few blocking variables concern properties of the information that is to be shared inan interaction. The first of these variables is the amount of information. The informationin most interactions studied was represented by the material that was being reviewed. Insome cases, this material was code, measured in LOC, and in others it was a designdocument, measured in pages. In order to collapse these two "size" measures, we havecreated an ordinal scale, shown in Table 1, under "Information Size". The first level refersto interactions where the information shared is very simple, e.g. the answer to a "yes orno" question. These interactions are normally part of the managerial tasks surrounding areview. The second level is also used in some managerial interactions that involve a bitmore information, e.g. a review summary form, and also reviews of small designdocuments. The last three levels each correspond to both a number of lines of code and anumber of pages. The two definitions of each level were considered roughly equivalent bya number of experienced reviewers. The boundaries between these levels were chosenbased on the data, which naturally fell into these groups. The amount of information in aninteraction is labelled Size.
The second information characteristic is the degree of technicality of the information. Thisvariable, labelled Tech, is coded as 1 for non-technical (managerial or logistical)information, 2 for information which is mixed, and 3 for purely technical information.
Information complexity, Comp, is coded on a five-point subjective scale, based on theanswers to questions put to developers about the comparative complexity of the materialbeing reviewed. Comp ranges from very easy (1) to very hard (5). This variable is meantto capture how much difficulty interaction participants would have in understanding theinformation. Information in managerial or logistical interactions is generally not verycomplex (usually 1). Review materials, however, vary over the entire range.
The degree of structure that the information exhibits, labelled Struct, reflects whether ornot the information follows some predefined format or is in some language more precisethan English. Source code, for example, is highly structured (1), as is information on aform. Questions and discussion are unstructured (3). Design documents, which arewritten with a predefined template, are in between (2).
The use to which it is to be put after the interaction is another characteristic of information.That is, we want to record the purpose of the interaction and the reason the informationneeds to be shared. This variable also gives some indication of the importance of theinformation. This variable, labelled Use, has the value 1 if the purpose of the interaction isgeneral information, and it is not clear what specific activities or decisions will be affectedby this information in the future. A value of 2 indicates that the information will be used tohelp make a decision. Some information is used to influence how and which activities areperformed (3). This is often logistical information, for example a deadline. Finally,information can be used as input to an activity (4), for example a design document as inputto the implementation activity.
18
Finally, we will use the type of interaction, Type, as a variable later in our analysis. Thetype of an interaction is related to the step of the process it is part of and the informationinvolved. The types of interactions for this study were identified during construction of thethree-part model presented in section 3.3. The list of interaction types is presented insection 3.3.3.
3.5.2. Coding
Recall that each review has associated with it a set of interactions, each of which has avalue for every variable. Thus, there is an instance of each variable for each interaction ineach review. The values of some independent variables are completely determined by thetype of interaction. That is, some variables have the same value for every interaction of acertain type, regardless of which review it is part of. The values of these variables aredictated by the way that interactions have been modeled. For other variables and otherinteractions, the values vary over different reviews. This information is summarized inTable 1.
The dependent variable, CE, was coded by combining several pieces of data, depending onthe interaction. Recall that CE for an interaction is defined as the total amount of effortexpended on that interaction, from the initial request for information through the reading (orotherwise digesting) of the information.
The effort for many interaction types (e.g. schedule_meeting, choose_participantsand preparation_done) is straightforwardly gathered from interviews. In many cases,the effort information gathered in interviews reflects the amount of time just one of theparticipants spent in the interaction, so the value must be multiplied by the number ofparticipants.
The effort for the interactions which take place during the review meeting is actuallyobserved and timed. These values must also be multiplied by the number of people presentat the meeting. This is not always straightforward, as it was common for reviewers tocome and go during the course of the review meeting. Some of these interactions alsoinclude some of the preparation time (e.g. reviewers prepare the defects to be raised at themeeting ahead of time), so that is included in the calculation of CE.
Values of the organizational variables, Organizational Distance (XOD and MOD),Familiarity, and Physical Distance, are calculated directly from the graphs that make up theorganizational part of the model described in section 3.3.2. The scales used for thesevariables are shown in Table 1. These scales were derived from the data itself.
Most of the information used to evaluate the blocking variables was collected duringinterviews. Some blocking variables, however, were evaluated a priori according to thetype of interaction. For example, some interaction types always involve technicalinformation while others are concerned with purely managerial or logistical information.So the value of the variable T is constant for each type of interaction, regardless of anycharacteristic of individual reviews.
3.6. Data Analysis
The data to be analyzed consisted of 100 data points, each corresponding to a singleinteraction. Associated with each data point were values for each of the independent,
19
dependent, and blocking variables. In addition, we recorded for each data point what typeof interaction it corresponded to, which review that interaction was a part of, and the natureof the material being reviewed (code, design, etc.).
The data analysis involved the construction of histograms to display the distributions ofindividual variables, and scatterplots to illustrate the relationships between pairs ofvariables. Blocking variables were used in a limited way to explore whether or notrelationships between variables held under different conditions. Part of the analysis alsoinvolved blocking the data by interaction type.
Our analysis method basically consisted of creating subsets of data based on the values ofone or more variables, then creating histograms and scatterplots based on those subsets.The subsets of interactions that we analyzed are:
• the entire set of interactions• high effort interactions (CE>250 and CE>500)• technical interactions which take place during the review meeting (questions,
defects, and discussion).• by technicality• by complexity• by degree of structure• by size of information• by skill level• by number of participants• by interaction type• by line item• by combinations of the organizational variables (e.g. low Physical Distance and high
MOD)
For each of these subsets, a histogram showing the distribution of CE was generated, aswell as scatterplots showing the relationships between CE and each organizational variable(MOD, XOD, Physical Distance, and Familiarity). To test these relationships, Spearmancorrelation coefficients were calculated. In addition, the distributions of other variableswere analyzed for some of the subsets. For example, we looked at the distribution ofinteraction types among the high-effort interactions. Also, for both the data set as a wholeand for the high-effort interactions, we studied the distributions of all variables. Anothertwo-variable relationships that we explored with scatterplots is the relationship between CEand the number of participants (N). For this relationship, we grouped the data by line itemto see which line items required more Communication Effort overall, and which requiredmore effort per participant. We also ran ANOVAs (Analysis of Variance tests) on somecombinations of variables for some subsets, but there was not enough data to yieldmeaningful results. Mann-Whitney tests were also used to test some special hypothesesabout combined effects of Organizational Distance. The strongest and most interesting ofour findings are presented in the next section.
4. Results
The results of our study are presented in four subsections. First, we give an overallcharacterization of the data collected by looking at each variable in isolation. Then wepresent some findings concerning the relationships between the dependent variable(Communication Effort) and the various organizational independent variables. We callthese relationships "global" because they hold in the data set as a whole. In section 4.3, we
20
examine those interactions that required the most Communication Effort more closely.Finally, in section 4.4, we divide the data by type of interaction to see what patterns emergefor different types.
4 .1 Data Characterization
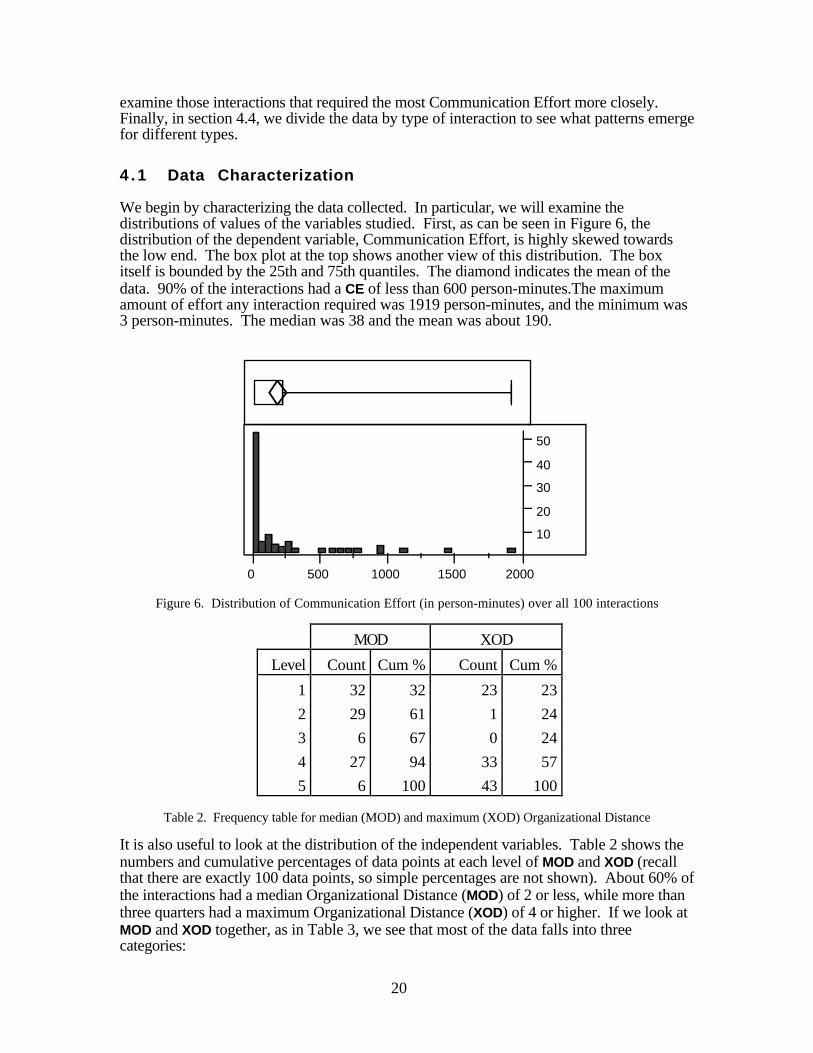
We begin by characterizing the data collected. In particular, we will examine thedistributions of values of the variables studied. First, as can be seen in Figure 6, thedistribution of the dependent variable, Communication Effort, is highly skewed towardsthe low end. The box plot at the top shows another view of this distribution. The boxitself is bounded by the 25th and 75th quantiles. The diamond indicates the mean of thedata. 90% of the interactions had a CE of less than 600 person-minutes.The maximumamount of effort any interaction required was 1919 person-minutes, and the minimum was3 person-minutes. The median was 38 and the mean was about 190.
10
20
30
40
50
0 500 1000 1500 2000
Figure 6. Distribution of Communication Effort (in person-minutes) over all 100 interactions
MOD XOD
Level Count Cum % Count Cum %
1 32 32 23 23
2 29 61 1 24
3 6 67 0 24
4 27 94 33 57
5 6 100 43 100
Table 2. Frequency table for median (MOD) and maximum (XOD) Organizational Distance
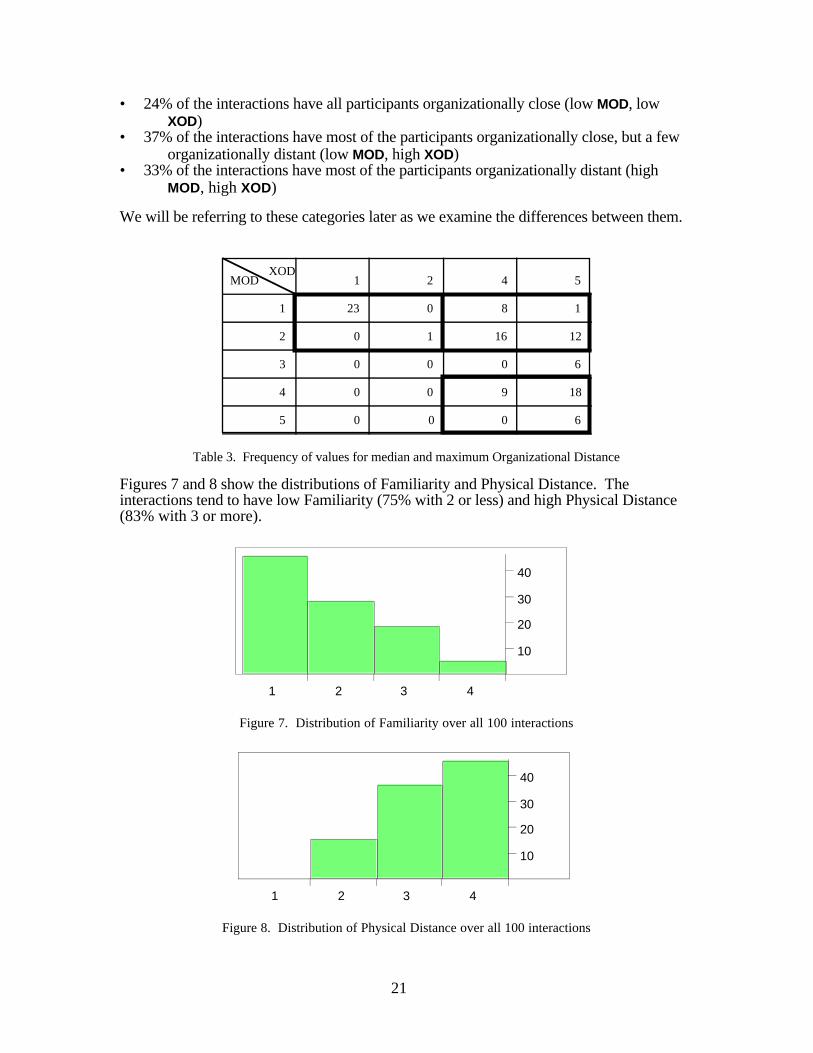
It is also useful to look at the distribution of the independent variables. Table 2 shows thenumbers and cumulative percentages of data points at each level of MOD and XOD (recallthat there are exactly 100 data points, so simple percentages are not shown). About 60% ofthe interactions had a median Organizational Distance (MOD) of 2 or less, while more thanthree quarters had a maximum Organizational Distance (XOD) of 4 or higher. If we look atMOD and XOD together, as in Table 3, we see that most of the data falls into threecategories:
21
• 24% of the interactions have all participants organizationally close (low MOD, lowXOD)
• 37% of the interactions have most of the participants organizationally close, but a feworganizationally distant (low MOD, high XOD)
• 33% of the interactions have most of the participants organizationally distant (highMOD, high XOD)
We will be referring to these categories later as we examine the differences between them.
MODXOD
1
2
3
4
5
5421
23
1
8
16
1
12
6
18
6
9
0
0
0
0
0
0
0
0
0
0
Table 3. Frequency of values for median and maximum Organizational Distance
Figures 7 and 8 show the distributions of Familiarity and Physical Distance. Theinteractions tend to have low Familiarity (75% with 2 or less) and high Physical Distance(83% with 3 or more).
10
20
30
40
1 2 3 4
Figure 7. Distribution of Familiarity over all 100 interactions
10
20
30
40
1 2 3 4
Figure 8. Distribution of Physical Distance over all 100 interactions
22
10
20
30
40
10
20
30
40
none verbal electronic
10
20
30
40
formwritten
verbal writtenmessage
documentstructured
unstructureddocument
meeting confcall
videoconf electronic
paper 2-waycall
Request Medium
Preparation Medium
Transfer Medium
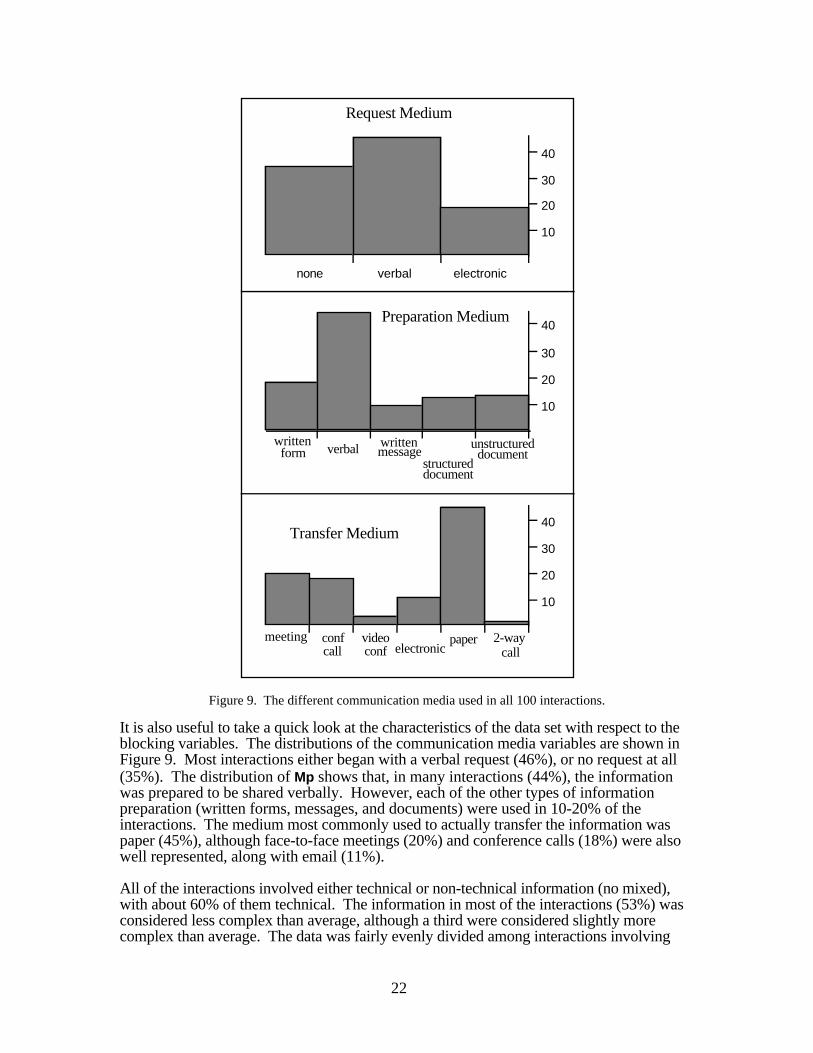
Figure 9. The different communication media used in all 100 interactions.
It is also useful to take a quick look at the characteristics of the data set with respect to theblocking variables. The distributions of the communication media variables are shown inFigure 9. Most interactions either began with a verbal request (46%), or no request at all(35%). The distribution of Mp shows that, in many interactions (44%), the informationwas prepared to be shared verbally. However, each of the other types of informationpreparation (written forms, messages, and documents) were used in 10-20% of theinteractions. The medium most commonly used to actually transfer the information waspaper (45%), although face-to-face meetings (20%) and conference calls (18%) were alsowell represented, along with email (11%).
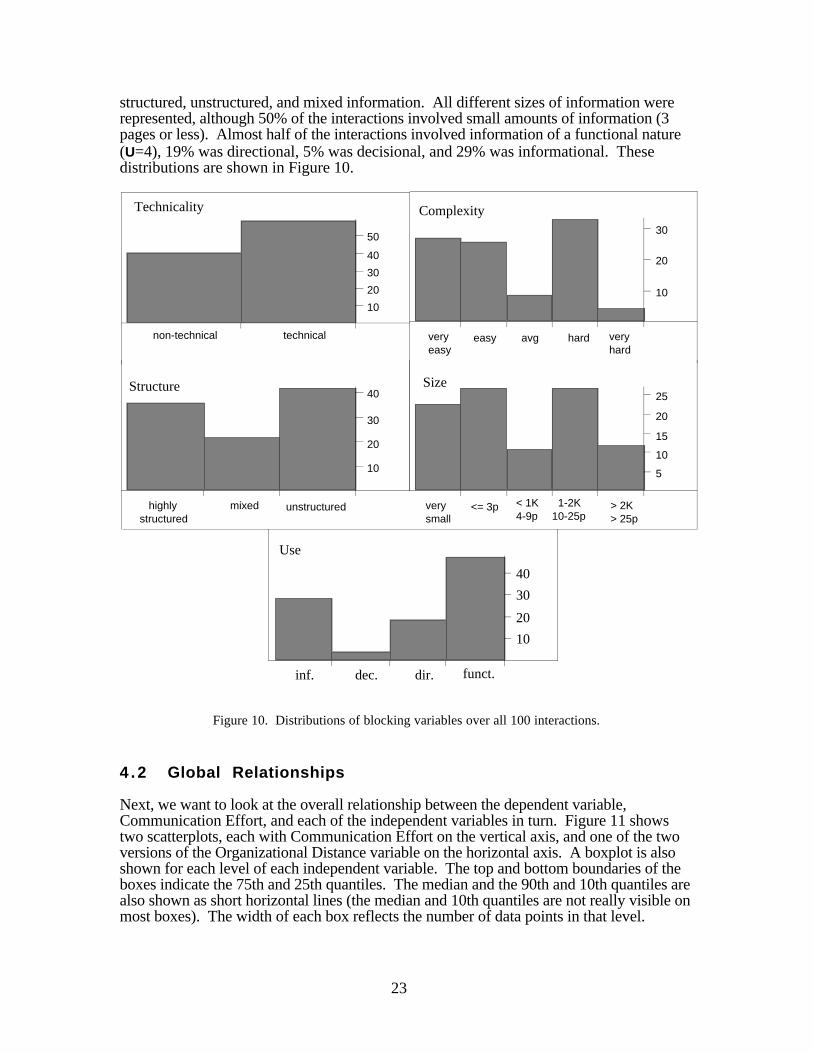
All of the interactions involved either technical or non-technical information (no mixed),with about 60% of them technical. The information in most of the interactions (53%) wasconsidered less complex than average, although a third were considered slightly morecomplex than average. The data was fairly evenly divided among interactions involving
23
structured, unstructured, and mixed information. All different sizes of information wererepresented, although 50% of the interactions involved small amounts of information (3pages or less). Almost half of the interactions involved information of a functional nature(U=4), 19% was directional, 5% was decisional, and 29% was informational. Thesedistributions are shown in Figure 10.
10
20
30
40
50
non-technical technical
10
20
30
veryeasy
easy avg hard veryhard
10
20
30
40
highlystructured
mixed unstructured
5
10
15
20
25
verysmall
<= 3p < 1K4-9p
1-2K10-25p
> 2K> 25p
10
20
30
40
inf. dec. dir. funct.
Size
Use
Structure
ComplexityTechnicality
Figure 10. Distributions of blocking variables over all 100 interactions.
4 .2 Global Relationships
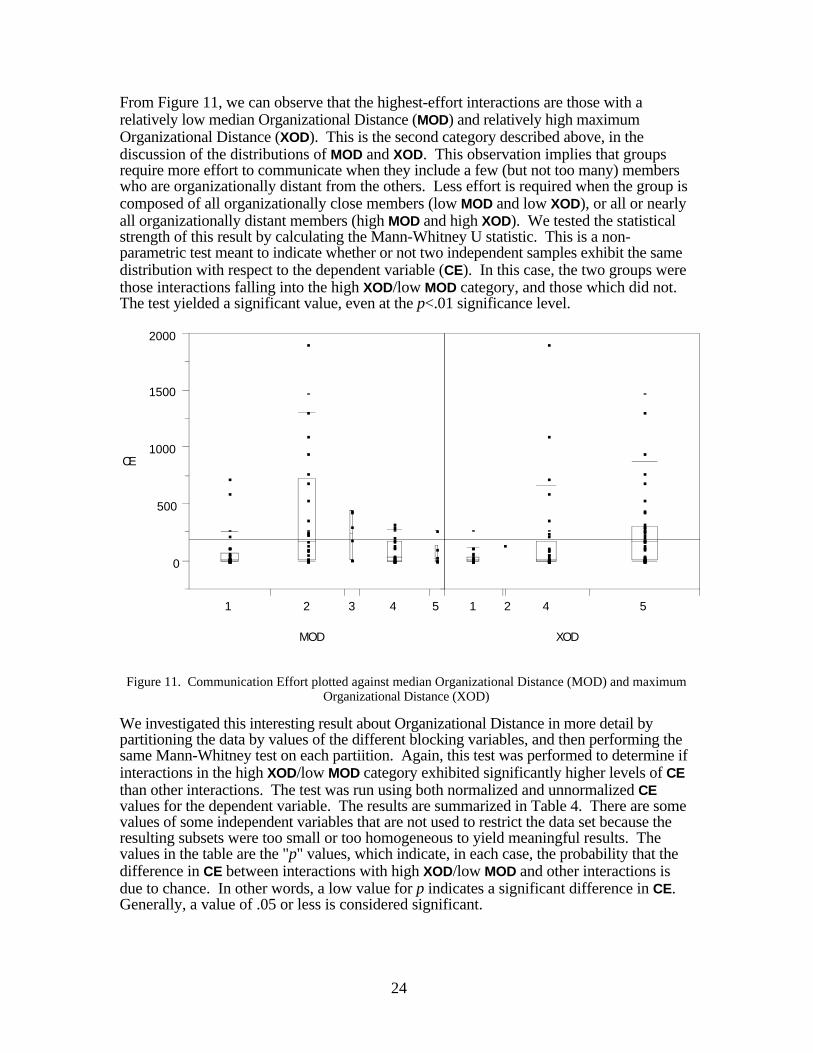
Next, we want to look at the overall relationship between the dependent variable,Communication Effort, and each of the independent variables in turn. Figure 11 showstwo scatterplots, each with Communication Effort on the vertical axis, and one of the twoversions of the Organizational Distance variable on the horizontal axis. A boxplot is alsoshown for each level of each independent variable. The top and bottom boundaries of theboxes indicate the 75th and 25th quantiles. The median and the 90th and 10th quantiles arealso shown as short horizontal lines (the median and 10th quantiles are not really visible onmost boxes). The width of each box reflects the number of data points in that level.
24
From Figure 11, we can observe that the highest-effort interactions are those with arelatively low median Organizational Distance (MOD) and relatively high maximumOrganizational Distance (XOD). This is the second category described above, in thediscussion of the distributions of MOD and XOD. This observation implies that groupsrequire more effort to communicate when they include a few (but not too many) memberswho are organizationally distant from the others. Less effort is required when the group iscomposed of all organizationally close members (low MOD and low XOD), or all or nearlyall organizationally distant members (high MOD and high XOD). We tested the statisticalstrength of this result by calculating the Mann-Whitney U statistic. This is a non-parametric test meant to indicate whether or not two independent samples exhibit the samedistribution with respect to the dependent variable (CE). In this case, the two groups werethose interactions falling into the high XOD/low MOD category, and those which did not.The test yielded a significant value, even at the p<.01 significance level.
CE
0
500
1000
1500
2000
1 2 3 4 5
MOD
1 2 4 5
XOD
Figure 11. Communication Effort plotted against median Organizational Distance (MOD) and maximumOrganizational Distance (XOD)
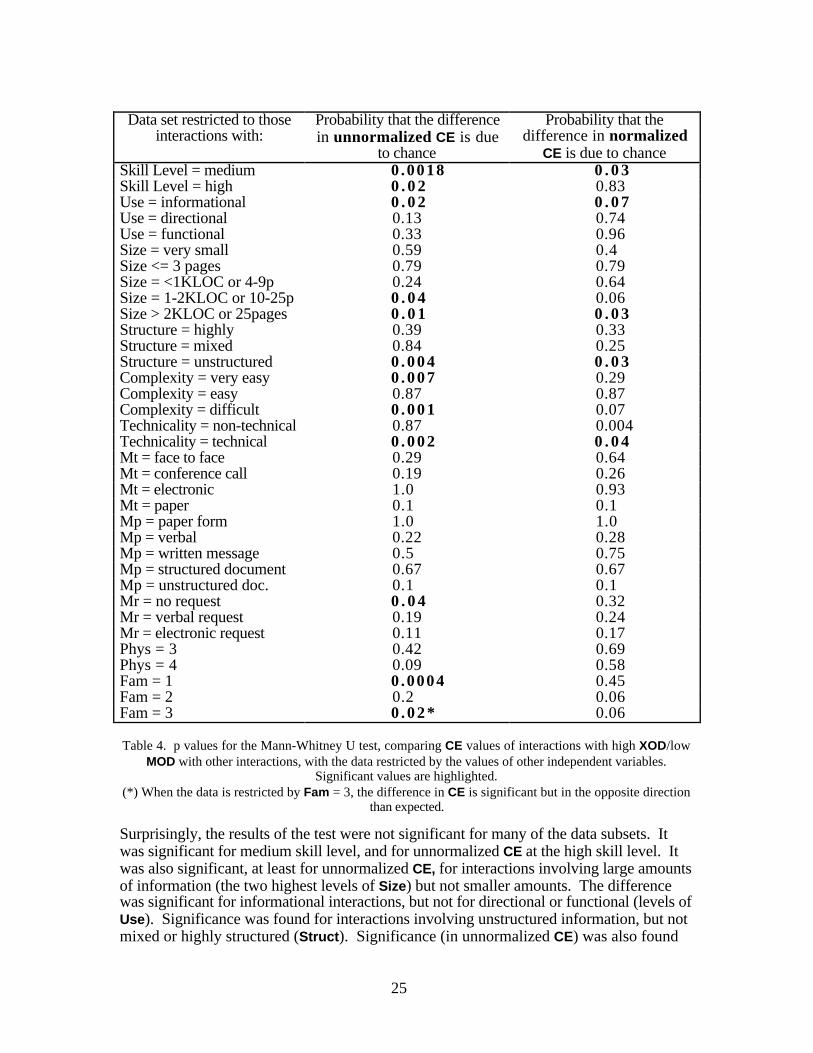
We investigated this interesting result about Organizational Distance in more detail bypartitioning the data by values of the different blocking variables, and then performing thesame Mann-Whitney test on each partiition. Again, this test was performed to determine ifinteractions in the high XOD/low MOD category exhibited significantly higher levels of CEthan other interactions. The test was run using both normalized and unnormalized CEvalues for the dependent variable. The results are summarized in Table 4. There are somevalues of some independent variables that are not used to restrict the data set because theresulting subsets were too small or too homogeneous to yield meaningful results. Thevalues in the table are the "p" values, which indicate, in each case, the probability that thedifference in CE between interactions with high XOD/low MOD and other interactions isdue to chance. In other words, a low value for p indicates a significant difference in CE.Generally, a value of .05 or less is considered significant.
25
Data set restricted to thoseinteractions with:
Probability that the differencein unnormalized CE is due
to chance
Probability that thedifference in normalized
CE is due to chanceSkill Level = medium 0 .0018 0 . 0 3Skill Level = high 0 . 0 2 0.83Use = informational 0 . 0 2 0 . 0 7Use = directional 0.13 0.74Use = functional 0.33 0.96Size = very small 0.59 0.4Size <= 3 pages 0.79 0.79Size = <1KLOC or 4-9p 0.24 0.64Size = 1-2KLOC or 10-25p 0 . 0 4 0.06Size > 2KLOC or 25pages 0 . 0 1 0 . 0 3Structure = highly 0.39 0.33Structure = mixed 0.84 0.25Structure = unstructured 0 .004 0 . 0 3Complexity = very easy 0 .007 0.29Complexity = easy 0.87 0.87Complexity = difficult 0 .001 0.07Technicality = non-technical 0.87 0.004Technicality = technical 0 .002 0 . 0 4Mt = face to face 0.29 0.64Mt = conference call 0.19 0.26Mt = electronic 1.0 0.93Mt = paper 0.1 0.1Mp = paper form 1.0 1.0Mp = verbal 0.22 0.28Mp = written message 0.5 0.75Mp = structured document 0.67 0.67Mp = unstructured doc. 0.1 0.1Mr = no request 0 . 0 4 0.32Mr = verbal request 0.19 0.24Mr = electronic request 0.11 0.17Phys = 3 0.42 0.69Phys = 4 0.09 0.58Fam = 1 0 .0004 0.45Fam = 2 0.2 0.06Fam = 3 0 .02* 0.06
Table 4. p values for the Mann-Whitney U test, comparing CE values of interactions with high XOD/lowMOD with other interactions, with the data restricted by the values of other independent variables.
Significant values are highlighted.(*) When the data is restricted by Fam = 3, the difference in CE is significant but in the opposite direction
than expected.
Surprisingly, the results of the test were not significant for many of the data subsets. Itwas significant for medium skill level, and for unnormalized CE at the high skill level. Itwas also significant, at least for unnormalized CE, for interactions involving large amountsof information (the two highest levels of Size) but not smaller amounts. The differencewas significant for informational interactions, but not for directional or functional (levels ofUse). Significance was found for interactions involving unstructured information, but notmixed or highly structured (Struct). Significance (in unnormalized CE) was also found
26
for two different levels of complexity, "very easy" and "more difficult than average", butnot the others. Significance also held for technical interactions, but not administrativeones. Significance was not found for any individual levels of any of the communicationmedia variables, with one exception, nor for any levels of Physical Distance. Partitioningthe data by levels of the Familiarity variable produced some interesting results. The MannWhitney test found a significant difference in unnormalized CE for interactions with Famequal to 1, but not 2. For interactions with Fam equal to 3, the test was significant, but inthe opposite direction. That is, in this subset, interactions in the high XOD/low MODcategory exhibited significantly lower levels of unnormalized CE than other interactions.
This set of results is difficult to interpret. In general, interactions which have high XODand low MOD will require more communication effort. However, the effect ofOrganizational Distance may be overshadowed by the effect of size, use, degree ofstructure, complexity, or technicality.
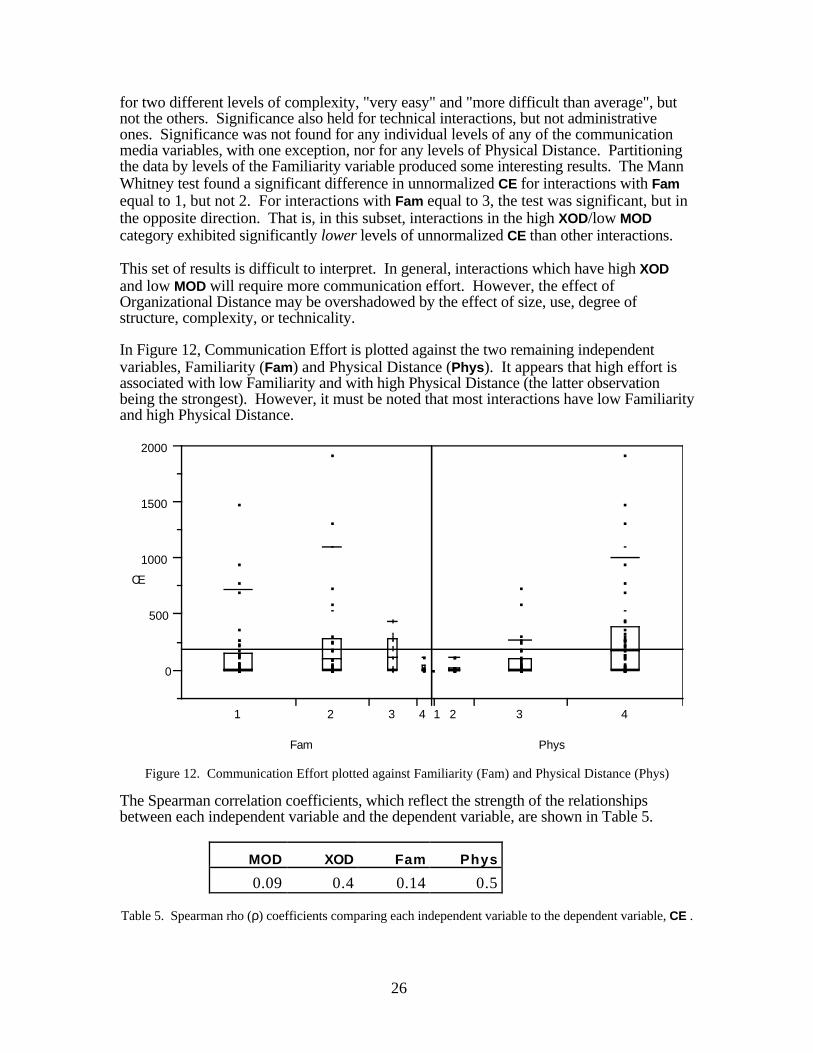
In Figure 12, Communication Effort is plotted against the two remaining independentvariables, Familiarity (Fam) and Physical Distance (Phys). It appears that high effort isassociated with low Familiarity and with high Physical Distance (the latter observationbeing the strongest). However, it must be noted that most interactions have low Familiarityand high Physical Distance.
CE
0
500
1000
1500
2000
1 2 3 4
Fam
1 2 3 4
Phys
Figure 12. Communication Effort plotted against Familiarity (Fam) and Physical Distance (Phys)
The Spearman correlation coefficients, which reflect the strength of the relationshipsbetween each independent variable and the dependent variable, are shown in Table 5.
MOD XOD Fam Phys
0.09 0.4 0.14 0.5
Table 5. Spearman rho (ρ) coefficients comparing each independent variable to the dependent variable, CE .
27
4 .3 High Effort Interactions
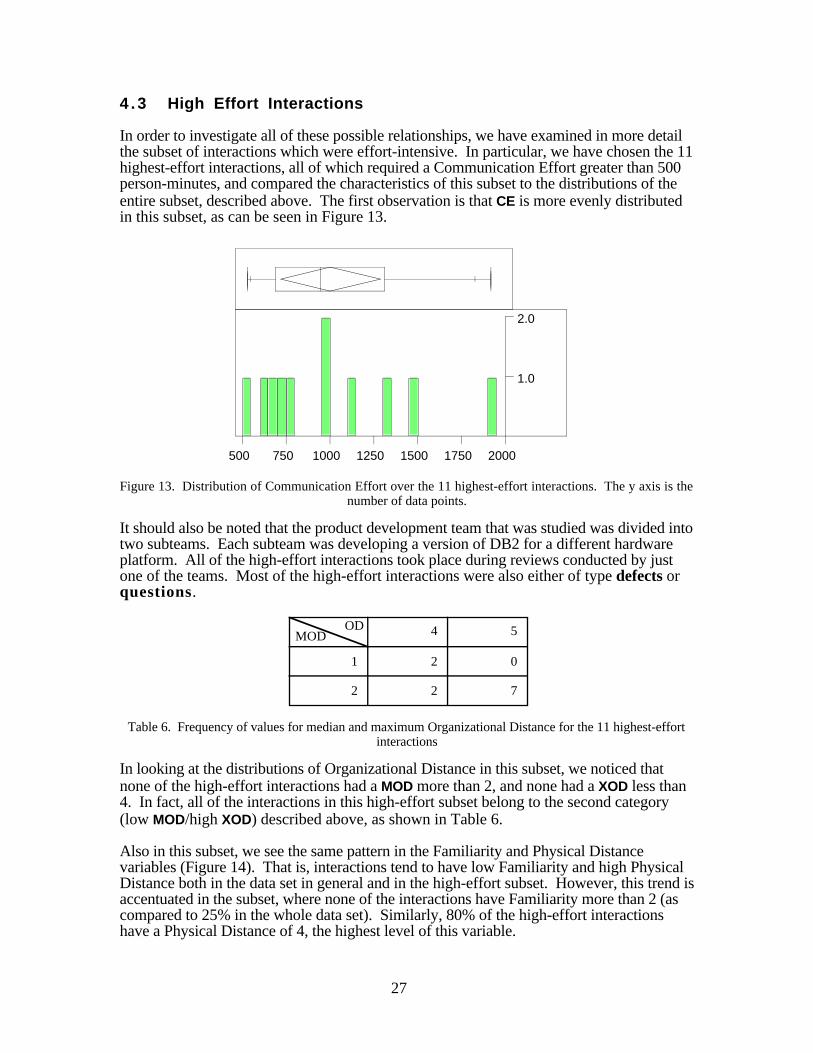
In order to investigate all of these possible relationships, we have examined in more detailthe subset of interactions which were effort-intensive. In particular, we have chosen the 11highest-effort interactions, all of which required a Communication Effort greater than 500person-minutes, and compared the characteristics of this subset to the distributions of theentire subset, described above. The first observation is that CE is more evenly distributedin this subset, as can be seen in Figure 13.
1.0
2.0
500 750 1000 1250 1500 1750 2000
Figure 13. Distribution of Communication Effort over the 11 highest-effort interactions. The y axis is thenumber of data points.
It should also be noted that the product development team that was studied was divided intotwo subteams. Each subteam was developing a version of DB2 for a different hardwareplatform. All of the high-effort interactions took place during reviews conducted by justone of the teams. Most of the high-effort interactions were also either of type defects orquestions.
MODOD
1
2
4 5
2
2
0
7
Table 6. Frequency of values for median and maximum Organizational Distance for the 11 highest-effortinteractions
In looking at the distributions of Organizational Distance in this subset, we noticed thatnone of the high-effort interactions had a MOD more than 2, and none had a XOD less than4. In fact, all of the interactions in this high-effort subset belong to the second category(low MOD/high XOD) described above, as shown in Table 6.
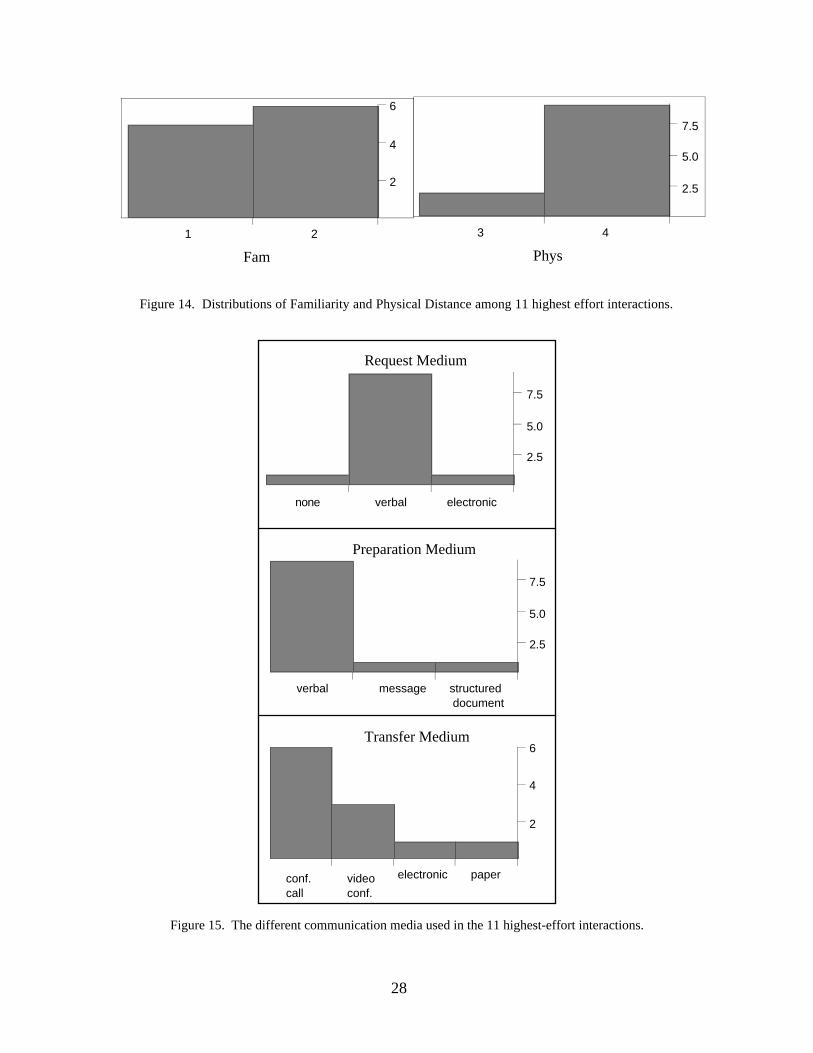
Also in this subset, we see the same pattern in the Familiarity and Physical Distancevariables (Figure 14). That is, interactions tend to have low Familiarity and high PhysicalDistance both in the data set in general and in the high-effort subset. However, this trend isaccentuated in the subset, where none of the interactions have Familiarity more than 2 (ascompared to 25% in the whole data set). Similarly, 80% of the high-effort interactionshave a Physical Distance of 4, the highest level of this variable.
28
2
4
6
1 2
2.5
5.0
7.5
3 4
Fam Phys
Figure 14. Distributions of Familiarity and Physical Distance among 11 highest effort interactions.
2.5
5.0
7.5
none verbal electronic
2.5
5.0
7.5
verbal message structured document
2
4
6
conf.call
videoconf.
electronic paper
Request Medium
Preparation Medium
Transfer Medium
Figure 15. The different communication media used in the 11 highest-effort interactions.
29
Nearly all of the high-effort interactions involved a verbal request for information (Mr=1),no written preparation of the information (Mp=2), and were executed using a conferencecall or video conference (Mt=2 or 3). These patterns in the use of communication media,shown in Figure 15, differ dramatically from the patterns seen in the data as a whole.Interactions which involved a verbal request and no preparation usually took place during aface-to-face meeting in which many people were present, which implicitly increases thecommunication effort. In those meetings in which conference calling or videoconferencingwas used, the technology actually slowed down the process. Significant amounts of timewere spent waiting for remote participants to find the right page, to clarify issues for remoteparticipants, etc. Also, the communication technology was unfamiliar to some participants.
All of the high-effort interactions involved technical information. This would imply thatdevelopers do not spend a large amount of time in administrative (non-technical)communication. In this study, 40% of all interactions were administrative in nature andnone of them were highly effort-intensive. In fact, over all 10 reviews studied, 96% of theeffort spent in communication involved technical information.
Comparisons between high-effort interactions and the whole set of interactions in terms ofthe other blocking variables yield few surprising results. The information in most of thehigh-effort interactions was unstructured, medium to large in size, and of average or highercomplexity. The different uses of information in the high-effort interactions were not verydifferent from that in the entire set of interactions, nor were the skill levels of theparticipants.
One other variable deserves a little more attention. The median number of participants inhigh-effort interactions is 10, but the median in the larger set of interactions is about halfthat (5.5). This result is not so straightforward as it might seem, however, because thevariable N (number of participants) is not completely independent from CommunicationEffort. For some interactions, in fact, N is used in the calculation of CE. For example, CEfor the interaction of type discussion is calculated by multiplying the amount of timespent in general discussion during the review meeting by N. To investigate whether or notthe number of participants has an independent effect on effort, we normalizedCommunication Effort by dividing it by N. Then we picked the 15 interactions with thehighest normalized CE(15 was the smallest number which included the 11 interactions weanalyzed before as the highest-effort). The median number of participants in this subset is8, lower than than 10, but still considerably higher than the median of the data as a whole(5.5). So it appears that the highest-effort interactions involve more participants thaninteractions in general, regardless of which way effort is calculated.
In some of the discussion below, we refer both to "normalized" and "unnormalized" valuesof Communication Effort (CE). CE values are normalized simply by dividing them by N,as in the discussion above.
4 .4 Interaction Types
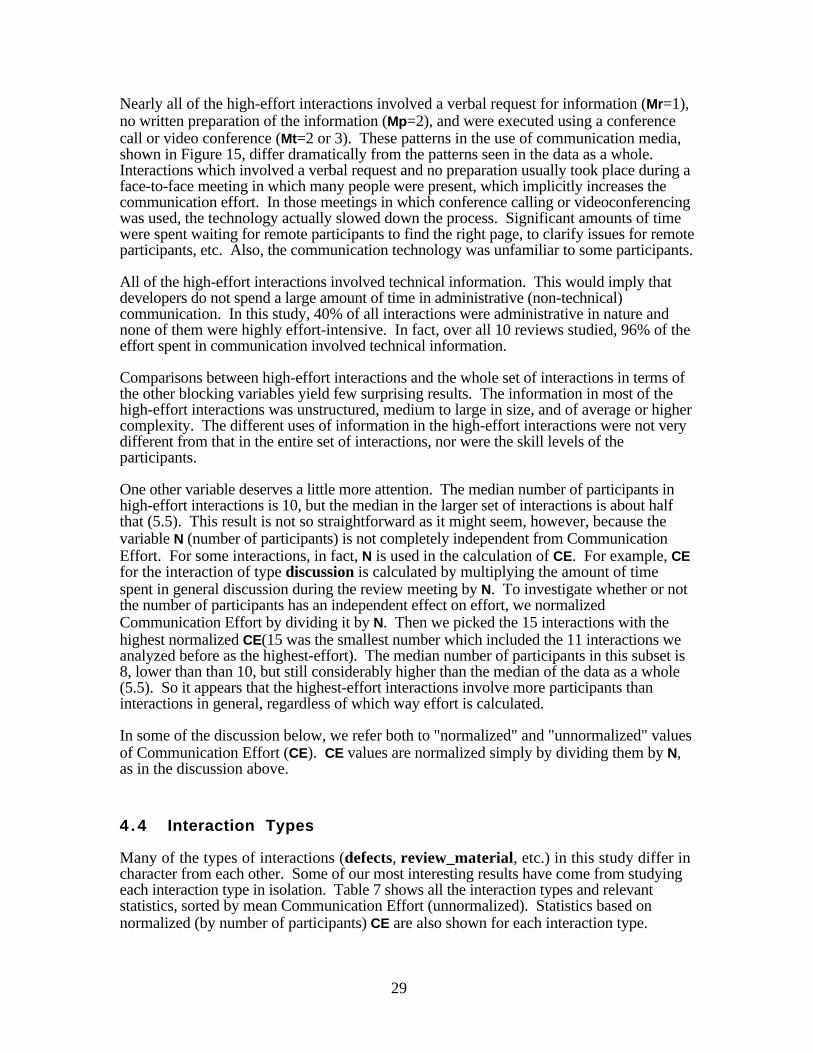
Many of the types of interactions (defects, review_material, etc.) in this study differ incharacter from each other. Some of our most interesting results have come from studyingeach interaction type in isolation. Table 7 shows all the interaction types and relevantstatistics, sorted by mean Communication Effort (unnormalized). Statistics based onnormalized (by number of participants) CE are also shown for each interaction type.
30
Interaction Unnormalized NormalizedType N Mean S.D. Min Max Mean S.D. Min Max
defects 11 642 658 92 1919 67 68 18 240questions 11 409 373 68 1109 43 37 17 139review_material 11 313 164 120 729 35 26 16 104discussion 9 195 241 12 694 18 20 2 53schedule_meeting 9 105 188 20 600 14 24 1 75comments 7 97 92 9 273 41 46 3 137choose_participants 2 65 78 10 120 33 39 5 60rework 2 30 0 30 30 15 0 15 15commented_material 7 22 22 4 60 9 8.8 1 23preparation_done 3 20 0 20 20 4 1 2 5summary_form 10 13 10 3 32 6 5 2 16sum_form_rework 9 11 2 10 15 6 1 5 8re-review_decision 9 8 4 4 13 1 0 0 1
Table 7. Mean Communication Effort by type of interaction, both unnormalized and normalized by thenumber of participants
The defects interaction is, on average, the most effort-intensive interaction type, whetheror not Communication Effort is normalized by the number of participants. This makesintuitive sense, since this interaction embodies the entire purpose of the review. In our dataset, most of the defects interactions involved a set of participants that fell into the secondcategory (low MOD/high XOD), including all of those with CE above the mean. All of thedefects interactions were verbal, and took place during a face-to-face meeting, conferencecall, or videoconference. The highest-effort defects interactions took place duringconference calls. Defects interactions included anywhere from 4 to 15 participants, with amean of about 9 participants. All of the defects interactions with (normalized orunnormalized) CE above the mean had 7 or more participants.
0
100
200
300
400
500
600
700
800
900
1000
1100
1200
2 3 4 5
MOD
4 5
XOD
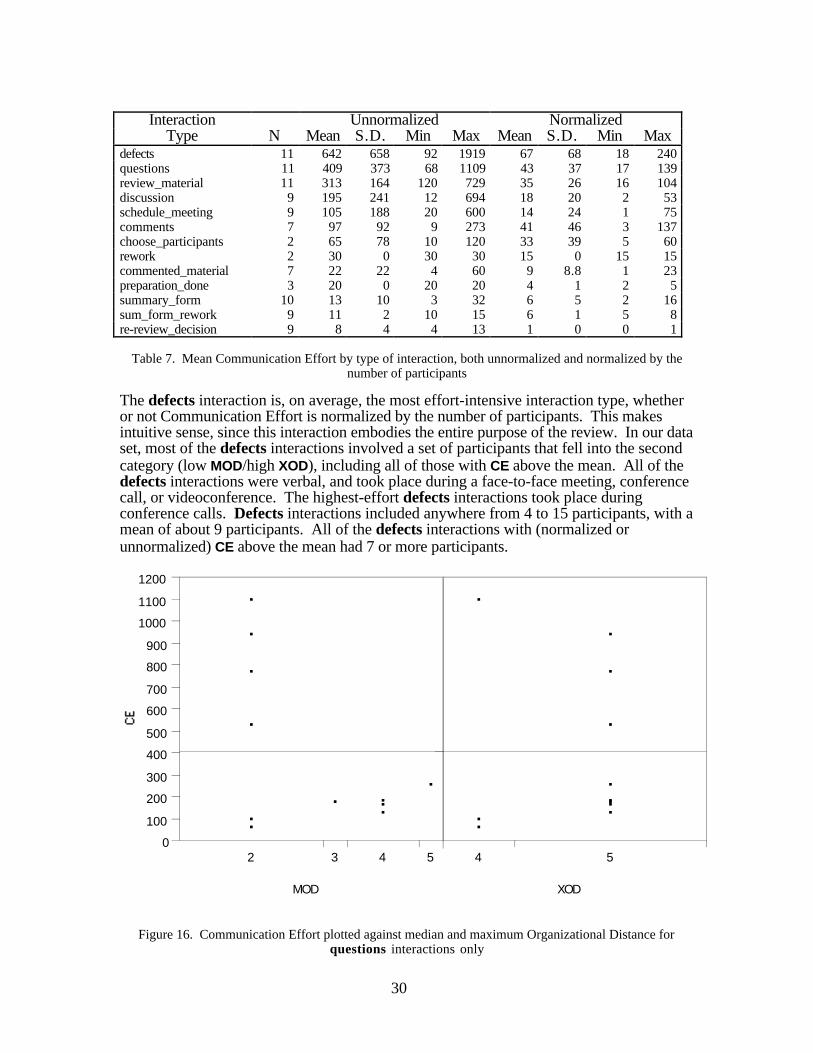
Figure 16. Communication Effort plotted against median and maximum Organizational Distance forquestions interactions only
31
Another effort-intensive interaction type is the questions interaction. Again, the highest-effort interactions of this type fall into the second category of participant sets (lowMOD/high XOD). This can be seen clearly in Figure 16.
Although all of the questions interactions have fairly high Physical Distance (3 or higher),the highest-effort ones have the highest Physical Distance, 4. Like the defectsinteractions, the above-average effort intensive questions interactions all had 7 or moreparticipants.
The discussion interactions tend to be less effort-intensive than the questions ordefects interactions, but still require more effort than most interaction types. Discussioninteractions exhibit the same patterns in Organizational and Physical Distance as mentionedabove for the questions and defects interactions. In addition, high-effort discussioninteractions tend to involve information of relatively high complexity (Comp=4 or higher)and large size (Size>=4).
The defects, questions, and discussion interactions constitute all of the technicalcommunication that takes place during a review meeting. The effort recorded for theseinteractions includes the effort required to prepare for, carry out, and digest this technicalinformation. Since these interactions form the core of the work of a review, it iscomforting to know that they are the ones which require the most effort. In fact, over all10 reviews studied, 70% of the total Communication Effort expended was expended ininteractions of these three types.
Two other relatively high-effort types of interactions, review_material and comments,exhibit slightly different behavior than described above. First of all, most of the high-effortreview_material interactions have participants which fall into the third categorydescribed earlier (organizationally distant). The sets of participants for the high-effortcomments interactions, on the other hand, fall into the first category (organizationallyclose). This contrasts with the observation that the participants in high-effort defects,questions, and discussion interactions are all in the second category. Anotherdifference is that there is no apparent relationship between Communication Effort andPhysical Distance for these types of interactions.
These results must be interpreted remembering that the set of participants in the defects,questions, and discussion interactions for each review is different than the set ofparticipants for the review_material and comments interactions. The first threeinteractions take place during the review meeting, and the participants comprise all thosepresent at the meeting. Furthermore, all the distance measures are calculated using everypair of participants. The distance measures for review_material interactions, on theother hand, reflect only the distances between the Author(s) and each Reviewer (i.e. notbetween Authors or between Reviewers). Thus, saying that the participants in areview_material interaction are organizationally distant means that the Authors areorganizationally distant from the Reviewers. Similarly, the participants in a commentsinteraction are the Moderator and the Author(s). So saying that a comments interactionhas a low Physical or Organizational Distance refers only to the distance between theModerator and the Author(s).
The review_material and comments interactions also exhibited some relationshipsbetween effort and some of the blocking variables which did not seem relevant with othertypes of interactions. For instance, the high-effort review_material interactions allinvolved material that was highly structured and large, and took place during reviews in
32
which the Chief Reviewer was highly skilled. High-effort comments interactions allinvolved information that was more complex than average.
5. Limitations of the study
The major limitation of this study is its size and scope. It examines only 10 reviews,during one month, in a single development project. The amount of data collected (100 datapoints), relative to the number of relevant variables, is too small to assess statisticalsignificance of many of the findings or to generalize the results in any way.
The three-part model built at the beginning of the study (see section 3.3) was extremelyuseful throughout as a framework for organizing the data and for communicating withdevelopers. However, it could have been more useful. In particular, handling the dataassociated with interactions was cumbersome and limited somewhat the analyses whichcould be done easily. Some automatic support for managing this part of the model (or evenhandling the data itself through the model), as well as a better notation, was needed.
Another lesson learned from this study was that the interactions, as defined, did notnaturally fit the way the participants thought about the review process. This made collectingand validating the data very difficult. For example, the Reviewers' preparation time had tobe divided over several different interactions in order to fit the model. Some of it wasincluded in the Communication Effort for the defects interaction, some for the questionsinteraction, etc. During the interviews, we asked some Reviewers how they divided theirpreparation time. We used their responses as a guideline, but we cannot be sure that thepercentages are accurate or consistent. Modeling more in accordance with the process as itis enacted, and at a slightly higher level of abstraction, would help eliminate doubts aboutthe accuracy of the data.
The design of the research variables and their levels in the pilot study was based on expertopinion and the literature, but the process of designing these measures was not very formalor well-documented. A more rigorous qualitative analysis is needed to support the designchoices. Such an "ahead-of-time" analysis is part of what is called prior ethnography, atechnique from qualitative research methods.
During data collection, the follow-up interviews after the observed reviews were vitallyimportant. However, they could have been combined into just one interview for eachinterviewee. Instead, the questions were spread over several interviews over a period of 10months. This led to memory, personnel turnover, and discontinuity problems. A singleinterview, as shortly after the review as possible, is preferred.
The observations in this study were not as rigorous as they could have been. The singleobserver was not very familiar with the application domain, and this sometimes made itdifficult to determine what type of discussions were taking place during observations. Aswell, no reliability techniques were employed, such as audio- or videotaping the reviews,or having a second observer. This would have ensured better accuracy of the data. Alsorelated to data accuracy, there were some variables that had no triangulation [Lincoln85]source. That is, there was only one data source for these variables. It would be better, andshould be possible, to have at least two sources for each piece of information collected.
During observations and interviews, some field notes were taken in addition to theinformation on the interview forms and observation checklists. However, this data was notextensive or reliable enough to be used as part of the data analysis. If more faithful noteshad been kept, this qualitative data could have been used to help explain and interpret the
33
quantitative results. The collection of useful anecdotes and quotes would also have beenfacilitated by making the interview questions more open-ended, that is, by relaxing thestructuredness of the interviews a little.
One of the goals of this study was to serve as a pilot for a larger study begun recently.Although small, this pilot study was valuable in clarifying a number of issues related tohow this subject is best studied. The limitations discussed above have been remedied in thedesign of the larger study, which is being conducted at NASA Goddard Space FlightCenter. The main differences between this study and the pilot study described in this paperare its setting, size, and scope. Other differences arise as a result of remedying thelimitations described above. The main goal of this larger study, as in the pilot study, is tolearn how organizational structure characteristics affect the amount of effort expended oncommunication.
The setting for the larger study is the team developing AMPT, a mission planning tool.This project involves about 15-20 developers, and is the subject project for anotherexperiment exploring a new software development process, Joint ApplicationDevelopment. As in the pilot study, we are studying the review process (called theinspection process at NASA) in particular. However, we expect to observe a much largernumber of reviews (on the order of 30-50) over a longer period of time (3-6 monthsbeginning December 1995).
6. Discussion and Summary
We have addressed the broad problem of organizational issues in software development bystudying the amount of effort developers expend in certain types of communication. Wehave described an empirical study conducted to investigate the organizational factors thataffect this effort. The research design combined quantitative and qualitative methods in aneffort to be sensitive to uncertainty, but also to provide well-founded results. Thesemethods include participant observation, interviewing, coding, graphical data displays, andsimple statistical tests of significance.
Our findings are best summarized as a set of proposed hypotheses. The results of thisstudy point to the validity of these hypotheses, but they are yet to be formally tested. Manyof the methods and measures described in this paper may be used to do so. However, evenas untested hypotheses, these findings provide important preliminary insight into issues oforganizational structure and communication in software development:
H 1 Interactions tend to require more effort when the participants are not previouslyfamiliar with each others' work. This is consistent with Krasner's [Krasner87]findings about "common internal representations".
H 2 Interactions tend to require more effort when the participants work in physicallydistant locations. Curtis [Curtis88] and Allen [Allen85] have had similar findings.
H 3 Interactions which take place during a meeting (a verbal request and an unpreparedreply) tend to require more effort than other interactions.
H 4 Interactions which involve some form of communication technology (conferencecalling and videoconferencing in this study) tend to require more effort.
H 5 Non-technical (administrative) communication accounts for very little (less than5%) of the overall communication effort.
H 6 More participants tend to make interactions more effort-intensive, even when theeffort is normalized by the number of participants.
H 7 In interactions that take place in a meeting, more effort is required when the set ofparticipants includes mostly organizationally close members, but with a few
34
organizationally distant members. This contrasts with Curtis [Curtis88], whohypothesized that the relationship between organizational distance andcommunication ease is more straightforward.
H 8 Preparing, distributing, and reading material tends to take more effort when allparticipants are organizationally distant, and when the material is highly structuredand large.
H 9 Writing and distributing comments to authors during the review meeting tends totake more effort when all of the participants are organizationally close, and whenthe material being reviewed is complex.
Recall that the problem to be addressed is the lack of knowledge about how to manageinformation flow in a software development organization and process. This study is notsufficient to solve this problem, but it is a first step. In section 1.1, several symptoms ofthis problem were described. The first is the difficulty of planning for communicationcosts. The findings of this study could be used to help in planning by pointing outcharacteristics which increase communication costs in reviews. For example, more thanaverage time should be allowed for review meetings in which most of the participants areorganizationally close, but a few are from distant parts of the organization. Alternatively,assignments could be made in such a way as to avoid such configurations of reviewparticipants.
The second symptom of the process information flow problem is that we do not know howto identify or solve communication problems as they arise. For example, if during thecourse of a project, developers are spending much more time preparing for reviews thanplanned, the findings above indicate that the problem may be that the participants are tooorganizationally distant, or that the material is too large. The problem might be solved bychoosing reviewers who are closer, or by breaking the material to be reviewed into smallerpieces.
The third point raised in section 1.1 as a consequence of the research problem is that oflearning from experience. This study represents a very small first step in building theexperience necessary to effectively manage information flow in software developmentorganizations. The next step for the authors is the larger empirical study described brieflyin section 5. But there are several next logical steps in this line of research. No attempt hasbeen made in this study to determine how communication effort affects software quality ordevelopment productivity. An understanding of this issue is necessary for effectivemanagement support. As well, this study does not address the issue of communicationquality, only quantity. One cannot assume that the two are equivalent. Finally, there needsto be more work in the area of actually applying this new knowledge to the improvement ofsoftware development projects, and the mechanisms needed to achieve such improvement.
35
References
[Allen85] Thomas J. Allen. Managing the Flow of Technology. The MITPress, 1985.
[Ballman94] Karla Ballman and Lawrence G. Votta. "Organizational Congestionin Large-Scale Software Development". In Proceedings of the 3rdInternational Conference on Software Process, pages 123-134,Reston, VA, October 1994.
[Barley90] Stephen R. Barley. "The Alignment of Technology and Structurethrough Roles and Networks". Administrative Science Quarterly,35:61-103, 1990.
[Bradac94] Mark G. Bradac, Dewayne E. Perry, and Lawrence G. Votta."Prototyping a Process Monitoring Experiment". IEEETransactions on Software Engineering, 20(10):774-784, October1994.
[Curtis88] Bill Curtis, Herb Krasner, and Neil Iscoe. "A Field Study of theSoftware Design Process for Large Systems". Communications ofthe ACM, 31(11), November 1988.
[Davenport90] Thomas H. Davenport and James E. Short. "The New IndustrialEngineering: Information Technology and Business ProcessRedesign". Sloan Management Review, pages 11-27, Summer1990.
[Ebadi84] Yar M. Ebadi and James M. Utterback. "The Effects ofCommunication on Technological Innovation". ManagementScience, 30(5):572-585, May 1984.
[Galbraith77] Jay R. Galbraith. Organization Design. Addison-Wesley, 1977.
[Gilgun92] Jane F. Gilgun. "Definitions, Methodologies, and Methods inQualitativeFamily Research". In Qualitative Methods in Family Research.Sage, 1992.
[Hammer90] Michael Hammer. "Reengineering Work: Don't Automate,Obliterate". Harvard Business Review, pages 104-112, July 1990.
[Krasner87] Herb Krasner, Bill Curtis, and Neil Iscoe. "CommunicationBreakdowns and Boundary Spanning Acitivities on LargeProgramming Projects". In Gary Olsen, Sylvia Sheppard, andElliot Soloway, editors, Empirical Studies of Programmers, secondworkshop, chapter 4, pages 47-64. Ablex Publishing, New Jersey,1987.
[Liker86] Jeffrey K. Liker and Walton M. Hancock. "Organizational SystemsBarriers to Engineering Effectiveness". IEEE Transactions onEngineering Management, 33(2):82-91, May 1986.
36
[Lincoln85] Yvonna S. Lincoln and Egon G. Guba. Naturalistic Inquiry. Sage,1985.
[March58] J.G. March and Herbert A. Simon. Organizations. John Wiley,New York, 1958.
[Mintzberg79] Henry Mintzberg. The Structuring of Organizations. Prentice-Hall,1979.
[Perry94] Dewayne E. Perry, Nancy A. Staudenmayer, and Lawrence G.Votta. "People, Organizations, and Process Improvement". IEEESoftware, July 1994.
[Rank92] Mark R. Rank. "The Blending of Qualitative and QuantitativeMethods in Understanding Childbearing Among WelfareRecipients". In Qualitative Methods in Family Research, Sage,1992.
[Sandelowski92] Margarete Sandelowski, Diane Holditch-Davis and Betty GlennHarris. "Using Qualitative and Quantitative Methods: TheTransition to Parenthood of Infertile Couples". In QualitativeMethods in Family Research, Sage, 1992.
[Schilit82] Warren Keith Schilit. "A Study of Upward Influence in FunctionalStrategic Decisions". PhD thesis, University of Maryland at CollegePark, 1982.
[Schneider85] Larissa A. Schneider. "Organizational Structure, EnvironmentalNiches, and Public Relations: The Hage-Hull Typology ofOrganizations as a Predictor of Communication Behavior ". PhDthesis, University of Maryland at College Park, 1985.
[Stinchcombe90] Arthur L. Stinchcombe. Information and Organizations. Universityof California Press, 1990.
[Sullivan85] Matthew J. Sullivan. "Interaction in Multiple Family GroupTherapy: A Process Study of Aftercare Treatment for Runaways".PhD thesis, University of Maryland at College Park, 1985.
[Taylor84] Steven J. Taylor and Robert Bogdan. Introduction to QualitativeResearch Methods. John Wiley and Sons, 1984.