Embed Size (px)
Citation preview

Communication Systems, 5e
Chapter 11: Baseband Digital TransmissionChapter 14: Bandpass Digital Transmission
A. Bruce CarlsonPaul B. Crilly
© 2010 The McGraw-Hill Companies

© 2010 The McGraw-Hill Companies
Chapter 11 & 14
• Chapter 11: Baseband Digital Transmission– Digital signals and systems– Noise and errors– Bandlimited digital PAM systems– Synchronization Techniques
• Chapter 14: Bandpass Digital Transmission– Digital CW modulation– Coherent binary systems– Noncoherent binary systems– Quadrature-carrier and M-ary systems– Orthogonal frequency division multiplexing– Trellis-coded modulation

3
Why go digital?• Stability
– Inherently invariant of performance. Identical clock rates result in identical results. No temperature variance or component aging effects.
• Flexibility– Reprogramming allows for changes and upgrades– Apply digital signal processing to meet different needs
encryption, compression, encoding
• Reliable Reproduction– All circuits perform identically with identical results.

4
Digital Formatting and Transmission

5
Digital Signals and Systems
• An ordered sequence of symbols– Produced by a discrete information source– With symbols drawn from a defined alphabet
• Binary symbols are one subset of symbols– Represent binary digits, 0 and 1 known as bits– Symbols may be represented by multiple bits (M-ary)
• Interested in:– Symbol rate, symbols per second and bits per second
(bps)– Symbol error probability or rate
(bit-error-rate or BER measures)

6
Digital Pulse-Amplitude Modulation (PAM)
• Also referred to as pulse-code modulation (PCM)• The amplitude of pulse take on discrete number of
waveforms and/or levels within a pulse period T.
• p(t) takes on many different forms, a rect for example
k
k kTtpatx
else0
Tt01tp
T0for,apakTmTpamTx mmk
k

7
Digital Signaling Rate
• For symbols of period T, the symbol rate is 1/T = R
• The rate may be in bits-per-second when bits are sent. A bps rate is usually computed and defined.
• The rate may be in symbols-per-second when symbols are sent. When there are a defined number of bits-per-symbol, the rate may be defined in bits-per-second.– If parity or other non-data bits are sent, the messaging
rate and the signaling rate may differ.

8
PAM/PCM Types
Biphase Mark Code
RZ
AMI-Bipolar Encoding(Alternate Mark Inversion)
ManchesterNRZ
9
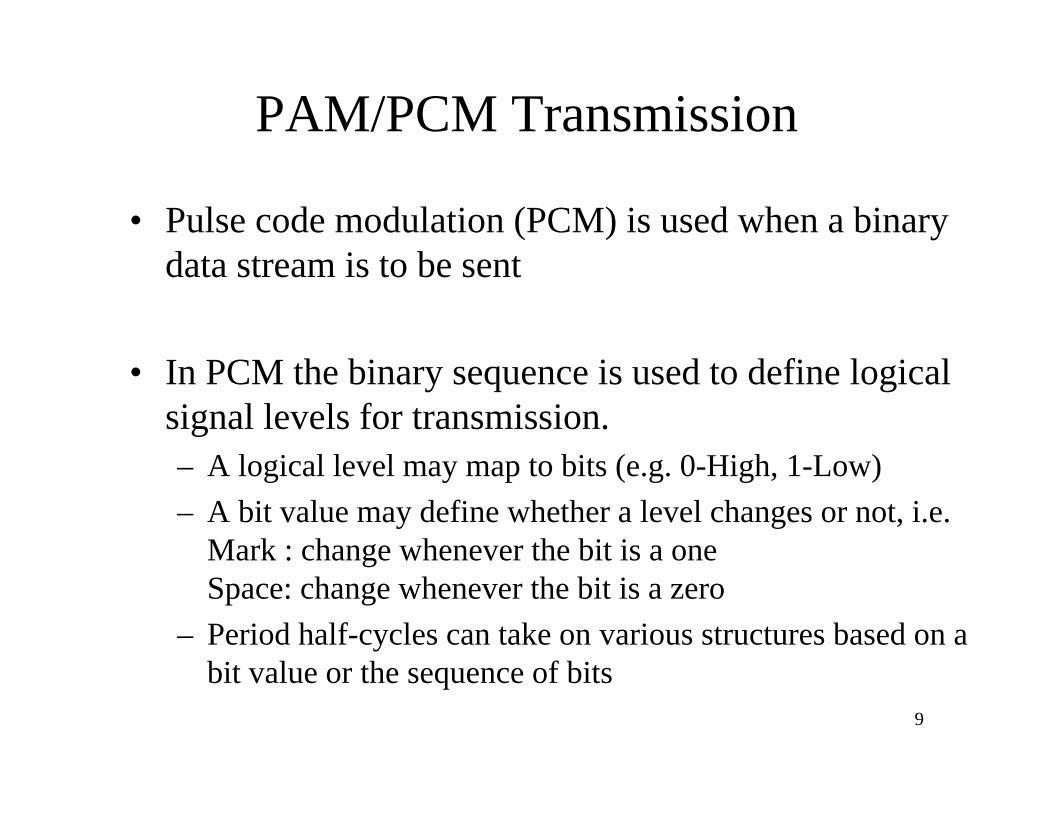
PAM/PCM Transmission
• Pulse code modulation (PCM) is used when a binary data stream is to be sent
• In PCM the binary sequence is used to define logical signal levels for transmission. – A logical level may map to bits (e.g. 0-High, 1-Low)– A bit value may define whether a level changes or not, i.e.
Mark : change whenever the bit is a one Space: change whenever the bit is a zero
– Period half-cycles can take on various structures based on a bit value or the sequence of bits
10
PCM Common Waveform Types
• Marks (1’s) and Spaces (0’s)
• Non-return-to-zero (NRZ) – Level, Mark, Space• Return-to-zero (RZ) – unipolar, bipolar, AMI
(alternate mark inversion)• Manchester – biphase level, biphase mark, biphase
space

11
PCM Types Again
Biphase Mark Code
RZ
AMI-Bipolar Encoding(Alternate Mark Inversion)
ManchesterNRZ
12
PCM Type Selection
• Spectral characteristics (power spectral density and bandwidth efficiency)
• Bit synchronization capability• Error detection capability• Interference and noise immunity• Implementation cost and complexity
– Simple to modulate and demodulate
13
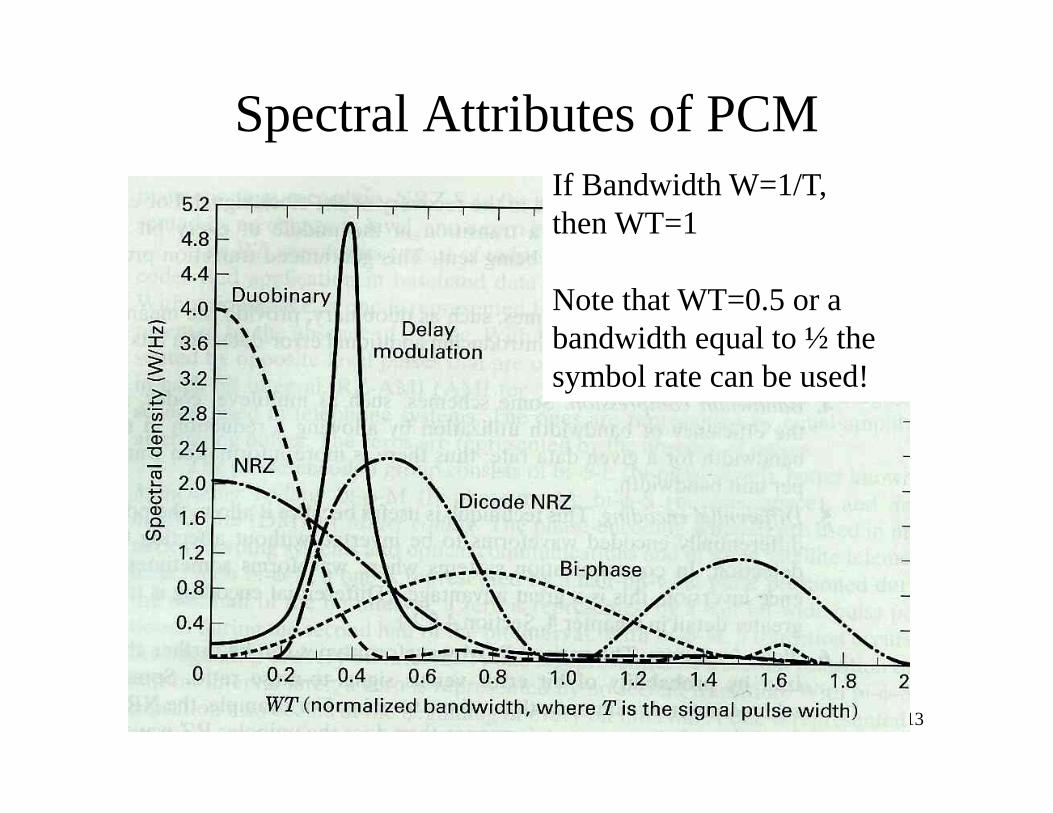
Spectral Attributes of PCMIf Bandwidth W=1/T, then WT=1
Note that WT=0.5 or a bandwidth equal to ½ the symbol rate can be used!

14
Copyright © The McGraw-Hill Companies, Inc. Permission required for reproduction or display.
(a) unipolar RZ & NRZ
(b) polar RZ & NRZ
(c) bipolar NRZ
(d) split-phase Manchester
(e) polar quaternary NRZ
Figure 11.1-1
ABC Binary PAM formats

15
M-ary Coded Symbols
• When multiple bits per symbol are sent
– The symbol rate is
– “quaternary NRZ” is a 4-ary symbol providing 2 bits-per-symbol based on 4 amplitude levels
• Digital mapping of the symbols is performed• Gray Codes typically used so that the nearest neighbor only
has one-bit different (improves the bit-error rate of the symbol type being used)
n2M
nR
MlogRR Bit
2
BitSymbol
16
Copyright © The McGraw-Hill Companies, Inc. Permission required for reproduction or display.
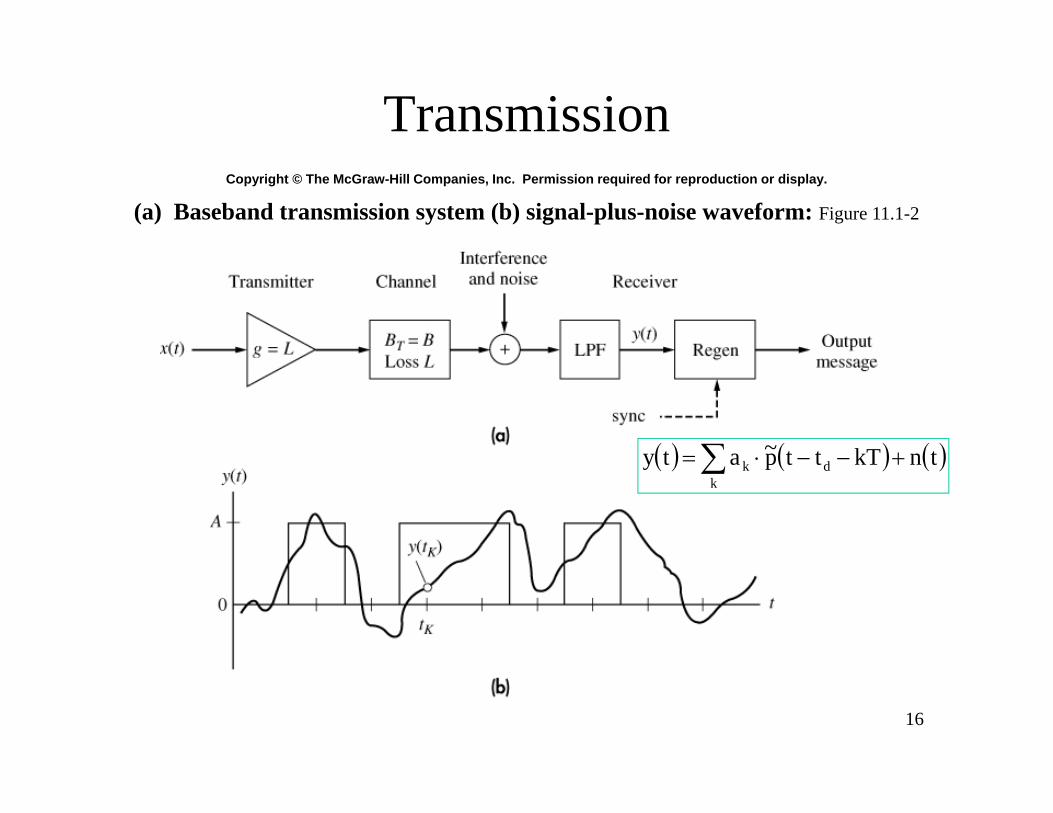
(a) Baseband transmission system (b) signal-plus-noise waveform: Figure 11.1-2
Transmission
tnkTttp~atyk
dk

17
Transmission
• The digital signal is time delayed
• The pulse is “filtered” and/or distorted by the channel
• Recovering or Regenerating the signal may not be trivial
– Signal plus inter-symbol interference (ISI) plus noise
tnkTttp~atyk
dk
thtpfntp c~
dt
dmk
kmd tmTnkTmTpaatmTy
~ˆ
18
Copyright © The McGraw-Hill Companies, Inc. Permission required for reproduction or display.
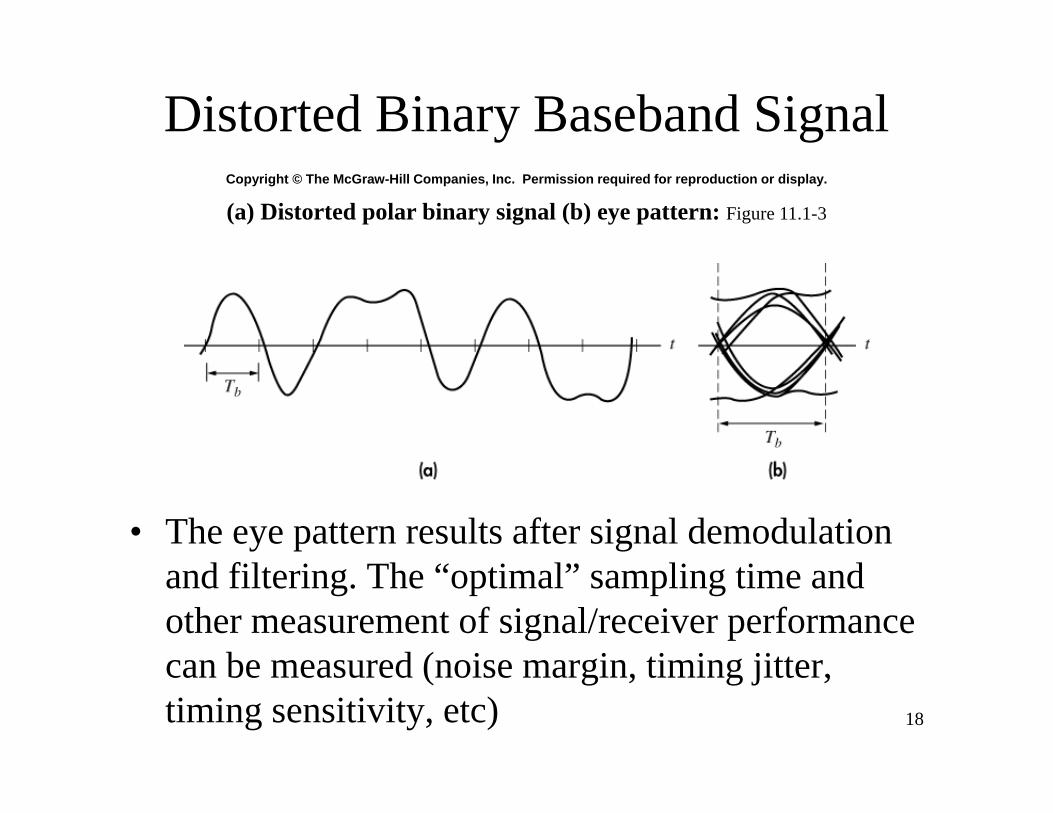
(a) Distorted polar binary signal (b) eye pattern: Figure 11.1-3
Distorted Binary Baseband Signal
• The eye pattern results after signal demodulation and filtering. The “optimal” sampling time and other measurement of signal/receiver performance can be measured (noise margin, timing jitter, timing sensitivity, etc)

19
Symbol Periods and ISI
• For a signal with the maximum number of level transitions (typically, 01010101)
• The binary signal would form a square wave of period 2T.– Fourier Series of fundamental plus odd harmonics
• To minimally pass this signal, a low pass filter with cutoff frequency of B 1/2T = R/2 may be used …– This concept also comes from Nyquist– Therefore the previous comments about BT = ½

20
Symbol Periods and ISI (2)
• To minimally pass this signal, a low pass filter with cutoff frequency of R/2 may be used …
• The optimal binary symbol pulse shape would then have a band-limited spectrum …
• Note that the value of other symbols that could cause ISI is equal to zero at the “optimal” symbol sampling time … the center of the eye diagram.– A way to minimize ISI using the optimal filter!
Rfrect
R1fP
TtsincRtsinctp

21
Matlab Bipolar NRZ
• Sinc Function Waveform Sum (SincEyev2.m)• Eye Diagram
-4 -3 -2 -1 0 1 2 3 4
-1
-0.8
-0.6
-0.4
-0.2
0
0.2
0.4
0.6
0.8
1
-8 -6 -4 -2 0 2 4 6 8-1
-0.8
-0.6
-0.4
-0.2
0
0.2
0.4
0.6
0.8
1Eye Diagram For Square Wave

22
Matlab Bipolar NRZ (2)
• Sinc Function Waveform Sum• Power Spectral Density
-4 -3 -2 -1 0 1 2 3 4
-1
-0.8
-0.6
-0.4
-0.2
0
0.2
0.4
0.6
0.8
1
0 1 2 3 4 5 6 7 8-60
-50
-40
-30
-20
-10
0
10
20Power Spectral Density

23
Copyright © The McGraw-Hill Companies, Inc. Permission required for reproduction or display.
Figure 11.2-1
Baseband Binary Receiver
• Synchronous Time sampling of maximum filter output
thtnthkTtpaty ink
k
kkk tnaty

24
Copyright © The McGraw-Hill Companies, Inc. Permission required for reproduction or display.
(a) signal plus noise (b) S/H output (c) comparator output: Figure 11.2-2
Regeneration of a unipolar signal

25
Unipolar Binary Error Probability
• Hypothesis Testing using a voltage threshold– Hypothesis 0
• The conditional probability distribution expected if a 0 was sent
– Hypothesis 1• The conditional probability distribution expected if a 1 was
sent
kYkkkY0kY tnp0a|tnapH|yp
kYkkkY1kY tnApAa|tnapH|yp
kN0kY ypH|yp
A-| 1 kNkY ypHyp

26
Copyright © The McGraw-Hill Companies, Inc. Permission required for reproduction or display.
Conditional PDFs Figure 11.2-3
Decision Threshold and Error Probabilities
• Use Hypothesis to establish a decision rule– Use threshold to determine the probability of correctly
and incorrectly detecting the input binary value
V
0Y0e dyH|ypVYPP
V
1Y1e dyH|ypVYPP

27
Average Error Probability
• Using the two error conditions:– Detect 1 when 0 sent– Detect 0 when 1 sent
• For equally likely binary values
• Optimal Threshold
1e10e0error PHPPHPP
21HPHP 10
1e0eerror PP21P
1optY10optY0 H|VpHPH|VpHP

28
Copyright © The McGraw-Hill Companies, Inc. Permission required for reproduction or display.
Figure 11.2-4
Threshold regions for conditional PDFs
2AVopt
29
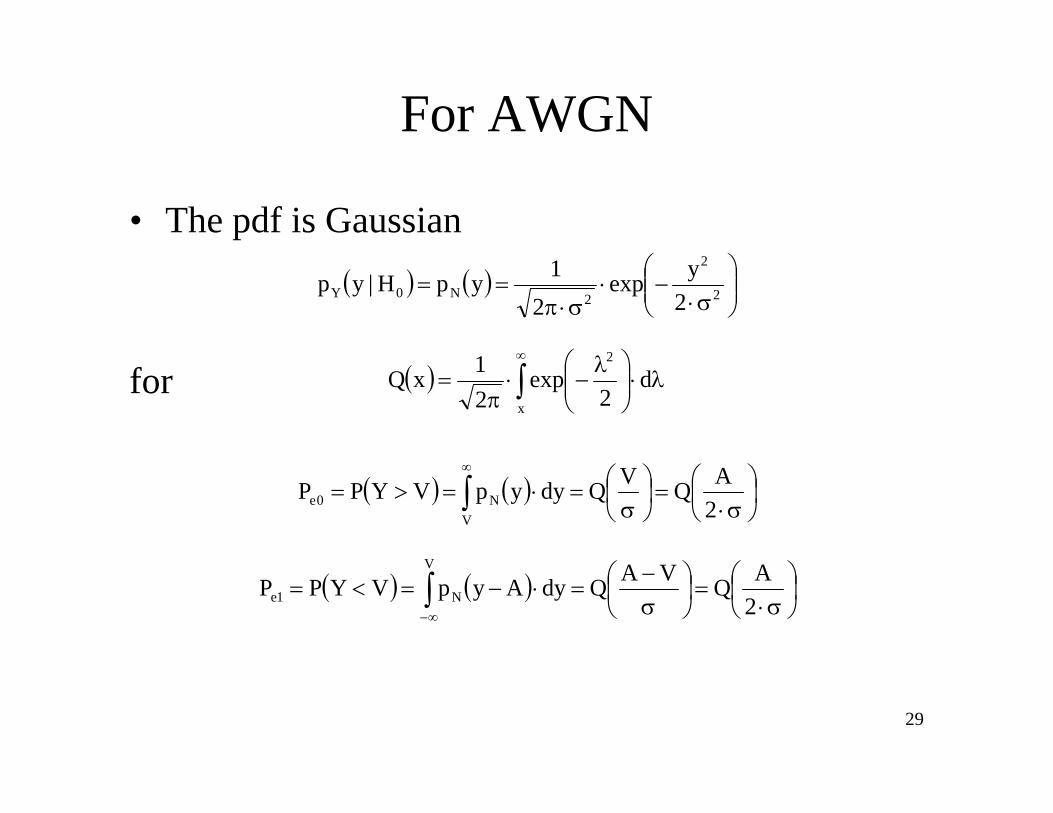
For AWGN
• The pdf is Gaussian
for
2
2
2N0Y 2yexp
21ypH|yp
x
2
d2
exp21xQ
2AQVQdyypVYPP
VN0e
2
AQVAQdyAypVYPPV
N1e

30
Modification for Bipolar Signals
• Hypothesis Testing using a voltage threshold– Hypothesis 0
• The conditional probability distribution expected if a 0 was sent
– Hypothesis 1• The conditional probability distribution expected if a 1 was
sent
kYkkkY0kY tnA-pAa|tnapH|yp
kYkkkY1kY tnApAa|tnapH|yp
AypH|yp kN0kY
A-ypH|yp kN1kY
02A
2AVopt

31
Modification for Bipolar Signals (2)
• Determining the error probability
• Notice that the error has been reduced– The distance between the expected signal values may
be twice as large as the unipolar case (using +/- A)
AQVAQdyAypVYPPV
Ne1
AQVAQdyAypVYPP
VNe0