Embed Size (px)
Citation preview

COMMUNICATIONS IN INFORMATION AND SYSTEMS c© 2010 International PressVol. 10, No. 2, pp. 115-136, 2010 004
SPACED SEEDS FOR CROSS-SPECIES CDNA-TO-GENOME
SEQUENCE ALIGNMENT∗
LEMING ZHOU† , INGRID MIHAI‡ , AND LILIANA FLOREA§
Abstract. We review recent developments in spaced seed design for cross-species sequence
alignment. We start with a brief overview of original ideas and early techniques, and then focus on
more recent work on finding accurate (sensitive and specific) seeds for cross-species cDNA-to-genome
alignment. These recent developments include methods and models for estimating seed specificity
and determining sensitive and specific seeds, finding seeds that can be applied to a wide range of
comparisons, and applying seed models to other computational biology areas, such as gene finding.
Keywords: cDNA, Genome, Spaced Seeds, Markov Model
1. Introduction. New high-throughput and cost-effective technologies have rev-
olutionized our ability to sequence complex organisms, and are expected to lead to a
significant increase in the number of available genomes for species from all branches
of life [1]. The first and most important step in analyzing these genomes is gene
annotation, that is, accurately identifying the locations and exon-intron structures of
genes along the genome, and further determining their function.
There are two primary classes of methods for identifying genes in a given genomic
sequence. The first class, ab initio methods (GenScan [2], Genie [3], GeneMark [4],
FGenesH [5]), use machine-learning techniques to analyze a single genomic sequence
and predict the locations of genes. Such methods are reasonably accurate at finding
coding exons, but are not effective at detecting untranslated regions (UTRs) and
alternatively spliced or overlapping genes [6].
The second class, comparative methods, predict exons based on sequence similarity
of protein or expressed DNA (cDNA, EST, mRNA) with genomic sequences containing
those genes. These methods are the most reliable for inferring the gene structure,
and thus genome annotation projects have routinely used cDNA sequences from the
same species to annotate genes. Although several projects exist that produce full-
length cDNA sequences [7–9], they focus on a handful of high-priority species, such
as human, mouse, rat, cow and zebrafish. For most newly sequenced species, few
native cDNA sequences are available in the databases. Consequently, gene annotation
∗Dedicated to Michael Waterman on the occasion of his 67th birthday.†Department of Health Information Management and McGowan Institute for Regenerative
Medicine, University of Pittsburgh, Pittsburgh, PA 15260, USA. E-mail: [email protected], corre-
sponding author.‡Department of Computer Science, George Washington University, Washington DC, 20052, USA.
E-mail: [email protected]§Center for Bioinformatics and Computational Biology, University of Maryland, College Park,
MD 20742, USA. E-mail: [email protected], corresponding author.
115

116 LEMING ZHOU, INGRID MIHAI, AND LILIANA FLOREA
projects for these genomes will need to rely instead on cDNA information from other
species. While several tools exist that map cDNA sequences to the genome of the
same species accurately and efficiently (sim4 [10], Spidey [11], BLAT [12], GMAP [13],
MGAlignIt [14], ESTmapper [6]), their performance drops in cross-species comparisons,
as the sequence similarity decreases. Furthermore, tools specialized for cross-species
comparisons (EXALIN [15], GeneSeqer [16], EST GENOME [17]) lack the speed required
for whole-genome annotation and are still very limited in the evolutionary range they
address. Therefore, there is a critical need for alignment tools for mapping gene
sequences to the genome of a related species accurately and efficiently.
The first and foremost limitation in aligning cross-species is the sensitivity of
alignment, in which the choice of seed is the most important factor. A seed is a match
pattern used to detect local alignments. For instance, blast [18,19] searches for exact
word matches of length 11 between the two sequences, which it later extends to local
alignments by allowing for gaps and substitutions. Such match pattern, or seed, is
called continuous, and can be represented as a pattern of 1s (11111111111), where each
1 represents a position required to match. The blast seed and its length variations
have served as match patterns for many generations of alignment programs, until its
limitations have recently been revealed. Indeed, the blast seed loses sensitivity as the
differences between the sequences increase with the evolutionary distance between the
compared species. Reducing the size of the seed increases its ability to detect weaker
similarities, however at a considerable loss in specificity.
Spaced seeds were recently introduced to increase alignment sensitivity with a
relatively small change in specificity. Unlike continuous seeds, spaced seeds allow
for some wildcard positions in the pattern, marked with 0s. For instance, the seed
11011011011011011 intuitively takes into account the weaker matching pattern at the
third (wobble) position in the codon to increase the success rate when mapping ESTs
or genes to target genomic sequences [20]. The length of the seed pattern is called
span, and the number of 1s in the seed is the weight of the seed. The definition
of weight may change for different classes of seeds, as we will see in later sections.
For the same weight, spaced seeds were shown to be more sensitive than continuous
seeds in most practical cases [21]. As many {0,1} seeds can be formed, even while
maintaining the weight constant, a natural question that arises is: Given an alignment
pattern, what is the best, or most sensitive, seed? Ma et al. [22] formally introduced
spaced seeds and proposed a mathematical framework for estimating the sensitivity
of a seed [23], which allowed them to determine optimal seeds for a class of alignment
applications. Refinements and extensions of their model to other classes of alignment
were soon proposed, and are reviewed in the following sections.
While sensitivity has been in the cross-hairs of seed design efforts, specificity has
received considerably less attention. Whereas sensitivity reflects the ability of a seed
to detect biologically meaningful sequence similarities, specificity measures the ability

CROSS-SPECIES CDNA-TO-GENOME SEQUENCE ALIGNMENT 117
of the seed to differentiate between true and spurious matches, and directly affects the
outcome as well as the speed of processing. We recently gave a rigorous formulation
for specificity for the case of cDNA-to-genome alignment and suggested strategies for
selecting accurate seeds that are both sensitive and specific [24].
As the field of seed design is maturing, new questions and challenges emerge from
their application to practical alignment tools and to other computational biology ar-
eas. So far seed theory has focused on designing good seeds for one comparison at
a time, usually using human-mouse as the model of interest. As the number of se-
quenced species increases, however, designing seeds for each individual comparison
quickly becomes prohibitive, given both the computational time involved and the in-
creased complexity when selecting the appropriate program parameters for a type of
comparison. A natural question that arises is: Are there seeds that can be used by
multiple comparisons, and under what conditions? We gave a preliminary characteri-
zation of both such seeds, which we call universal [25], and conditions [26], which we
review here.
The remainder of the paper is organized as follows: Section 2 describes the early
introduction of spaced seeds and more recent refinements and extensions, and the
application of seeds to alignment programs; Section 3 illustrates the general seed de-
sign framework in the context of our work with determining accurate (i.e., sensitive
and specific) spaced seeds for cDNA-to-genome comparison; Section 4 presents new
directions in seed design, including our ongoing work with characterizing and deter-
mining universal spaced seeds, and exploring the potential of using spaced seeds for
gene detection from sequence alignments. Lastly, Section 5 summarizes the results.
2. Background and Previous Work.
2.1. Intuitive Spaced Seeds. “Seeds” are match patterns used to locate re-
gions of similarity between two sequences. The first and most enduring seed pattern
was 11111111111, requiring an exact match of 11 contiguous bases. First introduced in
blast [18,19], it was later implemented, with length variations, in most alignment pro-
grams that succeeded it. Only recently spaced seeds were introduced, which allow for a
number of wildcard positions in the pattern, marked with 0s. Spaced seeds were infor-
mally used in programs such as WABA [20], a cDNA-to-genome alignment program,
where every third position was omitted from the comparison (11011011011011011),
consistently with the weaker match at the wobble codon position.
2.2. Formal Spaced Seeds Framework. Ma and co-authors formally intro-
duced the concept of spaced seeds in [22] and proposed a mathematical framework for
estimating the sensitivity of a seed given an alignment model and determining opti-
mal seeds [23]. Their framework consists of two components: a seed model, originally
a {0, 1} pattern as described above, and an alignment model. In a seed, 1s indicate
match positions and 0s indicate wildcard positions. Alignments are also represented
118 LEMING ZHOU, INGRID MIHAI, AND LILIANA FLOREA
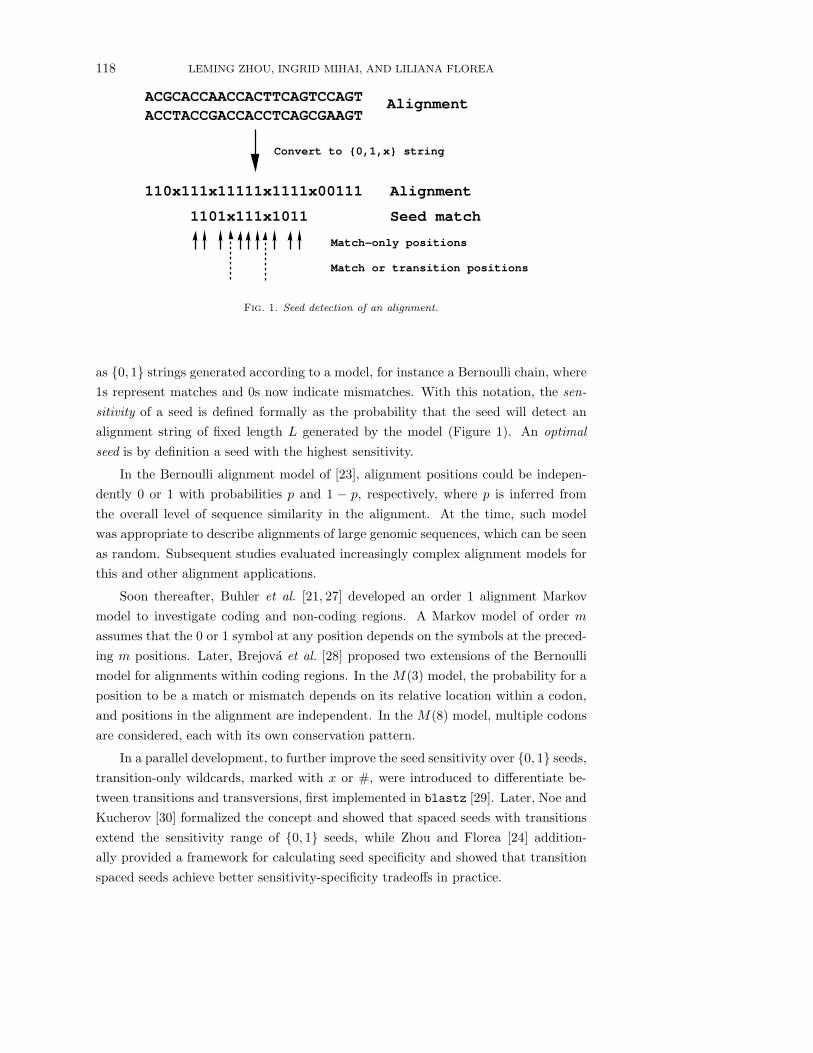
ACCTACCGACCACCTCAGCGAAGTAlignment
Convert to {0,1,x} string
1101x111x1011 Seed match
Match−only positions
ACGCACCAACCACTTCAGTCCAGT
110x111x11111x1111x00111 Alignment
Match or transition positions
Fig. 1. Seed detection of an alignment.
as {0, 1} strings generated according to a model, for instance a Bernoulli chain, where
1s represent matches and 0s now indicate mismatches. With this notation, the sen-
sitivity of a seed is defined formally as the probability that the seed will detect an
alignment string of fixed length L generated by the model (Figure 1). An optimal
seed is by definition a seed with the highest sensitivity.
In the Bernoulli alignment model of [23], alignment positions could be indepen-
dently 0 or 1 with probabilities p and 1 − p, respectively, where p is inferred from
the overall level of sequence similarity in the alignment. At the time, such model
was appropriate to describe alignments of large genomic sequences, which can be seen
as random. Subsequent studies evaluated increasingly complex alignment models for
this and other alignment applications.
Soon thereafter, Buhler et al. [21, 27] developed an order 1 alignment Markov
model to investigate coding and non-coding regions. A Markov model of order m
assumes that the 0 or 1 symbol at any position depends on the symbols at the preced-
ing m positions. Later, Brejova et al. [28] proposed two extensions of the Bernoulli
model for alignments within coding regions. In the M(3) model, the probability for a
position to be a match or mismatch depends on its relative location within a codon,
and positions in the alignment are independent. In the M(8) model, multiple codons
are considered, each with its own conservation pattern.
In a parallel development, to further improve the seed sensitivity over {0, 1} seeds,
transition-only wildcards, marked with x or #, were introduced to differentiate be-
tween transitions and transversions, first implemented in blastz [29]. Later, Noe and
Kucherov [30] formalized the concept and showed that spaced seeds with transitions
extend the sensitivity range of {0, 1} seeds, while Zhou and Florea [24] addition-
ally provided a framework for calculating seed specificity and showed that transition
spaced seeds achieve better sensitivity-specificity tradeoffs in practice.

CROSS-SPECIES CDNA-TO-GENOME SEQUENCE ALIGNMENT 119
2.2.1. Methods for Calculating Seed Sensitivity. The following two ques-
tions are at the heart of seed design efforts: i) What is the sensitivity of a seed given
a model of alignment? and ii) What is the best seed for that model?
To answer the first question, Keich et al. [23] gave a dynamic programming algo-
rithm for calculating seed sensitivity recursively, and Choi and Zhang [31] provided
a similar alternative. A more popular method was that proposed in [21], which used
tries and the Aho-Corasick algorithm [32] to construct a minimal Deterministic Finite
Automaton (DFA) recognizing all possible matches of the seed and to calculate their
probability, or equivalently the seed sensitivity, recursively. More recently, Kucherov
et al. [33,34] proposed a generalized framework for estimating the sensitivity of several
types of spaced seeds. Instead of the two components in the traditional framework,
namely a seed model and an alignment model, their framework uses three: the tar-
get alignments, a probability distribution of the alignments, and a seed model. This
formulation allows more efficient automata to be built, which speeds up the seed
sensitivity calculation.
To determine optimal seeds, in early work Keich et al. [23] determined optimal
spaced seeds by exhaustive search, calculating each seed’s sensitivity recursively. Such
a comprehensive approach was feasible given the relatively small seed space (11,440
seeds with weight 11 and span 18). As the space and complexity of the search in-
creased with larger seed spans and more sophisticated alignment models, heuristic
solutions were developed for optimizing seeds, which were shown to produce close ap-
proximations that worked well in practice. Among the most popular, a hill-climbing
heuristic algorithm was proposed in [21, 24] to speed up the search process. The al-
gorithm starts from a random seed and swaps any two distinct symbols with the goal
to optimize the sensitivity locally. If a better seed is found, it becomes the start seed
for variations in the next cycle, until there is no improvement to the seed sensitivity.
The procedure is restarted multiple times, to avoid convergence to a local optimum.
In [35], the authors exploit the structure of observed optimal seeds to derive rules
for pruning the search space, which they later refine in [36]. Lastly, an alternative
to the definition of seed sensitivity that is easier to compute and thus can be used
to design large seeds was introduced in [37]. It uses the overlap complexity of seeds
as a surrogate for sensitivity. This method, however, is only applicable to genomic
sequence alignment represented by Bernoulli models.
2.3. Generalized Spaced Seeds. Several variations of the traditional seed de-
sign model have been proposed, to further increase sensitivity. For instance, carefully
selected multiple seeds can be simultaneously used to improve alignment discovery.
Their set of hits is the union of the hits found by each seed. The formalism of multiple
seeds [38, 39] is a relatively straightforward extension of the single-seed models.
One generalization of spaced seeds that can also be applied to protein alignment

120 LEMING ZHOU, INGRID MIHAI, AND LILIANA FLOREA
is that of vector seeds [40]. Vector seeds model an alignment not as {0, 1} strings, but
as sequences of real numbers. Accordingly, each position in the seed pattern is a real
value representing the weight of a match or substitution at that position in the total
match score. A seed match is declared when the total score exceeds an a priori fixed
threshold.
Both multiple spaced seeds and vector seeds can further improve the sensitivity
over single spaced seeds, but they increase the memory and running time of searches,
both of which are critical for practical high-throughput applications.
2.4. Applications of Spaced Seeds to Alignment Programs. Since their
introduction in 2002, mathematically optimized spaced seeds have been rapidly adop-
ted by alignment programs. Optimal spaced seeds obtained in [22, 23] were imple-
mented in the programs PatternHunter [22] and blastz [29]. As a variation in-
tended to further increase seed sensitivity, blastz allows a transition (A↔G, C↔T)
at any one of the 12 match positions. This is the first example, albeit empirical, of
differentiating between transitions and transversions in alignments. Later, Noe and
Kucherov [30] used seed patterns of 0,1 and # (transition) symbols coupled with a
Bernoulli alignment model for non-coding regions and a hidden Markov model for
coding regions to search for optimal spaced seeds of weights 9 to 11, which they
implemented in their program YASS [41]. In different types of applications, Csuros
and Ma [42] developed an algorithm to reduce the memory usage for multiple spaced
seeds, and Flannick and Batzoglou [43] used multiple spaced seeds in an algorithm to
improve local alignment sensitivity. Lastly, multiple spaced seeds with two mismatch
positions were implemented in the tool ZOOM [44] for fast, high-throughput mapping
of short sequencing reads to a target genome.
2.5. Spaced Seeds for cDNA-to-Genome Alignment. Early work in de-
signing theoretically sensitive seeds has focused on seeds for aligning arbitrary genomic
sequences [21–23,27,31,35,36], due primarily to the simplicity of the alignment model.
As genomic sequences can be well approximated by a random model for most practi-
cal problems, a Bernoulli model is suitable in this case. A smaller number of studies
addressed optimal seeds for cDNA-to-genome alignments, usually as a particular case
of the general problem [21,27, 28].
Unlike genomic sequences, in which less than 2% of nucleotides typically rep-
resent coding material, cDNA sequences consist largely of protein coding regions,
and thus cDNA-to-genome alignments are expected to have more embedded sequence
compositional structure than alignments of random DNA. This includes effects of
transition-transversion biases [45], higher order statistical dependencies between po-
sitions [2], and periodicities due to the codon organization of sequences. These biases
translate into dependencies in the match patterns and, when incorporated into the
alignment model, are likely to lead to better seeds.

CROSS-SPECIES CDNA-TO-GENOME SEQUENCE ALIGNMENT 121
In the following section we describe our recent efforts with developing better
models for cDNA-to-genome alignment starting from the observations above, and use
them to illustrate the seed design framework.
3. Designing Sensitive and Specific Spaced Seeds. We illustrate the math-
ematical framework of seed design by focusing on the case of cDNA-to-genome align-
ment. We review the basic {0, 1} match-mismatch framework [22], then present an
extension that is better suited for this particular problem. In this context, using effi-
cient methods for estimating sensitivity and specificity we evaluate a large number of
seeds for a variety of seed weights, to assess their sensitivity-specificity tradeoffs and
ultimately design accurate seeds for practical applications.
3.1. Designing Sensitive Spaced Seeds.
3.1.1. The Basic {0,1} Framework. As we have mentioned earlier, the orig-
inal theoretical framework for assessing seed sensitivity has two components: a seed
model and an alignment model. A seed is a string of 0s and 1s that specifies a match
pattern between the sequences, where 1s represents match positions and 0s represent
wildcards. For instance, the WABA seed 11011011011011011 has the wildcard po-
sitions 3, 6, 9, 12 and 15. Conventionally, seeds must start with a 1 position. For
simplicity, a fixed span has been used in most cases (e.g., k = 22) [21,24,27] assuming
terminating positions to be 0s wherever necessary.
An alignment is represented as a string of 0s (mismatches) and 1s (matches)
generated from a model M, typically a Bernoulli or a Markov model. A seed S =
s1 . . . sk, s1 = 1, is said to detect the alignment A = a1 . . . aL ∈ {0, 1}L if there is a
match for the pattern in the alignment string such that all 1 positions in the seed
pattern map to 1 positions in the alignment, i.e. there exists an index i between 1
and L − k + 1 such that ai+l−1 =1 for all l with sl = 1 (Figure 1). In that case, the
seed is said to occur in the alignment a at position i. Given a seed, its theoretical
sensitivity is defined as the probability that it will detect a random alignment of
length L generated from the model M [21, 23], or equivalently:
Sn(S) = P ({A ∈ {0, 1}L | S detects A}).
Traditionally, the alignment length L has been set to 64, which is the average
length of a gap-free alignment in human-mouse comparisons. For a given seed, its
sensitivity can be computed exactly using dynamic programming [23, 27, 33], and
optimal or near-optimal seeds can be obtained with the exact or heuristic methods
reviewed in the previous section.
3.1.2. The Extended Codon-Sensitive {0, 1, x} Framework. Alignments of
coding sequences have characteristics that differentiate them from genomic sequence

122 LEMING ZHOU, INGRID MIHAI, AND LILIANA FLOREA
1321
2 3 1 2
3 21 3
Fig. 2. Position dependencies for an order 3 inhomogeneous, 3-periodic Markov model.
alignments, such as transition-transversion biases, higher order dependencies between
positions and periodicities due to the codon structure, and therefore require more
complex models. To account for the first of these characteristics, in previous work we
proposed a framework that differentiated between transitions and transversions, by
using an additional alphabet symbol x [24]. In the seed pattern, x marks a position
that allows transitions (A↔G, C↔T) but not transversions, while in the alignment
model it simply represents a transition (Figure 1). Furthermore, to reflect the period-
icity and higher order dependencies in the sequences of coding regions, the alignment
was modeled with a 3-periodic inhomogeneous Markov model consisting of 3 submodel
components, one for each position in the codon (Figure 2). The individual submodels
are Markov models of the same order m (m = 0 − 5). The definitions and methods
can be extended from the {0, 1} case in a straightforward way. The weight of the
new symbol x is 0.5. We denote (n1, n0, nx) the class of seed patterns with n1, n0
and nx symbols of 1, 0 and x, respectively, n1 + n0 + nx = k. Note that for a given
weight W , there may be multiple (n1, n0, nx) combinations with n1 + 0.5 · nx = W .
For instance, for the weight W = 10 and span k = 22 the following combinations are
possible: (10, 12, 0), (9, 11, 2), . . . , (0, 2, 20).
Theoretical Sensitivity Evaluation. To estimate seed sensitivity, we adopted and ex-
tended the method in [21] and the associated mandala software to allow transition
symbols. Briefly, the method builds a trie of all the alignment words that represent
seed matches, then converts the trie into a deterministic finite automaton (DFA) that
recognizes all and only those alignment strings containing a seed match, using the
Aho-Corasick algorithm [32]. The sensitivity of the seed is then computed recursively
from the automaton as the probability of all alignment strings of length L = 64 that
are recognized by the automaton. The detailed implementation for the {0, 1, x} case
can be found in [24].
Empirical Evaluation. We complemented our theoretical studies with empirical eval-
uations, both to identify a suitable alignment model and to validate our predic-
tions. Specifically, empirical tests were performed to test the ability of a seed to

CROSS-SPECIES CDNA-TO-GENOME SEQUENCE ALIGNMENT 123
accurately match coding exons between two species, for instance when searching for
chicken exons against the human genome [24]. Empirical sensitivity was calculated
as the fraction of human exons in the reference set that are detected by the seed:
Sne = TP/(TP + FN) [46]. Here, TP is the number of true positives, defined as
orthologous exon pairs detected by the seed, and FN represents the numbers of false
negatives, or missed pairs.
Comparisons between the empirical and the predicted behavior of seeds revealed
that higher order Markov models (m = 3 − 5) are more accurate descriptors of the
empirical data and lead to better seeds than those produced by earlier lower-order
models. Additionally, changing a 0 into a transition symbol in a {0, 1} seed roughly
doubles the specificity for only a small decrease in sensitivity, and thus offers a better
sensitivity-specificity tradeoff compared to {0, 1} seeds in practice [24, 30]. Based on
these analyses, an order 3 inhomogeneous 3-periodic Markov model of alignment was
chosen for our comprehensive seed evaluation in section 3.3.
3.2. Designing Specific Spaced Seeds. While sensitivity has been at the
forefront of seed design efforts, specificity has received considerably less attention.
Decreasing the seed weight generally increases sensitivity, but at a loss in specificity.
Understanding the tradeoffs between these two properties is essential to designing ac-
curate seeds that can work efficiently in practical alignment applications. We present
the theoretical framework and methods we proposed in [24] for evaluating seed speci-
ficity in the case of {0, 1, x} spaced seeds for cDNA-to-genome alignment. Similar
methods need to be developed for other types of models and seeds.
3.2.1. Evaluating Seed Specificity. We begin by presenting the intuition be-
hind our definition of specificity. When mapping cDNA sequences to a target genome,
consecutive k-mers in the cDNA query are searched against the genome sequence. The
search will find at most one true positive match, namely its ortholog on the genome,
and a variable number of false positives, which add to both processing time and pro-
gram complexity. Thus, intuitively, we define the specificity of a seed as the inverse of
the expected number of matches in the genome for a generic k-mer via the particular
seed, H(S):
(1) Sp(S) =1
H(S)=
1
ES [H ]
Here, H(w) is a random variable representing the expected number of (overlap-
ping) matches of a k-mer w in the genome sequence via seed S. Assuming probabilistic
models for both the gene and the genomic sequences, the above term can be written
as:

124 LEMING ZHOU, INGRID MIHAI, AND LILIANA FLOREA
(2) ES [H ] =∑
w∈{A,C,G,T}k
Pc(w)H(w) =∑
w∈{A,C,G,T}k
Pc(w)E[NS(w)]
where Pc(w) is the probability of w in the coding sequences, and NS(w) is a random
variable denoting the number of matches of w in the genome via seed S. For a
continuous seed, this is the number of occurrences of w in the genome. For a spaced
seed containing wildcard positions, it is the number of occurrences of all words w′
that are compatible with w via seed S. For instance, for the word AAGCT and the
seed S = 1x111, the set of compatible words is {AAGCT, AGGCT }.
In [24] we derived a closed formula and recurrences to efficiently calculate seed
specificity for the case of Bernoulli and Markov models of gene sequences and for a
Bernoulli or order 1 Markov model of the genome.
Theoretical Evaluation. The definition and recurrences mentioned above allowed us to
calculate specificity values for a large number of seeds exactly and efficiently. Species-
specific mRNA sequences were downloaded from the NCBI RefSeq repository [9] and
used to train Bernoulli and Markov models of coding sequences. Similarly, nucleotide
and di-nucleotide frequencies obtained from the human genome version HG17 were
used to train the two genome models.
Empirical Evaluation. As before, empirical testing was performed to calibrate and
validate the theoretical models. Empirical specificity was calculated as the inverse
of the average number of seed matches in the human genome for a generic k-mer in
the query: Spe = 1/((TP + FP )/#k-mers). This definition mirrors the theoretical
formulation described earlier.
Comparisons of empirical and predicted seed behavior allowed us to determine
the most accurate model for use in our comprehensive evaluation. As we found ear-
lier for sensitivity, higher-order Markov models of coding sequences provided a highly
accurate approximation of the real specificity values, while the Markov genome model
best captured the actual amount of specificity change as the weight of the seed de-
creased. Therefore, an order 1 Markov genome model and order 2 Markov coding
sequence models were chosen for further evaluations.
3.3. Comprehensive Seed Evaluation. The models and methods developed
above allowed us to evaluate a large number of seeds in a short amount of time, to
assess their tradeoffs between sensitivity and specificity. We analyzed seeds in seven
weight groups (W = 10 . . .16) and for all feasible (n1, n0, nx) combinations. For each
combination, the hill-climbing heuristic described in section 2 was used to estimate the
maximum and minimum sensitivity and specificity. The results are plotted linearly

CROSS-SPECIES CDNA-TO-GENOME SEQUENCE ALIGNMENT 125
for sensitivity, and on a log-scale for specificity, for the particular case of human-
chicken comparison (Figure 3). Similar plots were obtained for other species (data
not shown).
0
0.2
0.4
0.6
0.8
1
9 10 11 12 13 14 15 16 17
Sen
sitiv
ity
W
0.0001
0.001
0.01
0.1
1
9 10 11 12 13 14 15 16 17
Spe
cific
ity
W
Fig. 3. Sensitivity (left, linear-scale) and specificity (right, log-scale) ranges for seeds of weight
W = 10 . . . 16, using an order 3 Markov model alignment representation for sensitivity evaluation,
and using an order 1 genome Markov model and an order 2 Markov model for coding sequences
for specificity. For each weight W , (n1, n0, nx) combinations are shown right-to-left starting with
nx = 0 and subsequently increasing nx. Reproduced from [24] with permission from Mary Ann
Liebert, Inc.
As the plots illustrate, sensitivity varies widely among seeds within each weight
group and each (n1, n0, nx) combination. Although the combinations have different
ranges of variation and maximum sensitivity, the pattern of variation is consistent
among the different weight groups. Furthermore, for the chicken-human comparison
we used as example, the highest sensitivity was achieved for seeds with a small (2-4)
number of transition symbols. This number is comparison-specific and varies with
the transition-transversion ratio [25]. For instance, the human-mouse comparison,
which has a higher transition-transversion ratio (κm = 1.73 > κc = 1.17), shows
an increased affinity for transition symbols (6-8). Furthermore, this number reflects
the gain in sensitivity that can be obtained by incorporating transitions compared to
{0, 1} seeds.
In contrast, specificity is almost constant within each weight group, and shows
a discrete range of steps. As the weight of the seed increases, specificity grows by
a factor of roughly 3.6 with each additional unit. These observations suggest the
following strategy for selecting seeds for practical applications: first determine the
seed weight based on an acceptable sensitivity-specificity tradeoff, then select the
most sensitive seed in that weight group.
4. Other Problems in Seed Design. The framework and methods described
in the previous sections were designed to optimize seeds for one comparison at a
time. With the improvement in sequencing technologies, the number of sequenced
organisms has grown significantly in recent years, with more genomes and other se-
quence data to become available in the near future. Finding optimal seeds for each
126 LEMING ZHOU, INGRID MIHAI, AND LILIANA FLOREA
pairwise comparison quickly becomes prohibitive, both because of the computational
costs involved and because of the difficulty that it poses to alignment program de-
velopers and users. For practical reasons, therefore, it becomes desirable to identify
a small number of seeds that would perform well for a wide range of comparisons.
Several studies [31, 35, 36] determined and analyzed best seeds for various sequence
identity levels p under a Bernoulli model of alignment, in a greatly simplified model of
evolutionary distance. This simple p-level representation of evolutionary sequence di-
vergence is likely inadequate for coding sequences, which are under a more diverse set
of evolutionary pressures. In this section we present two recent approaches: i) finding
universal (good) seeds, or seeds that work well across different classes of compar-
isons [25], and ii) clustering comparisons into seed-equivalent groups and determining
best seeds for each group [26].
4.1. Determining Universal Seeds. We sought to observe the behavior of
seeds, and in particular good seeds, across different classes of comparisons, with
the goal to characterize and ultimately determine universal seeds. We focused on
four comparisons (human-mouse, human-dog, human-chicken, and human-zebrafish),
which coarsely sample the range of vertebrate evolutionary distances. For simplicity,
we will refer to each comparison by the name of the second organism (DOG, MUS,
CHK, ZFS). Using the extended framework of the previous section, we evaluated seeds
exhaustively for several weights, and analyzed the distributions of seed sensitivities
between the models.
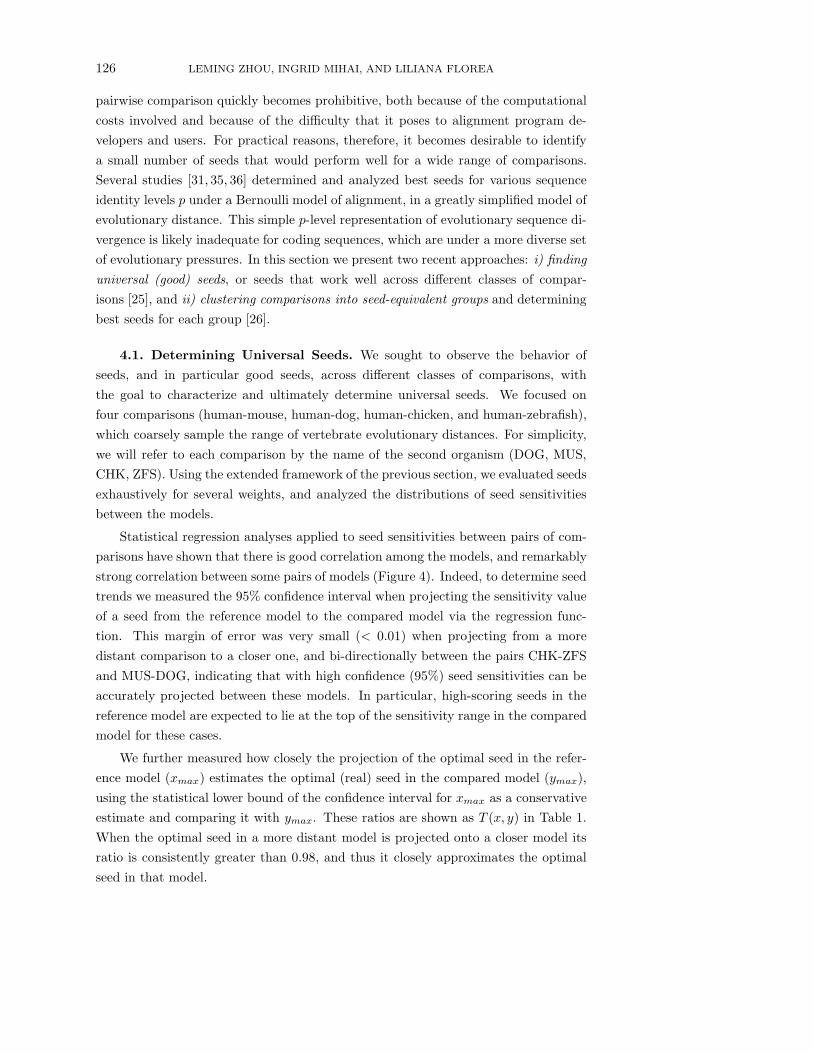
Statistical regression analyses applied to seed sensitivities between pairs of com-
parisons have shown that there is good correlation among the models, and remarkably
strong correlation between some pairs of models (Figure 4). Indeed, to determine seed
trends we measured the 95% confidence interval when projecting the sensitivity value
of a seed from the reference model to the compared model via the regression func-
tion. This margin of error was very small (< 0.01) when projecting from a more
distant comparison to a closer one, and bi-directionally between the pairs CHK-ZFS
and MUS-DOG, indicating that with high confidence (95%) seed sensitivities can be
accurately projected between these models. In particular, high-scoring seeds in the
reference model are expected to lie at the top of the sensitivity range in the compared
model for these cases.
We further measured how closely the projection of the optimal seed in the refer-
ence model (xmax) estimates the optimal (real) seed in the compared model (ymax),
using the statistical lower bound of the confidence interval for xmax as a conservative
estimate and comparing it with ymax. These ratios are shown as T (x, y) in Table 1.
When the optimal seed in a more distant model is projected onto a closer model its
ratio is consistently greater than 0.98, and thus it closely approximates the optimal
seed in that model.

CROSS-SPECIES CDNA-TO-GENOME SEQUENCE ALIGNMENT 127
Fig. 4. Scatterplots of seed sensitivity values for pairs of comparisons among (DOG, MUS,
CHK, ZFS). The non-linear regression (solid) and the 95% confidence interval (dashed) curves are
shown.
These findings, validated by empirical evaluations, suggest that simply selecting
top scoring seeds in the most distant model, in our case ZFS, with high probability
will lead to good seeds for all other models, and therefore provide a simple strategy
for determining universal good seeds.
There is yet another observation critical for designing seeds for multiple compar-
isons that this analysis revealed: similar comparisons render similar behavior of seeds,
and in particular best seeds. We call such pairs of comparisons seed-equivalent. In our
case, (ZFS, CHK), and (DOG,MUS) are sufficiently close to be seed-equivalent. In the
following section we exploit this finding in determining conditions for seed-equivalence
and employ them to cluster comparisons into groups that each can be served by the
same optimal seed.
4.2. Determining Seeds for Seed-Equivalent Comparisons. We observed
the existence of seed-equivalent models when comparing seed behavior between com-
parisons with statistical regression methods, using exhaustive calculations of seed
sensitivities. One outstanding question is how to determine whether two models are

128 LEMING ZHOU, INGRID MIHAI, AND LILIANA FLOREA
Table 1
Comparison of seed sensitivity distributions between models. ymin,max are the minimum and
maximum sensitivity in the compared model; xmax is the maximum sensitivity in the reference
model; tα/2σy is half the length of the 95% prediction interval (tα/2 = 1.96 when α = 0.05);
T (x, y) = ((a + bxmax + cx2max + dx3
max) − tα/2σy)/ymax, where a, b, c and d are the coefficients of
the regression curve, and σy is the estimated regression standard error of prediction for a given x
value. Because the number of values is large, σy ≃ σ for all y. Reproduced from [25] with permission
from BioMed Central Ltd.
xmax ymax ymin tα/2σy T (x, y)
W=12, population size = 352716.
CHK-DOG 0.742 0.992 0.936 0.002 0.996
DOG-CHK 0.992 0.742 0.429 0.028 0.947
CHK-MUS 0.742 0.964 0.827 0.005 0.991
MUS-CHK 0.964 0.742 0.429 0.017 0.978
CHK-ZFS 0.742 0.476 0.196 0.006 0.995
ZFS-CHK 0.476 0.742 0.429 0.006 0.984
DOG-MUS 0.992 0.964 0.827 0.004 0.996
MUS-DOG 0.964 0.992 0.936 0.001 0.999
DOG-ZFS 0.992 0.476 0.196 0.033 0.866
ZFS-DOG 0.476 0.992 0.936 0.003 0.995
MUS-ZFS 0.964 0.476 0.196 0.023 0.934
ZFS-MUS 0.476 0.964 0.827 0.006 0.988
sufficiently close to be seed-equivalent without the expensive calculation of seed sensi-
tivities. Once a suitable measure for model similarity is determined, it can be used to
cluster comparisons into seed-equivalent groups and then design seeds for each group.
We ask the following questions: i) How do we measure the closeness of comparisons?
ii) How do we group comparisons? iii) How do we validate the groups?
We investigate the relationship between alignment Markov models using a conven-
tional distance measure between their probability distributions. The Kullback-Leibler
Divergence (KLD) [47] can be applied on the space of alignment words X = {0, 1, x}64
to produce a distance between the two models:
KLD(P, Q) =∑
w∈X
p(w) logp(w)
q(w)
KLD(P, Q) represents the relative entropy of P over Q, or the information gain
about X when P is used instead of Q. The KLD measure is non-symmetrical, i.e.
KLD(P, Q) 6= KLD(Q, P ), and therefore can capture unidirectional relationships. In
the case of the four comparisons above (DOG, MUS, CHK and ZFS), the more distant
comparisons contain consistently more information than the closer ones [25]. A metric
distance, which is symmetrical, can then be defined as 1
2(KLD(P, Q)+KLD(Q, P )).

CROSS-SPECIES CDNA-TO-GENOME SEQUENCE ALIGNMENT 129
L4L4
L3
L1
1L
L2
L3 L2
L4
Zebrafish
Fugu fishFrogChickenOpossum
Cow
Dog
RatMouseMacaqueChimp
Human
L1
L2
Fig. 5. Phylogenetic tree of 12 species.
To validate the metric, we applied it to a larger set of species, including human,
chimp, macaque, mouse, rat, cow, dog, opossum, chicken, frog, fugu, and zebrafish.
The comparisons are not limited to those between human and other species, but rather
extend to all 66 pairwise comparisons of the 12 species, and thus offer a wide diversity
of evolutionary distances and mutation patterns. KLD distances between Markov
models were calculated and used to generate a distance profile for each comparison.
A profile is the vector of KLD distances of one comparison with all comparisons.
Profiles were then clustered using hierarchical clustering with the Pearson correlation
coefficient to create groups of similar comparisons.
Remarkably, the 66 comparisons fall into four clusters [26] closely corresponding
to the different depths of the phylogenetic tree of the species (Figure 5): cluster L1
contains comparisons between evolutionarily very close species (5-12 Million Years
divergence) at or close to the leaf-level in the phylogenetic tree of the species; cluster
L2 represents comparisons at the intermediate (90 - 110 Million Years divergence),
between primates and the rodent, artyodactil or carnivore species; cluster L3 shows
comparisons between relatively diverged species (160-310 Million Years divergence),
such as between chicken or opossum and the rest of the mammals; lastly, cluster L4
represents some of the most distant comparisons among vertebrates (>350 Million
Years divergence), between frog or fishes and the rest of the clades, at the deepest
levels in the phylogenetic tree.
We optimize seeds for each cluster and for each comparison in the clusters, using
the framework described earlier, and validate them by comparing their performance
within their group and in the other groups. Indeed, seeds optimized for one clus-
ter performed best on their own cluster and on the individual comparisons within
that cluster. Based on this large scale clustering and validation analysis, it can be

130 LEMING ZHOU, INGRID MIHAI, AND LILIANA FLOREA
concluded that our method of clustering models based on their KLD distance profile
followed by optimizing seeds for each group can be effectively and reliably used to
determine a small number of seeds with wide applicability among a variety of com-
parisons.
These findings have important implications for developing robust and user-friend-
ly alignment tools [48], by providing program developers with a small and easily
tunable set of parameters, and providing a unified and easy to use interface to the
users, who can now seamlessly use the tool without regard to the species compared.
4.3. Applying Seeds to Gene Detection. Gene annotation by mapping for-
eign cDNAs to genomic sequence will fail when no copies of a gene are available.
However, sufficient information is present in the genomic alignments to allow inferring
gene regions. Indeed, gene regions will exhibit higher sequence similarity compared
to non-coding DNA, as natural selection lowers the rates at which mutations are in-
corporated in gene regions. Moreover, they show higher-level dependencies between
positions and periodicities due to the codon organization of genes, all of which dif-
ferentiate them from other DNA sequences. Seeds optimized for cDNA-to-genome
comparisons capture the characteristics of gene regions in sequence alignments in a
natural way, and therefore may be apt to locate genes for which no other information
is available.
We have started to explore the use of seeds to differentiate between gene and
non-gene regions by exploiting the differences in their match patterns among the
three reading frames. Indeed, some seeds appear to match differentially among the
three reading frames when applied to coding regions, having a significantly higher or
lower match probability in one of the frames compared to the others [24], whereas
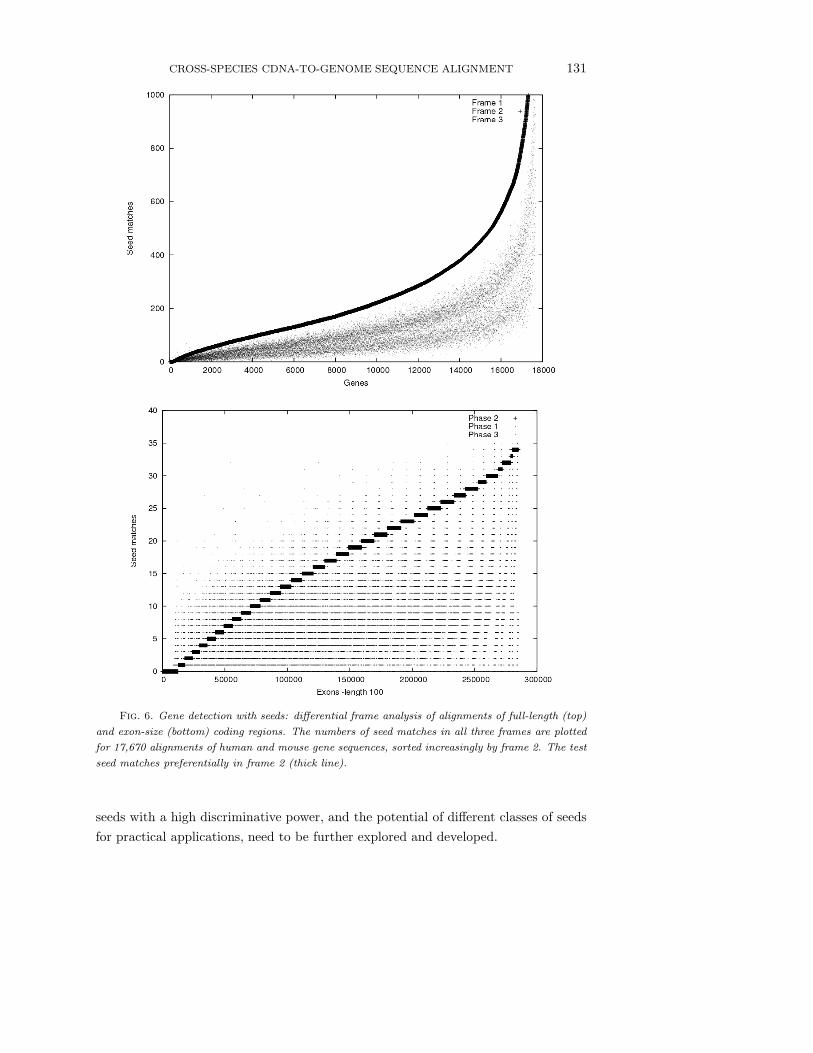
they show no bias in non-coding regions. To assess empirically the ability of codon-
sensitive seeds to distinguish among the three frames, we applied seeds derived in our
previous studies [25] to the coding region alignments of 17,670 orthologous human
and mouse mRNA sequences obtained from the project HomoloGene [49], counting
the number of seed matches within the alignment strings for each frame (Figure 6).
Since in eukaryotic species coding regions appear as short exons interspersed with
introns, we performed a similar experiment on sets of short coding regions of fixed
length (51 bp, 102 bp, 150 bp and 201 bp) cut from the alignments of full-length
sequences. These preliminary analyses reveal significant frame differences when ap-
plying specific transition spaced seeds to all three frames of human-mouse pairwise
alignments of gene sequences. Although the sensitivity decreases slightly with the
length of the target regions, this simple seed match counting method achieves 92%
sensitivity on the 150 bp data set, corresponding to the average length of coding
exons. Thus, spaced seeds appear to be a promising instrument for detecting genes
in genomic sequence alignments. The theoretical foundations for selecting sensitive
CROSS-SPECIES CDNA-TO-GENOME SEQUENCE ALIGNMENT 131
Fig. 6. Gene detection with seeds: differential frame analysis of alignments of full-length (top)
and exon-size (bottom) coding regions. The numbers of seed matches in all three frames are plotted
for 17,670 alignments of human and mouse gene sequences, sorted increasingly by frame 2. The test
seed matches preferentially in frame 2 (thick line).
seeds with a high discriminative power, and the potential of different classes of seeds
for practical applications, need to be further explored and developed.
132 LEMING ZHOU, INGRID MIHAI, AND LILIANA FLOREA
5. Conclusions. We reviewed recent developments in spaced seed design for
cross-species cDNA-to-genome alignment, starting from the original framework and
continuing with extensions to address both traditional and novel problems in seed de-
sign. Compared to genomic sequences, which are roughly randomly distributed, gene
sequences have significantly more sequence compositional structure, such as periodic-
ities due to codon organization, higher-order position dependencies and characteristic
transition-transversion biases. By incorporating these features into a new framework,
which allows transition wildcards within seeds, we were able to find more accurate,
higher-order models that produced more sensitive seeds.
Designing good seeds for accurate alignment programs must balance sensitivity
and specificity. We present a first theoretical framework we developed earlier for
estimating the specificity of a seed, based on its expected number of matches in the
genome sequence, and use it to analyze the sensitivity and specificity of a large number
of seeds in parallel. These analyses showed that while sensitivity varies widely among
seeds with the same weight, specificity is relatively constant. In particular, they clearly
indicate that spaced seeds with transitions designed by these models offer better
sensitivity-specificity tradeoffs compared to traditional {0, 1} seeds. Furthermore, the
interplay between sensitivity and specificity suggests a clear strategy to determine the
best seeds in practice, by first choosing the desired level of specificity and sensitivity
tradeoff by selecting the seed weight, and then selecting the most sensitive seed within
that weight group. This comprehensive and systematic seed evaluation provides the
blueprint for selecting accurate, i.e. both sensitive and specific, seeds for a wide variety
of practical applications.
As the number and variety of sequenced species increases, for practical reasons it
becomes desirable to determine a small number of seeds that are applicable to a wide
range of comparisons. This new consideration brings a shift from the single to the
multi-comparison paradigm in seed design. We propose two solutions, namely deter-
mining universal seeds that work well for classes of comparisons across evolutionary
distances and, at a higher resolution, designing seeds for groups of seed-equivalent
comparisons, clustered based on model similarity. These findings have important im-
plications for developing robust programs that are easy to use, with a relatively small
set of parameters that can be accurately tuned and easily understood by the users.
Lastly, we proposed that spaced seeds may be used as ‘machine-learning’ models in
other areas of computational biology, such as gene finding.
Future work will be needed to extend the methods presented here, in particular
mapping the sensitivity-specificity tradeoffs, to other categories of seeds, to improve
the efficiency of seed design for single and multiple comparisons, to design seeds and
new seed models to support the alignment of sequences produced by new sequencing
technologies, to develop more efficient ways to incorporate seeds into alignment tools,
and to explore the potential of seeds in other application areas.
CROSS-SPECIES CDNA-TO-GENOME SEQUENCE ALIGNMENT 133
Acknowledgments. This work was supported in part by a Sloan Research Fel-
lowship to Liliana Florea. The comprehensive seed evaluation was performed on the
“Herd” Scientific Computing Cluster at The George Washington University.
REFERENCES
[1] National Human Genome Research Institute, Listing of Genome Sequencing Proposals.
[http://www.genome.gov/10002154].
[2] C. Burge and S. Karlin. Prediction of complete gene structures in human genomic DNA. J
Mol Biol. 268 (1997), pp. 78–94.
[3] D. Kulp, D. Hussler, M. Reese, and F. Eeckman. A generalized hidden Markov model for
the recognition of human genes in DNA. Proc Int Conf Intell Syst Mol Biol. 4(1996), pp.
134–142.
[4] A. Lukashin and M. Borodovsky. GeneMark.hmm: New solutions for gene finding. Nucleic
Acids Res. 26(1998), pp. 1107–1115.
[5] A. Salamov and V. Solovyev. Ab initio gene finding in Drosophila genomic DNA. Genome
Res. 10:4(2000), pp. 516–522.
[6] L. Florea, V. Di Francesco, J. Miller, R. Turner, C. Mobarry, A. Yao, M. Harris,
B. Walenz, I. Dew, G. Merkulov, R. Charlab, Z. Deng, S. Istrail, P. Li, and G.
Sutton. Gene and alternative splicing annotation with AIR. Genome Res. 15(2005), pp.
54–66.
[7] Y. Okazaki, M. Furuno, T. Kasukawa, J. Adachi, H. Bono, S. Kondo, I. Nikaido, N.
Osato, R. Saito, and H. Suzuki et al. Analysis of the mouse transcriptome based on
functional annotation of 60,770 full-length cDNAs. Nature, 420(2002), pp. 563–573.
[8] MGC Project Team. The status, quality, and expansion of the NIH full-length cDNA project:
the Mammalian Gene Collection (MGC). Genome Res. 14(2004), pp. 2121-2127.
[9] K. Pruitt, T. Tatusova, and D. Maglott. NCBI Reference Sequence (RefSeq): a curated
non-redundant sequence database of genomes, transcripts and proteins. Nucleic Acids Res.
35(2007), pp. D61–D65.
[10] L. Florea, G. Hartzell, Z. Zhang, G. Rubin, W. Miller. A computer program for aligning
a cDNA sequence with a genomic DNA sequence. Genome Res. 8:9(1998), pp. 967–974.
[11] S.J. Wheelan, D.M. Church and J.M. Ostell. Spidey: a tool for mRNA to genomic align-
ments. Genome Res. 11:11(2001), pp. 1952–1957.
[12] W.J. Kent. BLAT – the BLAST-like alignment tool. Genome Res. 12(2002), pp. 656-664.
[13] T.D. Wu and C.K. Watanabe. GMAP: a genomic mapping and alignment program for mRNA
and EST sequences. Bioinformatics, 21(2005), pp. 1859–1875.
[14] B.T.K. Lee, T.W. Tan, and S. Ranganathan. MGAlignIt: a web service for the alignment
of mRNA/EST and genomic sequences. Nucl. Acids Res. 31:13(2003), pp. 3533–3536.
[15] M. Zhang and W. Gish. Improved spliced alignment from an information theoretic approach.
Bioinformatics. 22:1(2006), pp. 13–20.
[16] J. Usuka, W. Zhu, and V. Brendel. Optimal spliced alignment of homologous cDNA to a
genomic DNA template. Bioinformatics. 16:3(2000), pp. 203–211.
[17] R. Mott. EST GENOME: a program to align spliced DNA sequences to unspliced genomic
DNA. Comput. Appl. Biosci. 13:4(1997), pp. 477–478.
[18] S. Altschul, W. Gish, W. Miller, E. Myers, D. Lipman. Basic local alignment search tool.
J Mol Biol. 215:3(1990), pp. 403–410.
[19] S. Altschul, T. Madden, A. Schaffer, J. Zhang, Z. Zhang, W. Miller, D. Lipman.
Gapped BLAST and PSI-BLAST: A new generation of protein database search programs.
Nucleic Acids Res. 25:17(1997), pp. 3389–3402.

134 LEMING ZHOU, INGRID MIHAI, AND LILIANA FLOREA
[20] W. Kent and A. Zahler. Conservation, regulation, synteny, and introns in a large-scale C.
briggsae-C. elegans genomic alignment. Genome Res. 10:8(2000), pp. 1115–1125.
[21] J. Buhler, U. Keich U, and Y. Sun. Designing seeds for similarity search in genomic DNA. In
Proceedings of the Seventh Annual International Conference on Computational Molecular
Biology (RECOMB 2003). 7(2003), pp. 67–75.
[22] B. Ma, J. Tromp, and M. Li. PatternHunter: faster and more sensitive homology search.
Bioinformatics. 18:3(2002), pp. 440–445.
[23] U. Keich, M. Li, B. Ma, and J. Tromp. On spaced seeds for similarity search. Discrete Appl
Math. 138:3(2004), pp. 253–263.
[24] L. Zhou and L. Florea. Designing sensitive and specific spaced seeds for cross-species mRNA-
to-genome alignment. J Comput Biol. 14:2(2007), pp. 113–130.
[25] L. Zhou, J. Stanton, and L. Florea. Universal seeds for cDNA-to-genome comparison, BMC
Bioinformatics, 9:36(2008).
[26] L. Zhou, I. Mihai, and L. Florea. Effective cluster-based seed design for cross-species se-
quence comparison. Bioinformatics, 24:24(2008), pp. 2926-2927.
[27] J. Buhler, U. Keich, Y. Sun. Designing seeds for similarity search in genomic DNA. J
Comput Syst Sci. 70:3(2005), pp. 342–363.
[28] B. Brejova, D. Brown, and T. Vinar. Optimal spaced seeds for homologous coding regions.
J Bioinform Comp Biol. 1:4(2004), pp. 595–610.
[29] S. Schwartz, W. Kent, A. Smit, Z. Zhang, R. Baertsch, R. Hardison, D. Haussler,
and W. Miller. Human-mouse alignments with BLASTZ. Genome Res. 13(2003), pp.
103–107.
[30] L. Noe and G. Kucherov. Improved hit criteria for DNA local alignment. BMC Bioinformat-
ics. 5:149(2004),
[31] K. Choi and L. Zhang. Sensitivity analysis and efficient method for identifying optimal spaced
seeds. J Comp Syst Sci. 68(2004), pp. 22–40.
[32] A. Aho and M. Corasick. Efficient string matching: an aid to bibliographic search. Comm
ACM. 18:6(1975), pp. 333–340.
[33] G. Kucherov, L. Noe, and M. Roytberg. A unifying framework for seed sensitivity and its
application to subset seeds. J Bioinform Comp Biol. 4:2(2006), pp. 553–569.
[34] G. Kucherov, L. Noe, and M. Roytberg. Subset Seed Automaton, Proceedings of the 12th
International Conference on Implementation and Application of Automata (CIAA 2007),
Prague, Czech Republic, July 16-18, 2007. LNCS, 4783(2007), pp. 180-191. Holub J and
Zdarek J, Eds.
[35] K. Choi, F. Zeng, and L. Zhang. Good spaced seeds for homology search. Bioinformatics.
20:7(2004), pp. 1053–1059.
[36] F. Preparata, L. Zhang, and K.P. Choi. Quick, practical selection of effective seeds for
homology search. J Comput Biol. 12:9(2005), pp. 1137–1152.
[37] L. Ilie and S. Ilie. Multiple spaced seeds for homology search, Bioinformatics, 23:22(2007),
pp. 2969–2977.
[38] M. Li, B. Ma, D. Kisman, and J. Tromp. PatternHunter II: highly sensitive and fast homology
search. J Bioinf Comp Biol. 2(2002), pp. 411–439.
[39] Y. Sun and J. Buhler. Designing multiple simultaneous seeds for DNA similarity search. J
Comput Biol. 12:6(2005), pp. 847–861.
[40] B. Brejova, D. Brown, and T. Vinar. Vector seeds: an extension to spaced seeds. J Comput
Syst Sci. 70:3(2005), pp. 364–380.
[41] L. Noe and G. Kucherov. YASS: enhancing the sensitivity of DNA similarity search. Nucleic
Acid Res. 33(2005), pp. W540–W543.
[42] M. Csuros and B. Ma. Rapid homology search with two-stage extension and daughter seeds.
In: COCOON 2005 - Eleventh International Computing and Combinatorics Conference.

CROSS-SPECIES CDNA-TO-GENOME SEQUENCE ALIGNMENT 135
Springer LNCS 3595 (2005), pp. 104–114.
[43] J. Flannick and S. Batzoglou. Using multiple alignments to improve seeded local alignment
algorithms. Nucleic Acids Res. 33:14(2005), pp. 4563–4577.
[44] H. Lin, Z. Zhang, M.Q. Zhang, B. Ma, and M. Li, ZOOM! Zillions of oligos mapped,
Bioinformatics, 24:21(2008), pp. 2431-2437.
[45] M. Nei and S. Kumar. Molecular evolution and phylogenetics. New York: Oxford University
Press, 2000.
[46] M. Burset and R. Guigo. Evaluation of gene structure prediction programs. Genomics.
34:3(1996), pp. 353–367.
[47] T. Cover and J. Thomas. Elements of information theory. New York: John Wiley & Sons,
Inc. 1991.
[48] L. Zhou, A. Delcher, M. Pertea, and L. Florea. Sim4cc - A cross-species cDNA-to-genome
alignment tool. Nucleic Acids Res. 37:11(2009), pp. e80.
[49] HomoloGene. [http://www.ncbi.nlm.nih.gov/sites/entrez?db=homologene].

136 LEMING ZHOU, INGRID MIHAI, AND LILIANA FLOREA