Embed Size (px)
Citation preview
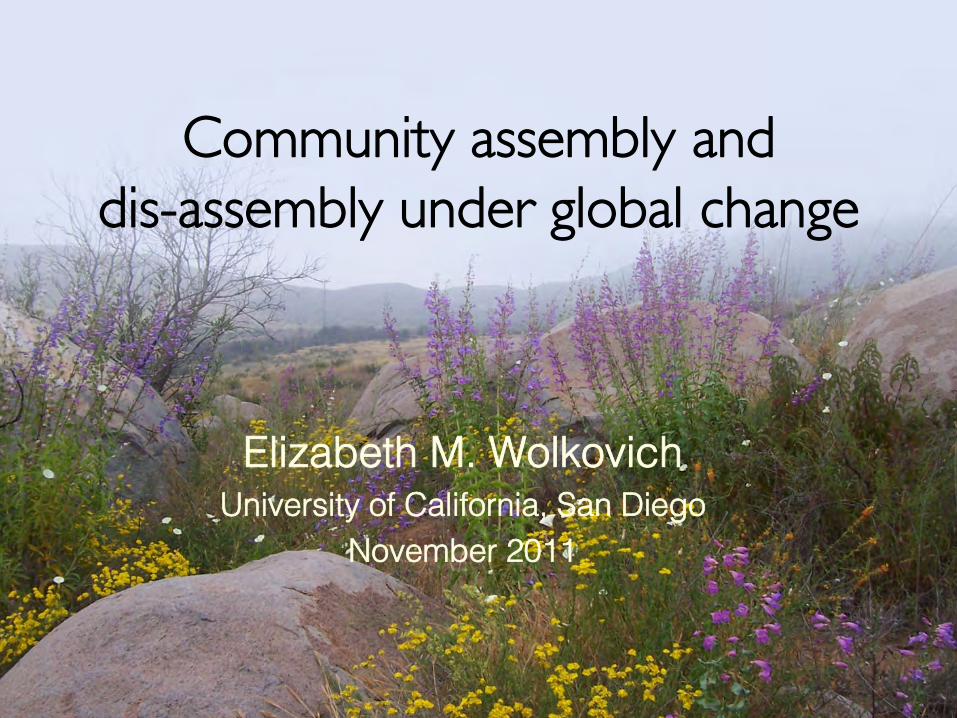
Community assembly anddis-assembly under global change
Elizabeth M. WolkovichUniversity of California, San Diego
November 2011
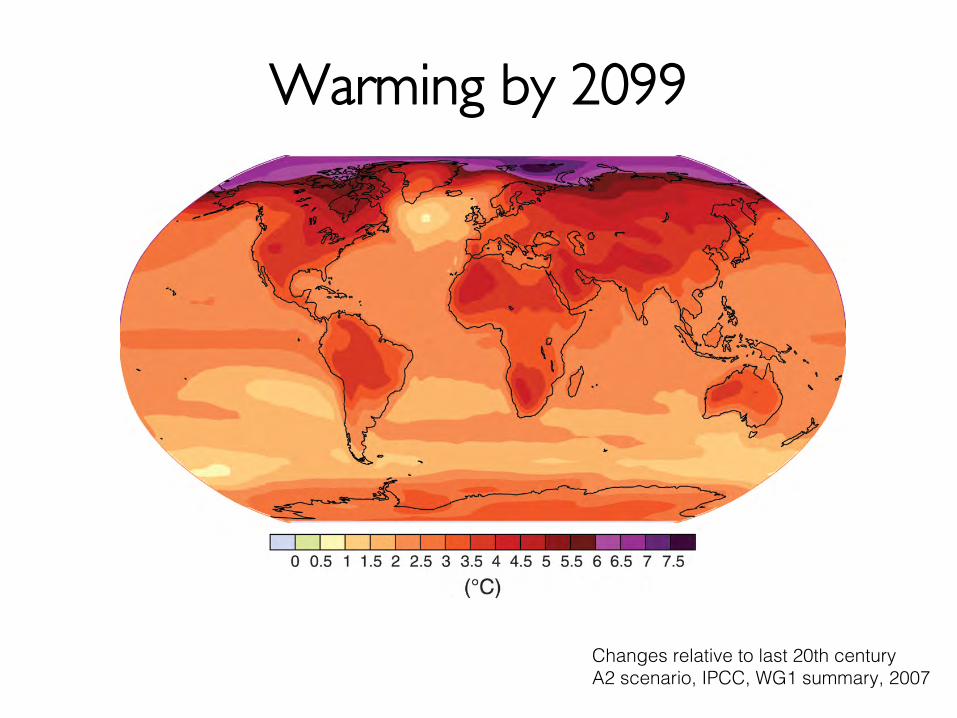
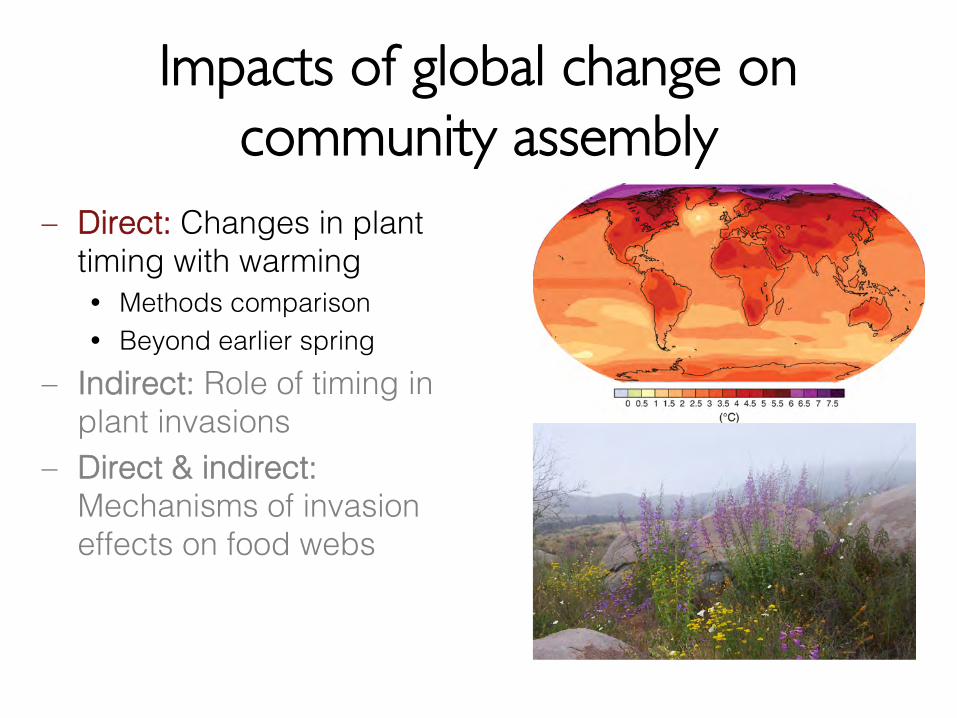
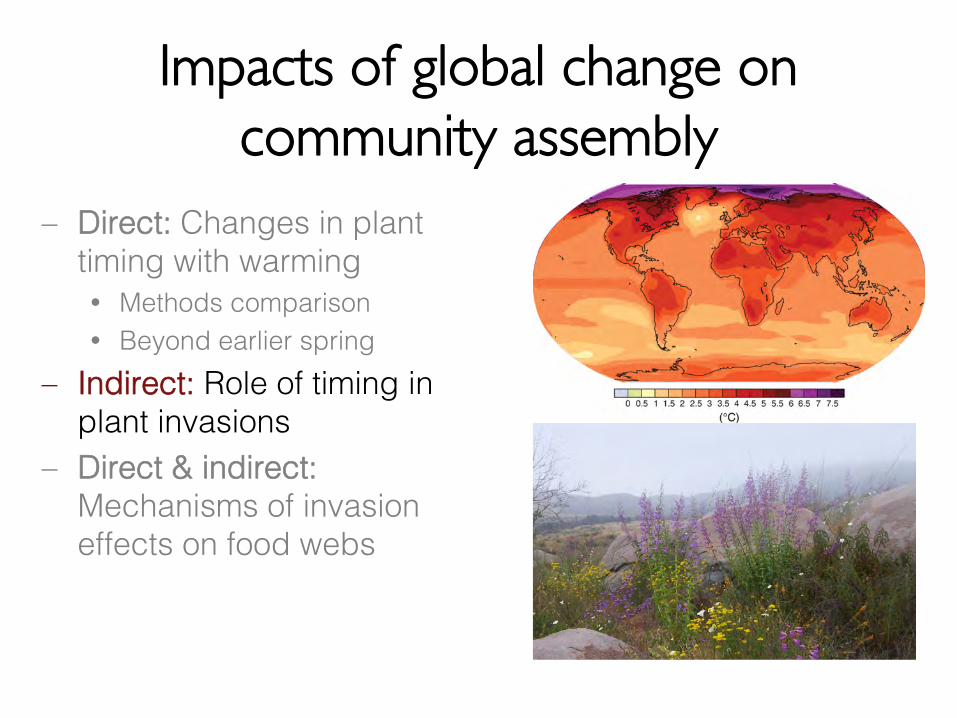
Warming by 2099
Changes relative to last 20th centuryA2 scenario, IPCC, WG1 summary, 2007
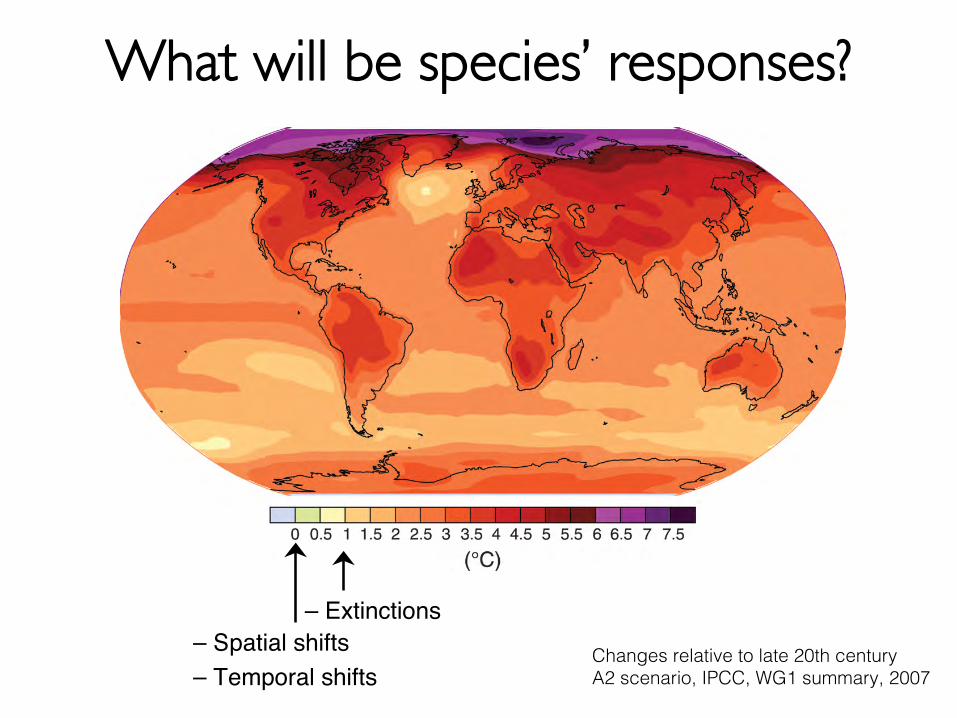
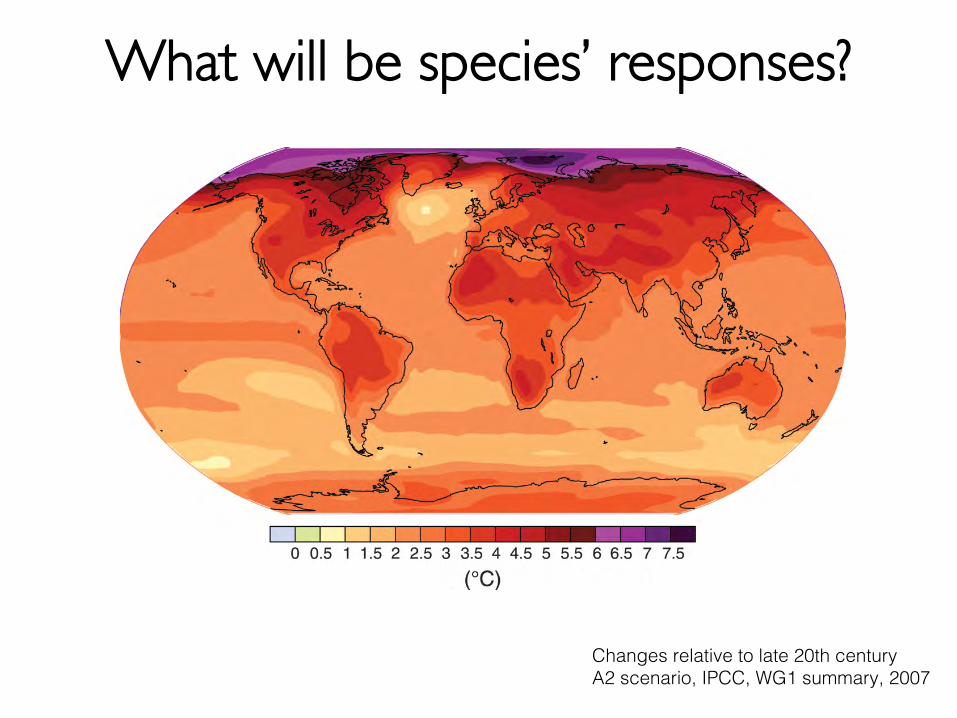
What will be species’ responses?
Changes relative to late 20th centuryA2 scenario, IPCC, WG1 summary, 2007
– Extinctions– Spatial shifts– Temporal shifts
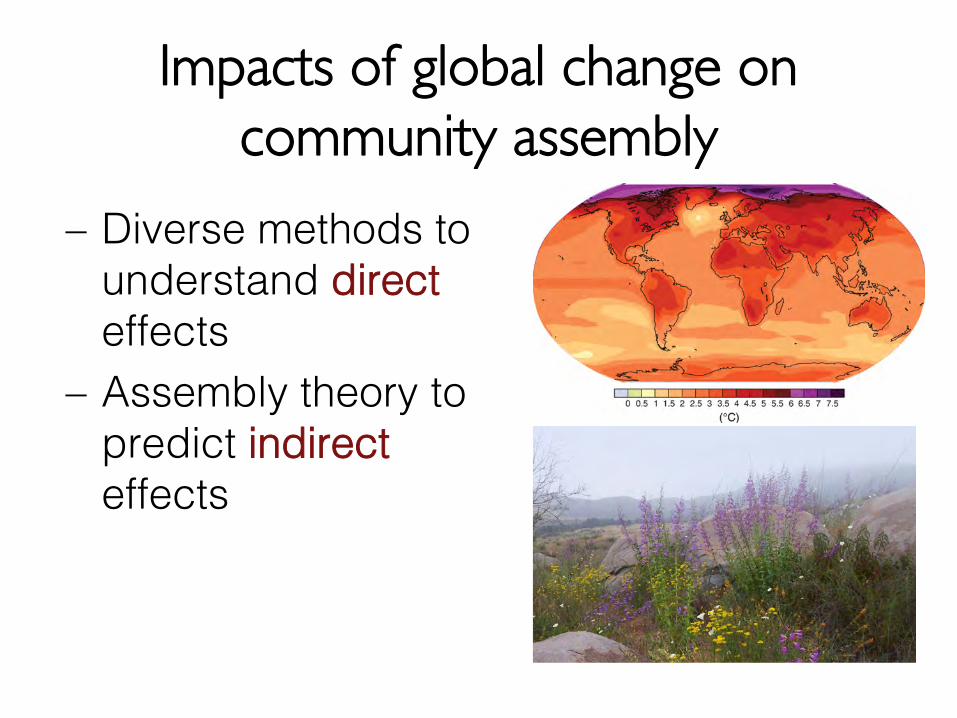
Impacts of global change oncommunity assembly
– Diverse methods tounderstand directeffects
– Assembly theory topredict indirecteffects
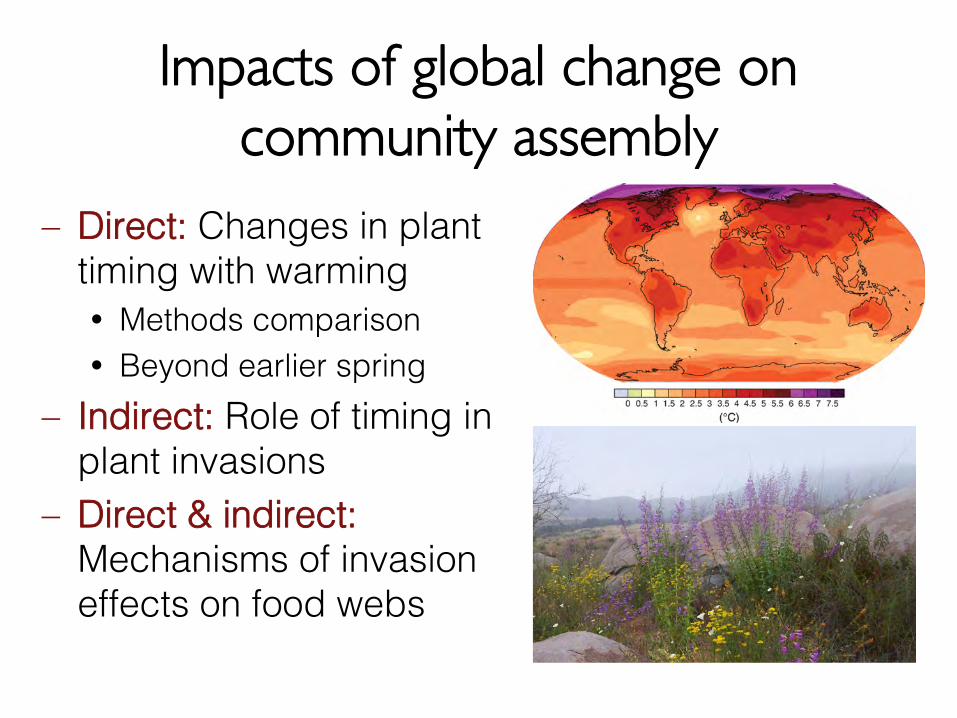
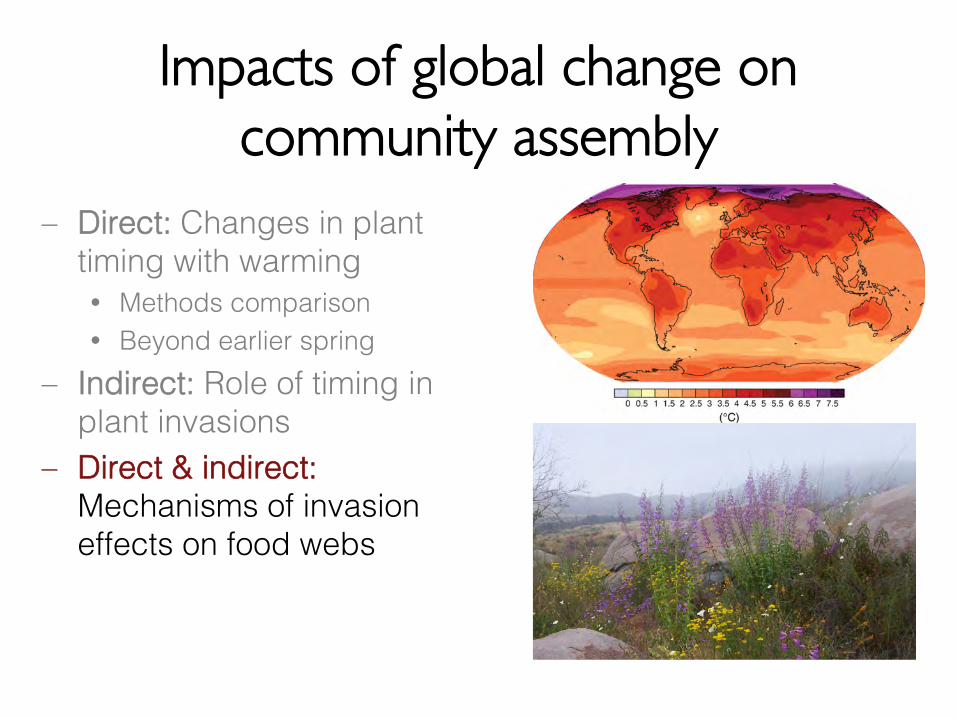
Impacts of global change oncommunity assembly
– Direct: Changes in planttiming with warming Methods comparison Beyond earlier spring
– Indirect: Role of timing inplant invasions
– Direct & indirect:Mechanisms of invasioneffects on food webs
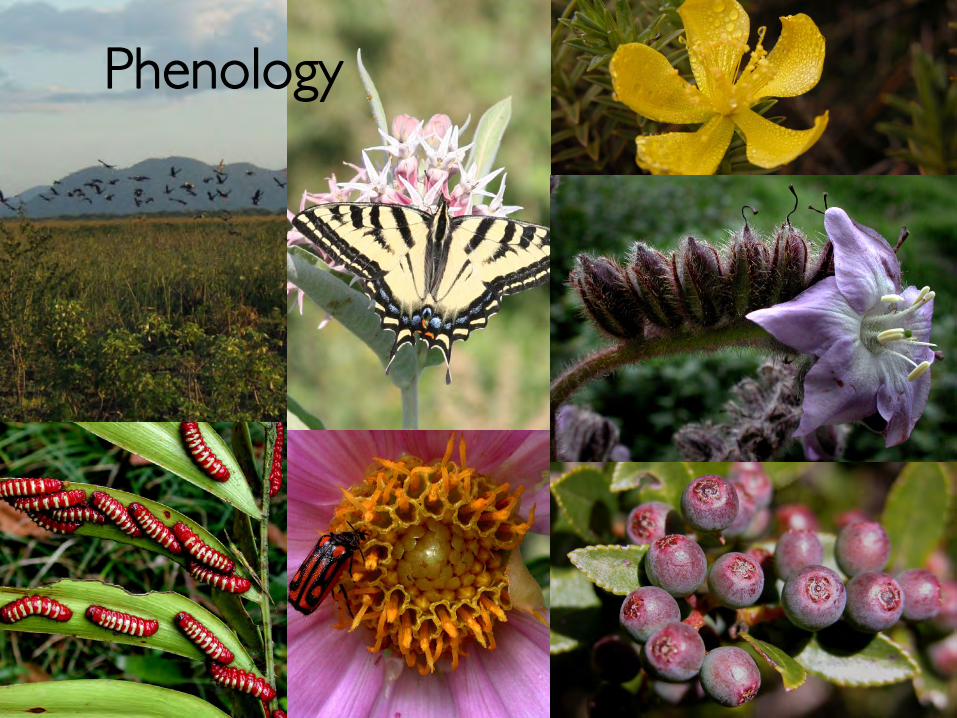
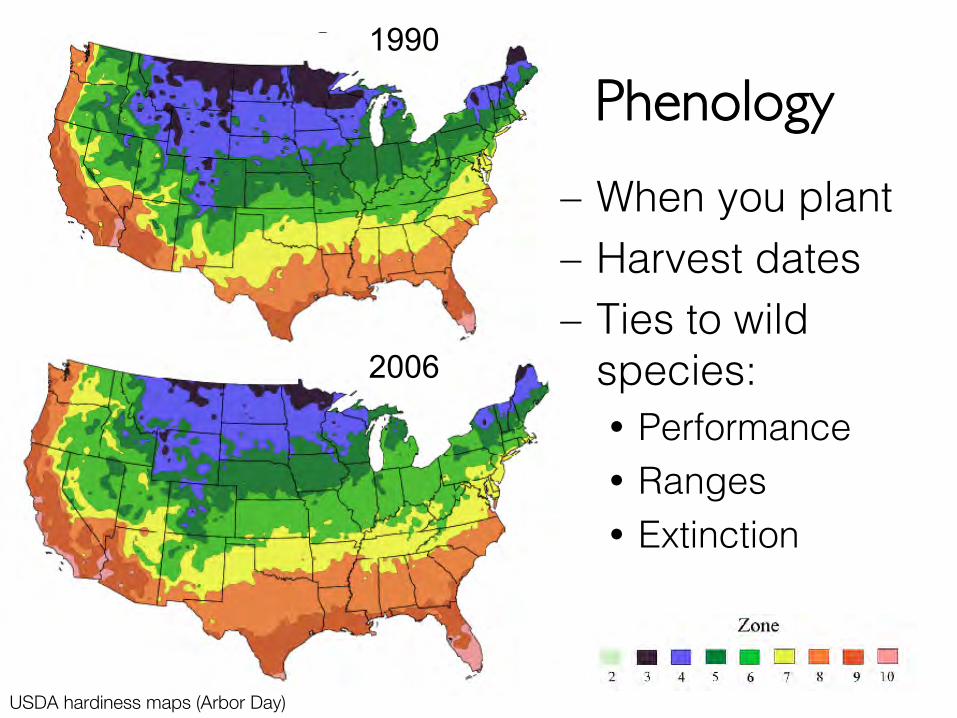
Phenology
Phenology
– When you plant– Harvest dates– Ties to wild
species: Performance Ranges Extinction
1990
2006
USDA hardiness maps (Arbor Day)
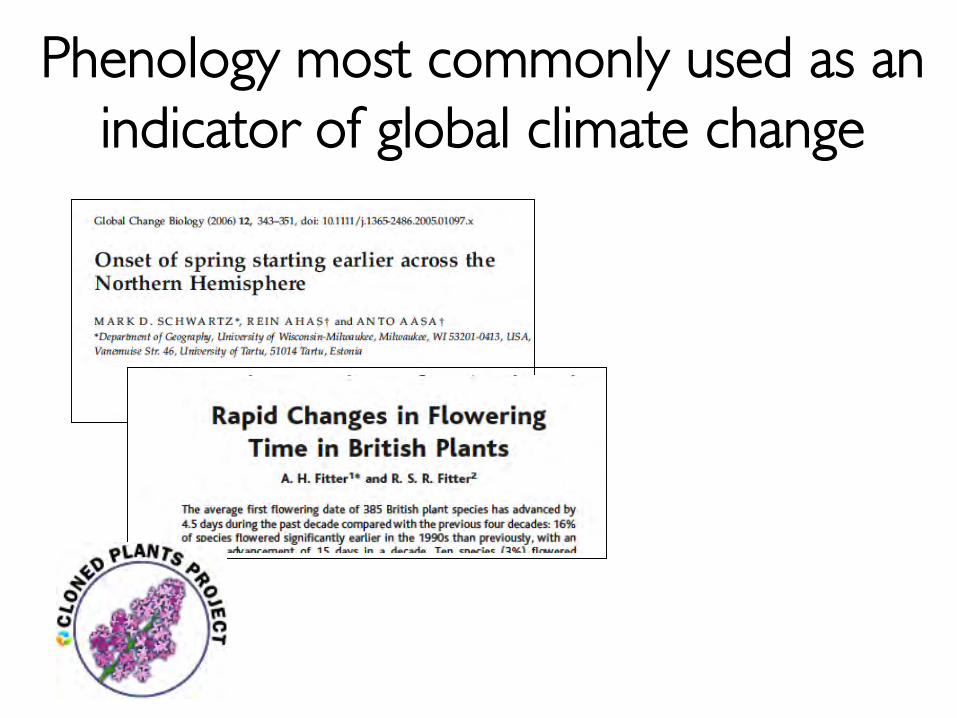
Phenology most commonly used as anindicator of global climate change
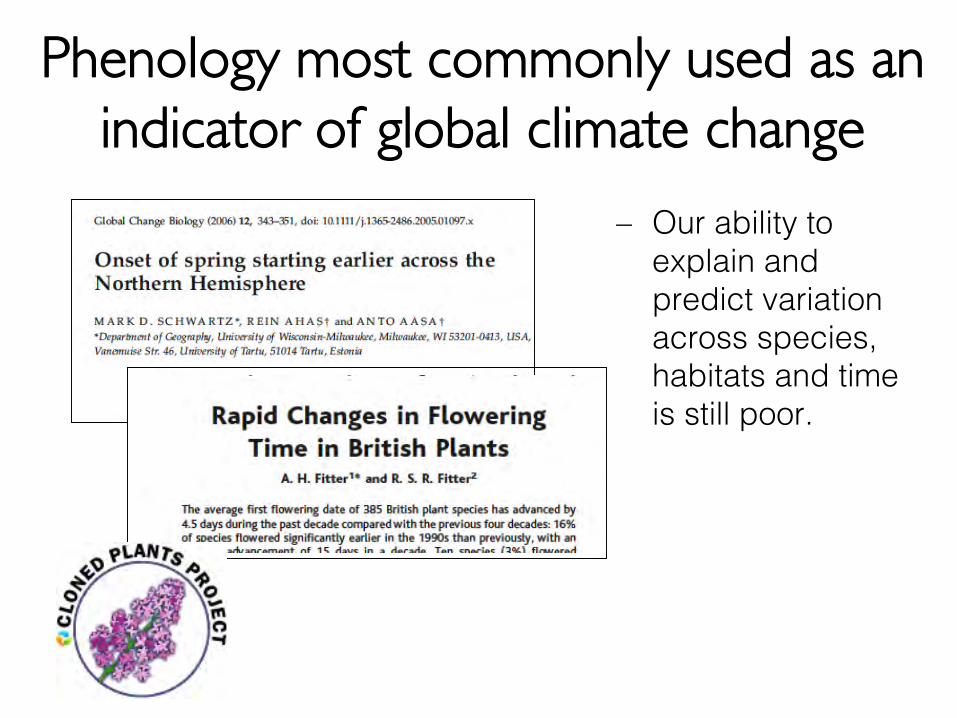
Phenology most commonly used as anindicator of global climate change
– Our ability toexplain andpredict variationacross species,habitats and timeis still poor.
What are the direct phenologicaleffects of climate change on plant
species?
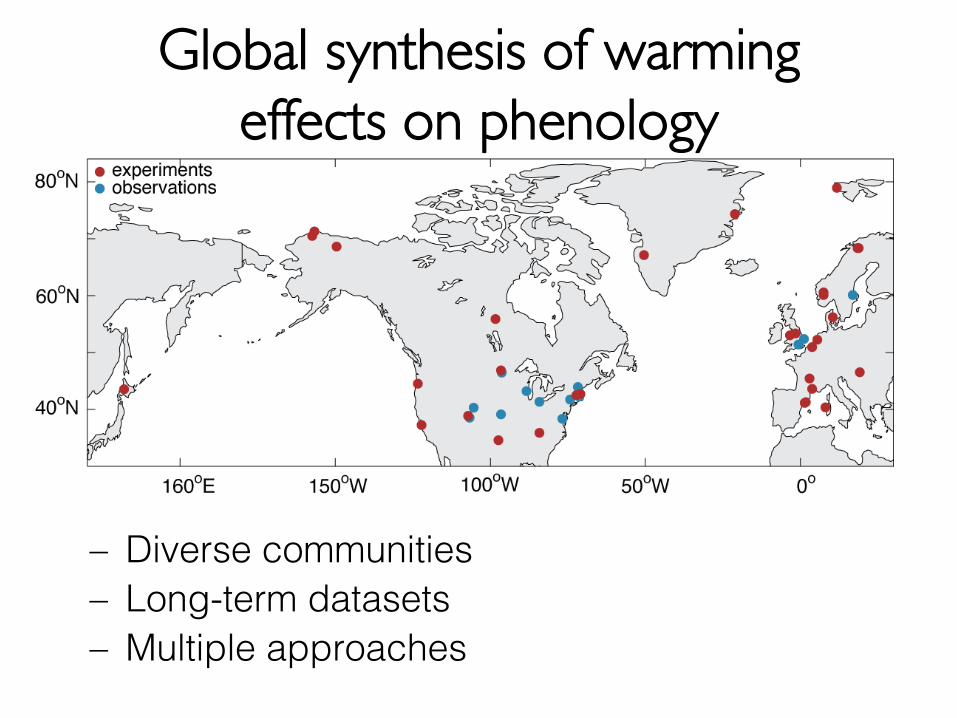
Global synthesis of warmingeffects on phenology
– Diverse communities– Long-term datasets– Multiple approaches
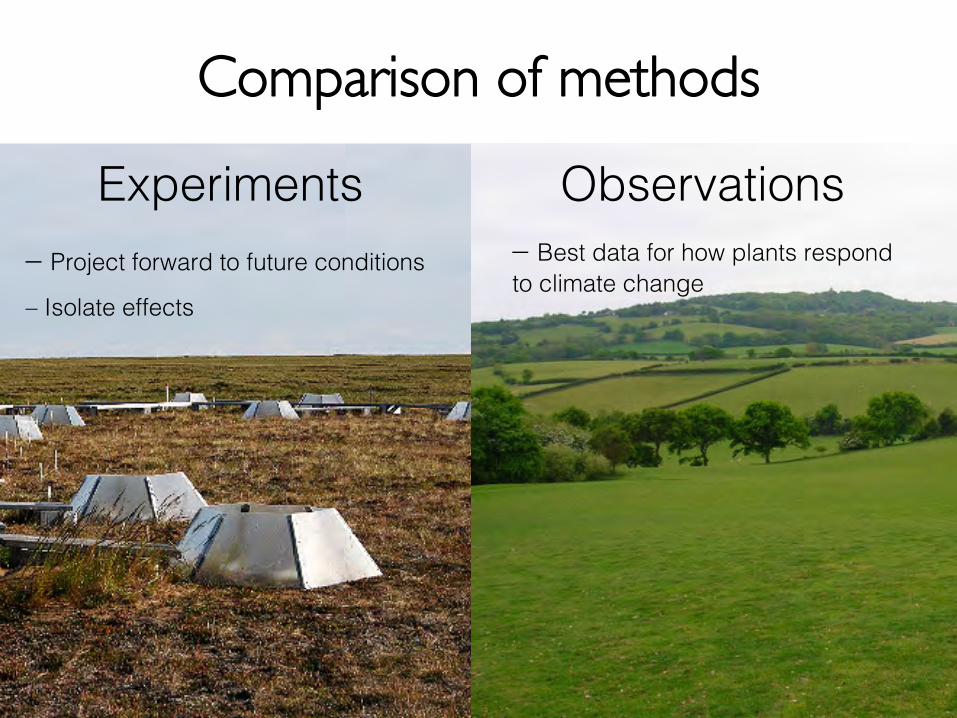
Comparison of methods
Experiments Observations– Project forward to future conditions
– Isolate effects
– Best data for how plants respondto climate change
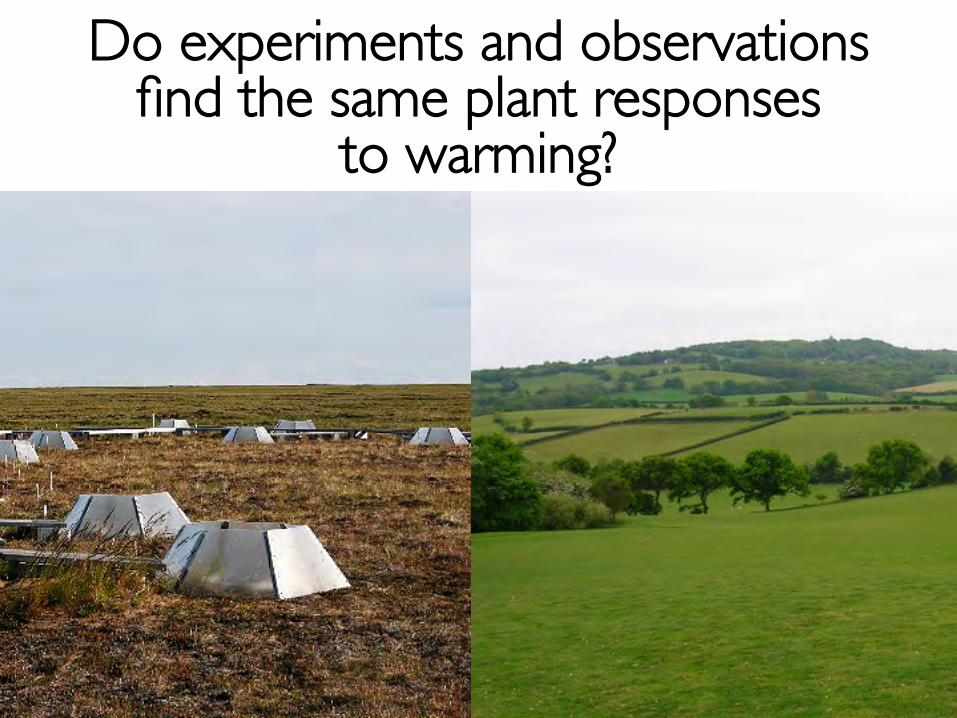
Do experiments and observationsfind the same plant responses
to warming?
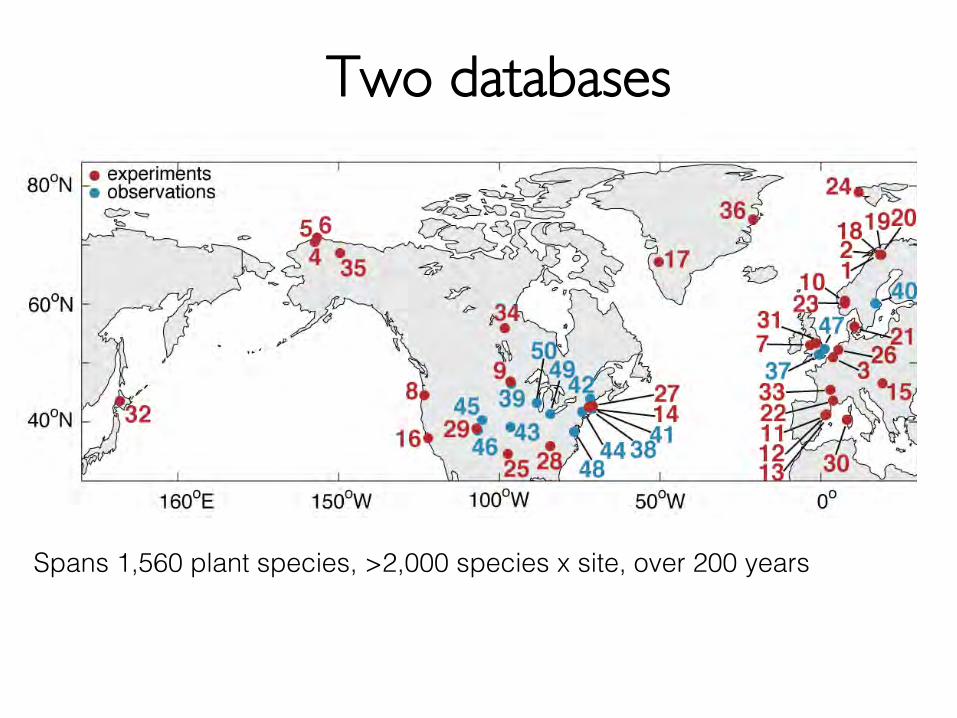
Two databases
Spans 1,560 plant species, >2,000 species x site, over 200 years
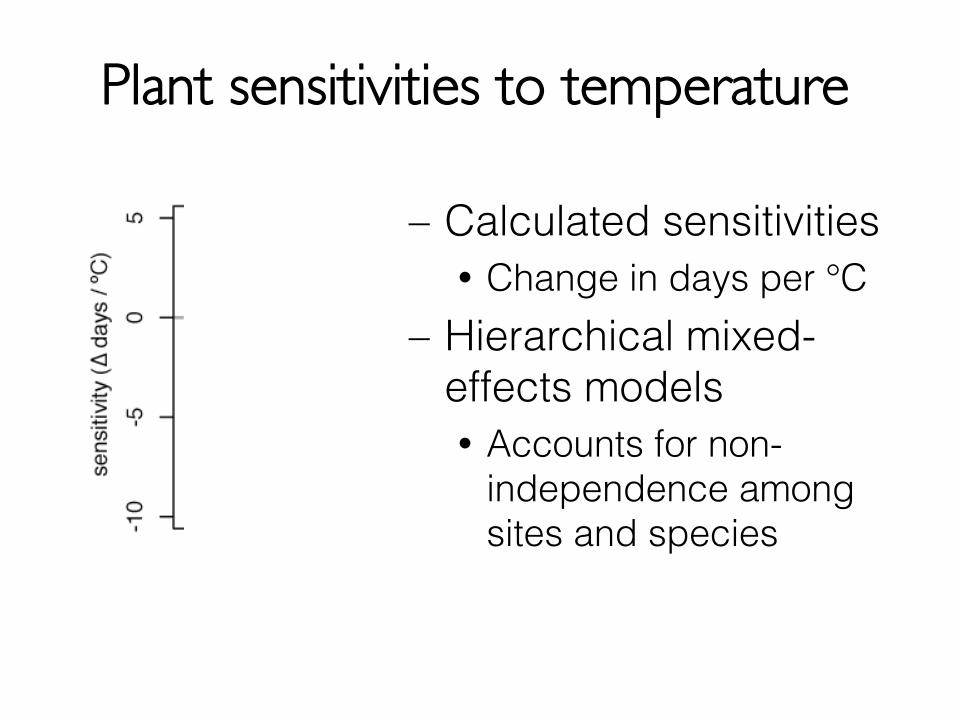
Plant sensitivities to temperature
– Calculated sensitivities Change in days per °C
– Hierarchical mixed-effects models Accounts for non-
independence amongsites and species
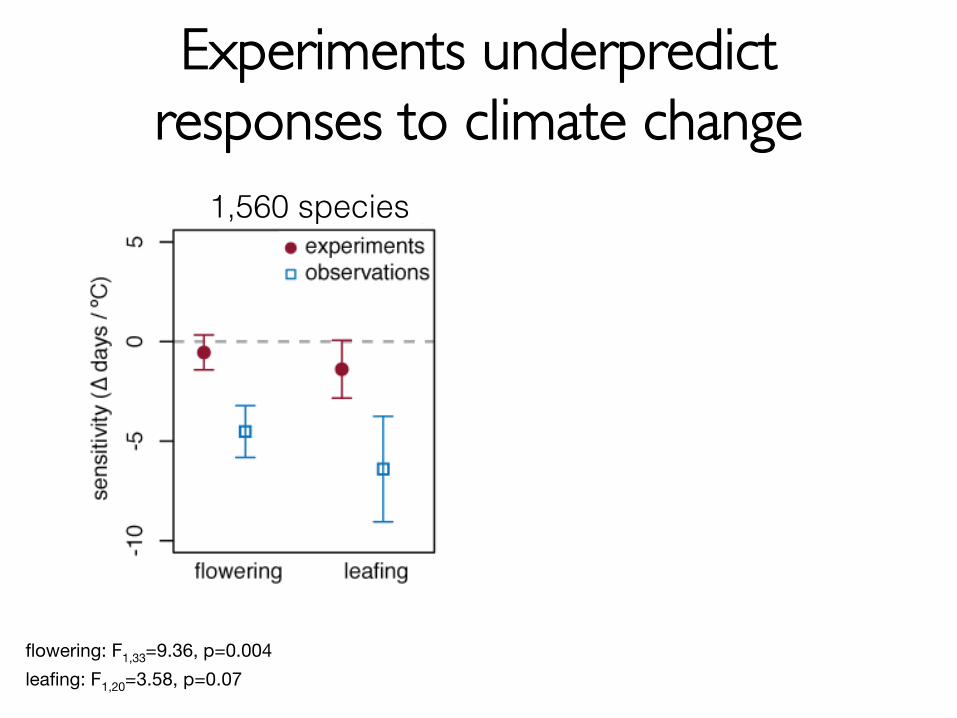
Experiments underpredictresponses to climate change
1,560 species
flowering: F1,33=9.36, p=0.004
leafing: F1,20=3.58, p=0.07
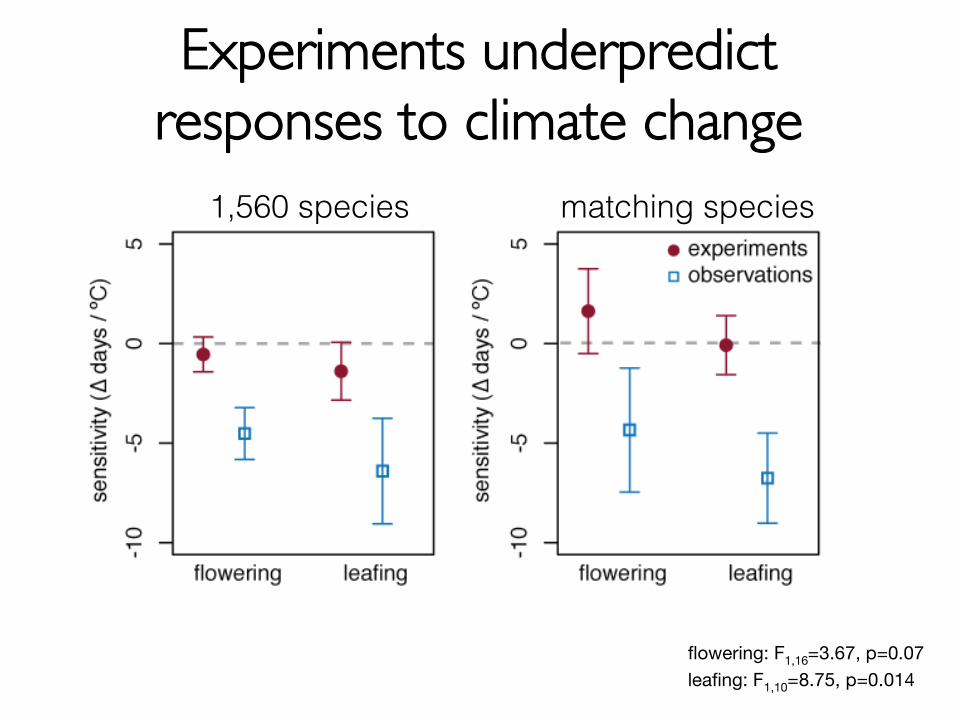
Experiments underpredictresponses to climate change
1,560 species matching species
flowering: F1,16=3.67, p=0.07leafing: F1,10=8.75, p=0.014
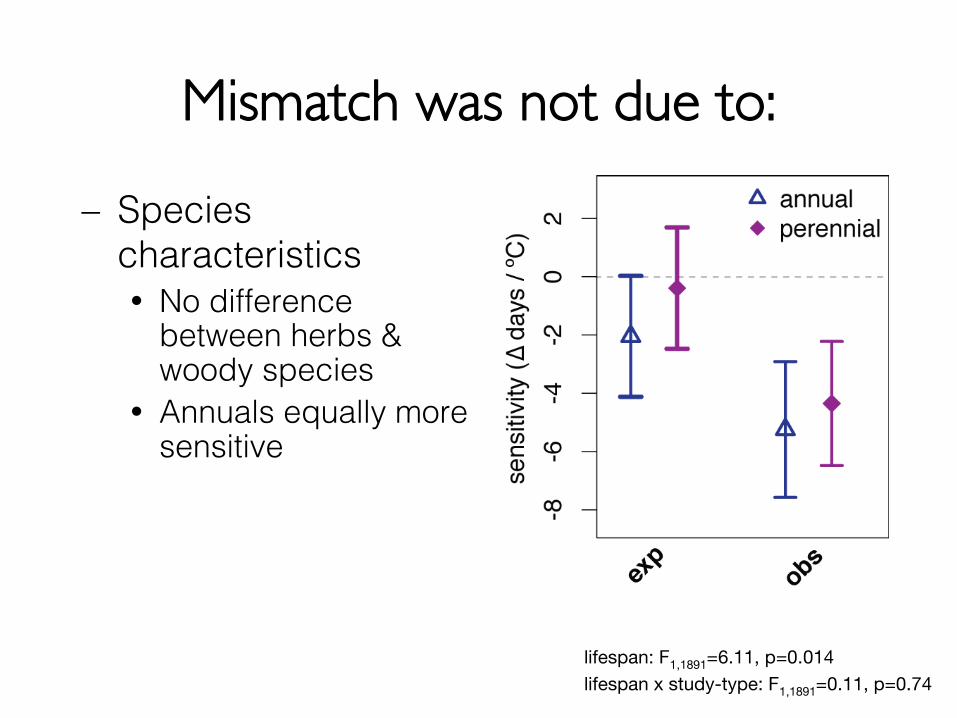
Mismatch was not due to:
lifespan: F1,1891=6.11, p=0.014lifespan x study-type: F1,1891=0.11, p=0.74
– Speciescharacteristics No difference
between herbs &woody species
Annuals equally moresensitive
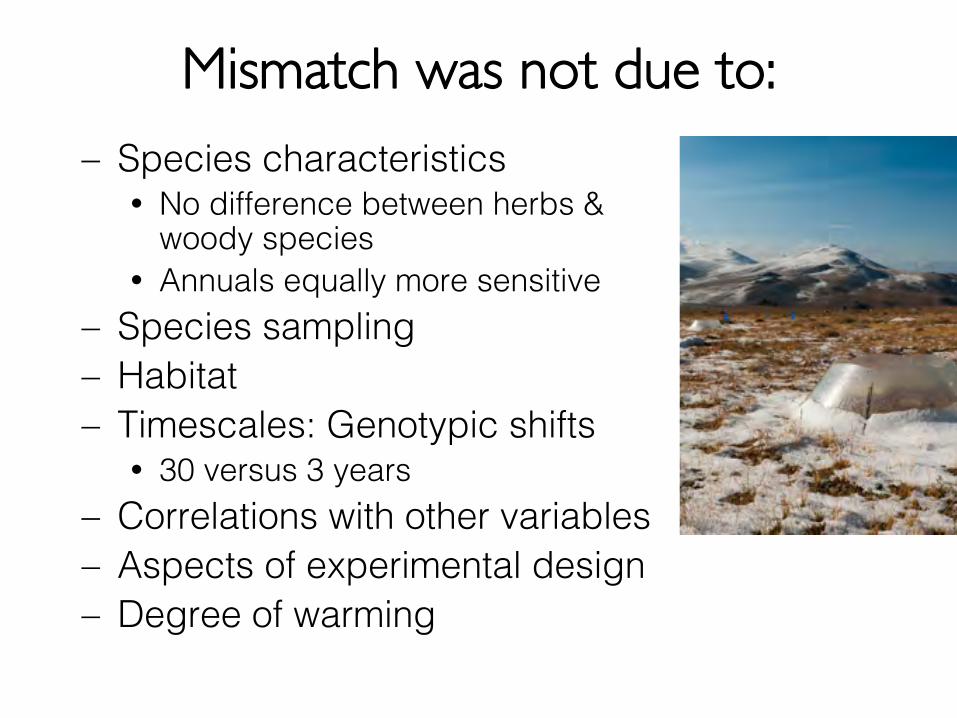
Mismatch was not due to:– Species characteristics
No difference between herbs &woody species
Annuals equally more sensitive– Species sampling– Habitat– Timescales: Genotypic shifts
30 versus 3 years– Correlations with other variables– Aspects of experimental design– Degree of warming
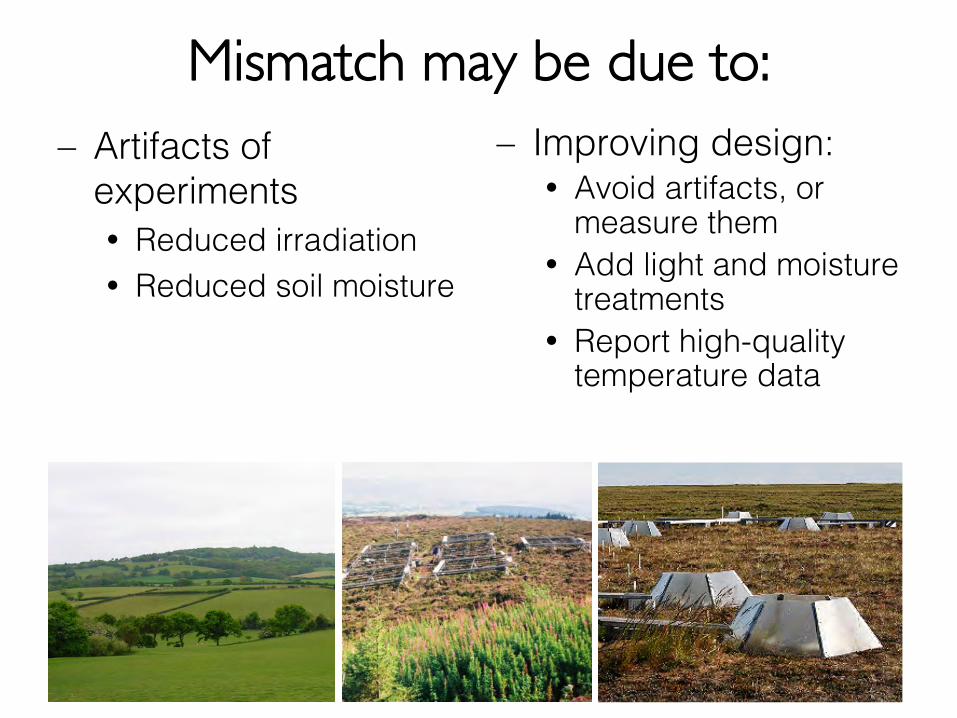
Mismatch may be due to:– Artifacts of
experiments Reduced irradiation Reduced soil moisture
– Improving design: Avoid artifacts, or
measure them Add light and moisture
treatments Report high-quality
temperature data
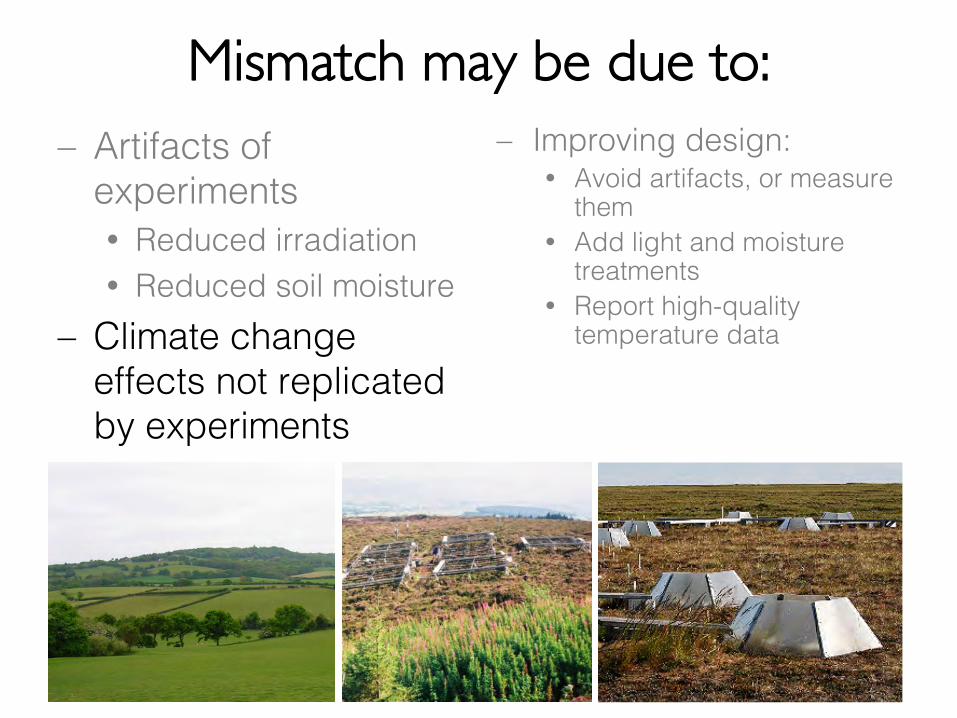
Mismatch may be due to:– Artifacts of
experiments Reduced irradiation Reduced soil moisture
– Climate changeeffects not replicatedby experiments
– Improving design: Avoid artifacts, or measure
them Add light and moisture
treatments Report high-quality
temperature data
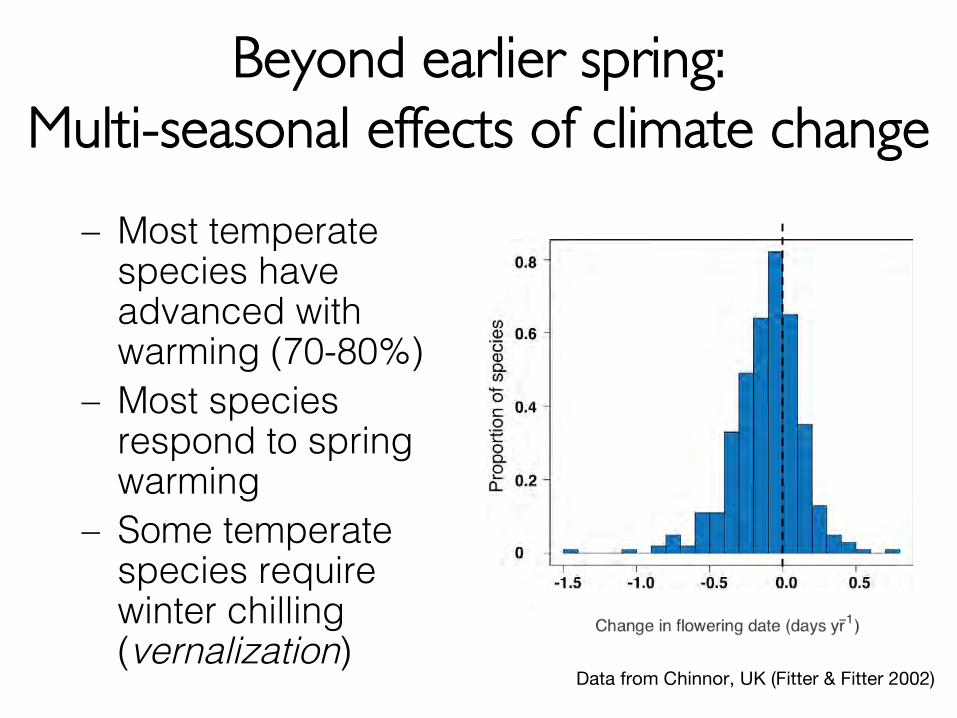
Beyond earlier spring:Multi-seasonal effects of climate change
– Most temperatespecies haveadvanced withwarming (70-80%)
– Most speciesrespond to springwarming
– Some temperatespecies requirewinter chilling(vernalization)
Data from Chinnor, UK (Fitter & Fitter 2002)
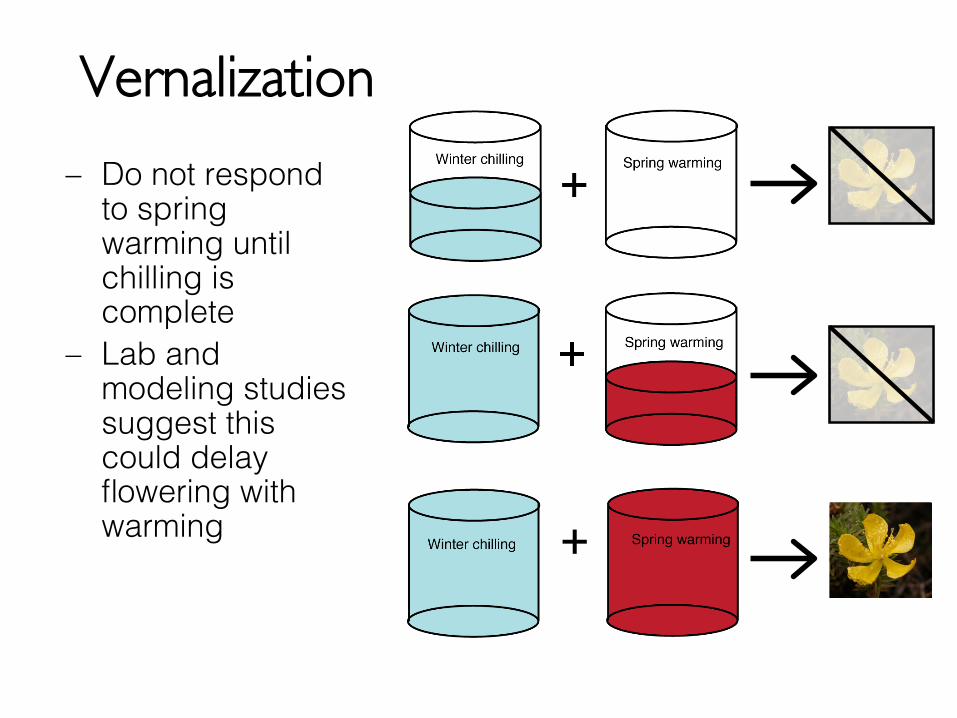
Vernalization
– Do not respondto springwarming untilchilling iscomplete
– Lab andmodeling studiessuggest thiscould delayflowering withwarming
Data from Chinnor, UK (Fitter & Fitter 2002)
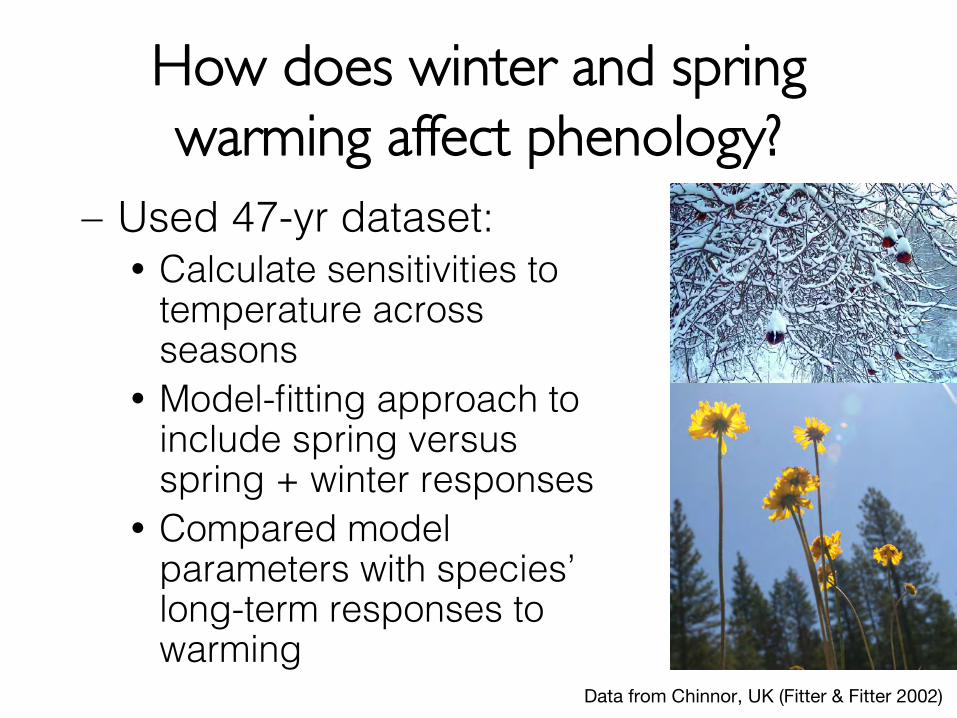
How does winter and springwarming affect phenology?
– Used 47-yr dataset: Calculate sensitivities to
temperature acrossseasons
Model-fitting approach toinclude spring versusspring + winter responses
Compared modelparameters with species’long-term responses towarming
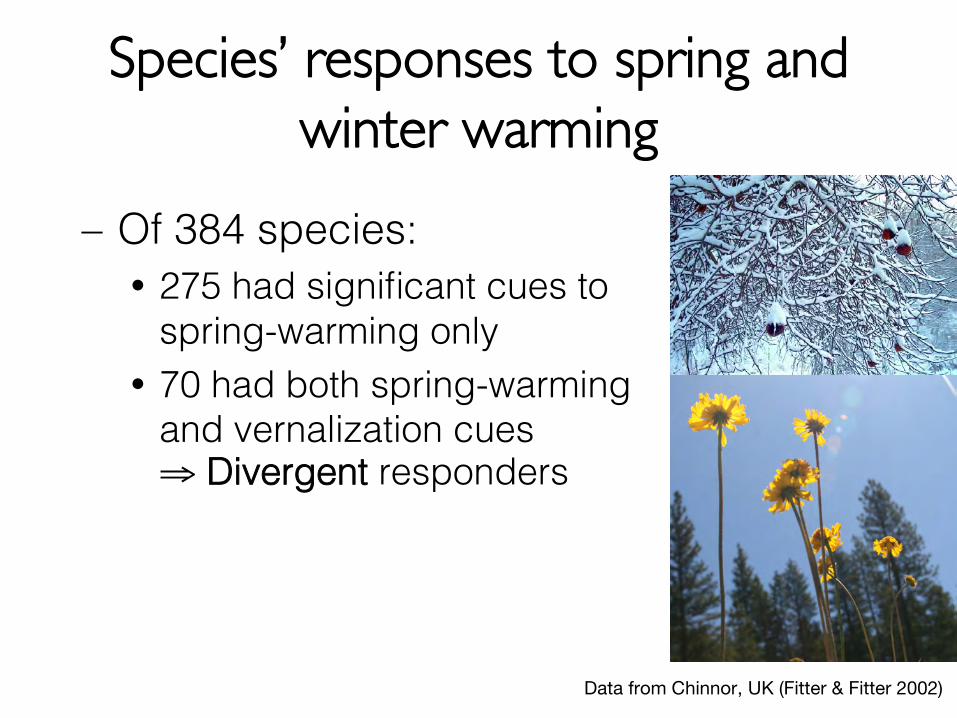
Species’ responses to spring andwinter warming
– Of 384 species: 275 had significant cues to
spring-warming only 70 had both spring-warming
and vernalization cues⇒ Divergent responders
Data from Chinnor, UK (Fitter & Fitter 2002)
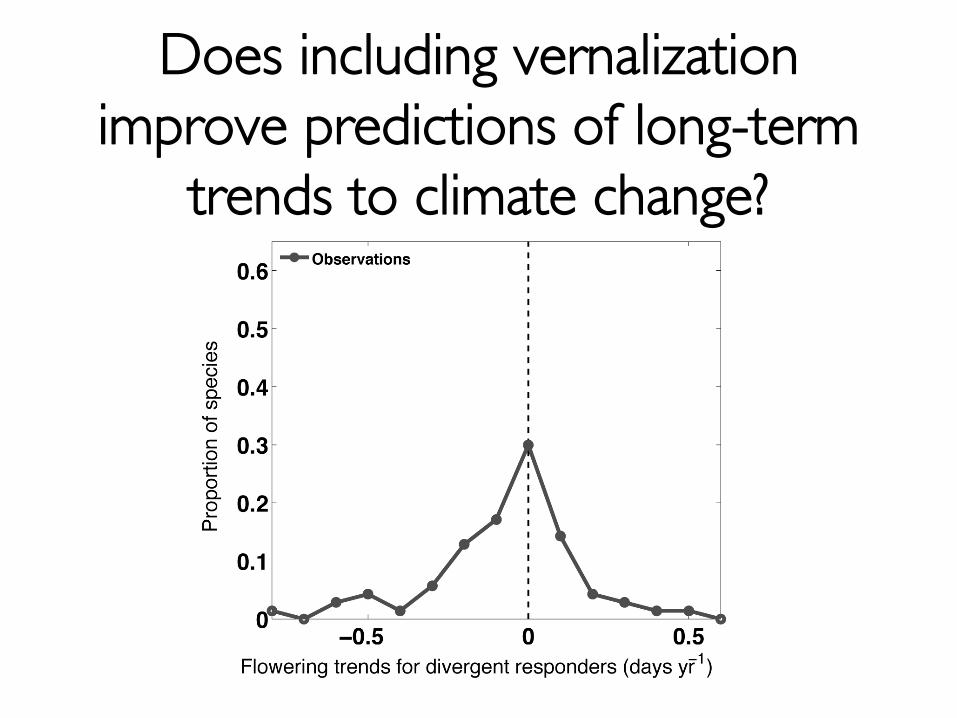
Does including vernalizationimprove predictions of long-term
trends to climate change?
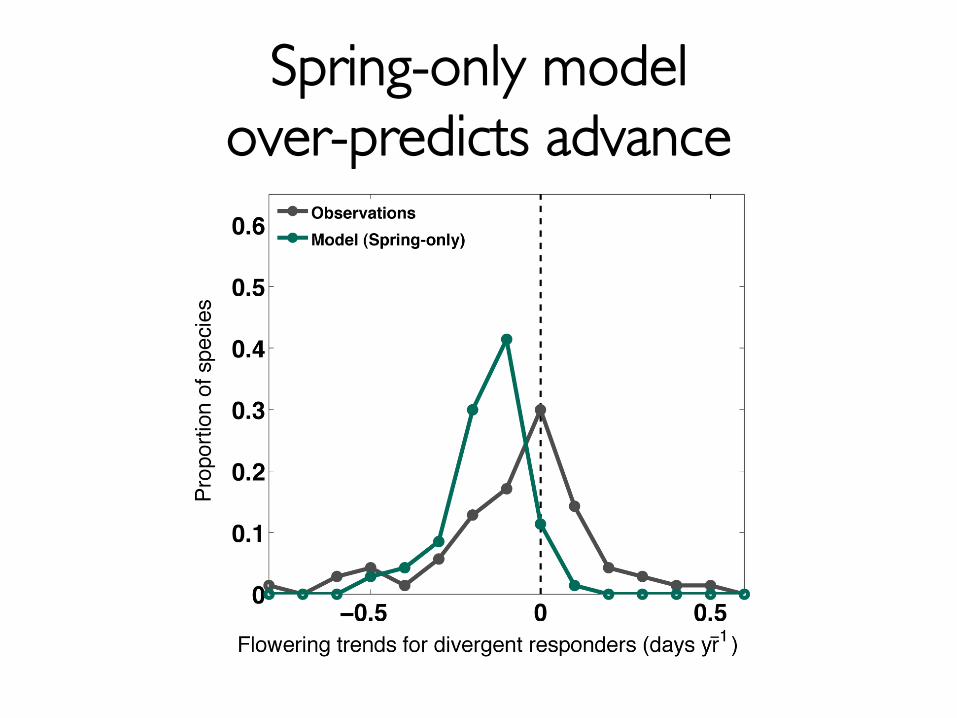
Spring-only modelover-predicts advance
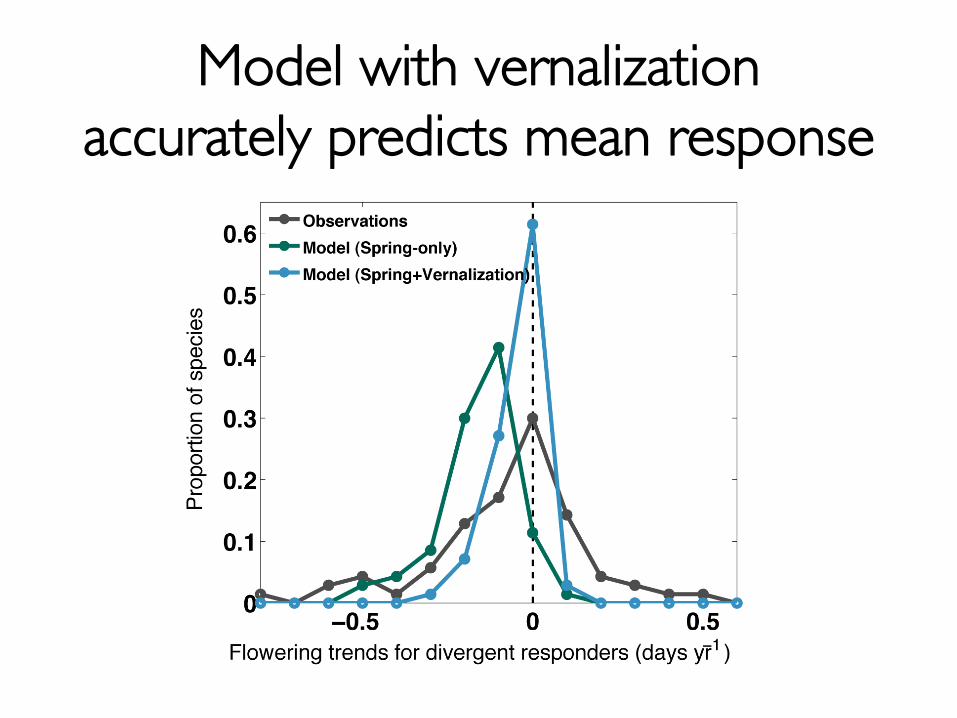
Model with vernalizationaccurately predicts mean response
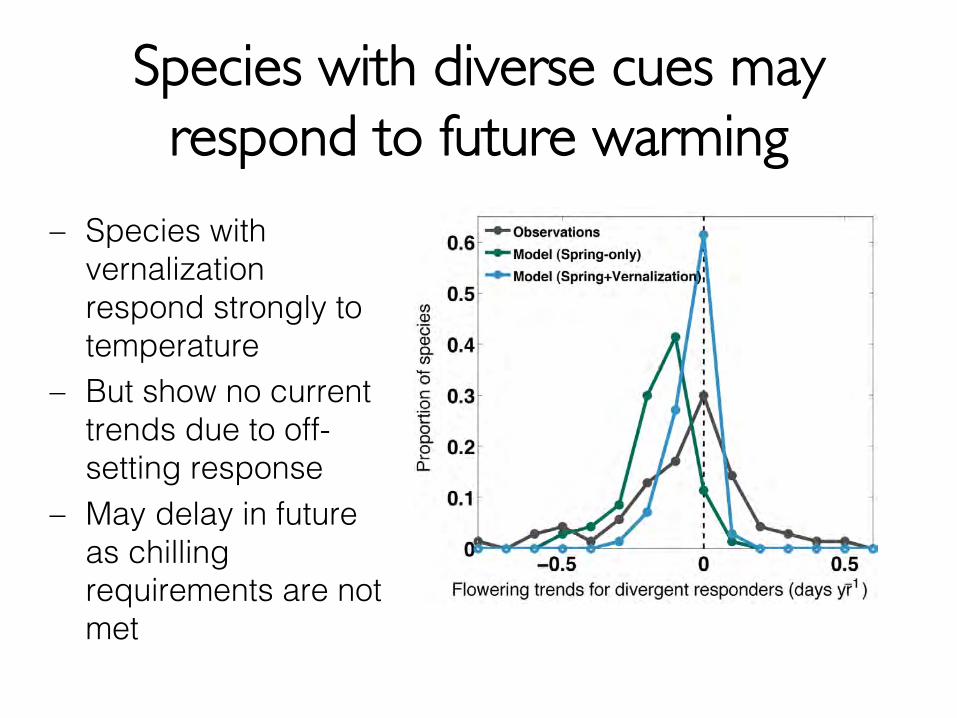
Species with diverse cues mayrespond to future warming
– Species withvernalizationrespond strongly totemperature
– But show no currenttrends due to off-setting response
– May delay in futureas chillingrequirements are notmet

What are the direct phenologicaleffects of climate change on plant
species?
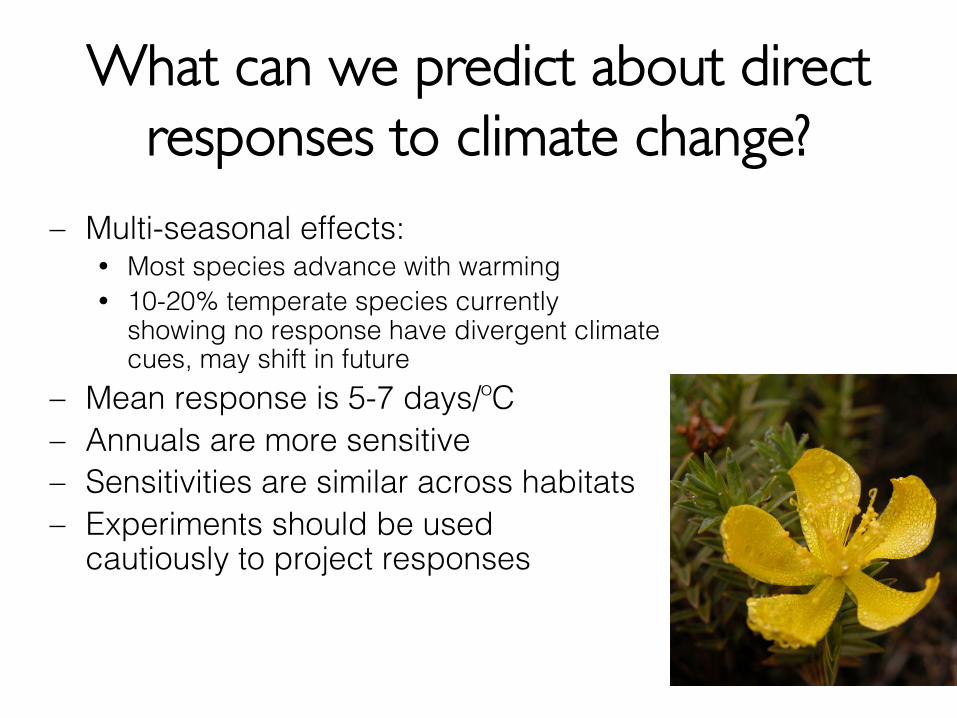
What can we predict about directresponses to climate change?
– Multi-seasonal effects: Most species advance with warming 10-20% temperate species currently
showing no response have divergent climatecues, may shift in future
– Mean response is 5-7 days/ºC– Annuals are more sensitive– Sensitivities are similar across habitats– Experiments should be used
cautiously to project responses
Impacts of global change oncommunity assembly
– Direct: Changes in planttiming with warming Methods comparison Beyond earlier spring
– Indirect: Role of timing inplant invasions
– Direct & indirect:Mechanisms of invasioneffects on food webs
Impacts of global change oncommunity assembly
– Direct: Changes in planttiming with warming Methods comparison Beyond earlier spring
– Indirect: Role of timing inplant invasions
– Direct & indirect:Mechanisms of invasioneffects on food webs
How does phenological assemblyin an era of changing climatecontribute to plant invasions?
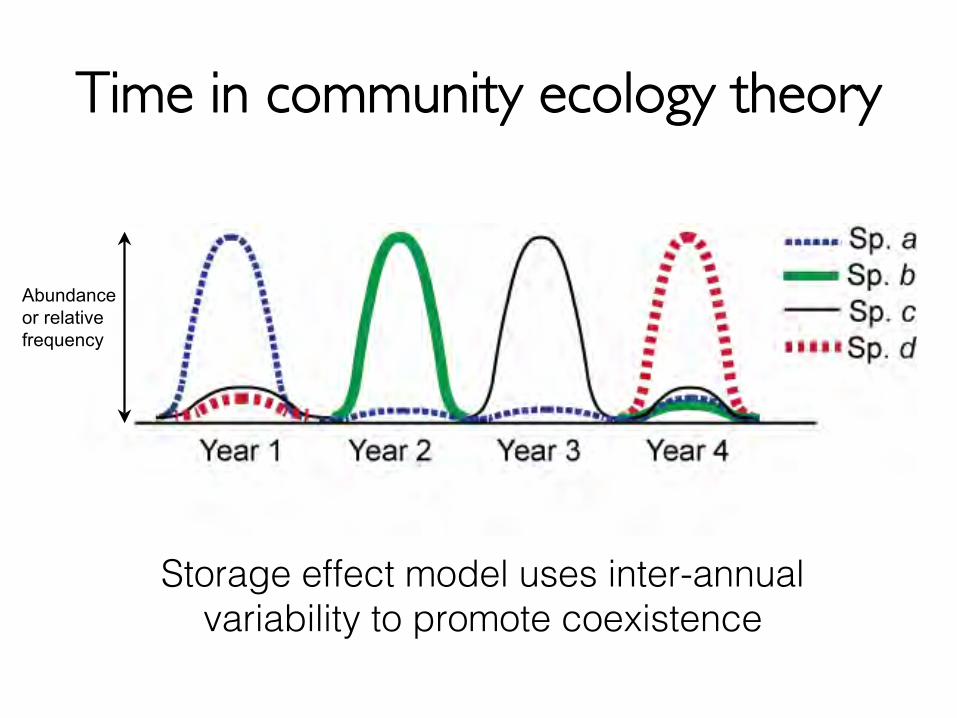
Time in community ecology theory
Storage effect model uses inter-annualvariability to promote coexistence
Abundanceor relativefrequency
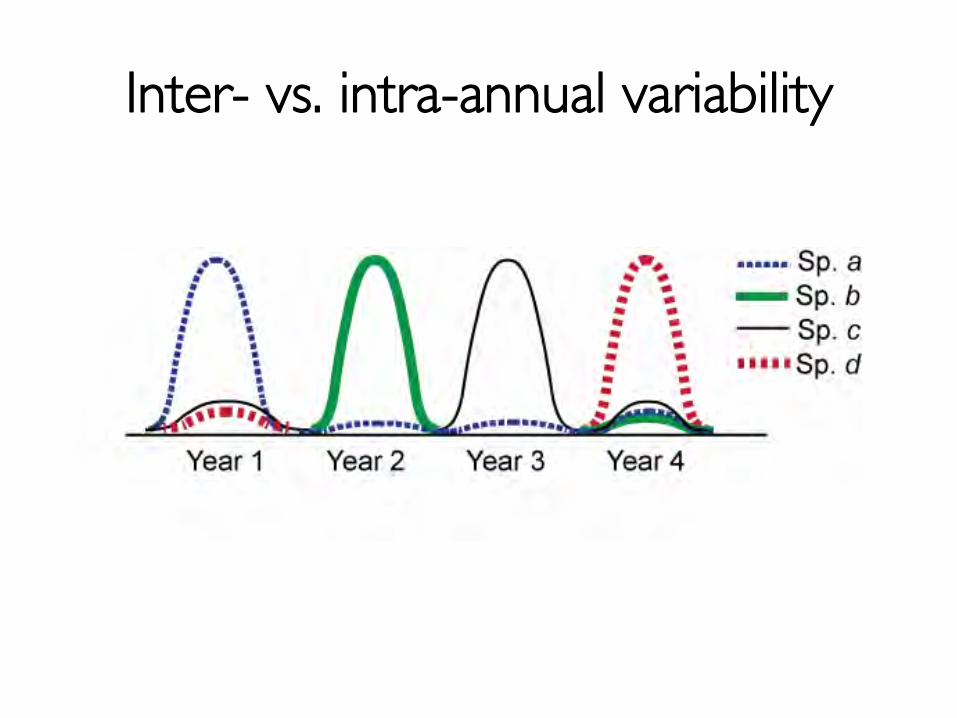
Inter- vs. intra-annual variability
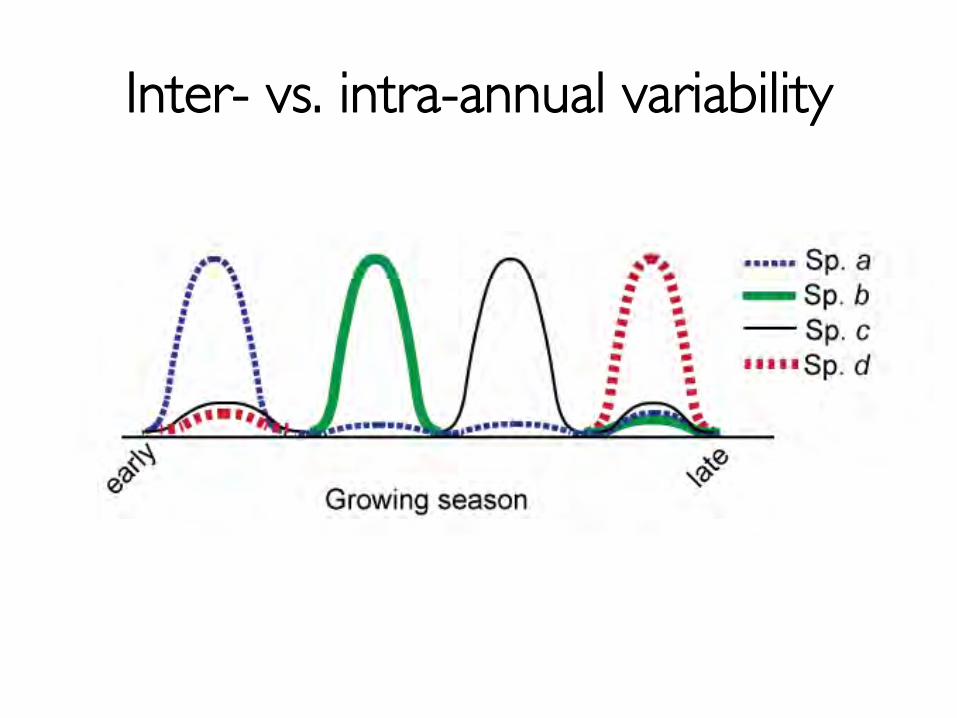
Inter- vs. intra-annual variability
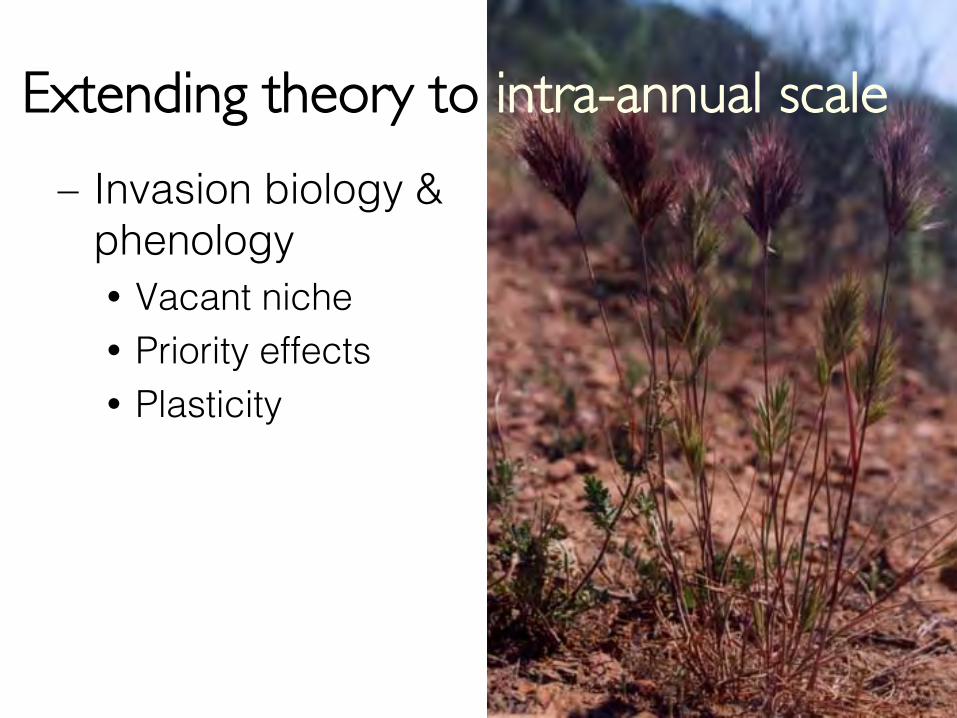
– Invasion biology &phenology Vacant niche Priority effects Plasticity
Extending theory to intra-annual scale
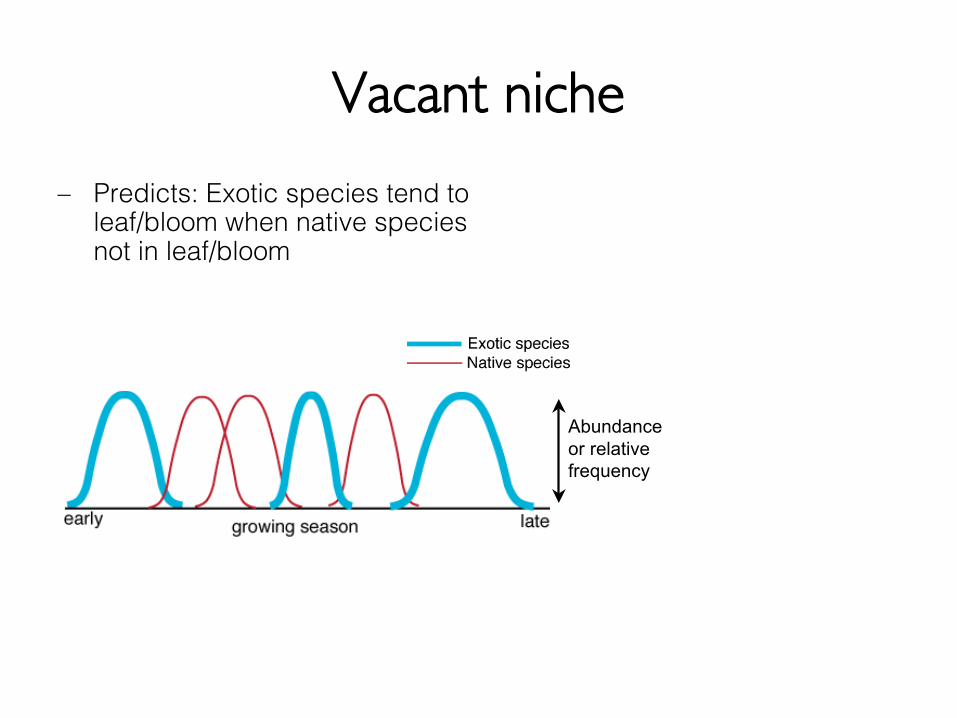
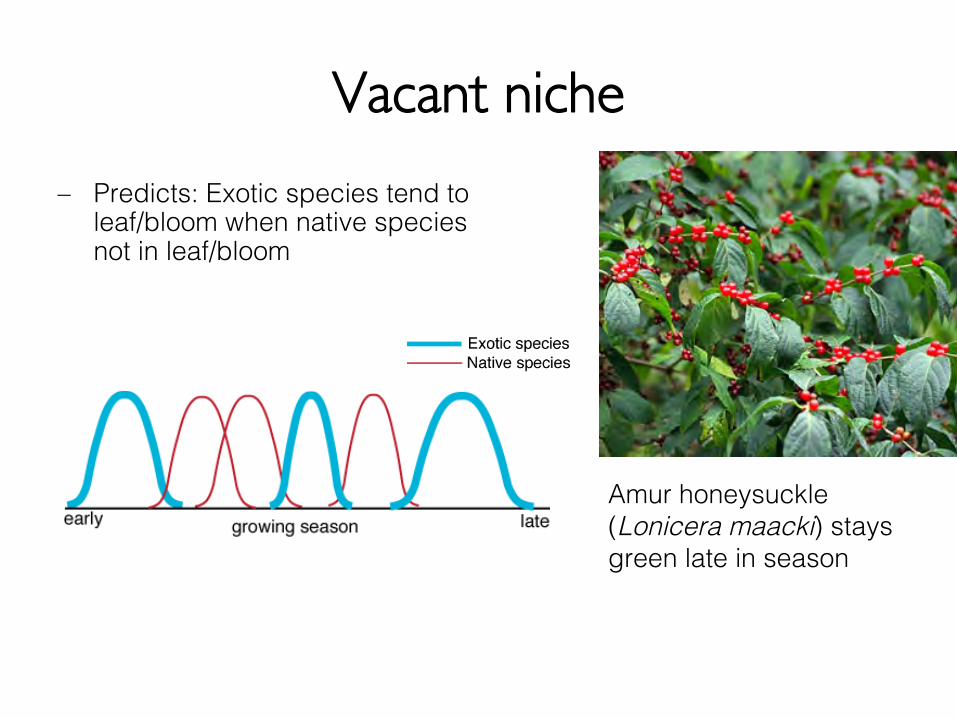
Vacant niche
– Predicts: Exotic species tend toleaf/bloom when native speciesnot in leaf/bloom
Abundanceor relativefrequency
Vacant niche
– Predicts: Exotic species tend toleaf/bloom when native speciesnot in leaf/bloom
Amur honeysuckle(Lonicera maacki) staysgreen late in season
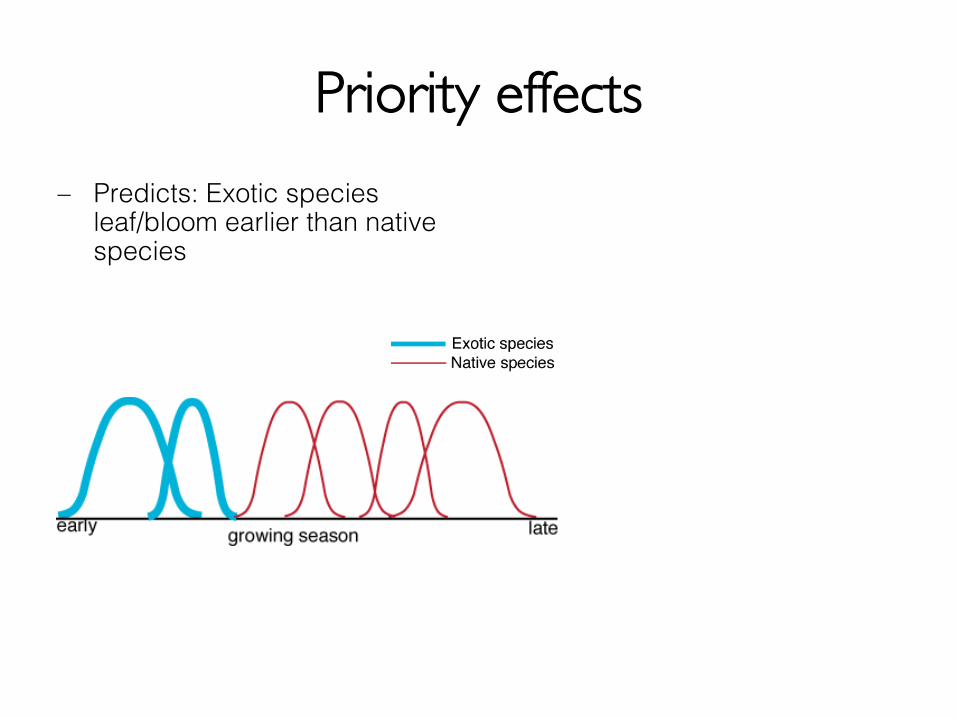
Priority effects
– Predicts: Exotic speciesleaf/bloom earlier than nativespecies
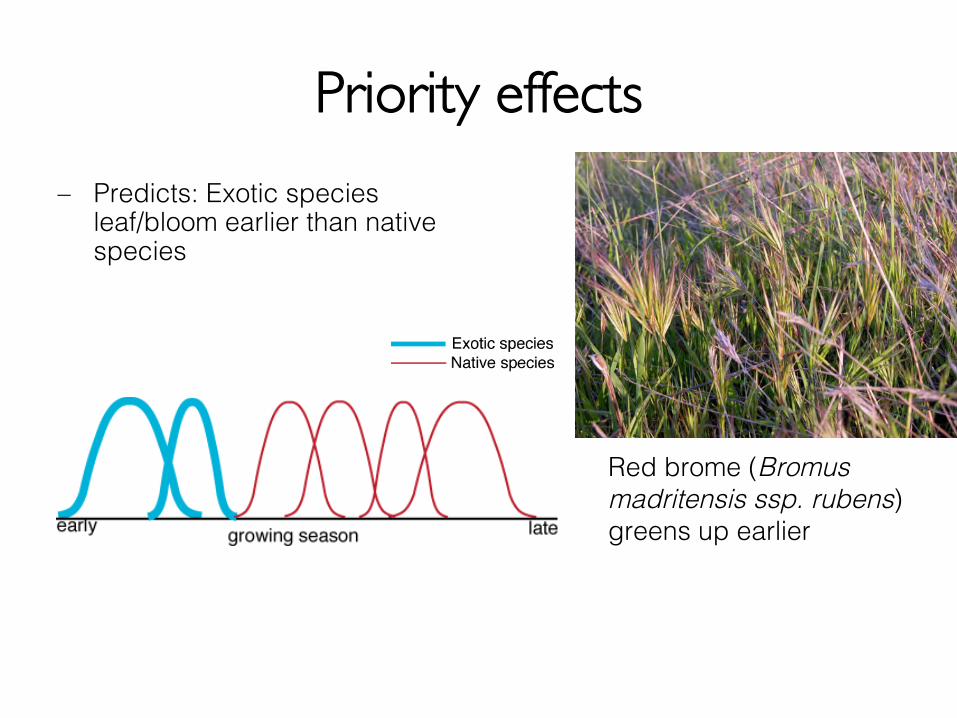
Priority effects
– Predicts: Exotic speciesleaf/bloom earlier than nativespecies
Red brome (Bromusmadritensis ssp. rubens)greens up earlier
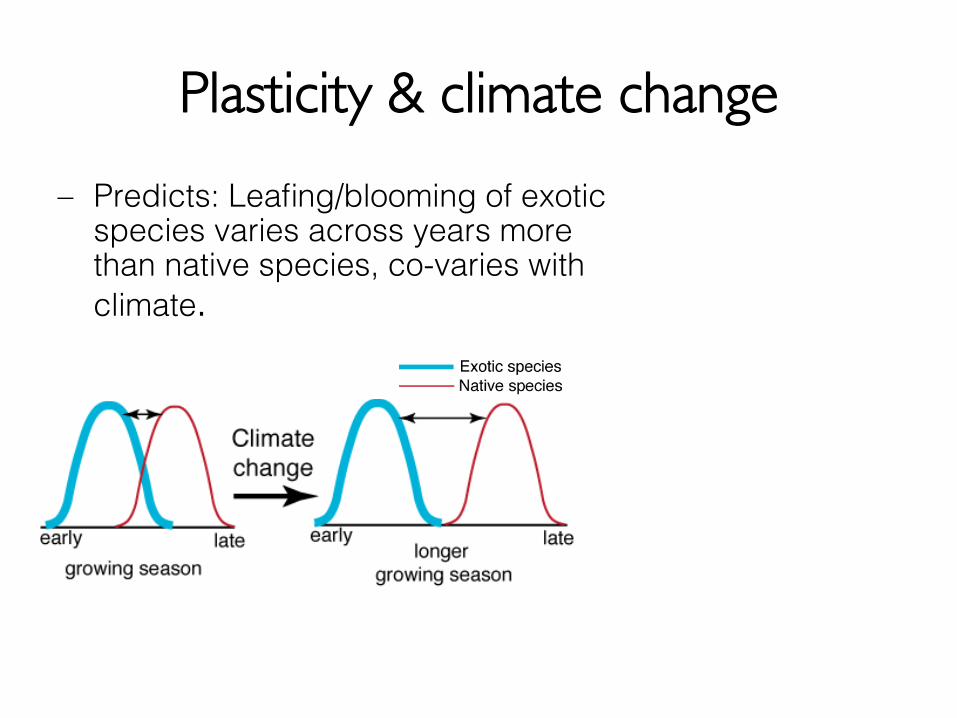
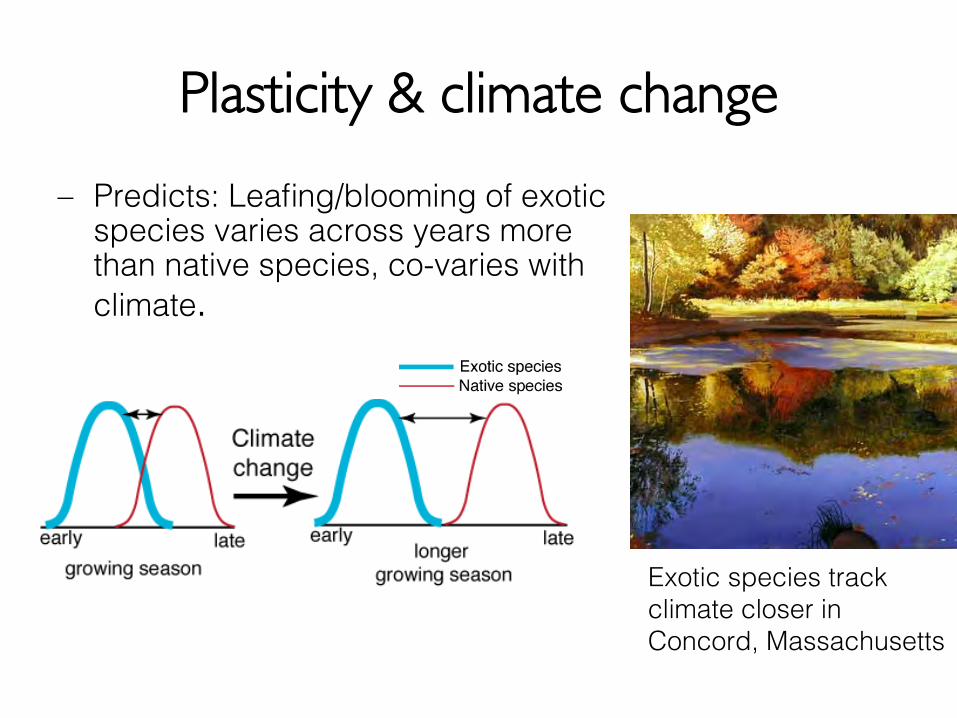
Plasticity & climate change
– Predicts: Leafing/blooming of exoticspecies varies across years morethan native species, co-varies withclimate.
Plasticity & climate change
– Predicts: Leafing/blooming of exoticspecies varies across years morethan native species, co-varies withclimate.
Exotic species trackclimate closer inConcord, Massachusetts
Febr
uary
May
Day of year
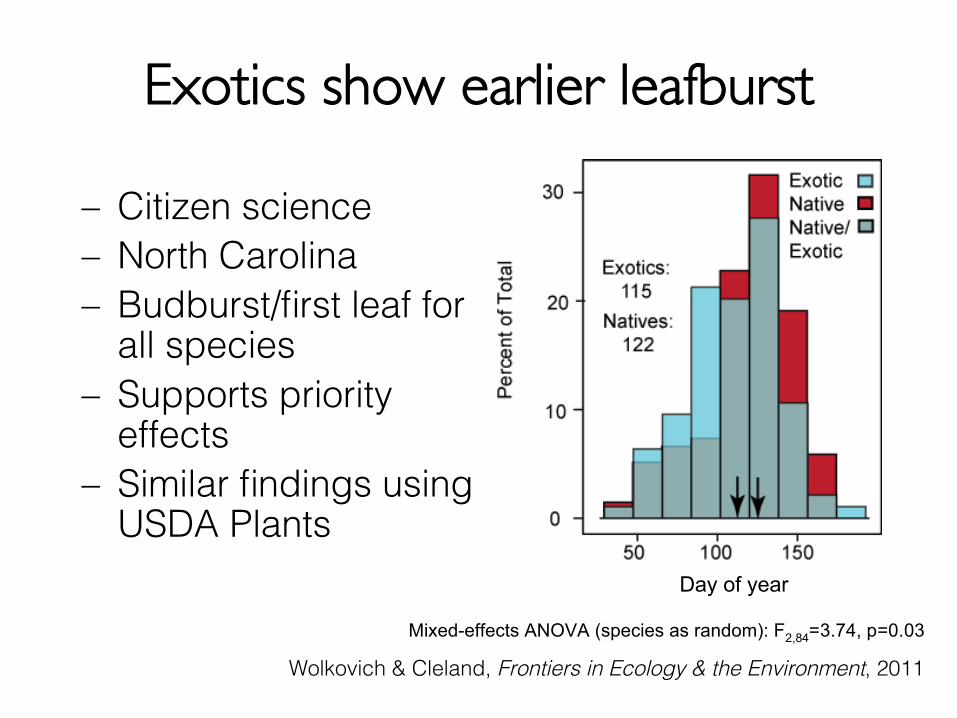
Wolkovich & Cleland, Frontiers in Ecology & the Environment, 2011
Mixed-effects ANOVA (species as random): F2,84=3.74, p=0.03
Exotics show earlier leafburst
– Citizen science– North Carolina– Budburst/first leaf for
all species– Supports priority
effects– Similar findings using
USDA Plants

Impacts of global change oncommunity assembly
– Direct: Changes in planttiming with warming Methods comparison Beyond earlier spring
– Indirect: Role of timing inplant invasions
– Direct & indirect:Mechanisms of invasioneffects on food webs
Impacts of global change oncommunity assembly
– Direct: Changes in planttiming with warming Methods comparison Beyond earlier spring
– Indirect: Role of timing inplant invasions
– Direct & indirect:Mechanisms of invasioneffects on food webs
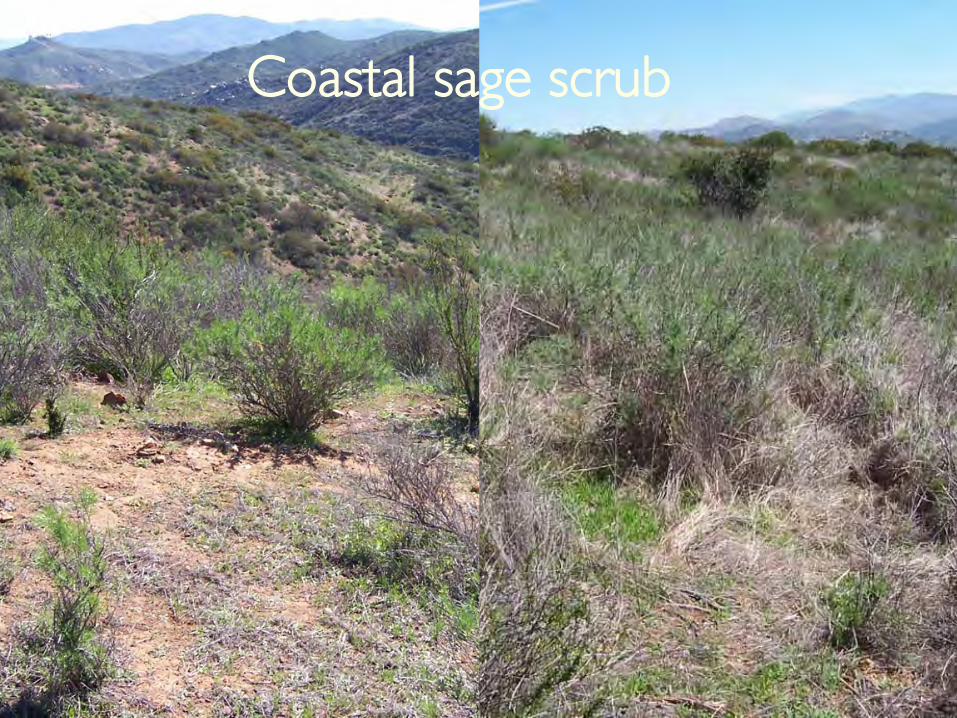
Coastal sage scrub
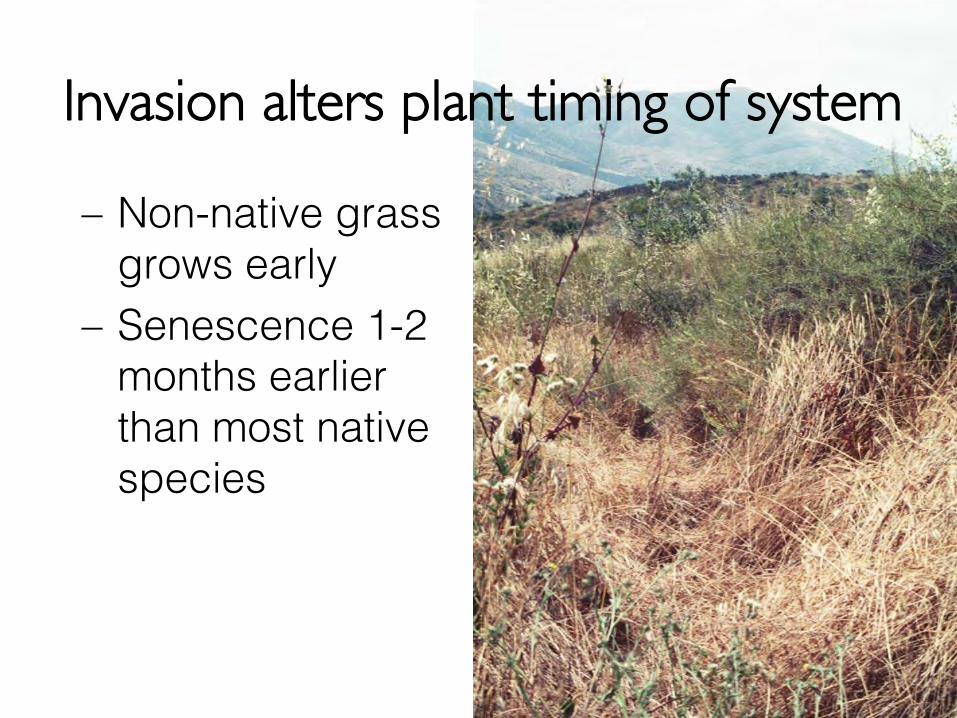
– Non-native grassgrows early
– Senescence 1-2months earlierthan most nativespecies
Invasion alters plant timing of system
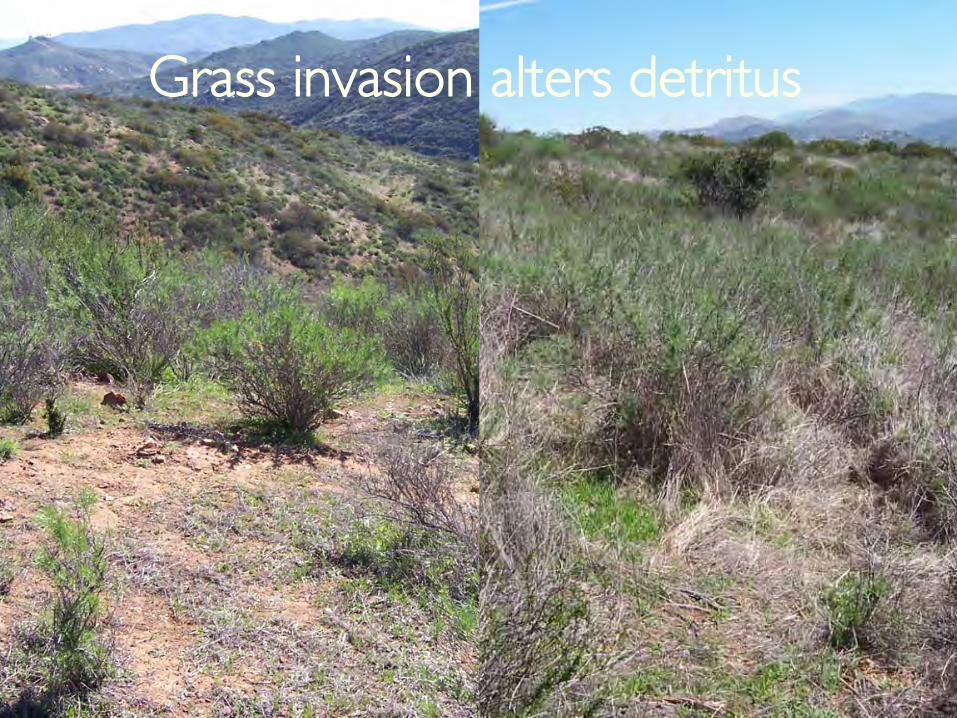
Grass invasion alters detritus
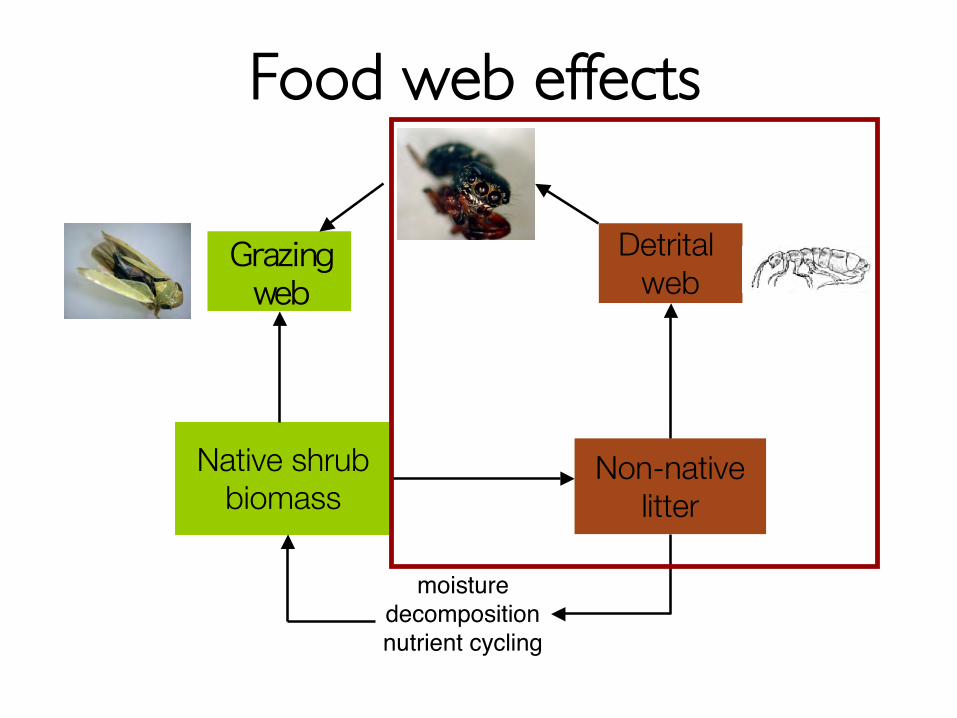
Food web effects
Native shrubbiomass
Grazingweb
Non-nativelitter
moisturedecompositionnutrient cycling
Detrital web
omnivorouspredators
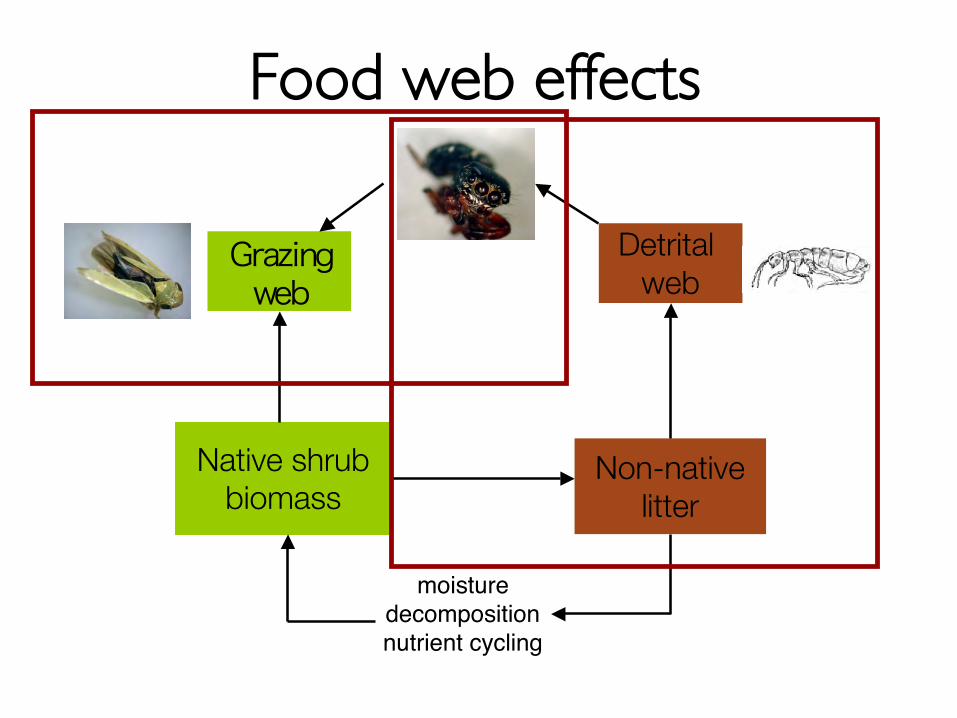
Food web effects
Native shrubbiomass
Grazingweb
Non-nativelitter
moisturedecompositionnutrient cycling
Detrital web
omnivorouspredators
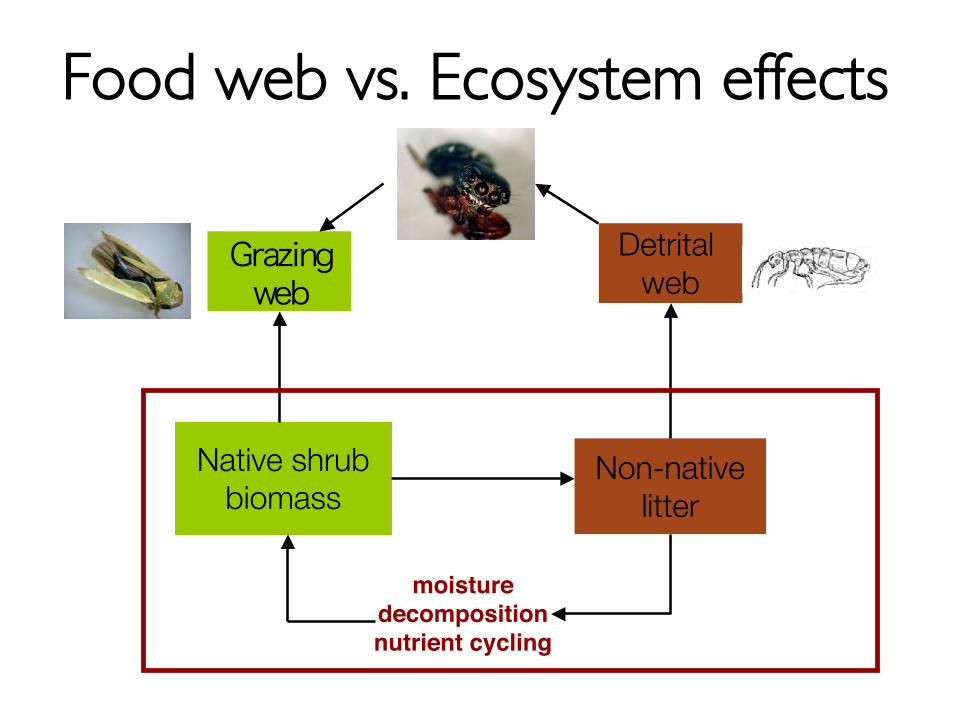
Food web vs. Ecosystem effects
Native shrubbiomass
Grazingweb
Non-nativelitter
moisturedecompositionnutrient cycling
Detrital web
omnivorouspredators
How do abiotic and biotic effectsof invasions alter arthropod
communities?
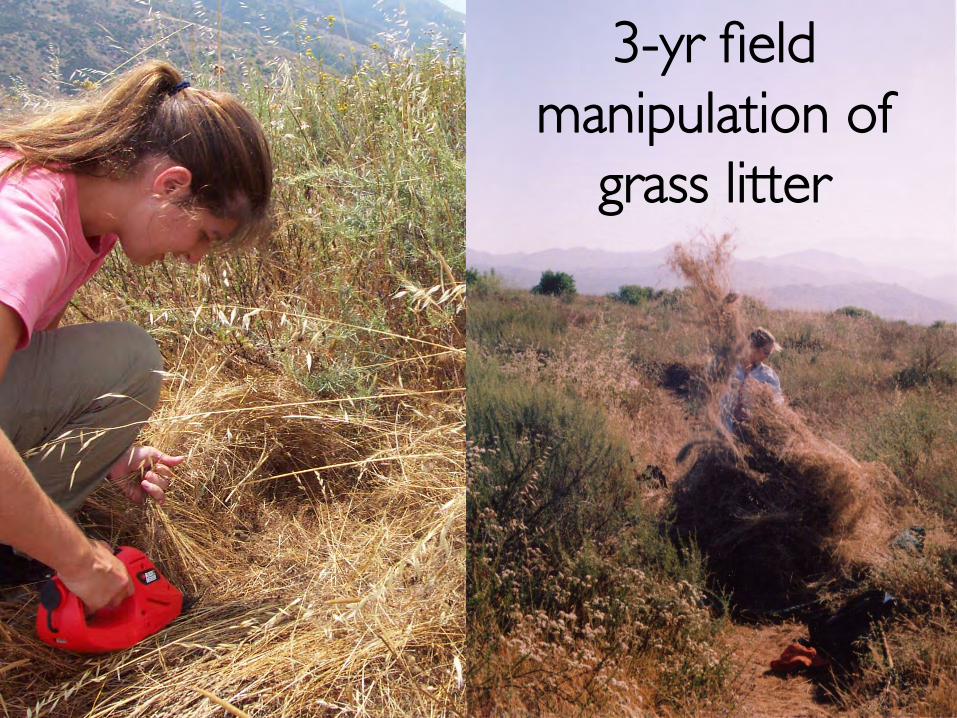
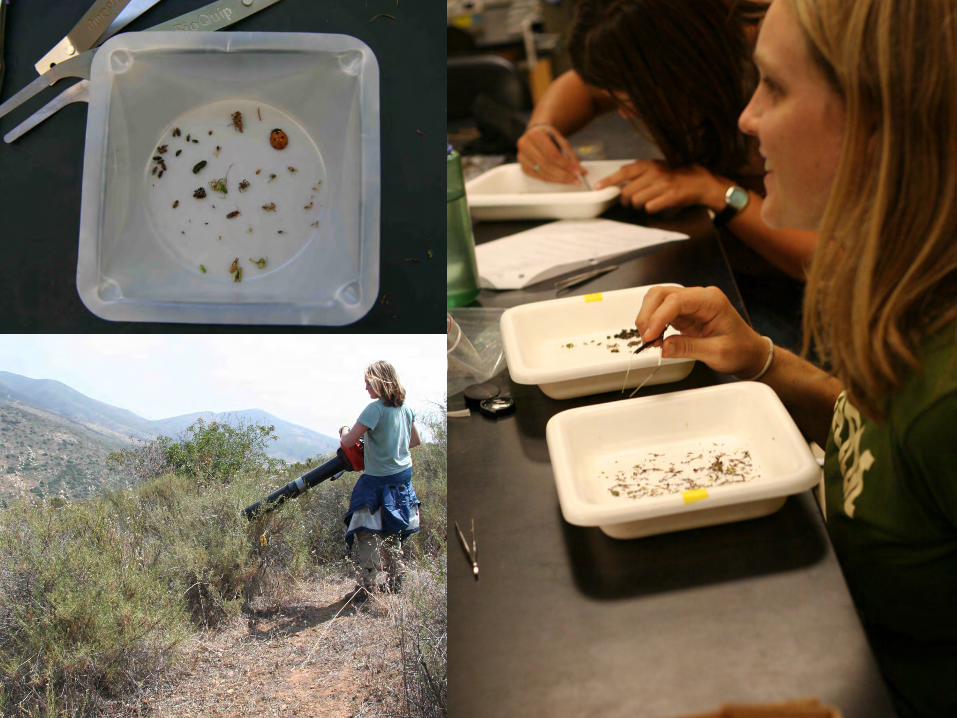
3-yr fieldmanipulation of
grass litter
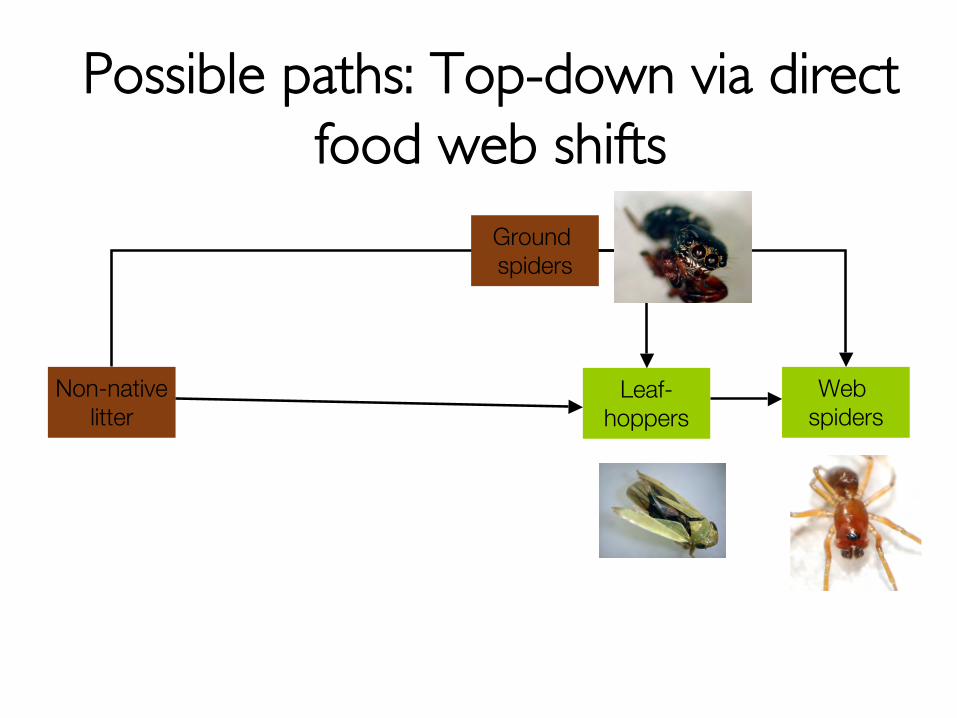
Possible paths: Top-down via directfood web shifts
Leaf-hoppers
Non-nativelitter
Ground spiders
Web spiders
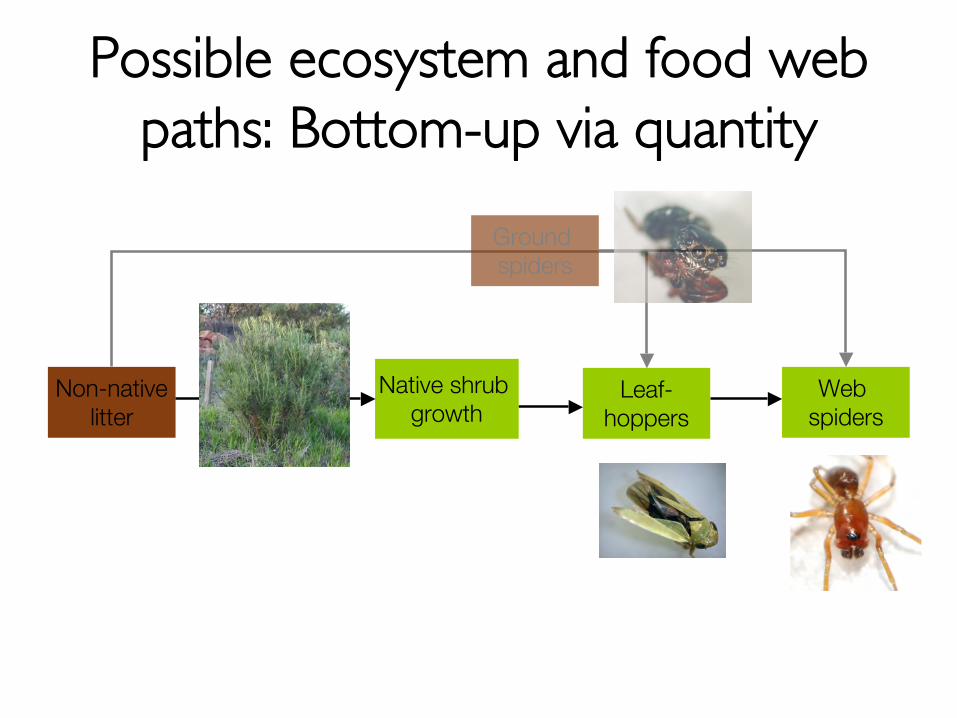
Possible ecosystem and food webpaths: Bottom-up via quantity
Leaf-hoppers
Native shrub growth
Non-nativelitter
Ground spiders
Web spiders
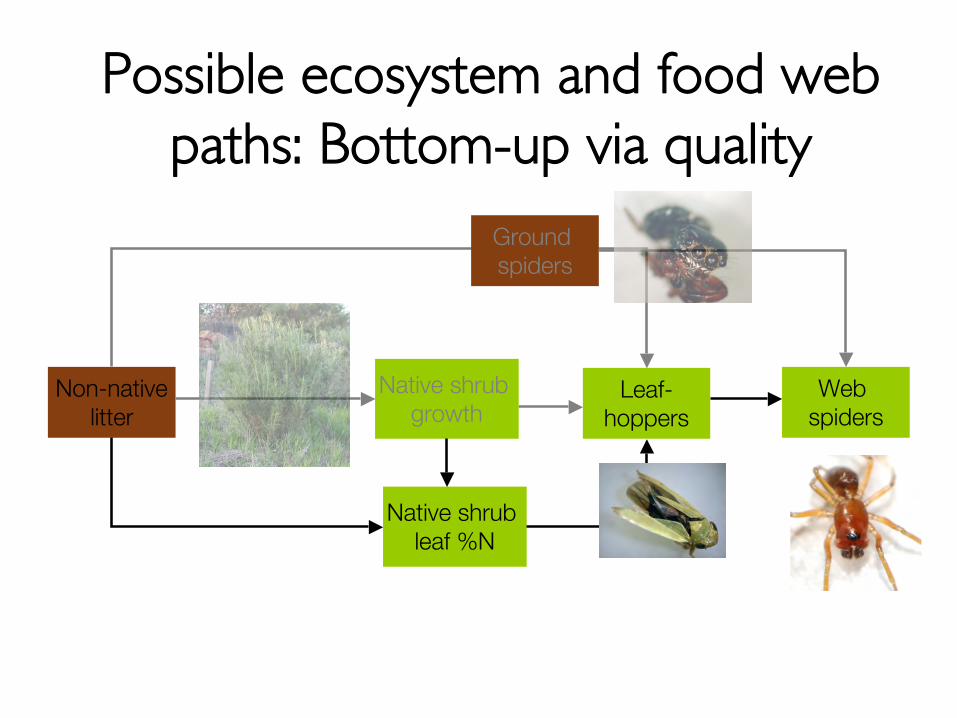
Possible ecosystem and food webpaths: Bottom-up via quality
Leaf-hoppers
Native shrub growth
Non-nativelitter
Ground spiders
Web spiders
Native shrub leaf %N
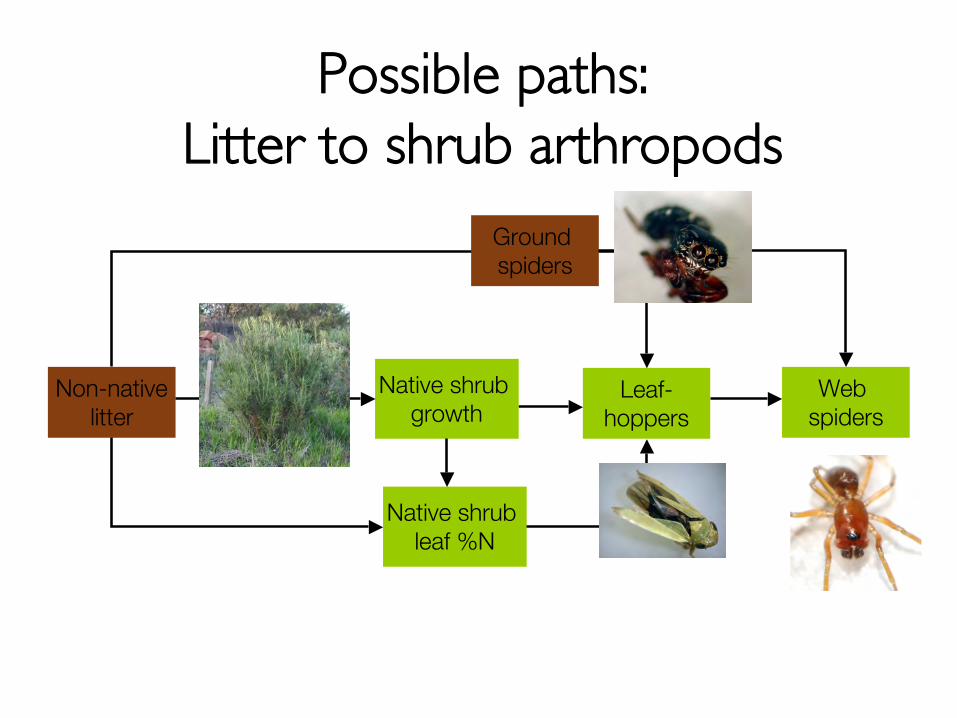
Possible paths:Litter to shrub arthropods
Leaf-hoppers
Native shrub growth
Non-nativelitter
Ground spiders
Web spiders
Native shrub leaf %N
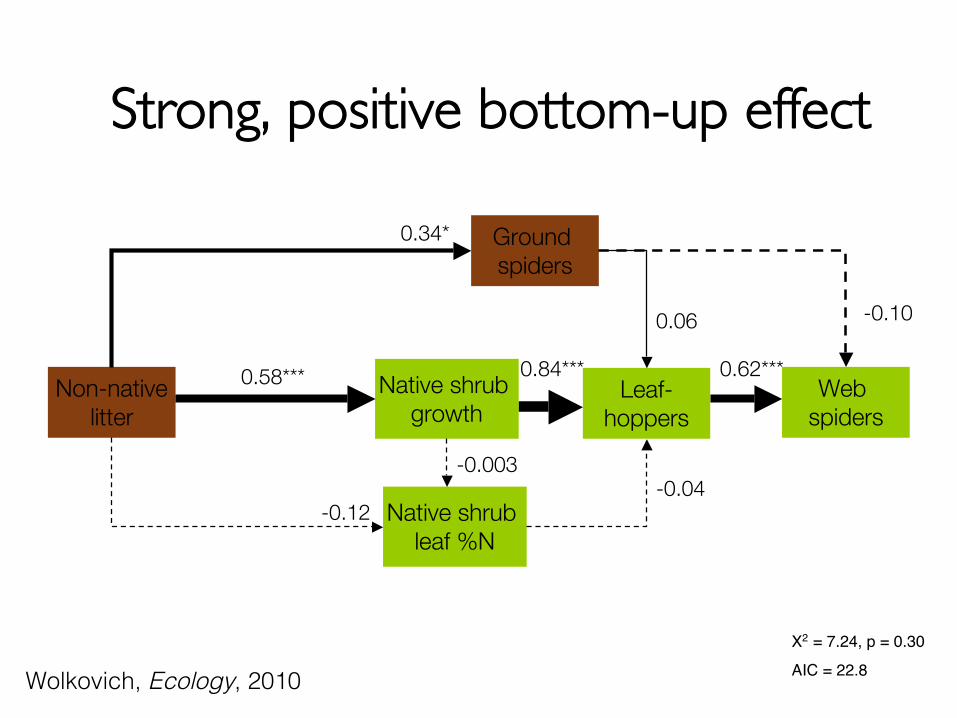
Strong, positive bottom-up effect
Leaf-hoppers
Native shrub growth
Non-nativelitter
Ground spiders
Web spiders
Native shrub leaf %N
-0.100.06
-0.04-0.003
-0.12
0.58*** 0.84*** 0.62***
0.34*
X2 = 7.24, p = 0.30
AIC = 22.8Wolkovich, Ecology, 2010
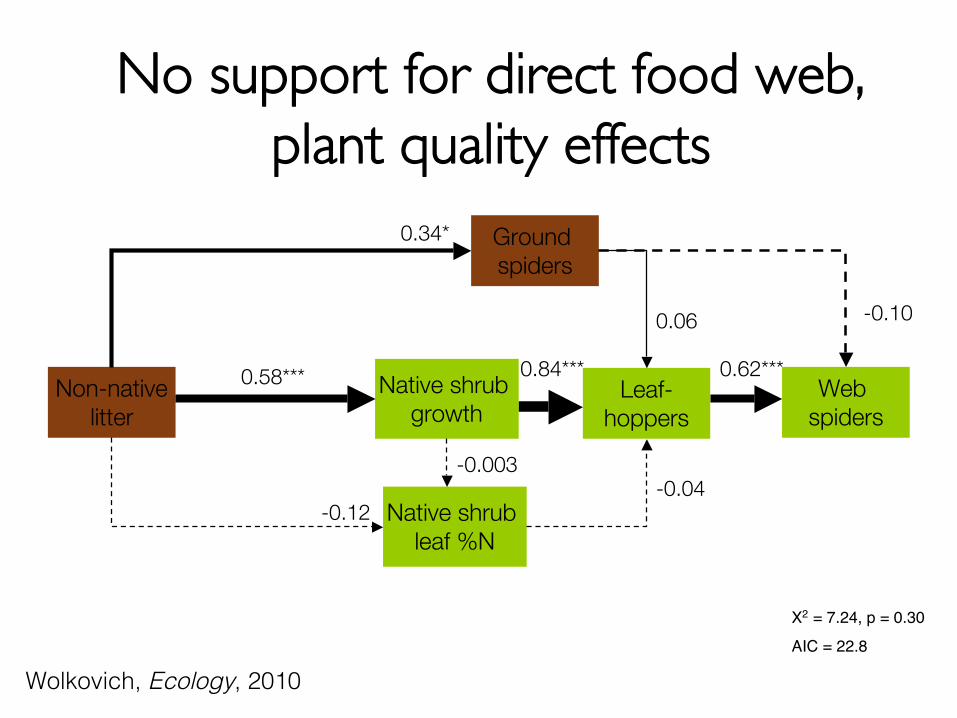
No support for direct food web,plant quality effects
Leaf-hoppers
Native shrub growth
Non-nativelitter
Ground spiders
Web spiders
Native shrub leaf %N
-0.100.06
-0.04-0.003
-0.12
0.58*** 0.84*** 0.62***
0.34*
X2 = 7.24, p = 0.30
AIC = 22.8
Wolkovich, Ecology, 2010
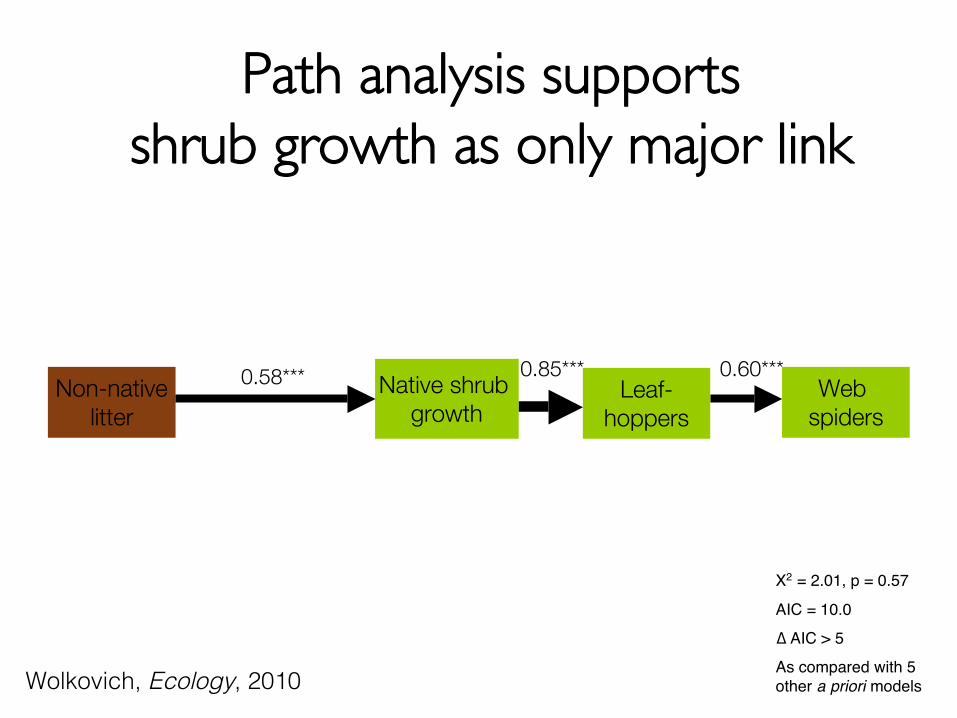
Path analysis supportsshrub growth as only major link
Leaf-hoppers
Native shrub growth
Non-nativelitter
Web spiders
0.58*** 0.85*** 0.60***
X2 = 2.01, p = 0.57
AIC = 10.0
∆ AIC > 5
As compared with 5other a priori modelsWolkovich, Ecology, 2010
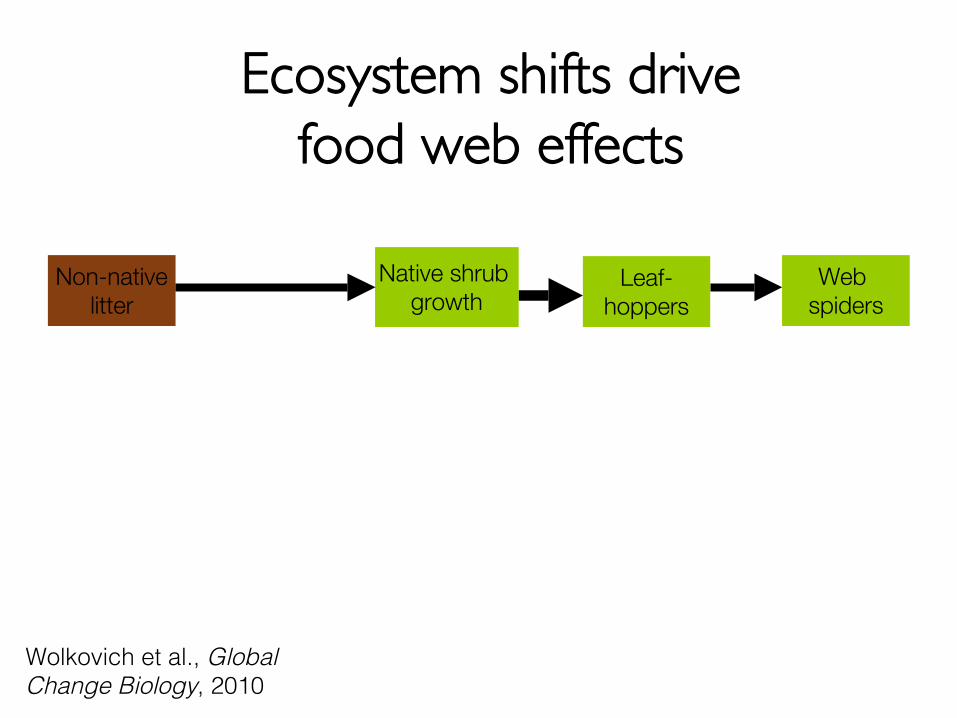
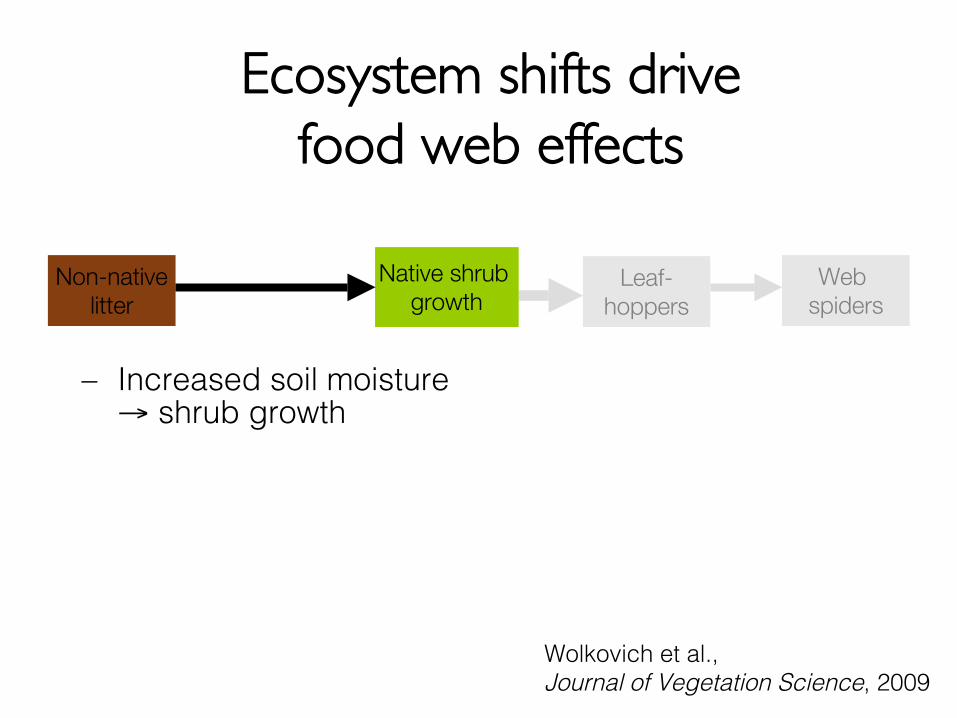
Ecosystem shifts drivefood web effects
Leaf-hoppers
Native shrub growth
Non-nativelitter
Web spiders
Wolkovich et al., GlobalChange Biology, 2010
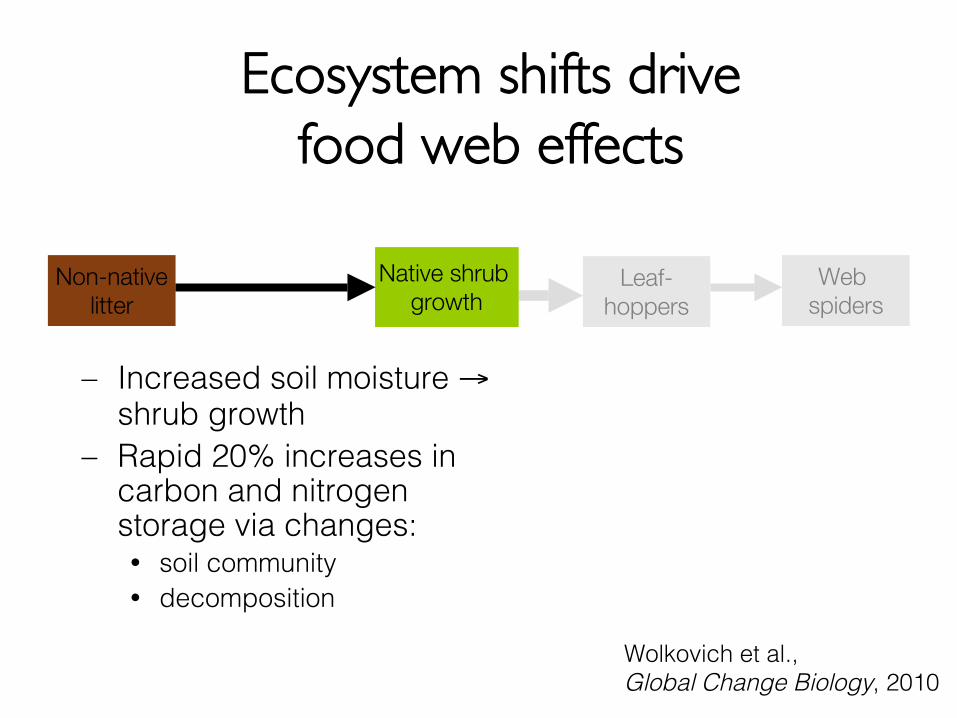
Ecosystem shifts drivefood web effects
Leaf-hoppers
Native shrub growth
Non-nativelitter
Web spiders
Wolkovich et al.,Journal of Vegetation Science, 2009
– Increased soil moisture→ shrub growth
Ecosystem shifts drivefood web effects
Leaf-hoppers
Native shrub growth
Non-nativelitter
Web spiders
Wolkovich et al.,Global Change Biology, 2010
– Increased soil moisture →shrub growth
– Rapid 20% increases incarbon and nitrogenstorage via changes: soil community decomposition
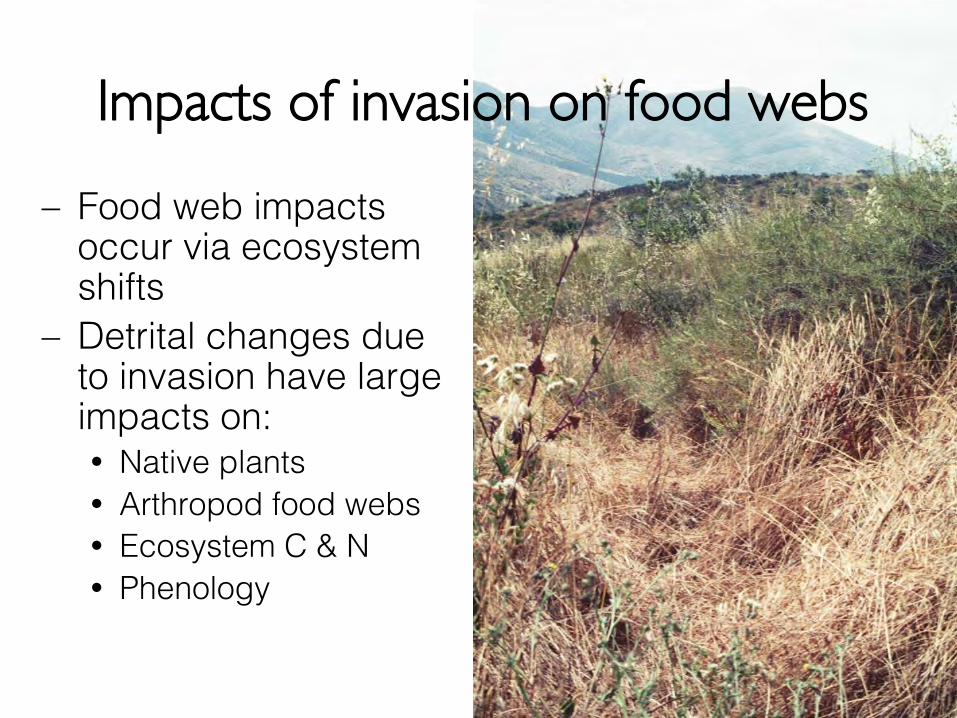
– Food web impactsoccur via ecosystemshifts
– Detrital changes dueto invasion have largeimpacts on: Native plants Arthropod food webs Ecosystem C & N Phenology
Impacts of invasion on food webs
What will be species’ responses?
Changes relative to late 20th centuryA2 scenario, IPCC, WG1 summary, 2007
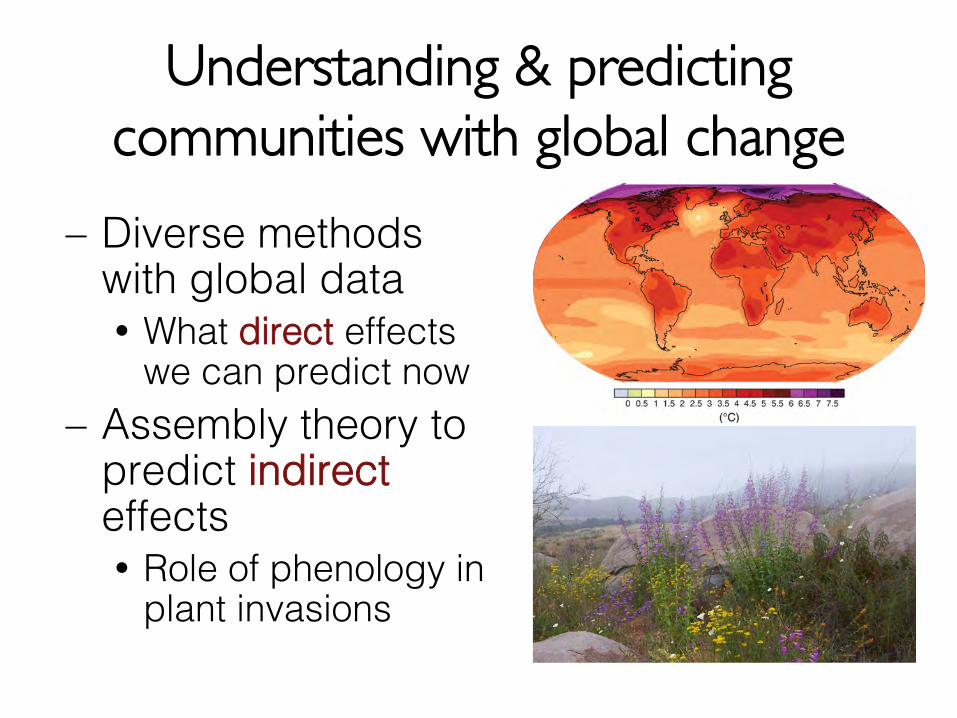
Understanding & predictingcommunities with global change
– Diverse methodswith global data What direct effects
we can predict now– Assembly theory to
predict indirecteffects Role of phenology in
plant invasions
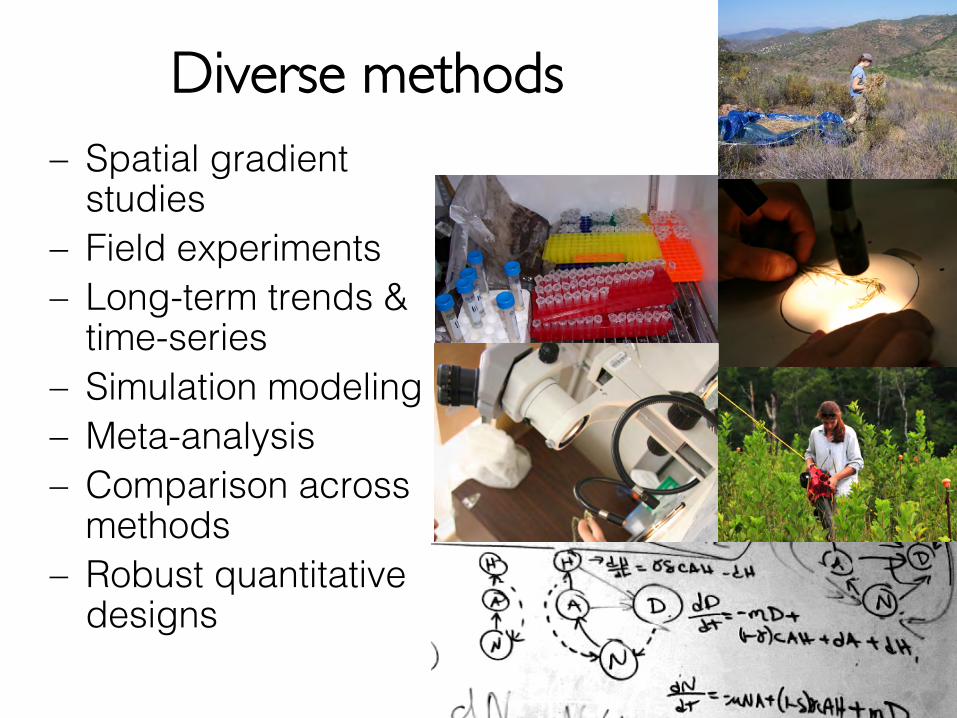
Diverse methods– Spatial gradient
studies– Field experiments– Long-term trends &
time-series– Simulation modeling– Meta-analysis– Comparison across
methods– Robust quantitative
designs
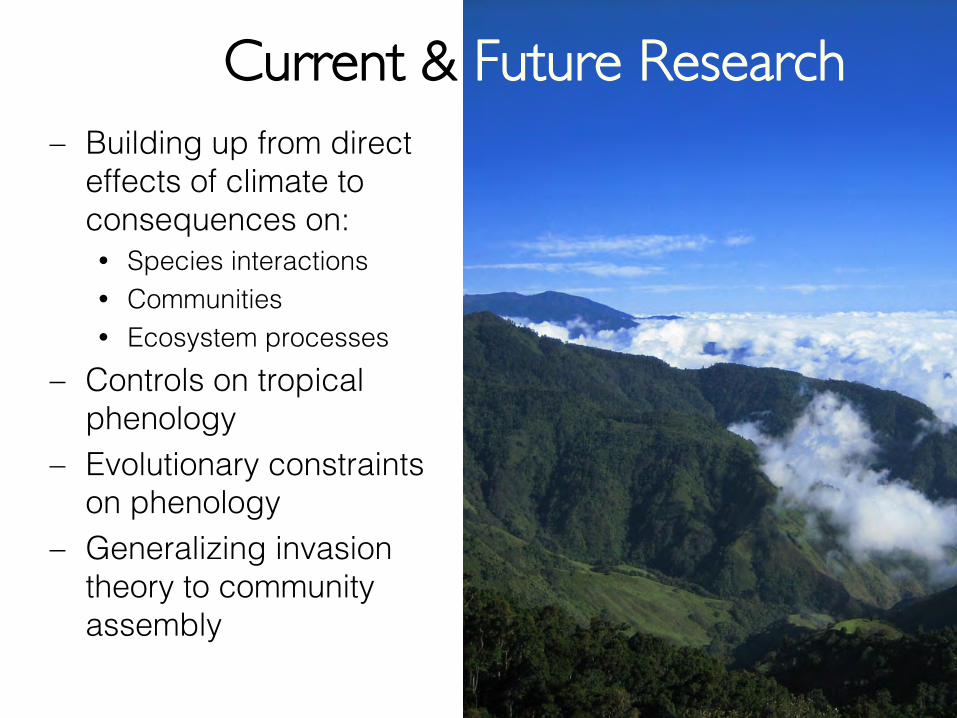
– Building up from directeffects of climate toconsequences on: Species interactions Communities Ecosystem processes
– Controls on tropicalphenology
– Evolutionary constraintson phenology
– Generalizing invasiontheory to communityassembly
Current & Future Research
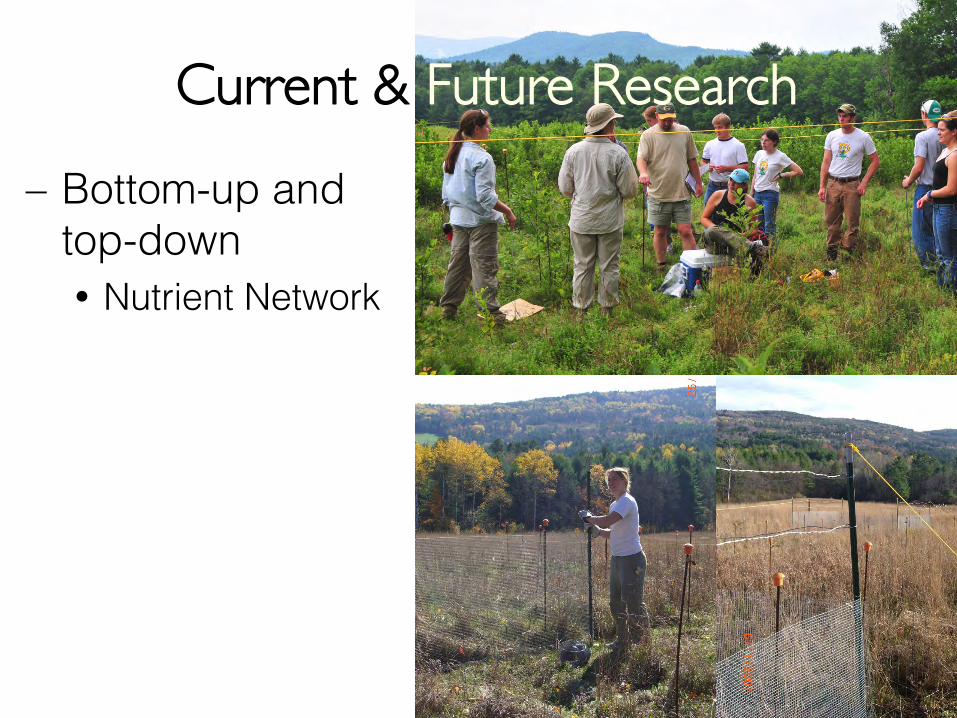
– Bottom-up andtop-down Nutrient Network
Current & Future Research
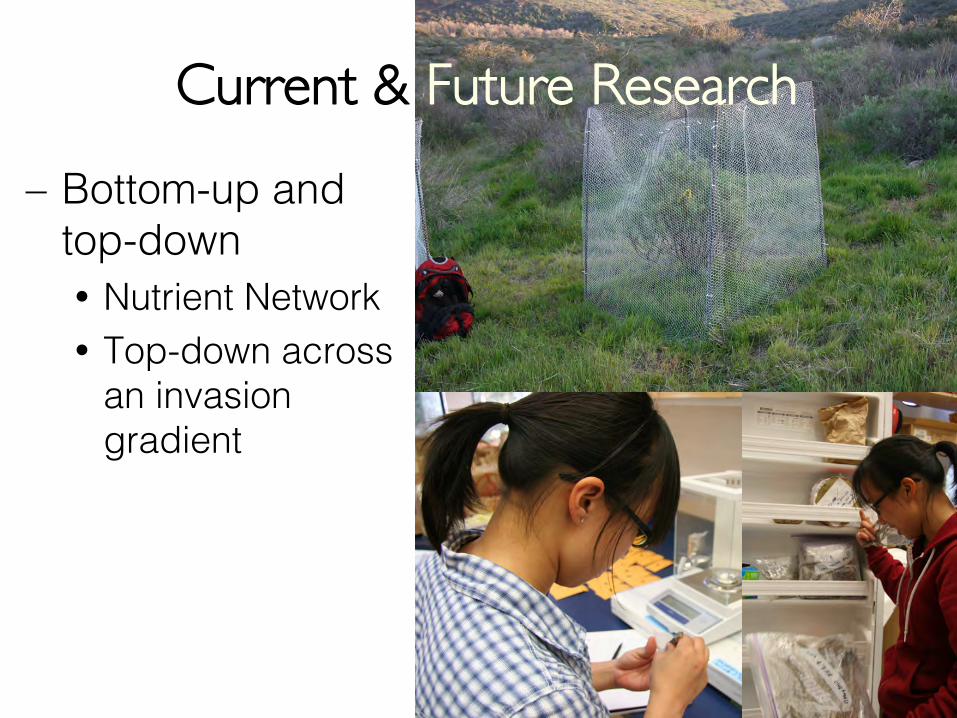
– Bottom-up andtop-down Nutrient Network Top-down across
an invasiongradient
Current & Future Research
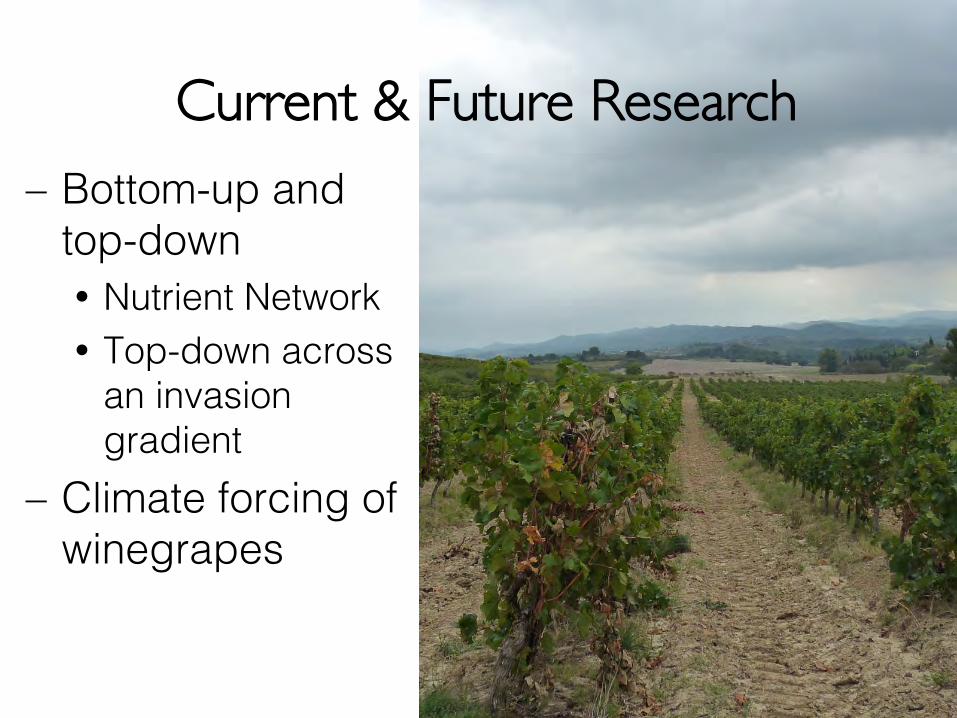
– Bottom-up andtop-down Nutrient Network Top-down across
an invasiongradient
– Climate forcing ofwinegrapes
Current & Future Research
Acknowledgements
– Doug Bolger & KathyCottingham
– Elsa Cleland & StephHampton
– Forecasting Phenologyworking group
– Ben Cook– David Holway, David Lipson,
John Moore