Embed Size (px)
Citation preview

Community Based Model For Fighting Slavery
facebook.com/freetheslaves
@freetheslaves | #freetheslaves
Revised 9-12-2016
freetheslaves.net

Introduction
The anti-slavery movement very much needs evidence-based models that yield significant, sustained declines in the prevalence of slavery.
Free the Slaves has developed a community-based model for fighting slavery that it has deployed, with adaptation, in six countries. The model focuses on identifying and supporting at-risk communities so they acquire the intellectual, organizational, legal, political and physical assets that reduce vulnerability to slavery and liberate those in slavery.
The key elements of the model are contextual research, strengthening the capacity of local agencies and organizations, which, in turn, act to increase community resistance and resilience. Community resistance to slavery is fostered through protective behaviors, community anti-slavery committees, increased household security, services to slavery survivors and increased policy and legal protection. The strengthening of community resistance and resilience reduces new cases of slavery, liberates those in slavery and yields sustained declines in the prevalence of slavery.
The model has been carefully designed to permit rigorous testing and the accumulation of evidence and lessons learned. Results to date are promising. Free the Slaves will continue to test the model over the 2014-2016 period to develop longitudinal data.
We urge the development and testing of other models that can be subjected to rigorous scrutiny.
About Free the Slaves
The mission of Free the Slaves is to liberate slaves and change the conditions that allow slavery to persist. The organization was founded in 2000 and is widely regarded as a pioneer and leader in the modern abolitionist movement. We work with local partners in countries highly affected by slavery to design, test and replicate effective approaches to ending slavery. Free the Slaves implements programs in Democratic Republic of the Congo, Ghana, Haiti, India and Nepal.
The creation of the Free the Slaves community-based model to fight slavery – as well as the ongoing work to implement the model and measure its impact -- has been a remarkable team effort involving every staff member of the organization. This explanatory booklet was authored by Free the Slaves Executive Director Maurice I. Middleberg, Copyright 2014-16 Free the Slaves.
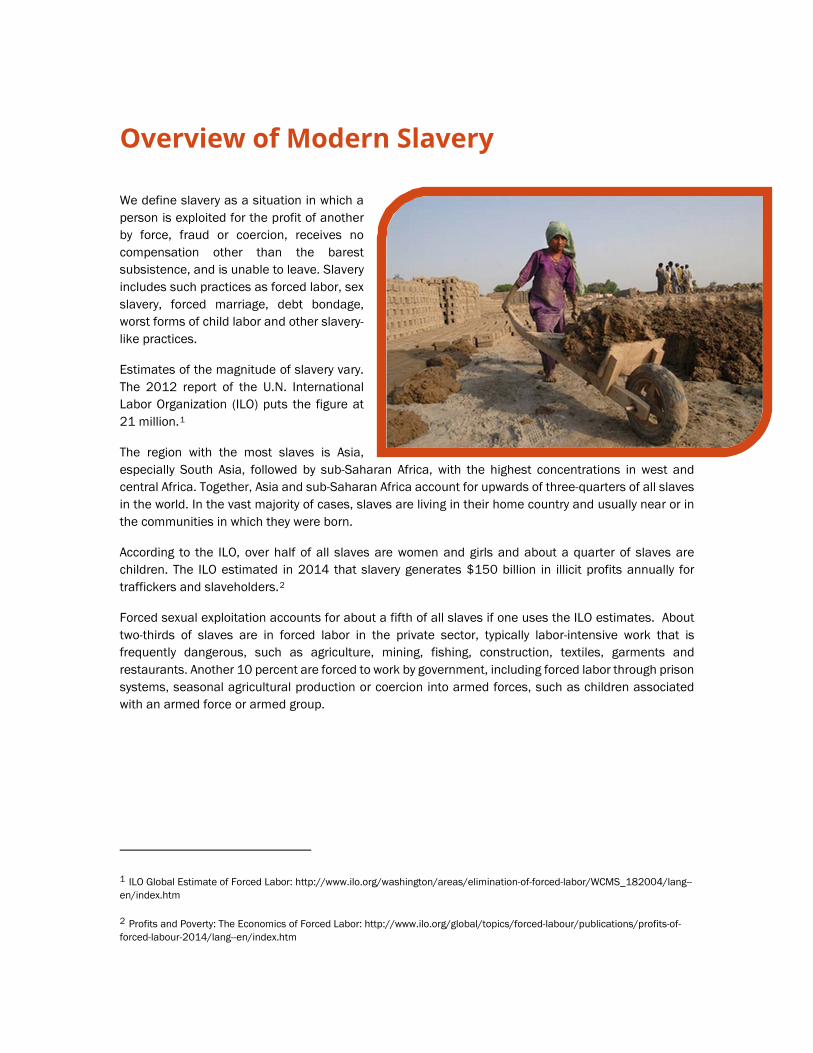
Overview of Modern Slavery
We define slavery as a situation in which a person is exploited for the profit of another by force, fraud or coercion, receives no compensation other than the barest subsistence, and is unable to leave. Slavery includes such practices as forced labor, sex slavery, forced marriage, debt bondage, worst forms of child labor and other slavery-like practices.
Estimates of the magnitude of slavery vary. The 2012 report of the U.N. International Labor Organization (ILO) puts the figure at 21 million.1
The region with the most slaves is Asia, especially South Asia, followed by sub-Saharan Africa, with the highest concentrations in west and central Africa. Together, Asia and sub-Saharan Africa account for upwards of three-quarters of all slaves in the world. In the vast majority of cases, slaves are living in their home country and usually near or in the communities in which they were born.
According to the ILO, over half of all slaves are women and girls and about a quarter of slaves are children. The ILO estimated in 2014 that slavery generates $150 billion in illicit profits annually for traffickers and slaveholders.2
Forced sexual exploitation accounts for about a fifth of all slaves if one uses the ILO estimates. About two-thirds of slaves are in forced labor in the private sector, typically labor-intensive work that is frequently dangerous, such as agriculture, mining, fishing, construction, textiles, garments and restaurants. Another 10 percent are forced to work by government, including forced labor through prison systems, seasonal agricultural production or coercion into armed forces, such as children associated with an armed force or armed group.
1 ILO Global Estimate of Forced Labor: http://www.ilo.org/washington/areas/elimination-of-forced-labor/WCMS_182004/lang--en/index.htm
2 Profits and Poverty: The Economics of Forced Labor: http://www.ilo.org/global/topics/forced-labour/publications/profits-of-forced-labour-2014/lang--en/index.htm

Factors Leading to Slavery
Slavery is not randomly distributed in a population. Slavery disproportionately affects vulnerable communities. While no group or class is immune, those in slavery overwhelmingly come from the poor, the desperate, the uneducated, the marginalized and the unprotected.
However, poverty alone does not cause slavery. On the contrary, slavery is most common among identifiable communities of poor people burdened by very specific forms of vulnerability that can be addressed.
We use the term “communities” advisedly. Our experience is that slavery is to be found in identifiable rural villages and urban neighborhoods that manifest specific kinds of vulnerability. Hence, we focus on strengthening entire communities.
Most Salient Vulnerabilities Leading to Slavery
Lack of Awareness of Rights
In many cases, people do not know their basic rights. They accept the condition of forced labor and exploitation. Debt bondage is a good example. People in debt actually accept the fact that the moneylender has the right to hold them as servants until the debt is paid. They do not know that the moneylender is committing a crime.
Lack of Awareness of Risks
If people don’t have access to good information about working conditions, the promise of a job can be highly alluring. The schemes and blandishments of traffickers are made to sound highly attractive and plausible. This can lead to people placing themselves at risk of trafficking.
Absence or Weakness of Protective Organizations
Poor communities often lack effective local organizations that can serve as buffers and protectors and against those perpetrating enslavement. Disorganized communities are especially vulnerable to becoming enslaved.

Household Insecurity
An underlying cause of slavery is the insecurity of families, by which we mean critical deficiencies in income, assets, access to schooling and health, and inadequate shelter. These deficits can lead to exploitation by those who promise to fill the void. People turn to usurious moneylenders in the absence of a legitimate source of credit. Children who are not in school are especially vulnerable to traffickers. A health crisis can drive people into debt and slavery.
Inadequate Legal Protection
Poor and marginalized groups and communities are also the ones least likely to be protected by the law. Weak laws and lack of law enforcement reduce the risk to slaveholders and traffickers. Almost everywhere, the number of successful prosecutions for slavery is a tiny fraction of the number of crimes committed. Restitution to victims is rare. There are few, if any, penalties to companies that tolerate slavery in their supply chains. In such circumstances, there is a huge incentive for slavery since the profits are high and the costs and risks are low.
Survivor Vulnerability
Survivors of slavery are especially vulnerable. They are usually traumatized as a result of physical, psychological and sexual abuse. They may have developed a perceived or real dependence on their traffickers. Survivors are almost invariably impoverished and sometimes without marketable skills. Their families and communities frequently stigmatize them; this is especially true of women and girls victimized by sex trafficking. Survivors are therefore at high risk of becoming re-enslaved.

Community Based Model for Fighting Slavery
Free the Slaves has developed a causal model that captures the logic by which we attempt to redress key vulnerabilities. All of our programs are carried out with and through local partners. Our basic approach is to create assets that offset vulnerabilities: educate about rights and risks; organize community groups against slavery; strengthen household security; liberate those in slavery; and increase the costs and risks to perpetrators. The model draws from strategies that have been proven to be successful in other international human rights and development efforts.3 The detailed multi-step model and table of indicators to measure progress can be seen in the appendixes of this report. Below is a simplified explanation.
3 A.) Friesendorf, Cornelius (ed.) Strategies Against Human Trafficking: Role of the Security Sector, Vienna and Geneva: National
Defense Academy and Austrian Ministry of Defense and Sports, 2009. B.) CARE Household Livelihood Security Assessments: A Toolkit for Practitioners, Prepared for the PHLS Unit by: TANGO International Inc., Tucson, Arizona 2002. C.) International HIV/AIDS Alliance Tools Together Now! 100 participatory tools to mobilize communities for HIV/AIDS. D.) Global Health Council Global Health Advocacy Manual, Wash., D.C., 2005. E.) Fawcett, Stephen B.; Paine-Andrews, Adrienne; Francisco, Vincent T.; Schultz, Jerry A.; Richter, Kimber P; A Lewis, Rhonda K.; Williams, Ella L.; Harris, Kari J.; Berkley, Jannette Y.; Fisher, Jacqueline L.; Lopez, Christine M. American Journal of Community Psychology “Using empowerment theory in collaborative partnerships for community health and development” 1995-10-01 23:5 P 677-697.

Contextual Research: Free the Slaves always undertakes contextual research to understand the magnitude and dynamics of slavery in the areas selected for support. This helps us identify the specific vulnerabilities and pathways that lead to slavery. Programs can then be adapted to meet local needs.
Capacity Building: Strengthening the capacity of local organizations and agencies to fight slavery is essential to achieving sustainable solutions. Free the Slaves therefore provides training, technical assistance, management development and grants to local organizations. Our partners in any given context may include:
Non-governmental organizations that serve at-risk communities; these may be human rights or development organizations that want to integrate anti-slavery work into their portfolios.
Government agencies charged with providing essential services and/or legal protection.
Media that benefit from training on how to report about slavery through newspapers,
radio, television, websites and social media.
Advocacy coalitions that seek reform of the laws governing slavery or more effective enforcement of existing laws.
International organizations, including bilateral and multilateral donors and
international NGOs that want to integrate anti-slavery interventions into their projects and programs.
Fostering Community Resistance and Resilience: The purpose of capacity building is to enhance the ability of at-risk communities to resist slavery. We develop work plans in concert with the local partners benefiting from our assistance. The goal of these plans is to reduce community vulnerabilities leading to slavery. The outcomes we expect to achieve through the services to communities are:
Behavior change resulting from education and participatory exercises; these should result in changes in knowledge, attitudes and practices at the individual and household level that will protect against slavery.
Organized communities: The education of individuals must be accompanied by collective action. Our partners and we encourage the creation of village and neighborhood committees that mobilize action against slavery. They may be called community vigilance committees, community protection committees, child protection committees or a similar name. They serve as educators, watchdogs and advocates that inform their neighbors, look out for traffickers, follow up on suspected cases of enslavement and advocate for better services and police protection.
Household security is advanced by helping communities access schools, health care,
legitimate sources of credit and employment. Mobilized communities assisted by effective local anti-slavery organizations are better positioned to secure needed services from governments and non-governmental providers.
Survivor protection is advanced by working with and through survivor led organizations
to ensure former slaves receive an appropriate combination of transition shelter, counseling, medical care, vocational training and follow-up.

Legal and police protection are strengthened through training of police and judiciary,
legal services for survivors, media reporting on the effectiveness of police protection and political advocacy.
Sustained Reduction in Slavery: Community resistance and resilience should lead to long-term reductions in slavery. Specifically, we expect to observe the following:
Liberation of slaves either as a result of direct action by newly empowered individuals
and communities or through rescues and raids undertaken by NGOs and police.
Reintegration of freed slaves, who, through survivor services, acquire the wherewithal to claim a life in freedom.
Reduction in the number of people newly entering slavery.
Decline in the prevalence of slavery in formerly vulnerable communities.
The detailed Free the Slaves causal model may be seen in Appendix 1.

Monitoring and Evaluating Impact
While we believe our country program causal model reflects the knowledge gained through long experience about slavery causes and remedies, we also acknowledge that rigorous validation of the model is needed. Moreover, the actual results achieved in any of our programs must be carefully tracked and analyzed.
To that end, Free the Slaves has defined indicators for each variable in the model (see Appendix 2). These have been accompanied by the development of evaluation tools that will facilitate data gathering.
All of our country programs develop detailed work plans that articulate the specific results to be achieved each year. We use the indicators to track progress.
Through continuous and systematic monitoring and evaluation, we are testing and validating the model, monitoring actual progress against planned objectives and deriving lessons learned that help continually improve our programs.
We anticipate that the model will be refined as evidence accumulates. Among the questions that we hope to address are the following:
The quantitative impact of the Free the Slaves approach on the incidence and prevalence of slavery in our target areas.
The time frame needed to achieve significant impact.
The relative importance of the different variables hypothesized to affect slavery.
Strategies for scaling up the model.

Impact Achieved
The increased focus on measurement at Free the Slaves has already helped improve our ability to assess impact. In 2015, we were able to record the following aggregate results from our programs:
2,265 people freed from slavery.
82,583 villagers educated on how to protect their families from traffickers.
1,977 villages and neighborhoods supported to protect their residents from slavery.
1,281 government officials trained on how to more effectively stop slavery. 163 traffickers and slaveholders arrested.

Appendix 1: Free the Slaves Detailed Causal Model
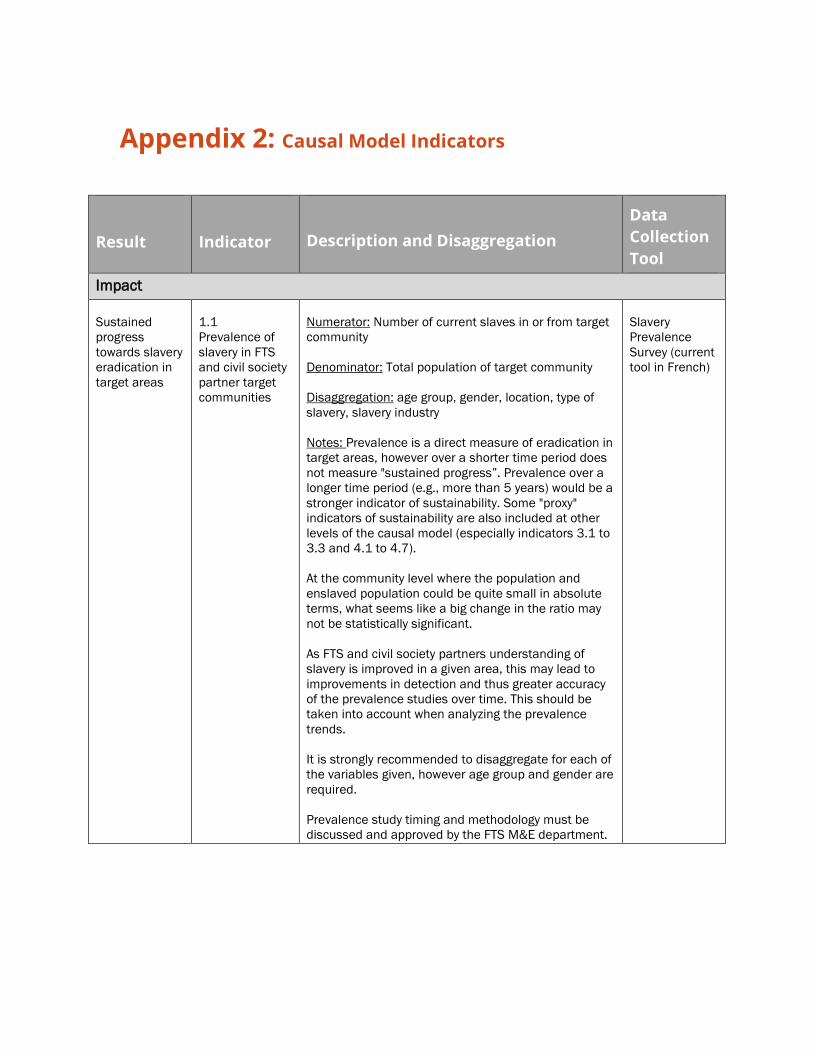
Appendix 2: Causal Model Indicators
Result
Indicator
Description and Disaggregation Data Collection Tool
Impact Sustained progress towards slavery eradication in target areas
1.1 Prevalence of slavery in FTS and civil society partner target communities
Numerator: Number of current slaves in or from target community Denominator: Total population of target community Disaggregation: age group, gender, location, type of slavery, slavery industry Notes: Prevalence is a direct measure of eradication in target areas, however over a shorter time period does not measure "sustained progress”. Prevalence over a longer time period (e.g., more than 5 years) would be a stronger indicator of sustainability. Some "proxy" indicators of sustainability are also included at other levels of the causal model (especially indicators 3.1 to 3.3 and 4.1 to 4.7). At the community level where the population and enslaved population could be quite small in absolute terms, what seems like a big change in the ratio may not be statistically significant. As FTS and civil society partners understanding of slavery is improved in a given area, this may lead to improvements in detection and thus greater accuracy of the prevalence studies over time. This should be taken into account when analyzing the prevalence trends. It is strongly recommended to disaggregate for each of the variables given, however age group and gender are required. Prevalence study timing and methodology must be discussed and approved by the FTS M&E department.
Slavery Prevalence Survey (current tool in French)

1.2 Incidence of slavery in FTS and civil society partners target communities
Numerator: Number of individuals in population who entered slavery in the past 12 months in target community (counts current slaves who entered in past 12 months and those who both entered and exited in the past 12 months) Denominator: Total population of target community Disaggregation: age group, gender, location, type of slavery, slavery industry Notes: Incidence measures a person's probability of being enslaved (i.e. the occurrence of people starting to be slaves) during the most recent year. It is strongly recommended to disaggregate for each of the variables given, however age group and gender are required.
Slavery Prevalence Survey (current tool in French)
Decreased vulnerability to slavery 1. Slaves freed and reintegrated
2.11 Number of slaves freed
The number of slaves who used to meet all three conditions of slavery (1. Forced, coerced, or deceived to provide labor or sexual service, 2. under the threat of physical or psychological violence or other serious harm, and 3. unable to walk away) who are no longer in slavery, and are now living in freedom as a result of:
• rights education (those who directly received information about their rights or whose family members or community received information about their rights), or
• rescue efforts (including FTS or government/civil society partner detection or law enforcement), or
• other FTS and civil society partner efforts Disaggregation: age group, gender, location, type of slavery (including those in transit to slavery), slavery industry Notes: This also includes those people who have been rescued in transit to situations of slavery.
Survivor Registry (a tab within the partner quarterly reporting template)
2.12 Number of freed slaves who are effectively reintegrated
The number of freed slaves who have achieved self-sustained independence based on an assessment of whether their status on the following five criteria are similar to their peers/neighbors: employment, education, savings, housing, and health (including mental health)
Disaggregation: age group, gender, location, type of slavery, slavery industry.
Survivor Registry (a tab within the partner quarterly reporting template) Reintegration checklist

Notes: This is a "trailing indicator" showing results over a longer time period. May not as accurately reflect effectiveness of current efforts. Does not measure long-term sustainability.
(under development)
2. Individual knowledge, attitudes and practices strengthened in target communities
2.2 Knowledge, Attitudes, Practice (KAP) score for communities
A composite (index-type) indicator that represents a weighted average of individuals' knowledge, attitudes, and practices related to slavery within target populations Stratification: Gender, age Notes: Free the Slaves has designed a KAP survey with common categories across countries, but specific survey questions need to be adapted to the local slavery situation, the local understanding of slavery, language, and cultural factors. The target population for this indicator is all of the households in a community. The tool may also be used as pre/post tests with beneficiaries of certain interventions.
Knowledge, Attitudes, and Practices Survey (standard tool available)
3. Community collective resistance strengthened
2.3a Number of communities maturing towards sustainable resistance to slavery 2.3b Proportion of communities maturing towards sustainable resistance to slavery 2.3c Number of communities that have reached the full level of maturity
2.3a and 2.3b Numerator: Number of communities with a maturity (for sustainable resistance to slavery) score that increased by at least 5 points relative to the prior year's rating 2.3b Denominator: Total number of communities with one or more anti-slavery community groups receiving capacity building support from FTS and civil society partners 2.3c Number of communities who have reached the full level of maturity of sustainable resistance to slavery (i.e. scored 40 to 45 points on the Community Maturity Tool AND both the community members and partner organization agree the community is mature)
Community Maturity Tool (standard tool available)
4. Improved socio-economic status
2.4 Socioeconomic index score
A composite (index-type) indicator of socioeconomic status (wealth/assets, education, family size, food availability, water sources, shelter, and health access) for each community. Stratification: female-headed households, male-headed households, child-headed households
Socio-economic Status Survey (current tool in French)

Notes: This functions as both a context indicator as well as a performance indicator in some communities where intense efforts to improve socioeconomic status are underway. The target population for this indicator is all of the households in a community. The tool may also be used as pre/post tests with beneficiaries of certain interventions.
5. Government anti-slavery policies and practices strengthened
2.51 Number of government policy milestones achieved
Total number of annual milestones achieved as measured using the qualitative policy milestone tracker Disaggregation: FTS policy areas, government level Notes: Aggregate count shows broad effectiveness across countries; the detailed qualitative milestone trackers will provide richer information to "zoom in" to specific country programs. Anti-slavery actions taken by advocacy targets may not be fully attributable to FTS or FTS civil society partner/coalition advocacy efforts.
Advocacy Milestone Tracker (standard tool available: stand-alone and integrated into partner quarterly reporting template)
2.52a Number of arrests 2.52b Number of prosecutions 2.52c Number of Convictions
2.5.2a: Total number of individuals arrested over the prior year for violations of slavery-related laws (including slave-holding, trafficking, accessories to crimes, etc.) or of laws violated in the course of committing slavery-related crimes (e.g. rape, assault, murder) in cases receiving support from FTS or FTS civil society partners 2.5.2b: Total number of individuals prosecuted for slavery-related crimes or crimes committed in the course of committing slavery-related crimes in cases receiving support from FTS or FTS civil society partners 2.5.2c: Total number of individuals found guilty following a criminal trial of slavery-related crimes or crimes committed in the course of committing slavery-related crimes in cases receiving support from FTS or FTS civil society partners Disaggregation: Type of slavery; Slavery Industry.
Quarterly indicators tracker within partner quarterly reporting template
6. General public awareness of slavery increased
2.6 Estimated number of people reached through awareness raising
Estimated number of individuals that have been introduced to information about the local existence of slavery and/or the types of slavery. Disaggregation: Location Notes: When possible, if individuals are reached more than once, they will only be counted once. Some estimates can be more accurate than others; methods for estimation should be discussed and approved. If individuals are both told about slavery and about their rights/risks, they are counted both under indicator 3.2 and under the general awareness-raising indicator.
Quarterly indicators tracker within partner quarterly reporting template

7. Increased donor and international NGO support for anti-slavery work
2.7 Anti-slavery interventions adopted and/or funded by donors and international NGOs as a result of FTS and civil society partner advocacy
Qualitative description of interventions undertaken by donor and international NGOs along with qualitative description of how FTS and civil society partners influenced that outcome. Should be verified with records of discussions, correspondence, and/or in increases in budget allocations for anti-slavery work. Disaggregate: Slavery-focused programs/Slavery lens, donor/NGO Notes: This indicator shows the degree of influence FTS and civil society partners exercise but does not measure the actual outcomes or quality of the "slavery lens" activities of these stakeholders. (On the other hand, if the stakeholder is undertaking such analysis of outcomes, FTS and civil society partners could include details in its qualitative description.)
Quarterly partner quarterly reporting template
Fostering Rights, Resistance and Resilience 1. Support to communities and anti-slavery community groups
3.11 Number of communities receiving support from FTS and civil society partners
Total number of communities that have actively been supported by FTS and civil society partners with any type of assistance during the year Disaggregation: Assistance type; location. Notes: This only measures the number of communities in which we are doing long-term work towards eradicating slavery - not just one-time meetings. Communities that have been declared mature, but still receive some type of support, would not be included in this indicator.
Quarterly indicators tracker within partner quarterly reporting template
3.12 Number of anti-slavery community groups being facilitated in participatory learning and action
Total number of anti-slavery community groups (CVCs, village councils, or other groups at the community level that would or do take collective action to keep the community free from trafficking and slavery) that are being facilitated in participatory learning and action by FTS and civil society partners Disaggregation: Support type, Location
Quarterly indicators tracker within partner quarterly reporting template
2. Rights and risks education
3.2 Number of community members educated in rights and risks
Total number of community members who have received information about their rights and risks (the information should include both risks and rights) through informal or formal programs Disaggregation: Age group, Gender, Location, length of event Notes: Mass general awareness raising such as radio spots is not included in this indicator. Rights education is included without consideration of the time length. Examples include Reflect circles, community skits,
Quarterly indicators tracker within partner quarterly reporting template

outreach, and formal curricula. When possible, if individuals are trained more than once, they will only be counted once. If individuals are both told about slavery and about their rights/risks, they are counted both under this indicator and under the general awareness-raising indicator.
3. Promoting socio-economic rights & services
3.3a Number of individuals supported to access their socioeconomic rights and/or services 3.3b Number of individuals that have successfully accessed socioeconomic rights and/or services as a result of the support provided 3.3c Proportion of individuals that have successfully accessed socioeconomic rights and/or services as a result of the support provided
3.3a, 3.3c Denominator: Total number of individuals that have received any form of support from FTS and civil society partners beyond rights education (counted under indicator 3.2) to gain access to socioeconomic rights and/or services 3.3b, 3.3c Numerator: Total number of individuals that have successfully accessed the rights and/or services as a result of the support provided Disaggregation: age, gender, location, number of rights and/or services Notes: Examples of socio-economic rights & services include filing cases with the police, accessing schools, accessing health care, and government welfare/cash programs. Increasing knowledge of available services but not getting access to them would be counted under 3.3a, i.e. a family of a returned child slave learns about Ghana’s livelihood empowerment program. They would not be counted under 3.3b until the family received the funding.
Quarterly indicators tracker within partner quarterly reporting template
4. Other direct services
3.4 Number of slavery survivors or at-risk individuals receiving services directly from FTS and civil society partners
Total number of survivors of slavery or at-risk individuals who received direct services from FTS and civil society partners Disaggregation: Service area, age group, gender, location, survivor vs at-risk, type of slavery, slavery industry, number of services Notes: Measures quantity but not effectiveness of services. Effectiveness is measured through the "Decreased vulnerability to slavery" (level 2) indicators. Examples of services include psychosocial counseling and filing legal cases.
Quarterly indicators tracker within partner quarterly reporting template

All services provided are included despite the length or amount (whether a survivor is receiving long term, comprehensive support vs. a one-time seed funding, for example). If an individual receives both a direct service and is supported to access other services, they would be counted under both indicators.
5. Advocacy
3.5 Advocacy interventions undertaken by FTS and/or FTS coalition and/or civil society partners
Qualitative analysis of advocacy interventions undertaken by FTS and/or FTS coalition and/or civil society partners
Advocacy Milestone Tracker(standard tool available: stand-alone and integrated into partner quarterly reporting template)
6. Monitoring, Evaluation, & Research
3.6a Monitoring, Evaluation or Research reports developed 3.6b Recommendations developed and disseminated to stakeholders as a result of partner-led, FTS-supported M&E or research or FTS direct M&E or research
3.6a: Titles of monitoring, evaluation, or research products developed 3.6b: Qualitative analysis of NEW recommendations developed and later disseminated as a result of partner-led, FTS-supported, M&E or research or FTS-led M&E or research.
Quarterly indicators tracker within partner quarterly reporting template
Strengthened Partner Capacity
1. Grassroots partner capacity strengthened
4.1 Grassroots partners' organizational capacity score
Composite score (index-type) of FTS civil society partners using organizational capacity assessment tool Decomposition of score by: capacity categories
OCAT (standard tool available)
2. Key government
4.2a Number of government entities
4.2a: Total number of government entities receiving any form of support from FTS or FTS civil society partners.
Quarterly indicators tracker within partner

actors capacity strengthened
receiving capacity building support 4.2b Number of government officials receiving capacity building support
Disaggregation: Support type; Government sector; Government Level 4.2b: Total number of government officials receiving any form of support from FTS or FTS civil society partners. Disaggregation: Support type; Government sector; Government Level Notes: When possible, if individuals or entities are trained more than once within a year, they will only be counted once during that year.
quarterly reporting template
3. Media more capable of telling "slavery story"
4.3 Number of media stories disseminated following FTS or FTS civil society partners capacity building interventions, meeting minimum standards for an effective media story
Counts all media stories (using radio, print, digital, or other means) that effectively communicate about the slavery situation and/or solutions relevant to national or local context subsequent to receiving FTS, or FTS civil society partners, capacity building Disaggregation: Geographic level of story (national, subnational, district) Note: Effectiveness criteria are categorized into accuracy, completeness, tone, and impact.
Media standards checklist (under development)
4. Donors & international NGOs able to integrate "slavery lens"
4.4a Number of non-FTS partner NGOs or donors receiving capacity building support 4.4b Number of non-FTS partner NGO staff or donor staff receiving capacity building support
4.4a: Total number of non-FTS partner NGOs or donors receiving any form of support from FTS or FTS civil society partners. Disaggregation: NGO/donor sector; NGO/ donor level 4.4b: Total number of non-FTS partner NGO staff or donor staff receiving any form of support from FTS or FTS civil society partners. Disaggregation: NGO/donor sector; NGO/donor level Notes: When possible, if individuals, NGOs or donors are trained more than once within a year, they will only be counted once during that year. Although the result area mentions only international NGOs, this indicator also captures the support we give to non-partner country civil society organizations.
Quarterly indicators tracker within partner quarterly reporting template
5. Coalitions advocacy capacity strengthened
4.5 Number of coalitions receiving advocacy
Total number of coalitions receiving any form of capacity building or other support from FTS or FTS civil society partners Disaggregation: Assistance type
Quarterly indicators tracker within partner quarterly

capacity building support
Notes: This is an output indicator used as a proxy for an outcome that could be measured, but for practicality's sake will not be. Eventually may use capacity assessment tools, however degree of assistance and workload factors do not yet justify this.
reporting template
Free the Slaves Support to Partners
1. Capacity building
5.11 FTS Time spent providing technical assistance to civil society and/or coalition partners
Estimated days spent providing direct capacity building to partners. Estimate based on pre-determined proportion of program team (and other appropriate staff) labor.
5.12 Number of civil society and coalition partner staff trained by FTS staff.
Total number of staff from government, NGO, and/or coalition partners who have received training directly from FTS personnel. Disaggregation: Partner type, ST vs. LT training. Notes: An output indicator related to capacity building. Outcomes are measured via indicators 4.1 and 4.2. Direct mentoring is counted under indicator 5.1.1
Country Program Reports
2. Grants
5.2a Number of Grants 5.2b Value of Grants
5.2a: Total number of grants active during the current calendar year 5.2b: Total USD value of grant funds actually disbursed to partner organizations during the current calendar year
Budgets

Appendix 3: Monitoring and Evaluation Tools Summary
Free the Slaves (FTS) uses six data collection tools across its six country programs. FTS’ grassroots partners, as elements both of their capacity development plan and subgrant reporting requirements, are provided with technical assistance (TA) to adapt and use the appropriate indicators allowing for aggregation and comparison across contexts. The TA is part of a larger effort to strengthen the capacity of the partners to undertake effective M&E. The six data collection tools are:
• Slavery Prevalence Survey that also measures key variables that affect the vulnerability of communities to slavery such as Socioeconomic Status and individual Knowledge, Attitudes, and Practices.
• Community Maturity Tool, which is a self-assessment used by community groups and partner organizations to measure the capacity of the community to sustainably resist slavery.
• Organizational Capacity Assessment Tool, which is used to measure partner organization capacity and create capacity-building action plans in regards to program quality, governance, human resources, finances, and communication.
• Survivor Registry, which is used to track freed slaves and their reintegration.
• Advocacy Milestone Tracker, which tracks progress towards desired policy changes.
• Quarterly partner reporting template, which tracks the implementation and outputs of activities.

1320 19th Street NW, Suite 600
Washington, DC 20036 USA
Phone: 202-775-7480
Email: [email protected]