Embed Size (px)
Citation preview

Community Health Access Program
Heather Bittner Fagan, MD
James M. Gill, MD MPHYu Ling, MA
Delaware Health Care Commission Meeting
July 20, 2005

Community Health Access Program(CHAP)
Matches low-income uninsured Delawareans with established health homes
Goal of program is to improve health by integrating services and improving access to existing resources

CHAP Evaluation 2004/2005
Health Care outcomes– Preventive care measures– Hospital Utilization
Role of CHAP in the Safety Net– Interaction with Screening for Life program
Geographical implications– Distribution of CHAP enrollees (demand)– Distribution of physicians (supply)
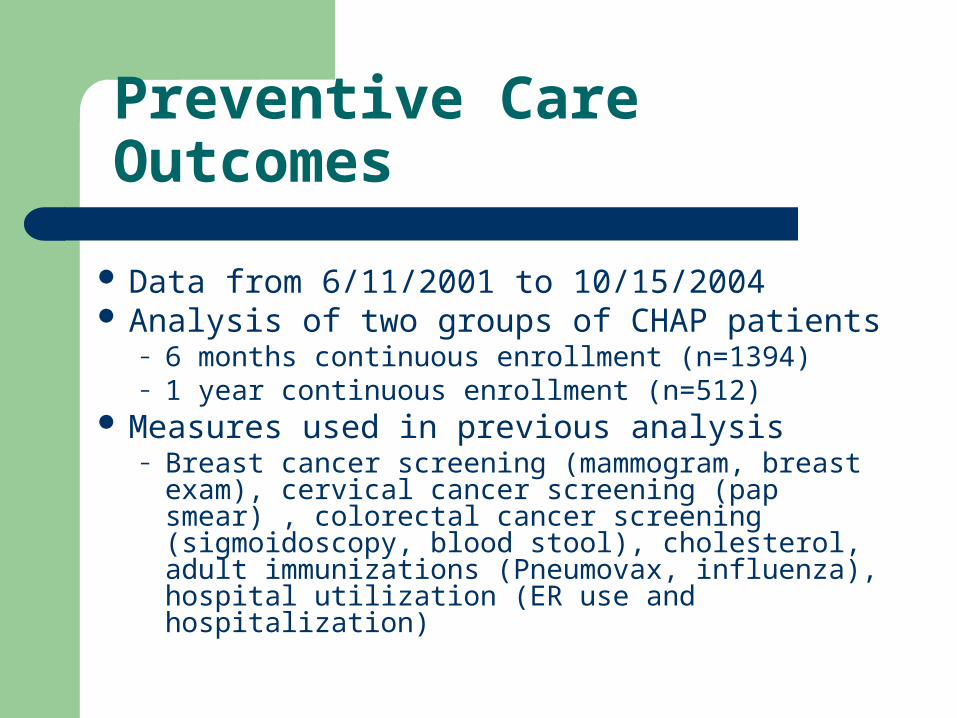
Preventive Care Outcomes
Data from 6/11/2001 to 10/15/2004 Analysis of two groups of CHAP patients
– 6 months continuous enrollment (n=1394)– 1 year continuous enrollment (n=512)
Measures used in previous analysis– Breast cancer screening (mammogram, breast
exam), cervical cancer screening (pap smear) , colorectal cancer screening (sigmoidoscopy, blood stool), cholesterol, adult immunizations (Pneumovax, influenza), hospital utilization (ER use and hospitalization)

Breast Cancer Screening
3888 61 68*
49 67* 52 61*
020406080
100
Breast Exam Mammograms
6month
1year
Baseline
Follow Up
* P < 0.05

Cervical Cancer Screening
7092*
6689*
020406080
100
Baseline Follow up
6month
1year
* P < 0.05

Colorectal Cancer Screening
2935
16 20
21 28*12 15
0
20
40
Colon/
sigm
oidosc
opy
Fecal
Occ
ult Blo
od
6month
1year
Baseline
Follow Up
* p<0.05
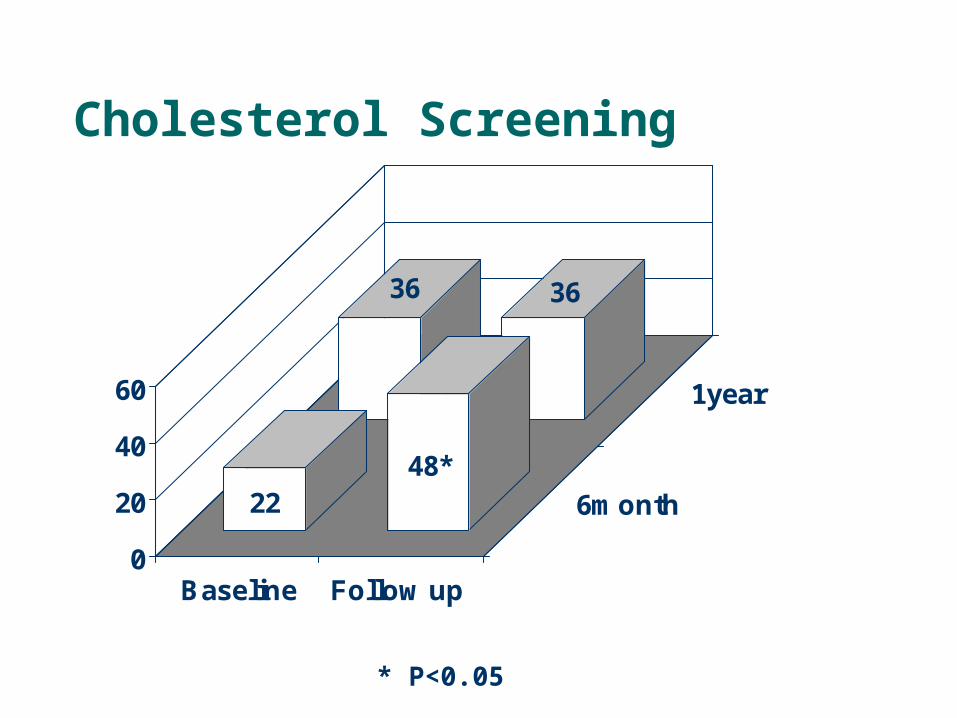
Cholesterol Screening
36 36
2248*
0
20
40
60
Baseline Follow up
6month
1year
* P<0.05

Adult Immunizations
0 0
33
44
814 13
21*
0
20
40
60
Peunomovax Influenza
6month
1year
Baseline
Follow Up
* P < 0.05

Hospitalization Utilization
16
9*8
11
159* 7 10
0
5
10
15
20
Per
cen
t
ER Use Hospitalization
6month
1year
Baseline
Follow Up
*P < 0.05
CHAP and SFL
Attempted to isolate the effects of CHAP and SFL to examine interaction of programs using index dates*
Looked at population as they entered CHAP (i.e. before “CHAP intervention”) to estimate the influence of SFL
Looked at change in rate in CHAP follow-up records before and after SFL index dates
* For women 1/1/02 and for men 10/1/03

Interaction of CHAP and SFL
2129
0
10
20
30
40
50
Perc
enta
ge
Before SFL After SFL
SFL alone 8% increase CHAP alone estimated 5-8% Combined effect 8%
3240
0
10
20
30
40
Per
cent
Baseline Follow-up
Understanding the geography of CHAP
Demand: where do CHAP enrollees come from
Supply: where are CHAP physicians and services located

Where do Chap enrollees come from?

Where are CHAP physicians located

Does the supply of CHAP physicians meet the demand of CHAP patients
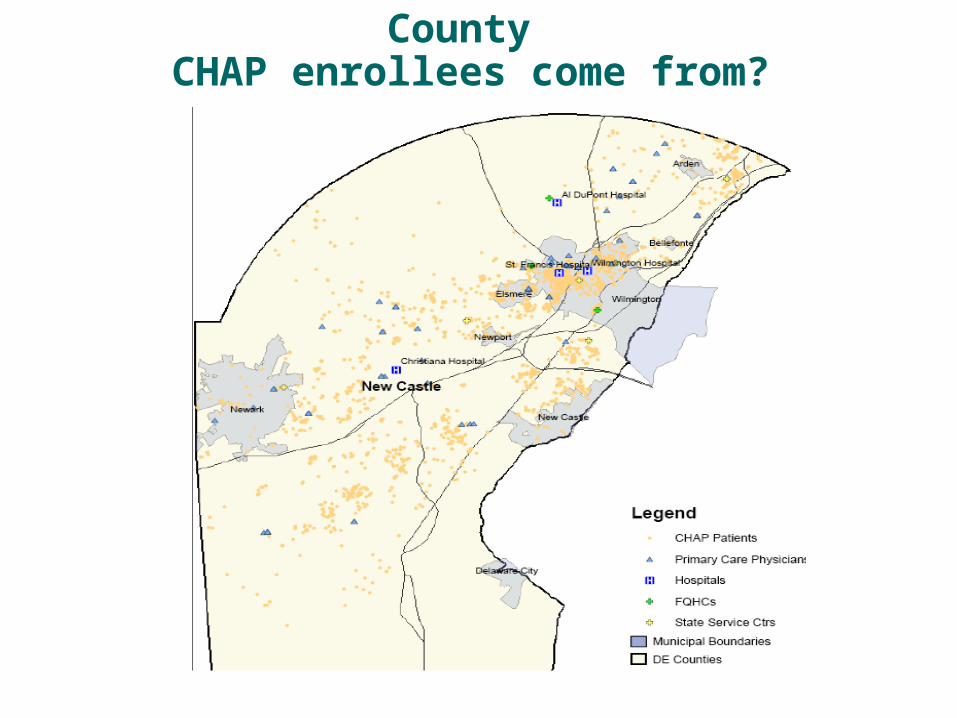
Where do Northern New Castle County CHAP enrollees come from?

Where do Southern New Castle County CHAP enrollees come from?

Where do Kent County CHAP enrollees come from?

Where do Sussex County CHAP enrollees come from?

Summary
CHAP improves health outcomes CHAP in conjunction with SFL leaves CRC
screening suboptimal The distribution of physicians in the CHAP
program mirrors the need of CHAP enrollees

Future Work
Move away from survey and preventive health outcomes
Move towards disease management Further understanding of CHAP synergy
through the state CRC screening program Estimate the magnitude of CHAP supply and
demand with geo mapping

New CHAP model
Disease management– Based on age of population: obesity, smoking,
HTN
Measuring the ability of program to help a vulnerable population navigate the health system– Health literacy