Embed Size (px)
Citation preview
2016 Greater Danbury Region Community Health Needs Assessment and Priorities
This document is a special chapter of the 2016 Fairfield County Community Wellbeing Index: Indicators of social progress, economic opportunity, and well-being in Fairfield County neighborhoods.
A core program of DataHaven, in partnership with Fairfield County’s Community Foundation and a Community Health Needs Assessment for the towns served by all Fairfield County hospitals, including Danbury Hospital and the New Milford Hospital campus.
ABOUT THIS REPORT | 2016 Greater Danbury Region CHNA
About This Report
This document is a special chapter of the 2016 Fairfield County Community Wellbeing Index, a comprehensive report about Fairfield County and the towns within it. The Community Wellbeing Index was produced by DataHaven in partnership with Fairfield County’s Community Foundation and other regional funding partners, including Danbury Hospital. The Community Wellbeing Index serves as a Community Health Needs Assessment for Fairfield County and the towns within it, including eight towns in the Greater Danbury area (Bethel, Brookfield, Danbury, New Fairfield, Newtown, Redding, Ridgefield, and Sherman). Topics covered in the Index include demographic change, housing, early childhood education, K-12 education, economic opportunity, leading public health indicators, and civic and community life.
This chapter provides additional local detail of rele-vance to the Greater Danbury Region, including data points on the towns that in some cases are reported in aggregate within the main Community Wellbe-ing Index, as well as data on towns in the Greater Danbury region not included in the Fairfield County Wellbeing Index, located in Litchfield and New Haven counties (New Milford, Bridgewater, Roxbury, South-bury, Woodbury and Washington). It also documents the process that Danbury Hospital used to conduct this regional community health needs assessment and involve additional community partners, including the Community Action Planning Steering Committee (CAPSC), a coalition of regional partners serving all the towns in the Greater Danbury region. The Great-er Danbury Community Health Needs Assessment was approved by the Western Connecticut Board of Directors on September 22, 2016.
You may find the full Fairfield County Wellbeing Index attached to this chapter, or posted on the DataHav-en (ctdatahaven.org), Fairfield County’s Community Foundation (fccfoundation.org), Danbury Hospital (danburyhospital.org) websites, as well as the West-ern Connecticut Health Network website (wchn.org).
Table of Contents
Executive Summary .................................................................................................................................................... 4Introduction .................................................................................................................................................................. 9
OVERVIEW ........................................................................................................................... 9Advisory Structure and Process ..............................................................................................9Purpose and Scope ...............................................................................................................9Communities Served ........................................................................................................... 10
METHODS ............................................................................................................................10Social Determinants Framework ........................................................................................... 10Data Collection Methods ...................................................................................................... 11
Quantitative Data ........................................................................................................... 11Qualitative Data.............................................................................................................. 11Analyses ........................................................................................................................ 12Limitations ..................................................................................................................... 12
FINDINGS ...........................................................................................................................12Demographics .................................................................................................................... 12
Population...................................................................................................................... 12Age Distribution .............................................................................................................. 12Race and Ethnic Diversity ................................................................................................. 13
Social and Physical Environment........................................................................................... 15Income and Employment ................................................................................................. 15Poverty.......................................................................................................................... 16Educational Attainment .................................................................................................... 18Housing ......................................................................................................................... 18Transportation ................................................................................................................ 20Crime and Violence ......................................................................................................... 20Environmental Quality ..................................................................................................... 21
Primary and Secondary Health Data ...................................................................................... 21Health Behaviors ............................................................................................................ 21Health Outcomes ............................................................................................................ 26Health Care Access ......................................................................................................... 32
Key Informant Surveys ....................................................................................................... 34Vision for the Future........................................................................................................ 35
Identifying Key Priorities ..................................................................................................... 36Key Themes and Conclusions ...................................................................................................................... 38
Next Steps ........................................................................................................................ 38Appendices ........................................................................................................................................................ 39
Appendix A: Community Action Planning Steering Committee (CAPSC) Members ................39Appendix B: Key Informant Survey Participant Organizations .............................................39Appendix C: Health Department Participants ......................................................................40
EXECUTIVE SUMMARY | 2016 Greater Danbury Region CHNA
4
Executive Summary
Introduction
Improving the health of a community is essential to enhancing residents’ quality of life in the region and supporting future social well-being. The Greater Dan-bury region collaborative of Danbury Hospital and the Community Action Planning Steering Committee (CAPSC) is leading a community health planning process to improve residents’ health in the Greater Danbury region.
In addition to Danbury and New Milford Health De-partments and the Pomperaug Health District, which are members of CAPSC, the health departments of Brookfield, Bethel, Ridgefield, New Fairfield, and Newtown Health District also participated in the process.
This effort includes two phases:
(1) Community Health Needs Assessment (CHNA)
that identifies community strengths and health needs and priorities in the Greater Danbury Region.
(2) Community Health Improvement Plan (CHIP) that conveys priorities identified through the health assessment and determines goals and strategies for implementation to improve health and create a healthy community throughout the Greater Danbury Region.
This report provides an overview of key findings from the community health needs assessment and key elements that will be used to develop the community health improvement plan.
PART I: Community Health Needs Assessment
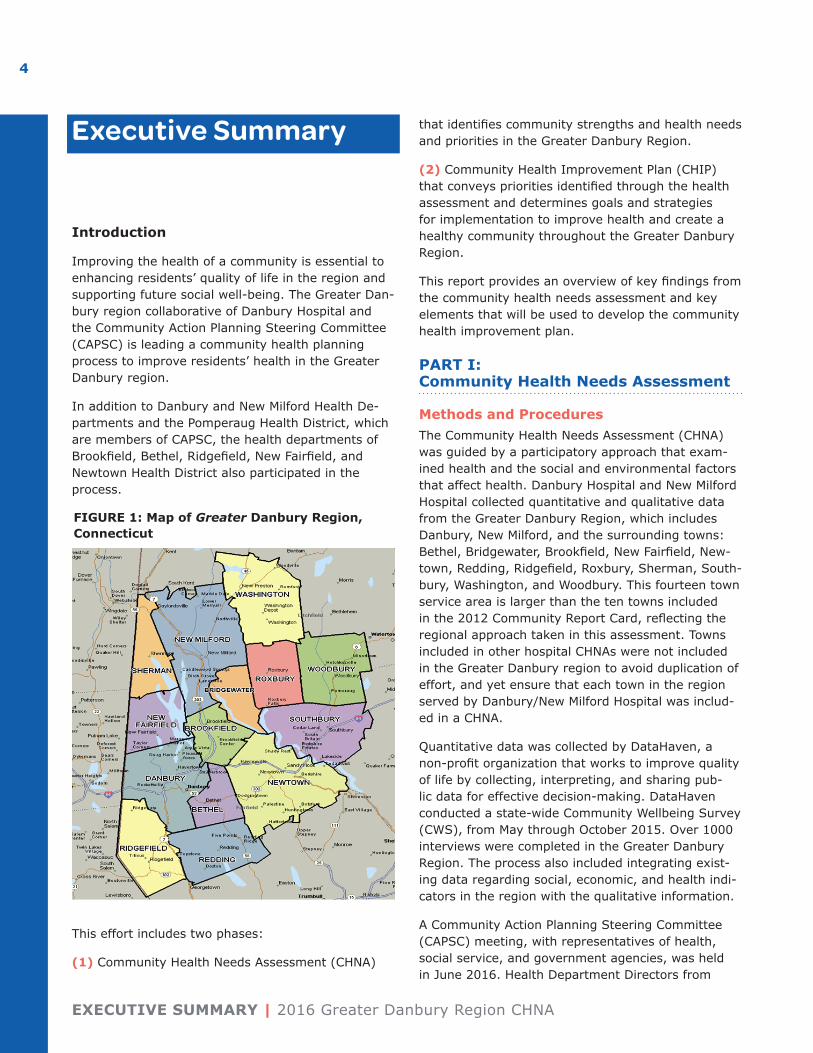
Methods and ProceduresThe Community Health Needs Assessment (CHNA) was guided by a participatory approach that exam-ined health and the social and environmental factors that affect health. Danbury Hospital and New Milford Hospital collected quantitative and qualitative data from the Greater Danbury Region, which includes Danbury, New Milford, and the surrounding towns: Bethel, Bridgewater, Brookfield, New Fairfield, New-town, Redding, Ridgefield, Roxbury, Sherman, South-bury, Washington, and Woodbury. This fourteen town service area is larger than the ten towns included in the 2012 Community Report Card, reflecting the regional approach taken in this assessment. Towns included in other hospital CHNAs were not included in the Greater Danbury region to avoid duplication of effort, and yet ensure that each town in the region served by Danbury/New Milford Hospital was includ-ed in a CHNA.
Quantitative data was collected by DataHaven, a non-profit organization that works to improve quality of life by collecting, interpreting, and sharing pub-lic data for effective decision-making. DataHaven conducted a state-wide Community Wellbeing Survey (CWS), from May through October 2015. Over 1000 interviews were completed in the Greater Danbury Region. The process also included integrating exist-ing data regarding social, economic, and health indi-cators in the region with the qualitative information.
A Community Action Planning Steering Committee (CAPSC) meeting, with representatives of health, social service, and government agencies, was held in June 2016. Health Department Directors from
FIGURE 1: Map of Greater Danbury Region, Connecticut
2016 Greater Danbury Region CHNA | EXECUTIVE SUMMARY
5
the Greater Danbury region were also invited to this meeting. These community members agreed to as-sist in conducting the Community Health Needs As-sessment. An online key informant survey (KIS) was developed and distributed to 200 community leaders in the Greater Danbury Region; including elected of-ficials, social service organizations, schools, libraries, housing, police, and community health agencies. A 21% participation rate was achieved. A second meet-ing was held in August 2016 and preliminary findings were shared with this group. The group then com-pleted a voting exercise to rank findings and partici-pated in a facilitated discussion to determine health priorities, and identify resources needed for the Community Health Improvement Planning process.
Key FindingsDemographic and Social Determinants
• Overall Population: In 2015, the total popula-tion of the Greater Danbury Region was 264,621, an increase of 1.6% since 2010 and an annual growth rate of only 0.3%. The towns within the region vary in size, growth patterns, wealth, age and diversity of residents. Danbury is the most populous town in the area, comprising 31.8% of the region’s population.
• Age Distribution: The age distribution for the region is similar to that of Connecticut. Across the region, there is variation in the age distribution and growth rates for each group. Danbury has the youngest population, with over 60% below the age of 44. Although the younger age groups comprise about half of the population, they show declining growth rates in all towns. Danbury is the exception, showing a little growth in the 20-44 age group. The most significant growth rates are seen in the 65+ age group in every town in the region.
• Racial and Ethnic Diversity: Danbury is the most diverse town with 52% identifying as minori-ty (CERC, 2016), and the largest minority group identifying as Hispanic (23%). In the Greater Dan-bury region, 71% identify as white, with smaller populations of Hispanic (13%) and black (3%), while in New Milford 84% identifies as white.
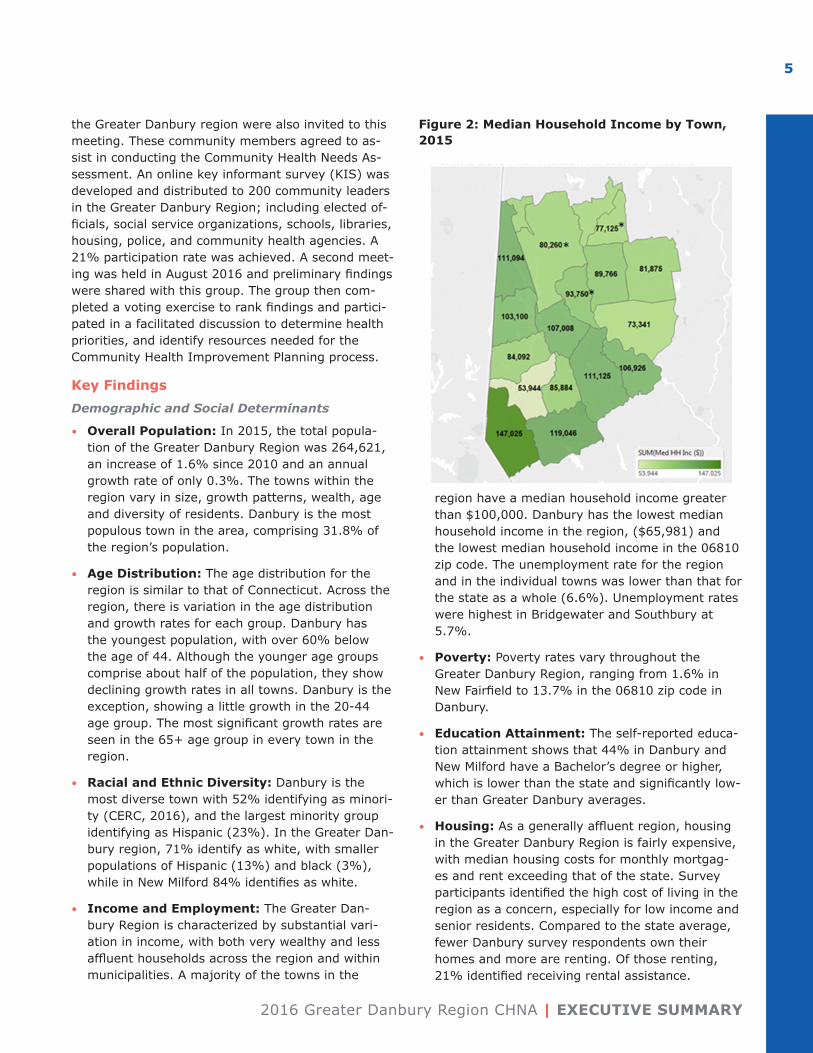
• Income and Employment: The Greater Dan-bury Region is characterized by substantial vari-ation in income, with both very wealthy and less affluent households across the region and within municipalities. A majority of the towns in the
region have a median household income greater than $100,000. Danbury has the lowest median household income in the region, ($65,981) and the lowest median household income in the 06810 zip code. The unemployment rate for the region and in the individual towns was lower than that for the state as a whole (6.6%). Unemployment rates were highest in Bridgewater and Southbury at 5.7%.
• Poverty: Poverty rates vary throughout the Greater Danbury Region, ranging from 1.6% in New Fairfield to 13.7% in the 06810 zip code in Danbury.
• Education Attainment: The self-reported educa-tion attainment shows that 44% in Danbury and New Milford have a Bachelor’s degree or higher, which is lower than the state and significantly low-er than Greater Danbury averages.
• Housing: As a generally affluent region, housing in the Greater Danbury Region is fairly expensive, with median housing costs for monthly mortgag-es and rent exceeding that of the state. Survey participants identified the high cost of living in the region as a concern, especially for low income and senior residents. Compared to the state average, fewer Danbury survey respondents own their homes and more are renting. Of those renting, 21% identified receiving rental assistance.
Figure 2: Median Household Income by Town, 2015
EXECUTIVE SUMMARY | 2016 Greater Danbury Region CHNA
6
• Environmental Quality: A majority of the pop-ulation reported they are satisfied with the city they live in. Survey participants described safe environment, quality food, and active life styles as driving forces behind what makes this community an attractive destination to work and live. While 51% of KIS respondents reported their area as a place to live is getting better or much better, CWS data shows respondents think it is about the same or worse.
• Transportation: Transportation was described as a necessity for nutrition, medical, and social pur-poses. However, it is a concern for many parts of the region, especially for seniors, youth, and low income individuals.
• Crime and Violence: A majority of residents reported they feel safe in their neighborhoods. Connecticut state data shows violent crime of-fenses 40% lower than the national average and property crime 25% lower than national average. Ridgefield, Redding and Newtown are ranked in the top ten safest cities in Connecticut (of cities with a population greater than 19,000). Survey respondents are more concerned about the rising drug utilization/abuse rates in the region.
Health Behaviors
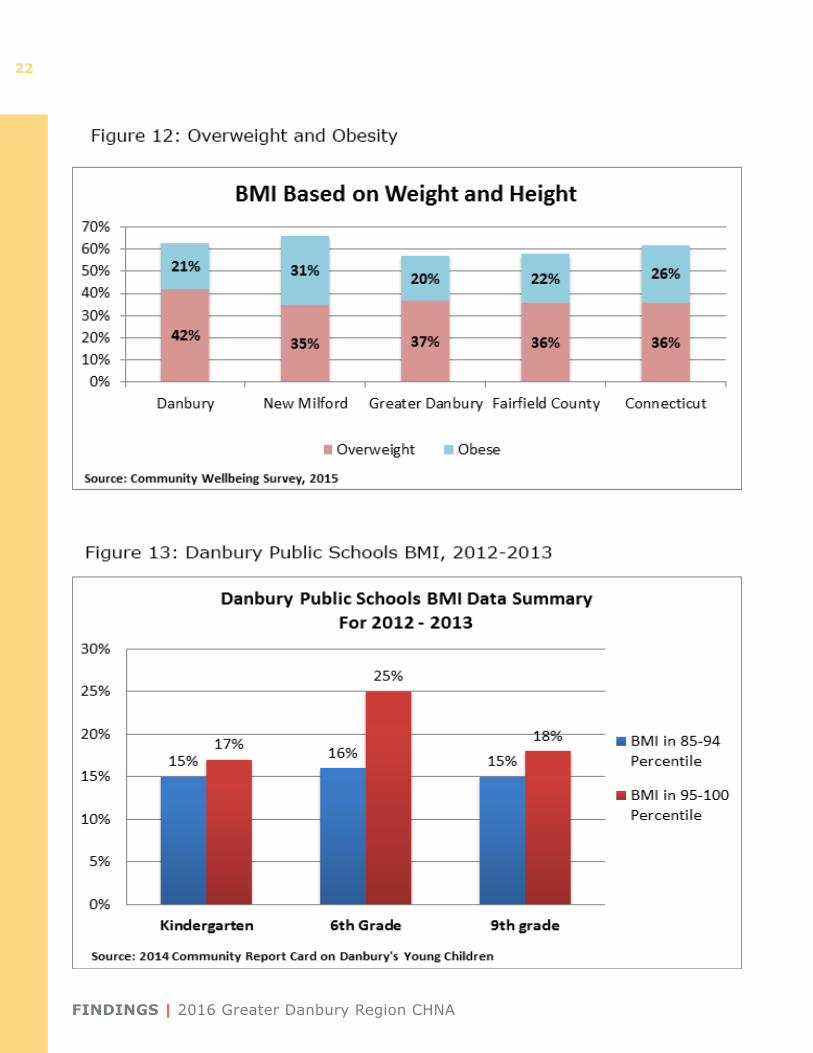
• Healthy Eating, Physical Activity, and Over-weight/Obesity: Issues around overweight and obesity – particularly healthy eating and physical activity – emerged as key health concerns for interview participants. The reported prevalence of adult obesity in Greater Danbury (20%) and Danbury (21%) was lower than that of the state (26%); however, New Milford (31%) was higher than the region. Overweight was higher in Dan-bury (42%) than in New Milford (35%), Greater Danbury (37%) or the state (36%). Survey partic-ipants reported access to quality, healthy food was a concern for low-income families and children. In addition, participation in out of school activities is difficult for many low income families.
• Mental Health and Substance Abuse: Partic-ipants described mental health and substance abuse as key health concerns for the region. Interview participants identified lack of resourc-es and services as challenges. There is special consideration for seniors suffering from physical or cognitively debilitating diseases. Opioid use was cited as a rising concern.
• Smoking: Reported prevalence in Greater Dan-bury (11%) is lower than the state (15%). Dan-bury is also lower than the state at 12%, but New Milford survey respondents reported 17% preva-lence.
Health Outcomes
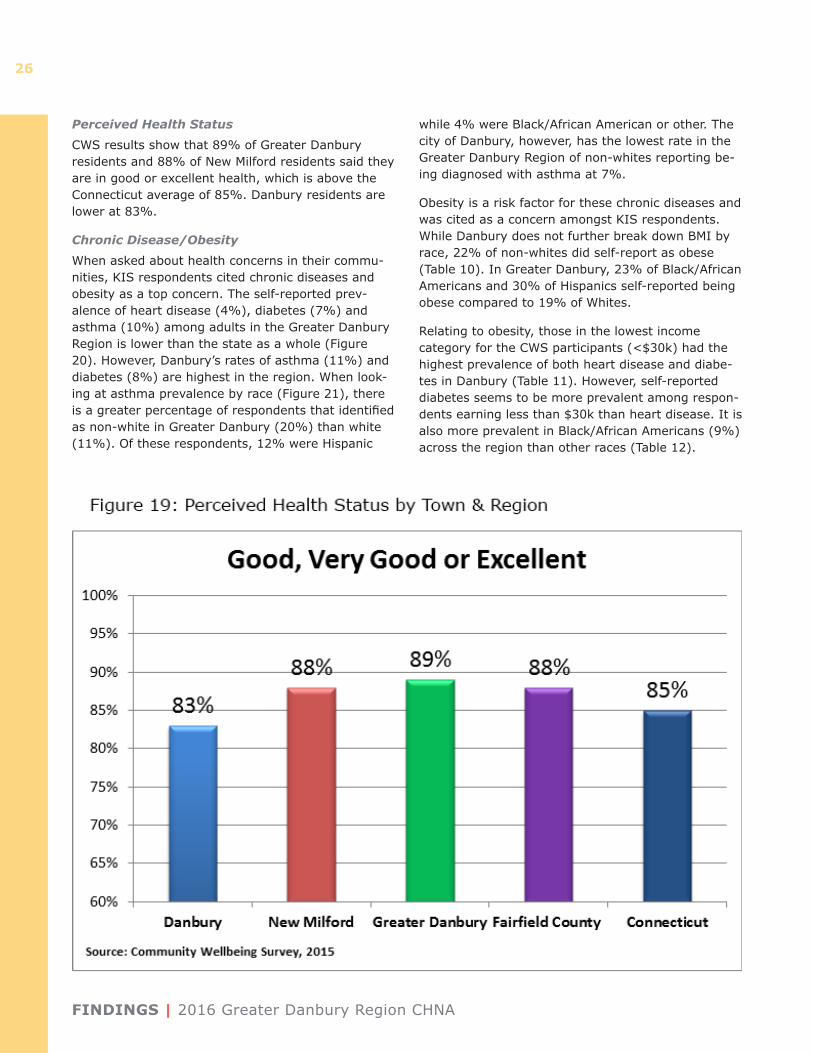
• Perceived Health Status: CWS results show that Greater Danbury residents (89%) said they are in good or excellent health, which is above the Con-necticut average of 85%. Danbury residents are lower at 83%.
• Overall Leading Causes of Death Hospitaliza-tion: Quantitative data indicate that the top two causes of mortality in the Greater Danbury Region are diseases of the heart and cancer. Type II dia-betes and depression were the top two conditions for inpatient hospitalizations, while alcohol/sub-stance abuse and falls were the top two conditions for emergency department non-admissions.
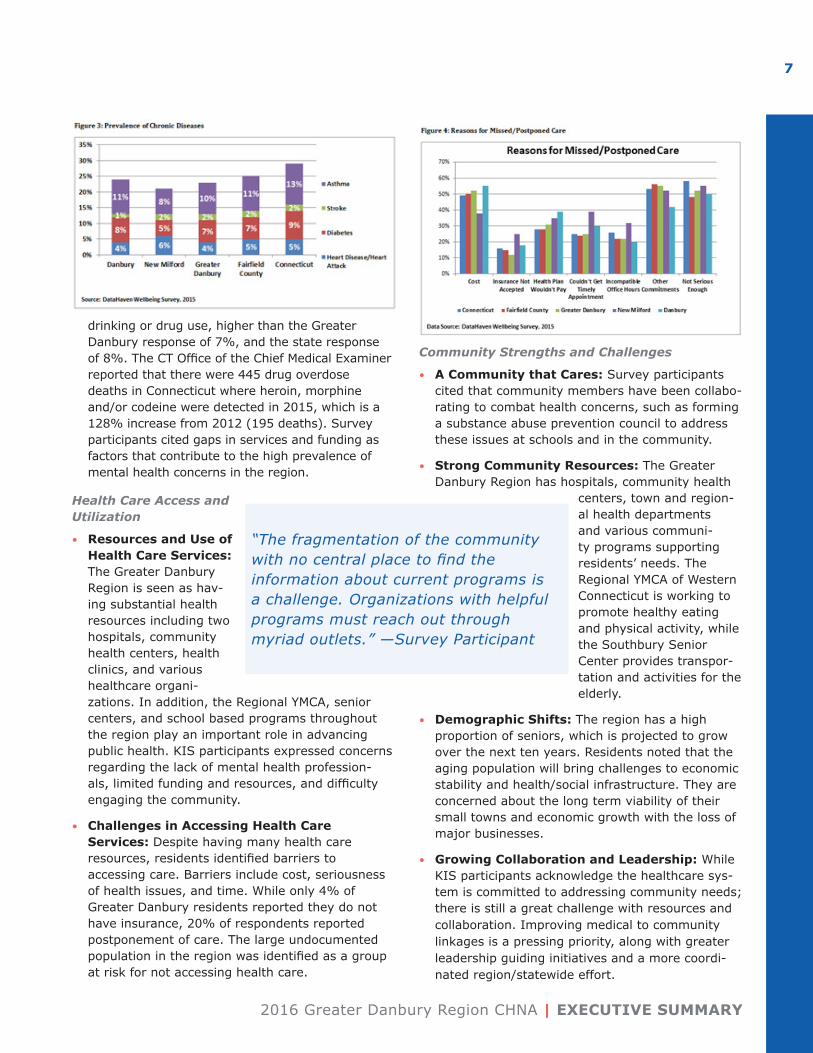
• Chronic Disease/Obesity: When asked about health concerns in their communities, KIS partic-ipants cited chronic diseases and obesity as a top concern. The self-reported prevalence of heart disease (4%), diabetes (7%) and asthma (10%) among adults in the Greater Danbury Region is lower than the state as a whole. Obesity is a risk factor for these chronic diseases.
• Mental Health and Substance Abuse: Survey participants also reported mental health and substance abuse as major health concerns. 27% of Greater Danbury CWS respondents reported feeling somewhat/completely anxious, while 26% reported feeling depressed or hopeless sometimes/often in the previous month. Nine percent of Danbury respondents indicated the need to cut down on
“We lack a focus on prevention. The built environment of most towns is not supportive of exercise as a part of daily living.” —Survey Participant
“For the general population, mental health issues are widely NOT addressed. The increase in drug and alcohol use and dependency is devastating.” —Survey Participant
2016 Greater Danbury Region CHNA | EXECUTIVE SUMMARY
7
drinking or drug use, higher than the Greater Danbury response of 7%, and the state response of 8%. The CT Office of the Chief Medical Examiner reported that there were 445 drug overdose deaths in Connecticut where heroin, morphine and/or codeine were detected in 2015, which is a 128% increase from 2012 (195 deaths). Survey participants cited gaps in services and funding as factors that contribute to the high prevalence of mental health concerns in the region.
Health Care Access and Utilization
• Resources and Use of Health Care Services: The Greater Danbury Region is seen as hav-ing substantial health resources including two hospitals, community health centers, health clinics, and various healthcare organi-zations. In addition, the Regional YMCA, senior centers, and school based programs throughout the region play an important role in advancing public health. KIS participants expressed concerns regarding the lack of mental health profession-als, limited funding and resources, and difficulty engaging the community.
• Challenges in Accessing Health Care Services: Despite having many health care resources, residents identified barriers to accessing care. Barriers include cost, seriousness of health issues, and time. While only 4% of Greater Danbury residents reported they do not have insurance, 20% of respondents reported postponement of care. The large undocumented population in the region was identified as a group at risk for not accessing health care.
Community Strengths and Challenges
• A Community that Cares: Survey participants cited that community members have been collabo-rating to combat health concerns, such as forming a substance abuse prevention council to address these issues at schools and in the community.
• Strong Community Resources: The Greater Danbury Region has hospitals, community health
centers, town and region-al health departments and various communi-ty programs supporting residents’ needs. The Regional YMCA of Western Connecticut is working to promote healthy eating and physical activity, while the Southbury Senior Center provides transpor-tation and activities for the elderly.
• Demographic Shifts: The region has a high proportion of seniors, which is projected to grow over the next ten years. Residents noted that the aging population will bring challenges to economic stability and health/social infrastructure. They are concerned about the long term viability of their small towns and economic growth with the loss of major businesses.
• Growing Collaboration and Leadership: While KIS participants acknowledge the healthcare sys-tem is committed to addressing community needs; there is still a great challenge with resources and collaboration. Improving medical to community linkages is a pressing priority, along with greater leadership guiding initiatives and a more coordi-nated region/statewide effort.
“The fragmentation of the community with no central place to find the information about current programs is a challenge. Organizations with helpful programs must reach out through myriad outlets.” —Survey Participant
EXECUTIVE SUMMARY | 2016 Greater Danbury Region CHNA
8
Vision for the Future
• Priority Areas: Respondents identified areas of improvement for mental health and substance abuse services, chronic disease/obesity preven-tion, increasing access to care, and promoting healthy aging.
• Enhanced Mental Health and Substance Abuse Services: Needed resources include pro-viders, support groups, and housing for the home-less. Outreach is also needed, especially for lower income residents and students.
• Centralized Resource Information: A central repository of information on available services in the area was cited as an important tool that resi-dents and professionals need to access care.
• Focus on Prevention and Intervention: Par-ticipants described an emphasis on prevention and intervention initiatives to overcome chronic diseases, mental health, and substance abuse.
Identifying Key PrioritiesMembers of the CAPSC and Health Department(s) met on August 2, 2016 to review the preliminary re-sults of the CHNA and identify priorities for the CHIP. After assessing and discussing the data presented in the CHNA, participants used a quality improvement multi-voting process to identify the most import-ant public health issues for Greater Danbury from a list of major themes identified from the CHNA and several other health concerns identified during the discussion. The following four health priority areas were identified:
1. Mental Health and Substance Abuse
2. Chronic Disease Prevention
3. Access to Care/Information/Resources
4. Healthy Aging
The group then participated in a facilitated discussion to identify strategies to address these priorities, re-sources already in place, gaps in services or resourc-es, and additional resources that should be included to develop the community health improvement plan.
Key Themes and Conclusions • The aging population in the region is a ma-
jor concern, with special concern on seniors’ needs. The increasing growth rate of seniors in the region is expected to put great demands on the health and social service infrastructure. Given
the increasing age of the population in the region and the statistics that support falls as a leading cause of ED visits, an emphasis on fall prevention is included in the priorities for action.
• Mental health and substance abuse is a top concern for which current services are not meeting community needs. Survey respondents and community forum participants identified a scarcity of mental health services as well as the stigma around seeking mental health services as barriers to accessing care. Residents cited the need for a unified, regional response to health issues, especially regarding the growing opioid addiction crisis.
• As chronic disease and obesity rates rise, residents saw the great need for increased efforts focusing on prevention. Healthy eating and active lifestyles are essential to improving the health of the region. Risk factors leading to chronic disease can be mediated by improving community awareness through engagement and education on the seriousness of this issue, and the importance of seeking prevention services and medical care early instead of postponing it. Oral health services were also identified as a need in both the chronic disease and access to care priori-ties.
• There is an awareness and identified need for greater collaboration in the community. Residents understand that the health care com-munity has been working to address health needs. However, more effort is needed from all sectors of the community to improve health behaviors and outcomes. More outreach is needed to increase community awareness of services, and to improve access to them.
Next StepsThe components included in this report will serve as the foundation for developing the strategic frame-work for a data-driven, community-enhanced Com-munity Health Improvement Plan (CHIP). Members of the CAPSC will develop the CHIP, timeline, and sustainability plan. They will revise and refine the suggested activities and timelines drafted by work-group members to complete the action plans for the CHIP. Additionally, partners and resources will be aligned to ensure successful CHIP implementation and coordination of activities and resources among key community partners in the Greater Danbury Region.
2016 Greater Danbury Region CHNA | INTRODUCTION
9
Introduction
Overview
Understanding that health is affected by where we live, work, and play, in 2015, Danbury and the Com-munity Action Planning Steering Committee (CAPSC) began the process of updating the tri-annual Com-munity Health Needs Assessment and Improvement Plan, in order to appropriately meet the health needs of the community. Together they invited additional town and district Health Departments and over 200 community members from various professions to participate in the process. The health departments of Brookfield, Bethel, Ridgefield, New Fairfield, and the Newtown Health District joined Danbury Hospital and the CAPSC to work in collaboration with Norwalk Hospital, Greenwich Hospital, Stamford Hospital, Bridgeport Hospital, St. Vincent’s Medical Center, the Fairfield County Foundation, and DataHaven, a non-profit organization that works to improve quality of life by collecting, interpreting, and sharing public data for effective decision-making.
This assessment fulfills the Internal Revenue Ser-vice (IRS) requirement in the Patient Protection and Affordable Care Act (PPACA), that mandates all non-profit hospitals to conduct a community health needs assessment (CHNA) and strategic planning process every three years. Furthermore, hospitals are required to engage local public health officials and other health and social service providers, and local residents when developing the CHNA. Hospitals are also required to develop a community health im-provement plan (CHIP) to address the areas of con-cern identified. The plan will outline both the manner in which the Hospital engaged such officials and residents, as well as the manner in which the Hospi-tal will collaborate with local partners to address the health needs of the Greater Danbury Region.
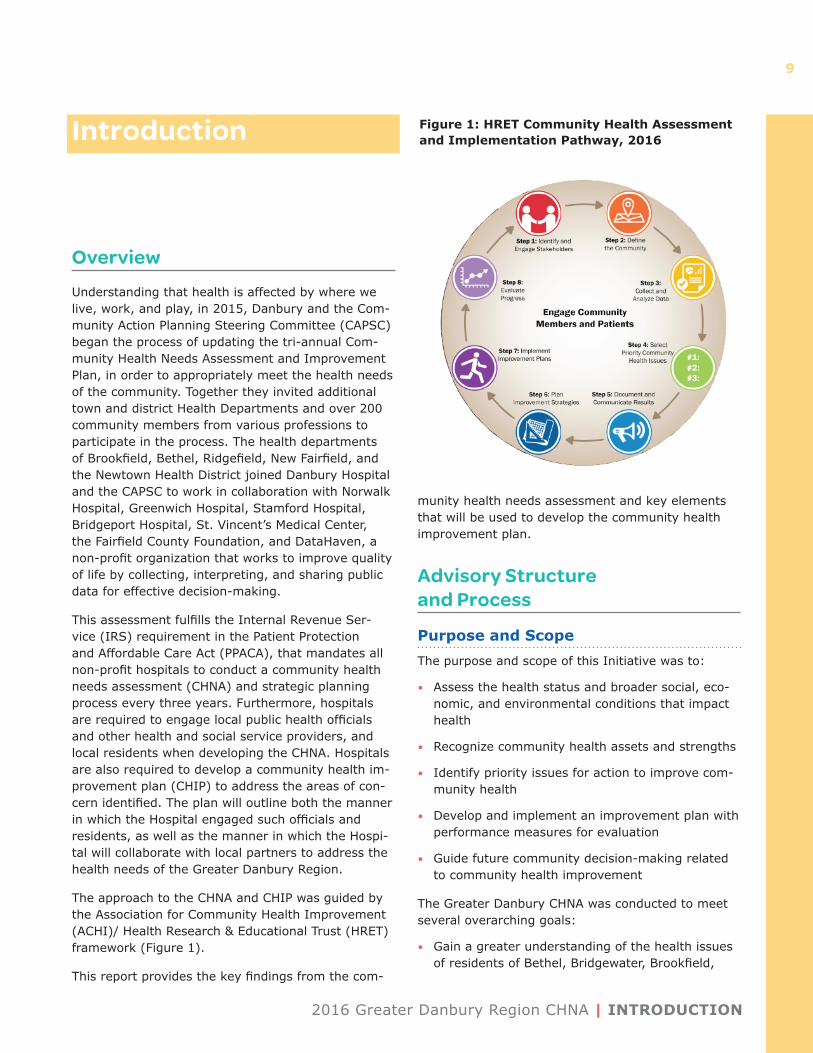
The approach to the CHNA and CHIP was guided by the Association for Community Health Improvement (ACHI)/ Health Research & Educational Trust (HRET) framework (Figure 1).
This report provides the key findings from the com-
munity health needs assessment and key elements that will be used to develop the community health improvement plan.
Advisory Structure and Process
Purpose and ScopeThe purpose and scope of this Initiative was to:
• Assess the health status and broader social, eco-nomic, and environmental conditions that impact health
• Recognize community health assets and strengths
• Identify priority issues for action to improve com-munity health
• Develop and implement an improvement plan with performance measures for evaluation
• Guide future community decision-making related to community health improvement
The Greater Danbury CHNA was conducted to meet several overarching goals:
• Gain a greater understanding of the health issues of residents of Bethel, Bridgewater, Brookfield,
Figure 1: HRET Community Health Assessment and Implementation Pathway, 2016
INTRODUCTION | 2016 Greater Danbury Region CHNA
10
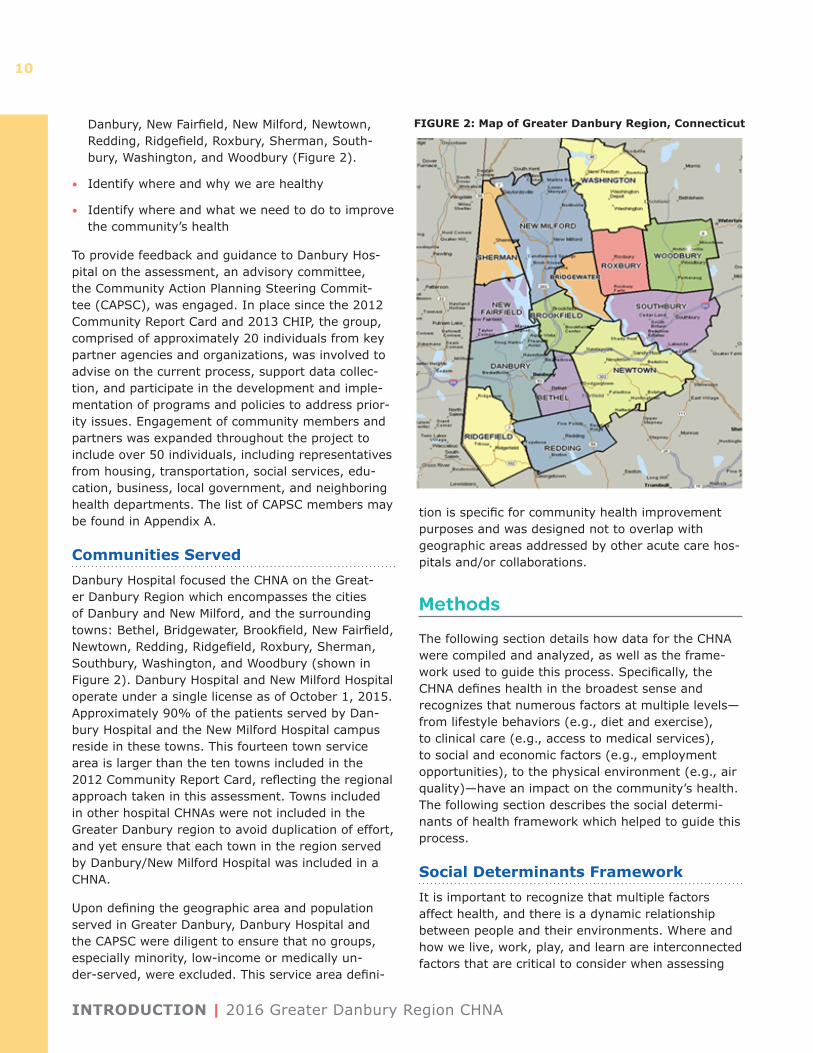
Danbury, New Fairfield, New Milford, Newtown, Redding, Ridgefield, Roxbury, Sherman, South-bury, Washington, and Woodbury (Figure 2).
• Identify where and why we are healthy
• Identify where and what we need to do to improve the community’s health
To provide feedback and guidance to Danbury Hos-pital on the assessment, an advisory committee, the Community Action Planning Steering Commit-tee (CAPSC), was engaged. In place since the 2012 Community Report Card and 2013 CHIP, the group, comprised of approximately 20 individuals from key partner agencies and organizations, was involved to advise on the current process, support data collec-tion, and participate in the development and imple-mentation of programs and policies to address prior-ity issues. Engagement of community members and partners was expanded throughout the project to include over 50 individuals, including representatives from housing, transportation, social services, edu-cation, business, local government, and neighboring health departments. The list of CAPSC members may be found in Appendix A.
Communities ServedDanbury Hospital focused the CHNA on the Great-er Danbury Region which encompasses the cities of Danbury and New Milford, and the surrounding towns: Bethel, Bridgewater, Brookfield, New Fairfield, Newtown, Redding, Ridgefield, Roxbury, Sherman, Southbury, Washington, and Woodbury (shown in Figure 2). Danbury Hospital and New Milford Hospital operate under a single license as of October 1, 2015. Approximately 90% of the patients served by Dan-bury Hospital and the New Milford Hospital campus reside in these towns. This fourteen town service area is larger than the ten towns included in the 2012 Community Report Card, reflecting the regional approach taken in this assessment. Towns included in other hospital CHNAs were not included in the Greater Danbury region to avoid duplication of effort, and yet ensure that each town in the region served by Danbury/New Milford Hospital was included in a CHNA.
Upon defining the geographic area and population served in Greater Danbury, Danbury Hospital and the CAPSC were diligent to ensure that no groups, especially minority, low-income or medically un-der-served, were excluded. This service area defini-
tion is specific for community health improvement purposes and was designed not to overlap with geographic areas addressed by other acute care hos-pitals and/or collaborations.
Methods
The following section details how data for the CHNA were compiled and analyzed, as well as the frame-work used to guide this process. Specifically, the CHNA defines health in the broadest sense and recognizes that numerous factors at multiple levels— from lifestyle behaviors (e.g., diet and exercise), to clinical care (e.g., access to medical services), to social and economic factors (e.g., employment opportunities), to the physical environment (e.g., air quality)—have an impact on the community’s health. The following section describes the social determi-nants of health framework which helped to guide this process.
Social Determinants FrameworkIt is important to recognize that multiple factors affect health, and there is a dynamic relationship between people and their environments. Where and how we live, work, play, and learn are interconnected factors that are critical to consider when assessing
FIGURE 2: Map of Greater Danbury Region, Connecticut
2016 Greater Danbury Region CHNA | INTRODUCTION
11
a community’s health. That is, not only do people’s genes and lifestyle behaviors affect their health, but health is also influenced by factors such as employ-ment status and quality of housing. The social deter-minants of health framework addresses the distribu-tion of wellness and illness among a population—its patterns, origins, and implications. While the data to which we have access is often a snapshot of a population in time, the people represented by that data have lived their lives in ways that are enabled and constrained by economic circumstances, social context, and government policies. Building on this framework, this assessment utilizes data to discuss which populations are healthiest and least healthy in the community as well as to examine the larger social and economic factors associated with good and poor health.
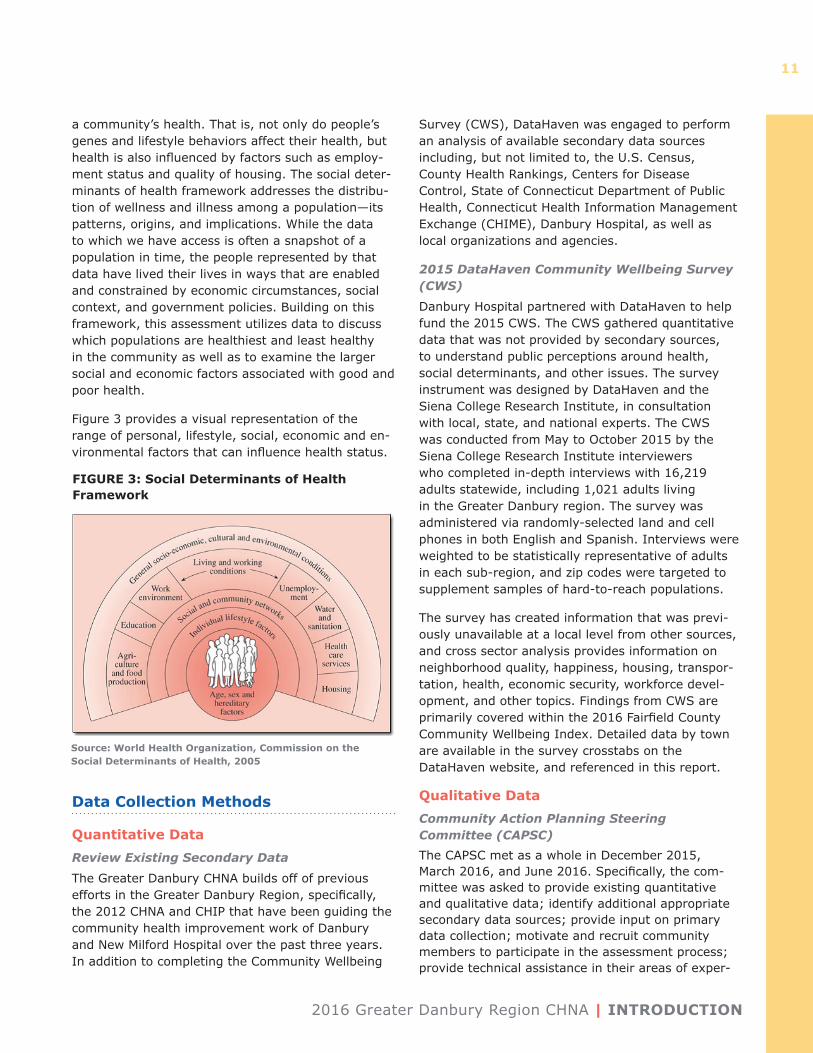
Figure 3 provides a visual representation of the range of personal, lifestyle, social, economic and en-vironmental factors that can influence health status.
Data Collection Methods
Quantitative DataReview Existing Secondary Data
The Greater Danbury CHNA builds off of previous efforts in the Greater Danbury Region, specifically, the 2012 CHNA and CHIP that have been guiding the community health improvement work of Danbury and New Milford Hospital over the past three years. In addition to completing the Community Wellbeing
Survey (CWS), DataHaven was engaged to perform an analysis of available secondary data sources including, but not limited to, the U.S. Census, County Health Rankings, Centers for Disease Control, State of Connecticut Department of Public Health, Connecticut Health Information Management Exchange (CHIME), Danbury Hospital, as well as local organizations and agencies.
2015 DataHaven Community Wellbeing Survey (CWS)
Danbury Hospital partnered with DataHaven to help fund the 2015 CWS. The CWS gathered quantitative data that was not provided by secondary sources, to understand public perceptions around health, social determinants, and other issues. The survey instrument was designed by DataHaven and the Siena College Research Institute, in consultation with local, state, and national experts. The CWS was conducted from May to October 2015 by the Siena College Research Institute interviewers who completed in-depth interviews with 16,219 adults statewide, including 1,021 adults living in the Greater Danbury region. The survey was administered via randomly-selected land and cell phones in both English and Spanish. Interviews were weighted to be statistically representative of adults in each sub-region, and zip codes were targeted to supplement samples of hard-to-reach populations.
The survey has created information that was previ-ously unavailable at a local level from other sources, and cross sector analysis provides information on neighborhood quality, happiness, housing, transpor-tation, health, economic security, workforce devel-opment, and other topics. Findings from CWS are primarily covered within the 2016 Fairfield County Community Wellbeing Index. Detailed data by town are available in the survey crosstabs on the DataHaven website, and referenced in this report.
Qualitative Data Community Action Planning Steering Committee (CAPSC) The CAPSC met as a whole in December 2015, March 2016, and June 2016. Specifically, the com-mittee was asked to provide existing quantitative and qualitative data; identify additional appropriate secondary data sources; provide input on primary data collection; motivate and recruit community members to participate in the assessment process; provide technical assistance in their areas of exper-
FIGURE 3: Social Determinants of Health Framework
Source: World Health Organization, Commission on the Social Determinants of Health, 2005
FINDINGS | 2016 Greater Danbury Region CHNA
12
tise; identify priority issues for health improvement; and to develop and implement programs and policies to address priority issues.
The United Way of Western Connecticut shared the ALICE (Asset Limited, Income Constrained, Em-ployed) Community Conversations and Survey 2015 Summary report, the Regional YMCA of Western Con-necticut provided their 2016 Online CHNA Summary report, and the Pomperaug Health District provided their Community Survey results. Information from these sources was reviewed and incorporated into the community health needs assessment.
Throughout the process, information was provided to all CAPSC members through email allowing partici-pants to be informed on the progress of the project and the opportunities to share their expertise.
Key Informant Surveys (KIS)
The online KIS was administered to community leaders and service providers in the Greater Danbury Region using an online survey tool. The survey was distributed to over 200 key informants and had 42 responses in total (a 21% response rate). Respon-dents included health care professionals, community leaders and members, and government officials. The survey was designed to better understand the health needs of the Greater Danbury region and included questions on community health initiatives, strengths and challenges, health concerns and limitations, and vulnerable populations. Please refer to Appendix B for organizations responding to the KIS.
AnalysesThe secondary data and qualitative data from the CWS and KIS were synthesized and integrated in this report. Key themes that emerged across all groups were identified, as well as unique issues that were noted for specific populations. While community differences are noted where appropriate, analyses emphasized findings common across the Greater Danbury Area. Selected paraphrased quotes – with-out personal identifying information – are presented in the narrative of this report to further illustrate points within topic areas. The information from these sources was used to identify priorities and opportuni-ties for action.
LimitationsAs with all research efforts, there are several limita-tions related to the CHNA’s research methods that should be acknowledged. Self-reported data may
include over or underreported behaviors and illness-es based on misunderstanding of the question being asked or fear of social stigma. Respondents may also be prone to recall bias, attempting to answer accu-rately but remember incorrectly. It should be noted that for the secondary data analyses, several sources did not provide current data stratified by race/ethnic-ity, gender, or age — thus, these data could only be analyzed for the total population.
While the community meetings and KIS conducted for the CHNA provide valuable insights, results are not statistically representative of a larger population due to non-random recruiting techniques and a small sample size. It is also important to note that data were collected at one point in time, so findings, while directional and descriptive, should not be interpreted as definitive.
Findings
DemographicsNumerous factors are associated with the health of a community, including the resources and services that are available as well as who lives in the community. While individual characteristics such as age, gen-der, race, and ethnicity have an impact on people’s health, the distribution of these characteristics across a community is also critically important and can affect the number and type of services and resources needed and available. The section below provides an overview of the population of the Greater Danbury Region.
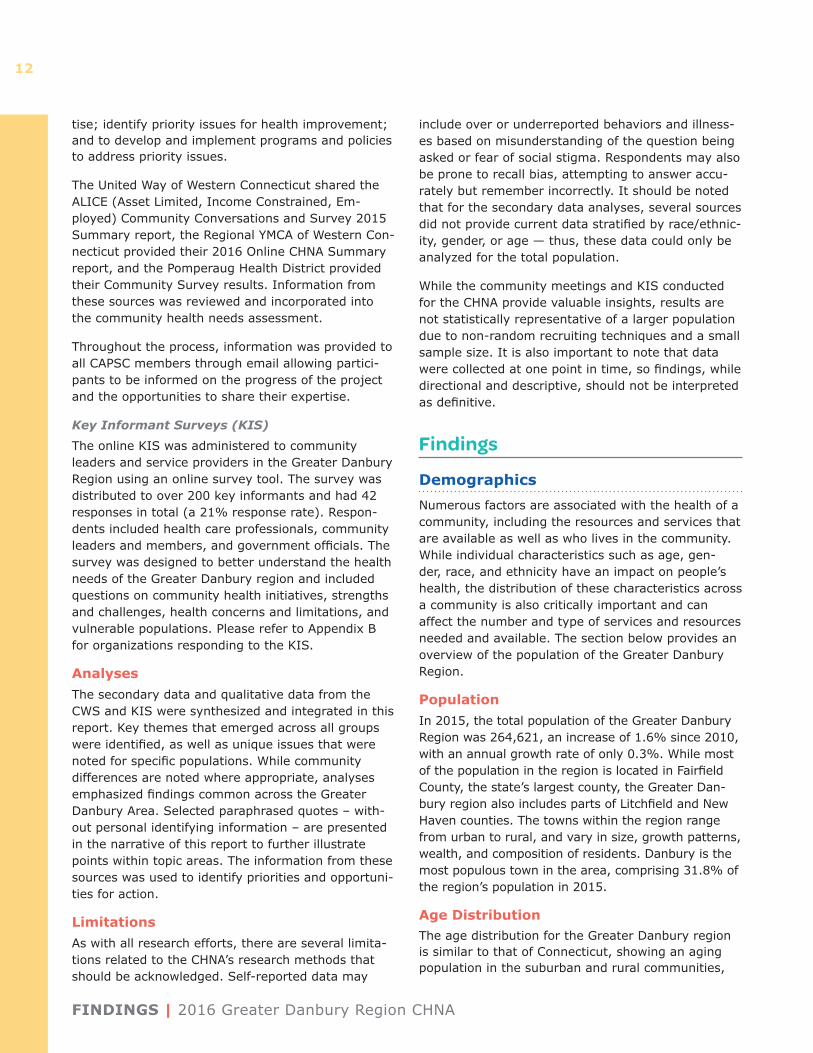
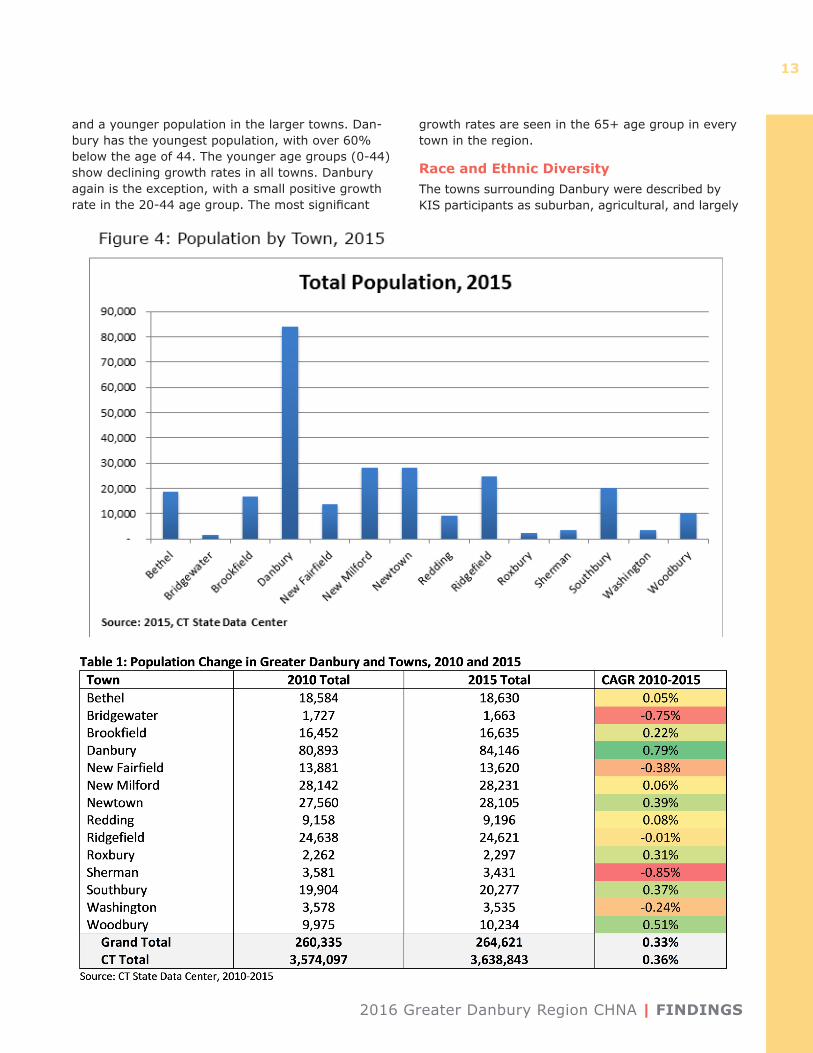
PopulationIn 2015, the total population of the Greater Danbury Region was 264,621, an increase of 1.6% since 2010, with an annual growth rate of only 0.3%. While most of the population in the region is located in Fairfield County, the state’s largest county, the Greater Dan-bury region also includes parts of Litchfield and New Haven counties. The towns within the region range from urban to rural, and vary in size, growth patterns, wealth, and composition of residents. Danbury is the most populous town in the area, comprising 31.8% of the region’s population in 2015.
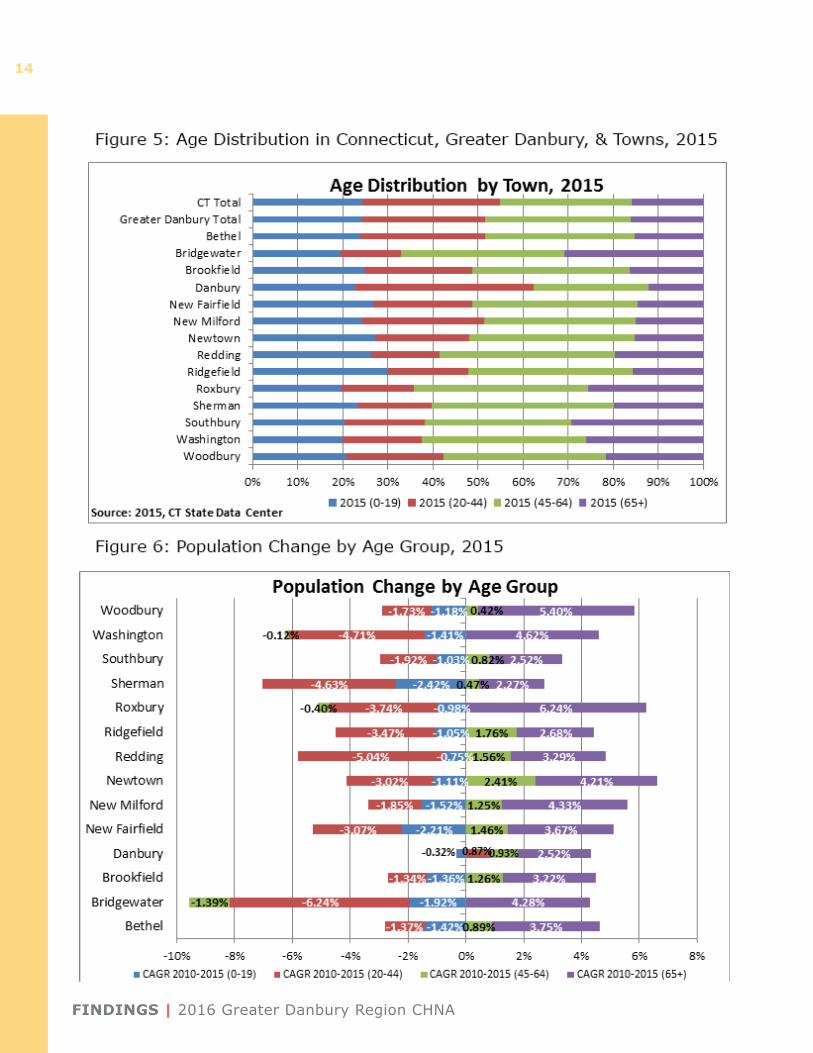
Age DistributionThe age distribution for the Greater Danbury region is similar to that of Connecticut, showing an aging population in the suburban and rural communities,
2016 Greater Danbury Region CHNA | FINDINGS
13
and a younger population in the larger towns. Dan-bury has the youngest population, with over 60% below the age of 44. The younger age groups (0-44) show declining growth rates in all towns. Danbury again is the exception, with a small positive growth rate in the 20-44 age group. The most significant
growth rates are seen in the 65+ age group in every town in the region.
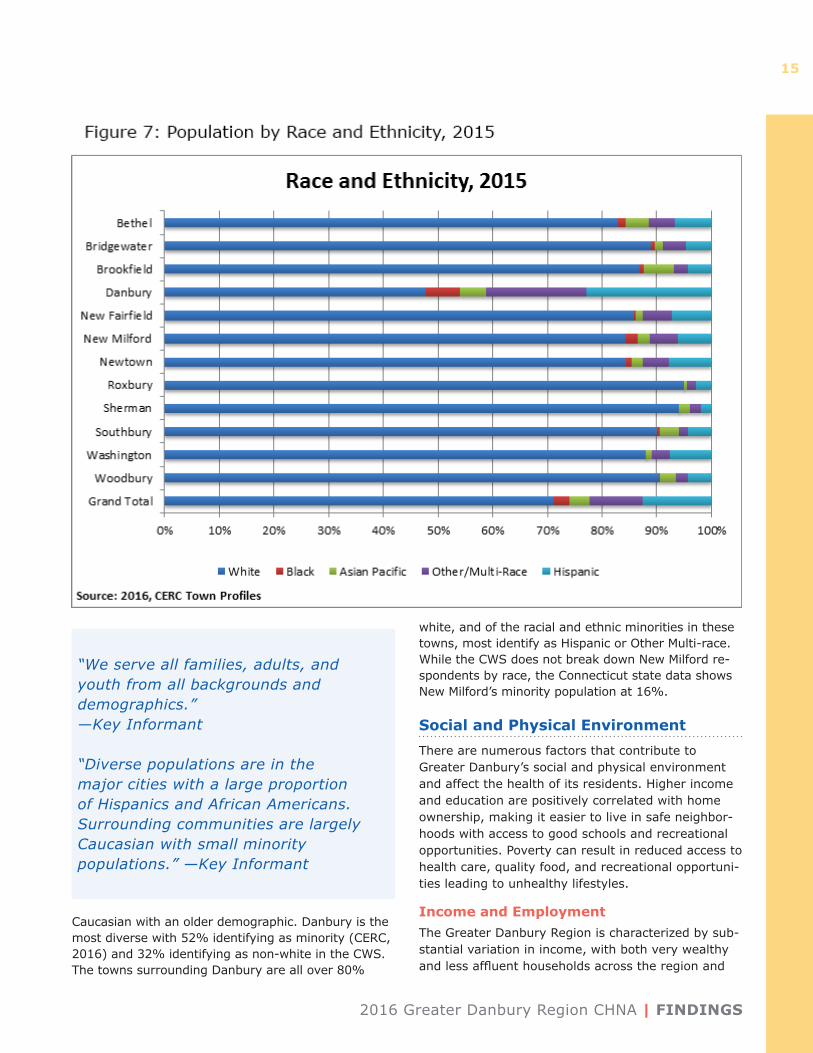
Race and Ethnic DiversityThe towns surrounding Danbury were described by KIS participants as suburban, agricultural, and largely
FINDINGS | 2016 Greater Danbury Region CHNA
14
2016 Greater Danbury Region CHNA | FINDINGS
15
Caucasian with an older demographic. Danbury is the most diverse with 52% identifying as minority (CERC, 2016) and 32% identifying as non-white in the CWS. The towns surrounding Danbury are all over 80%
white, and of the racial and ethnic minorities in these towns, most identify as Hispanic or Other Multi-race. While the CWS does not break down New Milford re-spondents by race, the Connecticut state data shows New Milford’s minority population at 16%.
Social and Physical EnvironmentThere are numerous factors that contribute to Greater Danbury’s social and physical environment and affect the health of its residents. Higher income and education are positively correlated with home ownership, making it easier to live in safe neighbor-hoods with access to good schools and recreational opportunities. Poverty can result in reduced access to health care, quality food, and recreational opportuni-ties leading to unhealthy lifestyles.
Income and EmploymentThe Greater Danbury Region is characterized by sub-stantial variation in income, with both very wealthy and less affluent households across the region and
“We serve all families, adults, and youth from all backgrounds and demographics.” —Key Informant
“Diverse populations are in the major cities with a large proportion of Hispanics and African Americans. Surrounding communities are largely Caucasian with small minority populations.” —Key Informant
FINDINGS | 2016 Greater Danbury Region CHNA
16
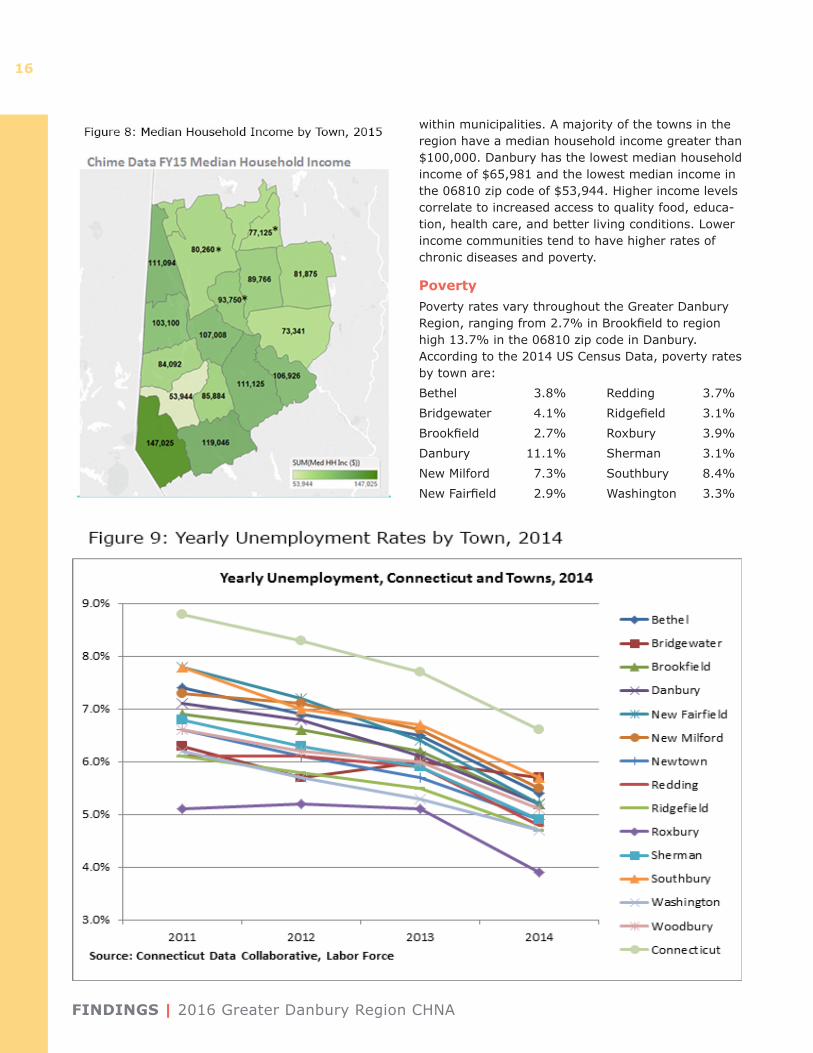
within municipalities. A majority of the towns in the region have a median household income greater than $100,000. Danbury has the lowest median household income of $65,981 and the lowest median income in the 06810 zip code of $53,944. Higher income levels correlate to increased access to quality food, educa-tion, health care, and better living conditions. Lower income communities tend to have higher rates of chronic diseases and poverty.
PovertyPoverty rates vary throughout the Greater Danbury Region, ranging from 2.7% in Brookfield to region high 13.7% in the 06810 zip code in Danbury. According to the 2014 US Census Data, poverty rates by town are: Bethel 3.8% Redding 3.7%Bridgewater 4.1% Ridgefield 3.1%Brookfield 2.7% Roxbury 3.9%Danbury 11.1% Sherman 3.1%New Milford 7.3% Southbury 8.4%New Fairfield 2.9% Washington 3.3%
2016 Greater Danbury Region CHNA | FINDINGS
17
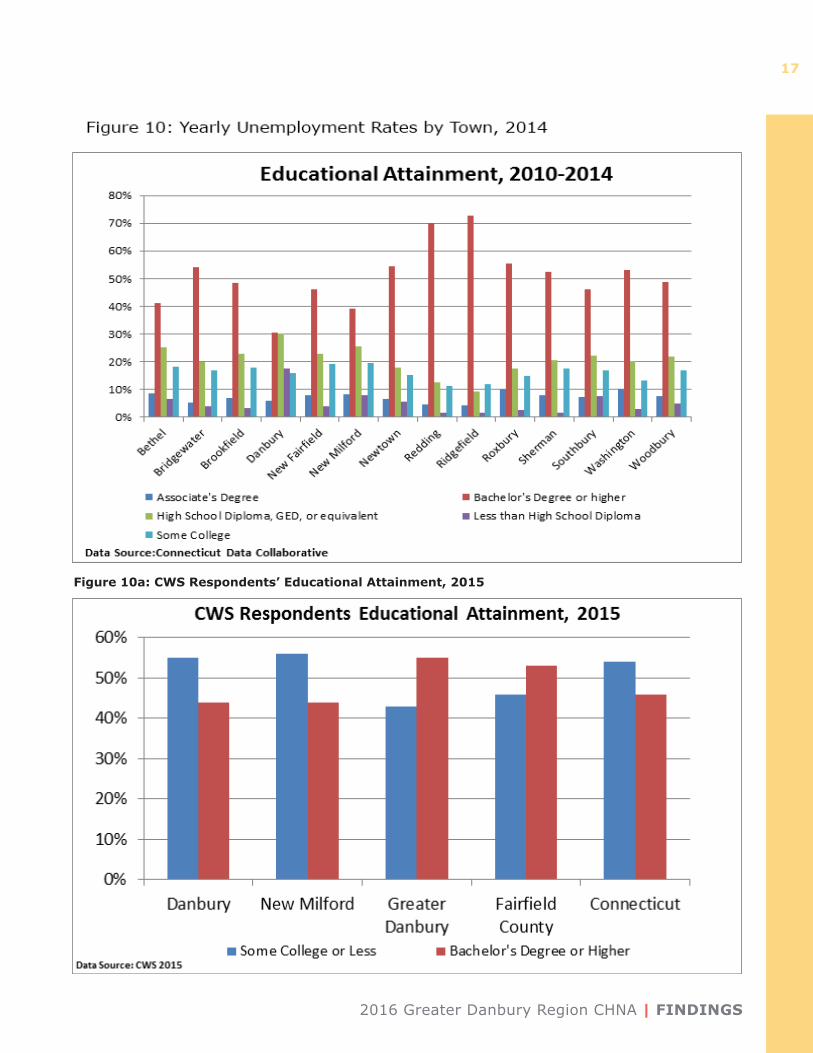
Figure 10a: CWS Respondents’ Educational Attainment, 2015
FINDINGS | 2016 Greater Danbury Region CHNA
18
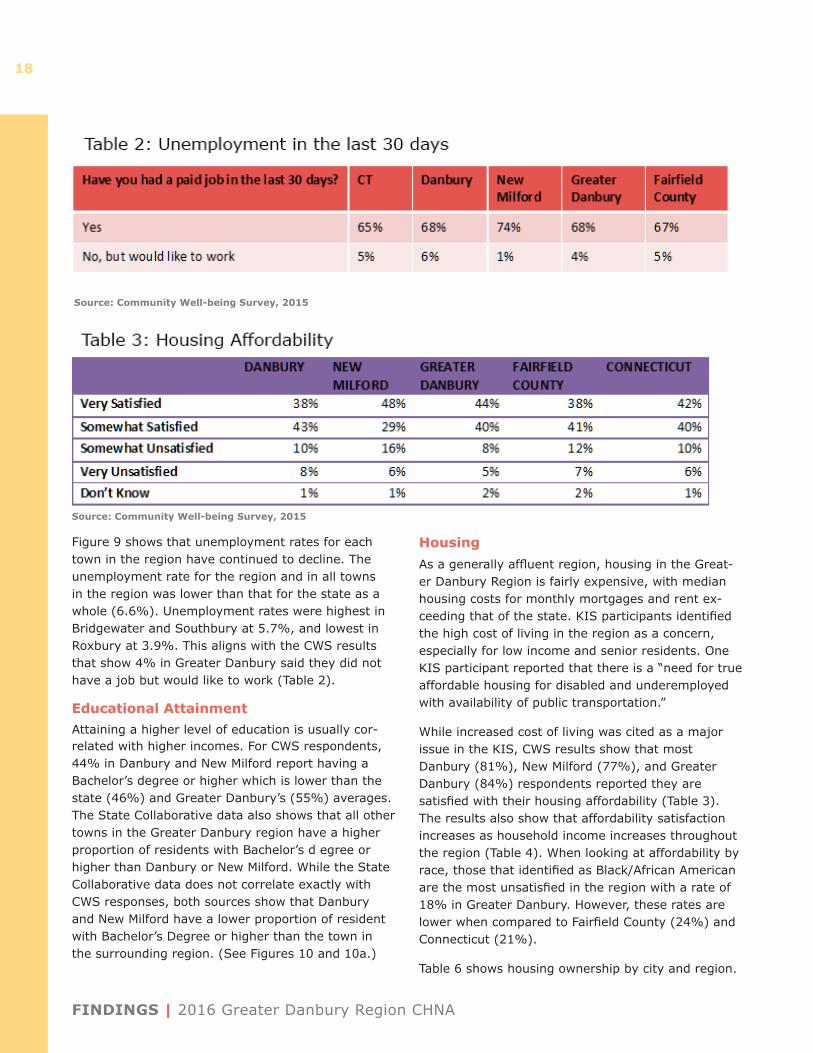
Figure 9 shows that unemployment rates for each town in the region have continued to decline. The unemployment rate for the region and in all towns in the region was lower than that for the state as a whole (6.6%). Unemployment rates were highest in Bridgewater and Southbury at 5.7%, and lowest in Roxbury at 3.9%. This aligns with the CWS results that show 4% in Greater Danbury said they did not have a job but would like to work (Table 2).
Educational AttainmentAttaining a higher level of education is usually cor-related with higher incomes. For CWS respondents, 44% in Danbury and New Milford report having a Bachelor’s degree or higher which is lower than the state (46%) and Greater Danbury’s (55%) averages. The State Collaborative data also shows that all other towns in the Greater Danbury region have a higher proportion of residents with Bachelor’s d egree or higher than Danbury or New Milford. While the State Collaborative data does not correlate exactly with CWS responses, both sources show that Danbury and New Milford have a lower proportion of resident with Bachelor’s Degree or higher than the town in the surrounding region. (See Figures 10 and 10a.)
HousingAs a generally affluent region, housing in the Great-er Danbury Region is fairly expensive, with median housing costs for monthly mortgages and rent ex-ceeding that of the state. KIS participants identified the high cost of living in the region as a concern, especially for low income and senior residents. One KIS participant reported that there is a “need for true affordable housing for disabled and underemployed with availability of public transportation.”
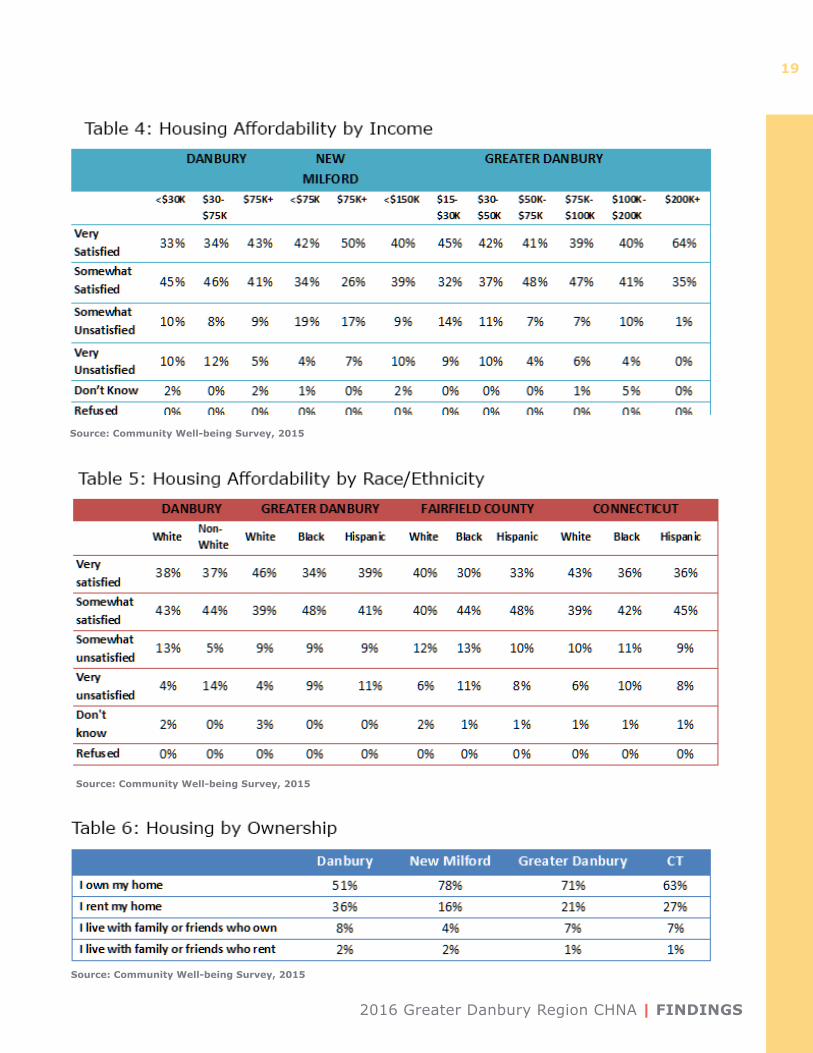
While increased cost of living was cited as a major issue in the KIS, CWS results show that most Danbury (81%), New Milford (77%), and Greater Danbury (84%) respondents reported they are satisfied with their housing affordability (Table 3). The results also show that affordability satisfaction increases as household income increases throughout the region (Table 4). When looking at affordability by race, those that identified as Black/African American are the most unsatisfied in the region with a rate of 18% in Greater Danbury. However, these rates are lower when compared to Fairfield County (24%) and Connecticut (21%).
Table 6 shows housing ownership by city and region.
Source: Community Well-being Survey, 2015
Source: Community Well-being Survey, 2015
2016 Greater Danbury Region CHNA | FINDINGS
19
Source: Community Well-being Survey, 2015
Source: Community Well-being Survey, 2015
Source: Community Well-being Survey, 2015
FINDINGS | 2016 Greater Danbury Region CHNA
20
Compared to the state average, fewer Danbury CWS respondents own their homes and more are renting. Of those renting in Danbury, 21-22% identified living in subsidized apartments or receiving rental assis-tance compared to 14% in Greater Danbury.
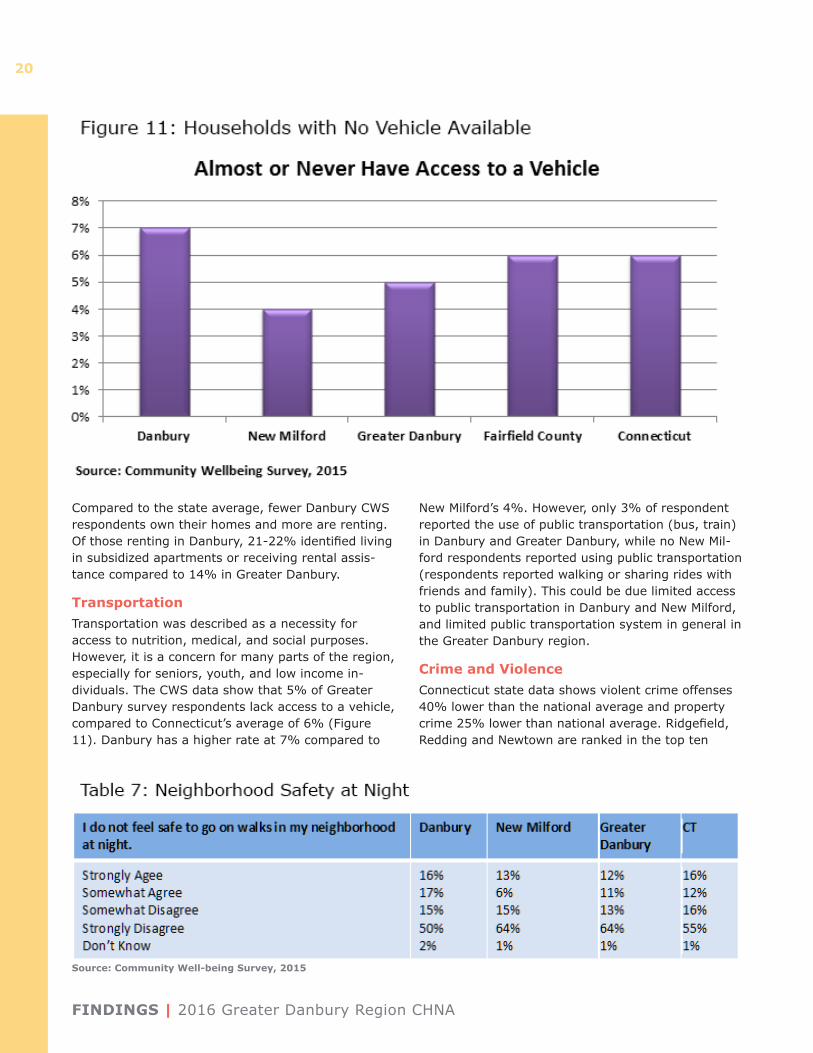
TransportationTransportation was described as a necessity for access to nutrition, medical, and social purposes. However, it is a concern for many parts of the region, especially for seniors, youth, and low income in-dividuals. The CWS data show that 5% of Greater Danbury survey respondents lack access to a vehicle, compared to Connecticut’s average of 6% (Figure 11). Danbury has a higher rate at 7% compared to
New Milford’s 4%. However, only 3% of respondent reported the use of public transportation (bus, train) in Danbury and Greater Danbury, while no New Mil-ford respondents reported using public transportation (respondents reported walking or sharing rides with friends and family). This could be due limited access to public transportation in Danbury and New Milford, and limited public transportation system in general in the Greater Danbury region.
Crime and ViolenceConnecticut state data shows violent crime offenses 40% lower than the national average and property crime 25% lower than national average. Ridgefield, Redding and Newtown are ranked in the top ten
Source: Community Well-being Survey, 2015
2016 Greater Danbury Region CHNA | FINDINGS
21
safest cities in Connecticut (of cities with population greater than 19,000) by SafeWise, based on FBI Crime Report statistics from 2014. KIS respondents are more concerned about the rising drug utiliza-tion/abuse rates in the region. This aligns with CWS results showing that majority of residents reported they feel safe in their neighborhoods (Table 7).
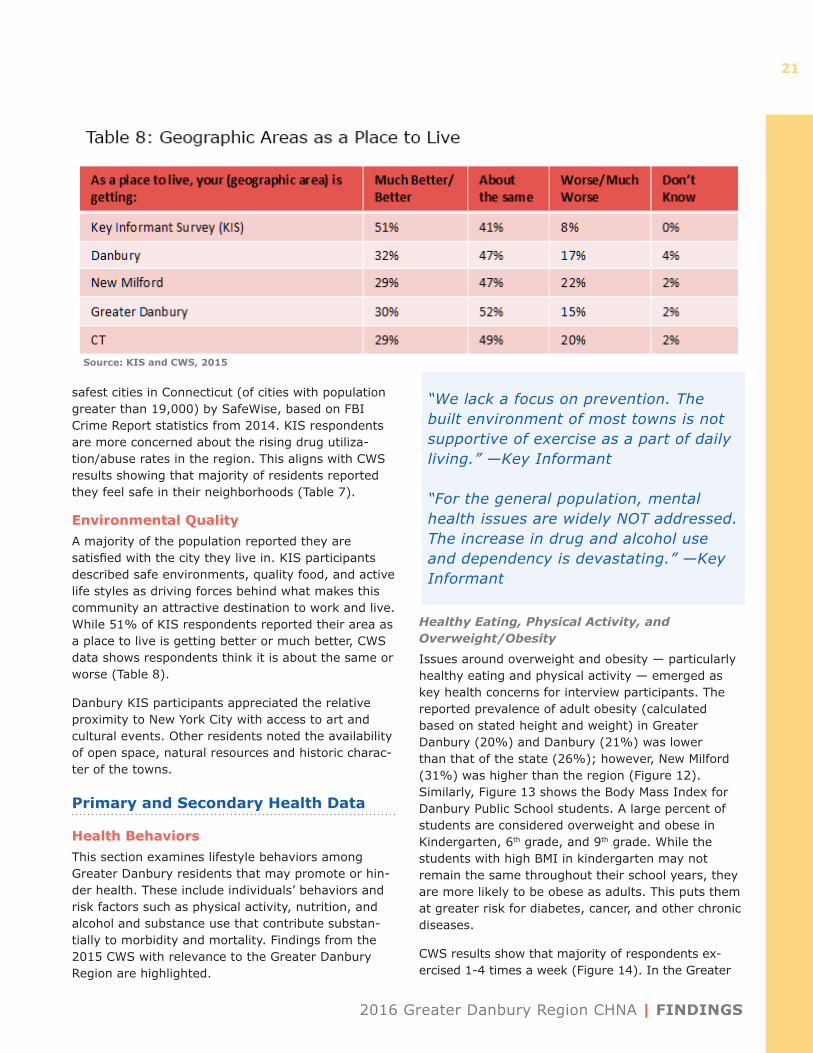
Environmental Quality A majority of the population reported they are satisfied with the city they live in. KIS participants described safe environments, quality food, and active life styles as driving forces behind what makes this community an attractive destination to work and live. While 51% of KIS respondents reported their area as a place to live is getting better or much better, CWS data shows respondents think it is about the same or worse (Table 8).
Danbury KIS participants appreciated the relative proximity to New York City with access to art and cultural events. Other residents noted the availability of open space, natural resources and historic charac-ter of the towns.
Primary and Secondary Health Data
Health BehaviorsThis section examines lifestyle behaviors among Greater Danbury residents that may promote or hin-der health. These include individuals’ behaviors and risk factors such as physical activity, nutrition, and alcohol and substance use that contribute substan-tially to morbidity and mortality. Findings from the 2015 CWS with relevance to the Greater Danbury Region are highlighted.
Healthy Eating, Physical Activity, and Overweight/Obesity
Issues around overweight and obesity — particularly healthy eating and physical activity — emerged as key health concerns for interview participants. The reported prevalence of adult obesity (calculated based on stated height and weight) in Greater Danbury (20%) and Danbury (21%) was lower than that of the state (26%); however, New Milford (31%) was higher than the region (Figure 12). Similarly, Figure 13 shows the Body Mass Index for Danbury Public School students. A large percent of students are considered overweight and obese in Kindergarten, 6th grade, and 9th grade. While the students with high BMI in kindergarten may not remain the same throughout their school years, they are more likely to be obese as adults. This puts them at greater risk for diabetes, cancer, and other chronic diseases.
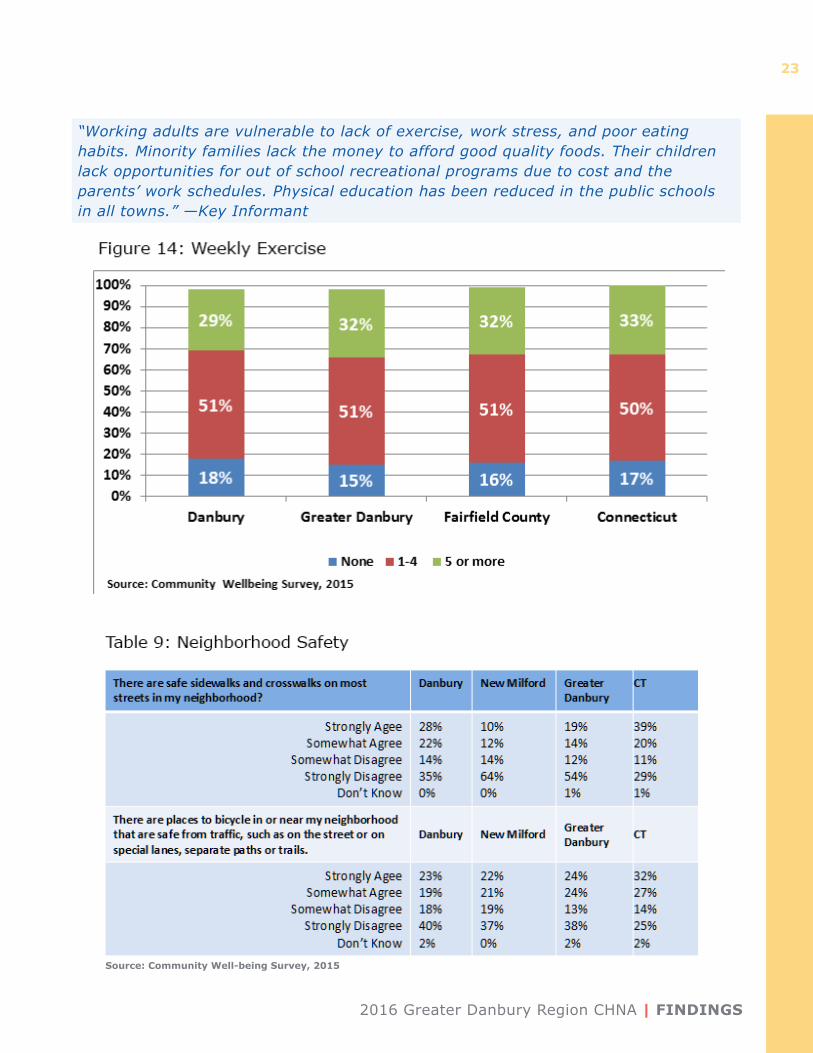
CWS results show that majority of respondents ex-ercised 1-4 times a week (Figure 14). In the Greater
“We lack a focus on prevention. The built environment of most towns is not supportive of exercise as a part of daily living.” —Key Informant
“For the general population, mental health issues are widely NOT addressed. The increase in drug and alcohol use and dependency is devastating.” —Key Informant
Source: KIS and CWS, 2015
FINDINGS | 2016 Greater Danbury Region CHNA
22
2016 Greater Danbury Region CHNA | FINDINGS
23
“Working adults are vulnerable to lack of exercise, work stress, and poor eating habits. Minority families lack the money to afford good quality foods. Their children lack opportunities for out of school recreational programs due to cost and the parents’ work schedules. Physical education has been reduced in the public schools in all towns.” —Key Informant
Source: Community Well-being Survey, 2015
FINDINGS | 2016 Greater Danbury Region CHNA
24
Danbury Region, 15% said they do not exercise compared to Connecticut’s average of 17%. However, 18% in Danbury alone do not exercise weekly.
Another contributing factor to physical activity is safe areas for people to walk or bike in their neigh-borhoods. A smaller proportion of Greater Danbury respondents (33%) than Connecticut respondents (59%) said there were safe sidewalks and crosswalks in their neighborhoods. One KIS participant said that there needs to be a “multi-disciplinary coalition to address walkability and bikeability of the downtown Danbury area, and connect towns with multi-use trails.”
Smoking
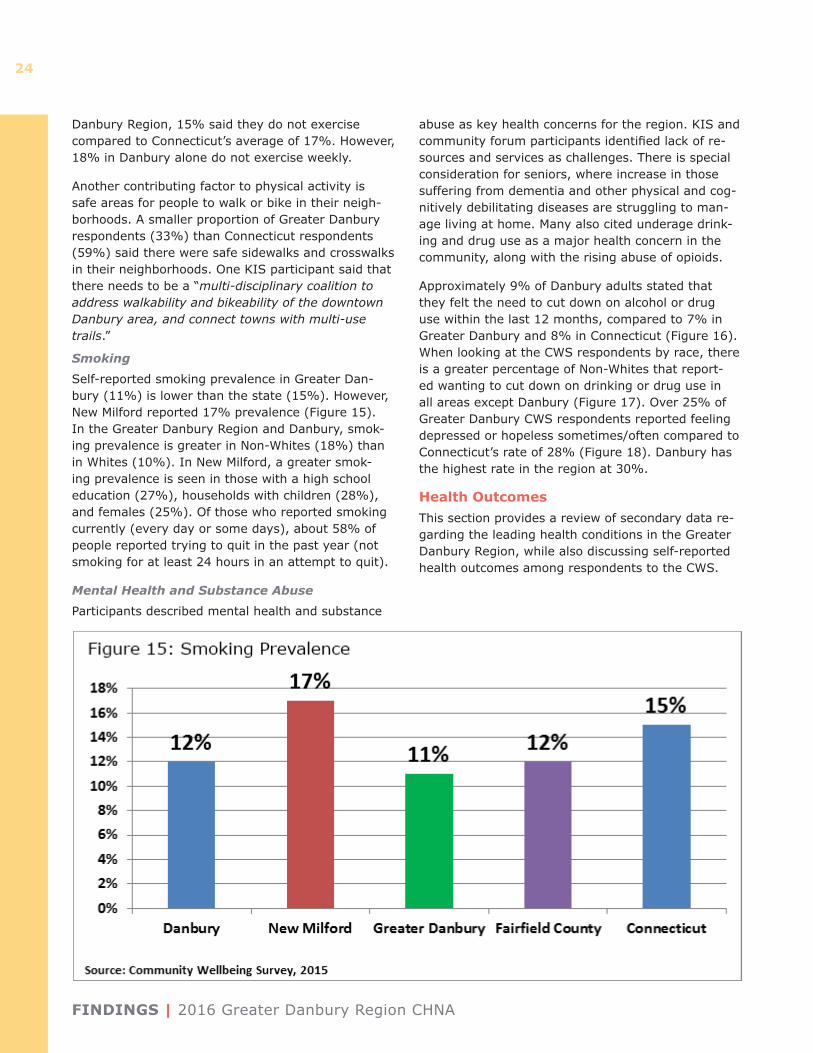
Self-reported smoking prevalence in Greater Dan-bury (11%) is lower than the state (15%). However, New Milford reported 17% prevalence (Figure 15). In the Greater Danbury Region and Danbury, smok-ing prevalence is greater in Non-Whites (18%) than in Whites (10%). In New Milford, a greater smok-ing prevalence is seen in those with a high school education (27%), households with children (28%), and females (25%). Of those who reported smoking currently (every day or some days), about 58% of people reported trying to quit in the past year (not smoking for at least 24 hours in an attempt to quit).
Mental Health and Substance Abuse
Participants described mental health and substance
abuse as key health concerns for the region. KIS and community forum participants identified lack of re-sources and services as challenges. There is special consideration for seniors, where increase in those suffering from dementia and other physical and cog-nitively debilitating diseases are struggling to man-age living at home. Many also cited underage drink-ing and drug use as a major health concern in the community, along with the rising abuse of opioids.
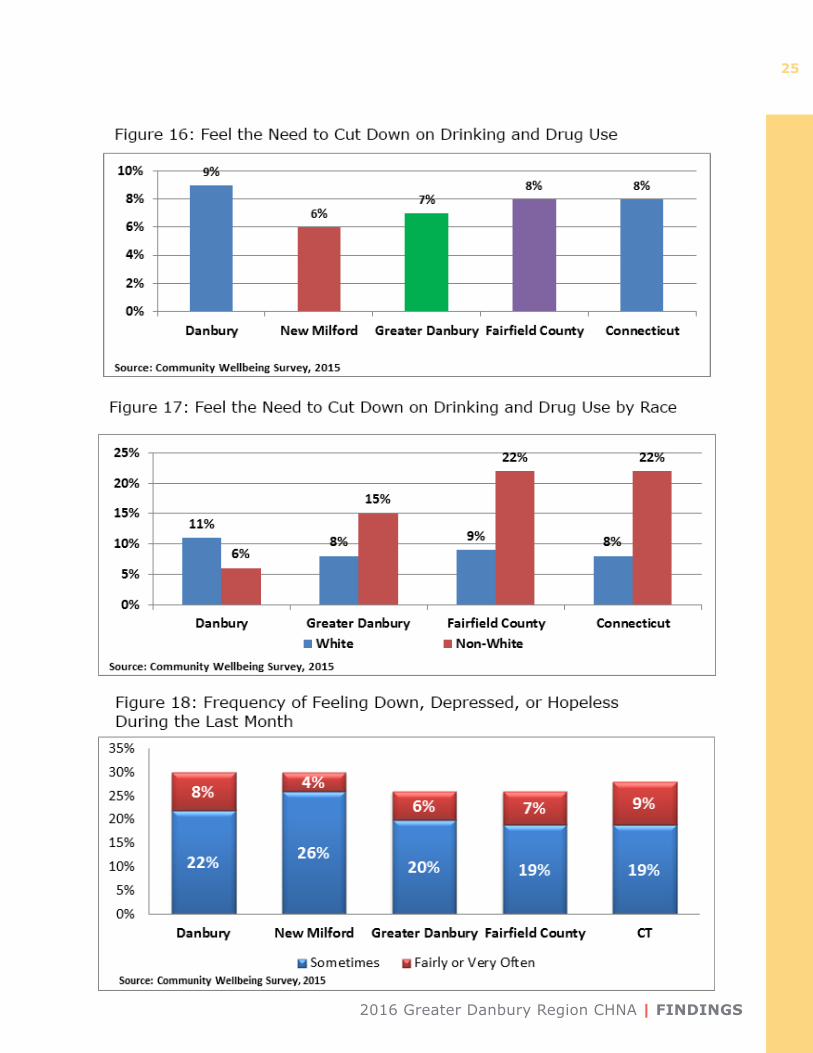
Approximately 9% of Danbury adults stated that they felt the need to cut down on alcohol or drug use within the last 12 months, compared to 7% in Greater Danbury and 8% in Connecticut (Figure 16). When looking at the CWS respondents by race, there is a greater percentage of Non-Whites that report-ed wanting to cut down on drinking or drug use in all areas except Danbury (Figure 17). Over 25% of Greater Danbury CWS respondents reported feeling depressed or hopeless sometimes/often compared to Connecticut’s rate of 28% (Figure 18). Danbury has the highest rate in the region at 30%.
Health OutcomesThis section provides a review of secondary data re-garding the leading health conditions in the Greater Danbury Region, while also discussing self-reported health outcomes among respondents to the CWS.
2016 Greater Danbury Region CHNA | FINDINGS
25
FINDINGS | 2016 Greater Danbury Region CHNA
26
Perceived Health Status
CWS results show that 89% of Greater Danbury residents and 88% of New Milford residents said they are in good or excellent health, which is above the Connecticut average of 85%. Danbury residents are lower at 83%.
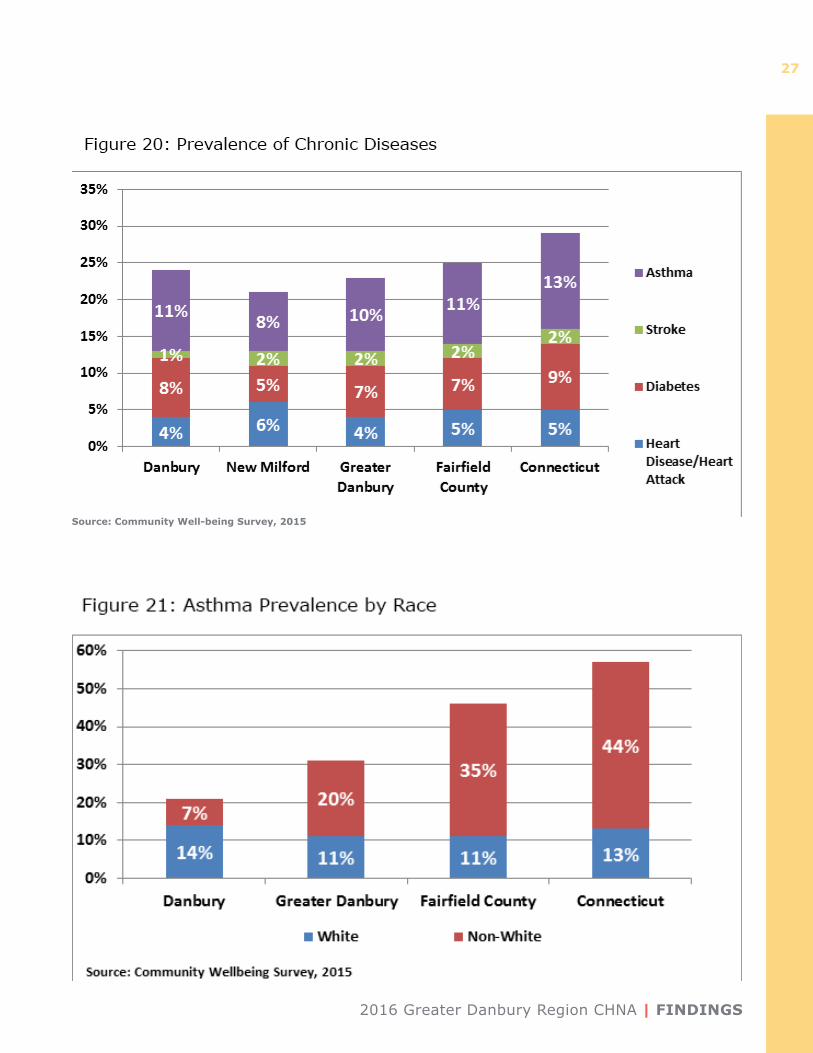
Chronic Disease/Obesity
When asked about health concerns in their commu-nities, KIS respondents cited chronic diseases and obesity as a top concern. The self-reported prev-alence of heart disease (4%), diabetes (7%) and asthma (10%) among adults in the Greater Danbury Region is lower than the state as a whole (Figure 20). However, Danbury’s rates of asthma (11%) and diabetes (8%) are highest in the region. When look-ing at asthma prevalence by race (Figure 21), there is a greater percentage of respondents that identified as non-white in Greater Danbury (20%) than white (11%). Of these respondents, 12% were Hispanic
while 4% were Black/African American or other. The city of Danbury, however, has the lowest rate in the Greater Danbury Region of non-whites reporting be-ing diagnosed with asthma at 7%.
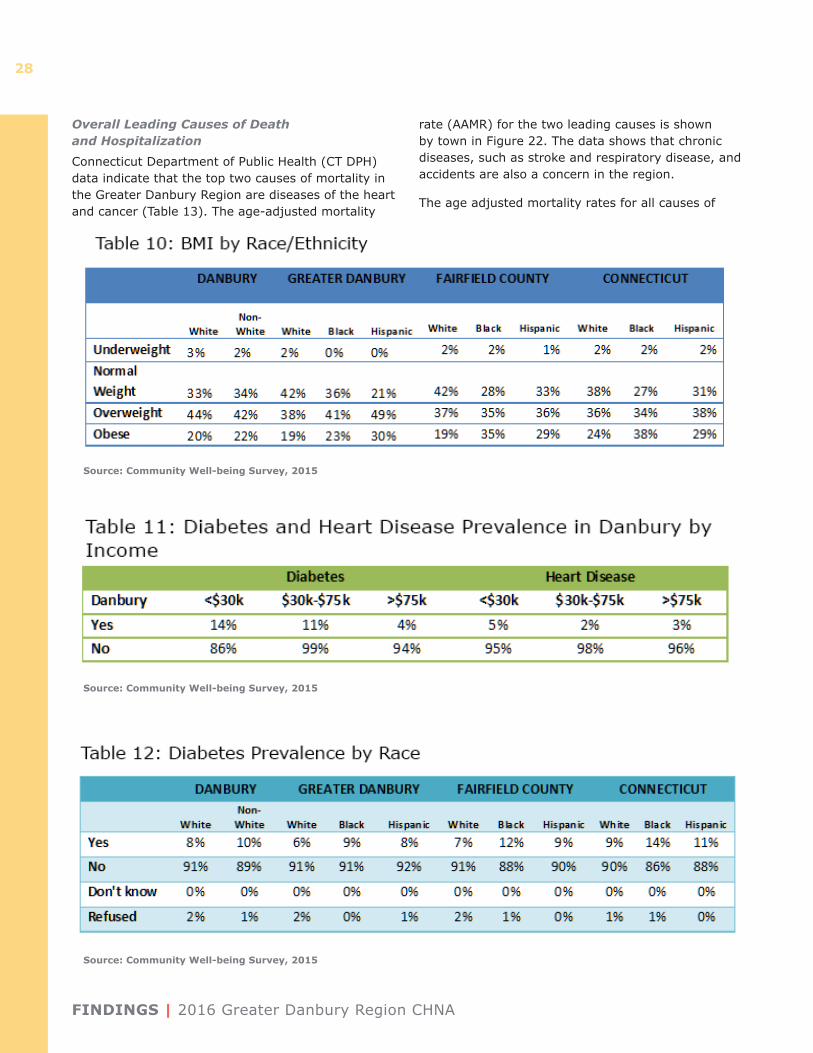
Obesity is a risk factor for these chronic diseases and was cited as a concern amongst KIS respondents. While Danbury does not further break down BMI by race, 22% of non-whites did self-report as obese (Table 10). In Greater Danbury, 23% of Black/African Americans and 30% of Hispanics self-reported being obese compared to 19% of Whites.
Relating to obesity, those in the lowest income category for the CWS participants (<$30k) had the highest prevalence of both heart disease and diabe-tes in Danbury (Table 11). However, self-reported diabetes seems to be more prevalent among respon-dents earning less than $30k than heart disease. It is also more prevalent in Black/African Americans (9%) across the region than other races (Table 12).
2016 Greater Danbury Region CHNA | FINDINGS
27
Source: Community Well-being Survey, 2015
FINDINGS | 2016 Greater Danbury Region CHNA
28
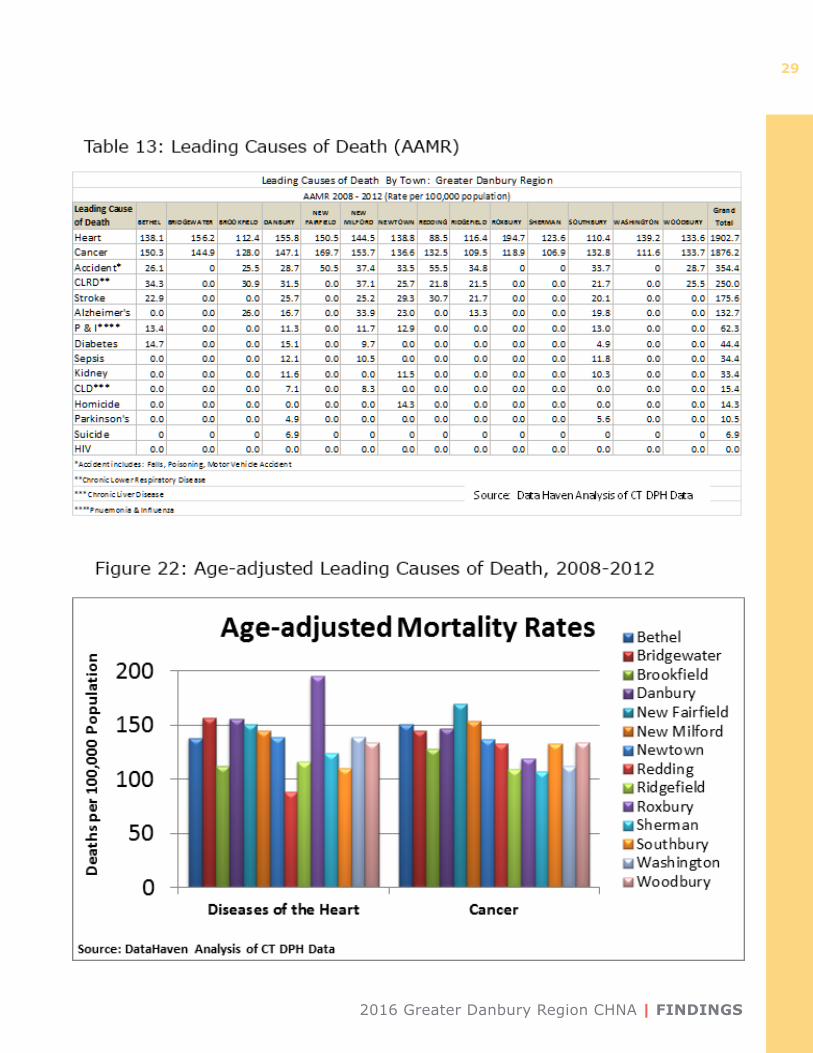
Overall Leading Causes of Death and Hospitalization
Connecticut Department of Public Health (CT DPH) data indicate that the top two causes of mortality in the Greater Danbury Region are diseases of the heart and cancer (Table 13). The age-adjusted mortality
rate (AAMR) for the two leading causes is shown by town in Figure 22. The data shows that chronic diseases, such as stroke and respiratory disease, and accidents are also a concern in the region.
The age adjusted mortality rates for all causes of
Source: Community Well-being Survey, 2015
Source: Community Well-being Survey, 2015
Source: Community Well-being Survey, 2015
2016 Greater Danbury Region CHNA | FINDINGS
29
FINDINGS | 2016 Greater Danbury Region CHNA
30
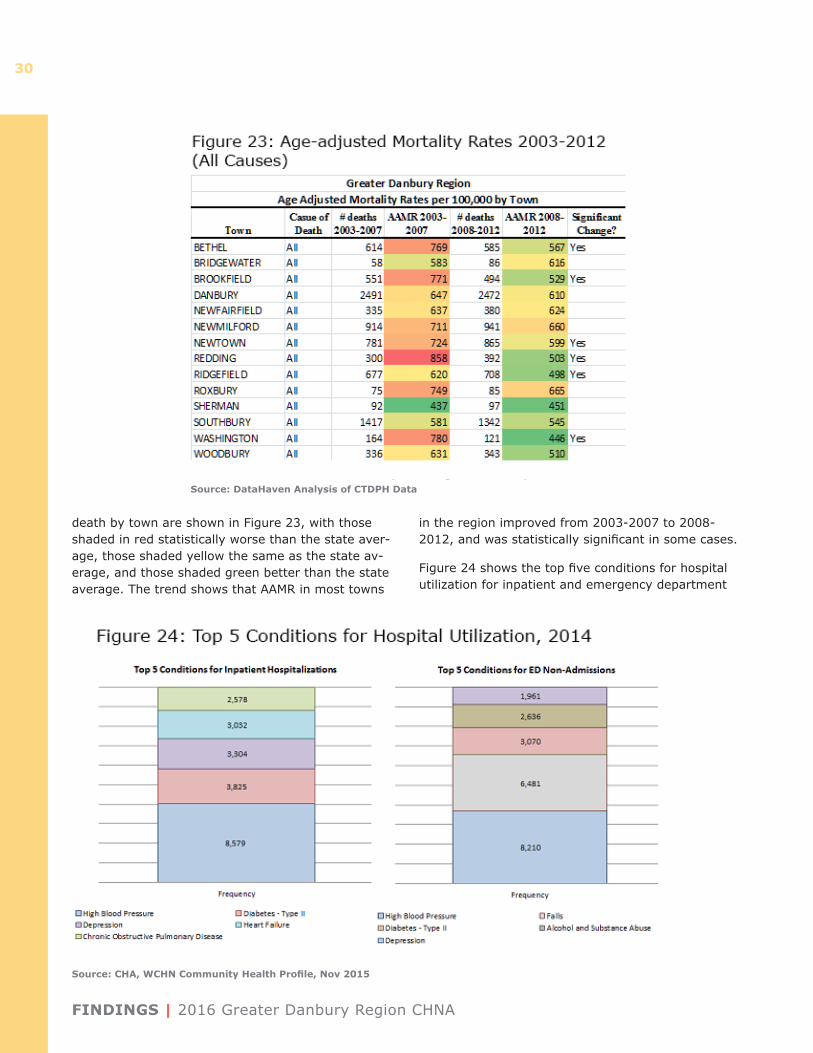
death by town are shown in Figure 23, with those shaded in red statistically worse than the state aver-age, those shaded yellow the same as the state av-erage, and those shaded green better than the state average. The trend shows that AAMR in most towns
in the region improved from 2003-2007 to 2008-2012, and was statistically significant in some cases.
Figure 24 shows the top five conditions for hospital utilization for inpatient and emergency department
Source: DataHaven Analysis of CTDPH Data
Source: CHA, WCHN Community Health Profile, Nov 2015
2016 Greater Danbury Region CHNA | FINDINGS
31
Source: DataHaven Analysis of Chime Data
Source: DataHaven Analysis of Chime Data
FINDINGS | 2016 Greater Danbury Region CHNA
32
for residents of the Greater Danbury Region. High blood pressure was the most prevalent condition among hospitalization for both inpatient and emer-gency department. Depression was the third most prevalent condition for inpatient hospital utilization, and the fifth most prevalent in the emergency de-partment.
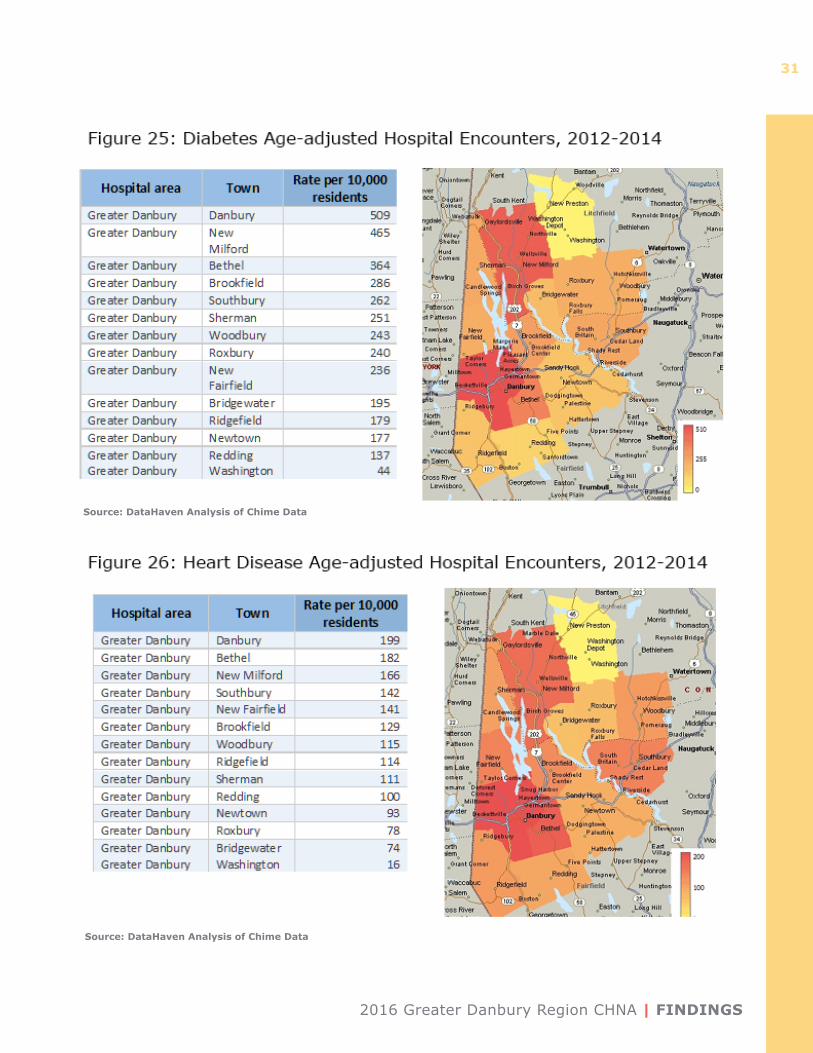
Age-adjusted hospital encounters data shows that Danbury has the highest rate of hospital utilization (509) per 10,000 residents for diabetes from 2012-2014, while Washington has the least (45). Similarly, Danbury also has the highest rate for heart disease at 161, while Washington has the least at 16 (Figure 26). These rates were calculated as an aggregate for 2012-2014 and adjusted to be comparable between towns.
Mental Health and Substance Abuse
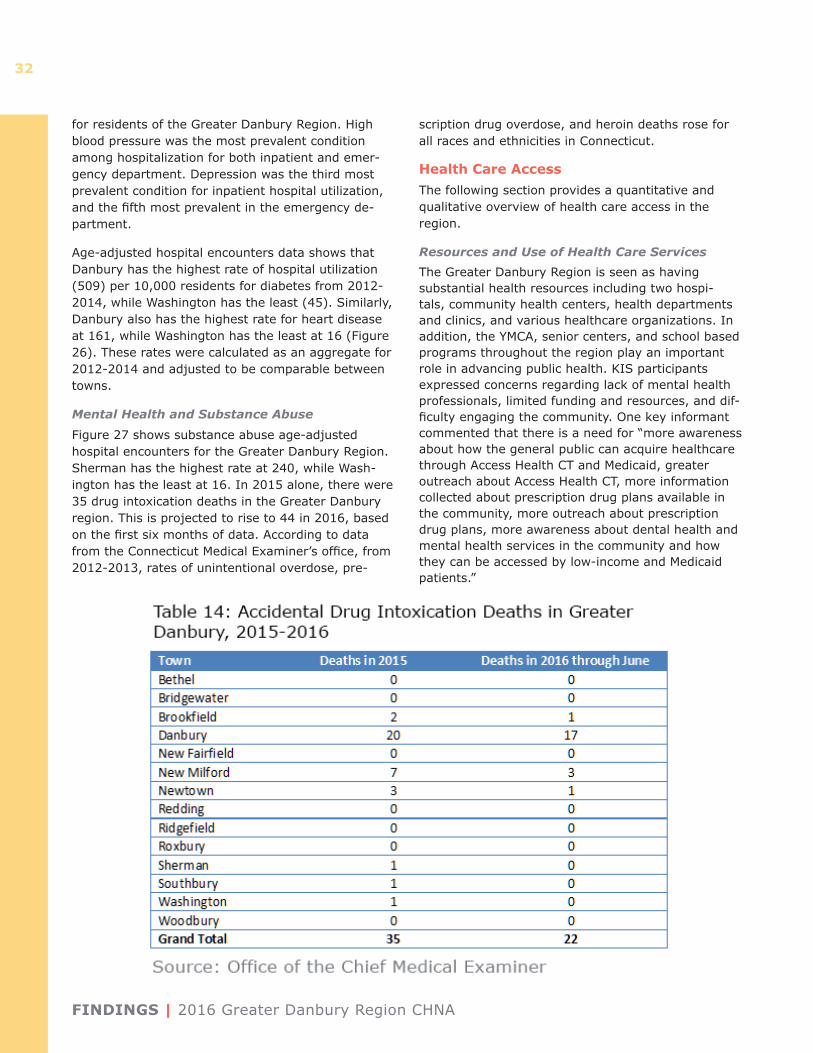
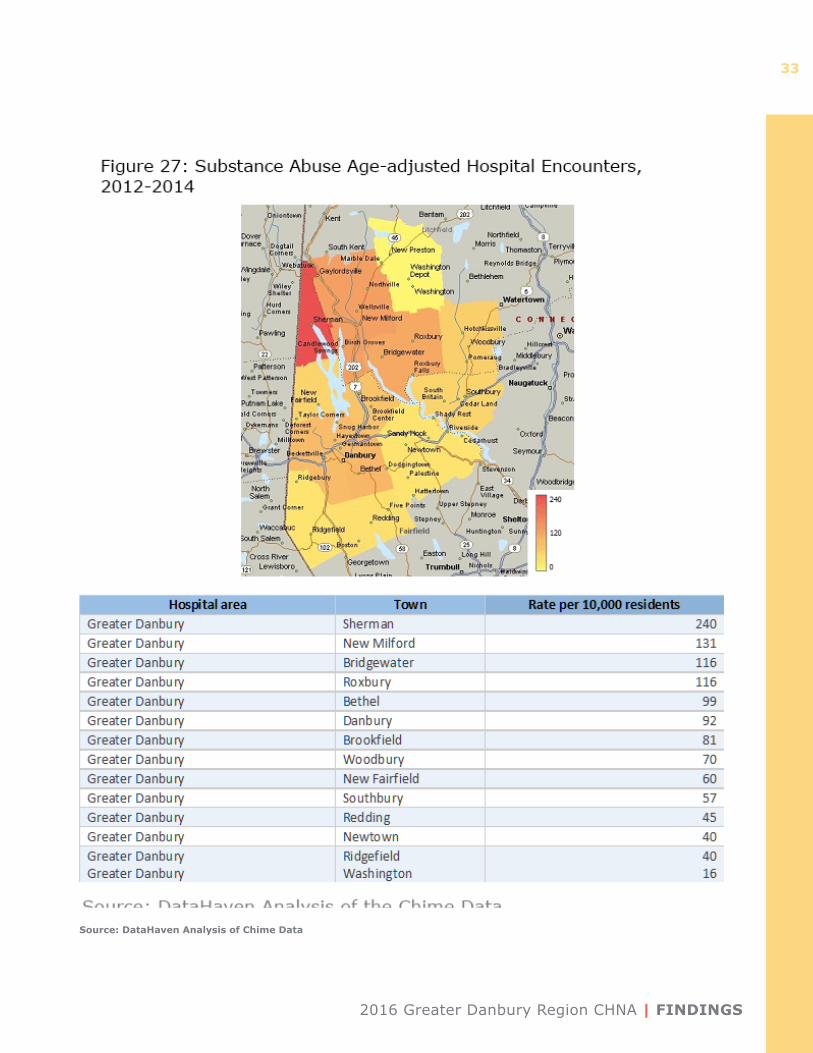
Figure 27 shows substance abuse age-adjusted hospital encounters for the Greater Danbury Region. Sherman has the highest rate at 240, while Wash-ington has the least at 16. In 2015 alone, there were 35 drug intoxication deaths in the Greater Danbury region. This is projected to rise to 44 in 2016, based on the first six months of data. According to data from the Connecticut Medical Examiner’s office, from 2012-2013, rates of unintentional overdose, pre-
scription drug overdose, and heroin deaths rose for all races and ethnicities in Connecticut.
Health Care Access The following section provides a quantitative and qualitative overview of health care access in the region.
Resources and Use of Health Care ServicesThe Greater Danbury Region is seen as having substantial health resources including two hospi-tals, community health centers, health departments and clinics, and various healthcare organizations. In addition, the YMCA, senior centers, and school based programs throughout the region play an important role in advancing public health. KIS participants expressed concerns regarding lack of mental health professionals, limited funding and resources, and dif-ficulty engaging the community. One key informant commented that there is a need for “more awareness about how the general public can acquire healthcare through Access Health CT and Medicaid, greater outreach about Access Health CT, more information collected about prescription drug plans available in the community, more outreach about prescription drug plans, more awareness about dental health and mental health services in the community and how they can be accessed by low-income and Medicaid patients.”
2016 Greater Danbury Region CHNA | FINDINGS
33
Source: DataHaven Analysis of Chime Data
FINDINGS | 2016 Greater Danbury Region CHNA
34
Challenges in Accessing Health Care Services
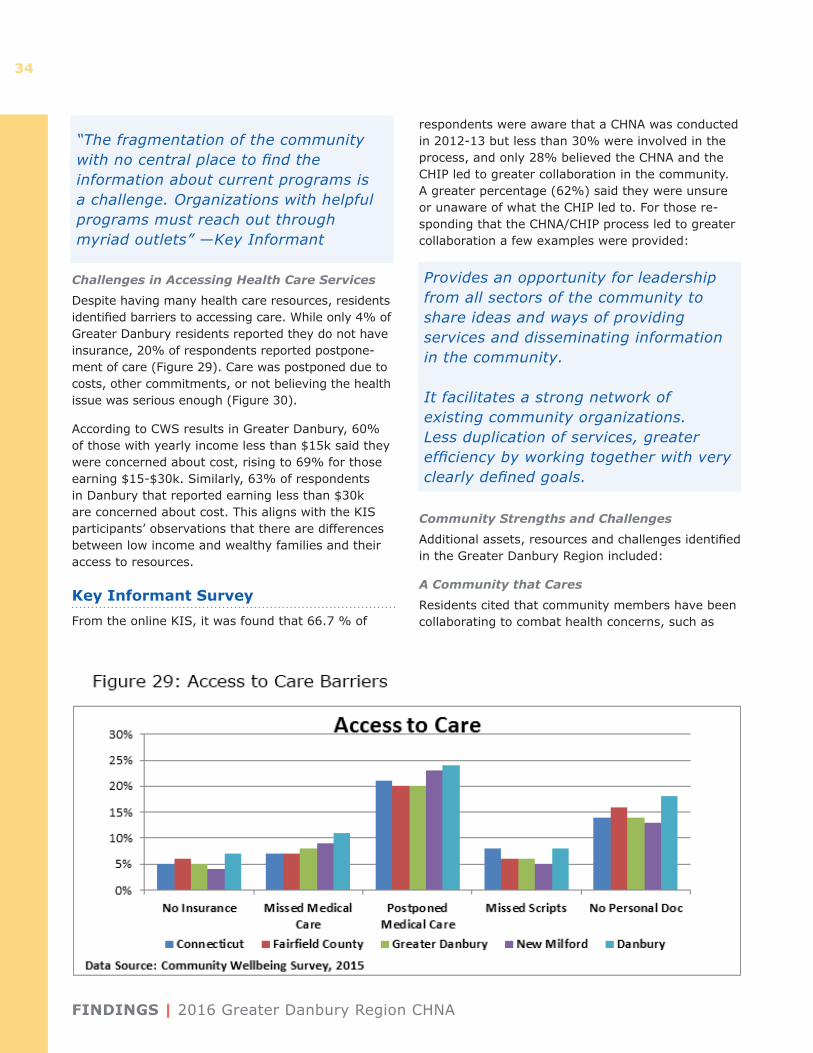
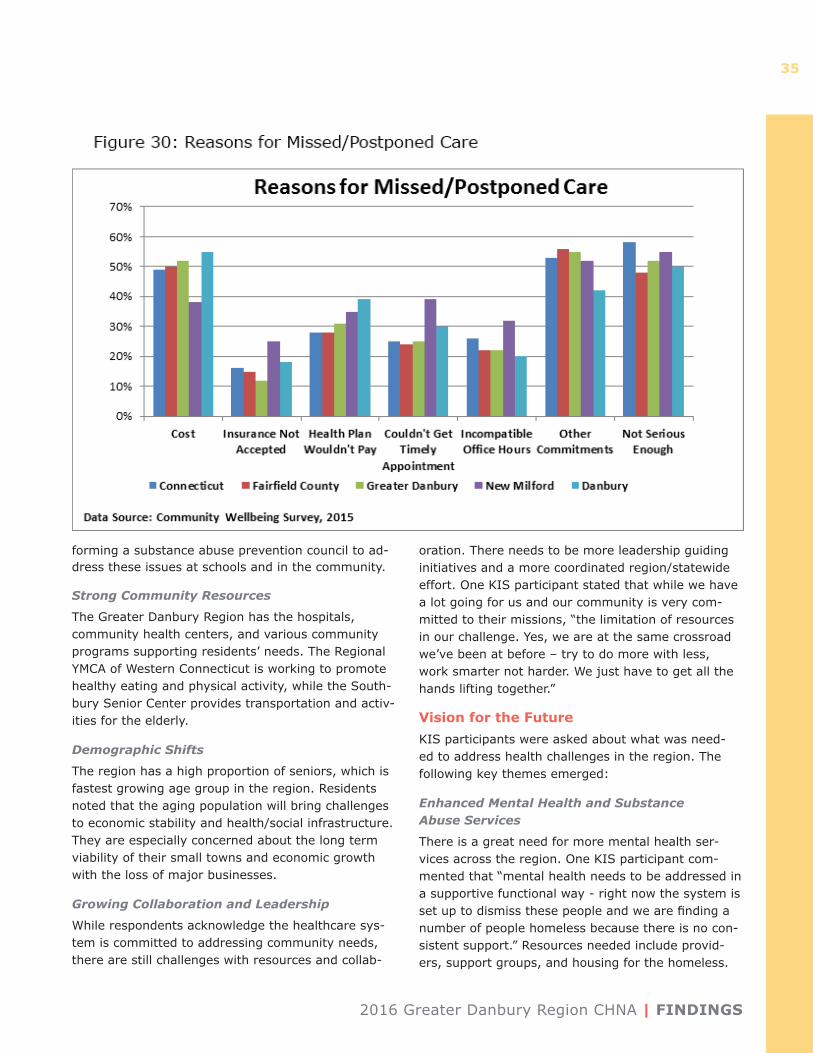
Despite having many health care resources, residents identified barriers to accessing care. While only 4% of Greater Danbury residents reported they do not have insurance, 20% of respondents reported postpone-ment of care (Figure 29). Care was postponed due to costs, other commitments, or not believing the health issue was serious enough (Figure 30).
According to CWS results in Greater Danbury, 60% of those with yearly income less than $15k said they were concerned about cost, rising to 69% for those earning $15-$30k. Similarly, 63% of respondents in Danbury that reported earning less than $30k are concerned about cost. This aligns with the KIS participants’ observations that there are differences between low income and wealthy families and their access to resources.
Key Informant SurveyFrom the online KIS, it was found that 66.7 % of
respondents were aware that a CHNA was conducted in 2012-13 but less than 30% were involved in the process, and only 28% believed the CHNA and the CHIP led to greater collaboration in the community. A greater percentage (62%) said they were unsure or unaware of what the CHIP led to. For those re-sponding that the CHNA/CHIP process led to greater collaboration a few examples were provided:
Community Strengths and Challenges
Additional assets, resources and challenges identified in the Greater Danbury Region included:
A Community that Cares
Residents cited that community members have been collaborating to combat health concerns, such as
“The fragmentation of the community with no central place to find the information about current programs is a challenge. Organizations with helpful programs must reach out through myriad outlets” —Key Informant
Provides an opportunity for leadership from all sectors of the community to share ideas and ways of providing services and disseminating information in the community.
It facilitates a strong network of existing community organizations. Less duplication of services, greater efficiency by working together with very clearly defined goals.
2016 Greater Danbury Region CHNA | FINDINGS
35
forming a substance abuse prevention council to ad-dress these issues at schools and in the community.
Strong Community Resources
The Greater Danbury Region has the hospitals, community health centers, and various community programs supporting residents’ needs. The Regional YMCA of Western Connecticut is working to promote healthy eating and physical activity, while the South-bury Senior Center provides transportation and activ-ities for the elderly.
Demographic Shifts
The region has a high proportion of seniors, which is fastest growing age group in the region. Residents noted that the aging population will bring challenges to economic stability and health/social infrastructure. They are especially concerned about the long term viability of their small towns and economic growth with the loss of major businesses.
Growing Collaboration and Leadership
While respondents acknowledge the healthcare sys-tem is committed to addressing community needs, there are still challenges with resources and collab-
oration. There needs to be more leadership guiding initiatives and a more coordinated region/statewide effort. One KIS participant stated that while we have a lot going for us and our community is very com-mitted to their missions, “the limitation of resources in our challenge. Yes, we are at the same crossroad we’ve been at before – try to do more with less, work smarter not harder. We just have to get all the hands lifting together.”
Vision for the FutureKIS participants were asked about what was need-ed to address health challenges in the region. The following key themes emerged:
Enhanced Mental Health and Substance Abuse Services
There is a great need for more mental health ser-vices across the region. One KIS participant com-mented that “mental health needs to be addressed in a supportive functional way - right now the system is set up to dismiss these people and we are finding a number of people homeless because there is no con-sistent support.” Resources needed include provid-ers, support groups, and housing for the homeless.
FINDINGS | 2016 Greater Danbury Region CHNA
36
Education is also needed, especially for lower income residents and students.
Centralized Resource Information
A central source of information on available ser-vices in the area was cited as an important tool that residents and professionals need to access care. One KIS participant said that “The fragmentation of the community with no central place to find the information about current programs is a challenge. Organizations with helpful programs must reach out through myriad outlets.”
Focus on Prevention and InterventionParticipants described an emphasis on prevention and intervention initiatives to overcome chronic diseases, mental health, and substance abuse. “The community needs to become aware of resources and services, become better educated, and provided more options to accessing care.”
Identifying Key PrioritiesDanbury Hospital and members of the CAPSC con-vened a meeting on August 2, 2016 with additional Health Department Directors and other community members in attendance, representing diverse per-spectives and sectors from the community, to share the preliminary findings of the CHNA and identify priorities for the CHIP. After reviewing and discuss-ing the data presented in the CHNA, the following themes emerged:
• Mental Health – including depression, anxiety, stress management, access to services, and stigma
• Substance Abuse – including tobacco, alcohol and opioid abuse
• Chronic Disease – including cardiovascular dis-ease, cancer, diabetes, asthma, obesity as an un-derlying cause, and the need to promote healthy eating and active living
• Access to Care – including outreach, education, awareness, and funding
• Healthy Aging – including aging in place, support for caregivers, socialization
Each community participant was asked to rank their top three health priorities, based on the following agreed-upon criteria:
• Builds on/enhances current initiatives
• Community values: Likely community mobiliza-tion, important to community
• Key area of need (based on data) • Size: Many people affected• Trend: Getting worse• Seriousness: Deaths, hospitalizations,
disabilities• Causes: Can identify root causes/social
determinants • Research/evidence-based
• Measurable outcomes
• Population Based Strategies: can focus on target-ed population(s)
• Can move the needle: feasible, proven strategies
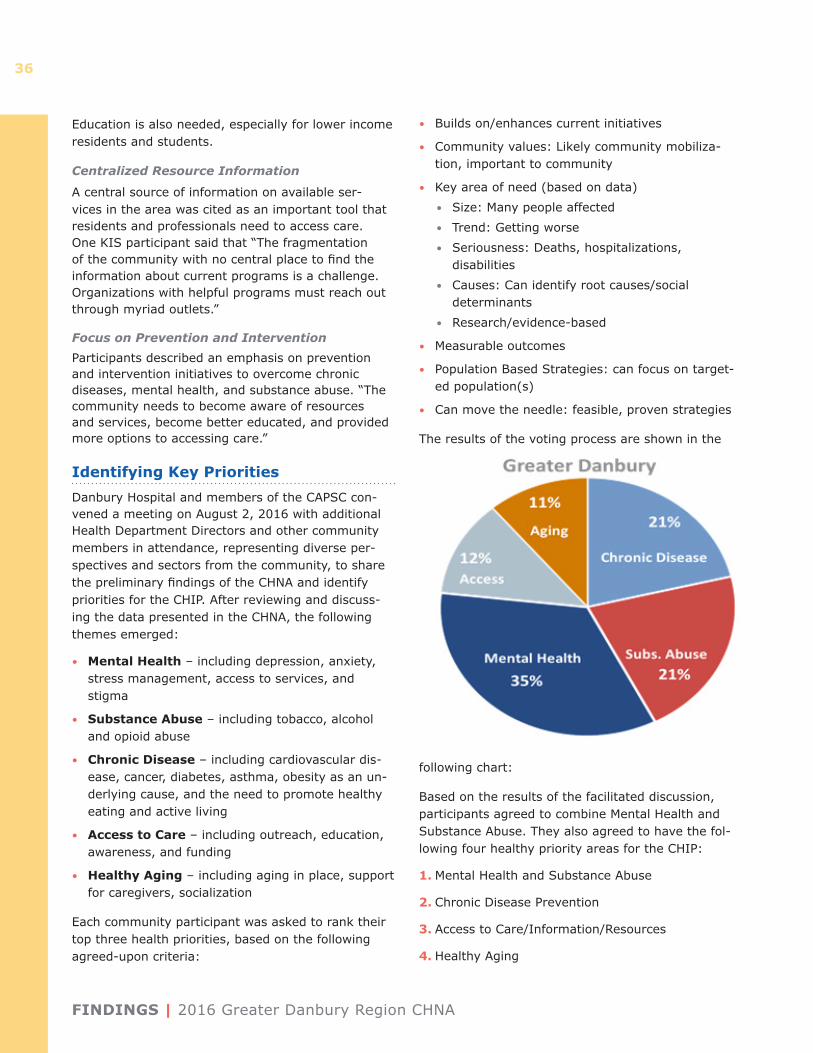
The results of the voting process are shown in the
following chart:
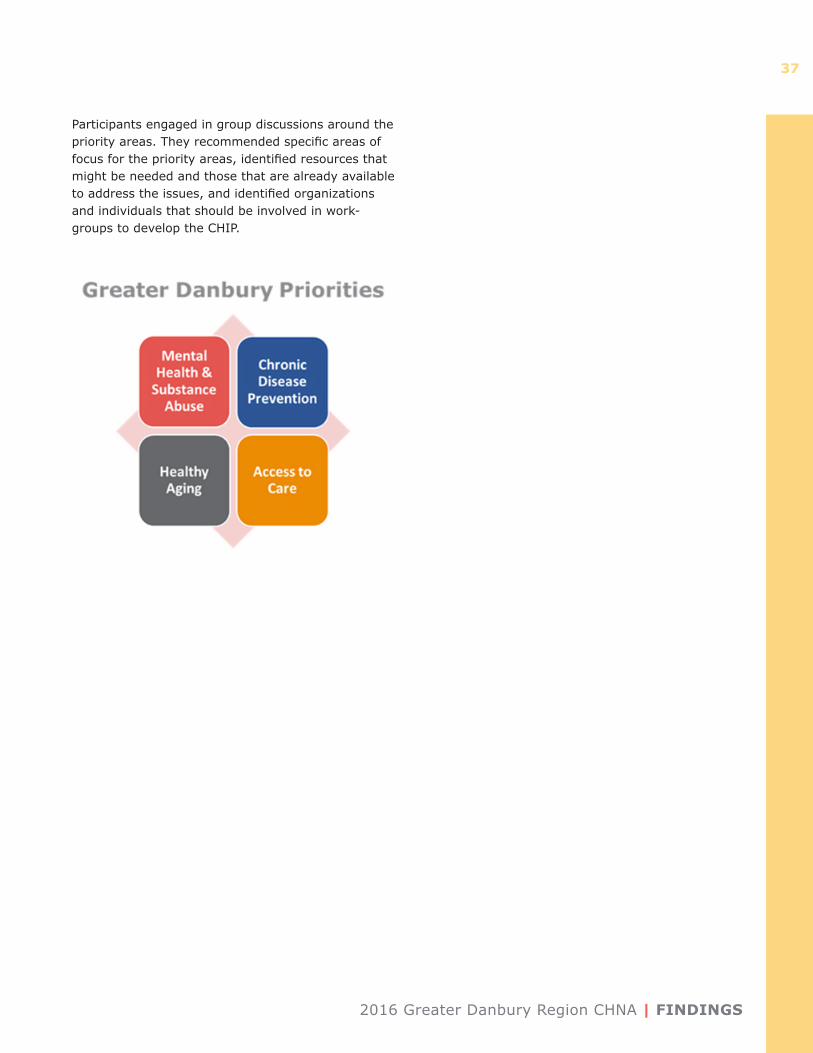
Based on the results of the facilitated discussion, participants agreed to combine Mental Health and Substance Abuse. They also agreed to have the fol-lowing four healthy priority areas for the CHIP:
1. Mental Health and Substance Abuse
2. Chronic Disease Prevention
3. Access to Care/Information/Resources
4. Healthy Aging
2016 Greater Danbury Region CHNA | FINDINGS
37
Participants engaged in group discussions around the priority areas. They recommended specific areas of focus for the priority areas, identified resources that might be needed and those that are already available to address the issues, and identified organizations and individuals that should be involved in work-groups to develop the CHIP.
KEY THEMES AND CONCLUSIONS | 2016 Greater Danbury Region CHNA
38
Key Themes and Conclusions
Integrating regional secondary data, the CWS, and the KIS, ªnd surveys completed by other community organizations, this report provides an overview of the social and economic environment of the Greater Danbury Region that impact health. It analyzes the health conditions and behaviors that affect its residents, and perceptions of strengths and challenges in the current public health and health care systems. Several overarching themes emerged from this analysis:
• Mental health and substance abuse is a top concern for which current services are not meeting community needs. Survey respondents and community forum participants identified a scarcity of mental health services and providers as well as the stigma around seeking mental health services as barriers to accessing care. Residents cited the need for a unified, regional response to mental health issues, especially regarding the opioid addiction crisis.
• As chronic disease and obesity rates rise, residents saw a great need for increased efforts focusing on prevention. Healthy eating and active lifestyles are essential to improving the health of the region. The community needs to be engaged and educated on the seriousness of this issue, and the need to seek medical care instead of postponing it. Barriers for low-income populations in accessing healthy food and engag-ing in physical activity need to be identified and addressed.
• The aging population in the region is a major concern, with special focus on seniors’ needs. The increasing growth rate of seniors in the region is expected to put great demands on the health and social service infrastructure. Concerns were identified around those providing care for elders aging in place, with isolation and lack of engage-ment with available services noted across the region. With the loss of major businesses and the younger population, residents are concerned over the smaller towns’ economic stability and future.
• There is an awareness and identified need for greater collaboration in the community. Residents understand that the health care com-munity has been working to address health needs. However, more effort is needed from all sectors of the community to improve health behaviors and outcomes. Education, outreach, and enhanced re-ferral processes between agencies were identified as essential to improving access to and engage-ment in care across delivery sites.
Next StepsThe data and findings included in the report will serve as the foundation for developing the strategic framework for a data-driven, community-enhanced Community Health Improvement Plan (CHIP). Dan-bury Hospital and the CAPSC will convene work-groups around each of the four priorities identified in the CHNA. The workgroups will develop goals and action plans around their respective priority area.
2016 Greater Danbury Region CHNA | APPENDICES
39
Appendices
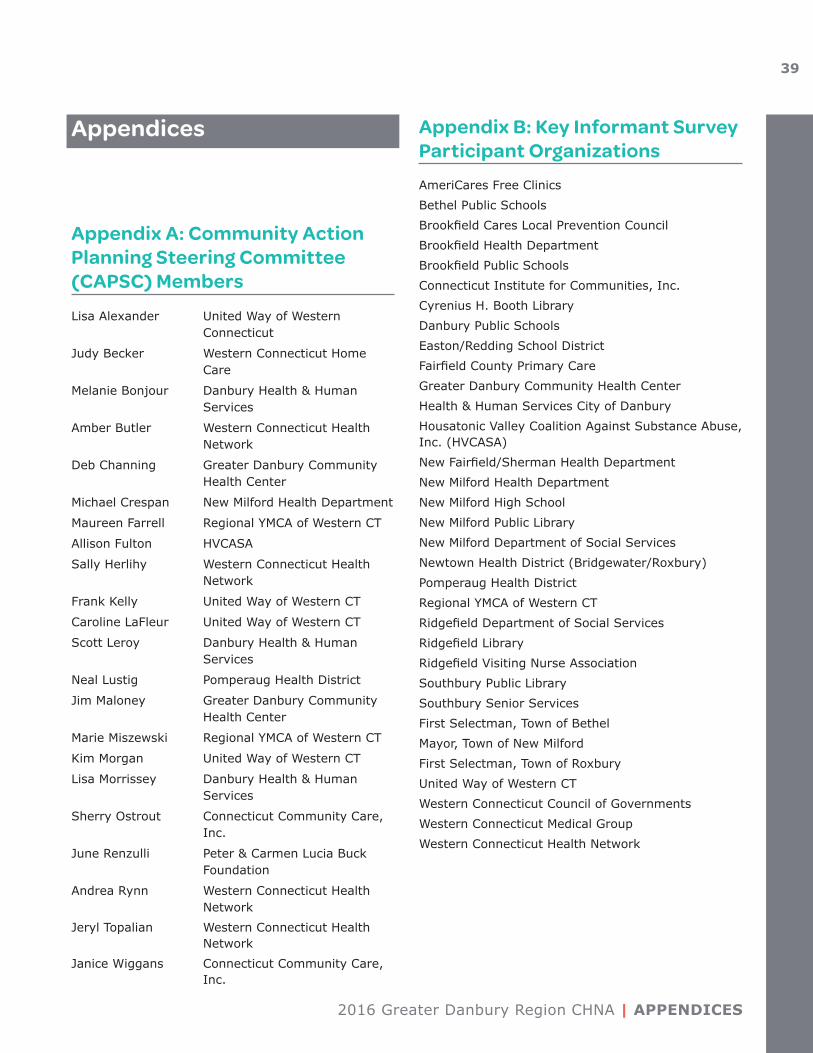
Appendix A: Community Action Planning Steering Committee (CAPSC) Members
Lisa Alexander United Way of Western Connecticut
Judy Becker Western Connecticut Home Care
Melanie Bonjour Danbury Health & Human Services
Amber Butler Western Connecticut Health Network
Deb Channing Greater Danbury Community Health Center
Michael Crespan New Milford Health Department
Maureen Farrell Regional YMCA of Western CT
Allison Fulton HVCASA
Sally Herlihy Western Connecticut Health Network
Frank Kelly United Way of Western CT
Caroline LaFleur United Way of Western CT
Scott Leroy Danbury Health & Human Services
Neal Lustig Pomperaug Health District
Jim Maloney Greater Danbury Community Health Center
Marie Miszewski Regional YMCA of Western CT
Kim Morgan United Way of Western CT
Lisa Morrissey Danbury Health & Human Services
Sherry Ostrout Connecticut Community Care, Inc.
June Renzulli Peter & Carmen Lucia Buck Foundation
Andrea Rynn Western Connecticut Health Network
Jeryl Topalian Western Connecticut Health Network
Janice Wiggans Connecticut Community Care, Inc.
Appendix B: Key Informant Survey Participant Organizations
AmeriCares Free ClinicsBethel Public SchoolsBrookfield Cares Local Prevention CouncilBrookfield Health DepartmentBrookfield Public SchoolsConnecticut Institute for Communities, Inc. Cyrenius H. Booth LibraryDanbury Public SchoolsEaston/Redding School DistrictFairfield County Primary CareGreater Danbury Community Health CenterHealth & Human Services City of DanburyHousatonic Valley Coalition Against Substance Abuse, Inc. (HVCASA)New Fairfield/Sherman Health DepartmentNew Milford Health DepartmentNew Milford High SchoolNew Milford Public LibraryNew Milford Department of Social ServicesNewtown Health District (Bridgewater/Roxbury)Pomperaug Health DistrictRegional YMCA of Western CTRidgefield Department of Social ServicesRidgefield LibraryRidgefield Visiting Nurse AssociationSouthbury Public LibrarySouthbury Senior ServicesFirst Selectman, Town of BethelMayor, Town of New MilfordFirst Selectman, Town of RoxburyUnited Way of Western CTWestern Connecticut Council of GovernmentsWestern Connecticut Medical GroupWestern Connecticut Health Network
APPENDICES | 2016 Greater Danbury Region CHNA
40
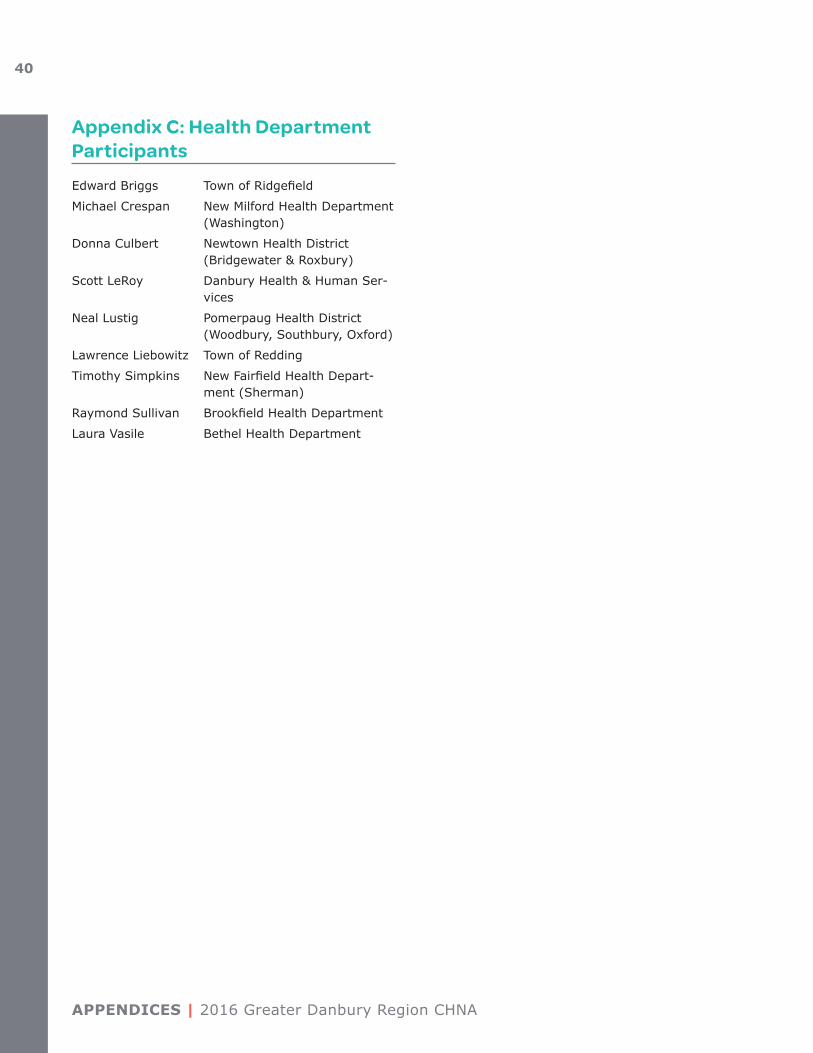
Appendix C: Health Department Participants
Edward Briggs Town of Ridgefield
Michael Crespan New Milford Health Department (Washington)
Donna Culbert Newtown Health District (Bridgewater & Roxbury)
Scott LeRoy Danbury Health & Human Ser-vices
Neal Lustig Pomerpaug Health District (Woodbury, Southbury, Oxford)
Lawrence Liebowitz Town of Redding
Timothy Simpkins New Fairfield Health Depart-ment (Sherman)
Raymond Sullivan Brookfield Health Department
Laura Vasile Bethel Health Department