Embed Size (px)
Citation preview

Xavier Institute of Social Service, Ranchi, India
Understanding resource implications of the “plus” in community
management of rural water supply systems in India: DWSD,
Jharkhand
Prakash C. Dash, Pramil K. Panda, Ragini Sinha and Matthias Javorszky
July 2015
Community Water plus is a 20 case study research project managed by
Cranfield University, UK, on behalf of the Department of Foreign Affairs
and Trade (DFAT) of the Australian Government
COMMUNITY MANAGEMENT OF RURAL WATER SUPPLY Community Water
plus

2
Community Water plus
Executive summary
This case study investigates the support given by the Drinking Water and Sanitation Department
(DWSD), Government of Jharkhand, to community service providers for rural water supply and
assesses the level of service achieved through this arrangement. A majority of consumers in the ‘best
practice’ villages were found to receive acceptable service levels, which confirms the effectiveness of
service provision. However, only 15% to 42% of households are connected to the piped water
scheme, whilst the rest rely on other sources. In best practice villages, 33% of users access quantities
classified as inacceptable and 37% receive water for less than one hour a day, which shows that
major challenges remain.
The study found functioning Village Water and Sanitation Committees (VWSC) that manage water
supply in all villages. The community is involved in decision-making through village meetings. The
type of service provision was classified as community management with direct support, bordering on
direct public provisioning, especially because of the heavy financial subsidy for operational expenses.
The VWSCs have effective mechanisms for accounting and managing cash, whilst improvements
could be made in the area of water security planning. Each VWSC has a ‘Jal Sahiya’ (water volunteer),
selected from the daughters-in-law of the village, who acts as a treasurer and is responsible for water
quality testing.
DWSD is responsible for implementing rural water supply schemes and supporting service providers.
The department scored highly on its technical performance and interaction with external institutions.
Support is given by training committee members and through technical and financial assistance for
operation and maintenance. Systematic retraining new committee members would ensure that
capacity is not lost when Jal Sahiyas change. In the studied villages, the department often pays for
spares and some minor repairs are done by department staff, however, according to DWSD
guidelines the VWSC is responsible for all operation and maintenance, which shows the somewhat
unclear support arrangement. The department provides a matching grant to the audited records of
user tariff collection, which incentivises VWSC to collect them. Furthermore, the electricity bills are
paid by the department, which represents a major subsidy.
Total recurrent support costs were found to be INR 69 per person and year. Of this, INR 35 represent
the electricity support for operation and maintenance and INR 33 for general operations support.
Jharkhand Summary Cost Table - calculated as the average cost per person, that is averaging across the three 'successful' villages
Source of funds Use of funds - implementation
CapEx
hardware
CapEx
softwareCAPEX TOTAL
OpEx
labour &
materials
OpEx
power
OpEx bulk
water
OpEx
enabling
support
CapManEx
RECURRENT
EXPENDITURE
TOTAL
Community/consumers - - - 21INR - - - 7INR 28INR
Local self-government - - - - - - - - -
- - - - - - - - -
State government entity - - - - - - - - -
State water supply agency 1,815INR 8INR 1,823INR 33INR 35INR - 1INR - 69INR
National Government 1,815INR - 1,815INR - - - - - -
NGO national & international - - - - - - - - -
International donor - - - - - - - - -
TOTALS 3,629INR 8INR 3,638INR 55INR 35INR - 1INR 7INR 97INR
Median of 20 case studies 3,231INR 207INR
'Plus' %age 100% 100% 100% 61% 100% - 100% 0% 71%
Median of 20 case studies 95% 57%
Notes: CapManEx is only for the village Bero, as no data could be obtained for the other best practice villages
Use of funds - annual recurrent

3
Community Water plus
Costs for initial training and capacity building were estimated at INR 8 per person, which is less than
1% of the costs for initial construction of infrastructure. The service providers pay their staff salaries
from tariff collection, which represents about 29% of operating expenses.
The Financial Flow Diagram, below, has been developed as an advocacy and communication tool. It
aims to assist policy-makers and programme developers to visualise the ‘plus’ resource implications
necessary for sustainable community-managed rural water supply services.

4
Community Water plus
Acknowledgements
This case study research was led by Mr. Prakash C. Dash and Dr. Pramil K. Panda and was assisted by Ms. Ragini Sinha and Mr. Suresh Sahu. Additional support for writing the report was given by Matthias Javorszky. Paul Hutchings, Cranfield University, reviewed and edited the report before publication. Dr Snehalatha Mekala was the national research coordinator. We wish to put on record our sincere gratitude to the officials and staff of Ranchi (West) Division, Drinking Water and Sanitation Department, Government of Jharkhand for creating the enabling conditions to undertake this case study. We extend our heartfelt thanks to the officials and staffs of State Programme Management Unit, Drinking Water and Sanitation Department, Government of Jharkhand for facilitating in the selection of study villages. We are highly indebted to all the Mukhiya (president of VWSC), Jal Sahiya (treasurer of VWSC) and VWSC members of four study villages: Bero, Khijri, Rai Bazar and Brambe for extending their cooperation and contributing their valuable time during the interviews and focus group discussions. We are highly grateful to all the people who heartily participated in the focus group discussions and net-mapping exercises and helped us understand their point of view on the topic. Finally, we also would like to appreciate all the sample households for providing information during the household survey.
This research project has investigated twenty reportedly successful community-managed rural water
supply programmes and approaches across India, from which we have subsequently developed
understanding on the support needed to make community-management service provision successful
and sustainable. The project has been implemented by a consortium of partners, including: the
Administrative Staff College of India (ASCI), the Centre of Excellence for Change (CEC), Malaviya
National Institute of Technology (MNIT), the Xavier Institute of Social Service (XISS) and IRC, The
Netherlands with overall project coordination provided by Cranfield University, UK.
The research has been funded by the Australian Government through the Australian Development Awards Research Scheme, Australian Aid, Department of Foreign Affairs and Trade, under an award titled ‘Community Management of Rural Water Supply Systems in India’. The views expressed in this report are those of the project and not necessarily those of the Australian Government. The Australian Government accepts no responsibility for any loss, damage or injury, resulting from reliance on any of the information or views contained in this report.
The twenty case studies
1 Jharkhand 11 Punjab
2 Madhya Pradesh 12 Uttarakhand
3 Odisha 13 Kerala (Kodur)
4 Chhattisgarh 14 Kerala (Nenmeni)
5 Meghalaya 15 Gujarat (Ghandinagar)
6 Rajasthan 16 Gujarat (Kutch)
7 West Bengal 17 Tamil Nadu (Morappur)
8 Telangana 18 Tamil Nadu (Kathirampatti)
9 Karnataka 19 Maharashtra
10 Himachal Pradesh 20 Sikkim

5
Community Water plus
Contents
Executive summary ................................................................................................................................. 2
Acknowledgements ................................................................................................................................. 4
1 Introduction ..................................................................................................................................... 8
1.1 Overall objectives of the research and research questions .................................................... 8 1.2 Concepts and methodology .................................................................................................... 9 1.3 Case study selection .............................................................................................................. 12 1.4 Data collection and analysis .................................................................................................. 13
2 Enabling Support Environment Level ............................................................................................ 15
2.1 Background and origin of the ESE, and context in which it operates .................................... 15 2.2 Enabling support environment description ........................................................................... 15 2.3 Enabling Support Environment Support Activities ................................................................ 17 2.4 Enabling environment performance indicators ..................................................................... 20 2.5 Enabling environment institutional assessment ................................................................... 21 2.6 Enabling environment partnering assessment ...................................................................... 23
3 Community Service Provider Level ................................................................................................ 25
3.1 Context .................................................................................................................................. 25 3.1.1 Socio-economic status of the villages ........................................................................... 27
3.1.2 Infrastructure snapshot ................................................................................................. 28
3.2 Community service provider descriptors .............................................................................. 29 3.3 Community service provider indicators ................................................................................ 30
3.3.1 Governance and staff .................................................................................................... 30
3.3.2 Finance and tariff collection .......................................................................................... 31
3.3.3 Technical Performance .................................................................................................. 32
3.4 Community service provider participation assessment ........................................................ 33 3.5 Community service provider costs ........................................................................................ 35
4 Household Service levels ............................................................................................................... 37
4.1 Coverage ................................................................................................................................ 37 4.2 Service levels ......................................................................................................................... 37 4.3 Equity ..................................................................................................................................... 38 4.4 User satisfaction .................................................................................................................... 39
5 Costing ........................................................................................................................................... 40
5.1 Capital Costs .......................................................................................................................... 40 5.2 Recurrent costs ...................................................................................................................... 40 5.3 Capital maintenance .............................................................................................................. 41 5.4 Overview of costs .................................................................................................................. 41
6
Community Water plus
6 Conclusions .................................................................................................................................... 43
References ............................................................................................................................................. 46
Appendices ............................................................................................................................................ 47
Institutional assessment tables ......................................................................................................... 47 Partnership assessment tables .......................................................................................................... 50 Service level tables ............................................................................................................................ 52
List of tables
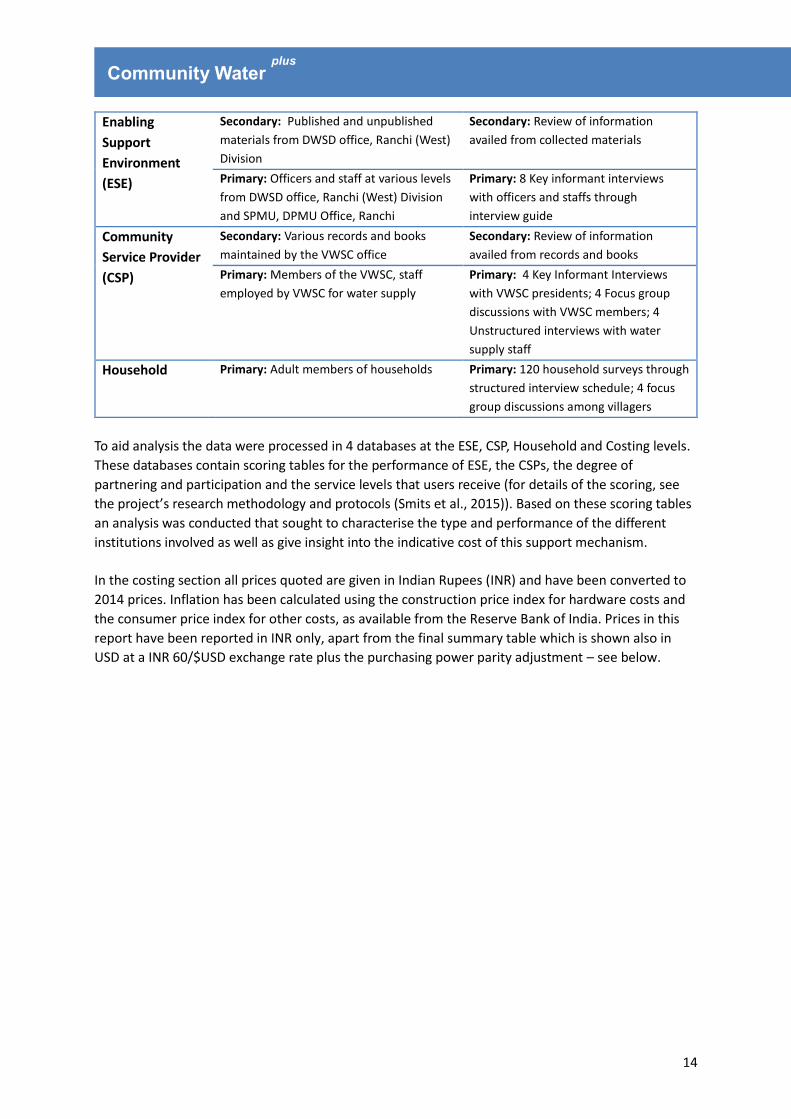
Table 1: Data sources and methods of data collection .......................................................................... 13
Table 2: ESE descriptors ......................................................................................................................... 16
Table 3: Support provided by DWSD ..................................................................................................... 18
Table 4: Activity and responsibility matrix ............................................................................................ 19
Table 5: ESE performance indicators ..................................................................................................... 20
Table 6: Basic village information .......................................................................................................... 26
Table 7: Social indicators of surveyed households ................................................................................ 27
Table 8: Economic indicators of surveyed households .......................................................................... 28
Table 9: Coverage with piped water ...................................................................................................... 29
Table 10: CSP descriptors ...................................................................................................................... 30
Table 11: Gender balance in the committees ....................................................................................... 31
Table 12: CSP performance indicators .................................................................................................. 32
Table 13: Recurrent costs at CSP level .................................................................................................. 35
Table 14: Water sources of surveyed households ................................................................................. 37
Table 15: Service levels for best practice villages (n=90) ...................................................................... 37
Table 16: Service levels for control village (n=30) ................................................................................. 38
Table 17: Water source by caste ............................................................................................................ 38
Table 18: User satisfaction with water supply ....................................................................................... 39
Table 19: Capital expenditure ................................................................................................................ 40
Table 20: Recurrent costs paid by DWSD .............................................................................................. 41
Table 21: Overview of O&M costs ......................................................................................................... 42
Table 222 Summary Cost Table (INR) .................................................................................................... 42
Table 23 Summary Cost Table (PPP USD$) ............................................................................................ 42
Table 24: Service levels for household connections in practice villages (n=43) .................................... 52
Table 25: Service levels for household connections in control village (n=17) ....................................... 52
Table 267: Service levels in Khijiri village (n=30) ................................................................................... 52
Table 278: Service levels in Rai Bazaar village (n=30) ............................................................................ 53
Table 289: Service levels in Brambe village (n=30) ................................................................................ 53
List of figures
Figure 1: Application of plus approaches in relation to demand and costs of water supplies. ............ 10

7
Community Water plus
Figure 2: Elements of the research ........................................................................................................ 11
Figure 3: Location of Ranchi district in the state of Jharkhand (Source: maps.google.com .................. 13
Figure 4: ESE institutional assessment .................................................................................................. 21
Figure 5: ESE partnering assessment ..................................................................................................... 23
Figure 6: Village locations (source: maps.google.com) ......................................................................... 25
Figure 7: Service provider participation assessment ............................................................................. 33
Figure 8: Typology of management for the four service providers ...................................................... 44
The twenty Community Water plus case studies are available also in four page summaries, both in
Indian Rupees and in US Dollar (PPP) versions, accessible from the project website. A Policy Brief and
a Research Brief There is also a synthesis report available, published by Earthscan, London.

8
Community Water plus
1 Introduction
This report is part of the Community Water plus series of case studies on community-managed rural
water supply in India. It documents the support provided by the Drinking Water and Sanitation
Department, (DWSD), Government of Jharkhand to the Village Water and Sanitation Committees
(VWSC) in managing their pipe water supply system for providing drinking water to the villagers of
Ranchi district. This report describes this support arrangement in detail, and assesses the effects of
the support in terms of service delivery. It also provides an approximation of the costs involved in
support.
Community management has long been recognised to be critical for rural water supply services.
Indeed, community management has contributed significantly to improvements in rural water
supplies. However those supplies are only sustainable when communities receive appropriate levels
of support from government and other entities in their service delivery tasks. This may consist of easy
access to call-down maintenance staff from government entities, or support from civil society
organisations to renew their management structures and they may need to professionalize - that is,
outsourcing of certain tasks to specialised individuals or enterprises.
In spite of the existence of success stories in community management, mechanisms for support and
professionalization are often not institutionalised in policies and strategies. Success stories then
remain pockets of achievement. Also, the necessary support comes at a price, and sometimes a
significant one – though in many cases there is lack of insight into the real costs of support.
Community Water Plus (Community management of rural water supply systems) is a research project
which aims to gain further insights into the type and amount of support that is needed for
community-managed water services to function effectively.
1.1 Overall objectives of the research and research questions
This research investigates 20 case studies of reportedly ‘successful’ community-managed rural water
supply programmes across India in order to determine the extent of direct support provided to
sustain services with a valid level of community engagement. The expected outcome – based on the
empirical evidence from the 20 cases - of the project is to have a better understanding of the likely
resource implications of delivering the ‘plus’ of successful community management ‘plus’, for
different technical solutions, at a level of competence and bureaucratic involvement that is indicative
of normal conditions across many low-income countries, and the possible trajectories for institutional
development of effective support entities for community management.
In order to achieve that outcome, the project focuses on the following main research question:
What type, extent and style of supporting organisations are required to ensure sustainable
community managed water service delivery relative to varying technical modes of supply?
This is further broken down in the following specific questions:
What are the current modalities of successful community management and how do they
differ in their degrees of effectiveness?

9
Community Water plus
What supporting organisations are in place to ensure sustainable water service delivery
relative to alternative modes of supply?
What are the indicative costs of effective support organisations?
Can particular trajectories of professionalising and strengthening the support to rural water
be identified?
This report provides the results from the case study of community-managed pipe water supply
systems in Ranchi district (Jharkhand). The Village Water and Sanitation Committees (VWSC) that
operate as the community service providers in the villages are supported by the Drinking Water and
Sanitation Department (DWSD), Government of Jharkhand. The report investigates both the service
provision and support received.
This report is divided into 7 sections. Following this introduction, Chapter 2 gives an overview of the
conceptual framework and methodology of the research. The following four chapters follow the
elements of research in the project. Chapter 3 deals with the Enabling Support Environment, in this
case the DWSD, Government of Jharkhand. Its role in supporting rural water supply is explained
followed by an assessment of its performance and partnering. In Chapter 4, the four community
service providers are introduced and their performance assessed. Chapter 5 presents the results
from the household surveys and assesses service levels users receive. This is followed by an analysis
of the costs associated with support in Chapter 6. Finally, Chapter 7 gives a summary and of the
findings and conclusion.
1.2 Concepts and methodology
Community-management remains the predominant approach for rural water supply services delivery
in low-income countries. It originated in response to the perceived limitations of the ‘public works
department’ phase, and built on the insights around appropriate technology, eventually leading to
the present ‘community management’ paradigm. Though this has undoubtedly brought benefits
(Schouten and Moriarty, 2003; Harvey and Reed, 2006; Lockwood and Smits, 2011) and is often the
most appropriate service delivery model, evidence shows that the community management
approach is necessary but not sufficient for sustainable services (Harvey and Reed, 2006; RWSN,
2010).
The hypothesis is that sustainable services delivery requires a combination of community
engagement and community management of appropriate technology with the necessary government
institutional support (potentially including a level of out-sourcing to the private sector). We see that
there is the need to professionalise the support elements of community-management in order to
provide on-going support. The needs and possibilities for this differ widely and the need for
institutional/functional segmentation and resulting differentiation of support, most likely according
to technology use, needs to be further investigated.
Ultimately, we believe that for successful community management, proper support is needed to
deliver water services that are: effective in terms of quantity, accessibility, quality and reliability;
equitable in that all rural households can access services irrespective of gender or social status,
indeed that there is a bias towards the poorest who most benefit from good public health provision;
sustainable or viable, in that there are adequate resources available, from whoever, to ensure the
continuation of the service; efficient such that the minimum resources are used to deliver the desire

10
Community Water plus
quality of outputs; and replicable such that approaches can work at scale across different localities,
not being dependent upon particular situations or leaders.
Building on these principles and applying general insights from the theoretical literature on
participation and partnerships, the research identifies several “community-engaged approaches” to
ensuring the fulfilment of the human rights to water. These are illustrated in Figure 1 below and
include: 1) direct provision with community involvement, 2) community management with direct
support and 3) professionalised community-based management. These three broad approaches
represent different levels of balance of what communities themselves do, and the extent to which
they are supported by external agencies. We believe that these different approaches are closely
related to factors such as average income levels, cost of technology, development status and context
and that across the demand and cost continuum it is expected that the intensity of community
involvement will vary.
Figure 1: Application of plus approaches in relation to demand and costs of water supplies.
Source: adapted from Franceys and Gerlach (2008) after Stern et al. (2007)
Key to all three models is the presence of what is called an ‘enabling support environment’ within the
Indian context. The enabling support entities (ESE), that make up this environment, fulfil what
Lockwood and Smits (2011) call service authority and monitoring functions, such as planning,
coordination, regulation, monitoring and oversight, and direct support functions, such as technical
assistance. The main objective of such support is to help communities in addressing issues they
cannot solve on their own and gradually improve their performance in their service provider
functions. Within this research, we will seek to classify the varying types of community management
and the necessary enabling support environment, and get a further understanding of which models
are functioning best. An interrelated objective will be to identify the resource implications of this
plus, economic as well as financial, which is needed to deliver demonstrably successful, sustainable
water services across these typologies.

11
Community Water plus
The focus of this research is thus to investigate successful cases of community-managed rural water
supplies, and in that assess the type and size of support that has been deployed to make it successful.
What can be considered successful can be understood at various levels: at the level of service that
users receive, at the level of the service provider carrying out its tasks with a certain degree of
community engagement, and at the level of partnership between the support entities and the service
provider. The research will therefore assess the degrees of success across various elements, as
summarised in Figure 2 below, and further elaborated below.
Figure 2: Elements of the research
This implies the following:
1. Enabling support environment. To assess the degree of success in support, we look into the
following elements:
- We describe the enabling support environment model, by defining which type of entity (or
entities) fulfil these roles, and the relationships between them.
- Performance of the enabling support environment. This refers to the degree to which the
support entities are fulfilling their roles adequately, against a set of performance indicators.
- Institutional performance. This entails the internal institutional process such as leadership,
organisational culture and community orientation that allow the external performance to
happen.
- Degree of partnering. This is a description of the type of partnering between the enabling
support entity and community service providers, using the partnership categories defined by
Demirjian (2002).
4. Household service levels and
infrastructure status
3. Community service provider - Service delivery model - Performance - Degree of community
engagement
5. C
on
text
ual
fac
tors
: tec
hn
olo
gy, e
nab
ling
envi
ron
men
t,
sett
lem
ent
typ
e, p
ove
rty
situ
atio
n, w
ater
res
ou
rces
1. Enabling support environment
- Model - Performance
- Institutional performance - Degree of partnering
6. Trajecto
ry of d
evelo
pm
ent o
f com
mu
nity m
anagem
ent p
lus
2. Resources dedicated to support
Critical Level of Analysis
Validation level of analysis

12
Community Water plus
2. Resources dedicated to support. This refers to the resources dedicated to the various functions
carried out by the enabling support entities. This refers both to the monetary costs (as per the
cost categories) as well as non-monetary ones, such as presence of skilled staff and political
capital. We will quantify both financial and human resources and provide a qualitative description
of other resources, like political capital, that are spent on this. In this, a differentiation will be
made between the different life-cycle cost categories: Capital Expenditure (CapEx) during project
implementation- particularly the ‘software’ part, the Operation and Minor maintenance
Expenditure (OpEx), Capital Maintenance Expenditure (CapManEx) and direct support costs
(Fonseca et al., 2011).
3. Community service provider. To validate that the support has been successful, we assess the
degree of success of the service providers supported by the ESE through three elements:
- Service delivery model. This refers to description of the entity that carries out day-to-day
operations and maintenance and administration, and the degree to which the entity may have
professionalised certain tasks, e.g. to a paid-for caretaker or mechanic, and its scope and scale
of operations.
- Performance. This refers to the extent to which the service provider is fulfilling its roles in
operation, maintenance and administration adequately, as defined by formal regulations or
general good business practices.
- Degree of community engagement in service provision. We believe that community
engagement in service provision is a good thing per se, as it empowers users to take
appropriate levels of responsibility and oversight over their water services. We will assess the
degree of community engagement, based on the ladders of participation (based on Pretty
(1994), adapted from Adnan et al. (1992).
4. Household service levels and infrastructure status. Whether a water service can be considered
successful is eventually measured by the characteristics of the water supply that users eventually
receive, i.e. the service level. In this, we will look at aggregate service levels, as well as their
break-down between the constituting elements, including water quantity, quality and
accessibility. In addition, it will be disaggregated for different groups within a community, to
assess equity in service levels. We will complement data on service levels, with data on the status
of the infrastructure.
5. Contextual factors. We recognise that what might be required to be successful in one case may
not be adequate to be successful in another. Specifically, we will describe the type of technology
employed, the socio-economic and poverty status of the community and the type of settlement
and the water resources situation.
6. Trajectories. Last, but not least, we recognise that the organisational partnerships between
communities, service providers and support agents have a particular history and trajectory of
development that is often not replicable to another situation. Still, insights in the various
trajectories of development of these plus partnerships may help identify common elements to
take into account when promoting such partnerships elsewhere. Therefore the research provides
a qualitative description of the trajectories of development of partnerships will be undertaken.
1.3 Case study selection
In selecting twenty successful case studies, the research has scanned over 161 community-managed
rural water supply programmes in India, covering a combined population of nearly 50 million people.

13
Community Water plus
Through a detailed process of selection using both secondary data and pilot visits, 20 programmes
were selected to become case studies.
The research is interested in investigating (relative) success across a variety of socio-economic,
political and environmental contexts that are indicative of the ‘normal operating conditions’ in India.
It was therefore important that the research took up case studies in some of the poorer states of
India, even if the level of success found there was not as high as can be found in some of the richer
states. In this regard, part of the scanning exercise was devoted to finding successful cases in such
states that led to the selection of a case study focused on the Drinking Water and Sanitation
Department (DWSD), Government of Jharkhand. The DWSD is charged with providing potable and
sustainable drinking water supply and sanitation services to the people of Jharkhand. In rural areas, it
works through a model in which it supports Village Water and Sanitation Committees (VWSCs) that
take on the service delivery tasks associated with water supply.
Consultation with DWSD staff led to the selection of high performing villages under this scheme.
Based on this exercise, it was decided to focus on the Ranchi (West) division with Bero, Khijri and Rai
Bazar villages taken as examples of good practice. Brambe village was taken as control village since
despite being supported by DWSD, this village does not get the same amount of support compared to
the other villages. A map showing the location of Ranchi district in the state is given in Figure 3.
Figure 3: Location of Ranchi
district in the state of
Jharkhand (Source:
maps.google.com
1.4 Data collection
and analysis
The data collection for this case
study was designed to gather information on each of the research elements using both primary and
secondary data. The methods of data collection involved key informant interviews, focus group
discussions and household surveys. Table 1 depicts the sources of data and methods of data
collection at different levels. The data collection was carried out from 2 August to 17 September
2014.
Table 1: Data sources and methods of data collection
Unit of Analysis Sources of Data Methods of Data Collection
14
Community Water plus
Enabling
Support
Environment
(ESE)
Secondary: Published and unpublished
materials from DWSD office, Ranchi (West)
Division
Secondary: Review of information
availed from collected materials
Primary: Officers and staff at various levels
from DWSD office, Ranchi (West) Division
and SPMU, DPMU Office, Ranchi
Primary: 8 Key informant interviews
with officers and staffs through
interview guide
Community
Service Provider
(CSP)
Secondary: Various records and books
maintained by the VWSC office
Secondary: Review of information
availed from records and books
Primary: Members of the VWSC, staff
employed by VWSC for water supply
Primary: 4 Key Informant Interviews
with VWSC presidents; 4 Focus group
discussions with VWSC members; 4
Unstructured interviews with water
supply staff
Household Primary: Adult members of households Primary: 120 household surveys through
structured interview schedule; 4 focus
group discussions among villagers
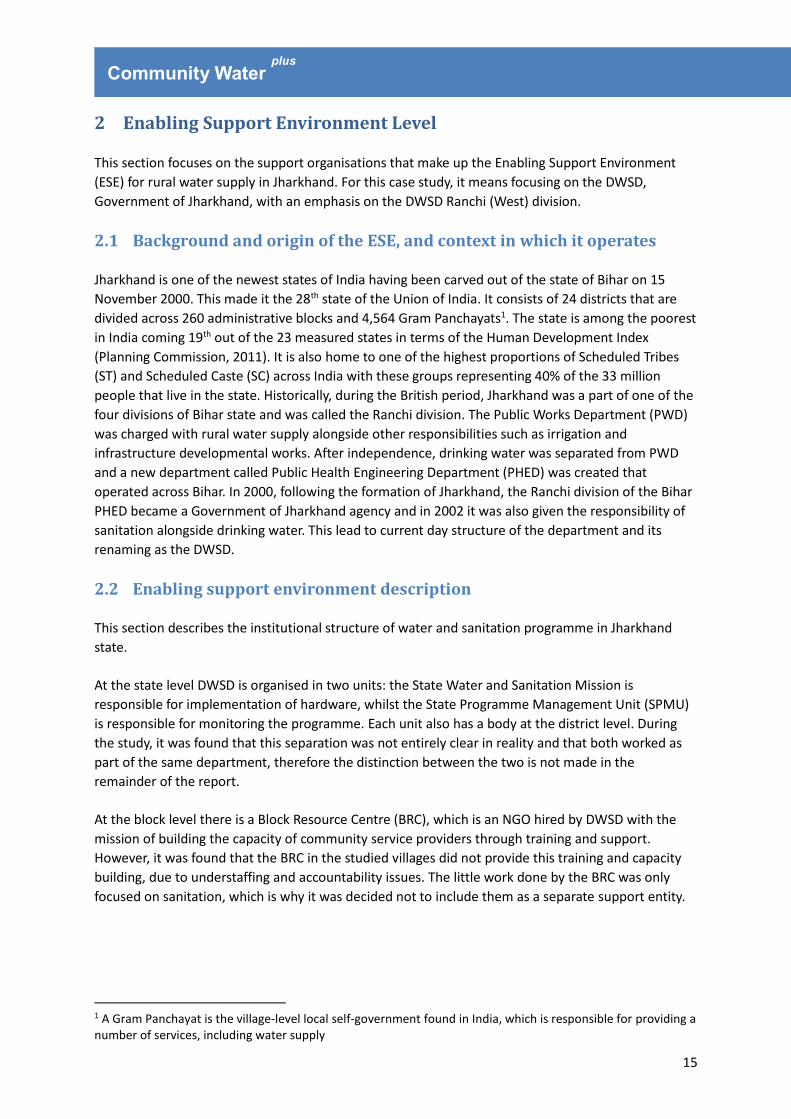
To aid analysis the data were processed in 4 databases at the ESE, CSP, Household and Costing levels.
These databases contain scoring tables for the performance of ESE, the CSPs, the degree of
partnering and participation and the service levels that users receive (for details of the scoring, see
the project’s research methodology and protocols (Smits et al., 2015)). Based on these scoring tables
an analysis was conducted that sought to characterise the type and performance of the different
institutions involved as well as give insight into the indicative cost of this support mechanism.
In the costing section all prices quoted are given in Indian Rupees (INR) and have been converted to
2014 prices. Inflation has been calculated using the construction price index for hardware costs and
the consumer price index for other costs, as available from the Reserve Bank of India. Prices in this
report have been reported in INR only, apart from the final summary table which is shown also in
USD at a INR 60/$USD exchange rate plus the purchasing power parity adjustment – see below.
15
Community Water plus
2 Enabling Support Environment Level
This section focuses on the support organisations that make up the Enabling Support Environment
(ESE) for rural water supply in Jharkhand. For this case study, it means focusing on the DWSD,
Government of Jharkhand, with an emphasis on the DWSD Ranchi (West) division.
2.1 Background and origin of the ESE, and context in which it operates
Jharkhand is one of the newest states of India having been carved out of the state of Bihar on 15
November 2000. This made it the 28th state of the Union of India. It consists of 24 districts that are
divided across 260 administrative blocks and 4,564 Gram Panchayats1. The state is among the poorest
in India coming 19th out of the 23 measured states in terms of the Human Development Index
(Planning Commission, 2011). It is also home to one of the highest proportions of Scheduled Tribes
(ST) and Scheduled Caste (SC) across India with these groups representing 40% of the 33 million
people that live in the state. Historically, during the British period, Jharkhand was a part of one of the
four divisions of Bihar state and was called the Ranchi division. The Public Works Department (PWD)
was charged with rural water supply alongside other responsibilities such as irrigation and
infrastructure developmental works. After independence, drinking water was separated from PWD
and a new department called Public Health Engineering Department (PHED) was created that
operated across Bihar. In 2000, following the formation of Jharkhand, the Ranchi division of the Bihar
PHED became a Government of Jharkhand agency and in 2002 it was also given the responsibility of
sanitation alongside drinking water. This lead to current day structure of the department and its
renaming as the DWSD.
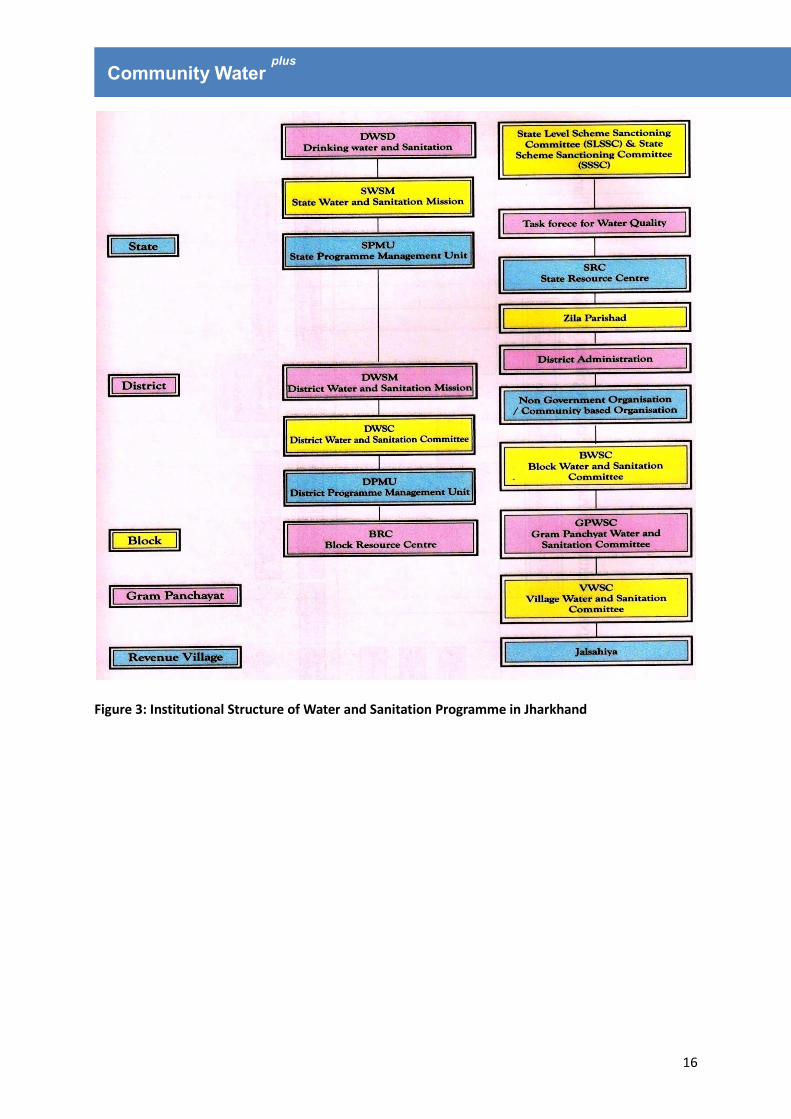
2.2 Enabling support environment description
This section describes the institutional structure of water and sanitation programme in Jharkhand
state.
At the state level DWSD is organised in two units: the State Water and Sanitation Mission is
responsible for implementation of hardware, whilst the State Programme Management Unit (SPMU)
is responsible for monitoring the programme. Each unit also has a body at the district level. During
the study, it was found that this separation was not entirely clear in reality and that both worked as
part of the same department, therefore the distinction between the two is not made in the
remainder of the report.
At the block level there is a Block Resource Centre (BRC), which is an NGO hired by DWSD with the
mission of building the capacity of community service providers through training and support.
However, it was found that the BRC in the studied villages did not provide this training and capacity
building, due to understaffing and accountability issues. The little work done by the BRC was only
focused on sanitation, which is why it was decided not to include them as a separate support entity.
1 A Gram Panchayat is the village-level local self-government found in India, which is responsible for providing a number of services, including water supply
16
Community Water plus
Figure 3: Institutional Structure of Water and Sanitation Programme in Jharkhand

Figure 4: Organogram of Drinking Water and Sanitation Department, Jharkhand.

16
Community Water plus
The above institutional set-up and internal structure is designed to enable the DWSD to meet its
stated vision and mission:
Vision of DWSD
Ensuring safe, sustainable and adequate drinking water cost effectively and contribution
towards a healthy and dignified life through good sanitation and hygiene practices with
community involvement for the people of Jharkhand.
Every household must always be clean
Every household must use safe water.
Mission of DWSD
To Improve the quality of life through improved use of safe drinking water; thereby reducing
incidences of water borne diseases and enhancement of productivity of people.
To provide knowledge of cost effective technological option for enhanced access to water for
informed choice making by community.
To involve local communities in operation, maintenance, usage and water tariff collection
leading to improved functioning and usage and empowerment of user groups.
To facilitate the conversion of latent demand for better sanitation and hygiene solutions
through enhanced awareness leading to finally adoption and usage.
To ensure the catalytic role schools and children can play in transforming rural hygiene
practices.
From reading the vision and mission it is clear that the DWSD has an integrated approach focusing on
both water supply and sanitation to improved public health and wellbeing. For this case study we
have focused on the role the department plays in water supply but acknowledge this is only part of
the support it provides to villages.
Now focusing on the DWSD at a more local scale the exact set-up for the DWSD Ranchi (West)
division is described in Table 2. The division provides support to 745 VWSCs covering a total
population of 11,893,459 people as per 2011 census. For this purpose, it employs 80 full time staff
that comprises Engineers, Technical Staff, Finance Staff, Administrative Staff and Logistical Support
Staff. Out of them, 17% have professional degrees like B. Tech. and Diploma in Engineering, 23% have
either graduate or post graduate degrees, 19% reach an intermediate education status, 26% have
studied between 6th to 10th standard and 15% have studied between the 1st to 5th standard. This
indicates a relatively highly skilled workforce with those working at higher levels or in specialist
technical roles having the appropriate qualifications for their posts. However, there is a strong
emphasis on technical skills and engineering and little know-how in areas such as community
mobilisation or social sciences.
Table 2: ESE descriptors
Parameter Number
Total Number of VWSC Supported 745
Total Number of Population Served 11,893,459
Total Number of Full Time Employed Staff 80

17
Community Water plus
2.3 Enabling Support Environment Support Activities
This section describes the support activities of DWSD and the broader set-up of the ESE. As can be
seen from Table 3, the DWDS generally follows a supply-driven model in which it provides a number
of support activities. It is supposed that the high level of support provided through the DWDS is
because the VWSCs in the villages are in a relative nascent stage of development and yet to be strong
enough to take on the financial and administrative challenges associated with water supply.
In the studied villages a very close, but informal, support relationship with department engineers
could be observed. In two villages, Bero and Khijri, the Junior Engineers responsible for the respective
area have their offices next to the water supply schemes. Therefore, they are often approached by
VWSC members with questions about scheme management, repairs or other issues. The two other
schemes also get frequent visits by Junior and Assistant Engineers; Rai Bazaar because it is a relatively
new scheme and therefore gets a lot of attention from the department and Brambe because the
village is centrally located and the engineers pass through it regularly and therefore visit the VWSC.
Part of regular maintenance is also done by department staff. In all villages plumbers, mechanics,
electricians and masons employed by DWSD provide assistance for maintenance on a request basis.
DWSD furthermore pays the electricity bills for all studied schemes, which represent a major part of
operating expenditure. Further capacity building of these community service providers, along with
increased tariffs and a higher number of consumers would be needed if the DWDS were to reduce its
support but in the meantime it is necessary for the DWDS to maintain this level of support.
Some support activities should be performed by the Block Resource Centre (BRC), an NGO. However,
no evidence of this support could be found. The activities done by BRC were found to be very limited,
and completely confined to sanitation. Ensuring that BRC performs its duties, or finding alternative
ways of conducting these activities would improve the overall support environment.
DWSD is training a VWSC member, the ‘Jal Sahiya’, on minor repairs, water quality testing and book
keeping. However there is no mechanism for retraining if the Jal Sahiya in a village changes.
Implementing a system where a newly appointed Jal Sahiya receives training would ensure that
capacity is not lost.

18
Community Water plus
Table 3: Support provided by DWSD
Type of activity Is this type
of activity
undertaken?
Modality
of
support
Way of providing support
Monitoring
and control
(auditing)
Yes Supply
based
Monitoring of the scheme functionality is done by DWSD
engineers. For the purpose of auditing, private auditors
are hired on need basis and they submit their audit
report of the VWSCs to DWSD
Water quality
testing
Yes Supply
based
Water quality testing kits are provided to VWSCs,
responsibility lies with the Jal Sahiya. Testing should be
done before and after the monsoon, however not done in
all villages. DWSD engineers also supposed to take water
samples twice a year
Water
resources
management
No
Technical
assistance
Yes Both (On
request
and supply
based)
Engineers of DWSD provide technical support to VWSCs
in preparation of Detailed Project Reports2 for
establishment of new structures, extension and in case of
major break downs. DWSD also provides support for
day-to-day operation, e.g. management of the scheme,
plumbing and electrical work.
Conflict
Management
No The BRC should provide support for conflict management,
however no evidence of this support could be found
Support in
identifying
investments
needs
Yes Both (On
request
and supply
based)
Support in identifying hamlets to expand water supply to,
then help in preparing Detailed Project Report to get
funding for it
(Re)training of
service
provider
Partial Supply
based
DWSD conducts training programmes for VWSC members
and Jal Sahiyas, but not in regular intervals.
Information
and
communicatio
n activities
Yes Supply
based
DWSD develops IEC materials like posters, handbills,
booklets etc. and supplies to the VWSCs from time to
time for awareness generation among the villagers.
Fund
mobilization
Yes Supply
based
DWSD pays electricity bills, as well as an annual grant
matching the amount collected through tariffs. DWSD
also mobilises funds for system expansion or major
repairs through the preparation of a Detailed Project
Report
2 Detailed Project Reports are the basis for implementation of new schemes and major expansions or augmentations by DWSD. They contain the system design as well as cost estimates are prepared by the local Junior Engineer, and sanctioned by senior staff. After sanctioning a tender is floated and the work done by a contractor

19
Community Water plus
Table 4 depicts the activities and responsibilities that are undertaken in support of rural water supply
across the whole ESE, including both DWSD and other institutions. It covers the following factors for a
number of key tasks:
Responsible – the actor or entity that is responsible for the completion of a specific task.
Involved – those actors or entities who directly contribute to the completion of a specific
task.
Interested – those actors or entities that are likely to be affected by a specific task.
Paying – those actors or entities that cover the costs of an activity, but do not carry it out
directly
It shows that whilst the DWSD is the primary agency responsible for rural water supply, a number of
other institutions are also involved. Funds are mobilised at the Union and State government levels
and channelled through DWSD to implement new schemes. DWSD is also responsible for other
capital-intensive activities such as capital maintenance or major repairs. The actual scheme
implementation and major extensions or repairs are performed by private contractors, through a
tender floated by DWSD.
According to its operational policy, DWSD works with a local NGO for continuous capacity building
and training within villages. However, this cooperation was found not be effective in the studied
villages. Although the BRC exists, its activities were very limited and confined to sanitation. No
training or support for water supply was given by the BRC. Ensuring that the BRC fulfils these
functions, by increased funding and better oversight; or shifting the responsibility for on-going
software support to another agency would be a way to ensure this support reaches the communities.
The Jal Sahiya, VWSC president and vice-president receive training from DWSD, however there is a
lack of ongoing software support, especially after the Jal Sahiya or VWSC change; it was found that
the newly appointed Jal Sahiya often did not receive the training. On the village level, the VWSC is
responsible for service delivery whilst receiving financial and technical assistance by DWSD.

19
Community Water plus
Table 4: Activity and responsibility matrix
Entities /
Actors
Tasks / Activities A
lloca
tio
n o
f
fin
ance
/
Bu
dge
tary
app
rova
l
Mo
nit
ori
ng
serv
ice
leve
ls &
wat
er q
ual
ity
Pro
ject
pla
nn
ing
Infr
astr
uct
ure
des
ign
&
imp
lem
enta
tio
n
Soci
al
inte
rven
tio
n
des
ign
an
d
imp
lem
enta
tio
n
Op
erat
ion
an
d
min
or
mai
nte
nan
ce
On
goin
g so
ftw
are
sup
po
rt t
o
com
mu
nit
y W
ater
re
sou
rce
s
man
age
men
t
mea
sure
s C
apit
al
Mai
nte
nan
ce a
nd
ren
ewal
M
ajo
r re
pai
r
Ap
pro
val o
f u
ser
char
ges
Use
r ch
arge
colle
ctio
n
Man
agem
ent
of
com
mu
nit
y
invo
lvem
ent
Co
mm
un
ity
cap
acit
y
dev
elo
pm
ent
&
Trai
nin
g
Dis
pu
te
reso
luti
on
Pa
yin
g o
f w
ater
char
ges
Inst
itu
tio
nal
&
hu
man
res
ou
rce
s
dev
elo
pm
ent
Au
dit
ing
Eval
uat
ion
/per
for
man
ce
asse
ssm
ent
Central
Governm
ent
PA
Y
PA
Y
State
Governm
ent
IN
V
IN
V
IN
V
RE
S
+
PA
Y
IN
V
+
PA
Y
IN
V
+
PA
Y
PA
Y
DWSD RE
S
+
PA
Y
RE
S
+
PA
Y
RE
S
+
PA
Y
PA
Y
RE
S
PA
Y
IN
V
RE
S
+
PA
Y
PA
Y
IN
V
IN
V
RE
S
+
PA
Y
RE
S
Local
governm
ent/
Gram
Panchay
at
IN
V
IN
V
IN
V
IN
V
IN
T
Formal
private
enterpris
e
RE
S
RE
S
NGOs
(BRC)
RE
S
IN
V
RE
S
IN
V
RE
S
Water
committ
ee
(VWSC)
IN
T
IN
V
IN
V
RE
S
RE
S
+
PA
Y
IN
V
IN
V
RE
S
RE
S
RE
S
IN
T
RE
S
IN
T
IN
T
IN
V
IN
V
Operator
or
mechani
c
IN
V
RE
S
IN
V
IN
V
Househo
lds
IN
T
IN
T
IN
T
IN
V
IN
T
IN
T
RE
S

20
Community Water plus
2.4 Enabling environment performance indicators
Whilst the previous sections gave a description of DWDS, this section provides an assessment of its
performance. This exercise was conducted using specialist Qualitative Information System indicators
that were developed for this project and that rate the professionalism and performance of rural
water supply support entities. They cover a number of different aspects including the formality of the
mandate for support, working methods, information management, communication and client
satisfaction. Table 5 describes shows the scores for each indicator on a scale from 0 to 100, along with
explanations for the scoring.
Table 5: ESE performance indicators
Indicator Explanation Score
Formality of the mandate
for support
DWSD follows the NRDWP guidelines and sets its
own target for rural drinking water supply as per
the state implementation plan. Clear vision and
mission and policy mandate
100
Working methods Although standardised tools and methods exist
for most support activities, they are not always
used
50
Information management No systematic way of tracking performance of
service providers exists, only informal knowledge
through field staff
25
Communication between
service support authority
and service providers
DWSD staffs posted at the block level are easily
accessible to the VWSC members and general
public apart from the toll free number (which is
meant for issued with handpumps, but is often
used for PWSS as well). DWSD responds to
complaints and tries to solve issues.
75
Tracking client satisfaction There is no specific method in the DWSD at the
ESE level to assess the client satisfaction, it only
has an implicit understanding of it
25

21
Community Water plus
2.5 Enabling environment institutional assessment
After discussing how the DWSD performs in its role as a support agency, this section seeks assess the
internal characteristics and strengths of the organisation through an institutional assessment on
various indicators developed for this project. Through a series of questions these areas were scored
on a scale from 0 to 4 – with 0 reflecting low and 4 high scores. Figure 4 gives an overview of the
scores whilst each component is discussed below.
Figure 4: ESE institutional assessment
Organizational Autonomy: The DWSD is funded through both centre and state government funds so
must response to the priorities of government, as specified in the NRDWP. The organisation builds on
these guidelines and every year set its own targets and prepares an implementation plan with
budgetary allocation for it.
Leadership: The DWSD has good leadership and instils a sense of mission in its employees. The
leadership assesses the performance of their staff and based on their skills roles and responsibilities
are assigned. In the last five years innovative decisions were made such as supporting villages that
have autonomously moved towards piped water systems. This was achieved by taking out
advertisements in local newspapers that offer the support of the DWDS in terms of technical and
financial matters for any villages wishing to develop their own systems. Such provisions may not have
been recommended by the NRDWP guidelines but the leadership at DWSD believes that such
measures are needed to expand access to piped water.
Management and Administration:
Supporting the top-level leadership in the DWSD are team-leaders. This group of managers are aware
of theirs roles and responsibilities and can communicate the organisational objectives to the rest of
the team. Generally, clear procedural practices are in place meaning that employees are aware of
their tasks and are accountable for meeting them to scheduled times. The DWSD, however, currently
1
1.5
2
2.5
3
3.5
4Organisational autonomy
Leadership
Management andAdministration
Community Orientation
Technical Capability
Developing andMaintaining Staff
Organizational Culture
Interactions with KeyExternal Institutions

22
Community Water plus
lacks a well-organized management information system to track administrative work but an effort to
manage these tasks is undertaken based on a ‘target versus achievement’ approach – and the
department is now developing a management information system for this purpose. Current
administrative systems for accounting and human resources were found to be operating quite poorly.
Community Orientation:
Some sense of orientation towards serving the community could be observed in the organisation,
however no special efforts are made to educate communities about services offered by the
department.
Technical Capability:
The DWSD is a technical department and therefore has strong technical capability in implementing
rural water supply schemes. It seeks to maintain this capability through training, and for example,
recently it organised a 5-day training exercise for technical staff with support from UNICEF, Water AID
and other renowned agencies. The department in collaboration with UNICEF is establishing the
Visvesvaraya Sanitation & Water Academy as a residential training unit for capacity building of key
resource persons such as key programme managers and grass root level trainers.
Developing and Maintaining Staff:
Although the department does not have a dedicated, formalised plan for developing and maintaining
staff they do provide various opportunities for professional development, including organising
exposure visits within and outside the state for staff to learn skills and gain experience on relevant
subject matter. There is also an appraisal system for granting or renewing contracts (i.e. for
promotion) based on a written examination and assessment of the past performance by senior
authorities.
Organisational Culture:
Although the staff agree that DWSD is a good place to work, little team spirit could be observed,
which might be caused by a lack of continuity due to staff turnover. However, the higher authorities
and leadership are interested and keen to develop the department and hence efforts are made in
terms of maintaining physical office infrastructure.
Interactions with Key External Institutions:
DWSD has good interactions with key external institutions and hence the top management stays well
informed about external policy, financial, and regulatory issues and actions. Many international,
national and local NGOs as well as academic institutions are providing support and technical
assistance to DWSD. For example, the department works with the World Bank to implement PWS in
some of the tribal dominated district in the state. Another example is that DWSD is coordinating with
the Electricity Department in the state to slash the rate of electricity for drinking water abstraction.
DWDS brought to the notice of the Electricity Department that although drinking water has been
identified as a priority sector as per the National Water Policy, the electricity charges levied for
extracting drinking water has been put under the category of low intensity industrial units, making
the tariff much higher than for irrigation. These efforts from the department and simultaneous
23
Community Water plus
petitions from VWSCs resulted in the Electricity Department agreeing to reduce the electricity tariffs
from Rs 4.40 per unit to Rs 1.10 per unit. This has resulted in reducing the overall operational
expenditure for water supply as electrical charges represent a major part of the recurrent costs.
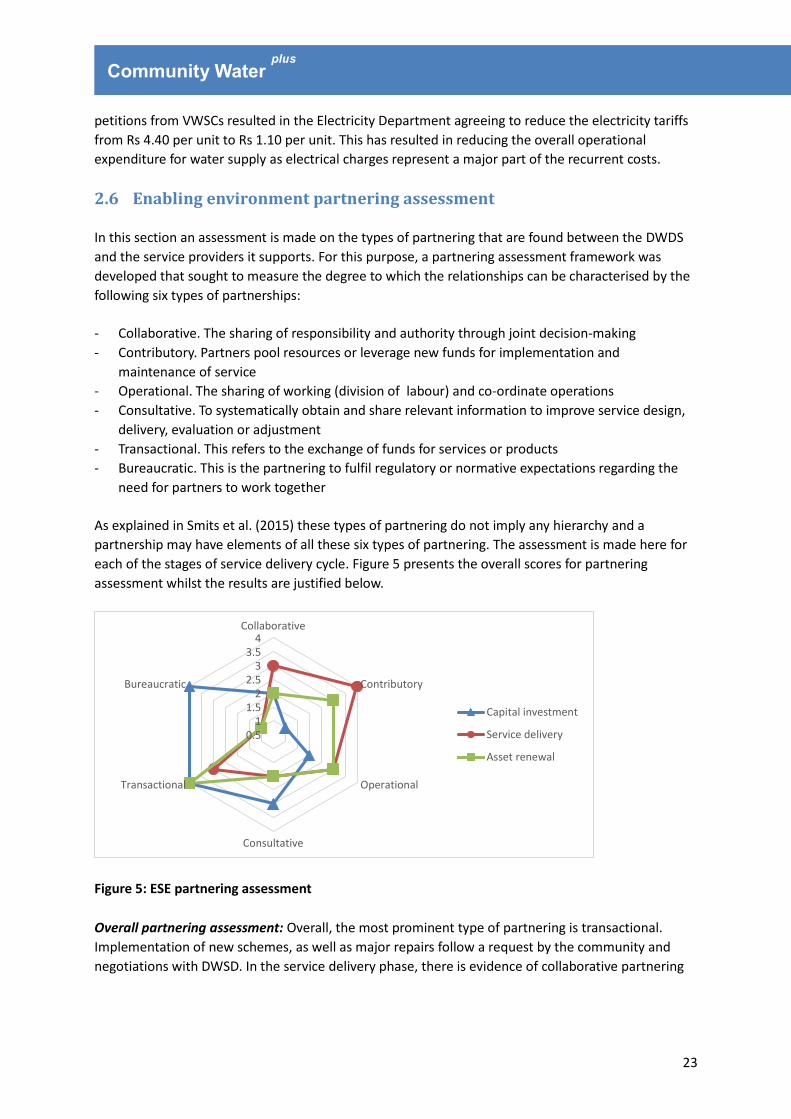
2.6 Enabling environment partnering assessment
In this section an assessment is made on the types of partnering that are found between the DWDS
and the service providers it supports. For this purpose, a partnering assessment framework was
developed that sought to measure the degree to which the relationships can be characterised by the
following six types of partnerships:
- Collaborative. The sharing of responsibility and authority through joint decision-making
- Contributory. Partners pool resources or leverage new funds for implementation and
maintenance of service
- Operational. The sharing of working (division of labour) and co-ordinate operations
- Consultative. To systematically obtain and share relevant information to improve service design,
delivery, evaluation or adjustment
- Transactional. This refers to the exchange of funds for services or products
- Bureaucratic. This is the partnering to fulfil regulatory or normative expectations regarding the
need for partners to work together
As explained in Smits et al. (2015) these types of partnering do not imply any hierarchy and a
partnership may have elements of all these six types of partnering. The assessment is made here for
each of the stages of service delivery cycle. Figure 5 presents the overall scores for partnering
assessment whilst the results are justified below.
Figure 5: ESE partnering assessment
Overall partnering assessment: Overall, the most prominent type of partnering is transactional.
Implementation of new schemes, as well as major repairs follow a request by the community and
negotiations with DWSD. In the service delivery phase, there is evidence of collaborative partnering
0.51
1.52
2.53
3.54
Collaborative
Contributory
Operational
Consultative
Transactional
Bureaucratic
Capital investment
Service delivery
Asset renewal
24
Community Water plus
as well, which shows that DWSD provides financial and technical support for operation and
maintenance.
Capital Investment: The DWSD pays for initial capital investment, whilst a private contractor is
responsible for implementation. For the preparation of Detailed Project Report, which is the basis of
the scheme design, the Junior Engineer consults the VWSC members. However, they can’t make
major amendments in the design or suggest an alternative technology.
Ongoing service delivery: There is sharing of responsibility between DWDS and VWSCs in
administration, management, operation and maintenance. The VWSC is responsible for service
delivery through hiring a pump operator, a bill collector or plumber as required. However,
department employees also give technical assistance and often help in repairing breakdowns.
Furthermore, DWSD pays the committee’s electricity bill, which is one of the major running costs.
Asset Renewal: The DWDS does not have an explicit guideline for assets renewal but they provide ad
hoc support to VWSCs that need to undertake this task. This varies depending on the situation. The
VWSC sometimes replaces motor pumps from its own funds, as in Bero village, but the DWSD can be
approached for assistance if the renewal exceeds the service provider’s capacity.
Service Enhancement or expansion: For service enhancement and expansion, VWSCs are meant to be
supported by the DWSD but no specific evidence on the partnering during this phase was gathered
on this as part of this study.

25
Community Water plus
3 Community Service Provider Level
Having seen the type and performance of the enabling support entities, this chapter assesses the
performance of the community service providers. As indicated in the conceptual framework, the
service provider assessment is above all a validation of whether the support that has been provided
indeed leads to well-performance community service providers. To do so, this chapter first provides
the context of the villages where the validation took place, describing their history of water
development. This is followed by the assessment of their respective service providers, using the
descriptors and indicators and participation scores set out in the project methodology. Although a
majority of people in the studied villages still depend on private wells or handpumps, the focus of this
study is on piped water supplies, as they are the are managed by the community service providers
and are the DWSD’s main focus for the future.
3.1 Context
For the present study, four villages from Ranchi district have been selected to be part of this
validation. The district is the most populous of 24 districts in the state with a population of 2,912,022
across 303 Gram Panchayats and 1,296 villages. It is headquartered in the city of Ranchi that is also
the state capital. As one of the 250 most backward districts of India, the district receives additional
funds under the Backward Regions Grant Fund Programme (BRGF) form the central government.
Under DWSD, Ranchi district has been divided into Ranchi West and Ranchi East divisions. The four
villages covered in the present study – Bero, Namkum-Khijri, Rai Bazaar and Brambe – belong to the
Ranchi West division. Out of these four villages, the first three – Bero, Namkum-khijri and Rai Bazaar
– have been taken as best practice cases with good support from the department whereas the fourth
village, Brambe, has been less successful in managing drinking water provisioning due to inadequate
support and is taken as the control village. The location of the villages is shown in Figure 6 and key
information on the four studied villages is given in Table 6.
Figure 6: Village locations (source: maps.google.com)

26
Community Water plus
Table 6: Basic village information
Bero Khijri Rai Bazaar Brambe
Population 7,193 5,936 6,977 4,230
Households 1,557 1,160 1,351 750
Household connections 235 218 572 132
Percentage SC 1% 3% 8% 1%
Percentage ST 55% 46% 5% 67%
Year of
implementation/rehabilitation
1990s/2010 2009 2013 2000/2007
Technology Groundwater Surface
water
Surface
water
Mixed
Handover to VWSC 2011 2012 2013 2011
Bero was is one of the first villages to receive a piped water scheme from the department in the early
1990s. However, the scheme fell into disrepair and before the rehabilitation in 2010, only around 30
households out of more than 100 connections actually received water from it. Bero has also been
awarded the ‘Nirmal Gram’ (clean village) status, meaning that all households have access to
improved sanitation facilities.
Namkum Khijri village is located on the outskirt of Ranchi city. The water scheme in the village is
surface water based and fed by the nearby Subarnarekha River. Initially users were sceptical about
the water quality, because the intake structure is situated in the vicinity of the cremation ground near
the river. However, after awareness campaigns conducted by the department and the good
experiences made by the fist users, the community was convinced and a lot households have applied
for private connections, which led to a plan for expansion of the distribution network in the village
being developed currently. The village also has a Reverse Osmosis (RO) plant operated by Water Life
and built with World Bank assistance. However, most customers of this RO plant were residents from
Ranchi and only a small minority of people in the village get their drinking water from it.
Furthermore, it is not managed by the community or has any operational cooperation with the
VWSC, therefore it was decided not to include it in this study.
Rai Bazaar is situated in a mining area and faced drinking water scarcity in the late 1980s. Due to
mining activities the water table declined rapidly and many wells, the traditional source of drinking
water, dried up. A lot of people had to get their drinking water from the nearby Safi River and water
fetchers charged 3-4 INR per bhar (can of about 25 litres). At this price a family of 5, requiring 4-5
bhars a day, was spending about 500 INR a month, which would be even higher in today’s prices. An
attempt to implement a piped water supply scheme around 1990 failed due to the political instability
and Naxalite presence in the area, because the contractor did not agree to pay protection money to
the Naxalites. The current system was successfully implemented in 2013 by a local contractor and
with greater cooperation of the villagers, especially the youth.
In the control village, Brambe there are design problems in the pipe distribution network and a lack
of storage capacity to meet the current demand, leading to sub-optimal performance of the water
supply system. Users are dissatisfied with the service, resulting in a high non-payment rate. A large
number of consumers use booster pumps to suck water from the pipe, which leads to the other

27
Community Water plus
households not receiving any water. A group of entrepreneurial individuals have developed their own
water source and storage and distribute it through the government pipelines at a higher price.
3.1.1 Socio-economic status of the villages
In order to determine service levels, a household survey has been conducted with 30 households in
each village. A socio-economic overview of these households is given in Table 7. Hindus constitute
the majority religious group in Bero, Khijri and Rai Bazaar, whereas Christians are the majority in
Brambe, the control village. Similarly, except for Rai which is dominated by BCs, the rest of the
villages STs are in majority. A closer look into the level of educational attainment reveals similarities
across villages with the share of graduates quite low at less than 20% and a large share of the
population below matriculation level (57% -77% of the population).
Table 7: Social indicators of surveyed households
Social Indicators Bero Khijri Rai Brambe
Religion Hindu 55% 37% 90% 10%
Muslim 0% 0% 10% 27%
Christian 12% 20% 0% 37%
Sarna 33% 0% 0% 0%
Others 0% 43% 0% 27%
Caste BC 15% 17% 63% 3%
General 0% 3% 0% 0%
MBC 0% 0% 17% 0%
OC 18% 17% 0% 30%
Other 9% 0% 0% 0%
SC 0% 7% 13% 0%
ST 58% 57% 7% 67%
Education
Illiterate 18% 10% 20% 17%
1st to 5th class 18% 20% 20% 20%
6th to 10th class 30% 27% 37% 20%
Intermediate 21% 27% 3% 40%
Degree 6% 7% 17% 0%
Post graduate 3% 3% 0% 3%
Professional degree 0% 0% 3% 0%
Private water entrepreneurs in Brambe
In Brambe, one hamlet at the tail end of the network does not receive any water from the VWSC
scheme. A group of entrepreneurial individuals constructed a borehole with a motor pump, at a
cost of about INR 450,000. They pump water to a storage tank on the roof of a house and supply
it to about 35 household in the area. They use the existing distribution network and collect
INR 100 from their customers, but are not affiliated to the VWSC at all.
28
Community Water plus
Below matriculation 66% 57% 77% 57%
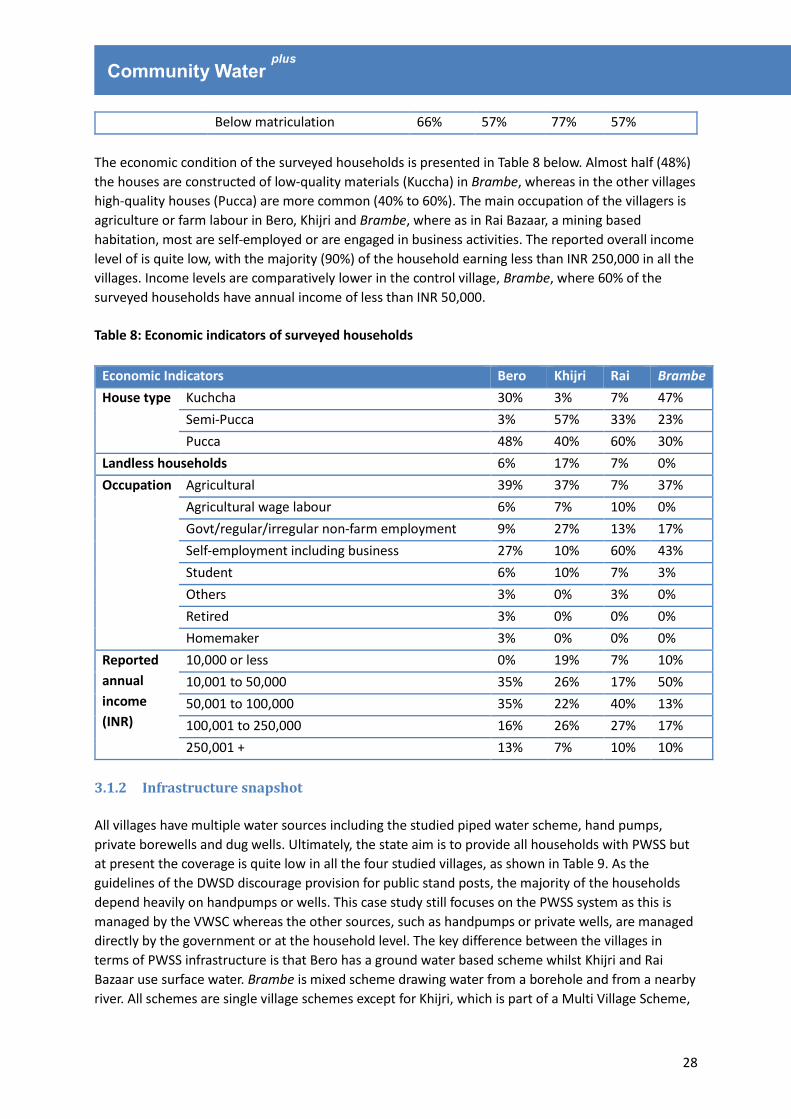
The economic condition of the surveyed households is presented in Table 8 below. Almost half (48%)
the houses are constructed of low-quality materials (Kuccha) in Brambe, whereas in the other villages
high-quality houses (Pucca) are more common (40% to 60%). The main occupation of the villagers is
agriculture or farm labour in Bero, Khijri and Brambe, where as in Rai Bazaar, a mining based
habitation, most are self-employed or are engaged in business activities. The reported overall income
level of is quite low, with the majority (90%) of the household earning less than INR 250,000 in all the
villages. Income levels are comparatively lower in the control village, Brambe, where 60% of the
surveyed households have annual income of less than INR 50,000.
Table 8: Economic indicators of surveyed households
Economic Indicators Bero Khijri Rai Brambe
House type Kuchcha 30% 3% 7% 47%
Semi-Pucca 3% 57% 33% 23%
Pucca 48% 40% 60% 30%
Landless households 6% 17% 7% 0%
Occupation Agricultural 39% 37% 7% 37%
Agricultural wage labour 6% 7% 10% 0%
Govt/regular/irregular non-farm employment 9% 27% 13% 17%
Self-employment including business 27% 10% 60% 43%
Student 6% 10% 7% 3%
Others 3% 0% 3% 0%
Retired 3% 0% 0% 0%
Homemaker 3% 0% 0% 0%
Reported
annual
income
(INR)
10,000 or less 0% 19% 7% 10%
10,001 to 50,000 35% 26% 17% 50%
50,001 to 100,000 35% 22% 40% 13%
100,001 to 250,000 16% 26% 27% 17%
250,001 + 13% 7% 10% 10%
3.1.2 Infrastructure snapshot
All villages have multiple water sources including the studied piped water scheme, hand pumps,
private borewells and dug wells. Ultimately, the state aim is to provide all households with PWSS but
at present the coverage is quite low in all the four studied villages, as shown in Table 9. As the
guidelines of the DWSD discourage provision for public stand posts, the majority of the households
depend heavily on handpumps or wells. This case study still focuses on the PWSS system as this is
managed by the VWSC whereas the other sources, such as handpumps or private wells, are managed
directly by the government or at the household level. The key difference between the villages in
terms of PWSS infrastructure is that Bero has a ground water based scheme whilst Khijri and Rai
Bazaar use surface water. Brambe is mixed scheme drawing water from a borehole and from a nearby
river. All schemes are single village schemes except for Khijri, which is part of a Multi Village Scheme,

29
Community Water plus
supplying water to Namkum Khijri and Tumbagutu. For this study, all analysis of this scheme only
pertains to Khijri village.
Table 9: Coverage with piped water
Parameters Bero Namkum-Khijri Rai Bazaar Brambe
No of HH 1557 1160 1351 749
Total Population 7193 5936 6977 4230
HH (%) under PWSS 230hh (16%) 218hh (19%) 572hh (42%) 130hh (17%)
3.2 Community service provider descriptors
This section describes the VWSCs that operate as the service provider within the villages. It covers
the institutional set-up, governance, administration and staffing, equity and water tariffs. Table 10
gives an overview of the four service providers, whilst further details are given below.
All four service providers are organised as formal water committees headed by the President of the
Gram Panchayat and composed of 12 people in total, half of which should be women. Members are
selected in the Gram Sabha (village meeting) and generally include ward members, heads of other
community organisations such as self-help groups and caste representatives. Although the VWSC is
closely linked to the Gram Panchayat, it functions independently for all practical matters such as
receiving grants from DWSD or making decisions. Following the DWSD policies, every VWSC has to
have a Jal Sahiya (Water Volunteer), who acts as treasurer and has the responsibility of
communicating decisions taken by the committee to the villagers. The DWSD specifies that this Jal
Sahiya must be selected from the village’s daughters-in-law, as they will stay in the village with a
higher probability than daughters of the village who might go to their husband’s village after
marriage.
All service provider have paid staff in addition to the committee, the salaries of which are paid from
the tariff collection. The number of staff depend on the size and complexity of the schemes. Whilst in
Bero only one pump operator and one bill collector are employed, there are two pump operators
and one assistant working in shifts in Khijri. Rai Bazaar employs one pump operator, one mechanic
and one guard, whilst Brambe only has one staff member, a mechanic.
In two villages the number of household connections has increased after the scheme was handed
over to the VWSCs. In Bero, this increase was from 135 to 235 connections from 2011 to 2014, whilst
Khijri saw an increase from 186 to 218 connections from 2012 to 2014.
Connection rates amongst marginalised groups are significantly lower in Rai Bazaar and Brambe,
which points to issues with equity. These issues are mostly caused by the settlement patterns.
Marginalised groups tend to settle on the edges of the village and these areas are not covered by the
pipe network. Although this discrimination might not happen intentionally, steps to connect these
hamlets to the system as well would lead to a more equitable system design.
To encourage service providers to set tariffs high enough, DWSD has decided on a minimum tariff of
62 INR per household and month, as well as a 310 INR minimum charge for new connections. Apart

30
Community Water plus
from the very new scheme in Rai Bazaar, all committees have started with the minimum tariff but
subsequently increased it to meet more of their operational expenditure.
Table 10: CSP descriptors
Bero Khijri Rai Bazaar Brambe
Type of organisation Formal water
committee
Formal water
committee
Formal water
committee
Formal water
committee
Organizational capacity
Staffing of governing body of
CSP
12 12 12 12
Staffing of the CSP 14 15 15 13
Coverage with household connections
Number of households with
connections
1557 1160 1351 750
Households served by the CSP 235 218 572 132
Coverage with household
connections
15% 19% 42% 18%
Coverage with household connections among vulnerable groups
Number of SC/ST households
with household connections
94 10 27 51
SC/ST households served by
the CSP
865 58 177 507
Coverage with household
connections among vulnerable
groups
11% 17% 15% 10%
Financial descriptors
Tariff per household and
month
72 INR 100 INR 62 INR 100 INR
Connection costs 310 INR 410 INR 310 INR 310 INR
Total capital expenditure (INR) 3,392,243 41,536,017 40,463,825 5,370,825
3.3 Community service provider indicators
The performance of the CSP in its functions of governance, administration and staff, finance and
operation and maintenance has been assessed using a specialised QIS developed for this project.
Scores are assigned on each indicator from 0, denoting low performance to 100 for the highest
performance. Results of this assessment are given in Table 12 and explained in depth below.
3.3.1 Governance and staff
In all the villages, VWSC members are selected in the Gram Sabha, but there is no formal document
describing this process. At least 50% of the members, as well as 50% of the executive committee, i.e.
president, vice president and Jal Sahiya, should be women. This requirement is fulfilled in all studied
villages, as shown in Table 11. The VWSC may take most decisions autonomously, however, the
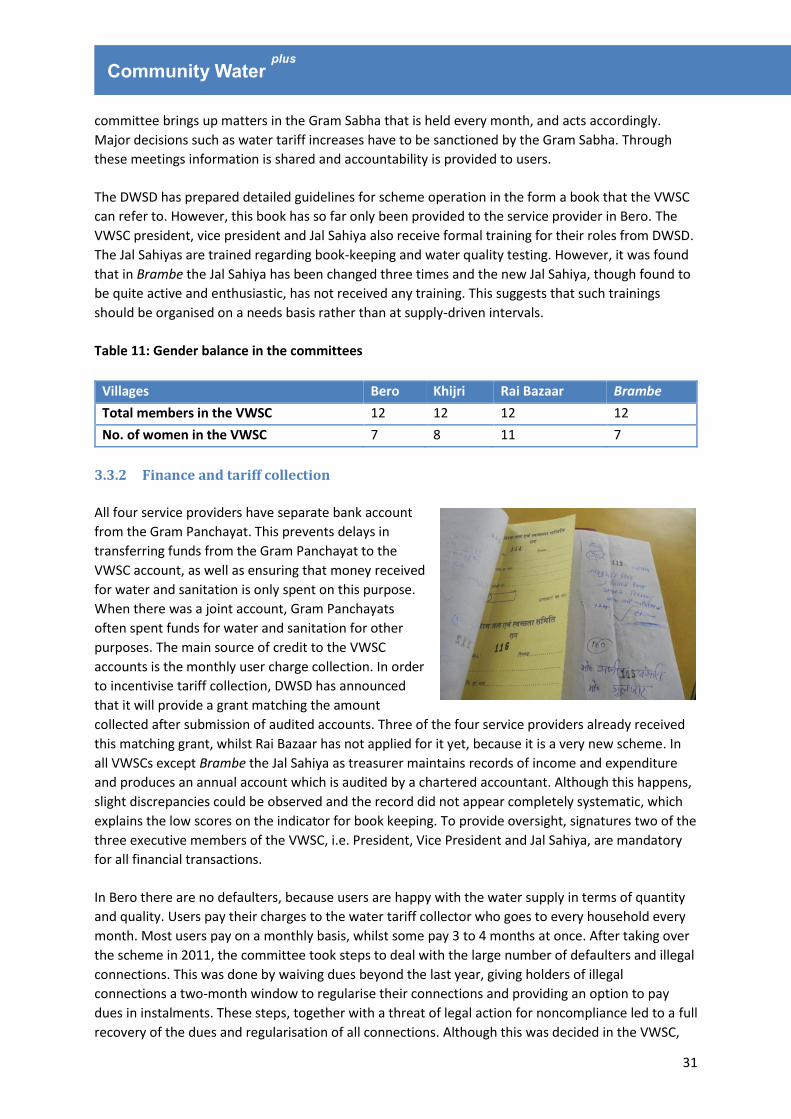
31
Community Water plus
committee brings up matters in the Gram Sabha that is held every month, and acts accordingly.
Major decisions such as water tariff increases have to be sanctioned by the Gram Sabha. Through
these meetings information is shared and accountability is provided to users.
The DWSD has prepared detailed guidelines for scheme operation in the form a book that the VWSC
can refer to. However, this book has so far only been provided to the service provider in Bero. The
VWSC president, vice president and Jal Sahiya also receive formal training for their roles from DWSD.
The Jal Sahiyas are trained regarding book-keeping and water quality testing. However, it was found
that in Brambe the Jal Sahiya has been changed three times and the new Jal Sahiya, though found to
be quite active and enthusiastic, has not received any training. This suggests that such trainings
should be organised on a needs basis rather than at supply-driven intervals.
Table 11: Gender balance in the committees
Villages Bero Khijri Rai Bazaar Brambe
Total members in the VWSC 12 12 12 12
No. of women in the VWSC 7 8 11 7
3.3.2 Finance and tariff collection
All four service providers have separate bank account
from the Gram Panchayat. This prevents delays in
transferring funds from the Gram Panchayat to the
VWSC account, as well as ensuring that money received
for water and sanitation is only spent on this purpose.
When there was a joint account, Gram Panchayats
often spent funds for water and sanitation for other
purposes. The main source of credit to the VWSC
accounts is the monthly user charge collection. In order
to incentivise tariff collection, DWSD has announced
that it will provide a grant matching the amount
collected after submission of audited accounts. Three of the four service providers already received
this matching grant, whilst Rai Bazaar has not applied for it yet, because it is a very new scheme. In
all VWSCs except Brambe the Jal Sahiya as treasurer maintains records of income and expenditure
and produces an annual account which is audited by a chartered accountant. Although this happens,
slight discrepancies could be observed and the record did not appear completely systematic, which
explains the low scores on the indicator for book keeping. To provide oversight, signatures two of the
three executive members of the VWSC, i.e. President, Vice President and Jal Sahiya, are mandatory
for all financial transactions.
In Bero there are no defaulters, because users are happy with the water supply in terms of quantity
and quality. Users pay their charges to the water tariff collector who goes to every household every
month. Most users pay on a monthly basis, whilst some pay 3 to 4 months at once. After taking over
the scheme in 2011, the committee took steps to deal with the large number of defaulters and illegal
connections. This was done by waiving dues beyond the last year, giving holders of illegal
connections a two-month window to regularise their connections and providing an option to pay
dues in instalments. These steps, together with a threat of legal action for noncompliance led to a full
recovery of the dues and regularisation of all connections. Although this was decided in the VWSC,
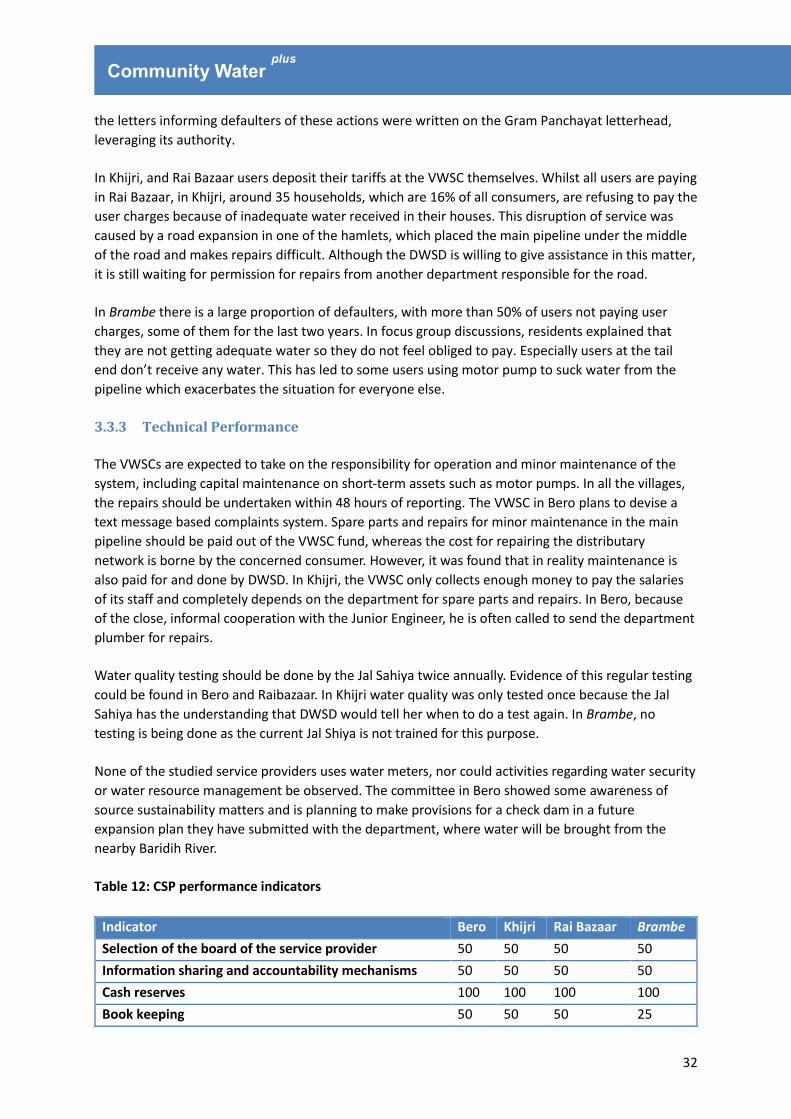
32
Community Water plus
the letters informing defaulters of these actions were written on the Gram Panchayat letterhead,
leveraging its authority.
In Khijri, and Rai Bazaar users deposit their tariffs at the VWSC themselves. Whilst all users are paying
in Rai Bazaar, in Khijri, around 35 households, which are 16% of all consumers, are refusing to pay the
user charges because of inadequate water received in their houses. This disruption of service was
caused by a road expansion in one of the hamlets, which placed the main pipeline under the middle
of the road and makes repairs difficult. Although the DWSD is willing to give assistance in this matter,
it is still waiting for permission for repairs from another department responsible for the road.
In Brambe there is a large proportion of defaulters, with more than 50% of users not paying user
charges, some of them for the last two years. In focus group discussions, residents explained that
they are not getting adequate water so they do not feel obliged to pay. Especially users at the tail
end don’t receive any water. This has led to some users using motor pump to suck water from the
pipeline which exacerbates the situation for everyone else.
3.3.3 Technical Performance
The VWSCs are expected to take on the responsibility for operation and minor maintenance of the
system, including capital maintenance on short-term assets such as motor pumps. In all the villages,
the repairs should be undertaken within 48 hours of reporting. The VWSC in Bero plans to devise a
text message based complaints system. Spare parts and repairs for minor maintenance in the main
pipeline should be paid out of the VWSC fund, whereas the cost for repairing the distributary
network is borne by the concerned consumer. However, it was found that in reality maintenance is
also paid for and done by DWSD. In Khijri, the VWSC only collects enough money to pay the salaries
of its staff and completely depends on the department for spare parts and repairs. In Bero, because
of the close, informal cooperation with the Junior Engineer, he is often called to send the department
plumber for repairs.
Water quality testing should be done by the Jal Sahiya twice annually. Evidence of this regular testing
could be found in Bero and Raibazaar. In Khijri water quality was only tested once because the Jal
Sahiya has the understanding that DWSD would tell her when to do a test again. In Brambe, no
testing is being done as the current Jal Shiya is not trained for this purpose.
None of the studied service providers uses water meters, nor could activities regarding water security
or water resource management be observed. The committee in Bero showed some awareness of
source sustainability matters and is planning to make provisions for a check dam in a future
expansion plan they have submitted with the department, where water will be brought from the
nearby Baridih River.
Table 12: CSP performance indicators
Indicator Bero Khijri Rai Bazaar Brambe
Selection of the board of the service provider 50 50 50 50
Information sharing and accountability mechanisms 50 50 50 50
Cash reserves 100 100 100 100
Book keeping 50 50 50 25

33
Community Water plus
Technical folder 75 75 75 25
Registry of operational information 100 100 100 50
Water metering 0 0 0 0
Water security measures 0 0 0 0
Water quality management 100 50 100 25
3.4 Community service provider participation assessment
In this research as assessment was made of the level of community participation in service provision
in each of the villages. Participation is understood functionally as “an active process whereby
beneficiaries influence the direction and execution of development projects rather than merely
receive a share of project benefits” (Paul, 1987) Using a participation ladder adapted from Arnstein
(1968) and Adnan et al. (1992) and specifically designed for this project, the degree of community
participation in community service provision is assessed at each stage of the service delivery cycle.
As can be seen in Figure 7, Bero is assessed as showing interactive participation in all phases, which
means that decisions are made in cooperation between the service provider and the community. The
other best practice villages also show quite high levels of participation, with mostly functional
participation, meaning that implementation or expansion plans are discussed and the community can
make limited amendments. The control village, Brambe, is characterised by passive participation,
which shows the low degree of engagement between the community and service provider.
Figure 7: Service provider participation assessment
Capital Investment In all villages, schemes were initially constructed more than 10 years ago,
therefore no assessment could be made for this phase. The assessment presented here relates to the
rehabilitation of dysfunctional or the construction of the current schemes.
In Bero, an old scheme that was almost completely dysfunctional was rehabilitated in 2010 in very
close cooperation with the community.
1
2
3
4
5
capital Investment(implementation)
Service Delivery
Asset Renewal
Service Enhancement orExpansion
Bero Khijri Rai Bazaar Brambe
1- Self Mobilisation2- Interactive Participation3- Functional Participation4- Participation by Consultation5- Passive Participation

34
Community Water plus
In Rai Bazaar, implementation of a scheme failed around 1990,
partly because the community was not strongly involved in the
process. Therefore the DWSD engineers prepared the
implementation plan for the current scheme with considerable
participation of the villagers. However, the main decision of using
surface water was decided by the department.
The community in Khijri was provided with a detailed
implementation plan that they discussed and they have a chance
to amend limited elements, while setting up the systems which
are in place at present.
In Brambe, the
control village,
community members have been informed that project
implementation is going ahead as per an externally designed plan and were not involved in the
planning process.
Service Delivery In all best practice villages, decisions regarding water supply are made in
cooperation between the service provider and the community. The service provider brings up
decisions such as amending tariff levels and adding duration of supply in summer months or special
festival occasions in the Gram Sabha to decide. This cooperation was found to be strongest in Bero,
where the community very actively participated in these meetings. In Brambe, community members
were found not to participate or bring any change in the service delivery arrangement. This has
happened because the users and the wider community are disillusioned and dissatisfied with the
service received.
Asset Renewal In Bero, joint-decision making between the community and the service provider
regarding asset renewal could be observed. Decisions for example regarding replacing pumps or
major repairs are brought up in the Gram Sabha and the community strongly participates in this
discussion. In Khijri, these matters are also discussed in the Gram Sabha, but less community
involvement was observed. In Rai bazaar there has not been any major asset renewal, however for
minor repair and replacement of a few smaller motors (1 HP capacity motor used for chlorination),
the community members were consulted but only with limited formal decision making power to
demand alternatives. In Brambe, the VWSC informs community members about asset renewal as per
the plan of the DWSD, but does not involve them.
Service Enhancement and Extension Interaction participation is witnessed in Bero where the
community in partnership with the VWSC and DWSD engage in joint-decision making regarding
service enhancement or expansion, for example in preparing a new Detailed Project Report for a
capacity expansion of the scheme. Khijri and Rai bazaar are characterised by functional participation,
where the community is provided with a service enhancement or expansion plan that they discuss
and they have a chance to amend with limited elements. In Rai Bazaar, scheme expansion faced
hurdles due to unwillingness of some people to allow construction on their land. This issue was
addressed in the Gram Sabha and people convinced of the need for expansion. However, further
expansion has faced a roadblock as the land through which the main pipeline should go is owned by
the Railway Department, therefore there limited scope for the community to intervene. In Brambe
Photograph 1: Abandoned structure from initial scheme in Rai Bazaar

35
Community Water plus
the community has been informed about a future expansion plan being considered by the DWSD, but
are not every involved due to their negative experiences with the present scheme.
3.5 Community service provider costs
This section presents the various costs borne by the service providers. None of the communities
contributed financially to initial implementation, so only recurrent costs are given. Information was
gathered through key informant interviews at the service provider level and, wherever possible,
confirmed through the accounts. As shown in Table 13, these costs consist almost entirely of staff
salaries because the electricity bills are paid by DWSD. DWSD is planning to shift the responsibility for
paying electricity charges to the service providers and has negotiated a 75% discounted tariff for
water supply with the electricity department. However, so far none of the VWSCs pay the electricity
bills, as they feel that their tariff collection is not sufficient for that. Furthermore, the electricity
department is unwilling to make the VWSCs pay, because they would pay the discounted tariff of
25%, whilst now DWSD pays the full amount.
All four service providers employ at least one member of staff, apart from paying the Jal Sahiya. The
government guidelines suggest paying the Jal Sahiya 10% of the collected tariffs, which is followed in
all villages except Bero, where she is paid a flat INR 1200 per month.
The service provider in Bero employs two staff, one pump operator and one bill collector. The pump
operator is paid INR 3000, the bill collector INR 1000 per month. Employing a dedicated bill collector
might seem an additional cost, but it has helped the VWSC reduce the number of defaulters and
illegal connections. Khijri village has a relatively large surface based scheme and employs three pump
operators working in shifts; they are paid INR 4500 per month each. The VWSC in Rai Bazaar, a
surface water scheme as well, has three members of staff: one pump operator, one scheme attendant
and one guard. The pump operator is paid INR 5000, the scheme attendant and guard INR 2500 per
month. Brambe VWSC employs one pump operator who is paid INR 3000 per month. The higher
number of staff in the surface water schemes leads to a markedly higher per capita expenditure,
about two or three times.
The service providers’ expenses for minor maintenance, spares and chemicals vary across the villages.
Whilst the committee in Bero bought chemicals for purification, spares for minor repairs and paid a
mechanic for repairing, no evidence for such payments could be found in Khijri and Rai Bazaar.
Although this arrangement is not completely clear, there is an informal agreement between the
DWSD and these two service providers that, because of the higher staff costs due to the technical
complexity of their schemes, the department pays for repairs and spares. The committee in Khijri felt
that they were unable to pay for repairs, as the tariff collection was just enough to pay staff salaries.
Table 13: Recurrent costs at CSP level
Particulars of Costs Bero Khijri Rai Bazaar Brambe
Annual salaries for technical staff 48,000 162,000 120,000 36,000
Annual salary for Jal Sahiya 14,400 24,000 36,000 9,600
Spares, repairs and chemicals 8,200 0 0 3,000
Total recurrent costs paid by CSP 70,600 186,000 156,000 48,600
Total population supported 7193 5936 6977 4230

36
Community Water plus

37
Community Water plus
4 Household Service levels
This section details results from the household surveys designed to validate the success by analysing
the water supply service levels users receive. It starts with a general overview of coverage levels, then
provides details of single parameters and finally looks at equity in terms of water service levels.
Service levels are assessed on five parameters: quantity, perception of quality, accessibility, reliability
and continuity. The service each household receives is scored for each parameter from ‘no service’ to
‘high’. The ‘basic’ service level represents the Indian Norms for Rural Drinking Water, therefore any
level above that can be seen as acceptable, any level below as unacceptable service.
4.1 Coverage
The sources used by the 30 households surveyed in each village are shown in Table 14. The best
practice villages are mostly covered by either household connections or private wells and boreholes,
whilst in the control village, almost half of surveyed users get their water from communal sources.
One household in Rai Bazaar reported fetching surface water from a nearby river, thereby relying on
an unimproved source as defined by JMP.
Table 14: Water sources of surveyed households
Bero Khijiri Rai Bazaar Brambe
Household connection 40% 30% 73% 57%
Private well/handpump/borehole 57% 53% 13%
Communal well/handpump 3% 17% 10% 43%
Surface water 3%
4.2 Service levels
The service levels for best practice and control villages are given below in Table 15 and Table 16. It
can be seen that overall, consumers in best practice villages enjoy significantly better service,
especially in regards to quantity, accessibility and continuity. In best practice villages, 33% of users
receive unacceptable quantity, whilst this proportion is 67% in the control village. Interestingly,
perceived quality is slightly higher in the control village, and perceived reliability is uniformly high.
Tables showing the service level for each village can be found in the Annex.
Table 15: Service levels for best practice villages (n=90)
Best practice (n=90)
Quantity Accessibility Quality Continuity Reliability
High 26% 87% 74% 2% 98%
Improved 9% 2% 0% 9% 1%
Basic 32% 1% 16% 51% 0%
Sub-standard 20% 5% 10% 37% 1%
No service 13% 5% 0% 0% 0%
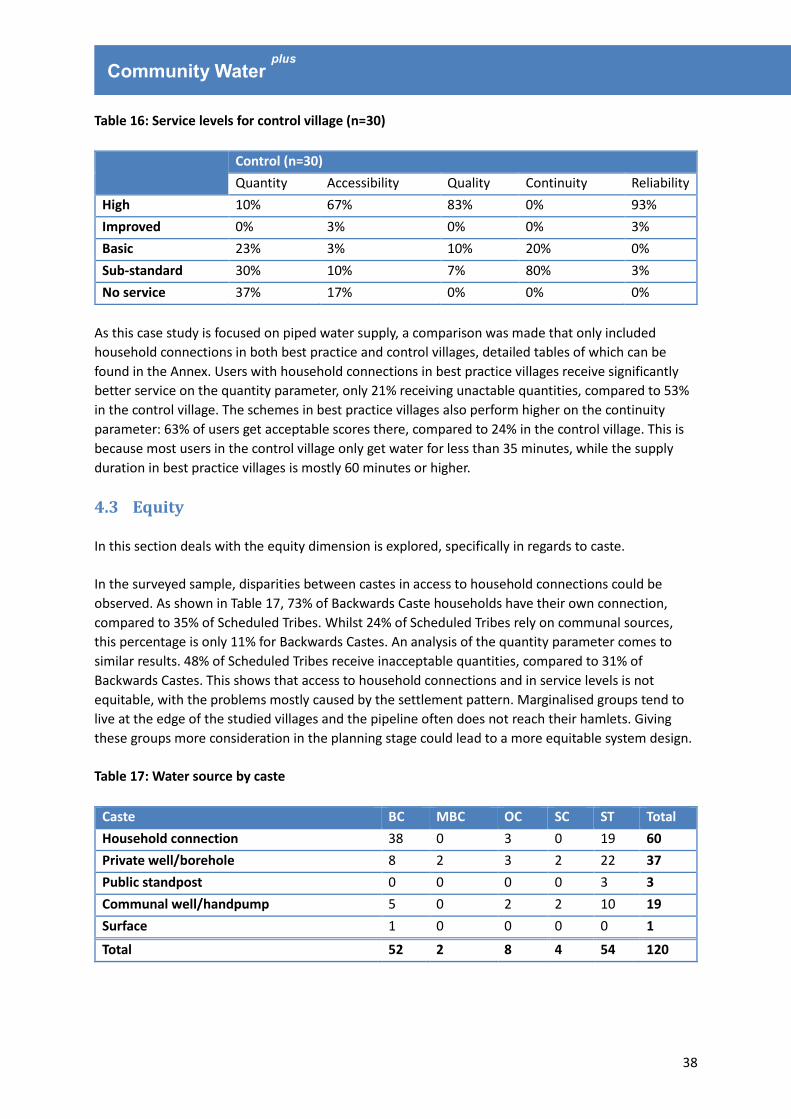
38
Community Water plus
Table 16: Service levels for control village (n=30)
Control (n=30)
Quantity Accessibility Quality Continuity Reliability
High 10% 67% 83% 0% 93%
Improved 0% 3% 0% 0% 3%
Basic 23% 3% 10% 20% 0%
Sub-standard 30% 10% 7% 80% 3%
No service 37% 17% 0% 0% 0%
As this case study is focused on piped water supply, a comparison was made that only included
household connections in both best practice and control villages, detailed tables of which can be
found in the Annex. Users with household connections in best practice villages receive significantly
better service on the quantity parameter, only 21% receiving unactable quantities, compared to 53%
in the control village. The schemes in best practice villages also perform higher on the continuity
parameter: 63% of users get acceptable scores there, compared to 24% in the control village. This is
because most users in the control village only get water for less than 35 minutes, while the supply
duration in best practice villages is mostly 60 minutes or higher.
4.3 Equity
In this section deals with the equity dimension is explored, specifically in regards to caste.
In the surveyed sample, disparities between castes in access to household connections could be
observed. As shown in Table 17, 73% of Backwards Caste households have their own connection,
compared to 35% of Scheduled Tribes. Whilst 24% of Scheduled Tribes rely on communal sources,
this percentage is only 11% for Backwards Castes. An analysis of the quantity parameter comes to
similar results. 48% of Scheduled Tribes receive inacceptable quantities, compared to 31% of
Backwards Castes. This shows that access to household connections and in service levels is not
equitable, with the problems mostly caused by the settlement pattern. Marginalised groups tend to
live at the edge of the studied villages and the pipeline often does not reach their hamlets. Giving
these groups more consideration in the planning stage could lead to a more equitable system design.
Table 17: Water source by caste
Caste BC MBC OC SC ST Total
Household connection 38 0 3 0 19 60
Private well/borehole 8 2 3 2 22 37
Public standpost 0 0 0 0 3 3
Communal well/handpump 5 0 2 2 10 19
Surface 1 0 0 0 0 1
Total 52 2 8 4 54 120

39
Community Water plus
4.4 User satisfaction
The survey also asked consumers how satisfied they are with their water supply. As shown in Table
18, less than half of users are very satisfied in all villages. Whilst only very few users are acutely
dissatisfied in Bero and Khijiri, more than one third in Rai Bazaar say they are not satisfied with the
water supply they receive, a percentage that is higher than in Brambe, the control village. Users
mostly complain about inadequate pressure and the supply duration, as well as water quality in
Brambe.
Table 18: User satisfaction with water supply
Bero Khijiri Rai Bazaar Brambe
Very satisfied 43% 43% 20% 37%
Somewhat satisfied 50% 50% 43% 40%
Not satisfied 7% 7% 37% 23%
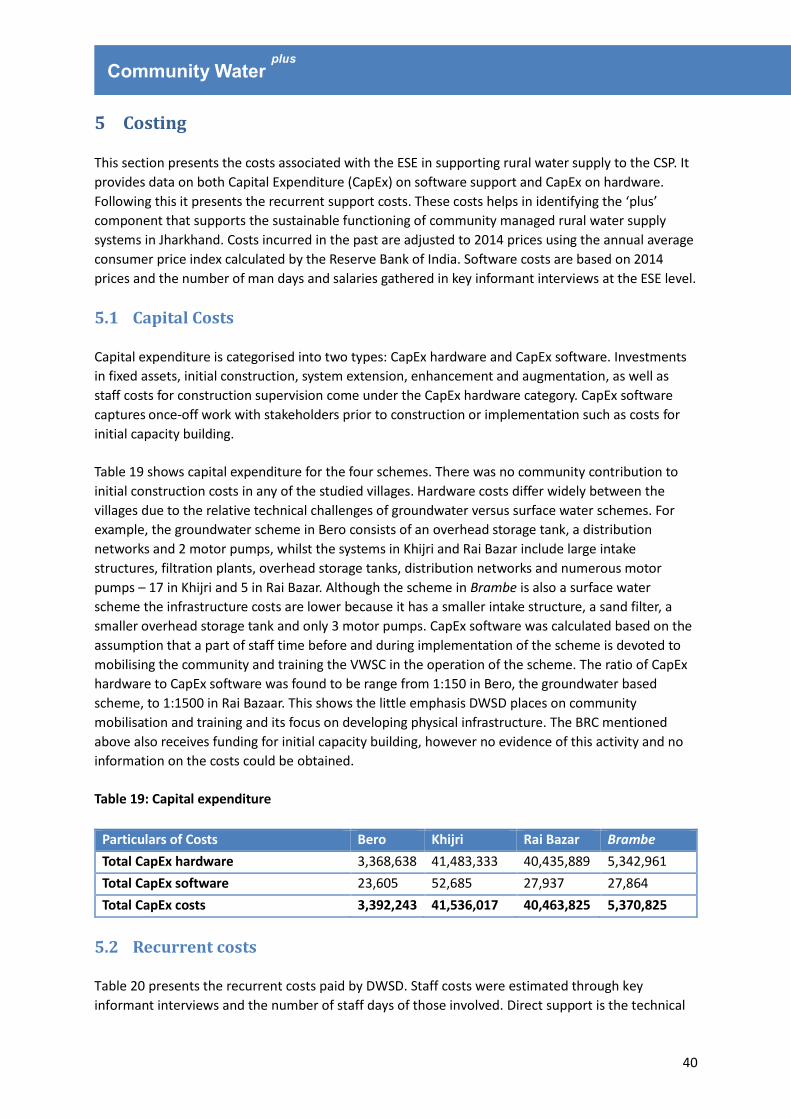
40
Community Water plus
5 Costing
This section presents the costs associated with the ESE in supporting rural water supply to the CSP. It
provides data on both Capital Expenditure (CapEx) on software support and CapEx on hardware.
Following this it presents the recurrent support costs. These costs helps in identifying the ‘plus’
component that supports the sustainable functioning of community managed rural water supply
systems in Jharkhand. Costs incurred in the past are adjusted to 2014 prices using the annual average
consumer price index calculated by the Reserve Bank of India. Software costs are based on 2014
prices and the number of man days and salaries gathered in key informant interviews at the ESE level.
5.1 Capital Costs
Capital expenditure is categorised into two types: CapEx hardware and CapEx software. Investments
in fixed assets, initial construction, system extension, enhancement and augmentation, as well as
staff costs for construction supervision come under the CapEx hardware category. CapEx software
captures once-off work with stakeholders prior to construction or implementation such as costs for
initial capacity building.
Table 19 shows capital expenditure for the four schemes. There was no community contribution to
initial construction costs in any of the studied villages. Hardware costs differ widely between the
villages due to the relative technical challenges of groundwater versus surface water schemes. For
example, the groundwater scheme in Bero consists of an overhead storage tank, a distribution
networks and 2 motor pumps, whilst the systems in Khijri and Rai Bazar include large intake
structures, filtration plants, overhead storage tanks, distribution networks and numerous motor
pumps – 17 in Khijri and 5 in Rai Bazar. Although the scheme in Brambe is also a surface water
scheme the infrastructure costs are lower because it has a smaller intake structure, a sand filter, a
smaller overhead storage tank and only 3 motor pumps. CapEx software was calculated based on the
assumption that a part of staff time before and during implementation of the scheme is devoted to
mobilising the community and training the VWSC in the operation of the scheme. The ratio of CapEx
hardware to CapEx software was found to be range from 1:150 in Bero, the groundwater based
scheme, to 1:1500 in Rai Bazaar. This shows the little emphasis DWSD places on community
mobilisation and training and its focus on developing physical infrastructure. The BRC mentioned
above also receives funding for initial capacity building, however no evidence of this activity and no
information on the costs could be obtained.
Table 19: Capital expenditure
Particulars of Costs Bero Khijri Rai Bazar Brambe
Total CapEx hardware 3,368,638 41,483,333 40,435,889 5,342,961
Total CapEx software 23,605 52,685 27,937 27,864
Total CapEx costs 3,392,243 41,536,017 40,463,825 5,370,825
5.2 Recurrent costs
Table 20 presents the recurrent costs paid by DWSD. Staff costs were estimated through key
informant interviews and the number of staff days of those involved. Direct support is the technical

41
Community Water plus
and administrative assistance given by the Junior and Assistant Engineers, per capita costs for which
are similar for all villages.
DWSD plumbers, mechanics, electricians and masons provide support for operation and
maintenance in all villages. The service providers’ electricity bills are paid by the department and
make up the majority of recurring costs.
Chemicals for water treatment are supplied by the department, costs of which are higher in the
surface water schemes in Khijri and Rai Bazaar. The committee in Rai Bazaar has not received the
matching grant yet, because the scheme is relatively new and has not submitted audited accounts.
The expenditure on this O&M support is significantly higher than expenditure on direct support in all
villages, with a ratio of 1:4 to 1:7. Indirect support costs were estimated by assuming that 2.5% of the
overall budget is used for high-level coordination and policy formulation.
Table 20: Recurrent costs paid by DWSD
Bero Khijri Rai Bazaar Brambe
Staff costs for direct support 101,190 98,409 100,130 62,742
Auditing cost 525 420 700 350
Information and communication materials 2500 2000 3000 1500
Total costs for direct support 104,215 100,829 103,830 64,592
Staff costs for O&M support 50,535 62,921 53,094 48,043
Electricity paid by DWSD 252,000 182,400 270,000 204,000
Chemicals provided by DWSD 8,000 30,000 25,000 4,000
Spares and repairs paid by DWSD 0 20,000 0 0
Matching grant 30,000 67,000 0 52,000
Total support for O&M 340,535 362,321 348,094 308,043
5.3 Capital maintenance
Data on capital maintenance could only be obtained for two villages. DWSD purchased a new motor
for the scheme in Bero at a cost of INR 56,000 in 2013, and paid for repairing a burnt motor in
Brambe for INR 44,640.
5.4 Overview of costs
As discussed in Chapter 3.5 above, service providers pay their staff salaries with tariffs collected from
users, which represents a community contribution towards operating the water supply. Table 21
shows total recurring costs. Overall recurring costs are likely to be significantly higher in Khijri and Rai
Bazaar, as information on a major part of the electricity bills paid by DWSD directly could not be
obtained. Therefore, these two schemes are not analysed comparatively, as the available costs are
likely a significant underestimation.
The tariff collection only covers part of the total reported expenditure on O&M, 16% in Bero and 14%
in Brambe. This shows the significant financial support VWSCs receive from the department, and the
need to increase tariff collection dramatically should the electricity bills paid by them directly. Total

42
Community Water plus
per capita costs are lower in Bero, which might be explained by the larger population and economies
of scale and the fact that Brambe is a mixed scheme, also using surface water, whilst Bero is a purely
groundwater-based scheme.
Table 21: Overview of O&M costs
Particulars of Costs Bero Khijri Rai Bazaar Brambe
Total recurrent costs paid by CSP 70,600 186,000 156,000 48,600
Costs for O&M support 340,535 362,321 348,094 308,043*
Total O&M costs 411,135 548,321 504,094 356,643
Table 222 Summary Cost Table (INR)
Table 23 Summary Cost Table (PPP USD$)
Jharkhand Summary Cost Table - calculated as the average cost per person, that is averaging across the three 'successful' villages
Source of funds Use of funds - implementation
CapEx
hardware
CapEx
softwareCAPEX TOTAL
OpEx
labour &
materials
OpEx
power
OpEx bulk
water
OpEx
enabling
support
CapManEx
RECURRENT
EXPENDITURE
TOTAL
Community/consumers - - - 1.21$ - - - 0.41$ 1.62$
Local self-government - - - - - - - - -
- - - - - - - - -
State government entity - - - - - - - - -
State water supply agency 103.43$ 0.47$ 103.90$ 1.90$ 1.98$ - 0.03$ - 3.92$
National Government 103.43$ - 103.43$ - - - - - -
NGO national & international - - - - - - - - -
International donor - - - - - - - - -
TOTALS 206.87$ 0.47$ 207.34$ 3.11$ 1.98$ -$ 0.03$ 0.41$ 5.54$
Median of 20 case studies 184.16$ 11.78$
'Plus' %age 100% 100% 100% 61% 100% - 100% 0% 71%
Median of 20 case studies 95% 57%
Notes: CapManEx is only for the village Bero, as no data could be obtained for the other best practice villages
Use of funds - annual recurrent
Jharkhand Summary Cost Table - calculated as the average cost per person, that is averaging across the three 'successful' villages
Source of funds Use of funds - implementation
CapEx
hardware
CapEx
softwareCAPEX TOTAL
OpEx
labour &
materials
OpEx
power
OpEx bulk
water
OpEx
enabling
support
CapManEx
RECURRENT
EXPENDITURE
TOTAL
Community/consumers - - - 21INR - - - 7INR 28INR
Local self-government - - - - - - - - -
- - - - - - - - -
State government entity - - - - - - - - -
State water supply agency 1,815INR 8INR 1,823INR 33INR 35INR - 1INR - 69INR
National Government 1,815INR - 1,815INR - - - - - -
NGO national & international - - - - - - - - -
International donor - - - - - - - - -
TOTALS 3,629INR 8INR 3,638INR 55INR 35INR - 1INR 7INR 97INR
Median of 20 case studies 3,231INR 207INR
'Plus' %age 100% 100% 100% 61% 100% - 100% 0% 71%
Median of 20 case studies 95% 57%
Notes: CapManEx is only for the village Bero, as no data could be obtained for the other best practice villages
Use of funds - annual recurrent
43
Community Water plus
The INR Indian Rupee conversion to the USD United States Dollar has been undertaken at the mid 2014
exchange rate of INR60/USD$ with a Purchasing Power Parity (PPP) multiplier of 3.42 applied in order to give
the best interpretation of India costs in global terms (http://data.worldbank.org/indicator/PA.NUS.PRVT.PP).
6 Conclusions
This report investigated the support given to community service providers in Jharkhand and how this
affected their performance.
The institution responsible for implementing water supply schemes and supporting service providers
is the Drinking Water and Sanitation Department (DWSD), Jharkhand. The assessment showed that
the department has very qualified technical staff and good leadership. There is room for
improvement in community orientation, with staff mostly focusing on technical projects and not on
‘soft’ skills such as community mobilisation. Regular support to VWSCs is given by monitoring
functionality, auditing, water quality testing and technical assistance. The Jal Sahiya, the VWSC
president and vice-president receive training from DWSD, although there is no effective mechanism
to retrain committee members after they change. In the studied villages quite intensive, but
informal, additional support is given to the community service providers. Department engineers
provide technical assistance and give advice in running the scheme, whilst DWSD staff such as
plumbers or electricians are often called to assist in minor maintenance and repairs. The department
pays the entire electricity bills for VWSCs, which are a major part of the overall costs. However, in the
future VWSCs should pay the electricity bills themselves and the department has negotiated a 75%
discount on the electricity tariff with the Electricity Department, showing effective cooperation with
external institutions. Further financial assistance is given in the form of a matched grant in the
amount of the total tariff collection, which is transferred to the VWSC after submission of audited
accounts. Partnering between DWSD and service providers was found to be mostly of the
transactional type, which is common in a government department supporting a large number of
service providers.
DWSD partners with an NGO to provide capacity building and ongoing software support in the
villages through a Block Resource Centre (BRC). However, no evidence of any activities in regards to
water supply could be found in the course of this study; the little support given by BRC is limited to
sanitation. Ensuring that BRC fulfils its duties in software support for water supply would lead to a
more complete support environment.
Water supply in all four villages is managed by VWSCs. Although the committees are headed by the
respective Gram Panchayat president, they act independently from the Gram Panchayat. They have
their own bank accounts, to which funds such as the matching grant are transferred directly. This has
helped reduce delays and the Gram Panchayat using funds for other purposes. Each VWSC has a ‘Jal
Sahiya’ (water volunteer) who acts as treasurer and conducts water quality testing. The Jal Sahiya is
selected from the village’s daughters-in-law, ensuring that she stays in the village and does not move
away after marriage. In two of the best practice villages, Bero and Khijri, the number of connections
have increased significantly since the handover to VWSC in 2011, showing the effectiveness of
service provision. The service provider in Bero has effectively reduced the number of defaulters and
illegal connections by threatening legal action and waiving all dues older than one year. The VWSC
president used his position as Gram Panchayat president to send these letters on the official
letterhead and in the name of the Gram Panchayat, which lent additional authority to them. This
shows the value of good cooperation between VWSC and Gram Panchayat. The VWSCs showed
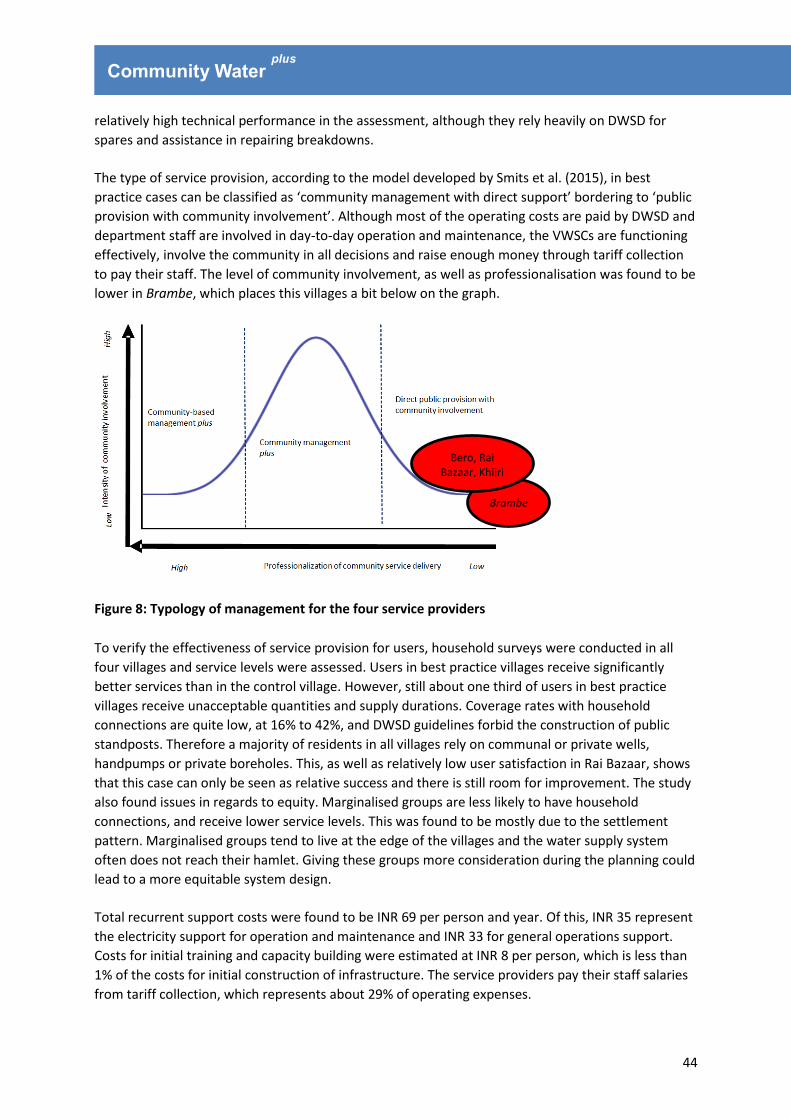
44
Community Water plus
relatively high technical performance in the assessment, although they rely heavily on DWSD for
spares and assistance in repairing breakdowns.
The type of service provision, according to the model developed by Smits et al. (2015), in best
practice cases can be classified as ‘community management with direct support’ bordering to ‘public
provision with community involvement’. Although most of the operating costs are paid by DWSD and
department staff are involved in day-to-day operation and maintenance, the VWSCs are functioning
effectively, involve the community in all decisions and raise enough money through tariff collection
to pay their staff. The level of community involvement, as well as professionalisation was found to be
lower in Brambe, which places this villages a bit below on the graph.
Figure 8: Typology of management for the four service providers
To verify the effectiveness of service provision for users, household surveys were conducted in all
four villages and service levels were assessed. Users in best practice villages receive significantly
better services than in the control village. However, still about one third of users in best practice
villages receive unacceptable quantities and supply durations. Coverage rates with household
connections are quite low, at 16% to 42%, and DWSD guidelines forbid the construction of public
standposts. Therefore a majority of residents in all villages rely on communal or private wells,
handpumps or private boreholes. This, as well as relatively low user satisfaction in Rai Bazaar, shows
that this case can only be seen as relative success and there is still room for improvement. The study
also found issues in regards to equity. Marginalised groups are less likely to have household
connections, and receive lower service levels. This was found to be mostly due to the settlement
pattern. Marginalised groups tend to live at the edge of the villages and the water supply system
often does not reach their hamlet. Giving these groups more consideration during the planning could
lead to a more equitable system design.
Total recurrent support costs were found to be INR 69 per person and year. Of this, INR 35 represent
the electricity support for operation and maintenance and INR 33 for general operations support.
Costs for initial training and capacity building were estimated at INR 8 per person, which is less than
1% of the costs for initial construction of infrastructure. The service providers pay their staff salaries
from tariff collection, which represents about 29% of operating expenses.
Brambe
Bero, Rai Bazaar, Khijri
45
Community Water plus
This shows that the service is heavily subsidised and the VWSC would have to increase revenue
significantly if electricity and all minor maintenance should be paid by the community. This could be
achieved by providing more household connections and increasing tariffs.
Overall, these findings suggest that community service providers in Jharkhand, with the current
support received from DWSD, are able to provide acceptable service to most consumers. However,
connection rates are quite low and due to the absence of public standposts, a majority of residents
rely on other water sources, therefore more efforts should be made to increase the number of
connections. Service providers would need to increase their revenue dramatically if they should pay
for the entire operating expenses, as tariffs currently only cover a small part of it and DWSD is
directly subsidising service provision by paying for electricity bills and minor maintenance. In terms of
support, community mobilisation and capacity building could be improved, for example through a
systematic way of retraining new committee members. All in all, the overall performance can be seen
as a good example of relative success, given Jharkhand’s history of political instability, the
socio-economic situation and the very nascent stage of Panchayati Raj institutions and community
management in the State.
46
Community Water plus
References
Arnstein, S.R. 1969. A Ladder of Citizen Participation. Journal of the American Planning Association 35 (4): 216–224
Boulenouar, J., Schweitzer, R. and H. Lockwood. 2013. Mapping sustainability assessment tools to support sustainable water and sanitation service delivery. Wivenhoe, UK: Aguaconsult
Davis J. and Iyer P., 2002.Taking Sustainable Rural Water Supply Services to Scale.A Discussion Paper. Washington, D.C.: Bank Netherlands Water Partnership – Water and Sanitation Program.
Demirjian, A. 2002.Partnering in Support of International Development Initiatives: The INTOSAI Case Study. Consulting and Audit Canada
Fonseca, C., Franceys, R. & Perry, C. 2010.Guidelines for User Fees and Cost Recoveryfor Rural, Non-Networked, Water and Sanitation Delivery, African Development Bank, Tunis
Fonseca, C., Franceys, R., Batchelor, C., McIntyre, P., Klutse, A., Komives, K., Moriarty, P., Naafs, A., Nyarko, K., Pezon, C., Potter, A., Reddy, R. and Snehalatha, M., 2011. Life Cycle Costs Approach; Costing sustainable services. Briefing Note 1a (second edition). The Hague, the Netherlands: IRC International Water and Sanitation Centre
Fonseca, C.; Smits, S.; Nyarko, K.; Naafs, A. and Franceys, R. 2013.Financing capital maintenance of rural water supply systems: Current practices and future options.WASHCost Working Paper No. 9. The Hague, the Netherlands: IRC International Water and Sanitation Centre.
Franceys, R. 2001. Promoting international scientific and technological co-operation in sustainable water and sanitation for people. In: OECD. 2001. International Science and Tecnology Co-Operation: Towards Sustainable Development. Proceedings of the OECD Seoul Conference.
Franceys, R. and Gerlach, E. 2008.Regulating water and sanitation for the poor: Economic regulation for public and private partnerships.London, United KingdomK: Earthscan.
James, A.J., 2011. India: Lessons for Rural Water Supply; Assessing progress towards sustainable service delivery. The Hague: IRC International Water and Sanitation Centre and Delhi: iMaCS.
Lockwood H. and S. Smits. 2011. Supporting Rural Water Supply: Moving towards a Service Delivery Approach. Rugby, UK: Practical Action Publishing
Moriarty, P. Smits, S., Butterworth J. and R. Franceys. 2013. Trends in rural water supply: towards a service delivery approach. Water Alternatives 6(3): 329-349
Moriarty, P., Batchelor, C., Fonseca, C., Klutse, A., Naafs, A., Nyarko, A., Pezon, K., Potter, A., Reddy, R. and Snehalata, M., 2011.Ladders and levels for assessing and costing water service delivery. WASHCost working paper No. 2. The Hague, The Netherlands: IRC International Water and Sanitation Centre.
Nickson, A. and R. Franceys. 2003. Tapping the Market; The Challenge of Institutional Reform in the Urban Water Sector. Palgrave MacMillan: UK
Smits, S., Verhoeven, J., Moriarty, P., Fonseca, C. and H. Lockwood. 2011. Arrangements and costs of support to rural water service providers. WASHCost Working Paper 5. The Hague, The Netherlands: IRC International Water and Sanitation Centre
Smits, S., Franceys, R., Mekala, S. & Hutchings, P. (2015) Understanding the Resource Implications of the ‘Plus’ in Community Management of Rural Water Supply Systems in India: Concepts and Research Methodology (Working Paper). Cranfield University/IRC.
Smits, S.; Rojas, J. and Tamayo, P. 2013. The impact of support to community-based rural water service providers: Evidence from Colombia.Water Alternatives 6(3): 384-404
Smits, S. and K. Baby. 2013. Islands of success; Towards water, sanitation and hygiene services for WASHPlus. 2013. WASH Sustainability Index Tool. Online tool, at: http://www.washplus.org/rotary-
usaid

47
Community Water plus
Appendices
Institutional assessment tables
Statement Agreement
Organisational autonomy
Sets own organisational policies and goals and changes them as necessary
to provide guidance and direction in achieving the objectives of the
institution
Disagree (2)
Determines level of funding required to meet organisational goals and
secures sufficient funds from appropriate sources
Agree (3)
Conducts such studies as may be necessary and carries out long-term
planning to meet the expected demands on the institution; approves and
acts on such studies and plans, including appropriate levels of investment
to meet future demand
Agree (3)
Determines own organisational structure including roles and
responsibilities of major divisions
Strongly Agree (4)
Employs levels of employee compensation, including salaries and
benefits, sufficient to attract and retain capable staff
Agree (3)
Average Score 3
Leadership
Provides clear sense of mission; articulates mission; involves people with
the mission so they get a sense of ownership of mission; gets people
excited about the mission, believing in it.
Agree (3)
Identifies clear performance standards and is strict but fair; gives positive
and negative feedback where due; disciplines where necessary based on
performance.
Agree (3)
Maintains sense of balance between future vision and everyday
operational matters.
Disagree (2)
Demonstrates personal integrity (i.e., does not claim false overtime, take
money, or cut corners for personal gain); instils sense of integrity in
others.
Agree (3)
Continuously guides technical staff on need to ensure that levels of
technology used by the institution are those which are most suitable in
terms of simplicity of operation and maintenance; monitors activities in
this regard.
Agree (3)
Average Score 2.8
Management and Administration
Managers have a clear sense of their own and others' roles and
responsibilities. They communicate roles and expectations clearly to
others and involve them in the process of defining their roles and
responsibilities.
Agree (3)
People are held accountable for getting work done. Agree (3)

48
Community Water plus
Administrative systems for the following functions have been developed
and are regularly used. (Note: rate each system for effectiveness.)
a. Accounting and Budgeting Strongly Disagree (1)
b. Personnel Disagree (2)
c. Management Information Disagree (2)
Average score 2.2
Community Orientation
Staff at every level demonstrate that they are oriented toward serving
the community / community service provider, and ensure engagement
with different groups within community, including the most marginalized;
when observed, their decisions and actions are clearly driven by what is
best for the community.
Agree (3)
There are identifiable mechanisms for communities / community service
providers to interact with key areas of the institution over important
matters (e.g., call-down for technical assistance, bill disputes, service
problems), that are also accessible to the most marginalized groups
within the community.
Agree (3)
There is clear evidence that the institution responds to complaints,
emergencies, and suggestions which community members / community
service providers make.
Disagree (2)
There are identifiable, ongoing, and effective measures to educate
communities / community service providers about institutional services
and requirements.
Strongly Disagree (1)
The institution makes efforts to invite and evoke an effective level of
community / community service providers participation (e.g.,
mechanisms for communities to bring concerns/complaints to the
institutions).
Agree (3)
Average score 2.4
Technical Capability
Consistently makes sound technical decisions and effectively serves
management by conducting technical studies and planning as requested.
Agree (3)
Ensures effective control of the quality of the end product and all other
technical operations.
Disagree (2)
Uses or adapts technology which is suitable for the specific needs of the
institution and avoids temptation to use more exciting-but not
appropriate-technologies learned by staff who were trained in other
settings.
Agree (3)
Maintains levels of in-house technical skills adequate for routine
technical responsibilities and sub-contracts to outside specialists those
tasks which are either beyond the institution's own capabilities or
necessary to meet peak needs.
Agree (3)
Conducts practical research and experiments to improve existing uses of
technology for local conditions and needs.
Agree (3)
Average score 2.8

49
Community Water plus
Developing and Maintaining Staff
A clear process for determining skill needs exists and is the basis for
designing training programmes.
Disagree (2)
A system exists for developing competent managers and supervisors. Disagree (2)
The institution provides adequate incentives to maintain staff (i.e. salary
levels, employee, benefits)
Agree (3)
A clear system exists for hiring qualified personnel and firing or
disciplining personnel when necessary.
Disagree (2)
A career path is open to social/community development staff and
technical staff and management staff.
Disagree (2)
Average score 2.2
Organizational Culture
An observable team spirit exists among the staff. Disagree (2)
People express a sense of ownership and pride about working that is
communicated by such statements as "this is a good place to work."
Agree (3)
Employees are able to articulate the history and legends of the
organization in positive ways.
Strongly Disagree (1)
Continuity in the organizational culture is maintained (even with staff
turnover at high or low organizational levels).
Strongly Disagree (1)
Staff place a value on maintaining the organisations physical
infrastructure (offices, treatment plants, grounds) of the organization.
Facilities look clean, well maintained, and attractive.
Agree (3)
Average score 2
Interactions with Key External Institutions
Top management stays well informed about external policy, financial,
and regulatory issues and actions.
Agree (3)
Management maintains direct contact with the key individuals in all
important external entities.
Agree (3)
Specific strategies are formulated to influence policies, legislation, and
other activities to obtain necessary approvals and resources.
Agree (3)
Programmes are developed to influence the public in support of
institutional goals.
Disagree (2)
To the extent to which it is not already responsible/involved in services,
local government/Panchayati Raj is kept full informed and involved in the
process of support and monitoring
Strongly Agree (4)
Average score 3
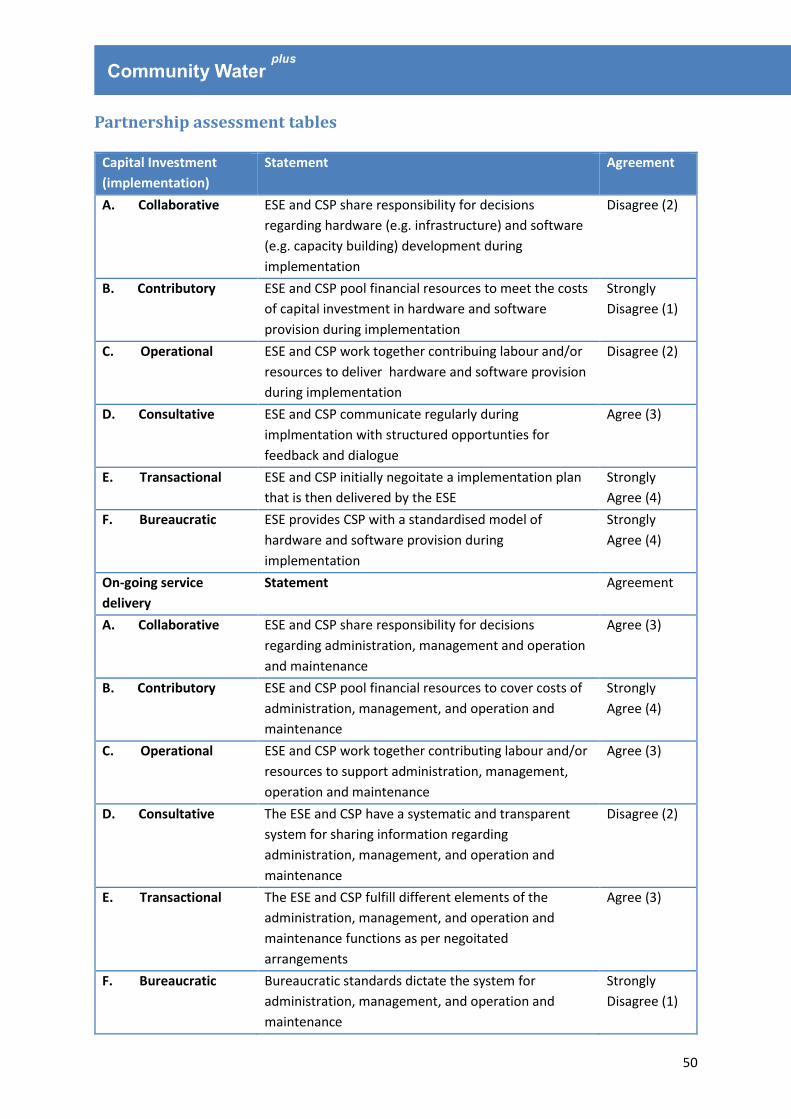
50
Community Water plus
Partnership assessment tables
Capital Investment
(implementation)
Statement Agreement
A. Collaborative ESE and CSP share responsibility for decisions
regarding hardware (e.g. infrastructure) and software
(e.g. capacity building) development during
implementation
Disagree (2)
B. Contributory ESE and CSP pool financial resources to meet the costs
of capital investment in hardware and software
provision during implementation
Strongly
Disagree (1)
C. Operational ESE and CSP work together contribuing labour and/or
resources to deliver hardware and software provision
during implementation
Disagree (2)
D. Consultative ESE and CSP communicate regularly during
implmentation with structured opportunties for
feedback and dialogue
Agree (3)
E. Transactional ESE and CSP initially negoitate a implementation plan
that is then delivered by the ESE
Strongly
Agree (4)
F. Bureaucratic ESE provides CSP with a standardised model of
hardware and software provision during
implementation
Strongly
Agree (4)
On-going service
delivery
Statement Agreement
A. Collaborative ESE and CSP share responsibility for decisions
regarding administration, management and operation
and maintenance
Agree (3)
B. Contributory ESE and CSP pool financial resources to cover costs of
administration, management, and operation and
maintenance
Strongly
Agree (4)
C. Operational ESE and CSP work together contributing labour and/or
resources to support administration, management,
operation and maintenance
Agree (3)
D. Consultative The ESE and CSP have a systematic and transparent
system for sharing information regarding
administration, management, and operation and
maintenance
Disagree (2)
E. Transactional The ESE and CSP fulfill different elements of the
administration, management, and operation and
maintenance functions as per negoitated
arrangements
Agree (3)
F. Bureaucratic Bureaucratic standards dictate the system for
administration, management, and operation and
maintenance
Strongly
Disagree (1)

51
Community Water plus
Asset Renewal Statement Agreement
A. Collaborative ESE and CSP share responsibility for decision making
regarding asset renewal
Disagree (2)
B. Contributory ESE and CSP save and pool financial resources to meet
the costs of asset renewal
Agree (3)
C. Operational ESE and service provider contribute labour and/or
resources for asset renewal
Agree (3)
D. Consultative ESE and CSP systematically share information
regarding service levels and technology status enabling
proper planning for asset renewal
Disagree (2)
E. Transactional Asset renewal is dependent on ngeoitations between
ESE and CSP following a request from the CSP
Strongly
Agree (4)
F. Bureaucratic Asset renewal is dependent on generic programme
timelines (i.e. every X years)
Strongly
Disagree (1)
Service Enhancement or
Expansion
Statement Agreement
A. Collaborative ESE and CSP share responsibility for decisions
regarding service enhancement or expansion
Disagree (2)
B. Contributory ESE and CSP save and pool financial resources to meet
the costs of service enhancement or expansion
Agree (3)
C. Operational ESE and CSP contribute labour and/or resources for
service enhancement or expansion
Agree (3)
D. Consultative Information regarding service levels, technology status
and population is systematically shared, enabling
proper planning for service enhancement or expansion
Disagree (2)
E. Transactional Service enhancement or expansion is dependent on
ngeoitations between ESE and CSP following a request
from the CSP
Strongly
Agree (4)
F. Bureaucratic Planned asset replacement, expansion or renewal is
dependent on generic programme timelines (e.g.
every X years and/or with every X% of population
increase)
Strongly
Disagree (1)

52
Community Water plus
Service level tables
Table 24: Service levels for household connections in practice villages (n=43)
Household connections in best practice (n=43)
Quantity Accessibility Quality Continuity Reliability
High 28% 100% 65% 2% 98%
Improved 19% 0% 0% 9% 2%
Basic 33% 0% 19% 51% 0%
Sub-standard 16% 0% 16% 37% 0%
No service 5% 0% 0% 0% 0%
Table 25: Service levels for household connections in control village (n=17)
Household connections in control (n=17)
Quantity Accessibility Quality Continuity Reliability
High 18% 100% 76% 0% 100%
Improved 0% 0% 0% 0% 0%
Basic 29% 0% 12% 24% 0%
Sub-standard 18% 0% 12% 76% 0%
No service 35% 0% 0% 0% 0%
Table 26: Service levels in Bero village (n=30)
Bero (n=30)
Quantity Accessibility Quality Continuity Reliability
High 13% 97% 100% 0% 100%
Improved 3% 0% 0% 0% 0%
Basic 53% 0% 0% 0% 0%
Sub-standard 23% 3% 0% 100% 0%
No service 7% 0% 0% 0% 0%
Table 267: Service levels in Khijiri village (n=30)
Khijiri (n=30)
Quantity Accessibility Quality Continuity Reliability
High 50% 81% 53% 0% 93%
Improved 3% 7% 0% 0% 3%
Basic 7% 4% 23% 100% 0%
Sub-standard 17% 7% 23% 0% 3%
No service 23% 0% 0% 0% 0%

53
Community Water plus
Table 278: Service levels in Rai Bazaar village (n=30)
Rai Bazaar (n=30)
Quantity Accessibility Quality Continuity Reliability
High 13% 83% 70% 5% 100%
Improved 20% 0% 0% 18% 0%
Basic 37% 0% 23% 59% 0%
Sub-standard 20% 3% 7% 18% 0%
No service 10% 13% 0% 0% 0%
Table 289: Service levels in Brambe village (n=30)
Brambe (n=30)
Quantity Accessibility Quality Continuity Reliability
High 10% 67% 83% 0% 93%
Improved 0% 3% 0% 0% 3%
Basic 23% 3% 10% 20% 0%
Sub-standard 30% 10% 7% 80% 3%
No service 37% 17% 0% 0% 0%