Embed Size (px)
Citation preview

Community Resilience Study
Janey Smith Camp, PhD, PE, GISP, CFM
Research Associate Professor, Department of Civil and Environmental Engineering
Associate Director, Vanderbilt Engineering Center for Transportation and Operational
Resiliency
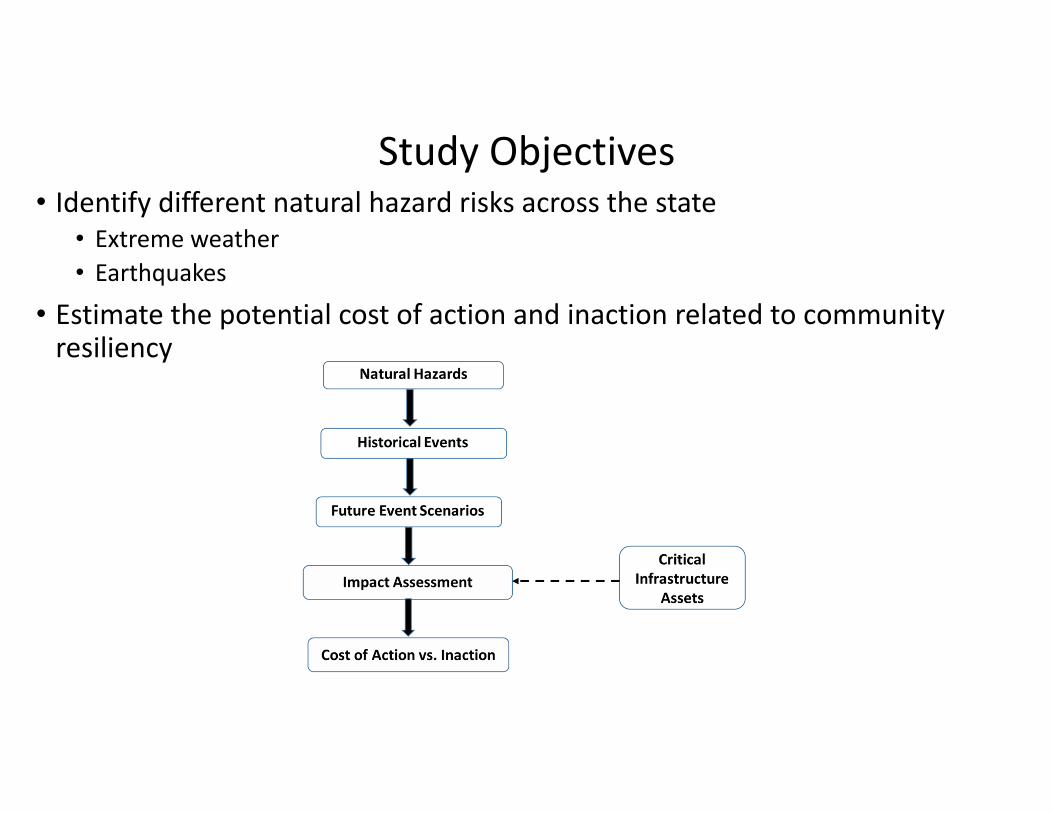
Study Objectives• Identify different natural hazard risks across the state
• Extreme weather• Earthquakes
• Estimate the potential cost of action and inaction related to community resiliency

Tennessee Climate Regions
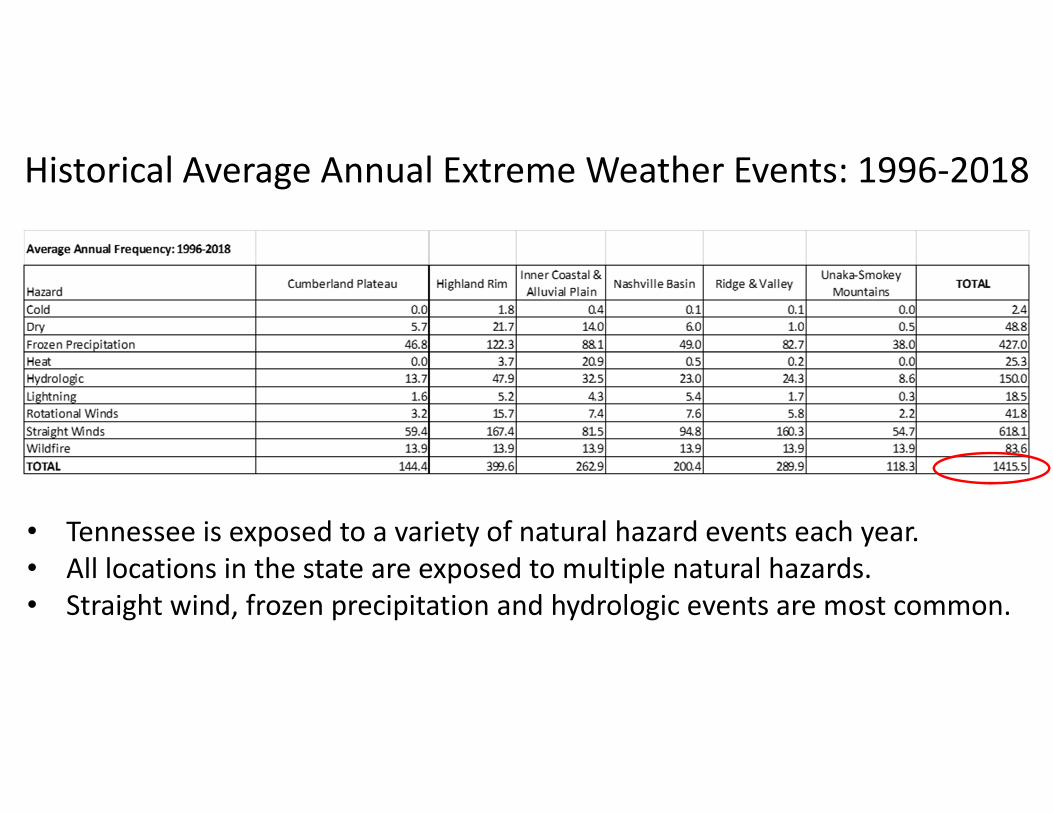
Historical Average Annual Extreme Weather Events: 1996‐2018
• Tennessee is exposed to a variety of natural hazard events each year.• All locations in the state are exposed to multiple natural hazards.• Straight wind, frozen precipitation and hydrologic events are most common.

Projected Average Annual Extreme Weather Events: 2035‐2055
• Extreme weather event frequency is expected to increase in the future, nearly doubling by mid‐century.
• Rising temperatures will be a significant concern.
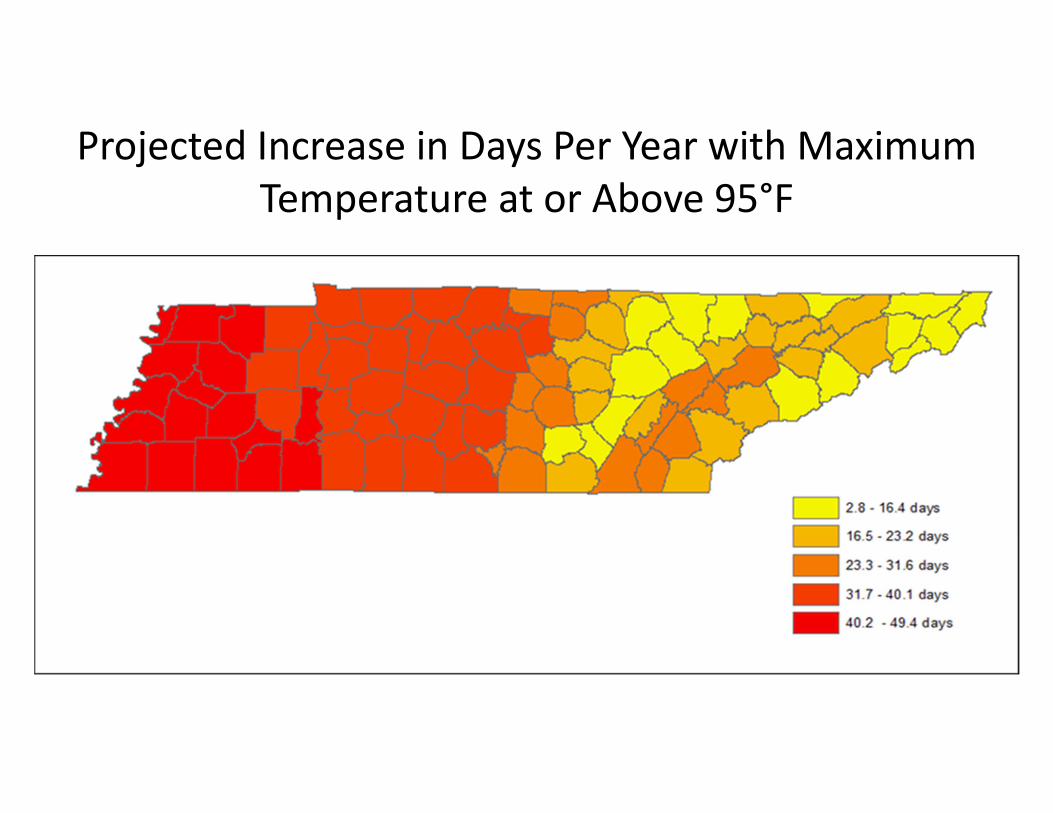
Projected Increase in Days Per Year with Maximum Temperature at or Above 95°F
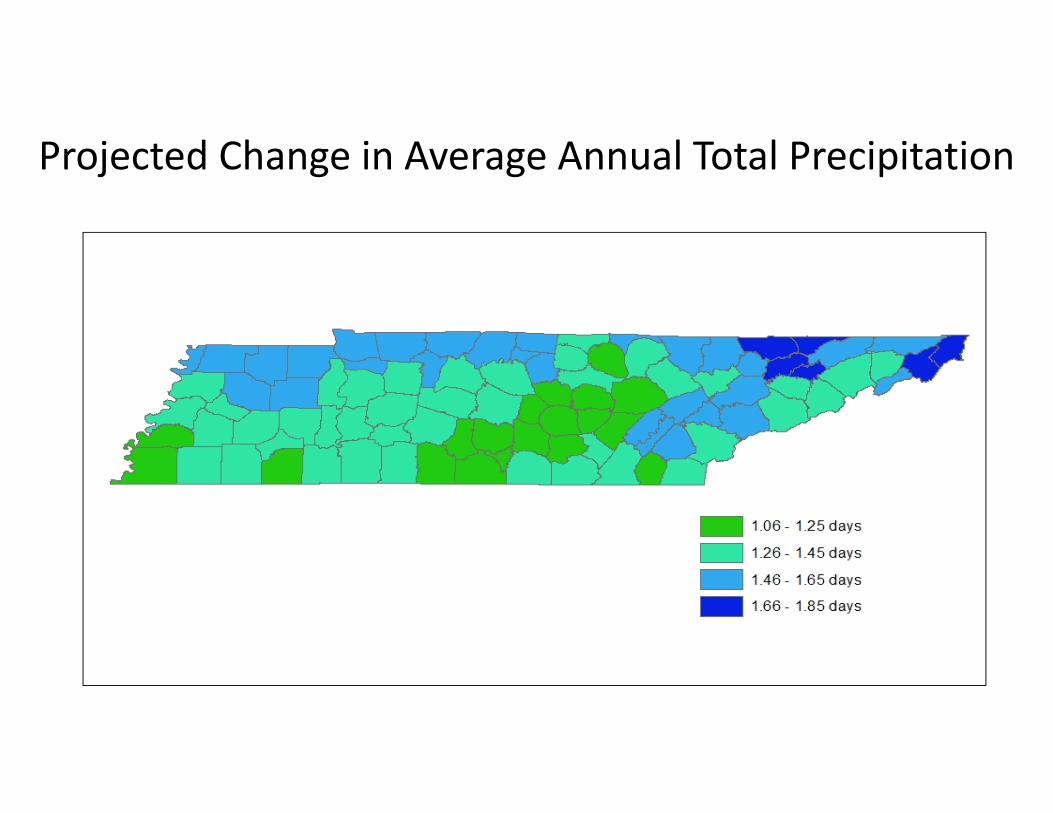
Projected Change in Average Annual Total Precipitation
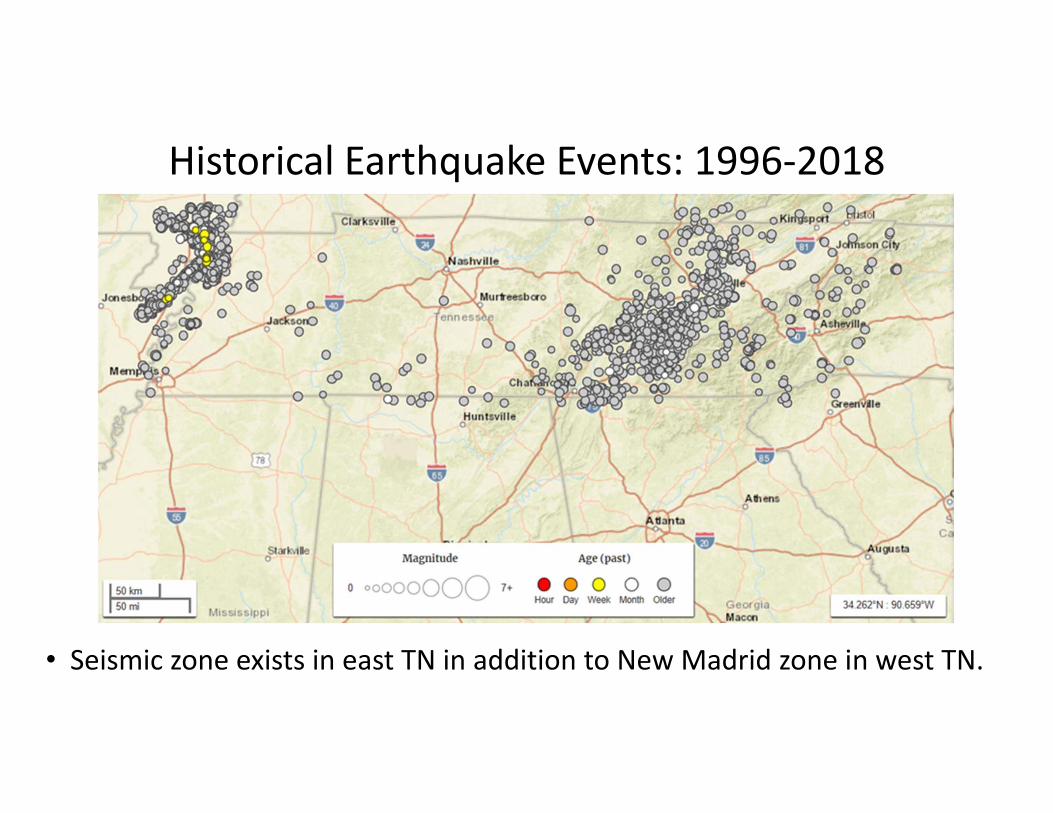
Historical Earthquake Events: 1996‐2018
• Seismic zone exists in east TN in addition to New Madrid zone in west TN.
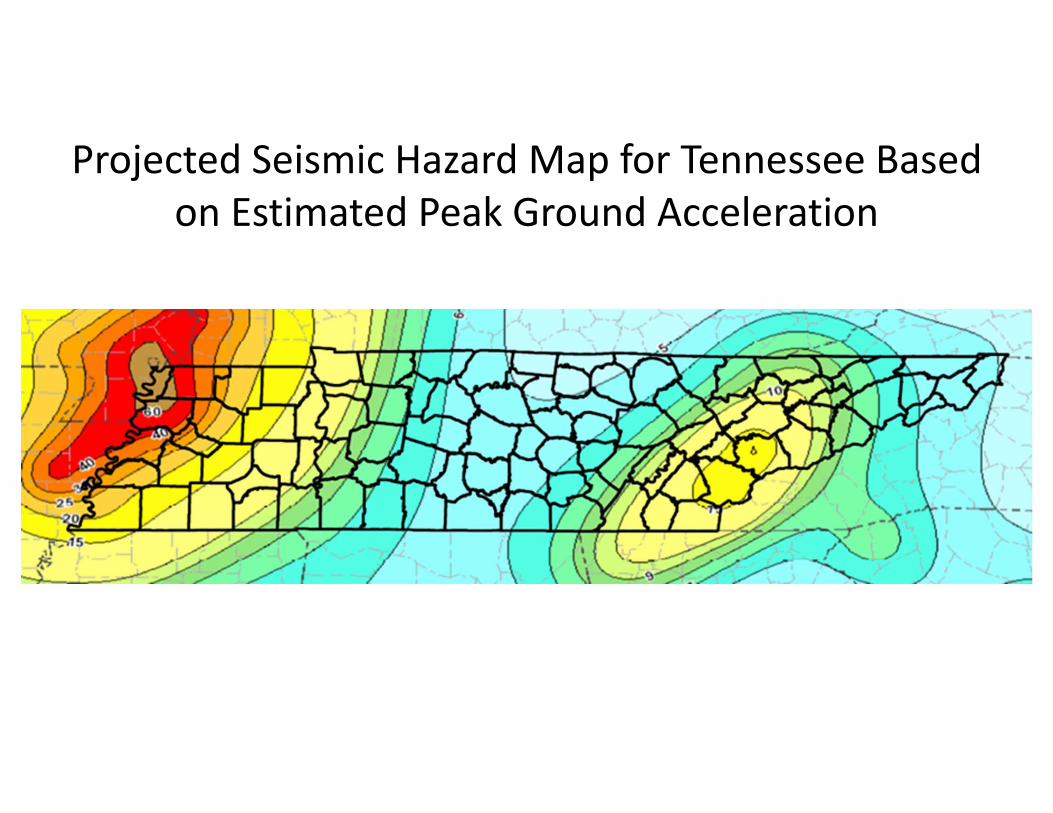
Projected Seismic Hazard Map for Tennessee Based on Estimated Peak Ground Acceleration
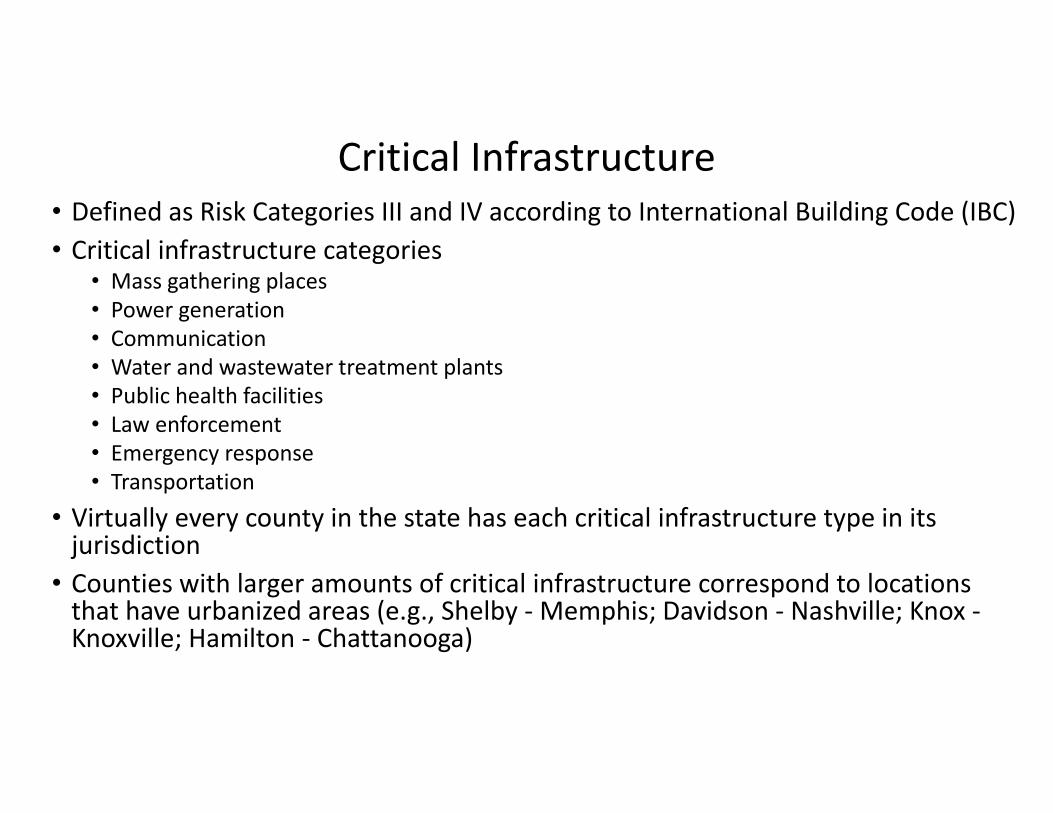
Critical Infrastructure • Defined as Risk Categories III and IV according to International Building Code (IBC)• Critical infrastructure categories
• Mass gathering places• Power generation• Communication• Water and wastewater treatment plants• Public health facilities• Law enforcement• Emergency response• Transportation
• Virtually every county in the state has each critical infrastructure type in its jurisdiction
• Counties with larger amounts of critical infrastructure correspond to locations that have urbanized areas (e.g., Shelby ‐ Memphis; Davidson ‐ Nashville; Knox ‐Knoxville; Hamilton ‐ Chattanooga)
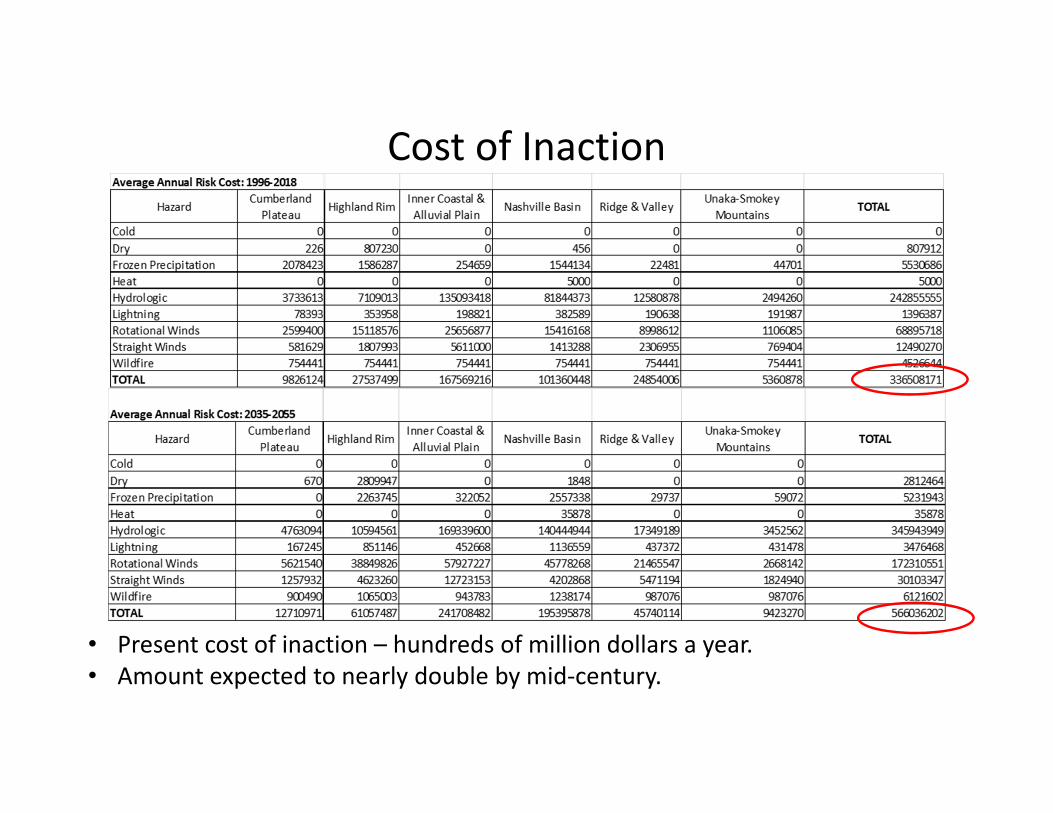
Cost of Inaction
• Present cost of inaction – hundreds of million dollars a year.• Amount expected to nearly double by mid‐century.

Cost of Action Versus Inaction• National Institute of Building Sciences (NIBS) study on financial impacts of investing in natural hazard mitigation actions:
• Benefits accrue to developers, property owners, lenders, tenants, and the community at large
• In addition gains due to avoided disaster losses, investment in risk mitigation actions can act as an economic stimulus by providing job opportunities and other forms of economic development
Exceed 2015 Code Requirements
Meet 2018 Code Requirements
Utilities & Transportation Case Studies
Federally Funded Programs
Overall Hazard B/C Ratio
4:1 11:1 4:1 6:1
Riverine Flood 5:1 6:1 8:1 7:1 Wind 5:1 10:1 7:1 5:1
Earthquake 4:1 12:1 3:1 3:1 Wildland-Urban
Interface Fire 4:1 N/A N/A 3:1
Takeaway Messages
• Tennessee is exposed to a variety of natural hazard events on an annual basis.
• All locations in the state are exposed to multiple natural hazards.• The frequency and severity of these events are expected to increase in the future.
• The cost of inaction is at least several hundred million dollars a year, an amount that is could nearly double by mid‐century.
• Available risk mitigation actions that the state could undertake show a return‐on‐investment of anywhere from 3:1 to 12:1.
• Prudent investment of risk mitigation resources could save hundreds of millions of dollars a year in expected disaster costs.