Embed Size (px)
Citation preview

Community solar on Lopez Island Feasibility study
Sponsored by:
Produced by:
Padric Clancy
Ben Elkin Maryam Mozafari
Hannah Ray Jake Sadie Albert Yuen
MSE/ERG C226 Photovoltaic Materials: Modern Technologies in the Context of a Growing Renewable Energy
Market
Spring 2011, UC Berkley

Community Solar on Lopez Island
`Spring 2011
2
Abstract
Washington State Senate passed a bill (SB6658) in 2010 that promises a feed-in tariff for every kWh generated by community-owned photovoltaic projects with the maximum capacity of 75kW. A community on Lopez Island wishes to take advantage of this new bill by building a solar installation on the property of the Lopez Island School District. The purpose of this report is to study the feasibility of this project by constructing a cash pro forma model that includes different technology & policy related variables. The model will take into account the eligibility requirements for incentive payments from the federal and state governments, as well as from the local utility. It will also suggest the best structure for the legal entity owning the project. Major model inputs were installation date (2011-2013) and installation size (3-15 kW). Major outputs of the model are expected time to payback and rate of return on equity. After completing our cash pro forma model, we found that both community solar and bond-financed photovoltaic projects can be viable under the right conditions. For the best financial results, this project should have Washington-made solar modules and inverters, be financed under a limited-liability corporation, and be a system of approximately 5kW. Furthermore, the project’s construction should be started as soon as possible (2011 or 2012) to take full advantage of federal tax credits and state incentive payments. This report will also include an analysis of the limitations and applicability of the new bill.
Contents 1. Lopez Island School District ....................................................................................... 3
1.1. Introduction .......................................................................................................... 3
1.2. Field Visit ............................................................................................................. 3
1.3. Discussion ............................................................................................................ 5
2. Summary of Solar Incentives ...................................................................................... 7
2.1. Federal Incentives ................................................................................................ 7
2.2. State Incentives .................................................................................................... 7
2.3. Local Incentives ................................................................................................... 8
3. Cash Pro Forma Model Inputs and Assumptions ........................................................ 8
4. Cash Pro Forma Model Outputs and Implications ...................................................... 9
4.1. LLC with ITC U.S. Treasury Grant v. Non-profit 100% Equity ....................... 10
4.2. Non-profit “Green” Bond Funded with 100% Project Debt .............................. 12
4.3. LLC Only Cases: Comparing ITC Grant to ITC Tax Credit.............................. 13
5. What is the best choice for the Lopez Island School District? .................................. 15
6. Evaluation of SB6658 ................................................................................................ 16
7. Conclusion ................................................................................................................. 17
8. Acknowledgements ................................................................................................... 17
9. References ................................................................................................................. 18
Community Solar on Lopez Island
`Spring 2011
3
1. Lopez Island School District
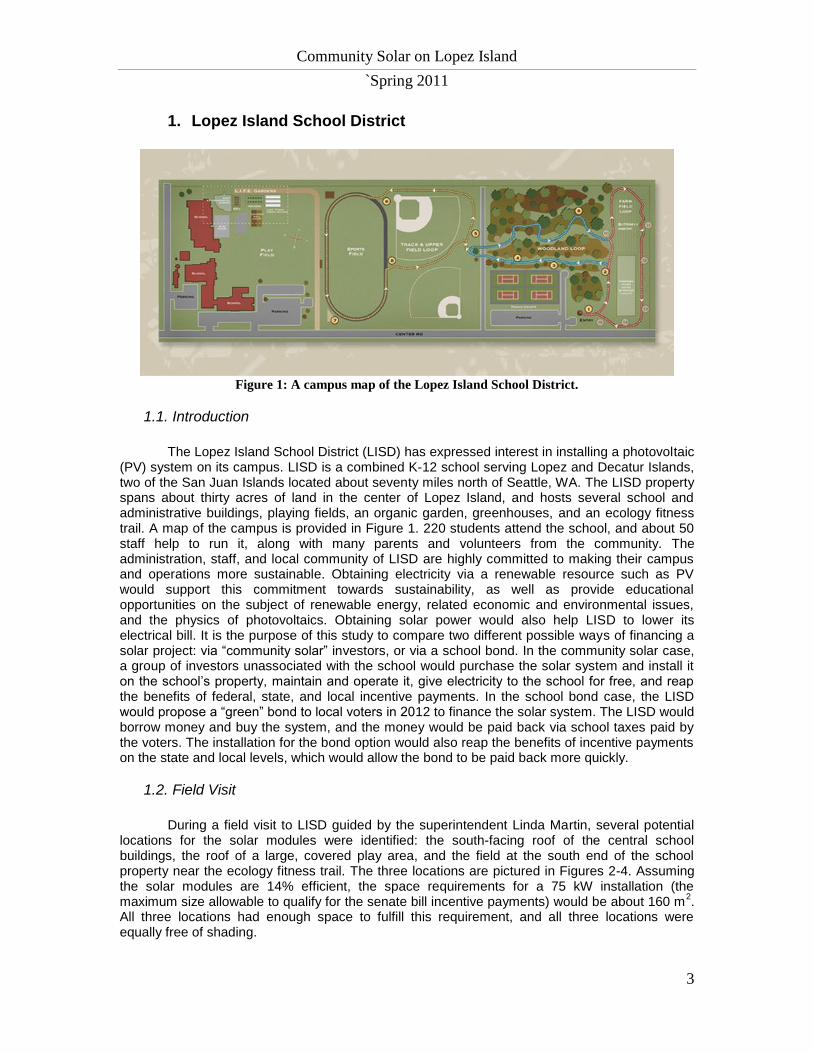
Figure 1: A campus map of the Lopez Island School District.
1.1. Introduction
The Lopez Island School District (LISD) has expressed interest in installing a photovoltaic
(PV) system on its campus. LISD is a combined K-12 school serving Lopez and Decatur Islands, two of the San Juan Islands located about seventy miles north of Seattle, WA. The LISD property spans about thirty acres of land in the center of Lopez Island, and hosts several school and administrative buildings, playing fields, an organic garden, greenhouses, and an ecology fitness trail. A map of the campus is provided in Figure 1. 220 students attend the school, and about 50 staff help to run it, along with many parents and volunteers from the community. The administration, staff, and local community of LISD are highly committed to making their campus and operations more sustainable. Obtaining electricity via a renewable resource such as PV would support this commitment towards sustainability, as well as provide educational opportunities on the subject of renewable energy, related economic and environmental issues, and the physics of photovoltaics. Obtaining solar power would also help LISD to lower its electrical bill. It is the purpose of this study to compare two different possible ways of financing a solar project: via “community solar” investors, or via a school bond. In the community solar case, a group of investors unassociated with the school would purchase the solar system and install it on the school’s property, maintain and operate it, give electricity to the school for free, and reap the benefits of federal, state, and local incentive payments. In the school bond case, the LISD would propose a “green” bond to local voters in 2012 to finance the solar system. The LISD would borrow money and buy the system, and the money would be paid back via school taxes paid by the voters. The installation for the bond option would also reap the benefits of incentive payments on the state and local levels, which would allow the bond to be paid back more quickly.
1.2. Field Visit
During a field visit to LISD guided by the superintendent Linda Martin, several potential
locations for the solar modules were identified: the south-facing roof of the central school buildings, the roof of a large, covered play area, and the field at the south end of the school property near the ecology fitness trail. The three locations are pictured in Figures 2-4. Assuming the solar modules are 14% efficient, the space requirements for a 75 kW installation (the maximum size allowable to qualify for the senate bill incentive payments) would be about 160 m
2.
All three locations had enough space to fulfill this requirement, and all three locations were equally free of shading.

Community Solar on Lopez Island
`Spring 2011
4
Figure 2: The south-facing roof space above the Lopez Island School District gym is a promising
potential location for a photovoltaic system.
Figure 3: (a) View of the covered play area’s roof space taken from the north side. (b) View of the
covered play area’s roof space taken from the east side.
Various advantages and disadvantages for the rooftop vs. the field locations were
identified during discussions with LISD Superintendent Linda Martin and Jeff Dyer, a local experienced solar installer with Turtle Energy.
The advantages of a roof mounted system are that the panels would be highly visible and in close proximity to the school’s electrical meters. The school is very interested in making the system as publicly visible as possible to promote its sustainability goals and possibly use it as a selling point for a potential “green” bond the school plans to put on the ballot next year to raise funding for future sustainability projects.
The disadvantages are that installation and interconnection on the school’s metal roof could be difficult. The load specifications for the roof must be obtained from Weatherguard Inc. in order to ensure that it can bear the weight. Attachment of the panels to the roof would require either clipping to the roof ridges, or drilling holes in the roof and securing mounts from the inside - a task made difficult by limited access in some of the roof/attic spaces and difficulty in lining up the roof penetrations with rafters. Installing on the gym roof would be particularly difficult if roof penetrations are necessary, as there is a catherdral ceiling (no attic). A roofmount arrangement

Community Solar on Lopez Island
`Spring 2011
5
on the covered play area, by comparison, would be easier as the roof has no insulation and the rafters are clearly accessible so there would be little or no guess work in sinking a lag bolt through the metal roof into the rafter.
A further disadvantage of a roof installation would be that volunteer labor might not be allowed because of potential liability. This would add to the labor costs of the project. Finally, interconnection logistics of roof-mounted panels would be difficult because of the space requirements. If the school does decide to go ahead with a photovoltaic installation on its south-facing roofs, it will be essential for them to discuss these issues with the contractor.
Discussions with the superintendent and school board members (Nickola Chopra and John Helding) revealed that LISD is interested in installing a water catchment system on the school roofs as well as PV. They expressed concern that the materials and chemicals used in the PV system’s seals, caulking materials, and attachments must be compatible with drinking water production. If the PV project goes forward, it will be necessary to include this information in the bid requests, and to discuss the relevant issues with the contractor.
Figure 4: The unused field space south of the ecology fitness course and the tennis courts
is a good alternative location for the solar installation.
The advantage of installing solar panels in the field south of the tennis courts (Figure 4) is that they would be easier and safer to install. Volunteer labor could be used, and the wiring logistics would be simpler. Also, the PV project would not interfere with the planned roof water catchment project. Disadvantages are that the panels would not be as visible to the public, that the lawn under them would have to be mowed occasionally in order to prevent shading, and that there are no electrical meters nearby. The installation area would have to be chosen carefully to avoid conflicts with potential use of this land as a water storage pond. A transformer would have to be installed so the panels could be connected to the 11 kV distribution lines running parallel to the road, increasing the installation cost.
1.3. Discussion
The Lopez Island School District is fortunate to have a large amount of land resources
and such a highly involved local community. During the field visit, many proposed school improvement projects were discussed besides the PV project, including water catchment systems for providing drinking water and water for the organic garden, a water storage pond, weatherizing and HVAC upgrades, and various landscaping projects. LISD and its associated community is

Community Solar on Lopez Island
`Spring 2011
6
obviously enthusiastic about sustainability and the environment. Installing a PV project would support the LISD’s commitment to environmentalism and education, while also helping economically with electricity bills. Whether the LISD decides to finance the PV using the community solar model, using a school bond, or by some other means, it is important that they carry out an energy audit in order to evaluate the potential impact of the system, and that they select a space to dedicate to the project for the next 20 years.
An energy audit would help LISD to quantify the impact a PV system would have on its energy usage. The entire school would be checked for leaks, insulation, heating and cooling, and electrical usage. Repairing any problem areas found would make LISD’s energy usage more efficient. In addition, the electricity use of the school should be monitored, either by using a smart meter and tracking electricity use hour by hour, or simply by compiling data from the school’s electrical bills. The utility’s cutoff rates for different tiers of electricity usage should be noted. Collecting data on the performance of PV systems already installed on Lopez Island would give a realistic estimate for the amount of electricity that will be generated by the proposed PV system. Compiling all of this information would give the LISD a good idea of how big a PV system would need to be in order to have a substantial economic impact on the school. This study does not include any recommendations of this type due to lack of access to the school’s usage data.
The three potential sites identified for the PV system are all adequately large and unshaded. To determine the best site for the system, two important factors must be considered: installation logistics and potential alternative plans for the space. To address the logistical issues, a detailed investigation of the roof-mounted sites must be carried out by a contractor in order to determine the specific challenges that would be encountered during installation. To address the space issues, the LISD must communicate to the school community that the chosen site will be dedicated to the PV project for at least the next 20 years. The chosen space for the PV system cannot be disturbed by proposals to replace a roof, or build a water storage pond, for example. Choosing the site for the PV system will probably be subject of some negotiation and therefore take time.
Installing community solar on Lopez Island’s school has exciting educational benefits for students. Solar installations often come with real-time monitoring, allowing all kinds of curriculum development for science and technology students. Students can calculate carbon offsets, gain introduction to the power industry, acquire first-hand experience with renewables, and observe changes in power and load with weather conditions or school activities. These educational opportunities would add to an already advanced science curriculum at Lopez Island School. Indeed, students have access to University of Washington-donated genetics equipment, where they have identified various salmon species in their own Fisherman’s Bay on Lopez Island. The educational benefits of installing community solar on Lopez Island are perhaps the most compelling reason to install solar at the school. Integrating these items into their curriculum has the capacity to get scores of students excited about opportunities in renewable energy and sustainability, whose society-wide scope will grow substantially in the coming years.
The purpose of this project is to compare two possible financing options for the LISD’s potential PV installation: the community solar option vs. the school bond option. As we will see, these two financing options are extremely different. In the case of a community solar financing structure, the school would not own or operate the solar system; community investors would. Their motivation for doing this would be the return on equity they would gain from the combination of financial incentives provided by policies written at the federal, state, and local levels. For the bond financing structure, the school would have the voters approve a bond, borrow money to purchase the solar system, and pay back that money using voter property taxes and the financial incentives provided at the state and local levels. A cash pro forma model taking into consideration all of the possible solar incentives was constructed in order to determine the feasibility of using each type of financing option. The model results will be discussed in the context of the LISD’s unique circumstances and interests.

Community Solar on Lopez Island
`Spring 2011
7
2. Summary of Solar Incentives
Financial incentives for solar installations are available at the federal, state, and local levels.
The eligibility requirements and specific details for these incentives are summarized here.
2.1. Federal Incentives
The federal government offers two types of financial incentives to corporations that purchase
and install photovoltaic systems: (1) the Business Energy Investment Tax Credit and (2) the Modified Accelerated Cost Recovery System. Both of these incentives only apply to corporate entities.
(A) Business Energy Investment Tax Credit (ITC) [Department of Energy, 2010]:
(i) If a PV system is installed by a corporation and placed in service before the end of 2016, the ITC allows the corporation to offset 30% of the capital cost of the project using this tax credit. If the company is a limited liability company (LLC) without a large tax appetite, then the ITC can pass through the company to its individual investors, divided up in proportion to their investment in the project. However, if an individual investor is only a passive investor in the LLC, he can only use the tax credit to offset passive income. [Northwest Seed, 2011] (ii) If a corporation’s PV system begins construction before December 31, 2011, and the corporation qualifies for the ITC, it can opt to take the Business Energy Investment Tax Credit in the form of a U.S. Treasury grant rather than a tax credit. The amount paid in the grant is 30% of the capital cost of the project. This version of the incentive is advantageous for small companies without a large tax appetite.
(B) Modified Accelerated Cost Recovery System (MACRS) [Department of Energy,
2010]: The Modified Accelerated Cost Recovery System (MACRS) is the current tax depreciation system in the United States. Under this system, the capitalized cost (basis) of tangible property is recovered over a specified life by annual deductions for depreciation. A number of renewable energy technologies including solar PV can benefit from this incentive.
2.2. State Incentives
Washington state recently passed Senate Bill 6658 which promises large investment cost
recovery incentives (feed-in tariffs), for photovoltaic power generators. The amount of the payment depends on the location where the solar modules and inverters were manufactured. The base tariff rate is $0.30 per kWh. This rate is multiplied by 2.4 if the solar modules are manufactured in Washington State, and by 1.2 if the inverters are Washington manufactured.
To be eligible for the incentive payments, the project must be rated at 75 kW or less, the electricity must be able to be transformed and be compatible with the grid, and all kWh must be generated before June 30, 2020. The legal entity that owns the project may be local individuals, a household, a nonprofit, or a nonutility business. The business can be an LLC, a cooperative, or a mutual corporation. The project must be placed on property owned by a government entity.
Each participant in the community solar project may apply to the light and power business each fiscal year for an investment cost recovery incentive for each kWh produced by a customer-generated electricity renewable energy system. This incentive payment is capped at

Community Solar on Lopez Island
`Spring 2011
8
$5000 per individual, household, business, or local govt. entity. Each applicant in a community solar project is eligible for up to $5000/year.
The payments are issued by the local utility, and the pot from which the funds are drawn is either 0.5% of the operational revenue of the utility or $100,000, whichever is greater. In the case of Orcas Power and Light Cooperative (OPALCO), the small utility serving Lopez Island, the operational revenue is just under $20 million, so the available funds will be $100,000 per year. Of this $100,000, only 5%, or $5,000, is made eligible to be given to corporate participants. If requests for cost recovery incentives exceed the available funds, then the incentive payments must be reduced proportionately. [Washington State Legislature, 2010]
2.3. Local Incentives
Member Owned Renewable Energy (MORE): OPALCO ratepayers can opt to pay a
higher rate for their power in order to support renewable energy. The extra money is put into a fund. Customers that generate their own power can apply to OPALCO for incentive payments which come from this fund. The amount of payment depends on the year that the solar system is interconnected. For systems interconnected during the years 2010-2012, the tariff is 20 cents per kWh. The maximum amount of power produced that qualifies for the tariff is capped at 4000 kWh for residential and 10000 kWh for commercial installations. There is a bonus payment of 10 cents per kWh if the system is interconnected within the first 3 years. This bonus payment lasts through June 30, 2014. The maximum amount that can be paid back per installation, therefore, is $3000 with the bonus payment or $2000 without it. This amount could decrease if the available funds are split between many generators. [OPALCO, 2011]
3. Cash Pro Forma Model Inputs and Assumptions
To determine the feasibility of constructing a PV project that makes use of the new WA state incentives for community solar, a pro forma cash flow model was constructed. The main metrics used to evaluate the various possible project scenarios were the return on equity (ROE) and the debt service coverage ratio (DSCR) for the investment. Because of the complexity of the incentives on the federal, state, and local levels, these metrics were sensitive to a large number of variables. The variables taken into account in the model were the location of manufacture of modules and inverters; the type of legal entity owning the system; installation year; installed cost; and system size. The fixed input parameters were the annual energy output; the capital cost; the annual operation and maintenance cost; and the resale value of the system. By modeling all of the possible combinations of variables, the best scenarios could be defined and quantitatively ranked. Reasonable values for the fixed input parameters were obtained through discussions with local PV project owners and installers. The annual energy output was assumed to be 1,010 kWh per rated kW per year, based on data obtained for the last two years for a 33.8 kW installation located at the Common Ground co-op on Lopez Island [Greacen, 2011]. Rough quotes for the capital costs were obtained from Silicon Energy, the WA-based solar module manufacturer, and from Turtle Energy and Rainshadow Solar, two solar contractors who had submitted bids for the LCLT solar project. The modeled cost for the three simulated scenarios are presented in Table 1. The annual operation and maintenance costs and the resale value of the system did not strongly affect the overall model trends. The values chosen were $30/year and 5% of the capital cost, respectively.

Community Solar on Lopez Island
`Spring 2011
9
Table 1: Modeled Installation Costs
Modeled Scenario Idealized Installation Cost ($/W)
WA Modules and WA Inverters 7.5
WA Modules and Non-WA Inverters 7.5
Non-WA Modules and Non-WA Inveters 4.85
The installation costs modeled above originate from rough quotes by Lopez-based Turtle Energy. [Greacen, 2011]. The first, all-Washington case reflects the installation of a combined SiliconEnergy module and inverter system for a recently installed 4.65 kW system. The WA-modules with out of state inverters were a specific scenario tested for due to the potential disqualification of SiliconEnergy inverters as being considered WA-made. The cost of the modeled system, however, did not decrease due to comparably priced inverter alternatives. Finally, the non-WA case models a $4.85/W installation cost based on a 6.9 kW system as specified by a solar installer, Jeff Dyer, in Washington. The model presented does not account for any cost inflation or deflation due to system size, but assumes a constant value for installation cost. [Dyer, 2011].
The different state tariff levels modeled were $0.30/kWh for all non-WA manufactured equipment; $0.72/kWh for WA modules and non-WA inverters; and $1.08/kWh for modules and inverters manufactured in WA. These cases were chosen because Silicon Energy is the only solar module and inverter manufacturer in Washington State. However, the eligibility of the Silicon Energy inverters to qualify as WA-manufactured is currently being contested by the legislature; therefore either the $1.08/kWh (WA modules and inverter) or the $0.72/kWh (WA modules) rates will be paid to a system constructed using Silicon Energy equipment. The possible legal entities that could own the solar systems would be a limited liability corporation (LLC) or a non-profit. Both types of entity are fairly easy to form. However, the incentives that would apply to them would be different. An LLC can claim the federal ITC, but would have a cap of $5000 per year on the state incentives. Nonprofits, although limited by the same $5000 cap on state incentive payments, do not qualify as corporations and therefore would not be able to claim the ITC. The year in which the system would be installed is important to the model. The state incentive payments only apply to power generated before June 30, 2020, and the local utility incentives have a bonus payment for systems installed before 2013. Therefore, to benefit the most from the state and local tariffs, the system should be built as soon as possible. In addition, for systems that begin construction before 2011, the federal ITC could be taken as a grant from the U.S. Treasury rather than as a tax credit. This would be extremely beneficial to small LLCs that would not be able to take full advantage of a tax credit due to their small tax appetites. The system size affects the model because of the $5000 cap on state incentive payments to corporate entities. Systems that produce kWh above this cap would cost more but would not gain any more revenue than the cap allowed. Therefore, financially, there is an optimal system size.
To model financing of the solar system using a green bond, 100% debt was assumed, and the legal entity owning the system (the school) was modeled as a nonprofit entity ineligible for the federal ITC, but eligible for the state and local incentives. The bond model was compared to the various community solar scenarios.
4. Cash Pro Forma Model Outputs and Implications
To organize the results from the cash pro forma model, several plots were generated that
described several different financing scenarios. Plots tracked the return on equity (ROE) or the debt service coverage ratio (DSCR) vs. the assumed installation year, system size, and installed

Community Solar on Lopez Island
`Spring 2011
10
cost per watt. The scenarios investigated are as follows. First, the impact of qualifying for the federal ITC was explored by comparing the ROE for an LLC (using the ITC) to the ROE for a nonprofit organization using 100% equity (no ITC). Second, the debt service coverage ratio was tracked for a “green bond” financing structure (a non-profit entity that financed a solar installation using 100% debt). Finally, the two forms in which the federal ITC can be claimed (tax credit vs. a U.S. Treasury grant) were compared.
4.1. LLC with ITC U.S. Treasury Grant v. Non-profit 100% Equity
The first scenario compared the two types of legal entity that could own the solar system:
an LLC vs. a nonprofit. This comparison highlights the effect that claiming the federal ITC has on the model. This comparison was made assuming that both entities use 100% equity; that the system size was 4.95kW; the system installation costs reflect the values in Table 1; and that the federal ITC was taken in the form of a U.S. Treasury grant rather than as a tax credit. The time period investigated was assumed to end in 2020 regardless of the start date.
Figure 5 shows the ROE for all of the combinations of equipment manufacturing location and for different project start years. The ROE for all of the possible cases is highest if the project is installed in 2011, and decreases with increasing installation year. The best ROE is 17%, which is obtained when the legal entity is an LLC that uses all WA-manufactured equipment (All WA). The nonprofit with all WA equipment performs about as well as the LLC with only WA-manufactured modules (WA Modules); the highest ROE obtainable here is a respectable 10%, although Washington’s (confusing) nonprofit laws might limit net earnings to 8% under this legal structure [WA Legislature - Coop]. The other cases pictured here have lower than 5% ROE and they decrease rapidly as the installation year increases to 2012 and 2013. The more rapid drop in ROE from 2012 to 2013 than from 2011 to 2012 in each case is due to the sudden drop in the local utility MORE program incentive. This trend emphasizes that the installation of a project must begin as soon as possible to take full advantage of all of the incentives. Even the loss of one incentive has a huge impact on the financial success of the project.
Figure 5: ROE vs. Installation Year for an LLC vs. a nonprofit.
Figure 6 shows the ROE vs. the cost per installed watt of each module. The assumed system size is 4.95 kW. The start date is assumed to be 2011 for all cases, and the for all LLC cases, the ITC is assumed to be taken in a grant rather than a tax credit. The cost per watt for scenarios in which modules are purchased from a WA manufacturer are single points since the cost is set at $7.50/W. Cost per watt for out of state modules can vary widely. The plot shows that if all WA manufactured equipment is used, or if the cost per watt of non-WA manufactured equipment is less than $5/W, then the ROE is high enough that using a nonprofit entity is viable.

Community Solar on Lopez Island
`Spring 2011
11
Figure 6: ROE vs. $/W Installed for an LLC vs. a nonprofit for all equipment manufacturing
locations
Figure 7 shows the ROE vs. the rated system size for an LLC vs. a nonprofit for all equipment manufacturing locations. Assumptions made for this plot are the installation costs fixed in Table 1, the installation date is 2011, and that the LLC data shown reflects the U.S. Treasury grant rather than the tax credit. This plot shows that the highest ROEs are obtained with small system sizes. All of the curves have the same general shape, with a high, constant ROE at small system sizes, and then the appearance of a “knee” where the curve begins to slope downward. For the All WA and WA Module cases, this knee appears once the $5000 payment cap imposed by the state incentive bill has been reached. In the cases of the non-WA manufactured equipment, the knee appears due to the limit imposed by the MORE incentive. Because we model the All WA and WA Module scenarios to have the same installation cost, we see that the graphs merge around a system size 7 kW due to the difference in incentive payout between the cases. Since Non-WA equipment is much less costly and the incentive payout is much less, systems can reach much larger sizes before hitting the incentive limits.
This result indicates all possible variations shown (LLC with an ITC Treasury Grant, nonprofit, all manufacturing options) except for the “nonprofit non-WA modules” option, give a positive ROE for small system sizes. However, the ROE becomes negative after the systems become larger than 10 kW due to the limits on the incentive payments. Therefore, the only way to benefit from the “community” solar bill is to build a very small system using either extremely inexpensive out of state modules or the expensive in-state modules.
Figure 7: ROE vs. the rated system size for an LLC vs. a nonprofit for all equipment
manufacturing locations.

Community Solar on Lopez Island
`Spring 2011
12
4.2. Non-profit “Green” Bond Funded with 100% Project Debt
The second scenario modeled the “green bond” financing option. In this scenario, the
project financing involves 100 % debt from the bond necessary to cover the capital costs. In the scenarios where debt recovery is important, rather than measuring the Return on Equity, we measure the average Debt Service Coverage Ratio (DSCR) which gives a potential investor a feel for how much money the project generates each year versus the appropriately divided debt taken on during that year. In the charts below, we present the system lifetime average DSCR. As a conservative assumption, we do not factor the potential resale value of the system into the DSCR calculation in the final year of the term. For a school-bond financed solar PV project, we estimate that the average DSCR should be above 1.2 in order to be considered viable. Finally, the school’s savings on electricity bills from the project’s solar PV production could be considered an additional income stream which is not factored into the model at this time.
Like the previous scenario, the simulation compared the DSCR dependent upon installation year. The results are shown in Figure 8. The assumptions made in this scenario are equivalent to the assumptions made previously: a 4.95 kW system size, installation costs outlined in Table 1, and a project lifetime ending in 2020 regardless of start year. Because this model reflects a non-profit entity, the ITC grant and MACRS depreciation scheme do not apply. As Figure 8 indicates, the same trend exists for the non-profit bond scenario; the DSCR drops from year to year, with an increasing rate from 2012 to 2013 due to the drop in MORE funding. However, we see that the DSCR is above one only for “All WA” (all equipment manufactured in WA) cases, indicating that setting up a bond funded non-profit entity would only be economically viable for “All WA” scenarios.
Figure 8: DSCR vs. Installation year for 100% Project Debt Bond Model.
The next figure reflects the DSCR as a function of installation cost. Since the installation cost is assumed to be limited to $7.50/W for All WA and WA Module cases, the model does not vary the potential installation cost variability. Rather, for Non-WA cases, the installation cost is varied in order to determine at which point a viable DSCR is achieved. All cases assume an installation year of 2011. As Figure 9 reveals, even varying the installation cost down to $4.00/W for the Non-WA case results in a DSCR below one. Assuming that an installation cost below this value is not possible, it becomes clear that a Non-WA scenario is impossible. The WA Module case (inverters from out of state) has potential only if the installation cost becomes unfixed and is driven below $7.50/W. The All-WA option has a DSCR of above one, which indicates a favorable payback.

Community Solar on Lopez Island
`Spring 2011
13
Figure 9: DSCR vs. Installation Cost for 100% Project Debt Bond Model.
The final scenario for the bond case examines the effect of system size variation on DSCR. The assumptions for this model include the installation costs from Table 1 and an installation year of 2011. We see another knee in Figure 10 that has the same origins as observed previously. The Washington State incentives reach their limit around a 5 kW system size in an All WA case, around 7 kW for the WA Module case, and at approximately 10 kW for the Non-WA case. We see that in each case the WA State incentives become the limiting factor on DSCR before any other incentive programs. Therefore, a non-profit entity should only target systems with All WA equipment resources, ideally installing in 2011, and installing at a maximum system size of approximately 5 kW.
Figure 10: DSCR vs. System Size for the 100% Project Debt Bond Model.
4.3. LLC Only Cases: Comparing ITC Grant to ITC Tax Credit
The form in which the federal ITC is claimed has a large impact on the ROE of a project. It is normally supposed to be claimed through a tax credit, but currently, there is an incentive program in place that allows for the tax credit to be received as a lump sum grant. However, this program is set to expire at the end 2011 with the possibility of being extended to the end of 2012. The comparison of the tax credit vs. the grant motivates installing the solar project as soon as possible in order to take advantage of the grant. Figure 11 shows the ROE vs. the system size for all equipment manufacture locations, comparing the receipt of the federal ITC in the form of a grant vs. a tax credit. As in the above sections, the cost per watt of in state panels is modeled as $7.50/W while out of state is $4.85/W.

Community Solar on Lopez Island
`Spring 2011
14
The install date is assumed to be 2011. The resulting plot shows the ROE is higher by a factor of 2-3 when the treasury grant is used rather than the tax credit for all manufacturing cases and for all system sizes. The knee in the All WA and WA Module cases is caused by the WA SB6658 limit being reached at 5kW and 7kW. The All WA and WA Module cases converge as expected when the WA SB6658 limit is reached. The knee caused by the limit of the MORE incentive occurs at a system size of 10kW. While it is not as beneficial to have a larger system due to incentive limits, it is clear that the ITC as a grant is more effective in opening up larger system options.
Figure 11: ROE vs. System Size for all equipment manufacturing locations, comparing the
use of the federal incentive as a U.S. Treasury grant vs. a tax credit.
Figure 12 shows the ROE vs. the installation year for all equipment manufacturing locations, comparing the use of the federal incentive as a U.S. Treasury grant vs. a tax credit. The assumed installed costs are the same as above. The assumed system size is 4.9kW. The more rapid drop in ROE from 2012 to 2013 than 2011 to 2012 in each case is due to the sudden drop in MORE funding. The ITC grant is significantly more effective at keeping the ROE positive value for 2011 cases. After 2011, the grant is no longer available, so the data shown for All-WA, WA Module, and Non-WA in years 2012 and 2013 will not be valid unless the federal government extends the U.S. Treasury grant option. Therefore, the only choice is to use all WA manufactured equipment if the system is to be installed after 2011.
Figure 12: ROE vs. the installation year for all equipment manufacturing locations, comparing the use of the federal incentive as a U.S. Treasury grant vs. a tax credit.

Community Solar on Lopez Island
`Spring 2011
15
Figure 13 shows the ROE vs. the cost per installed watt for all equipment manufacturing locations, comparing the use of the federal incentive as a U.S. Treasury grant vs. a tax credit. For equipment manufactured in Washington, $7.50/W is the only choice. This is due to the fact that there is only one solar module manufacturer in WA State. We regard the cost quoted by them as fixed. Non-WA manufactured equipment can vary in price due to the fact that there are many solar manufacturers all over the country and the world, and their prices vary widely. The installation date is assumed to be 2011 in all cases. The plot shows that an LLC is potentially viable with Non-WA cases under 5 $/W, but only with the ITC grant.
Figure 13: ROE vs. the cost per installed watt for all equipment manufacturing locations,
comparing the use of the federal incentive as a U.S. Treasury grant vs. a tax credit.
5. What is the best choice for the Lopez Island School District?
The results of the cash pro forma model demonstrate that there are certain situations in
which both the community solar and the school bond financing options are viable. As shown in parts 1 and 3 of the model outputs, the community solar financing option is attractive for investors for maximum system sizes of about 5-7 kW. The best ROE obtainable for them would be as high as 17% for a 4-5kW system, built with expensive WA-manufactured modules, installed before the end of 2011. This size system would be large enough to power a residence, but might be too small to make a dent in the LISD’s electricity bills. Part 2 of the cash pro forma model output shows that floating a “green” bond would give a DSCR greater than one only for small project sizes (4-5 kW) using expensive, all WA manufactured systems. The bond scenario is slightly less time-sensitive than the community solar scenario: systems built in 2012 using all-WA equipment still have a DSCR greater than one. Also, the bond is paid back using property taxes in addition to incentive payments.
The LISD will need to make its decision between these various financing scenarios based on its own needs and capabilities, as well as the model data. The school should determine the optimal solar system size to serve its needs, based on its own electricity usage. If the system size needed is small, the school would need to find an investor and dedicate some space for the project. Since space is a valuable commodity at the school, the decision to dedicate it to a solar project may take time. Since the community solar financing option is extremely time-sensitive, this option may turn out not be feasible for the LISD. The school bond financing option is similarly limited in system size if only incentive payments are taken into account. However, since the bond could be paid back in the traditional way, using property taxes, a school bond may be more appropriate if the LISD determines that its electricity needs and preferred timeline are larger than the investor-owned community solar option would allow.

Community Solar on Lopez Island
`Spring 2011
16
Table 2:Comparison of the different scenarios
Investor-owned School Bond
Optimum system size (WA equipment) and simple payback period
5 kW XX years 5 kW XX years
Who gets electricity school (given to school for free)
school
Who owns system investors school
Who owns system after 10 years
school school
Who bears risk of lower-than-optimal performance
investor school
Need to raise money in bond no yes
6. Evaluation of SB6658
Upon finishing our model, it became clear that SB6658 has significant flaws that make it very difficult for communities to benefit from the legislation, save for some select cases. It appears that the only people who can take full advantage of the bill are those who are customers of large utilities and have large taxable income. The money available for the program is limited to 0.5% of the utility’s taxable revenue, or $100,000 if the taxable revenue is less than $20 million, and the portion available for community projects is 5% of that. Small utilities such as OPALCO, whose annual revenues are approximately $18 million, only have $5000 available for community solar projects per year. With a maximum incentive payout of $5000 per year, only one LLC can reap full benefits of the program for the entire region. Also, in order to benefit from the federal ITC, the investor must have a tax bill greater than or equal to 30% of the cost to build the system, unless installation is started before December 2011. Another flaw is that the bill gives high incentives for the usage of PV panels and inverters that are produced in the state of Washington. On the surface, this is an excellent way to boost the local economy however, it became clear during our study that there is only one certified manufacturer of PV panels and inverters in Washington (Silicon Energy). Without other in-state manufacturers, Silicon Energy is able to charge far more for its panels than out-of-state competitors. This drives up the cost of the installed system, raising the required tax appetite of the investor to take advantage of the ITC and making it even more difficult to achieve ROE’s that would be attractive to potential investors. Lastly, SB6658 allows for new projects to take advantage of the incentives, even after the maximum payout has been reached. Instead of raising the cap, the fund will split between all projects on a pro-rated basis. For example, if one corporate entity builds a system to take advantage of the $5000 per year available from OPALCO, and another corporate entity builds an identical system, each entity would only receive a maximum of $2500 per year instead of $5000. This reveals a large risk that any potential investor must consider. These problems set severe limitations on which members of the community can benefit from the WA state SB6658. In order to make this bill more accessible to all of Washington, we suggest that the allotment for community solar projects be increased, especially for companies and corporations. This would allow for more investors to take part in the program, particularly in regions serviced by relatively small utilities. Also, methods to decrease the price of in-state solar modules must be explored. One potential method is to make it easier for manufacturers to become certified so that they can compete with Silicon Energy for in-state incentives. This would

Community Solar on Lopez Island
`Spring 2011
17
cause lower prices and expand the pool of those who can afford to invest in community solar projects. Another way to improve the legislation is to allow for “Virtual Net Metering.” This means that investors would be able to use the power produced by their system to offset their own utility bill even though the system is not on their own property. There is currently a Bill proposed by Senator Maynard addressing this issue. [Senator Maynard , 2011] Similarly, an amendment to the personal ITC code should be made to make it accessible to more people. This can be done by allowing people to take advantage of the tax credit regardless of whether the system is built on their property or not [Senator Udall, 2011]. This would allow community solar investors to escape the limits imposed on corporations by the state bill, but allow them to use the federal incentive that is so essential to a solar project’s affordability.
7. Conclusion
The purpose of this report was to study the feasibility of a community solar project on Lopez Island in WA. A cash pro forma model was constructed to take into account all of the possible federal, state, and local incentives available to community solar projects. To do this, many parameters were varied: the location of manufacture of modules; the legal entity owning the system; and the year in which the system is installed. The results of the model showed that under the current conditions, only small, 5-7kW solar systems using modules manufactured by the sole solar manufacturer in WA, and installed before the end of 2011 are feasible. The LISD will need to make its decision about financing its solar project based on its own needs as well as this result. For community solar to actually be able to benefit from the WA state legislation, new state legislation should be passed increasing the limits on incentive payments. Federal policy should be modified to allow community solar projects to qualify for the personal ITC, and allowing for virtual net metering. Finally, new solar manufacturers need to come online in WA State in order to drive in-state module prices down.
8. Acknowledgements
All of the authors would like to acknowledge Amber Mahone and Michele Chait at E3 for teaching us how to frame the problem, walking us through the construction of a cash pro forma model, and for giving us valuable suggestions and feedback. We are also deeply grateful to Chris Greacen for his enthusiasm for the project and his guidance on so many different fronts throughout the semester. Thank you Chris, Chom and all of your family and neighbors at the LCLT for your hospitality during the field visit. Thanks to Faith Van de Putte for generous use of her home while we were visiting Lopez. Thank you Linda Martin, Nickola Chopra, John Helding, and Denny Jardine for the introduction to the LISD, Jeff Dyer with Turtle Energy, Sandy Bishop with the Lopez Community Land Trust, Blake Rankin for his investor’s perspective, and Linda Irvine from Northwest SEED for her analysis of SB6658. Finally, thank you E3 for providing the funding of our trip to Lopez Island!

Community Solar on Lopez Island
`Spring 2011
18
9. References
Department of Energy. 2010. Business Energy Investment Tax Credit (ITC). Database of State Incentives
for Renewables & Efficiency. [Online] June 09, 2010. [Cited: May 9, 2011.]
http://www.dsireusa.org/incentives/incentive.cfm?Incentive_Code=US02F.
Department of Energy. 2010. MACRS. Database of State Incentives for Renewables & Efficiency. [Online] December 18, 2010. [Cited: May 9, 2011.] http://www.dsireusa.org/incentives/incentive.cfm?Incentive_Code=US06F. Department of the Treasury. 2011. Payments for Specified Energy Property in Lieu of Tax Credits. Department of the Treasury Website. [Online] January 5, 2011. [Cited: May 9, 2011.] http://www.treasury.gov/initiatives/recovery/Documents/FAQs%20for%20Beginning%20of%20Construction.doc. Department of the Treasury. 2011. Recovery Act. Department of the Treasury Website. [Online] April 18, 2011. [Cited: May 9, 2011.] http://www.treasury.gov/initiatives/recovery/Pages/1603.aspx. Dyer, Jeff. 2011. Lopez Island, WA, April 2011. Greacen, Chris. 2011. San Francisco, CA and Lopez Island, WA, March-April 2011. Northwest Seed. The Northwest Community Solar Guide. NorthwestSeed Website. [Online] [Cited: May 9, 2011.] http://www.nwseed.org/documents/NW%20Community%20Solar%20Guide.pdf. OPALCO. 2011. MORE. OPALCO Website. [Online] March 17, 2011. [Cited: May 9, 2011.] http://www.opalco.com/wp-content/uploads/2010/07/MORE-Committee-Policy-1.pdf. Senator Maynard . 2011. Bill No. 632. [Online] January 2011. [Cited: May 09, 2011.] ftp://ftp.cga.ct.gov/2011/tob/s/2011SB-00632-R00-SB.htm. Senator Udall. 2011. SUN Act. [Online] February 2, 2011. [Cited: May 9, 2011.] http://blog.solargardens.org/2011/02/mark-udall-on-sun-act.html. Washington State Legislature. 2010. ENGROSSED SUBSTITUTE SENATE BILL 6658. Washington State Legislature. [Online] March 11, 2010. [Cited: May 9, 2011.] http://apps.leg.wa.gov/documents/billdocs/2009-10/Pdf/Bills/Senate%20Passed%20Legislature/6658-S.PL.pdf.