Embed Size (px)
Citation preview

Defining Communitiy Vulnerability in Lebanon – September 2014 - February 2015
12
LEBANON
ASSESSMENT REPORT
SEPTEMBER 2014 – FEBRUARY 2015
DEFINING COMMUNITY VULNERABILITIES IN LEBANON

Defining Communitiy Vulnerability in Lebanon – September 2014 - February 2015
2
Cover photo ©REACH, 2015
About REACH REACH is a joint initiative of two international non-governmental organizations - ACTED and IMPACT Initiatives - and the UN Operational Satellite Applications Programme (UNOSAT). REACH was created in 2010 to facilitate the development of information tools and products that enhance the capacity of aid actors to make evidence-based decisions in emergency, recovery and development contexts. All REACH activities are conducted in support to and within the framework of inter-agency aid coordination mechanisms. For more information about REACH and to access our information products, please visit: www.reach-initiative.org. You can also write to our in-country team at: [email protected] and to the REACH global team at: [email protected]. Follow us @REACH_info.
Defining Communitiy Vulnerability in Lebanon – September 2014 - February 2015
3
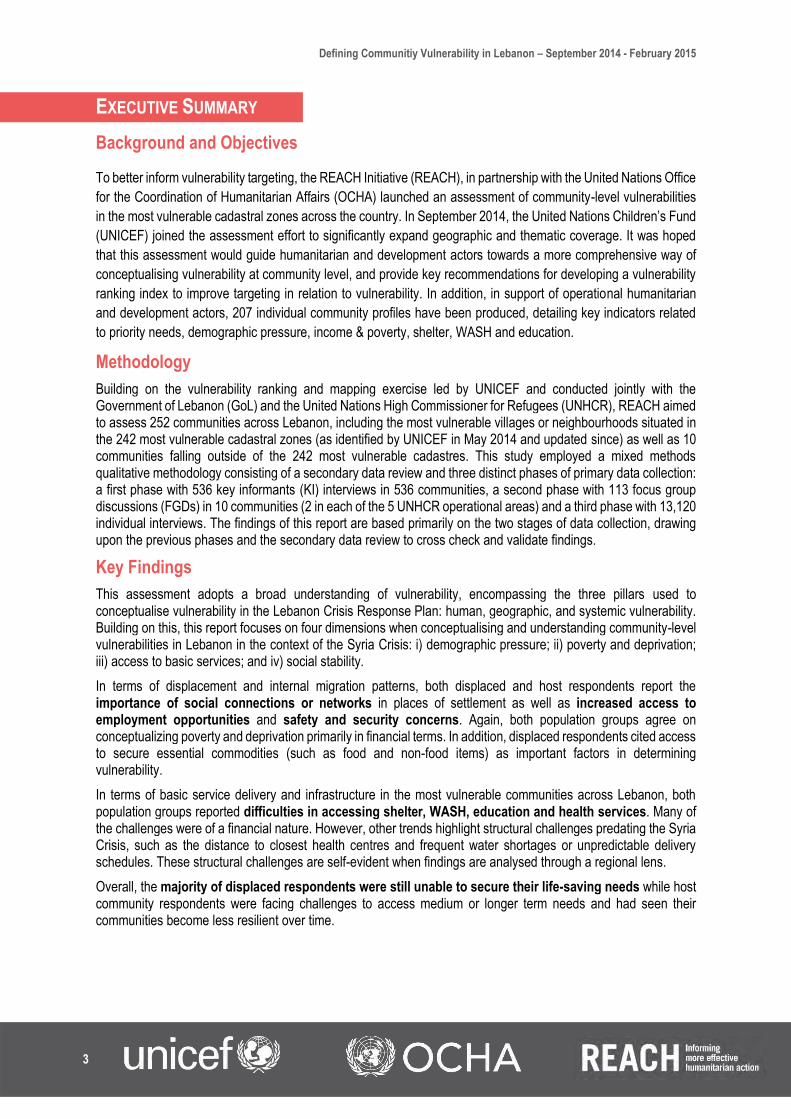
EXECUTIVE SUMMARY
Background and Objectives
To better inform vulnerability targeting, the REACH Initiative (REACH), in partnership with the United Nations Office
for the Coordination of Humanitarian Affairs (OCHA) launched an assessment of community-level vulnerabilities
in the most vulnerable cadastral zones across the country. In September 2014, the United Nations Children’s Fund
(UNICEF) joined the assessment effort to significantly expand geographic and thematic coverage. It was hoped
that this assessment would guide humanitarian and development actors towards a more comprehensive way of
conceptualising vulnerability at community level, and provide key recommendations for developing a vulnerability
ranking index to improve targeting in relation to vulnerability. In addition, in support of operational humanitarian
and development actors, 207 individual community profiles have been produced, detailing key indicators related
to priority needs, demographic pressure, income & poverty, shelter, WASH and education. Methodology
Building on the vulnerability ranking and mapping exercise led by UNICEF and conducted jointly with the Government of Lebanon (GoL) and the United Nations High Commissioner for Refugees (UNHCR), REACH aimed to assess 252 communities across Lebanon, including the most vulnerable villages or neighbourhoods situated in the 242 most vulnerable cadastral zones (as identified by UNICEF in May 2014 and updated since) as well as 10 communities falling outside of the 242 most vulnerable cadastres. This study employed a mixed methods qualitative methodology consisting of a secondary data review and three distinct phases of primary data collection: a first phase with 536 key informants (KI) interviews in 536 communities, a second phase with 113 focus group discussions (FGDs) in 10 communities (2 in each of the 5 UNHCR operational areas) and a third phase with 13,120 individual interviews. The findings of this report are based primarily on the two stages of data collection, drawing upon the previous phases and the secondary data review to cross check and validate findings.
Key Findings
This assessment adopts a broad understanding of vulnerability, encompassing the three pillars used to conceptualise vulnerability in the Lebanon Crisis Response Plan: human, geographic, and systemic vulnerability. Building on this, this report focuses on four dimensions when conceptualising and understanding community-level vulnerabilities in Lebanon in the context of the Syria Crisis: i) demographic pressure; ii) poverty and deprivation; iii) access to basic services; and iv) social stability.
In terms of displacement and internal migration patterns, both displaced and host respondents report the importance of social connections or networks in places of settlement as well as increased access to employment opportunities and safety and security concerns. Again, both population groups agree on conceptualizing poverty and deprivation primarily in financial terms. In addition, displaced respondents cited access to secure essential commodities (such as food and non-food items) as important factors in determining vulnerability.
In terms of basic service delivery and infrastructure in the most vulnerable communities across Lebanon, both population groups reported difficulties in accessing shelter, WASH, education and health services. Many of the challenges were of a financial nature. However, other trends highlight structural challenges predating the Syria Crisis, such as the distance to closest health centres and frequent water shortages or unpredictable delivery schedules. These structural challenges are self-evident when findings are analysed through a regional lens.
Overall, the majority of displaced respondents were still unable to secure their life-saving needs while host community respondents were facing challenges to access medium or longer term needs and had seen their communities become less resilient over time.

Defining Communitiy Vulnerability in Lebanon – September 2014 - February 2015
4
Theme 1: Demographic Pressure
Communities in Lebanon have been subjected to significant demographic pressure across the country as a result of the ongoing Syria Crisis. As of January 2015, 1.15 million displaced Syrians had registered with UNHCR. However,between 31 December 2014 and 16 March 2015, no significant increase in numbers was reported although this could be because since then, registration of refugees has been put on hold by the GoL. The above trend on new registered refugees has been influenced by the new Government of Lebanon criteria in place for displaced Syrians and restrictions at border crossings. 95 per cent of host community respondents reported a slight to significant increase in the population of their community in the last three years – an increase which was directly attributed to the arrival of displaced populations.
The most frequently cited reason reported by displaced community members for selecting their current location in Lebanon was related to safety and security: 32 per cent for female displaced respondents and 33 per cent for male displaced respondents. In addition, considerable proportions of displaced respondents reported the presence of family and friends and the availability of job opportunities as the primary reason for selecting their place of residence within Lebanon (both reported by 19 per cent of respondants).
Findings illustrate specific displacement patterns for displaced women and adolescents groups. Displaced female respondents are likely to report more often that family and personal network, as well as lower cost of living, were the main reasons for moving. Displaced adolescent respondents reported the same reasons, altough employment opportunities were also mentioned quite often too.
Theme 2: Poverty and Deprivation
Livelihoods
Commerce (including both informal commerce, reported by 26 per cent, and formal commerce, reported by 23 per cent), was the most commonly reported income source by host community respondents. Conversely, unskilled non-agricultural labour and food vouchers (reported by almost 43 per cent) were the most commonly reported income sources by displaced respondents. These findings confirm the reliance on external assistance for displaced communities in terms of livelihoods. In addition, other sources of income reported by displaced respondents include unskilled agricultural labour, reported by 23 per cent, and informal commerce, reported by 13 per cent. Furthermore, 72 per cent of host community respondents reported that they were able to rely on regular employment, compared to only 22 per cent of respondents from displaced populations. Displaced respondents most commonly reported that they were engaged in irregular, temporary or seasonal modes of employment. When compared to host respondents, displaced communities are clearly relying on more vulnerable and less sustainable sources of income.
Geographical trends are also significant: in the North (32 per cent) and Akkar (29 per cent), the primary source of income reported by host community respondents was informal commerce. However in the largely rural Baalbek/El Hermel Governorate, 54 per cent of respondents reported unskilled labour as their primary source of income, both agricultural and non-agricultural. In addition, in some governorates (such as Akkar or in the North), the majority of respondents reported that they were only able to access irregular or temporary forms of employment. Such regional trends may highlight areas where displaced and host communities are likely to face direct competition to access local labour market; such competition has been identified by the majority of respondents as a potential source for community divisions.
66 per cent in Mount Lebanon, 74 per cent in Beirut, and 51 per cent of respondents in Bekaa reported that they were able to access regular employment. This compares to only 30 per cent of respondents in Akkar.
Overall, respondents reported lower levels of participation by women and girls in the labour force, compared to men and boys. However, 80 per cent of host respondents reported the prevalence of women over 18 in the labour force, compared to only 46 per cent of displaced respondents. With regards to youth employment, 29 per cent of host respondents reported the participation of male adolescents in the labour force, compared to only 48 per cent of displaced respondents.
Income

Defining Communitiy Vulnerability in Lebanon – September 2014 - February 2015
5
The average monthly household income reported by host respondents was more than triple than that of their displaced counterparts, US$973 compared to US$323. Governorates in which the majority of respondents reported having access to regular sources of income also reported the highest monthly household incomes on average: in Mount Lebanon, host respondents earned an average of US$1389 compared to US$482 for displaced respondents; in Bekaa, this figure was US$1026 compared to US$266 respectively; and in Beirut, US$1508 compared to US$538 respectively.
Household Expenditure
Approximately two-thirds of both host and displaced respondents reported spending more than a half of their monthly household income on food, with displaced respondents spending proportionally more when compared to host respondents. It is worth mentioning that there are huge disparities amongst regions, with high levels of spending on food in Akkar (80 per cent) and North (79 per cent) Governorates, and far lower levels of expenditure on food reported in Beirut (55 per cent) and Mount Lebanon (52 per cent) Governorates.
On average, host community respondents reported paying significantly more in monthly rental costs than their displaced counterparts, USD$321 compared to USD$213 per month respectively. Regional differences in respondents’ average monthly rental costs can be observed, with the highest host community expenditure being in Beirut and Mount Lebanon Governorates, (USD$407 and USD$385 respectively) and the lowest displaced expenditure in Baalbek El Hermel and Akkar Governorates (USD$113 and USD$154 respectively).
71 per cent of displaced respondents and 58 per cent of host respondents reported allocating up to one-third of their total monthly household income on the purchase of essential Non Food Items (NFIs). Proportionally lower levels of spending on essential NFIs can be observed amongst displaced respondents; this can be explained as a result of the prevailing low level of income amongst displaced populations being prioritised to cover short-term survival needs. The highest levels of spending on essential NFIs can be observed in Akkar and North Governorates, with a fifth of respondents in each location reporting that they allocate over 50 per cent of their household income on this expense.
Both host and displaced communities incur similar costs for water; while host communities reported an average monthly expenditure of USD$31 on drinking water and of USD$35 on domestic water, displaced communities reportedly spent USD$30 and USD$32 on drinking and domestic water respectively. Respondents in Beirut and Mount Lebanon Governorates reported spending the most on water for either drinking and domestic purposes on a monthly basis: USD$45 and USD$37 respectively for drinking water, and USD$40 and USD$47 respectively for domestic water.
76 per cent of displaced respondents reported being unable to acquire required household medications in local markets, compared with 32 per cent of their host counterparts. This disparity is again reflected with a higher prevalence of perceived unaffordability of child vaccinations amongst displaced populations than host, with 64 per cent of displaced respondents reporting perceived financial barriers compared with 40 per cent of host respondents. However, it should be noted that the perception of cost being a barrier to vaccinations for displaced populations is unfounded, as health actors are implementing programming which affords displaced populations free access to child vaccinations.
It is important to note that reported household expenditures, especially for displaced respondents, significantly outstrip reported average mounthly household income. This can be explained by the high reliance on borrowed money and / or credit amongst the displaced population. Indeed, the VASyR 2014 noted that 82% of displaced Syrians borrowed money or received credit in the three months prior to data collection. Of this proportion 50% reported as having over $400 in debt at the time of assessment1.
Top reported needs
Increased availability of employment opportunities was a commonly reported priority amongst both host and displaced respondents alike. Heath also was reported as a top 5 priority need by both displaced and host respondents, reflecting the perceived inability to access required medications for household members and the perception of unaffordability of child vaccinations. As a result of the majority of data collection being conducted during the winter months of 2014 and 2015, one of the most commonly reported priority needs for displaced
1 World Food Programme, Vulnerability Assessment of Syrian Refugees in Lebanon: 2014, January 2015

Defining Communitiy Vulnerability in Lebanon – September 2014 - February 2015
6
populations was winterisation, reported by 17 per cent of respondents. This highlights the lower quality of shelter available to displaced populations in Lebanon (12 per cent of displaced respondents reported shelter as a top need indeed). While food is also among the priority needs, reported more commonly by refugees than by host communities as shown in Figure 1 below, education was prioritized by both communities. It should also be noted that the assessment took place before any cuts to food assistance.
Figure 1: Priority reported needs by host and displaced communities
Host populations placed more emphasis on access to basic services than their displaced counterparts, with electricity supply and drinking water featuring as most reported need right after employment and health. Aside from disparities in reporting health needs, differences between male and female respondent groups are limited.
Theme 3: Access to Essential Commodities & Basic Services and Infrastructure
Food
35 per cent of displaced respondents reported that they were unable to access basic staple foods in local markets, compared with only 14 per cent of host respondents. In addition, 53 per cent of displaced respondents reported that they were unable to access sufficient quantities of basic staple foods in local markets when they were available; a situation reported by only 21 per cent of host respondents. As noted above, data was collected prior to cuts to food assistance from WFP, which had been implemented by the time of writing.
Shelter & Electricity
A large proportion of host respondents reported that they owned their accommodation. 62 per cent of host respondents lived in apartments or independent houses, with an additional 17 per cent of host respondents reporting they were living in one room structures at the time of assessment. For the displaced community, apartments or independent houses and one room structures are also the two prominent shelter types, home to 34 per cent and 17 per cent respectively. However, less than one third of displaced respondents reported that they owned their current accommodation, with Mount Lebanon and Beirut being the governorates where ownership seems to be more common. While shelter types are largely similar across governorates, significant populations using handmade shelters or tents in informal settlements as a shelter solution can be observed in Baalbek El Hermel (18 per cent), Bekaa (16 per cent), and Akkar Governorates (9 per cent).
36 per cent of displaced respondents reported that they were living in shelters with inadequate protection (i.e. lacking doors for toilets, locks, and not being sealed from the elements), compared with only 5 per cent of host

Defining Communitiy Vulnerability in Lebanon – September 2014 - February 2015
7
respondents. Furthermore, 46 per cent of displaced respondents reported that their shelters were not weatherproof (i.e. susceptible to flooding or leakages) compared with only 9 per cent of host respondents.
Both host and displaced respondents reported accessing electricity from similar sources, with 91 per cent and 86 per cent respectively reporting that they relied on the public electricity network for power.
Essential non-food items
Twice as many displaced respondents (49 per cent) as their host counterparts (22 per cent) reported being unable to access essential non-food items (NFIs), such as bedding, clothing, cooking gas, and blankets, in local markets, despite NFIs being one the main household expenditure as reported above. When NFIs were reportedly available, less than half of displaced respondents (33 per cent) reported that they were able to acquire enough to meet weekly household needs, compared with 69 per cent of host respondents.
Water
In general, both host and displaced respondents reported the same challenges in accessing water for drinking or domestic use. The most frequently reported challenges faced when accessing water for drinking or domestic use were reportedly high demands on water resources as a result of a perceived population increases (36 per cent), drought or environmental disasters (34 per cent), supply shortages (33 per cent), and access related expenses (28 per cent).
Similarly, both host and displaced populations reported accessing the same sources for drinking water, namely bottled water (35 per cent) and tap water (27 per cent). In addition, with regards to water for domestic purposes, both host and displaced respondents reported relying primarily on public water connections (59 per cent and 49 per cent respectively).
Sanitation
Marked differences can be observed between toilet facilities accessed by host and displaced respondents. While 83 per cent of host respondents reported that they had flushable toilets in their homes, only 41 per cent of displaced respondents reported access to the same type of toilet.
Hygiene
While overall, the majority of respondents reported that they had access to showering and washing facilities inside the shelter, it was more common for displaced respondents to report no access than host respondents (16 per cent compared to 2 per cent).
Wastewater management
While overall the majority of respondents reported that their communities were connected to public sewerage networks (60 per cent), a larger proportion of displaced respondents reported relying on private tank collection, open air or pit latrine systems, or no consistent method at all (47 per cent, compared with 32 per cent for hosts).
Solid waste disposal systems
The primary solution for solid waste disposal was reported by both displaced and host respondents (48 per cent and 55 per cent respectively) to be public collection. However, the proportion of displaced respondents relying on other methods of disposal (including burning garbage) was slightly higher than host respondents, 52 per cent compared with 46 per cent.
Health
Respondents across the board reported significant difficulties in accessing adequate healthcare. In Bekaa Governorate, a higher proportion of host and displaced respondents cited challenges in accessing healthcare. Many of the major challenges in healthcare delivery were linked to the cost of medicines and services, and to the distance or availability of appropriate medical facilities. Many of the problems with healthcare provision may have preceded the Syrian crisis; however, the considerable population increase has undoubtedly placed a severe strain on existing institutions and exacerbated demand on limited and unaffordable healthcare delivery. Both displaced (39 per cent) and host (26 per cent) respondents reported that diarrhoea was a prevalent issue for children in their respective communities. The slightly higher rate of incidence of diarrhoea among the displaced communities can
Defining Communitiy Vulnerability in Lebanon – September 2014 - February 2015
8
be attributed to the fact that displaced households reported relatively more unsanitary living conditions than their hosting counterparts. For example, almost 48% of displaced respondents reported a noticable presence of pests, flies, rodents and insects within the community as opposed to the 38% respondents from host community households. Similarly, only 41% of displaced households respondents made use of flush toilets for wastewater
management unlike their predominant usage (83%) among hosting community households.Education
The top perceived challenge reported in accessing educational services was the same for both host and displaced respondents: the cost of school fees. The majority of respondents, both displaced and host populations, reported that they had no knowledge of non-formal education opportunities in their community at the time of assessment (67 per cent).
Coping strategies
When faced with limited financial resources, assessment data suggests that both displaced and host populations resort, on the whole, to similar coping strategies. Both host and displaced respondents reported that they resort to buying cheaper or lower quality food when they have a lack of finances, 57 per cent and 68 per cent respectively. In addition, purchasing food and NFIs on credit (42 per cent and 47 per cent respectively), and borrowing money for food (31 per cent and 37 per cent respectively), were commonly reported coping strategies by both population groups.
Vulnerability Focus: Children and Women
According to the survey, women-headed households and households with pregnant women are the main most
vulnerable groups identified by both host and displaced respondents. Specifically, a high proportion of female host
participants (34 per cent) reported the prevalence of women-headed households (widows), while a high proportion
of displaced respondents (30 per cent) reported the presence of pregnant women within their communities.
The assessment reveals that approximately 4 per cent of respondents had heard reports of abuse, exploitation
and/or sexual violence of children and women in the last six months; slightly more host participants (5 per cent)
than displaced (2 per cent) reported the prevalence of these incidents in their communities. It must be noted that
such issues are often underreported due to sensitivities within their communities. Surprisingly, 85 per cent of
surveyed community members were unaware of services catering to survivors of abuse, exploitation and/or sexual
violence.
Assessment results reveal that a significantly higher proportion of displaced participants (17 per cent) were aware
of unregistered births than surveyed host community members (4 per cent). Poor familiarity with administrative
processes, associated costs, limited family documentation and irregular status of displaced community members
may all play a role in limited access to registration services for children in Lebanon.
A high proportion of survey respondents were aware of out of school boys (50 per cent) and girls (46 per cent).
The proportion of displaced respondents aware of out of school boys and girls were significantly higher, with 68
per cent and 64 per cent of displaced respondents reporting prevalence of out of school boys and girls, respectively.
When asked as to their current occupation if not enrolled or attending school, a high proportion of respondents
suggested that boys were engaged in informal employment opportunities (42 per cent) while out of school girls
were engaged in household chores or childcare responsibilities (41 per cent).
Theme 4: Social Stability2
Effect of the crisis
Both host and displaced populations reported a rise in unemployment, a decrease in affordable housing and a decline in available water resources in their respective communities. This is a key issue as strains on public
2 Due to prevailing sensitivities REACH was unable to capture data to measure social stability indicators in a number of communities in the South, Bekaa, and Baalbek El Hermel Governorates. As such, analysis of social stability indicators should not be considered representative of the situation in all governorates.
Defining Communitiy Vulnerability in Lebanon – September 2014 - February 2015
9
services and a lack of available employment opportunities represent over 50 per cent of reported causes for community division by host communities, as well as displaced respondents.
On the whole, both displaced and host respondents reported that they felt safe in their respective communities, 65 per cent and 76 per cent respectively. For those respondents who at the contrary feel unsafe in their communities, the overall majority of respondents linked such feelings to the presence of refugees, as well as general concerns related to their community security environment. For the vast majority of respondents, their feeling of being unsafe is not connected to any specific place or location in their village or community. Furthermore, 86 per cent of respondents reported that there had been no specific security incidents in their community.
Host and displaced relations
Interactions between host and displaced populations reportedly occur on a regular basis, with 80 per cent reporting that this interaction occurred more than once per day in their community. In addition, the most common type of interaction between population groups was of an economic nature, with 75 per cent reporting exchanges in markets or shops and 57 per cent reporting trade or commerce between groups. On the whole, both population groups reported positive views of the Lebanese population in their respective communities. However, it was common for host respondents to report either neutral (38 per cent) or negative-very negative (40 per cent) feelings towards Syrian community members.
The top cited cause for community divisions was reportedly centred on employment issues, with 44 per cent of host respondents and 31 per cent of displaced respondents citing a shortage of jobs as a key driver of community division. Other commonly reported factors of community division include strained resources (21 per cent) and pressure on public services (16 per cent). Where communities had guidelines in place for displaced populations, the most common form of this was reported to be curfew. In 83 communities (mostly in Mount Lebanon and Bekaa governorates), more than 50 per cent of the respondents reported that a curfew was in place. This measure, where present, was supported by 82 per cent of host community respondents.
Perceptions of institutions and unfair assistance
Both host and displaced respondents reportedly held similar neutral to positive views of key social, religious, and governmental institutions. Both host and displaced respondents reported that they held neutral feelings towards political parties operating in their respective communities. Since safety, security and community tensions are sensitive topics, it is possible that neutral answers were given for a variety of reasons and the current situation may be more nuanced. Over half of displaced respondents reported either positive or very positive feelings towards the humanitarian community. This is in contradiction to the widespread assumption amongst humanitarian actors that perceived unfair allocation of assistance is a key driver of community tension.
Conclusion This assessment report is intended to facilitate humanitarian and development planning and vulnerability targeting within the framework of the Lebanon Crisis Response Plan (LCRP). Data collected from the third phase reveals notable trends related to community needs and vulnerabilities across population groups (displaced, host, male and female) and regions. This study found that access to income-generating activities was prioritised by host and displaced communities alike across all operational areas. This may be due to the substantial population increase in numerous hosting communities and the increased competition for low- and semi-skilled labour.
This report further highlights the differential needs of and challenges faced by host and refugee populations. Higher proportions of host community respondents cited challenges in accessing health facilities and employment opportunities, while high proportions of displaced communities pointed to the need for winterisation, suggesting inadequate shelter conditions and an inability to secure essential NFIs to cope with colder climates. The differential trends in needs and priorities highlight that many displaced respondents are still unable to secure their immediate, survival needs (Theme 2 aligning with the first LCRP response strategy) while host community respondents are facing increasing difficulties in accessing more intermediate-term needs (Theme 3 aligning with the second LCRP response strategy).
Gendered trends further highlight the distinctions in experiences of vulnerability even within specific population groups. Male and female respondents within each population group often cited different challenges in accessing the same services and even reported different priority needs in the community. These nuances between displaced

Defining Communitiy Vulnerability in Lebanon – September 2014 - February 2015
10
and hosts, and female and male respondents provide a more nuanced and comprehensive understanding of vulnerabilities at the community level. The data presented in this report should act as a guideline or stepping stone towards improving vulnerability targeting strategies and programmes.
Recommendations
Building on the three types of vulnerabilities and short-, intermediate- and long-term needs identified in the LCRP, the results of this assessment demonstrate an additional need to incorporate dimensions of community level vulnerabilities with regards to demographic pressure as well as towards particularly vulnerable groups in response strategies. Indicators that show how demographic pressure on basic needs and services is measured can help gauge the magnitude or scope of the impact of the Syria crisis on each vulnerable community. The incorporation of more gender-related factors into each of the three response strategies would enable more equitable outcomes with regards to mitigating community vulnerabilities.
1. Sector vulnerability criteria should feed in to vulnerability mapping exercises. In order to better coordinate and inform the prioritization of humanitarian and development programming, it is recommended that the findings from this study and specific indicators relating to vulnerabilities under each of the themes be incorporated into the vulnerability mapping exercise. The Inter-Agency vulnerable cadastres maps are periodically updated to identify the most vulnerable cadastral areas, the data collected for this assessment as well as other data sources can be used to build additional layers and components to the existing vulnerability ranking tool. Such assessments could be timed to inform periodic updates of the vulnerable cadastres mapping. In this way, this geographical prioritization tool will improve accuracy in identifying vulnerable communities. Of even more importance would be to build such an interactive tool that allows humanitarian and development actors see vulnerability scoring of communities by sector or region.
2. The comprehensive severity index should be able to take into account regional and territorial dynamics. Towards the classification or ranking of communities for the purposes of vulnerability targeting, the LCRP discusses the need to develop a comprehensive severity index. Findings from this study highlight the need to include monetary values for costs and income, especially as commonly cited challenges in accessing education, healthcare and water are all related to financial resources. However, these indicators need to be developed in a manner that takes into account the different costs of living in each region and in each type of settlement (e.g. semi-urban versus urban) in Lebanon. Furthermore, building on some of the conditions and challenges outlined in this report, sector experts need to outline a logical and value-laden ranking for types of facilities, sources of income and other factors that community members are able to access.
3. Vulnerability varies over time and needs to be updated on a regular and predictable basis. Lastly, this severity index or vulnerability targeting tool will further need to be updated at least twice a year, several months preceding the summer and winter months. This is because severe weather patterns affect vulnerability status (e.g. a recent influx of refugees arriving in a community that is accustomed to severe water shortages in summer months). In addition, socio-political and security-related developments on the ground often result in temporary or permanent displacements of local Lebanese and refugee populations. As such, essential needs and vulnerability of community populations are regularly changing and in flux.

Defining Communitiy Vulnerability in Lebanon – September 2014 - February 2015
11
TABLE OF CONTENTS
EXECUTIVE SUMMARY............................................................................................................................................... 3
TABLE OF CONTENTS.............................................................................................................................................. 11
Acronyms and Abbreviations ................................................................................................................................ 12 Geographical Classifications ................................................................................................................................. 12 List of Figures, Maps and Tables .......................................................................................................................... 13
INTRODUCTION ....................................................................................................................................................... 16
METHODOLOGY ...................................................................................................................................................... 17
Sample Selection: Targeted Communities ............................................................................................................ 18 Phase 1: Key Informant Interviews & Preliminary Vulnerability Ranking ............................................................... 20 Phase 2a: Focus Group Discussions (FGDs) ....................................................................................................... 20 Phase 2b: Individual Interviews ............................................................................................................................. 22 Limitations ............................................................................................................................................................. 23
BACKGROUND: KEY FINDINGS FROM ASSESSMENT PHASES 1 & 2A......................................................................... 25
UNDERSTANDING COMMUNITY VULNERABILITIES IN THE CONTEXT OF THE SYRIAN CRISIS ........................................ 27
THEME 1: DEMOGRAPHIC PRESSURE ...................................................................................................................... 29
THEME 2: POVERTY AND DEPRIVATION .................................................................................................................... 35
Household Profile .................................................................................................................................................. 35 Livelihoods and Income ........................................................................................................................................ 35 Household Expenditures ....................................................................................................................................... 40 Coping Strategies ................................................................................................................................................. 47 Top Reported Needs ............................................................................................................................................. 48
THEME 3: ACCESS TO ESSENTIAL COMMODITIES & BASIC SERVICES AND INFRASTRUCTURE .................................... 50
Food ...................................................................................................................................................................... 50 Shelter & Electricity ............................................................................................................................................... 51 Essential Non-Food Items (NFIs) .......................................................................................................................... 55 Water, Sanitation and Hygiene (WASH) ............................................................................................................... 56 Health .................................................................................................................................................................... 65 Education .............................................................................................................................................................. 70 Vulnerability Focus: Children and Women ............................................................................................................ 77
THEME 4: SOCIAL STABILITY ................................................................................................................................... 81
Effect of the Crisis ................................................................................................................................................. 81 Host and Displaced Relations ............................................................................................................................... 84 Perceptions of Institutions and Unfair Assistance ................................................................................................. 88
CONCLUSION .......................................................................................................................................................... 91
RECOMMENDATIONS ............................................................................................................................................... 92
ANNEX I: LEBANON PROFILE ................................................................................................................................... 93
ANNEX II: GOVERNORATE PROFILES ....................................................................................................................... 94
ANNEX III: LIST OF COMMUNITIES AND INTERVIEWS COMPLETED UNDER PHASE 2B DATA COLLECTION .................. 109
ANNEX IV: PHASE 2A FOCUS GROUP DISCUSSION TOOL FOCUS GROUP DISCUSSION QUESTIONNAIRE................ 119
ANNEX V: PHASE 2B INDIVIDUAL INTERVIEW SURVEY TOOL .................................................................................. 126

Defining Communitiy Vulnerability in Lebanon – September 2014 - February 2015
12
Acronyms and Abbreviations
FGD Focus group discussion
GoL Government of Lebanon
KI Key informant
LCRP Lebanon Crisis Response Plan 2015-2016
NFI Non-food items
NGO Non-governmental organization
NPTP National Poverty Targeting Programme
OCHA United Nations Office for the Coordination of Humanitarian Affairs
PRL Palestinian refugees from Lebanon
PRS Palestinian refugees from Syria
RRP6 2014 Syria Regional Response Plan
UNICEF United Nations Children’s Fund
UNHCR United Nations High Commissioner for Refugees
UNRWA United Nations Relief and Works Agency for Palestine Refugees in the Near East
WASH Water, sanitation and hygiene
Geographical Classifications
Operational Area Refers to UNHCR regional operational areas in Lebanon. There are five UNHCR sub-
office regions in Lebanon: Akkar, Bekaa, Mount Lebanon/Beirut, Tripoli T5 and South.
The operational area of Akkar coincides with the governorate of Akkar, and the
operational area of Bekaa comprises the districts of Baalbek, El Hermel, Rachaya,
West Bekaa and Zahle. The operational area of Mount Lebanon/Beirut includes the
governorates of Beirut and Mount Lebanon. Tripoli T5 operational area refers to the
districts of Tripoli, Batroun, Bcharre, El Minieh-Dennieh, Koura and Zgharta. The South
operational area includes the governorates of South and El Nabatieh.
Governorate/
Mohafazat
Largest administrative division below the national level. Lebanon has eight
governorates: Bekaa, Baalbek / Hermel, Beirut, El Nabatieh, Mount Lebanon, North,
Akkar and South.
District/Caza Second largest administrative division below the national level. Each governorate is
divided into districts or cazas. Lebanon has 26 districts.
Cadastre/
Cadastral zone
Geographic classification which are below the level of district/caza. Cadastrals may
encompass one or more contiguous villages/neighbourhoods.
Municipality Smallest administrative division in Lebanon. Municipalities serve villages and urban
areas. There are 1025 municipalities in Lebanon.
Defining Communitiy Vulnerability in Lebanon – September 2014 - February 2015
13
List of Figures, Maps and Tables
Figure 1: Priority reported needs by host and displaced communities .................................................................... 6
Figure 2: Timeline of data collection activities by phase ....................................................................................... 17
Figure 3: Number of registered Syrian refugees from January 2012 till present ................................................... 29
Figure 4: Number of registered Syrian refugees from the first quarter of 2011 to present per region .................. 30
Figure 5: Heat map of top reasons cited by displaced participants moving to present location in last 6 months .. 31
Figure 6: Reasons for displaced respondents moving to current location in the past 6 months (by Governorate) 32
Figure 7: Heat map of top reasons cited by host participants moving to present location in last 3 years ............. 33
Figure 8: Reasons for host respondents moving to current location in the past 3 years (by Governorate) ........... 34
Figure 9: Average number of household members by operational area ............................................................... 35
Figure 10: Heat map of respondents' reporting main sources of income within community .................................. 36
Figure 11: Percentage of respondents reporting most common modes of employment ....................................... 37
Figure 12: Percentage of respondents reporting population cohort participation in labour markets by age and
gender ................................................................................................................................................................... 38
Figure 13: Commonly cited reasons for no or poor female participation in labour force ....................................... 38
Figure 14: Average household monthly income of interviewees (USD) ................................................................ 39
Figure 15: Average monthly household income by governorate and population group ........................................ 40
Figure 16: Reported percentage of monthly household income spent on basic food items .................................. 41
Figure 17: Most commonly reported percentage of monthly household income spent on basic food items by
governorate ........................................................................................................................................................... 41
Figure 18: Average reported household expenditure on shelter by occupancy arrangement ............................... 42
Figure 19: Average reported household expenditure on shelter by governorate .................................................. 42
Figure 20: Average reported monthly expenditures on electricity by main source of electricity ............................ 43
Figure 21: Average reported monthly expenditures on electricity by governorate ................................................ 44
Figure 22: Percentage of monthly household income of survey respondents spent on essential non-food items 44
Figure 23: Average expenditures for water for drinking and domestic use by governorate .................................. 45
Figure 24: Perceived ability to purchase medication for household members ...................................................... 45
Figure 25: Perceived ability to afford vaccinations for children ............................................................................. 46
Figure 26: Perceived ability to purchase medication for household members by governorate ............................. 46
Figure 27: Perceived ability to afford vaccinations for children by governorate .................................................... 47
Figure 28: Heat map of commonly cited coping strategies ................................................................................... 48
Figure 29: Heat map of top reported needs of assessed communities ................................................................. 49
Figure 30: Most commonly reported needs as expressed by host and displaced survey participants .................. 49
Figure 31: Are members of your community able to acquire basic food staples on the local market on a weekly
basis? .................................................................................................................................................................... 50
Figure 32: Are members of your community able to acquire sufficient quantities of basic food staples to meet
household food needs on a weekly basis? ........................................................................................................... 51
Figure 33: Heat map of common types of community accommodation for host and displaced ............................ 51
Figure 34: Reported primary shelter types per governorate .................................................................................. 52
Figure 35: Common types of occupancy arrangements reported in community for host and displaced ............... 53
Figure 36: Percentage of respondents reporting inadequate protection for current accommodation .................... 53
Figure 37: Weatherproof status of host (left) and displaced (right) interviewees' current accommodation ........... 54
Figure 38: Reported primary electricity source for host (left) and displaced (right) ............................................... 54
Figure 39: Average hours of daily electricity supply as reported by survey participants ....................................... 54
Figure 40: Are members of your community able to acquire essential NFIs on the local market on a weekly
basis? .................................................................................................................................................................... 55

Defining Communitiy Vulnerability in Lebanon – September 2014 - February 2015
14
Figure 41: Are members of your community able to acquire sufficient quantities of essential NFIs to meet
household needs on a weekly basis? ................................................................................................................... 56
Figure 42: Heat map of challenges in accessing water for drinking (centre left) and domestic use (centre right) . 57
Figure 43: Primary sources of drinking water as reported by survey participants ................................................. 57
Figure 44: Primary sources of water for domestic use as reported by survey participants ................................... 58
Figure 45: Primary reported domestic water source by governorate .................................................................... 59
Figure 46: Main methods of solid waste disposal.................................................................................................. 60
Figure 47: Coverage of solid waste receptacles in immediate surroundings by host (left) and displaced (right)
respondents .......................................................................................................................................................... 60
Figure 48: Percentage of respondents reporting prevalence of excess garbage (left) and number of pests (right)
in last 3 months ..................................................................................................................................................... 61
Figure 49: Main type of wastewater disposal systems for host (left) and displaced (right) communities .............. 62
Figure 50: Most common types of toilet facilities among interviewees .................................................................. 63
Figure 51: Most common types of toilet facilities by governorate .......................................................................... 63
Figure 52: Access to showering / washing facilities per governorate .................................................................... 64
Figure 53: Prevalence of flooding (left) and manifestation of wastewater problems (right) in last 12 months ....... 65
Figure 54: Heat map of top reported challenges in accessing health services ..................................................... 66
Figure 55: Types of health facilities accessible to study participants in respective communities .......................... 66
Figure 56: Average distance to health facilities from home ................................................................................... 67
Figure 57: Common illnessess affecting children in the community ...................................................................... 68
Figure 58: Health facilities accessed for child healthcare ..................................................................................... 68
Figure 59: Health facilities accessed for child vaccinations .................................................................................. 69
Figure 60: Awareness of polio campaigns ............................................................................................................ 70
Figure 61: Awareness of polio campaigns by governorate ................................................................................... 70
Figure 62: Heat map of top perceived challenges in accessing education services ............................................. 71
Figure 63: Most prevalent type of education facility (%) serving host and displaced in assessed communities ... 72
Figure 64: Reported curriculum per school type ................................................................................................... 73
Figure 65: Presence of second shift per school type ............................................................................................ 73
Figure 66: Average distance to available school facilities from home ................................................................... 74
Figure 67: Percentage of adolescent respondents reporting bullying by educational facility ................................ 74
Figure 68: Reported physical state of schools ...................................................................................................... 75
Figure 69: Toilet facilities in schools ..................................................................................................................... 75
Figure 70: Availability of separate toilet facilities for boys and girls ...................................................................... 76
Figure 71: Presence of non-formal educational opportunities ............................................................................... 76
Figure 72: Percentage of survey respondents reporting prevalence of vulnerable children and women in their
communities .......................................................................................................................................................... 77
Figure 73: Reports of abuse, exploitation or sexual violence of children and women in last 6 months ................. 78
Figure 74: Awareness of services for survivors of abuse, exploitation or sexual violence .................................... 79
Figure 75: Are there children under the age of 5 years in your community whose births are unregistered? ......... 79
Figure 76: Changes in unemployment rates, availability of shelter and water in the last 3 years reported by host
respondents .......................................................................................................................................................... 82
Figure 77: Changes in unemployment rates, availability of shelter and water in the last 6 months reported by
displaced respondents .......................................................................................................................................... 82
Figure 78: Feeling of safety in the community....................................................................................................... 83
Figure 79: Respondents reporting specific incidents in their community since the onset of Syria Crisis (both
displaced and host respondents) .......................................................................................................................... 84
Figure 80: Percentage of host and displaced respondents' reporting frequency of interaction by governorate .... 85
Figure 81: Percentage of respondents reporting common types of interaction between host and displaced........ 85

Defining Communitiy Vulnerability in Lebanon – September 2014 - February 2015
15
Figure 82: Feelings of respondents towards specific population groups ............................................................... 86
Figure 83: Main causes of division between host and displaced communities as reported by survey participants
.............................................................................................................................................................................. 87
Figure 84: Percentage of respondents reporting prevalence of community guidelines for displaced ................... 88
Figure 85: Feelings of respondents towards institutions ....................................................................................... 88
Figure 86: Perceived beneficiaries of humanitarian assistance ............................................................................ 89
Figure 87: Perceived recipiants of health assistance ............................................................................................ 89
Figure 88: Perceived recipiants of education assistance ...................................................................................... 90
Map 1: UNICEF classification of worst to lowest vulnerable cadastres and sub-classification of 242 most
vulnerable cadastres ............................................................................................................................................. 19
Map 2: Cadastres and communities covered during Phase 2a (FGDs) and Phase 2b (surveys) data collection . 24
Table 1: Number of focus group discussion by operational area .......................................................................... 21
Table 2: Focus group discussion participants ....................................................................................................... 21
Table 3: Number of communities visited and interviews conducted by operational area as part of Phase 2b ...... 22
Table 4: Breakdown of intended interviewees by community for Phase 2b data collection .................................. 23

Defining Communitiy Vulnerability in Lebanon – September 2014 - February 2015
16
INTRODUCTION
Almost in its fifth year, the Syrian crisis has resulted in the displacement of 3.8 million refugees seeking refuge in
neighbouring countries and North Africa3. Lebanon is host to the largest number of refugees from Syria with at
least 1,173,552 Syrian refugees4, 270,000 Palestinian refugees from Lebanon (PRL) 5 and 44,2836 Palestinian
refugees from Syria (PRS) living in the country. With a population of almost 4 million, Lebanon has the highest per
capita concentration of refugees than any other country in the world. The impact of the Syrian crisis on hosting
communities has been immense. Local communities have reported significant strains on public services and
infrastructure, compounding existing structural problems prevalent in service delivery and limited resources.7 The
number of Lebanese poor has risen by 61 per cent since 2011 and Lebanese unemployment has increased twice-
fold with one-third of Lebanese youth without jobs.8 For the 270,000 PRL living in Lebanon, the effects of the Syrian
crisis have aggravated hardships owing to prolonged refugee status and relative disadvantage as both PRL and
PRS almost exclusively rely on the United Nations Relief and Works Agency for Palestine Refugees in the Near
East (UNRWA) for essential services.9 Late 2014 was also witness to a series of security incidents involving
clashes between extremist groups crossing into the country from Syria and Lebanese Armed Forces (LAF),
temporarily displacing local communities and bringing debates concerning national security and stability to the
forefront.10
With greater awareness of the vulnerabilities of host and displaced communities alike, the Lebanon Crisis
Response Plan (LCRP) for 2015-2016 outlines a structured and institutional approach towards managing the
effects of the Syrian crisis that simultaneously supports Lebanese public institutions and infrastructure and
maintains the humanitarian response. In an effort to transition from vulnerability towards stabilisation, the LCRP
recognises three overarching needs for the coming two years, specifically:
i) The short-term and immediate survival and protection needs amongst the most vulnerable displaced and poor Lebanese;
ii) Gaps in essential service delivery for the most vulnerable communities facing rising social tensions, rising poverty and weakening infrastructure and service provision; and
iii) Strengthening of weak national economic, social and institutional systems in order to counteract weak economic growth and social stability.
Towards informing these strategies and improving humanitarian and development targeting, the REACH Initiative
(REACH), in partnership with the United Nations Office for the Coordination of Humanitarian Affairs (OCHA),
launched an assessment of community-level vulnerabilities in the 242 most vulnerable cadastral zones in Lebanon
in May 2014. In September 2014, the United Nations Children’s Fund (UNICEF) joined this partnership to expand
the scope and depth of the assessment.
The focus of the assessment coincides largely with the overarching needs recognised by the LCRP. This report
aims to contribute to and build a knowledge base of the needs, priorities and risks facing the most vulnerable
communities across Lebanon.
3 United Nations High Commissioner for Refugees, Syrian Refugees: Inter-Agency Regional Update, 18 February 2015. 4 United Nations High Commissioner for Refugees, Syria Regional Refugee Response: Interagency Information Sharing Portal. Accessed 20/02/2015. 5 United Nations Officer for the Coordination of Humanitarian Affairs, Humanitarian Bulletin: Lebanon, Issue 7 (1 December 2014 – 15 January 2015). 6 Ibid. 7 World Bank, Lebanon: Economic and social impact assessment of the Syrian conflict, 2013. 8 Government of Lebanon and United Nations, Lebanon Crisis Response Plan 2015-2016, 19 December 2014. 9 Ibid. 10 Ibid.

Defining Communitiy Vulnerability in Lebanon – September 2014 - February 2015
17
This assessment report highlights key findings according to four key themes associated with community-level
vulnerabilities of both host and displaced populations, specifically: i) demographic pressure, ii) poverty and
deprivation, iii) basic service delivery and infrastructure and iv) social stability.
METHODOLOGY
This report presents findings from primary data collection carried out in pre-identified, vulnerable host communities
across Lebanon. For the purposes of this report, communities are defined as villages and neighbourhoods within
large urban centres. Host community refers to Lebanese and Palestinian refugees from Lebanon (PRL), while
displaced includes Syrian refugees, Palestinian refugees from Syria (PRS), Iraqi refugees and Lebanese
returnees. Data collection was carried out in two discrete time periods, first in September 2014 and then from
October 2014 -February 2015. The study began with a round of key informant (KI) interviews (Phase 1) followed
by focus group discussions (FGDs) in 10 communities across Lebanon (Phase 2a) and individual survey interviews
(Phase 2b).
Figure 2: Timeline of data collection activities by phase
Phase 1
• June to August 2014
• Key informant interviews in 536 communities
• 536 KI interviews
Phase 2a
• September 2014
• Focus group discussions in 10 communities
• 113 FGDs
Phase 2b
• October 2014 to February 2015
• Individual interviews in 207 communities
• 13,120 interviews

Defining Communitiy Vulnerability in Lebanon – September 2014 - February 2015
18
Sample Selection: Targeted Communities
The localities selected for data collection during Phase 1 and Phase 2 were limited to communities situated within
the ‘most vulnerable cadastres’, which were identified through a vulnerability ranking and mapping exercise carried
out by United Nations Children’s Fund (UNICEF) with support from UNHCR and the Government of Lebanon
(GoL). This vulnerability ranking takes into account the number of Lebanese residents living under US$4 a day
(extrapolated from 2004 GoL data) and the distribution of Syrian refugees registered with UNHCR in each cadastre.
Each cadastral zone is classified into quintiles based on their vulnerability scores and are classified as ‘worst’,
‘high’, ‘medium’, ‘low’ and ‘lowest’. The highest scoring quintile is classified as the ‘worst’ or most vulnerable
cadastral zones.
This assessment relies on the results of the UNICEF-led vulnerability ranking carried out in May 2014, where 24211
cadastres zones were classified as ‘worst’ or the most vulnerable cadastres. Rather than focussing data collection
at the cadastral level, REACH, OCHA, and UNICEF targeted the community level (villages in rural areas and
neighbourhoods in urban areas). This approach was selected as a result of the cadastral unit often containing
multiple distinct communities with differing levels of vulnerabilities. Therefore in order to establish a more nuanced
understanding of community level vulnerability in the context of the LCRP, it was deemed necessary to target the
lowest geographical unit possible.
11 An updated map and list of the ‘worst’ ranked or most vulnerable cadastres will soon be released by UNICEF; per this list, the total number of ‘most vulnerable cadastres’ will change. This new list and map will take into account: the number of Lebanese residents living under US$4 per day based on the UNDP 2008 study taking into account a GoL household study; distribution of registered Syrian refugees, PRL and PRS based on UNHCR and American University of Beirut/UNRWA data, respectively; and the number of extreme poor Lebanese as per latest NPTP data.

Defining Communitiy Vulnerability in Lebanon – September 2014 - February 2015
19
Map 1: UNICEF classification of worst to lowest vulnerable cadastres and sub-classification of 242 most vulnerable cadastres

Defining Communitiy Vulnerability in Lebanon – September 2014 - February 2015
20
Phase 1: Key Informant Interviews & Preliminary Vulnerability Ranking
For Phase 1 data collection, field teams conducted Key Informant (KI) interviews with community representatives
in every village and neighbourhood situated within the 242 most vulnerable cadastres. For comparison purposes,
KI interviews were also conducted with representatives from 76 randomly selected cadastral zones. These
comparison communities were situated in cadastres classified as ‘high’, ‘medium’, ‘low’, ‘lowest’ as well as
cadastres reportedly having no resident refugees according to the UNHCR registration database. In total, 536
community representatives were interviewed as part of Phase 1 data collection from the 242 ‘worst’ or most
vulnerable cadastral zones and 76 comparison cadastres.
KI interviews were conducted with a community representative from each of the 536 villages and neighbourhoods.
KIs were selected based on their knowledge of the village or neighbourhood and included mukhtars, zaims, long-
time residents or local business owners. Where official community leaders such as mukhtars were unavailable, KIs
were identified based on referrals from community residents. It must be noted that KIs interviewed during this
phase of data collection were solely members of the host community population residing in these areas. The data
collection tool includes a closed questionnaire administered on smartphones through the Open Data Kit platform.
The questionnaire was developed based on findings from a comprehensive secondary data review12 and inputs
from the Social Stability Working Group and key partners.
Upon completion of this phase of data collection, a preliminary vulnerability ranking index was built with inputs from
key humanitarian actors and partners as well as members of the Social Stability Working Group. This preliminary
vulnerability index built on the existing UNICEF ranking of the 242 most vulnerable cadastres and sought to assign
a quantifiable indicator of vulnerability to each assessed community. In order to provide a more comprehensive
tool for understanding community level vulnerabilities, factors including the proportion of extreme poor Lebanese
living as defined by the Ministry of Social Affairs’ National Poverty Targeting Programme (NPTP) in these
communities (i.e. those living on less than US$2.8 per day); access to education, health and other essential
services; availability of water, electricity and other public resources; as well as factors relating to social stability
were included in this ranking index. These factors were taken into account in addition to the number of registered
refugees by community as well as pre-crisis and current host community poverty indicators (specifically, the
proportion of Lebanese living under US$4 per day and the proportion of NPTP recipients) at the cadastral zone
level. The ranking index was used to select the communities for further study during Phase 2b of the assessment;
these communities or villages and neighbourhoods were situated in the same 242 most vulnerable communities
identified through the UNICEF mapping exercise as well as 10 communities situated outside of the 242 most
vulnerable cadastres.
Based on data collected from Phase 1, a preliminary findings report was prepared and disseminated to the wider
humanitarian community. The main aim of this report was to present sector-specific findings in order to facilitate
planning for the coming response strategy plan. Report touched on relevant findings and key sector trends by
UNHCR operational area, and focused specifically on access to education, health, water and sanitation, cash
assistance, shelter, livelihoods and social stability.13
Phase 2a: Focus Group Discussions (FGDs)
For Phase 2a, field teams conducted a total of 113 FGDs in 10 randomly selected communities from 9 to 19
September 2014. These focus groups were conducted in two communities in every operational area. Table 1
shows the breakdown of the focus groups conducted by operational area. The aim of Phase 2a activities was to
12 REACH Initiative and UN Office for Coordination of Humanitarian Affairs, Informing targeted host community programming in Lebanon: Secondary Data Review, September 2014. 13 REACH Initiative and UN Office for Coordination of Humanitarian Affairs, Informing targeted host community programming in Lebanon: Preliminary findings for sector planning, October 2014.

Defining Communitiy Vulnerability in Lebanon – September 2014 - February 2015
21
gain a more in-depth, qualitative understanding of community level vulnerabilities from the perspective of various
stakeholders within the community and inform the development of data collection tools for a larger phase of data
collection in 252 communities (Phase 2b).
Table 1: Number of focus group discussion by operational area
Operational Area District Village/ Neighbourhood # of Focus Groups
Akkar Akkar Tallet ez Zefir 16
Akkar Akkar Khreibet ej Jindi 16
Beirut/Mt Lebanon Chouf Damour 13
Beirut/Mt Lebanon Baabda Hadet 10
Bekaa Baalbek El Laouze 7
Bekaa Zahle Sahret el Qach 13
South Sour Deir Qanoun 9
South Saida Miye Ou Miye Camp 7
Tripoli T5 Tripoli Abou Samra 11
Tripoli T5 Tripoli Beddaoui Camp 11
Total 113
For the FGD phase of data collection, questions were developed with inputs from OCHA and UNICEF as well as
preliminary findings from Phase 1 data collection. Focus group discussions sought to explore circumstances
surrounding access to public services and infrastructure, protection mechanisms and the availability of basic
commodities for various sections of the population as well as perceived changes within each community since the
onset of the Syrian crisis. Recognising the differing experiences based on gender and age, 8 categories of people
were participating in FGDs for both host and displaced populations (see Table 2).
Table 2: Focus group discussion participants
Host Community
Lebanese, Palestinian refugees from Lebanon
Displaced Community
Syrian refugees, Palestinian refugees from Syria,
Lebanese returnees
Female Adult (25 years and over) Female Adult (25 years and over)
Female Youth (18-24 years old) Female Youth (18-24 years old)
Female Adolescent (12-17 years old) Female Adolescent (12-17 years old)
Pregnant Women Pregnant Women
Mothers/Caregivers Mothers/Caregivers
Male Adult (25 years and over) Male Adult (25 years and over)
Male Youth (18-24 years old) Male Youth (18-24 years old)
Male Adolescent (12-17 years old) Male Adolescent (12-17 years old)

Defining Communitiy Vulnerability in Lebanon – September 2014 - February 2015
22
A key output following this phase of data collection was an interim findings report, which aimed to highlight key
issues affecting community vulnerabilities based on the KI interviews conducted in Phase 1 and FGDs from Phase
2a. The report explored four dimensions of community vulnerabilities as identified through prior phases of data
collection and analysis as well as the secondary data review. These dimensions included demographic pressure,
poverty, community resilience and social cohesion.14
Phase 2b: Individual Interviews
A total of 252 communities were selected for in-depth study for Phase 2b of primary data collection activities
through the preliminary vulnerability ranking index developed during Phase 1. The communities selected for this
phase of data collection included the highest ranking communities in terms of vulnerability in each of the 242 most
vulnerable cadastral zones. An additional 10 communities, which were ranked as the most vulnerable village or
neighbourhood in their respective cadastral zones but falling outside UNICEF’s 242 most vulnerable cadastres,
were selected. The findings presented from Phase 2b cited in this report are based on the 13,120 surveys from
207 communities (198 assessed completely; nine assessed partially) across Lebanon as of 28 February 2015. All
252 communities selected for Phase 2b were not assessed largely due to access issues in the field; as a result,
surveys were carried out in 199 communities situated in the 242 most vulnerable cadastral zones and eight
additional communities situated outside of the 242 most vulnerable cadastres (see Table 3 and Map 2).
Table 3: Number of communities visited and interviews conducted by operational area as part of Phase 2b
Operational Area
Number of
Villages Visited
Number of
Interviews
Akkar 36 2,294
Mt. Lebanon/Beirut 49 3,998
Bekaa 63 3,228
South 22 1,229
Tripoli T5 37 2,371
Total 207 13,120
The methodology for primary data collection of Phase 2b was individual-level surveys administered on the
smartphones and tablets programmed with the Kobo platform. This closed questionnaire explores the needs,
vulnerabilities and risks of dispute at the community level. The individual-level surveys were carried out with at
least 64 residents of each community including displaced and host community members. Survey participants were
selected based on their age and vulnerability profiles (see Table 4). Table 4 shows the number of interviewees by
population group surveyed as part of Phase 2b primary data collection in each community to be assessed.
14 REACH Initiative, UN Office for Coordination of Humanitarian Affairs and United Nations Children’s Fund, Informing targeted host community programming in Lebanon: Interim cross-sector analysis report, November 2014.

Defining Communitiy Vulnerability in Lebanon – September 2014 - February 2015
23
Table 4: Breakdown of intended interviewees by community for Phase 2b data collection
Age/Population Group
# of Host
Community
Interviewees
# of Displaced
Community
Interviewees
Female Adult (25 years and over) 4 4
Female Youth (18-24 years old) 4 4
Female Adolescent (12-17 years old) 4 4
Pregnant Women 4 4
Mothers/Caregivers 4 4
Male Adult (25 years and over) 4 4
Male Youth (18-24 years old) 4 4
Male Adolescent (12-17 years old) 4 4
Total 32 32
Limitations
There are several limitations in the study methodology for Phases 2a and 2b. Sample selection was based on
snowballing techniques, and FGD and survey participants were therefore not selected on a truly random basis. In
addition, the sample was further stratified to include a larger number of female groups based on age and belonging
to specific vulnerability groups (e.g. pregnant women). The scope of data collection has been limited to 199 villages
and neighbourhoods situated within the 242 most vulnerable cadastres and eight additional communities situated
outside of these worst ranked cadastres. It must be noted that due to access difficulties (based on security incidents
as well as the presence of non-state actors), there is uneven coverage of the five operational areas in which study
sites are located. In particular, a substantial proportion of the villages and neighbourhoods situated in South
operational area, specifically in El Nabatieh Governorate, were not assessed due to access-related difficulties. In
sum, the results of this study are not representative of conditions across all areas in Lebanon; however, as a large
number of surveys were completed across the country, results can be considered close to representative of needs
and vulnerabilities among displaced and host communities in Lebanon’s most vulnerable areas.

Defining Communitiy Vulnerability in Lebanon – September 2014 - February 2015
24
Map 2: Cadastres and communities covered during Phase 2a (FGDs) and Phase 2b (surveys) data collection

Defining Communitiy Vulnerability in Lebanon – September 2014 - February 2015
25
BACKGROUND: KEY FINDINGS FROM ASSESSMENT PHASES 1 & 2A
During the inception phase of the project, a secondary data review15 was carried out to inform the development of
data collection tools and identify major gaps in information for the purposes of humanitarian and development
planning. The report focused on identifying key trends relating to the social, economic and political impact of the
influx of refugees into hosting communities as well as the principal vectors of tensions in these areas. This review
found that the impact of the crisis had been profound; secondary data sources highlighted that between 170,000
and 200,000 Lebanese were expected to fall below the poverty line by the end of 2014; this would be in addition
to the 1 million Lebanese already identified in 2004 to be living on less than US$4 per day. The Syrian crisis was
additionally taking a toll on key economic sectors such as tourism, banking and real estate, and indirectly lowering
economic activity in the country; this was further widening the gap between government revenue and public
expenditure. The review further brought to light the numerous assessments, reports and media articles attributing
problems in public service delivery and high costs of living to the on-going conflict in Syria. The number of displaced
seeking refuge in the country rose sharply in 2013; these demographic pressures were linked to frequent power
outages, water shortages, sharp rise in waste production, higher demand on an already strained health
infrastructure, and rising demand for education services.
The preliminary findings report16 produced during the KI interviews phase revealed key trends by sector as reported
by community representatives in the 242 most vulnerable cadastres. The most frequently mentioned top needs
within assessed communities included wastewater management (28 per cent of surveyed communities) and
water supply (27 per cent of surveyed communities) in their respective villages and neighbourhoods. Other top
reported needs included electricity supply (11 percent), employment and jobs (10 per cent) and health
services (7 per cent). It must be noted that data collection took place during the summer months of 2014, which
may account for increased access to water supply featuring as a top need. The study found that there were
significant regional and sector-specific trends within the framework of community vulnerabilities. Approximately 65
per cent of KIs in Akkar and Tripoli T5 reported improving access to education as urgent or critical in their
communities. Accessing health facilities also proved difficult in these operational areas as well as in Bekaa as 62
per cent, 45 per cent and 38 per cent of survey communities in Akkar, Tripoli T5 and Bekaa respectively,
travel over 2 kilometres to access health facilities. Just over half of the surveyed communities reported
being connected to public water networks; seasonal differences in water access were more pronounced in
surveyed communities in Akkar and Mount Lebanon/Beirut. Inadequate wastewater infrastructure was more
common in Akkar and Bekaa as 43 per cent and 39 per cent respectively, of the surveyed communities
relied on open fields and pit latrines as their main source of wastewater disposal. Access to affordable
shelter options was problematic in all five operational areas. More than three-fourths of assessed communities
reported an increase in community unemployment rates and cited increased job competition given population
increase and lack of jobs as main causes for rising unemployment. Lastly, in regards to community tensions, 61
per cent of assessed communities reported incidents of tension or violence in the six months preceding
the study, signalling a potential breakdown or declining level of social cohesion. These incidents were
thought to be motivated primarily by cultural differences, housing shortages and high unemployment.
Phase 2a sought to explore more qualitatively factors affecting community vulnerabilities and the various
dimensions and manifestations of community level vulnerabilities. The interim findings report17 of this assessment
explored four pre-identified themes of vulnerability including demographic pressure, poverty, long-term structural
deficiencies affecting community resilience, and social instability. In reference to demographic pressure, host and
15 REACH Initiative and UN Office for Coordination of Humanitarian Affairs, note 11 supra 16 REACH Initiative and UN Office for Coordination of Humanitarian Affairs, note 12 supra 17 REACH Initiative, UN Office for Coordination of Humanitarian Affairs and United Nations Children’s Fund, note 13 supra
Defining Communitiy Vulnerability in Lebanon – September 2014 - February 2015
26
displaced residents alike reported a marked increase in the number of inhabitants in their areas and linked this
population increase to negative impacts on shelter and livelihoods options as well as an increase in waste
production. Discussions surrounding the issue of poverty revealed that community participants understood
poverty almost exclusively in terms of financial issues as well as access to food and healthcare. Host and
displaced participants reportedly feared for their children’s futures as a result of increasing financial insecurity.
Financial insecurity was additionally linked to limited female autonomy and empowerment. Community resilience,
understood as a community’s ability to adapt to sudden shocks or stressors by means of access to public
infrastructure, shelter and livelihoods, was decreasing for both host and displaced populations. Access to
education was particularly problematic due to the high cost of school fees and materials, and many
participants reported the prevalence of out-of-school children in their respective communities. Of note,
FGD participants further highlighted the inadequate or lack of support from non-governmental organizations
(NGOs) or the United Nations in regards to their children’s educational needs. Health care was equally
problematic for most community members to access as a result of rising costs of treatment and lack of
specialised health departments to meet the specific needs of children and women. Discussions further
revealed that drivers of community tensions were becoming more pronounced as a result of competition
over employment and shelter between host and displaced groups.
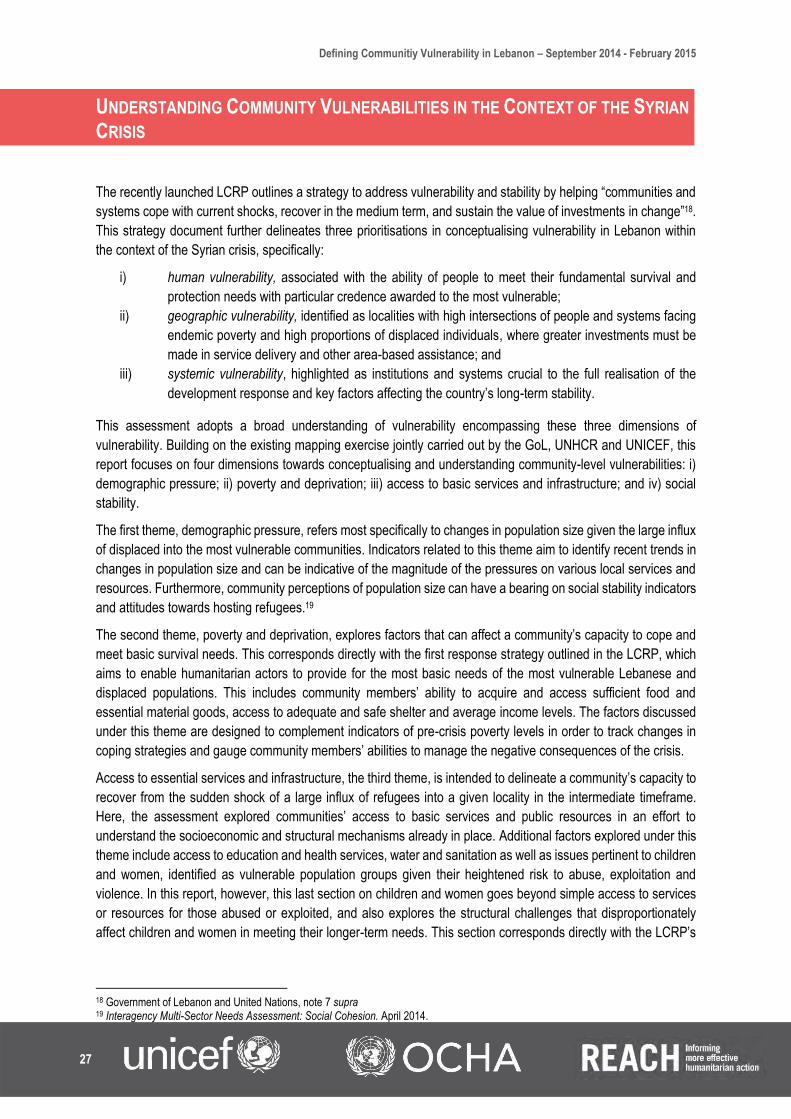
Defining Communitiy Vulnerability in Lebanon – September 2014 - February 2015
27
UNDERSTANDING COMMUNITY VULNERABILITIES IN THE CONTEXT OF THE SYRIAN
CRISIS
The recently launched LCRP outlines a strategy to address vulnerability and stability by helping “communities and
systems cope with current shocks, recover in the medium term, and sustain the value of investments in change”18.
This strategy document further delineates three prioritisations in conceptualising vulnerability in Lebanon within
the context of the Syrian crisis, specifically:
i) human vulnerability, associated with the ability of people to meet their fundamental survival and
protection needs with particular credence awarded to the most vulnerable;
ii) geographic vulnerability, identified as localities with high intersections of people and systems facing
endemic poverty and high proportions of displaced individuals, where greater investments must be
made in service delivery and other area-based assistance; and
iii) systemic vulnerability, highlighted as institutions and systems crucial to the full realisation of the
development response and key factors affecting the country’s long-term stability.
This assessment adopts a broad understanding of vulnerability encompassing these three dimensions of
vulnerability. Building on the existing mapping exercise jointly carried out by the GoL, UNHCR and UNICEF, this
report focuses on four dimensions towards conceptualising and understanding community-level vulnerabilities: i)
demographic pressure; ii) poverty and deprivation; iii) access to basic services and infrastructure; and iv) social
stability.
The first theme, demographic pressure, refers most specifically to changes in population size given the large influx
of displaced into the most vulnerable communities. Indicators related to this theme aim to identify recent trends in
changes in population size and can be indicative of the magnitude of the pressures on various local services and
resources. Furthermore, community perceptions of population size can have a bearing on social stability indicators
and attitudes towards hosting refugees.19
The second theme, poverty and deprivation, explores factors that can affect a community’s capacity to cope and
meet basic survival needs. This corresponds directly with the first response strategy outlined in the LCRP, which
aims to enable humanitarian actors to provide for the most basic needs of the most vulnerable Lebanese and
displaced populations. This includes community members’ ability to acquire and access sufficient food and
essential material goods, access to adequate and safe shelter and average income levels. The factors discussed
under this theme are designed to complement indicators of pre-crisis poverty levels in order to track changes in
coping strategies and gauge community members’ abilities to manage the negative consequences of the crisis.
Access to essential services and infrastructure, the third theme, is intended to delineate a community’s capacity to
recover from the sudden shock of a large influx of refugees into a given locality in the intermediate timeframe.
Here, the assessment explored communities’ access to basic services and public resources in an effort to
understand the socioeconomic and structural mechanisms already in place. Additional factors explored under this
theme include access to education and health services, water and sanitation as well as issues pertinent to children
and women, identified as vulnerable population groups given their heightened risk to abuse, exploitation and
violence. In this report, however, this last section on children and women goes beyond simple access to services
or resources for those abused or exploited, and also explores the structural challenges that disproportionately
affect children and women in meeting their longer-term needs. This section corresponds directly with the LCRP’s
18 Government of Lebanon and United Nations, note 7 supra 19 Interagency Multi-Sector Needs Assessment: Social Cohesion. April 2014.

Defining Communitiy Vulnerability in Lebanon – September 2014 - February 2015
28
second response mechanism, which hopes to strengthen local service delivery and infrastructure in areas with
substantial proportions of displaced populations as well as weak public institutions.
The last theme, social stability, hopes to shed light on issues relevant to the efficacy of the response strategy and
Lebanon’s long-term development and stabilisation. Specifically, the issues explored include community access to
livelihoods as well as risks of dispute or even conflict. This theme corresponds directly with the third response
strategy of the LCRP that aims to strengthen incomes and livelihoods to mitigate resorting to negative coping
mechanisms, and offset tensions in communities facing significant pressures.
Lastly, the level of analysis and focus of this assessment is at the community level, defined within the parameters
of a specific village or neighbourhood. Though prior conceptualisations of vulnerability for humanitarian and
development programming within the context of the Syrian Crisis have taken into account the capacity of
individuals20, households or communities to withstand and recover from sudden shocks and stressors, planning
documents and agency directives have often defined vulnerability at the individual or household levels21. This has
resulted in classifications of vulnerability being applied to specific population cohorts or groups, for example,
unaccompanied or orphaned children, female-headed households or the physically disabled. However, individual
or household characteristics, though important for humanitarian assistance provision, are difficult units of analysis
when trying to plan large-scale humanitarian and development programmes and vulnerability targeting. Therefore,
the focus on the community-level, as a larger unit of analysis, is intended to more easily facilitate humanitarian and
development strategic planning.
The first main section of this report presents general findings related to the four themes mentioned above,
beginning with demographic pressure, followed by poverty, access to essential services and infrastructure and
finishing with social stability. These sections disaggregate responses and analysis by displacement status (i.e.
host or displaced) and gender to provide a richer and more nuanced understanding of community-level
vulnerabilities. The second main section of findings outlines some brief regional findings; here, the level of analysis
is at the level of UNHCR operational areas, specifically: Akkar, Beirut / Mount Lebanon, Bekaa, South and Tripoli
T5. The final section outlines key recommendations for vulnerability analysis and scoring for the purposes of
humanitarian and development planning.
20 United Nations Development Programme and United Nations Development Group Working Group on Resilience – MENA, Position Paper: A Resilience-Based Development Response to the Syria Crisis, December 2013. 21 United Nations Development Programme and Overseas Development Institute, Towards a resilience-based response to the Syrian refugee crisis, May 2014.

Defining Communitiy Vulnerability in Lebanon – September 2014 - February 2015
29
THEME 1: DEMOGRAPHIC PRESSURE
There is undisputed evidence of significant demographic pressure across Lebanon as a result of the on-going Syria
Crisis (see Figure 3). As of 27 January 2012, almost 7,000 Syrian refugees were registered with UNHCR compared
with more than 1.15 million refugees as of January 2015.22 The number of Syrian refugees registering with UNHCR
rose rapidly in 2013 and has continued to increase well into 2013 and 2014. From 2011 to the end of 2014, the
total in-country population in Lebanon had increased by 30 per cent.23 The magnitude of this demographic change
is significantly impacting some of the most vulnerable host communities; the UNICEF vulnerability mapping
exercise suggests that the 242 most vulnerable cadastral zones hosts two-thirds of poor Lebanese and four-fifths
of registered Syrian refugees and Palestine refugees.
Figure 3: Number of registered Syrian refugees from January 2012 till present24
With a trend of gradually increasing demographic pressure at the national level in mind, regions in Lebanon have
experienced spikes in the population of registered Syrians at different times. Beirut & Mount Lebanon first
experienced a significant spike in registrations from displaced Syrians (716 per cent) between Q3 and Q4 of 2012,
followed by a second spike in registrations between Q1 and Q2 of 2013. A similar trend can be noted in Bekaa and
Baalbek El Hermel which experienced two spikes in the number or registered Syrians between Q2 and Q3 of 2012
(211 per cent) and Q3 and Q4 of the same year (112 per cent). On the other hand, Akkar & North and the South
have experienced relatively gradual increases in the number of registered Syrians since the onset of the crisis,
with the number of registered Syrians actually decreasing in Akkar & the North during the last quarter of 2014 and
the first of 2015.
22 Ibid. 23 Government of Lebanon and United Nations, note 7 supra 24 United Nations High Commissioner for Refugees, Inter-agency Information Sharing Portal - Syria Regional Refugee Response
0
200,000
400,000
600,000
800,000
1,000,000
1,200,000
Q2 Q3 Q4 Q1 Q2 Q3 Q4 Q1 Q2 Q3 Q4 Q1 Q2 Q3 Q4 Q1
2011 2012 2013 2014 2015

Defining Communitiy Vulnerability in Lebanon – September 2014 - February 2015
30
Figure 4: Number of registered Syrian refugees from the first quarter of 2011 to present per region25 26
Of the 207 assessed communities, an overwhelming 95 per cent of host respondents reported a slight or significant
increase in the population size within their communities in the last three years. Approximately 90 per cent of
displaced participants reported a slight or significant increase in the local population sizes in the last 6 months.
This may indicate that local population size in the assessed communities has been growing since the start of the
Syrian crisis and is continuing to increase more recently. FGD participants in 10 assessed communities across the
five operational areas pointed to an influx of refugees as the main cause of population increase.
This assessment revealed that displaced community members choose places of residence in Lebanon for a variety
of reasons (see Figure 5). The first most frequently cited motivating factor reported by both female and male
displaced participants was safety concerns at the last location (32 and 33 per cent respectively). This may be owing
to the fact that many recent refugees have left Syria or bordering areas due to on-going conflict in these regions.
A significant proportion of displaced participants cited the presence of family or friends (19 per cent overall) as well
as increased employment opportunities (18 per cent overall) for their selection of current places of residence.
Interestingly, a higher proportion of female survey participants pointed to the presence of family and friends (22
per cent compared to 15 per cent of their male counterparts) as a main motivator for their selection of residence.
Access to employment opportunities was featured at a higher proportion by male respondents (27 per cent
compared to 12 per cent by their female counterparts); this may be owing to traditional values placing the
responsibility of income-generation primarily on male members of families.
25 Ibid. 26 Note, until Q1 of 2013 statistics on registered Syrian Refugees in the South was grouped with Beirut & Mount Lebanon
0
50,000
100,000
150,000
200,000
250,000
300,000
350,000
400,000
450,000
Q2 Q3 Q4 Q1 Q2 Q3 Q4 Q1 Q2 Q3 Q4 Q1 Q2 Q3 Q4 Q1
2011 2012 2013 2014 2015
Akkar & North Beirut & Mount Lebanon Bekaa & Baalbek El Hermel South

Defining Communitiy Vulnerability in Lebanon – September 2014 - February 2015
31
Figure 5: Heat map of top reasons cited by displaced participants moving to present location in last 6 months
Regarding regional differences, it appears that employment was cited as a reason for leaving by 25 per cent in
Mount Lebanon Governorate, 14 per cent in Bekaa Governorate and 9 per cent of respondents in North
Governorate. Overall, amongst the displaced households who did mention employment as a reason for leaving,
82% were located in these four governorates. Nevertheless, it should be mentioned that 35% of respondents in
the South Governorate replied “do not know”; therefore South Governorate results should be used with reservation
regarding this indicator.
In addition, 60 per cent of displaced respondents (15 out of 25 individuals) who had moved to Beirut in the last 6
months selected “safety concerns” at their previous location as first reason to leave.
Similar to host repondents, the highest proportion of displaced respondents reporting employment opportunities
as a primary motivation were identified in Beirut and Mount Lebanon governorates.

Defining Communitiy Vulnerability in Lebanon – September 2014 - February 2015
32
Figure 6: Reasons for displaced respondents moving to current location in the past 6 months (by Governorate)
FGD participants in the 10 communities across Lebanon also highlighted the prevalence of out-migration or
displacement of host community members since the start of the Syrian crisis. Figure 7 shows the breakdown of
motivations by gender and age group of surveyed host respondents in moving from their previous place of
residence in the last three years. A high proportion of host survey participants who had settled in assessed
communities in the last three years noted the importance of social connections (30 per cent) and increased
employment opportunities (32 per cent) as primary factors driving their recent migration. These movements may
also be a by-product of deteriorating socioeconomic and security conditions, as a high proportion of female host
community survey participants cited safety concerns at the last location (12 per cent) and lack of affordable housing
(11 per cent) as main reasons in selecting their new places of residence.
0% 10% 20% 30% 40% 50% 60% 70% 80% 90% 100%
Akkar
Baalbek El Hermel
Beirut
Bekaa
Mount Lebanon
North
South
Discrimination/Hostility at last location More employment opportunities here
Knew friends/family here Lower cost of living here
No access to education at last location No access to health services at last location
Other Residence/Registration restrictions at last site
Saftey concerns at last location Same community at last location
Same political beliefs here More shelter options or availability here
Poor quality of housing/sanitation at last location

Defining Communitiy Vulnerability in Lebanon – September 2014 - February 2015
33
Figure 7: Heat map of top reasons cited by host participants moving to present location in last 3 years
Employment opportunities were most commonly cited as a reason for moving for 37 per cent of host respondents
in Mount Lebanon Governorate. The high proportion of host respondents which move to Beirut and Mount Lebanon
in the last three years as a result of employment opportunities reflects the reality that there is a significant
concentration of industry in Beirut and Mount Lebanon, arguably to the exclusion of other regions27. Employment
opportunities was also cited as a prevalent reason by respondents who have moved to their community in the last
3 years in Bekaa and Akkar, 24 per cent and 5 per cent respectively. This can be explained by the presence of
seasonal agricultural employment in these two largely agricultural governorates.
27 Dr. Elie Yashouie, Towards an Industrial Strategy for Lebanon, 1996

Defining Communitiy Vulnerability in Lebanon – September 2014 - February 2015
34
Figure 8: Reasons for host respondents moving to current location in the past 3 years (by Governorate)
For both displaced and host communities, employment opportunities as the main reason for moving to the current
location were cited with the highest frequency in Beirut (30% host respondents and 27% displaced respondents)
and Mount Lebanon (37% host repondents and 25% displaced respondents) governorates. Such a trend i.e. of
households moving to same locations with similar objectives, could intensify competition and imply a potential
increase in tensions between displaced and host communities.
0% 10% 20% 30% 40% 50% 60% 70% 80% 90% 100%
Akkar
Baalbek El Hermel
Beirut
Bekaa
Mount Lebanon
North
South
Knew friends/family here Hostility or tensions in last location
Improved access to education Improved access to health services
Lack of affordable housing at last location More employment opportunities here
Other Presence of displaced communities in last location
Safety concerns at last location Same religious group here

Defining Communitiy Vulnerability in Lebanon – September 2014 - February 2015
35
THEME 2: POVERTY AND DEPRIVATION
Both the first overall need and corresponding response strategy identified within the LCRP are focused on ensuring
the immediate survival needs of the most vulnerable displaced and Lebanese populations. This section highlights
key trends regarding short-term needs of these most vulnerable individuals especially as they relate to household
income. This section explores issues pertaining to household characteristics, livelihoods and income. In addition,
this section highlights survey participants’ top reported needs within their communities.
Household Profile
The average household sizes differed slightly between host and displaced survey participants; on average,
surveyed host and displaced members lived in households of 5 and 7 members, respectively. Household sizes
differed slightly by operational area as well, with surveyed host participants in Mount Lebanon and Beirut reporting
the smallest average household size (4.5 persons per household) (see Figure 11). Household sizes were more
similar between the two groups in Akkar with host and displaced participants reporting an average of 6.2 and 6.7
members, respectively.
Figure 9: Average number of household members by operational area
Livelihoods and Income
Main sources of income, participation in income-generating activities and income levels have an important bearing
on community members’ abilities to meet their basic and immediate survival needs. The section below outlines key
trends by population cohort regarding main sources of income, common modes of employment, participation in
labour market and average household incomes.
Livelihoods
Main sources of income differed significantly between host and displaced respondents (see Figure 12). A high
proportion of host community reported that their community members were engaged in formal commerce (23 per
cent) and informal commerce (26 per cent). The most commonly cited source of income by displaced respondents,
however, was unskilled non-agricultural labour (24 per cent) followed by reliance on food vouchers (21 per cent).
6.2
5.2
4.5
5.1
5.3
6.7
6.9
6.2
6.4
6.9
0.0 1.0 2.0 3.0 4.0 5.0 6.0 7.0 8.0
Akkar
Bekaa
Mt Leb/Beirut
South
Tripoli T5
Average number of HH members
Displaced Host

Defining Communitiy Vulnerability in Lebanon – September 2014 - February 2015
36
What is evident from Figure 12 is the participation of host respondents to identify with higher skilled positions, while
displaced participants identified their community’s involvement in low or semi-skilled professions.
Figure 10: Heat map of respondents' reporting main sources of income within community
When considering primary income generating activities of respondents, clear differences can be observed between
governorates. In the predominately agricultural governorates of Baalbek-El Hermel and Bekaa, unskilled labour is
the main source of income for displaced respondents for 54 and 50 per cent respectively.
Surprisingly, despite Akkar Governorate also being predominately agricultural, only 14 per cent of displaced
respondents reported unskilled agricultural labour as their primary income source. Including unskilled non-
agricultural labour, the total percentage of displaced respondents reporting unskilled labour as the main source of
income in this governorate amounts to 31 per cent. Another important primary income source for displaced
populations in this governorate was reported to be food vouchers, at 31 per cent. This highlights a reliance on
external support and the inability of displaced populations in this governorate to find gainful employment.
Across governorates overall, the significant proportion of displaced respondents reporting unskilled non-
agricultural labour as a primary source of income (except for Akkar and the North governorates) can possibly be
attributed to the presence of construction related jobs.
For host respondents, significant proportions reported their primary source of income as formal commerce in Beirut
and Mount Lebanon governorates. Informal commerce was reported as a primary income source by 32 per cent,
29 per cent and 24 per cent in North, Akkar and South governorates respectively. The prevalence of informal
commerce amongst host community respondents corroborates a study conducted by the International Monetary

Defining Communitiy Vulnerability in Lebanon – September 2014 - February 2015
37
Fund where it was estimated that up to half of employed Lebanese citizens are engaged in informal economic
activities28.
The similarities between proportions of displaced and host communities reporting unskilled non-agricultural labour
as a primary source of income, particularly in the Baalbek-El Hermel, Beirut, and South Governorates, highlights
a potential for tension when taking into consideration that access to employment opportunities was identified as a
source of community division. Also affecting the vulnerability and sustainability of livelihoods of the most vulnerable
displaced and hosting communities is the common modes of employment for each respective population. A higher
proportion of host respondents (72 per cent) reported involvement in regular employment opportunities among
their community members, in contrast to 22 per cent of displaced participants (see Figure 13 below). A significantly
larger proportion of displaced participants (93 per cent) reported their group’s participation in irregular, temporary
or seasonal modes of employment compared with 46 per cent of host respondents.
Figure 11: Percentage of respondents reporting most common modes of employment29
When disaggregating by governorates, respondents in Beirut, Mount Lebanon and Bekaa most commonly reported
that they were engaged in regular employment (74 per cent, 66 per cent and 51 per cent respectively). Conversely,
in North governorate, the majority of respondents reported that their employment was either irregular or temporary
(66 per cent). It was also true for Akkar, even though in smaller proportions, with 61 per cent of respondents
reporting irregular or temporary employment).This highlights the relatively lower levels of development in the two
regions.
This study further revealed gendered trends in community participation in the labour force. Surveyed community
members highlighted lower levels of involvement of working women and girls than men and boys (see Figure 14).
There were notable trends among specific population cohorts between host and displaced participants. A
significantly higher proportion of host participants reported the prevalence of working women aged 18 years and
older (80 per cent) compared to 46 per cent of displaced respondents. In reverse, a significantly larger proportion
28 International Monetary Fund, IMF Country Report No. 14/238, 2014 29 Respondents were allowed to provide multiple answers to this question.
0%
10%
20%
30%
40%
50%
60%
70%
80%
Regular Irregular/temporary Seasonal None
Host Displaced

Defining Communitiy Vulnerability in Lebanon – September 2014 - February 2015
38
of displaced participants cited the participation of male adolescents aged 12 to 17 years (48 per cent) compared
with 29 per cent of host participants.
Figure 12: Percentage of respondents reporting population cohort participation in labour markets by age and gender
Figure 15 below shows the most commonly cited reasons provided for poor participation of female community
members in the local labour market. Most frequently cited reasons were the number of household and childrearing
responsibilities borne mainly by both host and displaced female community members (23 per cent of respondents).
A high proportion of displaced respondents also remarked upon the prevalence of traditional values and customs
as factors affecting low female participation in the labour force (30 per cent of displaced respondents). FGDs with
both host and displaced female groups revealed that many women faced social barriers to accessing services and
livelihood opportunities; due to safety reasons, women were often prohibited by spouses or male household
members to leave home. These findings demonstrate the significant additional challenges girls and women face
in accessing labour markets and income-generating activities.
Figure 13: Commonly cited reasons for no or poor female participation in labour force
2%
7%
12%
48%
46%
99%
1%
2%
10%
29%
80%
100%
0% 20% 40% 60% 80% 100% 120%
Female children (3-11)
Male children (3-11)
Female adolescents (12-17)
Male adolescents (12-17)
Women (18+)
Men (18+)
Host Displaced

Defining Communitiy Vulnerability in Lebanon – September 2014 - February 2015
39
Income
Average reported household incomes varied significantly between surveyed host and displaced participants. In
fact, the average monthly household income among surveyed host community members was more than triple
(US$972) that of their displaced counterparts (US$323). Figure 16 further demonstrates that surveyed host and
displaced men reported slightly higher household incomes, on average, than their female counterparts. Such
income disparities may result in even more constrained financial resources for households without male
breadwinners.
Figure 14: Average household monthly income of interviewees (USD)
Average reported monthly household incomes vary significantly between governorates. As expected, the
governorates in which significant proportions of respondents reported formal commerce as a primary source of
income also have the highest reported average monthly household incomes, Beirut – 1035 USD, Mount Lebanon
920 USD, and Baalbek-El Hermel – 671 USD.
There is significant disparity between the highest and lowest reported monthly household incomes between
governorates. Moreover, it is interesting to look at the spread between average income of different population
groups within the same governorate.The average monthly income reported in Akkar Governorate was 40 per cent
lower than that reported in Beirut for displaced persons, and 47 per cent lower for host communities. Despite
significantly higher living costs in many areas of Beirut Governorate, the vast disparity between average incomes
highlights the potentially high level of vulnerability of both populations living in Akkar Governorate.
309345
961993
0
200
400
600
800
1000
1200
Female Male
Displaced Host

Defining Communitiy Vulnerability in Lebanon – September 2014 - February 2015
40
Figure 15: Average monthly household income by governorate and population group
Household Expenditures
Household expenditures can be telling of community vulnerabilities in the immediate term. Taken in conjunction
with average incomes, expenditures can indicate trends in resource prioritisation and allocation of host and
displaced respondents in meeting their essential, survival needs. It is important to note that reported household
expenditures, especially for displaced respondents, significantly outstrip reported average mounthly household
income. While it is possible that households rely on savings or underreport income levels, the high levels of
reported household expenditure can be best explained by the high reliance on borrowed money and / or credit
amongst the displaced population. Indeed, the VASyR 2014 noted that 82% of displaced Syrians borrowed money
or received credit in the three months prior to data collection. Of this proportion 50% reported as having over $400
in debt at the time of assessment30. This section reviews data relating to household expenditures on food, shelter
and electricity, essential NFIs, water for drinking and domestic use, and hygiene items.
Food
The majority of host and displaced respondents reported spending more than 50 per cent of their monthly
household incomes towards food expenditures, with 64 per cent of host and 68 per cent of displaced respondents
reportedly setting aside 50 per cent or more of their incomes to purchase food staples (see Figure 19). Surveyed
host community participants spent on average a lower proportion of their monthly household income on basic food
expenses, as 42 per cent of host respondents, in contrast to 52 per cent of displaced respondents, spent over 60
per cent of their household incomes on food-related expenses each month. With significantly lower monthly
incomes than host respondents, displaced participants may be obliged to allocate a larger share of their incomes
to meet household food needs.
30 World Food Programme, Vulnerability Assessment of Syrian Refugees in Lebanon: 2014, January 2015
$0
$200
$400
$600
$800
$1,000
$1,200
$1,400
$1,600
Akkar Baalbek-ElHermel
Beirut Bekaa MountLebanon
North South
Displaced Host Average

Defining Communitiy Vulnerability in Lebanon – September 2014 - February 2015
41
Figure 16: Reported percentage of monthly household income spent on basic food items
As shown above, both displaced and host community respondents most commonly reported spending more than
50 per cent of their household income on food. This was the most prevalent reported food expenditure in Akkar
and North Governorates where 80 per cent and 79 per cent respectively reported that food counted for over 50 per
cent of total household expenditure. Food expenditure as a proportion of total household expenditure was
reportedly the lowest in the Bekaa and Mount Lebanon Governorates, with 13 per cent and 17 per cent of
respondents respectively spending less than 30 percent of their total household income on food. The relatively
lower proportion of household expenditure on food in the aforementioned governorates can be explained by the
higher cost of other basic household needs in the region, such as shelter.
Figure 17: Most commonly reported percentage of monthly household income spent on basic food items by governorate
Shelter and Electricity
There is a significant difference in the average household expenditures on shelter per month between host and
displaced respondents. On average, surveyed host and displaced participants reported spending US$321 and
US$213 per month, respectively, on accommodation. When comparing average household expenditures by
occupancy arrangement, a higher proportion of displaced participants pay more for owned apartments/houses and
0%
5%
10%
15%
20%
25%
0-10% 11-20% 21-30% 31-40% 41-50% 51-60% 61-70% 71-80% 81-90% 91-100%
Host Displaced
0%
10%
20%
30%
40%
50%
60%
70%
80%
90%
100%
Akkar Baalbek-ElHermel
Beirut Bekaa Mount Lebanon North South
Host Displaced

Defining Communitiy Vulnerability in Lebanon – September 2014 - February 2015
42
furnished rentals, whereas host respondents pay more on average for unfurnished rentals (see Figure 21 below).
The former trend may be due to landlords’ charging higher rents to displaced community members. The latter,
however, may indicate that host respondents are more likely to rent unfurnished apartments or homes, and
therefore, tend to pay more than displaced participants, who are renting similar spaces as well as plots of land to
set up tents or handmade shelters.
Figure 18: Average reported household expenditure on shelter by occupancy arrangement
Average reported shelter cost varied significantly between governorates. Respondents reported the highest
average monthly cost for shelter in the Beirut and Mount Lebanon Governorates, US$409 and US$343
respectively. This significantly higher average rent when compared with other governorates is a result of Beirut
being the capital city and Mount Lebanon Governorate being significantly more developed, when compared with
other governorates, and geographically close to the capital.
Conversely, the lowest average reported monthly rental costs were reported in relatively underdeveloped and rural
governorates of Baalbek-El Hermel and Akkar, US$117 and US$156 respectively.
Figure 19: Average reported household expenditure on shelter by governorate
$0 $100 $200 $300 $400 $500 $600
Assistance/Charity
Squatting
Hosted (for free)
Provided by employer
Furnished rental
Unfurnished rental
Owned apartment/house
Host Displaced
$0
$50
$100
$150
$200
$250
$300
$350
$400
$450
Akkar Baalbek-ElHermel
Beirut Bekaa El Nabatieh MountLebanon
North South
Displaced Host

Defining Communitiy Vulnerability in Lebanon – September 2014 - February 2015
43
Survey data revealed that host respondents pay significantly more than their displaced counterparts for electricity
per month. Overall, host respondents cited paying more than double (US$85) the monthly average spent by their
displaced counterparts (US$44). Even when disaggregating by main source of electricity for communities, host
respondents paid significantly more per month on electricity (see Figure 23); this is therefore likely to be due to
differing levels of usage between host and displaced residents. In addition, with significantly lower incomes,
displaced residents may be further restrained from paying for (and therefore using) a higher supply of electricity
per month.
Figure 20: Average reported monthly expenditures on electricity by main source of electricity
Highest average monthly electricity costs were reported by respondents in Mount Lebanon and Bekaa
Governorates, US$96 and US$74 respectively. This average cost is almost three times the amount reported in
Akkar Governorate, US$43, and reflects the significantly higher cost for electricity from private generators (the
primary reported source) in the Mount Lebanon and Bekaa Governorates.
$0 $20 $40 $60 $80 $100 $120
None
Using electricity from nearby houses
Generators
Public network/connection
Displaced Host

Defining Communitiy Vulnerability in Lebanon – September 2014 - February 2015
44
Figure 21: Average reported monthly expenditures on electricity by governorate
Essential Non Food Items (NFIs)
Survey data reveals differential allocations of household income to acquire essential NFIs such as bedding, kitchen
items, gas and fuel between host and displaced respondents (see Figure 25). Approximately 70 per cent of
displaced and 58 per cent of host respondents reportedly allocated up to 30 per cent of monthly household incomes
on the purchase of essential NFIs. A larger proportion of displaced respondents (51 per cent) reported spending
up to 20 per cent of monthly household incomes on acquiring essential NFIs as opposed to host participants (36
per cent). Proportionately lower levels of spending on NFIs by displaced respondents may be due to low levels of
income that are stretched to cover a variety of short-term survival needs. Acquiring NFIs, despite how necessary,
may be of lower priority for many displaced groups than securing adequate shelter or sufficient food to meet
household needs.
Figure 22: Percentage of monthly household income of survey respondents spent on essential non-food items
The highest levels of spending on essential non-food items were reported in Akkar and North Governorates, with
20 per cent of respondents in each reporting that they spent over 50 per cent of their household income on NFIs.
Water
One of the major challenges reported in accessing adequate and sufficient water is high costs. The average
reported monthly household expenditure on water was the highest in Beirut and Bekaa Governorates for drinking
$0
$20
$40
$60
$80
$100
$120
$140
Akkar Baalbek-ElHermel
Beirut Bekaa Mount Lebanon North South
Displaced Host
0%
10%
20%
30%
40%
0-10% 11-20% 21-30% 31-40% 41-50% 51-60% 61-70% 71-80% 81-90% 91-100%
Host Displaced

Defining Communitiy Vulnerability in Lebanon – September 2014 - February 2015
45
water, US$45 and US$33 respectively, and the highest in Mount Lebanon and Beirut for domestic purposes, US$47
and US$39 respectively. The lowest average monthly expenditure on drinking water was reported in North
(USD$24) and South and Baalbek-El Hermel (USD$29 each), and in Akkar and North for domestic water, US$28
and US$25 respectively. This trend highlights the significantly higher costs facing populations living in more
developed governorates of Lebanon, when compared to less developed, predominately rural governorates.
Figure 23: Average expenditures for water for drinking and domestic use by governorate
Health
Survey questions directed at mothers and caregivers confirmed the inability of high proportions of host and
displaced communities to purchase required medicines and vaccinations to meet their household health needs.
More than double the proportion of displaced respondents compared with host participants were unable to acquire
required medications (76 per cent compared to 32 per cent host) (see Figure 28 below).
Figure 24: Perceived ability to purchase medication for household members
Similarily, 63 per cent of displaced respondent caregivers compared to 30 per cent of host participant caregivers
perceived they were unable to afford vaccinations for their families (see Figure 29 below).
$0
$5
$10
$15
$20
$25
$30
$35
$40
$45
$50
Akkar Baalbek-ElHermel
Beirut Bekaa Mount Lebanon North South
Domestic Water Drinking Water
0% 10% 20% 30% 40% 50% 60% 70% 80% 90% 100%
Host (male)
Host (female)
Displaced (male)
Displaced (female)
Do not know No Yes

Defining Communitiy Vulnerability in Lebanon – September 2014 - February 2015
46
Figure 25: Perceived ability to afford vaccinations for children
Interestingly, higher proportions of female host and displaced populations in contrast to their male counterparts
reported an inability to purchase medicines or acquire vaccinations for their family. However, the perceived inability
of displaced populations to afford vaccinations for their children is in the majority of cases misplaced. Current
health programming in Lebanon ensures that vaccinations are free for children in all public health centres, and as
such displaced popluations, at the very least, should not be spending household income on vaccinations.
The perceived ability to purchase required household medications is linked to the governorate of residence. Only
in Beirut and Mount Lebanon Governorates, was it reported by most respondents that they were able to purchase
required medications for themselves and their families (60 per cent and 54 per cent of respondents respectively).
In the remaining governorates, over half of respondents were unable to acquire required medications.
Figure 26: Perceived ability to purchase medication for household members by governorate
As with the purchase of required household medication, the perceived ability of respondents to afford vaccinations
for their children was also dependent on the governorate of residence. In Akkar and North Governorates over half
of respondents reported that they were unable to pay for vaccinations for their children, 62 per cent and 64 per
0% 10% 20% 30% 40% 50% 60% 70% 80% 90% 100%
Host (male)
Host (female)
Displaced (male)
Displaced (female)
Do not know No Yes
0.00%
10.00%
20.00%
30.00%
40.00%
50.00%
60.00%
70.00%
Akkar Baalbek-ElHermel
Beirut Bekaa Mount Lebanon North South
Don't know No Yes

Defining Communitiy Vulnerability in Lebanon – September 2014 - February 2015
47
cent respectively. Conversely, it was most prevalent for Mount Lebanon and South respondents to report that they
were able to afford vaccinations for their children (55 per cent for each).
Figure 27: Perceived ability to afford vaccinations for children by governorate
Coping Strategies
When faced with limited financial resources to cover immediate food and non-food household needs, both host
and displaced respondents reported that they resort to similar coping strategies. Both groups responded that they
resort to buying cheaper or lower quality food (56 per cent and 67 per cent for host and displaced, respectively),
purchasing food and NFIs on credit (42 per cent and 47 per cent, respectively) and borring money or food (31 per
cent and 38 per cent respectively). Highly prevalent negative coping strategies among displaced residents also
included reducing the number of meals per day (52 per cent) or reducing the portion size of meals (46 per cent).
In addition to the aforementioned similarities between cohorts, some reported negative coping strategies were
unique amongst specific population groups. For example, less than 1% host community respondents reported
reliance on food vouchers, while 36 per cent of displaced respondents reported this coping strategy. Between
genders, a higher proportion of displaced women also reported relying on food vouchers (45 per cent) compared
to their male counterparts (26 per cent). When comparing across governorates there are no discernible regional
trends, with a homogeneous spread of coping strategices cross the country.
0%
10%
20%
30%
40%
50%
60%
70%
Akkar Baalbek-ElHermel
Beirut Bekaa Mount Lebanon North South
Don't know No Yes

Defining Communitiy Vulnerability in Lebanon – September 2014 - February 2015
48
Figure 28: Heat map of commonly cited coping strategies
Top Reported Needs
Figure 32 summarises reports of the top needs of assessed host and displaced community members across
Lebanon. Though there are slight preferences for some needs over others between groups, there are no strong
preferences for a single or few needs. Nonetheless, some trends appear which provide some indication of the
socioeconomic conditions of host and displaced communities overall. Greater employment opportunities or jobs
were frequently mentioned by both surveyed host (19 per cent) and displaced (15 per cent) participants alike. FGD
data further corroborates the prioritisation of income-generating activities among host and displaced communities
specifically in an effort to balance the high cost of living in Lebanon. Improved access to health services and
medicines featured high among surveyed host priorities (16 per cent) while winterisation was ranked highly by
surveyed displaced participants (17 per cent). The latter trend can be partially attributed to the fact that data
collection took place during the winter months of 2014 and early 2015. The high proportion of displaced
communities citing improved access to housing may also point to the inadequacy of current shelter arrangements
to cope with colder climates and afford high monthly expenditures for rental accommodation, the most commonly
cited form of occupancy arrangement for displaced participating in this study. While food is also a commonly
reported priority need, particularly for displaced households, it should be noted that data collection took place
before the implementation of cuts to WFP assistance.

Defining Communitiy Vulnerability in Lebanon – September 2014 - February 2015
49
Figure 29: Heat map of top reported needs of assessed communities
Access to employment and jobs featured as the most frequently cited need for host and second most frequently
need for displaced participants (see Figure 22). This corroborates many of the findings from the FGDs carried out
in 10 communities across the country. Host and displaced FGD participants alike reported concerns in their abilities
to secure sufficient incomes to meet household needs. As a result of the Syrian crisis, host FGD participants
reported increased job competition as a result of the refugee influx, particularly in low skilled positions. Displaced
participants on the other hand reported difficulty finding employment opportunities and adequate wages. The
highest reported need among displaced respondents was winterisation. As access to adequate shelter and housing
was also listed as the third top need by displaced respondents, this may suggest that shelter conditions for
displaced households may be ill-equipped to deal with harsh winter climates; as such, access to weatherproof
shelters, blankets and fuel for heating were considered particularly important needs by displaced participants.
Figure 30: Most commonly reported needs as expressed by host and displaced survey participants
Rank Host Displaced
1 Employment/Jobs Winterisation
2 Health Employment/Jobs
3 Electricity supply Shelter/Housing
4 Drinking water Health
5 Roads Education

Defining Communitiy Vulnerability in Lebanon – September 2014 - February 2015
50
THEME 3: ACCESS TO ESSENTIAL COMMODITIES & BASIC SERVICES AND
INFRASTRUCTURE
The LCRP identifies ensuring access to essential basic services and infrastructure as a necessary strategy to
mitigate vulnerabilities of the most vulnerable displaced and poor Lebanese. Addressing these medium term needs
involves addressing structural issues in service delivery, specifically in areas with weak pre-crisis infrastructure,
particularly in locations affected by substantial proportions of refugees. This section presents findings related to
availability of essential items such as food and non-food items; access to shelter, electricity supply; education and
health services; and WASH conditions in assessed communities.
Food
Despite the fact that food was not reported as a top need for reasons mentioned above, access to food remains
critical nonetheless. When asked about the ability to access basic food staples (i.e. flour, bread, milk and eggs) on
local markets on a weekly basis, a higher proportion of displaced respondents (35 per cent) reported an inability
to acquire such goods compared to their host counterparts (14 per cent) (see Figure 34). One possible explanation
for this discrepancy may be due to hosts’ greater institutional knowledge of local markets or higher access to
means of production such as farms, orchards or home gardens. Interestingly, a larger proportion of female host
and displaced respondents (17 per cent and 41 per cent, respectively) reported an inability to acquire basic food
staples on a weekly basis; this may be owing to women’s traditional roles in obtaining and preparing meals for their
families and greater familiarity of acquiring such goods.
Figure 31: Are members of your community able to acquire basic food staples on the local market on a weekly basis?
A greater proportion of displaced respondents (53 per cent) reported an inability to acquire sufficient quantities of
basic food staples to meet their household food needs on a weekly basis in comparison to host respondents (21
per cent) (see Figure 35). This may be a result of the differential levels of incomes between host and displaced
survey participants. With greater incomes (i.e. on average, US$972 for host respondents and US$323 for displaced
monthly), host respondents may be more easily able to secure sufficient quantities of food to feed their families. In
addition, as mentioned in the sections above, displaced respondents mentioned allocating a greater proportion of
their household incomes towards basic food staples; combined with the general trends shown in Figure 35,
however, displaced households are still unable to access sufficient quantities of food. As with ability to access
basic food staples, a larger proportion of female host and displaced (24 per cent and 56 per cent, respectively)
reported an inability to acquire sufficient quantities of food to meet household needs weekly than male respondents.
Again, this may be due to women’s greater participation in food purchase and preparation within their households
suggesting acute awareness of the paucity of food within their households.
0% 10% 20% 30% 40% 50% 60% 70% 80% 90% 100%
Host (male)
Host (female)
Displaced (male)
Displaced (female)
Do not know No Yes

Defining Communitiy Vulnerability in Lebanon – September 2014 - February 2015
51
Figure 32: Are members of your community able to acquire sufficient quantities of basic food staples to meet household food needs on a weekly basis?
Shelter & Electricity
Shelter
Survey data revealed significant differences in access to shelter and accommodation types between host and
displaced community participants (see Figure 36). 62% of host community households as opposed to 34% of those
displaced mentioned independent houses or apartments as a main shelter type for their respective community
members. Also quite frequently mentioned as main types of accommodation for both host and displaced was one
room structures, which was cited by 17 per cent of both host and displaced respondents. However, substantial
proportions of displaced respondents cited handmade shelters and tents (17 per cent compared to 5 per cent of
host respondents) and garages or worksites (13 per cent compared to a host average of 7 per cent) as a primary
accommodation type inhabited by members of their community.
Figure 33: Heat map of common types of community accommodation for host and displaced
0% 10% 20% 30% 40% 50% 60% 70% 80% 90% 100%
Host (male)
Host (female)
Displaced (male)
Displaced (female)
Do not know No Yes

Defining Communitiy Vulnerability in Lebanon – September 2014 - February 2015
52
While reported shelter types were on the whole similar across governorates (a majority of independent houses /
apartments), a clear trend can be observered with regards to the prevelance of handmade shelters or tents in
informal settlements as a shelter solution for displaced respondents. The reported prevelance of this shelter type
in the aformentioend governorates is confirmed by the 11th iteration of the interagency mapping platform, in which
84 per cent of the informal settlements in Lebanon were identified in Akkar, Bekaa, and Baalbek El Hermel
Governorates31.
Figure 34: Reported primary shelter types per governorate
Types of occupancy arrangements differed more significantly than accommodation types; the vast majority of host
respondents (98 per cent) reportedly owned their apartments or houses while the most frequent response among
displaced was unfurnished or land rentals (92 per cent) (see Figure 38). In contrast, approximately 28 per cent of
displaced survey respondents reported the prevalence of owning apartments or houses for members of their
community, and 72 per cent of host respondents cited unfurnished rentals as a main occupancy arrangement. A
higher proportion of displaced respondents also cited the prevalence of accommodation provided by the employer
(22 per cent as opposed to 9 per cent of host) or assistance of charity actors (7 per cent versus 3 per cent of host
respondents).
31 UNHCR led Interagency Mapping Platform
0%
10%
20%
30%
40%
50%
60%
70%
80%
90%
100%
Akkar Baalbek-ElHermel
Beirut Bekaa Mount Lebanon North South
Collective centre/shelter Factory/Warehouse
Garage/Shop/Worksite Handmade shelter/Tent in settlement
Homeless/No shelter Independent house/apartment
One room structure Unfinished building
Other
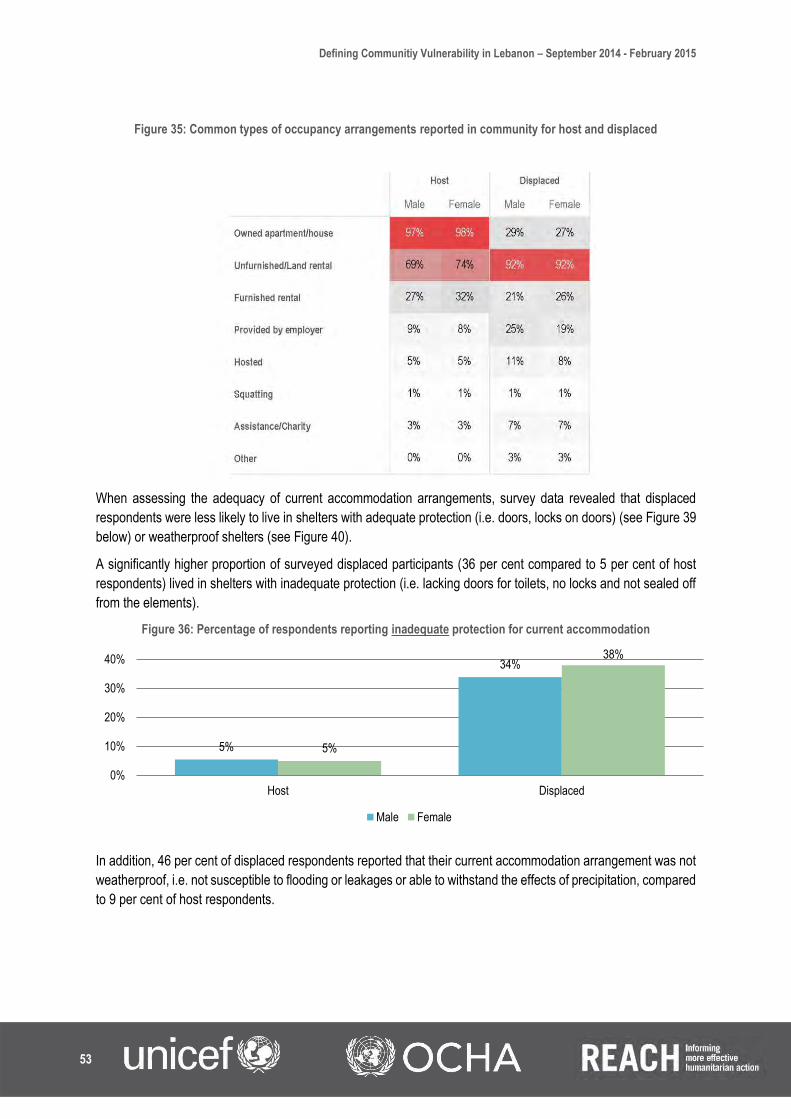
Defining Communitiy Vulnerability in Lebanon – September 2014 - February 2015
53
Figure 35: Common types of occupancy arrangements reported in community for host and displaced
When assessing the adequacy of current accommodation arrangements, survey data revealed that displaced
respondents were less likely to live in shelters with adequate protection (i.e. doors, locks on doors) (see Figure 39
below) or weatherproof shelters (see Figure 40).
A significantly higher proportion of surveyed displaced participants (36 per cent compared to 5 per cent of host
respondents) lived in shelters with inadequate protection (i.e. lacking doors for toilets, no locks and not sealed off
from the elements).
Figure 36: Percentage of respondents reporting inadequate protection for current accommodation
In addition, 46 per cent of displaced respondents reported that their current accommodation arrangement was not
weatherproof, i.e. not susceptible to flooding or leakages or able to withstand the effects of precipitation, compared
to 9 per cent of host respondents.
5%
34%
5%
38%
0%
10%
20%
30%
40%
Host Displaced
Male Female

Defining Communitiy Vulnerability in Lebanon – September 2014 - February 2015
54
Figure 37: Weatherproof status of host (left) and displaced (right) interviewees' current accommodation
Electricity
Common sources of electricity differed only slightly between host and displaced community respondents. The main
source of electricity supply for approximately 91 per cent of host respondents and 86 per cent of displaced
participants was public electricity network. The same percentage of host and displaced respondents cited reliance
on generators (9 per cent). Of note, roughly 4 per cent of displaced respondents confirmed the prevalence of
tapping into an electricity source from nearby houses or settlements as the top source of electricity for members
of their community.
Figure 38: Reported primary electricity source for host (left) and displaced (right)
In addition, displaced respondents reportedly accessed fewer hours of electricity supply than their host
counterparts.
Figure 39: Average hours of daily electricity supply as reported by survey participants
On average, respondents were able to access 12 hours of electricity supply daily. There were slight seasonal
variations, with slightly lower levels of electricity supply per day for both host and displaced respondents in winter
months.
10.6 10.8 11 11.2 11.4 11.6 11.8 12 12.2 12.4
Host
Displaced
Average hours of electricity supply per day
Winter Summer
0%
46%
53%
0%
9%
90%
Do not know
Not weatherproof
Weatherproof
86%
9%
4% 1%
91%
9%
0.29%Publicnetwork/connection
Generators
Using electricity fromnearby houses
None

Defining Communitiy Vulnerability in Lebanon – September 2014 - February 2015
55
Essential Non-Food Items (NFIs)
A higher proportion of surveyed displaced community participants reported limited capacity to access essential
NFIs (such as bedding, clothing, cooking gas and blankets) in their current places of residence. Overall, 49 per
cent of displaced participants, as opposed to 22 per cent of host respondents, reported an inability to acquire
essential NFIs on a weekly basis, highlighting a potentially severe lack of essential NFI availability in local markets.
Notably, a higher proportion of male host and displaced respondents reported an inability to access and secure
essential NFIs on a weekly basis. This may be due to the division of labour within households, potentially leaving
men in charge of acquiring such materials for household use. Men may more frequently travel to local markets and
shops, and may have a more keen awareness of price inflation for essential items and inability to acquire them.
The ability to aquire essential NFIs on the local market on a weekly basis was more commonly reported by
respondents in Beirut and Mount Lebanon than in Akkar Governorate, 72 per cent and 71 per cent respectively
compared with 52 per cent.
Figure 40: Are members of your community able to acquire essential NFIs on the local market on a weekly basis?
Where NFIs were reportedly available in local markets, the ability of community members to sufficiently meet
weekly household needs for essential NFIs varies significantly between host and displaced. While some 69 per
cent of host community respondents reported the ability of their community to meet household NFI needs, the
same can be said for 33 per cent of displaced respondents.There are several potential explanations for this trend
including displaced participants’ lower levels of household income, poor knowledge of local markets and cheaper
outlets, or greater need for NFIs as recent arrivals into the country.
Respondents in Beirut Governorate were slightltly more likely to report the ability to aquire sufficient quantities of
essential NFIs in local markets, 60 per cent of respondents. In Bekaa, South, and Baalbek El Hermel Governorates
slightly less than half of respondents, 42 per cent, 45 per cent and 45 per cent respectively, reported that they
could not aquire sufficient quantities of NFIs in local markets.
0% 10% 20% 30% 40% 50% 60% 70% 80% 90% 100%
Host (male)
Host (female)
Displaced (male)
Displaced (female)
Don't know No Yes
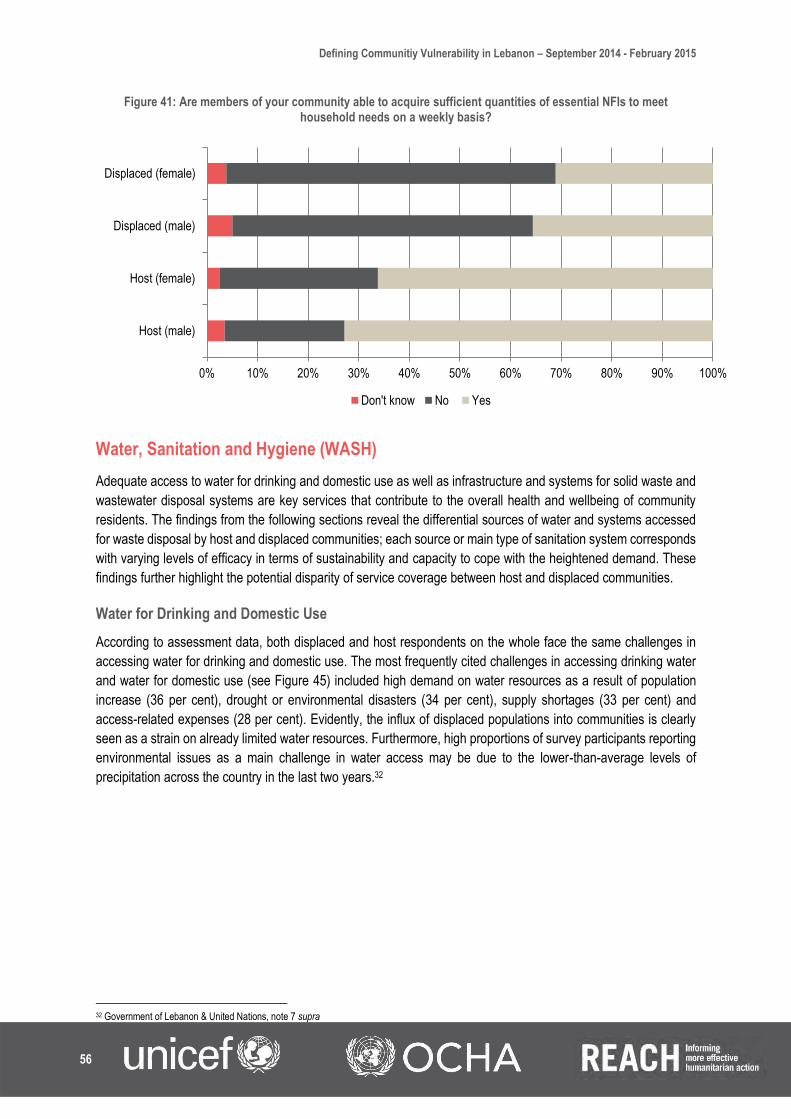
Defining Communitiy Vulnerability in Lebanon – September 2014 - February 2015
56
Figure 41: Are members of your community able to acquire sufficient quantities of essential NFIs to meet household needs on a weekly basis?
Water, Sanitation and Hygiene (WASH)
Adequate access to water for drinking and domestic use as well as infrastructure and systems for solid waste and
wastewater disposal systems are key services that contribute to the overall health and wellbeing of community
residents. The findings from the following sections reveal the differential sources of water and systems accessed
for waste disposal by host and displaced communities; each source or main type of sanitation system corresponds
with varying levels of efficacy in terms of sustainability and capacity to cope with the heightened demand. These
findings further highlight the potential disparity of service coverage between host and displaced communities.
Water for Drinking and Domestic Use
According to assessment data, both displaced and host respondents on the whole face the same challenges in
accessing water for drinking and domestic use. The most frequently cited challenges in accessing drinking water
and water for domestic use (see Figure 45) included high demand on water resources as a result of population
increase (36 per cent), drought or environmental disasters (34 per cent), supply shortages (33 per cent) and
access-related expenses (28 per cent). Evidently, the influx of displaced populations into communities is clearly
seen as a strain on already limited water resources. Furthermore, high proportions of survey participants reporting
environmental issues as a main challenge in water access may be due to the lower-than-average levels of
precipitation across the country in the last two years.32
32 Government of Lebanon & United Nations, note 7 supra
0% 10% 20% 30% 40% 50% 60% 70% 80% 90% 100%
Host (male)
Host (female)
Displaced (male)
Displaced (female)
Don't know No Yes

Defining Communitiy Vulnerability in Lebanon – September 2014 - February 2015
57
Figure 42: Heat map of challenges in accessing water for drinking (centre left) and domestic use (centre right)
The primary sources of drinking water for both host and displaced survey respondents was purchased bottled
drinking water. While this was reported by 36 per cent of all assessed houesholds, host community households
were more likely to rely on bottled water (41%) than displaced households (30%). The second most commonly
reported source was tap water connected to the public network (27 per cent). Of those not relying solely on
purchased bottled water as their main source of drinking water, only 8 per cent of respondents claimed to treat
water before drinking overall; a higher proportion of host participants (10 per cent) than displaced (6 per cent)
claimed to treat their water source prior to consumption. This suggests that consumption of contaminated or
unclean water may be high among both host and displaced respondents unable to afford potable drinking water,
which in turn may be affecting the health status of these vulnerable populations.
Figure 43: Primary sources of drinking water as reported by survey participants
0% 10% 20% 30% 40% 50%
Tap water connected to public network
Well
Water trucking
Purchased bottled water
Spring
Other natural sources (river, lakes)
Other
Displaced Host

Defining Communitiy Vulnerability in Lebanon – September 2014 - February 2015
58
In regards to water for domestic use, host and displaced respondents relied primarily on public water connections
(59 per cent and 49 per cent respectively). The second most commonly cited source of water for domestic was
wells (26 per cent overall). However, access to wells is often restricted to those with such facilities on personal
property or authorised by landlords for use. A higher proportion of displaced respondents (19 per cent) further
highlighted their reliance on water trucking than their host counterparts (8 per cent). Again, water trucking often
involves relatively high costs borne by service users and is not necessarily a feasible option for the most vulnerable
refugees and Lebanese poor.
Figure 44: Primary sources of water for domestic use as reported by survey participants
For drinking water, it was most common for respondents in the largely rural Akkar Governorate to use wells, 46
per cent. The utilization of natural springs was most commonly reported in El Nabatieh, North and Akkar
Governorates, at 34 per cent, 20 per cent and 14 per cent respectively. In Bekaa and Mount Lebanon
Governorates, the most reported primary source of drinking water was bottled water, 39 per cent and 58 per cent
respectively.
Regarding water for domestic purposes, the most commonly reported primary source was tap water, except for
Akkar and Baalbek Governorates (with only 25 per cent and 34 per cent reporting tap water as primary source
respectively). In these two governorates, well was the main source of water for domestic purpose, 50 per cent and
38 per cent respectively. However in the North Governorate 13 per cent of respondents respectively reported that
they rely on natural springs for domestic water purposes.
0% 10% 20% 30% 40% 50% 60% 70%
Tap water connected to public network
Well
Water trucking
Purchased bottled water
Spring
Other natural sources (river, lakes)
Other
Displaced Host
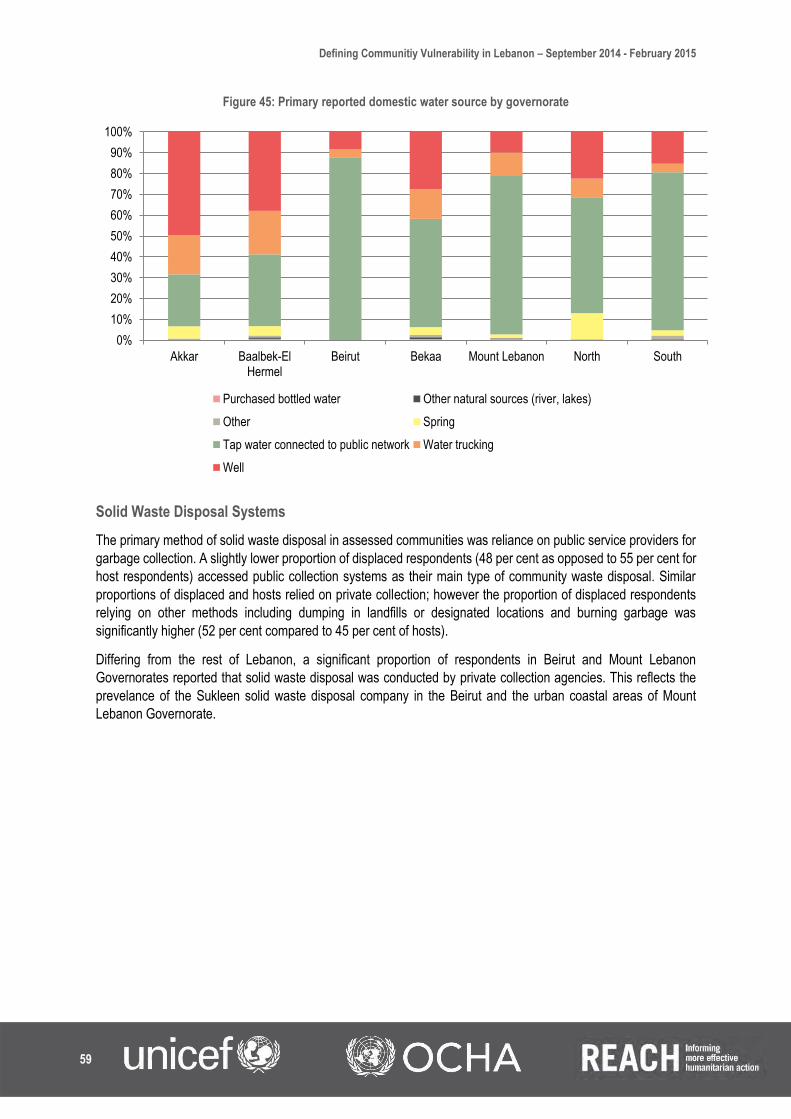
Defining Communitiy Vulnerability in Lebanon – September 2014 - February 2015
59
Figure 45: Primary reported domestic water source by governorate
Solid Waste Disposal Systems
The primary method of solid waste disposal in assessed communities was reliance on public service providers for
garbage collection. A slightly lower proportion of displaced respondents (48 per cent as opposed to 55 per cent for
host respondents) accessed public collection systems as their main type of community waste disposal. Similar
proportions of displaced and hosts relied on private collection; however the proportion of displaced respondents
relying on other methods including dumping in landfills or designated locations and burning garbage was
significantly higher (52 per cent compared to 45 per cent of hosts).
Differing from the rest of Lebanon, a significant proportion of respondents in Beirut and Mount Lebanon
Governorates reported that solid waste disposal was conducted by private collection agencies. This reflects the
prevelance of the Sukleen solid waste disposal company in the Beirut and the urban coastal areas of Mount
Lebanon Governorate.
0%
10%
20%
30%
40%
50%
60%
70%
80%
90%
100%
Akkar Baalbek-ElHermel
Beirut Bekaa Mount Lebanon North South
Purchased bottled water Other natural sources (river, lakes)
Other Spring
Tap water connected to public network Water trucking
Well

Defining Communitiy Vulnerability in Lebanon – September 2014 - February 2015
60
Figure 46: Main methods of solid waste disposal
To gauge the connectivity and efficacy of solid waste management systems as well as differential access issues,
host and displaced communities were asked to confirm the availability of an adequate number of garbage bins in
their localities. A larger proportion of displaced (46 per cent) than host respondents (38 per cent) reported
insufficient bins serving their communities (see Figure 50). This may be due to network coverage of solid waste
management service providers or even a preferential treatment in the distribution of community services.
Figure 47: Coverage of solid waste receptacles in immediate surroundings by host (left) and displaced (right) respondents
As reported above (see Theme 1: Demographic Pressure), host and displaced communities assessed during FGDs
perceived the considerable population increase within their respective communities as linked to an increase in
solid waste and garbage. These visual reminders can therefore lead to biases or even an unwillingness to host
refugees. A high proportion of surveyed community members reported a noticeable excess of refuse or garbage
on streets/open fields/storm drains and overflowing garbage bins (43 per cent), and number of pests (i.e. flies,
rodents and insects) (44 per cent) in their communities, in the last three months.
Between the two population groups, a higher proportion of displaced participants reported a noticeable excess of
garbage (45 per cent) and number of pests (49 per cent). Again, this may be linked to the network coverage of
solid waste management systems or problems in full geographical service coverage.
0%
10%
20%
30%
40%
50%
60%
70%
80%
90%
100%
Akkar BaalbekEl
Hermel
Beirut Bekaa MountLebanon
North South Akkar BaalbekEl
Hermel
Beirut Bekaa MountLebanon
North South
Displaced Host
Burn garbage Dump in nearby landfill Private collection
Public collection Dump in designated location (≠landfill) other
2%
46%52%
1%
38%
61%
Sufficient bins
Insufficient bins
Don't know

Defining Communitiy Vulnerability in Lebanon – September 2014 - February 2015
61
Only in Akkar Governorate did over 50 per cent of respondents report both a noticeable excess of refuse / garbage
and an increase number of pests in the last three months. In Bekaa, over 50 per cent of respondents reported a
noticeable increase in the number of pests.
Figure 48: Percentage of respondents reporting prevalence of excess garbage (left) and number of pests (right) in last 3 months
Wastewater Management
Disposal System
The majority of surveyed respondents claimed that their communities were connected to public sewage networks
(60 per cent). However, a lower proportion of displaced respondents (53 per cent as opposed to 68 per cent of
host participants) reported access to public networks. As a result, a much larger proportion of displaced
respondents respondents (47 per cent compared to 32 per cent of hosts) reported relying on private tank collection,
open air or pit latrine systems, or no consistent method at all. This suggests that a greater proportion of displaced
communities, in contrast to their host counterparts across Lebanon, may have to bear the expenses of private
wastewater collectors or live in unhygienic conditions with access to rudimentary or no wastewater disposal
systems.
The reliance on private water tank collections for wastewater was particularly higher in Baalbek El Hermel
Governorate, with 56 per cent of respondents relying on this form of disposal. In addition, disposing of wastewater
in the open was also most common in Baalbek El Hermel Governorate, 13 per cent of respondents.
0%
10%
20%
30%
40%
50%
60%
Akkar Baalbek-ElHermel
Beirut Bekaa Mount Lebanon North South
Noticeable excess of refuse / garbage Noticeable number of pests

Defining Communitiy Vulnerability in Lebanon – September 2014 - February 2015
62
Figure 49: Main type of wastewater disposal systems for host (left) and displaced (right) communities
Access to Toilet Facilities
Access to adequate toilet facilities also has a bearing on household hygiene, sanitation and health conditions. A
large proportion of host and displaced respondents had access to flush toilets in their homes (62 per cent overall);
however, there are marked differences between host and displaced responses with roughly 83 per cent and 41
per cent, respectively, having flush toilets in their homes. A larger proportion of displaced respondents had access
to traditional pit latrines (44 per cent). Interestingly, there were slight gendered differences among displaced
respondents; specifically, a higher percentage of female participants reported access to flush toilets (43 per cent
compared to 38 per cent males) but lower levels of access to traditional pit latrines (41 per cent as opposed to 49
per cent males) and improved pit latrines (3 per cent in contrast to 5 per cent males).
68%
31%
1% 0%
Public seweragenetwork
Private tank collection
Open air / Pit latrines
None
53%34%
13%
0%
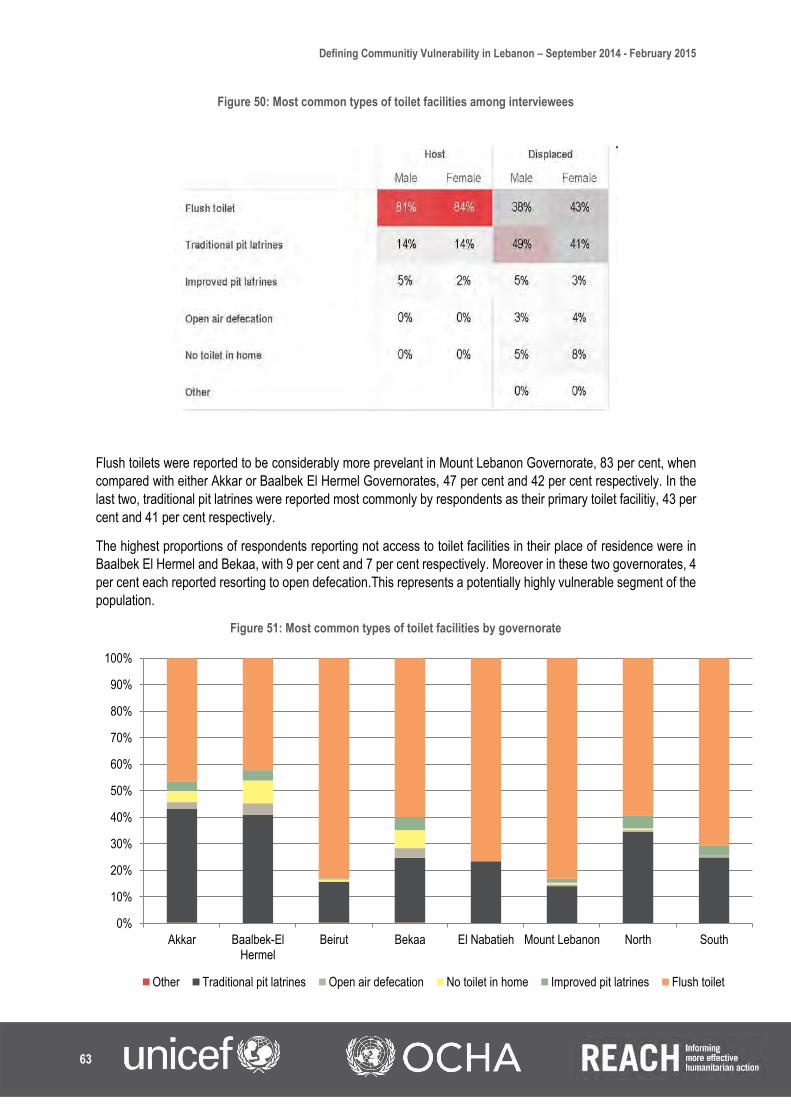
Defining Communitiy Vulnerability in Lebanon – September 2014 - February 2015
63
Figure 50: Most common types of toilet facilities among interviewees
Flush toilets were reported to be considerably more prevelant in Mount Lebanon Governorate, 83 per cent, when
compared with either Akkar or Baalbek El Hermel Governorates, 47 per cent and 42 per cent respectively. In the
last two, traditional pit latrines were reported most commonly by respondents as their primary toilet facilitiy, 43 per
cent and 41 per cent respectively.
The highest proportions of respondents reporting not access to toilet facilities in their place of residence were in
Baalbek El Hermel and Bekaa, with 9 per cent and 7 per cent respectively. Moreover in these two governorates, 4
per cent each reported resorting to open defecation.This represents a potentially highly vulnerable segment of the
population.
Figure 51: Most common types of toilet facilities by governorate
0%
10%
20%
30%
40%
50%
60%
70%
80%
90%
100%
Akkar Baalbek-ElHermel
Beirut Bekaa El Nabatieh Mount Lebanon North South
Other Traditional pit latrines Open air defecation No toilet in home Improved pit latrines Flush toilet

Defining Communitiy Vulnerability in Lebanon – September 2014 - February 2015
64
Access to Showering and Washing Facilities
Another major factor affecting the overall health and hygiene of community residents is access to showering and
washing facilities. Interviews with survey participants revealed that a higher proportion of displaced respondents
had no access to shower and washing facilities (16 per cent as opposed to 2 per cent of host respondents), further
exacerbating household hygiene and sanitation problems (see Figure 55 below).
The lowest reported access to showering and washing facilities for both displaced and host households on an
average can be observed in Baalbek El Heermel and Bekaa, with 83 and 85 per cent of respondents reporting
access respectively.
Figure 52: Access to showering / washing facilities per governorate
Wastewater Problems / Flooding
Survey data revealed that community-wide wastewater problems manifested themselves more amongst displaced
than host community residents. When asked about the incidence of flooding and visible manifestation of
wastewater problems in their immediate surroundings, 38 per cent and 45 per cent of displaced confirmed the
prevalence of such issues (as opposed to 29 per cent and 33 per cent of host, respectively). This may be due to
differential levels of access to wastewater management systems within communities, with host communities
residing in areas with greater connectivity to public networks and improved infrastructural maintenance.
0%
10%
20%
30%
40%
50%
60%
70%
80%
90%
100%
Akkar Baalbek-ElHermel
Beirut Bekaa El Nabatieh MountLebanon
North South
Don't know No Yes

Defining Communitiy Vulnerability in Lebanon – September 2014 - February 2015
65
Figure 53: Prevalence of flooding (left) and manifestation of wastewater problems (right) in last 12 months
Health
Access to Health Services
As with access to water, both host and displaced respondents reported on the whole that they face the same
challenges with regards to accessing adequate healthcare services. The top reported challenges identified were
unequivocally costs related to health services and medications as well as distance or availability of appropriate
medical facilities. Host and displaced respondents cited cost of medicines as a top challenge in guaranteeing
adequate access to health care (41 and 38 per cent respectively). In addition 37 per cent and 34 per cent
respectively of host and displaced participants pointed to the cost of health services as a main challenge in fully
accessing healthcare.
On the whole when analysed at the governorate level, challenges in accessing helath services are largely similar;
with cost of health services and cost of medicines / medications making the most prevelant reported challenge in
each governorate. Safety or security concerns during travel to health services were however much more frequently
reported in North and Akkar Governorates, 8 per cent and 7 per cent respectively. It must be kept in mind that
although many of the problems with healthcare provision may have preceded the Syrian crisis, the considerable
population increase has undoubtedly exacerbated demand on limited and unaffordable healthcare delivery.
0%
10%
20%
30%
40%
50%
Incidence of flooding Visible manifestation of wastewater problems
Host Displaced

Defining Communitiy Vulnerability in Lebanon – September 2014 - February 2015
66
Figure 54: Heat map of top reported challenges in accessing health services
The vast majority of survey participants (59 per cent) reported access to public health centres. A significantly
smaller proportion of survey respondents reported community access to public and private hospitals, private clinics
and even access to public and private mobile health clinics with availability of such facilities lower among displaced
participants. Some 18 per cent of respondents cited no access to health facilities.
Figure 55: Types of health facilities accessible to study participants in respective communities
0% 10% 20% 30% 40% 50% 60% 70%
None
Other
Private mobile health vans
Public mobile health vans
Private clinics
Private hospitals
Public hospital
Public health centre
Host Displaced

Defining Communitiy Vulnerability in Lebanon – September 2014 - February 2015
67
Approximately 12 per cent of host and 9 per cent of displaced respondents reported the lack of affordable
transportation and distance to health facilities as a major challenge in accessing healthcare. Survey data revealed
that available health facilities were on average 2.8 kilometres from their homes with public hospitals situated further
(approximately 4.1 kilometres away from respondents’ homes). Though these distances may be considered within
walking distance, respondents’ referrals to the lack of affordable transportation and distance as a major challenge
in accessing healthcare may be indicative of difficult terrains or roads or even weather conditions rendering travel
by foot difficult. In addition, although an average distance of 2.8 kilometres is a relatively short distance, a lack of
transport can pose particular challenges for people in need of medical assistance, small children and their carers,
elderly people and those with disabilities, and may prove problematic in the case of a serious emergency or when
suitable and affordable transportation is unavailable.
Figure 56: Average distance to health facilities from home
Child Healthcare
The most commonly reported illness affecting children in the respective communities of survey participants was
Diarrhea, with 33 per cent of respondents citing this as a prevelant issue in their community. While a significant
proportion of both host and displaced reported this issue as being prevelant, it was much more commonly reported
amongst displaced respondents, 39 per cent compared to 26 per cent of host. The high prevelance of diarrhea
amongst children within displaced communities can be attributed to a number of factors. For example, 62 per cent
of the displaced respondents identifying diarrhea amongst children as an issue also reported that members of their
respective communities’ were unable to access sufficient quantities of hygiene items (such as soap). In addition,
just under half of this proportion of displaced respondents, 49 per cent, also reported that community members
were unable to access sufficient quantities of clean drinking water to meet household needs.
0 0.5 1 1.5 2 2.5 3 3.5 4 4.5
Private mobile health vans
Public mobile health vans
Private clinics
Private hospitals
Public hospital
Public health centre

Defining Communitiy Vulnerability in Lebanon – September 2014 - February 2015
68
Figure 57: Common illnessess affecting children in the community
Regarding child healthcare specifically, it was most commonly reported by mothers / caregivers that they take their
children to public health centres when they fall ill. A significant difference can be seen between the proportion of
displaced and host populations which rely on public health centres when their children are ill, 30 percent and 16
per cent respectively. Host community mothers / caregivers reported more frequently that they take their children
to hospitals (either public or private) when they are ill, 12 per cent, compared to only 5 per cent of displaced mothers
/ caregivers. On the other hand, a relatively high proportion of both displaced and host mothers / caregivers
reported that they don’t take their children to any medical facility when they are ill, 11 per cent and 6 per cent
respectively. This can be linked to household expenditure, as twice the number of displaced respondents compared
to host reported being unable to afford medication and vaccinations for their household, as mentioned earlier.
Figure 58: Health facilities accessed for child healthcare
Differences can be noted between displaced and host mothers / caregivers with regards to which health facilities
they take their children to for the specific purpose of vaccinations. Both host and displaced respondents most
commonly reported that they access public health centres for the purposes of child vaccinations, 15 per cent and
21 per cent respectively. However, displaced respondents reported much more frequently that they relied on
0% 5% 10% 15% 20% 25% 30% 35% 40% 45%
None
Other/Specify
Acute jaundice
Other skin ailments (measles)
Dysentery
Chicken pox
Scabies
Other stomach ailments
Skin rashes
Acute respiratory diseases
Diarrhea
Host Displaced
0% 5% 10% 15% 20% 25% 30% 35%
Other/Specify
Nowhere
Private mobile health vans
Public mobile health vans
Private clinics
Private hospitals
Public hospital
Public health centre
Host Displaced

Defining Communitiy Vulnerability in Lebanon – September 2014 - February 2015
69
campaigns to vaccinate their children, 16 per cent compared to 4 per cent of host respondents. This difference is
likely as a result of the lower knowledge of available and affordable health services amongst displaced populations
when compared to long established host communities.
Figure 59: Health facilities accessed for child vaccinations
Polio Campaigns
Overall 59 per cent of mothers / caregivers reported that they were aware of polio campaigns which had occurred
in the three months prior to the assessment. Slight differences were observed between population groups, with a
slightly higher proportion of displaced compared to host repondents reporting awareness of polio campagins in
their communities, 63 per cent and 54 per cent respectively. This difference can be explained as a result of the
majority of polio campaigns within the three months prior to assessment targeting displaced Syrians rather than
host community members. Of mothers / caregivers who reported being aware of polio campaigns, 78 per cent
took their children to get vaccinated. A relatively significant difference can be noted between displaced and host
respondents, whereby 84 per cent of displaced respondents reported taking their children to get vaccinated through
a campaign compared with 67 per cent of host respondents.
The reasons for not taking children to polio campaigns do not seem to be due to an absence of knowledge, as only
30 per cent of host and 31 per cent of displaced respondents reported having no knowledge of such campaigns.
Rather, it was most common for both population groups to report that their children were already vaccinated, 75
per cent of host and 41 per cent of displaced respondents.
0% 5% 10% 15% 20% 25%
Other/Specify
Nowhere
Vaccination campaigns
Private mobile health vans
Public mobile health vans
Private clinics
Private hospitals
Public hospital
Public health centre
Host Displaced

Defining Communitiy Vulnerability in Lebanon – September 2014 - February 2015
70
Figure 60: Awareness of polio campaigns
Awareness of polio compaigns was the lowest amongst respondents from Akkar and North Governorates, where
36 per cent and 47 per cent respectively reported being aware of them. The greatest disparity in awareness of
polio campaigns between host and displaced populations was observed in Beirut, Baalbek-El Hemel and Bekaa,
as shown below.
Figure 61: Awareness of polio campaigns by governorate
Education
The most common top perceived challenges reported in accessing education by host and displaced community
members alike were the cost of school fees (as reported by 40 per cent of host and 35 per cent of displaced) and
school supplies, textbooks and/or uniforms (as reported by 38 per cent of host and 32 per cent of displaced).
It should be noted that the majority of data collection was conducted prior to the nationwide rollout of the education
sector’s second shift programme. Through this programme, displaced Syrians who wish to enroll their children in
public formal education do not face any fees. However, even prior to this programme, displaced Syrans were
provided some assistance with fees. As such, had the assessment been conducted after the natiowide rollout of
second shift programming we would expect the 35 per cent of displaced reporting school fees as a barrier to
decrease. Distance and/or lack of affordable transportation services to schools also featured high as a barrier to
education according to female host respondents (12 per cent) and to a lesser extent, male host participants (11
per cent). Distance was also the third most frequent response from displaced survey participants (11 per cent for
0%
10%
20%
30%
40%
50%
60%
70%
Aware of campaign Unaware of campaign Do not know
Displaced Host
0% 10% 20% 30% 40% 50% 60% 70% 80% 90%
Akkar
North
Beirut
Baalbek-El Hermel
El Nabatieh
Mount Lebanon
Bekaa
South
Displaced
Host
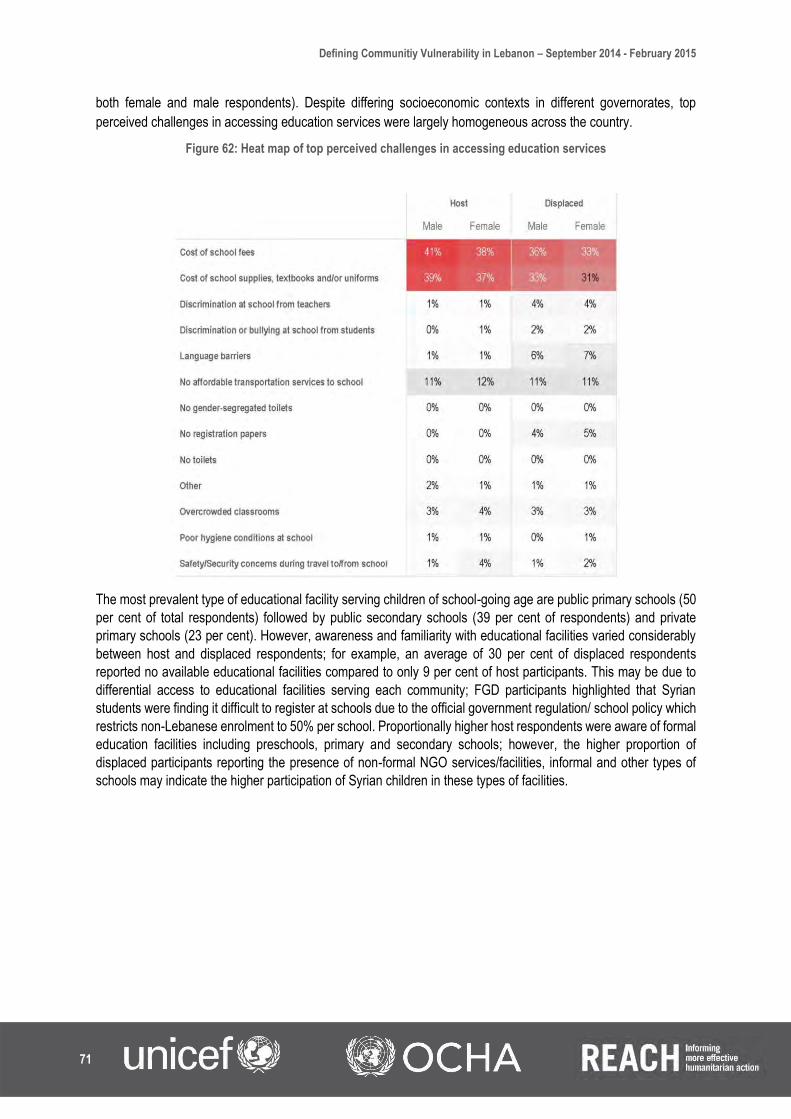
Defining Communitiy Vulnerability in Lebanon – September 2014 - February 2015
71
both female and male respondents). Despite differing socioeconomic contexts in different governorates, top
perceived challenges in accessing education services were largely homogeneous across the country.
Figure 62: Heat map of top perceived challenges in accessing education services
The most prevalent type of educational facility serving children of school-going age are public primary schools (50
per cent of total respondents) followed by public secondary schools (39 per cent of respondents) and private
primary schools (23 per cent). However, awareness and familiarity with educational facilities varied considerably
between host and displaced respondents; for example, an average of 30 per cent of displaced respondents
reported no available educational facilities compared to only 9 per cent of host participants. This may be due to
differential access to educational facilities serving each community; FGD participants highlighted that Syrian
students were finding it difficult to register at schools due to the official government regulation/ school policy which
restricts non-Lebanese enrolment to 50% per school. Proportionally higher host respondents were aware of formal
education facilities including preschools, primary and secondary schools; however, the higher proportion of
displaced participants reporting the presence of non-formal NGO services/facilities, informal and other types of
schools may indicate the higher participation of Syrian children in these types of facilities.

Defining Communitiy Vulnerability in Lebanon – September 2014 - February 2015
72
Figure 63: Most prevalent type of education facility (%) serving host and displaced in assessed communities
In formal education institutions, the predominant curriculm offered according to parents and caregivers is the
Lebanese national curriculum, as shown in Figure 64: Reported curriculum per school type.
33This is in line with the Lebanese Ministry of Education and Higher Education policy to enroll displaced students,
along with their host community counterparts, in the standard Lebanese curriculum rather than offering the Syrian
curriculm as an alternative to displaced students. Respondents did however identify educational programmes
through which a non-Lebanese curriculum (most commonly Syrian) was delivered to students. For example, 53
per cent of respondents reported the presence of non-Lebanese curriculum in non-formal classes provided by
NGOs.
33 This figure is based on responses given by parents or caregivers, when asked about the type of curriculum in place in the school their child(ren)
attended. Responses were grouped by school type.
0% 10% 20% 30% 40% 50% 60% 70%
Other/Specify
None
UNRWA schools
Non-formal classes provided by NGOs
Informal classes provided by community member
Informal religious school (not govt endorsed)
Private secondary school (General/Tech education)
Public secondary school (General/Tech education)
Private primary school (Cycles 1-3)
Public primary school (Cycles 1-3)
Private pre-school (ages 3-5)
Public pre-school (ages 3-5)
Host Displaced

Defining Communitiy Vulnerability in Lebanon – September 2014 - February 2015
73
Figure 64: Reported curriculum per school type
At the time of the assessment, a relatively low prevelance of schools offering second shift programmes was
reported, both in formal and non-formal education. On average, only 10 per cent of respondents identified formal
educational institutions which were offering second shifts for students. Second shifts reportedly on offer were more
prevelant in informal or UNRWA managed schools. The lack of knowledge of second shift educational
programmes, combined with the prevelance of Lebanese curricula across formal education, contributes towards
explaining the 30 percent of displaced respondents which reported no knowledge of educational opportunities on
offer for children in their community.
Figure 65: Presence of second shift per school type
The average distance from survey participants’ homes to educational facility varied little. On average, only public
pre-schools and UNRWA facilities were reported as under 2 kilometres from assessed individuals’ homes, at 1.85
kilometres and 1.86 kilometres respectively. On average, survey participants reported non-formal classes provided
by NGOS and informal classes led by community members to be the farthest situated from their homes, at an
average of 2.71 and 3.46 kilometres respectively. As numerous survey participants listed lack of affordable
transportation and distance to educational facilities as a barrier against fully accessing educational opportunities,
this challenge may not be owing to reported distance itself but rather the terrain (e.g. hilly or mountainous locales)
and weather conditions as well as security concerns that impede easy travel by foot to schools.
0% 10% 20% 30% 40% 50% 60% 70% 80% 90% 100%
UNRWA schools
Non-formal classes provided by NGOs
Informal classes provided by community member
Informal religious school (not govt endorsed)
Private secondary school (General/Tech education)
Public secondary school (General/Tech education)
Private primary school (Cycles 1-3)
Public primary school (Cycles 1-3)
Private pre-school (ages 3-5)
Public pre-school (ages 3-5)
Lebanese Non-Lebanese (e.g. Syrian) Other/Specify Don't know
0% 10% 20% 30% 40% 50% 60% 70% 80% 90% 100%
UNRWA schools
Non-formal classes provided by NGOs
Informal classes provided by community member
Informal religious school (not govt endorsed)
Private secondary school (General/Tech education)
Public secondary school (General/Tech education)
Private primary school (Cycles 1-3)
Public primary school (Cycles 1-3)
Private pre-school (ages 3-5)
Public pre-school (ages 3-5)
Don’t know One shift Two shifts

Defining Communitiy Vulnerability in Lebanon – September 2014 - February 2015
74
Figure 66: Average distance to available school facilities from home
Also towards gauging potential challenges impeding full access to education, adolescent participants were asked
about the prevalence of bullying at the educational facilities they attended. Surprisingly, a larger proportion of host
adolescents than displaced adolescents reported having been bullied in public and private secondary schools and
during past attendance to public and private preschools. However, in public and private primary schools, non-
formal NGO services and UNRWA, higher proportions of displaced adolescents reported cases of bullying.
Approximately 40 per cent of host adolescents attending other informal education or classes led by community
members reported incidents of bullying in contrast to 17 per cent of displaced adolescents attending the same
school type. This data suggests that targeted campaigns to address bullying should focus on both host and
displaced population groups; bullying may be more commonplace than assumed even outside of the context of the
Syrian crisis.
Figure 67: Percentage of adolescent respondents reporting bullying by educational facility
0.00 0.50 1.00 1.50 2.00 2.50 3.00 3.50 4.00
Public pre-school (ages 3-5)
Private pre-school (ages 3-5)
Public primary school (Cycles 1-3)
Private primary school (Cycles 1-3)
Public secondary school (General/Tech education)
Private secondary school (General/Tech education)
Informal religious school (not govt endorsed)
Informal classes provided by community member
Non-formal classes provided by NGOs
UNRWA schools
Average distance to available school facilities (in km)
0% 5% 10% 15% 20% 25% 30% 35% 40% 45%
UNRWA
Non-formal NGO
Informal other
Informal religious
Private secondary
Public secondary
Private primary
Public primary
Private preschool
Public preschool
Host Displaced

Defining Communitiy Vulnerability in Lebanon – September 2014 - February 2015
75
Overall the physical state of schools was reported by respondents as being adequate for purpose, however
significant differences can be identified between different types of educational institutions. In formal education,
private schools had the highest proportion of respondents reporting that facilities were in an excellent physical
state. Facilities in which informal classes are delivered by a community member were reported to have the highest
prevelance of deteriorating physical states, 25 per cent, however this can be expected as a result of the lack of
educational funding being channeled into such delivery points.
Figure 68: Reported physical state of schools
On the whole, the vast majority of formal education schools have were reported to have toilet facilities available to
students. Only for informal community and non-formal NGO providing classes did a significant proportion of
respondents report that there were no toilet facilities available to students, 28 per cent and 24 per cent respectively.
As with the reported physical state above, this points to a lack of available funding for facilities upkeep available to
these types of educational programmes.
Figure 69: Toilet facilities in schools
In schools where toilet facilities were reported to be available to students, the vast majority of respondents reported
that separate facilities were provided for boy and girls. Again, only in informal community and NGO managed
0% 10% 20% 30% 40% 50% 60% 70% 80% 90% 100%
UNRWA schools
Non-formal classes provided by NGOs
Informal classes provided by community member
Informal religious school (not govt endorsed)
Private secondary school (General/Tech education)
Public secondary school (General/Tech education)
Private primary school (Cycles 1-3)
Public primary school (Cycles 1-3)
Private pre-school (ages 3-5)
Public pre-school (ages 3-5)
Excellent Adequate Deteriorating Don't know
0% 10% 20% 30% 40% 50% 60% 70% 80% 90% 100%
UNRWA schools
Non-formal classes provided by NGOs
Informal classes provided by community member
Informal religious school (not govt endorsed)
Private secondary school (General/Tech education)
Public secondary school (General/Tech education)
Private primary school (Cycles 1-3)
Public primary school (Cycles 1-3)
Private pre-school (ages 3-5)
Public pre-school (ages 3-5)
Don’t know No Yes

Defining Communitiy Vulnerability in Lebanon – September 2014 - February 2015
76
classes was there a significant proportion of respondents reporting that separate toilet facilities were not provided
for boys and girls.
Figure 70: Availability of separate toilet facilities for boys and girls
The majority of both population groups reported that there were no non-formal educational opportunities available
to children in their community at the time of assessment, 67 per cent. Knowledge of available non-formal education
opportunies was limited amongst both displaced and host respondents, with 28 per cent and 22 per cent
respectively reporting that they did not know of any such opportunities available to their children. While this is less
concerning for host communities, as they have more open access to formal educational opportunities, this lack of
knowledge contributes to low enrolment amongst displaced populations. Interestingly, a slightly higher proportion
of host community respondents reported that there were non-formal education opportunities available for children
in their community than those from the displaced community, 10 per cent compared with 7 percent.
Figure 71: Presence of non-formal educational opportunities
0% 10% 20% 30% 40% 50% 60% 70% 80% 90% 100%
UNRWA schools
Non-formal classes provided by NGOs
Informal classes provided by community member
Informal religious school (not govt endorsed)
Private secondary school (General/Tech education)
Public secondary school (General/Tech education)
Private primary school (Cycles 1-3)
Public primary school (Cycles 1-3)
Private pre-school (ages 3-5)
Public pre-school (ages 3-5)
Don’t know No Yes
65% 68%
0%
20%
40%
60%
80%
100%
Displaced Host
Don't know No Yes

Defining Communitiy Vulnerability in Lebanon – September 2014 - February 2015
77
Vulnerability Focus: Children and Women
Prevalence of vulnerable children and women
In the second response strategy outlined by the LCRP, particular emphasis is placed on increasing outreach and
responsiveness of community institutions to support the most vulnerable groups, specifically children and women
at risk of violence, abuse and exploitation. Though the LCRP specifies the need to strengthen programmes and
community institutions aimed at providing services for survivors of abuse, exploitation and sexual violence, data
reveals a greater need to incorporate more programming geared towards the unique and special needs of
vulnerable children and women to more comprehensively mitigate community vulnerabilities. This is partly due to
the structural conditions and institutions such as conservative and traditional values which disproportionately inhibit
equal access to essential services and infrastructure for these vulnerable population groups.
The prevalence and magnitude of pre-identified vulnerable population groups such as women-headed households,
child-headed households, pregnant women and girls married before the age of 18 years can help guide
humanitarian and development actors towards specific localities where community-level vulnerabilities are
particularly high. The presence of these groups are important to consider due to specialised needs (e.g. pregnant
women), difficulty in accessing services (e.g. women-headed and child-headed households) and high risk of
exploitation (child-headed and women-headed households and girls married before the age of 18), for instance.
Figure 73 shows the proportion of survey participants reporting the prevalence of such vulnerable population
groups within their communities.
Figure 72: Percentage of survey respondents reporting prevalence of vulnerable children and women in their communities
A high proportion of female host participants (34 per cent) reported the prevalence of women-headed households
(widows). A high proportion of overall respondents (32 per cent) reported the presence of pregnant women within
their communities. 7 per cent of female displaced noted the prevalence of early marriage in their communities.
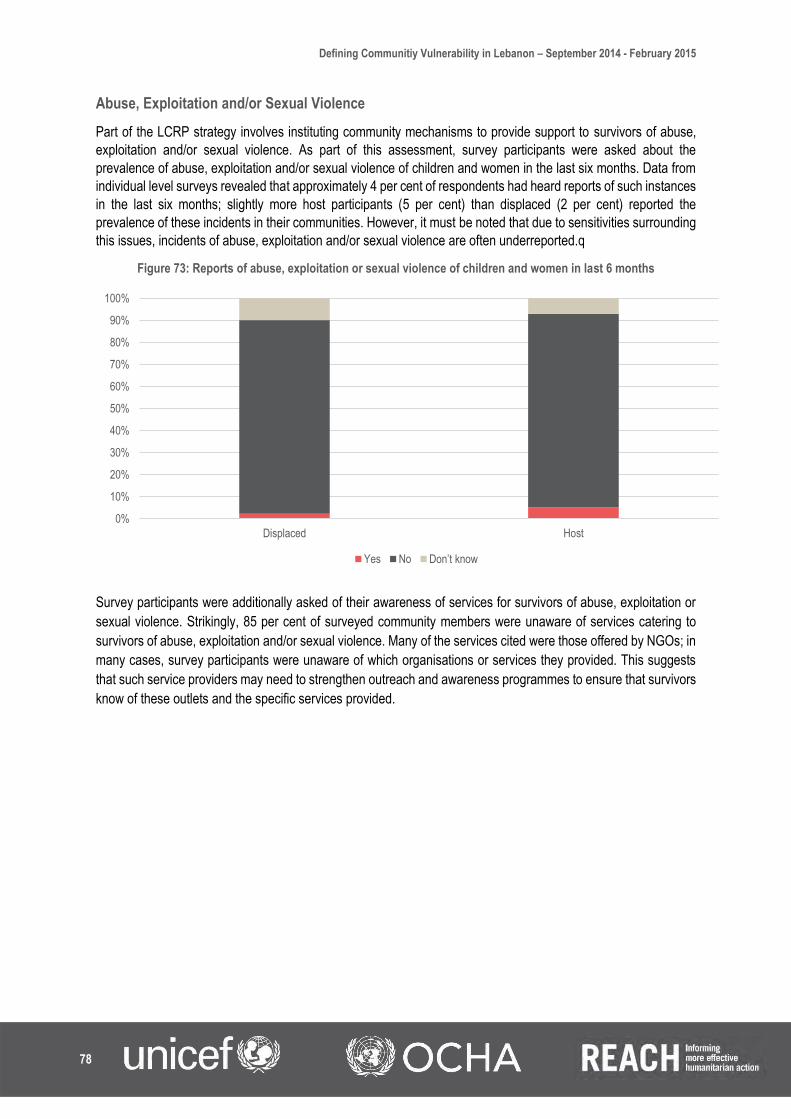
Defining Communitiy Vulnerability in Lebanon – September 2014 - February 2015
78
Abuse, Exploitation and/or Sexual Violence
Part of the LCRP strategy involves instituting community mechanisms to provide support to survivors of abuse,
exploitation and/or sexual violence. As part of this assessment, survey participants were asked about the
prevalence of abuse, exploitation and/or sexual violence of children and women in the last six months. Data from
individual level surveys revealed that approximately 4 per cent of respondents had heard reports of such instances
in the last six months; slightly more host participants (5 per cent) than displaced (2 per cent) reported the
prevalence of these incidents in their communities. However, it must be noted that due to sensitivities surrounding
this issues, incidents of abuse, exploitation and/or sexual violence are often underreported.q
Figure 73: Reports of abuse, exploitation or sexual violence of children and women in last 6 months
Survey participants were additionally asked of their awareness of services for survivors of abuse, exploitation or
sexual violence. Strikingly, 85 per cent of surveyed community members were unaware of services catering to
survivors of abuse, exploitation and/or sexual violence. Many of the services cited were those offered by NGOs; in
many cases, survey participants were unaware of which organisations or services they provided. This suggests
that such service providers may need to strengthen outreach and awareness programmes to ensure that survivors
know of these outlets and the specific services provided.
0%
10%
20%
30%
40%
50%
60%
70%
80%
90%
100%
Displaced Host
Yes No Don’t know

Defining Communitiy Vulnerability in Lebanon – September 2014 - February 2015
79
Figure 74: Awareness of services for survivors of abuse, exploitation or sexual violence
Birth Registration
Another important consideration for improving access to basic services for children and mothers/caregivers is the
registration of child births. Without registration documents, children and parents can face difficulties acquiring
necessary documentation (e.g. identification documents) and even accessing education or health services (e.g.
for registering at schools). Some of the problems related to unregistered child births can affect children and their
families well beyond childhood. Assessment results reveal that a significantly higher proportion of displaced
participants (17 per cent) were aware of unregistered births than surveyed host community members (4 per cent).
Poor familiarity with administrative processes, associated costs, limited family documentation and irregular status
of displaced community members may all play a role in limited access to registration services for children in
Lebanon.
Figure 75: Are there children under the age of 5 years in your community whose births are unregistered?
(Left: Host respondents; Right: Displaced respondents)
0%
10%
20%
30%
40%
50%
60%
70%
80%
90%
100%
Displaced Host
Yes No Don’t know
0%
20%
40%
60%
80%
100%
Displaced Host
Yes No Don’t know

Defining Communitiy Vulnerability in Lebanon – September 2014 - February 2015
80
Out of School Children
Survey participants were additionally asked about the prevalence of out of school children in an effort to understand
the extent of education access difficulties in the assessed communities. A high proportion of survey respondents
were aware of out of school boys (51 per cent) and girls (46 per cent). The proportion of displaced respondents
aware of out of school boys and girls were significantly higher, with 68 per cent and 64 per cent of displaced
respondents reporting prevalence of out of school boys and girls, respectively. When asked as to their current
occupation if not enrolled or attending school, a high proportion of respondents suggested that boys were engaged
in informal employment opportunities (42 per cent) followed by household chores or childcare responsibilities (30
per cent). A high proportion of respondents believed out of school girls were engaged in household chores or
childcare responsibilities (41 per cent) followed by informal employment (24 per cent).
Defining Communitiy Vulnerability in Lebanon – September 2014 - February 2015
81
THEME 4: SOCIAL STABILITY
In line with the third response strategy outlined in the LCRP, this section discusses relevant findings towards
informing programmes aimed at ensuring long-term and sustainable development and cooperation. In particular,
this section examines the factors affecting social stability within assessed communities. The significant influx of
refugees into the country is thought to have increased the labour force by approximately 50 per cent, exacerbating
job competition, unemployment particularly of youth and fostering divisions and unhealthy local relationships.34
This section discusses factors affecting the risk of tensions or conflict within hosting communities. Specifically, it
examines key factors such as types of interaction between hosts and displaced, reported causes of division and
perceptions of uneven humanitarian assistance. It must be noted, however, that due to sensitivity issues, social
stability questions have not been asked in all assessed areas.
Effect of the Crisis
Resource Strain
Related data pertaining to perceived changes in unemployment rates, availability of shelter and access to water
all confirm pervasive perceptions of overstretched public services and resources. Both host and displaced
respondents reported a general rise in unemployment rates, decrease in affordable housing and decline in
available water resources. Host respondents were asked about change over a 3 year-period (see Figure 80 below),
while displaced respondents were asked about change over a 6 month-period (see Figure 81 below).
As above, strains on public services and resources was cited as a driving factor of community division by host
community respondents. In addition, the lack of available employment opportunities was cited as a divisive factor
by both displaced and host respondents.
Perceptions of such changes can foster tensions within communities between host and displaced populations and
even lead to an unwillingness to host refugee populations35. According to findings of this assessment, resource
strain is relatively homogeneous across the country, with very little differences observed between governorates.
34 Government of Lebanon and United Nations, note 7 supra 35 Interagency Multi-Sector Needs Assessment: Social Cohesion , note 18 supra

Defining Communitiy Vulnerability in Lebanon – September 2014 - February 2015
82
Figure 76: Changes in unemployment rates, availability of shelter and water in the last 3 years reported by host respondents
Figure 77: Changes in unemployment rates, availability of shelter and water in the last 6 months reported by displaced respondents
0% 20% 40% 60% 80% 100%
Domestic water availability
Drinking water availability
Shelter availability
Unemployment rates
Decreased Increased Stayed the same
0% 10% 20% 30% 40% 50% 60% 70% 80% 90% 100%
Domestic water availability
Drinking water availability
Shelter availability
Unemployment rates
Decreased Increased Stayed the same

Defining Communitiy Vulnerability in Lebanon – September 2014 - February 2015
83
Safety and Security
Overall, the vast majority of both host and displaced respondents reported that they felt either safe or very safe
within their community, 65 per cent and 76 per cent respectively. Conversely only a fraction of respondents reported
that they felt very unsafe, 2 per cent and 1 per cent respectively. Female host community respondents more
commonly reported feelings of insecurity than women from displaced populations, 17 per cent compared to 4 per
cent.
When asked about which location female host community respondents felt most insecure, 57 per cent of the
respondents attributed it to the entire community rather than to one particular location. It was most commonly
reported by this population group that the presence of displaced populations within their community was the source
of their feeling of insecurity, at 79 per cent.
Figure 78: Feeling of safety in the community
Very little variation in feelings of safety within the community can be observed between governorates. The
governorates with the highest proportion of respondents reporting feeling very unsafe or unsafe in their respective
communities were Mount Lebanon and Bekaa, 12 per cent and 11 per cent respectively.
The overwhelming majority of respondents, both from host and displaced populations, reported that there had been
no specific security incidents in their community since the onset of the Syria Crisis, with 86 per cent reporting no
incidents (see Figure 83 below). This may however point to the reluctance of respondents in the communities
targeted through this assessment to discuss specific security incidents to international humanitarian organisations.
0%
10%
20%
30%
40%
50%
60%
70%
80%
90%
100%
Female Male Female Male
Host Displaced
Very safe Safe Neither safe nor unsafe Unsafe Very unsafe

Defining Communitiy Vulnerability in Lebanon – September 2014 - February 2015
84
Figure 79: Respondents reporting specific incidents in their community since the onset of Syria Crisis (both displaced and host respondents)
Where specific security incidents were reported, the most common was theft, 10 per cent overall. This was however
reported more frequently by host community respondents, 17 per cent. The instigators of theft related incidents,
where identified, were reported by the majority of respondents to have been displaced Syrians, 75 per cent,
compared to only 25 per cent Lebanese.
Host and Displaced Relations
Interaction and Community Feeling Between Population Groups
Frequency and types of interactions between host and displaced communities also have a bearing on the social
stability of communities; in fact, more frequent interactions of a non-economic nature may indicate higher levels of
social stability.36 In the assessed communities, 80 per cent overall reported interactions between host and
displaced taking place more than once a day. No significant differences can be observed between governorates,
however according to respondents the lowest levels of interaction between displaced and host are in Baalbek El
Hermel, where 4 per cent reported that they rarely / never interact. It is also interesting to note the differences in
how interaction patterns are reported between displaced and host community respondents. For instance, in
Baalbek El Hermel, 7% of displaced respondents reported a rarely/ never frequency of interaction whereas only
1% of host respondents reported the same. Meanwhile, in the same governorate, 85% of host respondents
reported an intereaction frequency of more than once a day as opposed to only 63% of displaced respondents.
36 Ibid.
0% 10% 20% 30% 40% 50% 60% 70% 80% 90% 100%
Shelling
Bombings
Other
Abductions
Protests
Targeted killing/murder
Physical intimidation
Youth unrest/violence
Vandalism
Physical violence (armed)
Verbal threats
Verbal arguments/harassment
Physical violence (unarmed)
Theft
None

Defining Communitiy Vulnerability in Lebanon – September 2014 - February 2015
85
Figure 80: Percentage of host and displaced respondents' reporting frequency of interaction by governorate
However, data relating to the most common types of interactions between host and displaced indicate that the
most common forms of contact may be economically motivated. The most frequently cited types of interaction
included exchanges at markets/shops (75 per cent), trade/commerce (57 per cent), interaction during non-
agricultural (45 per cent) and agricultural (37 per cent) employment and relations between landlords and leasers
(34 per cent) (see Figure 85 below).
Figure 81: Percentage of respondents reporting common types of interaction between host and displaced
While markets/ shops and trade/ commerce were the most commonly reported types of interactions overall, other
interactions vary considerably by governorate. Interactions during agricultural employment were much more
common in Baalbek El Hermel, Bekaa, and South Governorates, 62 per cent, 56 per cent, and 49 per cent
respectively. Host and displaced living together was repordeted to be significantly more common in Beirut and the
South, 21 per cent and 20 per cent respectively, when compared with other governorates.
Both host and displaced respondents reported on the whole positive or very positive views of the Lebanese
population in their respective communities, 91 per cent and 74 per cent respectively.
0%
10%
20%
30%
40%
50%
60%
70%
80%
90%
100%
Akkar BaalbekEl
Hermel
Beirut Bekaa MountLebanon
North South Akkar BaalbekEl
Hermel
Beirut Bekaa MountLebanon
North South
Displaced Host
Don’t know Rarely / never Monthly Multiple times per week Daily More than once per day
0% 10% 20% 30% 40% 50% 60% 70% 80%
Other/Specify
Conflict
At religious institution
Social events
At school
Living together
At health care facilities
Landlord/leaser
Employment (agri.)
Employment (non-agri.)
Trade/Commerce
At market/shop

Defining Communitiy Vulnerability in Lebanon – September 2014 - February 2015
86
However, it was most common for host respondents to report either neutral (38 per cent) or negative or very
negative views of displaced Syrians (40 per cent). This generally negative view of displaced Syrians can be
explained by the prevalent causes of community division resulting from increased demographic pressure as
described above; most notably pressure placed on services and lack of employment opportunities. Both host and
displaced populations on the whole held no views of either Palestinian refugees from Lebanon (PRL) or Palestinian
refugees from Syria (PRS) populations. This can be attributed to the lack of day to day interaction the majority of
assessed communities have with PRL and PRS.
Figure 82: Feelings of respondents towards specific population groups
Perceived Causes of Community Divisions
Overall, a high proportion of surveyed community residents (45 per cent) reported no divisions between host and
displaced populations within their communities. Interestingly, displaced respondents were more likely to report the
absence of divisions within their community (51 per cent in contrast to 40 per cent of hosts). The top cited cause
for divisions is related to unemployment with 44 per cent of assessed hosts and 31 per cent of displaced citing job
shortages as a divisive factor. This corroborates reported top needs where employment was the most frequently
reported top need for host respondents and the second most frequently reported for displaced respondents. Other
frequently cited factors included strained resources (21 per cent overall) and public services (16 per cent overall)
with a greater proportion of host respondents (26 per cent and 20 per cent, respectively) pointing to the significance
of these factors as main causes of division within hosting communities. Youth violence and youth unemployment
were reported by particularly high proportions of female respondents, and account for the third most commonly
reported issue by both host community females (29%) and displaced females (19%). This concern is closely related
to job shortages, another commonly reported concern by both sexes, but particularly women (by 50% host
community and 34% displaced females).
0%
10%
20%
30%
40%
50%
60%
70%
80%
90%
100%
Lebanese Syrians PRL PRS Lebanese Syrians PRL PRS
Displaced Host
Very positive Positive Neutral Negative Very negative Don’t know
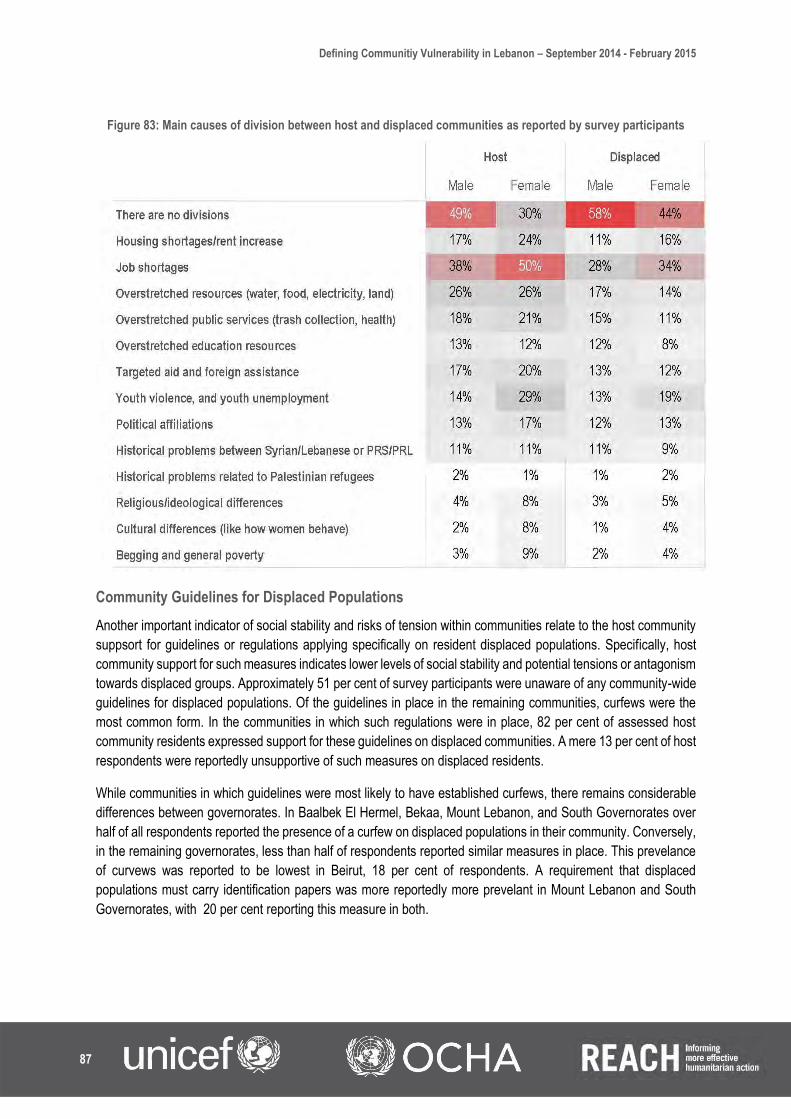
Defining Communitiy Vulnerability in Lebanon – September 2014 - February 2015
87
Figure 83: Main causes of division between host and displaced communities as reported by survey participants
Community Guidelines for Displaced Populations
Another important indicator of social stability and risks of tension within communities relate to the host community
suppsort for guidelines or regulations applying specifically on resident displaced populations. Specifically, host
community support for such measures indicates lower levels of social stability and potential tensions or antagonism
towards displaced groups. Approximately 51 per cent of survey participants were unaware of any community-wide
guidelines for displaced populations. Of the guidelines in place in the remaining communities, curfews were the
most common form. In the communities in which such regulations were in place, 82 per cent of assessed host
community residents expressed support for these guidelines on displaced communities. A mere 13 per cent of host
respondents were reportedly unsupportive of such measures on displaced residents.
While communities in which guidelines were most likely to have established curfews, there remains considerable
differences between governorates. In Baalbek El Hermel, Bekaa, Mount Lebanon, and South Governorates over
half of all respondents reported the presence of a curfew on displaced populations in their community. Conversely,
in the remaining governorates, less than half of respondents reported similar measures in place. This prevelance
of curvews was reported to be lowest in Beirut, 18 per cent of respondents. A requirement that displaced
populations must carry identification papers was more reportedly more prevelant in Mount Lebanon and South
Governorates, with 20 per cent reporting this measure in both.

Defining Communitiy Vulnerability in Lebanon – September 2014 - February 2015
88
Figure 84: Percentage of respondents reporting prevalence of community guidelines for displaced
Perceptions of Institutions and Unfair Assistance
Views on key social, religious and governmental institutions was predominately reported as being neutral to
positive for both host and displaced respondents. The institution with the highest level of support amongst host
community respondents was the Lebanese Armed Forces (LAF), with 57 per cent reporting a very positive feeling
towards the institution. Both displaced and host respondents reported largely neutral feelings towards either
political parties, 64 per cent and 55 per cent respectively, and religious groups, 62 percent and 53 percent
respectively. The extremely low levels of negative views reported towards government authorities as demonstrated
in Figure 87 below can be attributed to the possibility that respondents, especially from the displaced community,
might not have been entirely comfortable to share negative views towards the government, LAF, police, etc.
Regarding the humanitarian community, the majority of displaced populations reported positive feelings, with 74
per cent positive or very positive. In a similar fashion, over half (53 per cent) of host community respondents
reported either positive or very positive feelings towards the humanitarian community, despite the widespread
assumption amongst humanitarian actors that the perception of the unfair allocation aid is a driver of community
tension.
Figure 85: Feelings of respondents towards institutions
0% 5% 10% 15% 20% 25% 30% 35% 40% 45% 50%
No
Other/Specify
Restrictions on hosting refugees
Employment restrictions
Residency restrictions
Identification papers
Curfews
0%
10%
20%
30%
40%
50%
60%
70%
80%
90%
100%
Nat. Gov Local.Gov
LAF Police Politicalparties
Religiousgroups
UN /NGOs
Nat. Gov Local.Gov
LAF Police Politicalparties
Religiousgroups
UN /NGOs
Displaced Host
Very positive Positive Neutral Negative Very negative Don’t know
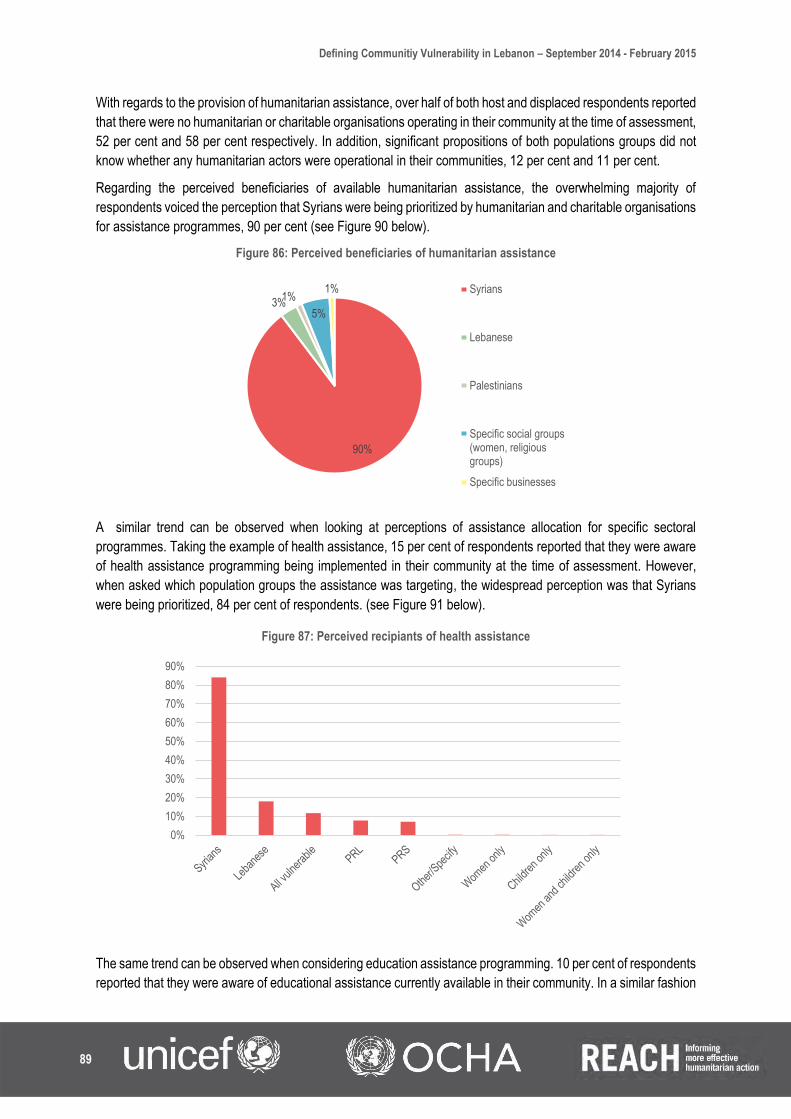
Defining Communitiy Vulnerability in Lebanon – September 2014 - February 2015
89
With regards to the provision of humanitarian assistance, over half of both host and displaced respondents reported
that there were no humanitarian or charitable organisations operating in their community at the time of assessment,
52 per cent and 58 per cent respectively. In addition, significant propositions of both populations groups did not
know whether any humanitarian actors were operational in their communities, 12 per cent and 11 per cent.
Regarding the perceived beneficiaries of available humanitarian assistance, the overwhelming majority of
respondents voiced the perception that Syrians were being prioritized by humanitarian and charitable organisations
for assistance programmes, 90 per cent (see Figure 90 below).
Figure 86: Perceived beneficiaries of humanitarian assistance
A similar trend can be observed when looking at perceptions of assistance allocation for specific sectoral
programmes. Taking the example of health assistance, 15 per cent of respondents reported that they were aware
of health assistance programming being implemented in their community at the time of assessment. However,
when asked which population groups the assistance was targeting, the widespread perception was that Syrians
were being prioritized, 84 per cent of respondents. (see Figure 91 below).
Figure 87: Perceived recipiants of health assistance
The same trend can be observed when considering education assistance programming. 10 per cent of respondents
reported that they were aware of educational assistance currently available in their community. In a similar fashion
90%
3%1%
5%
1% Syrians
Lebanese
Palestinians
Specific social groups(women, religiousgroups)
Specific businesses
0%
10%
20%
30%
40%
50%
60%
70%
80%
90%

Defining Communitiy Vulnerability in Lebanon – September 2014 - February 2015
90
to health assistance, the almost universal perception is that Syrian children are prioritied by the aid community for
education assistance, 83 per cent. (see Figure 92 below).
Figure 88: Perceived recipiants of education assistance
These trends are especially concerning for community social stability when taking into consideration that both
health and education assistance were cited as top needs by a relatively significant propotion of host community
respondents, 16 per cent and 7 per cent respectively.
.
0%
20%
40%
60%
80%
100%
Syrianstudents
Lebanesestudents
All poor PRLstudents
PRSstudents
Don’t know Other

Defining Communitiy Vulnerability in Lebanon – September 2014 - February 2015
91
CONCLUSION
This assessment report was intended to facilitate humanitarian and development planning and vulnerability
targeting within the framework of the Lebanon Crisis Response Plan (LCRP). Data collected from Phase 2b
revealed notable trends in regards to community needs and vulnerabilities across population groups (displaced,
host, male and female) and regions. This study found that access to income-generating activities was prioritised
by host and displaced communities alike across all operational areas. This may be due to the substantial population
increase in numerous hosting communities and the increased competition for low- and semi-skilled positions.
This report further highlighted the differential needs of and challenges faced by host and refugee populations.
Higher proportions of host community respondents cited challenges in accessing health facilities and employment
opportunities while high proportions of displaced communities pointed to the need for winterisation suggesting
inadequate shelter conditions and an inability to secure essential NFIs to cope with colder climates. The differential
trends in needs and priorities highlight that many displaced respondents are still unable to secure their immediate,
survival needs (Theme 2 aligning with the first LCRP response strategy) while host community respondents are
facing increasing difficulties in accessing more intermediate-term needs (Theme 3 aligning with the second LCRP
response strategy).
Gendered trends further highlighted the distinctions in experiences of vulnerability even within specific population
groups. Male and female respondents within each population group often cited different challenges in accessing
the same services and even varying priority needs in the community. These nuances between displaced and hosts,
and female and male respondents provide a more nuanced and comprehensive understanding of vulnerabilities at
the community level. The data presented in this report should act as a guideline or stepping stone towards
improving vulnerability targeting strategies and programmes.

Defining Communitiy Vulnerability in Lebanon – September 2014 - February 2015
92
RECOMMENDATIONS
Building on the three types of vulnerabilities and short-, intermediate- and long-term needs identified in the LCRP,
the results of this assessment demonstrate an additional need to incorporate dimensions of demographic pressure
as well as vulnerable groups into the response strategies. Indicators measuring demographic pressure can help
gauge the magnitude or scope of the impact of the Syrian crisis on each vulnerable community. The incorporation
of more gender-related factors into each of the three response strategies would enable more equitable outcomes
with regards to mitigating community vulnerabilities.
1. Sector vulnerability criteria should feed into vulnerability mapping exercises. In order to better coordinate and inform the prioritization of humanitarian and development programming, it is recommended that the findings from this study and specific indicators relating to vulnerabilities under each of the themes be incorporated into the on-going vulnerability mapping exercise led by UNICEF. The Inter-Agency vulnerable cadastres maps are periodically updated to identify the most vulnerable cadastral areas based on the proportion of registered refugees settled in each locality along with pre-crisis host community poverty figures. The data collected for this assessment as well as other data sources can be used to build additional layers and components to the existing vulnerability ranking tool. Such assessments could be timed to inform periodic updates of the vulnerable cadastres mapping. In this way, this geographical prioritization tool will improve accuracy in identifying vulnerable communities. Of even more importance would be to build such an interactive tool that allows humanitarian and development actors see vulnerability scoring of communities by sector or region.
2. The comprehensive severity index should be able to take into account regional and territorial dynamics.Towards the classification or ranking of communities for the purposes of vulnerability targeting, the LCRP discusses the need to develop a comprehensive severity index. Findings from this study highlight the need to include monetary values for costs and income, especially as commonly cited challenges in accessing education, healthcare and water all related to financial resources. However, these indicators need to be developed in a manner that takes into account the different costs of living in each region and type of settlement (e.g. semi-urban versus urban) in Lebanon. Furthermore, building on some of the conditions and challenges outlined in this report, sector experts need to outline a logical and value-laden ranking for types of facilities, sources of income, and other factors that community members are able to access.
3. Vulnerability varies over time and needs to be updated on a regular and predictable basis. Lastly, this severity index or vulnerability targeting tool will further need to be updated at least twice a year, several months preceding the summer and winter months. This is because severe weather patterns affect vulnerability status (e.g. a recent influx of refugees arriving in a community that is accustomed to severe water shortages in summer months). In addition, socio-political and security-related developments on the ground often result in temporary or permanent displacements of local Lebanese and refugee populations. As such, essential needs and vulnerability of community populations are regularly changing and in flux.

Sample Information: Number of Interview: 64 | Number of Male interviewed: 26 | Number of female interviewed: 41| Age Range: 12-80
Reported Top Needs
Host Displaced
May 2015
Shelter
Kind of occupancy arrangement
Average monthly household rent
$321 $213
Main types of accommodation reported
Do not know
YesNo
have heard reports of evictions
Reported evictions
Collective centre/shelter
Garage/Shop/Worksite
One room structure
Factory/Warehouse
Homeless/No shelter
Unfinished building
Tent/Handmade shelter in settlement
Independent house/apartment
Owned apartment/house
Provided by employer
Assistance/Charity
Unfurnished rental/Land
Hosted
Furnished rental
Squatting
Host Displaced
Social Stability
Lack of Social interaction
Lack of confidence ininstitutions
Negative views ofinternational actors
Social fragmentation
Restrictions ondisplaced communities
Lack of conflict mitigationmechanisms
Very low
Very high
Reported issues causing community divisions
Youth violence and unemployment Overstretched resources
Job shortages
Overstretched resources Youth violence and unemployment
Potential sources of tensions related to:
Demographic Pressure
of hosts reportedsignificant population increase in the last 3 years
of displaced reportedsignificant population increase in the last 6 months
Top 3 reasons for moving in
Safety concerns at last location More employment opportunities
Knew friends/family Safety concerns at last location
More employment opportunities Knew friends/family
Last 3 years Last 6 months
95% 90%
Host Displaced
Country Profile Lebanon
Income & Poverty
Most common mode of employmentRegular Irregular/temporary
as reported by respondents$973 $323
Main sources of income
Unskilled non-agricultural labour Unskilled agricultural labour
Informal commerce Unskilled non-agricultural labour
Formal commerce Food vouchers
Reported changes in unemployment in last 3 years/6 months
Most Commonly Reported HH expenditures on basic food staples51 - 60% 71 - 80%
Most Commonly Reported HH expenditures on essential non-food items11 - 20% 0 - 10%
Top coping mechanisms to cover cost of basic needs
Borrow money/food Credit
Cheaper food Cheaper food
Credit Reduce number of meals
Average monthly HH income
Increased Increased
Average hours of electricity reported per day
Main source of electricityPublic connection
$85 $45
Public connection
Average monthly HH expenditure reported
12h 12h
Water
Average monthly expenditure on drinking water per HH
$31 $30
Top sources for drinking and domestic water
Average monthly expenditure on domestic water per HH
$35 $32
Bottled water
Water Trucking
Natural Spring
Well
Tap water
Other natural sources
Drinking Domestic
100%
50%
0%
Drinking Domestic
Electricity
REACH Informingmore effectivehumanitarian action
Job shortages
1+1+1+t2+6+5+7+61+17+2+t 5+9+17+13+35+17+4+t45+33+14+4+2+1+1+t
3+69+28+t
15+50+13+12+5+1+4+t
5+74+21+t
39+21+13+1+22+4 1+27+10+1+41+20 31+20+11+2+26+10 2+24+6+1+44+23
km75 1500
Assessed Villages
Host CommunitiesMale Female
DisplacedMale Female
EmploymentHealthWinterisationEducationElectricityShelterFoodDrinking WaterRoadsWaste Water MgmtNFIsDomestic WaterSolid Waste MgmtSecurityTransportRegistrationHygiene ItemsOther 1%
0%0%1%2%2%5%2%5%7%8%2%2%12%8%7%17%19%
1%0%0%1%2%3%5%2%6%9%8%2%2%14%6%5%14%19%
1%1%1%0%1%1%2%4%1%0%6%10%12%3%12%18%14%15%
1%1%2%0%1%1%2%5%2%1%8%10%13%4%10%16%9%15%
Sheet 1
0% 25%% of Total Percent Res..
% of Total Percent Response broken down by Host Dis and Gender vs. Type. Color shows % ofTotal Percent Response. The marks are labeled by % of Total Percent Response.
45+77+50+77+45+45 cx+1+1+1+1+1+1
Population groups covered: Lebanese, Syrian, PRL, PRS | Average HH size: 6 | Cadastre Population: Lebanese: 2078960| Lebanese living under US$4: 605188 | Syrian Refugees: 786129Sample Information: Number of Interviews: 13120 | Number of Male interviewed: 4967 | Number of female interviewed: 8154 | Age Range: 12-92 | Data collected between October 2014 - February 2015
ANNEX I: LEBANON PROFILE

Host DisplacedHost Displaced
Children and Women
respondents reported cases of unregistered births4% 17%
of respondents heard of cases of abuse, exploitation or sexual violence in last 6 months
of respondents know of services available for women and children atrisk or survivors of violence, abuse or exploitation
1%1%
Vulnerable population groups living within community
Separated women
Widowed women
Unaccompanied children minors
Pregnant women
Girls married before 18
Reasons why women may not be participating in the labor force
Safety concerns Safety concerns
Too many HH responsibilities Too many HH responsibilities
Traditional values/customs Traditional values/customs
Main activities for out of school boys under 18
Begging Begging
Informal employment Informal employment
HH chores/Child care HH chores/Child care
Main activities for out of school girls under 18
Begging Begging
HH chores/Child care HH chores/Child care
Informal employment Informal employment
Population groups engaged in income generation
Male adolescents (12-17 years) Women (18+ years)
Men (18+ years) Men (18+ years)
Women (18+ years) Male adolescents (12-17)
Education
reported there are no non-formal education opportunities
of caregivers reported children enrolled 2013-1428%70%
of caregivers reported children enrolled 2014-1522%72%
adolescents were enrolled 2013-149%62%
adolescents are enrolled 2014-157%67%
Top reported challenges in accessing education
No affordable transport/Distance No affordable transport/Distance
Cost of school fees Cost of school fees
Cost of school supplies Cost of school supplies
In the last 3 months
of respondents reported noticeable excess refuse/garbage
of respondents reported noticeable presence of flies, rodents, and insects
Municipal collection
Main type of solid waste disposal
Solid Waste Management
Wastewater Management
reported flooding in immediate surroundings33% 45%
of respondents HH have access to showering and washing facilities83%98%
Main wastewater systems
Open air/Pit latrines
None
Public networkPrivate collection
Types of toiletsTraditional pit
No toilet in home
Flush
Open air
Improved pit Non-formal education opportunities65%68%
Municipal collection
Cases of abuses and services
39% 45%
38% 48%
Out of 2518 caregivers
Orphans
21% 11%
32%
2%
13%
33%
8% 10%
31%
11%
3%
21%
5% 2%
Country ProfileLebanon May 2015
Out of 2518 caregivers
Out of 1634 adolescents
Out of 1634 adolescents
Out of 2612 caregivers
Out of 2612 caregivers
Out of 1685 adolescents
Out of 1685 adolescents
Reported flooding or presence of stagnant water within community in the last 12 months
Refuse/garbage
Presence of pests
Access to showering and washing facilities
Birth registration
Health
Top 3 challenges in accessing health services
No affordable transportation No affordable transportation
Cost of medicines/medication Cost of medicines/medication
Cost of health consultation Cost of health consultation
Most commonly reported child illnessesDiarrhea Diarrhea
Acute respiratory disease Acute respiratory disease
Stomach illness Skin rashes
took their children to be vaccinated in polio campaign 84%67%
Fear of vaccines
Mistrust campaign
Not aware
Already vaccinated
Distance to site
No need for vaccine
Cost
No documents
Reasons for not participating in polio campaigns
Participated in polio campaigns in last 3 months
Average reported proportion of
REACH Informingmore effectivehumanitarian action
Other
1+68+31+t14+83+3+t
13+52+34+1+t44+41+4+6+5+t
4+78+1+4+13+t 5+42+12+2+13+1+7+1+17+t
ANNEX I: LEBANON PROFILE

Reported Top Needs
Host Displaced
May 2015Akkar
Shelter
Kind of occupancy arrangement
Average monthly household rent
$199 $154
Main types of accommodation reported
Do not know
YesNo
have heard reports of evictions
Reported evictions
Collective centre/shelter
Garage/Shop/Worksite
One room structure
Factory/Warehouse
Homeless/No shelter
Unfinished building
Tent/Handmade shelter in settlement
Independent house/apartment
Owned apartment/house
Provided by employer
Assistance/Charity
Unfurnished rental/Land
Hosted
Furnished rental
Squatting
Host Displaced
Social Stability
Lack of Social interaction
Lack of confidence ininstitutions
Negative views ofinternational actors
Social fragmentation
Restrictions ondisplaced communities
Lack of conflict mitigationmechanisms
Very low
Very high
Reported issues causing community divisions
Youth violence and unemployment Targeted aid and foreign assistance
Job shortagesOverstretched resources Youth violence and unemployment
Potential sources of tensions related to:
Demographic Pressure
of hosts reportedsignificant population increase in the last 3 years
of displaced reportedsignificant population increase in the last 6 months
Top 3 reasons for moving in
Lack of affordable housing More shelter options
Knew friends/family Safety concerns
More employment opportunities Knew friends/family
Last 3 years Last 6 months
92% 87%
Host Displaced
Governorate Profile
Income & Poverty
Most common mode of employmentIrregular/temporary Irregular/temporary
as reported by respondents$641 $219
Main sources of income
Formal commerce Unskilled non-agricultural labour
Unskilled non-agricultural labour Food vouchers
Informal commerce Humanitarian aid/Support from local charities
Reported changes in unemployment in last 3 years/6 months
Most Commonly Reported HH expenditures on basic food staples51 - 60% 51 - 60%
Most Commonly Reported HH expenditures on essential non-food items41 - 50% 21 - 30%
Top coping mechanisms to cover cost of basic needs
Reduce number of meals Reduce number of meals
Cheaper food Cheaper food
Credit Credit
Average monthly HH income
Increased Increased
Average hours of electricity reported per day
Main source of electricityPublic connection
$51 $30
Public connection
Average monthly HH expenditure reported
10h 9h
Water
Average monthly expenditure on drinking water per HH
$23 $25
Top sources for drinking and domestic water
Average monthly expenditure on domestic water per HH
$27 $28
Bottled water
Water Trucking
Natural Spring
Well
Tap water
Other natural sources
Drinking Domestic
100%
50%
0%
Drinking Domestic
Electricity
REACH Informingmore effectivehumanitarian action
Job shortages
2+11+4+9+59+13+2+t 6+18+17+17+30+9+3+t56+26+11+2+4+1+t
4+71+25+t
12+60+12+6+6+4+t
1+73+26+t
14+18+17+43+0+7 1+11+23+47+0+19 15+16+15+41+1+12 1+10+17+46+0+26
53+73+47+64+64+43cx+1+1+1+1+1+1
Population groups covered: Lebanese, Syrian, PRL, PRS | Average HH size: 6 | Cadastre Population: 190914 | Lebanese living under US$4: 62123 | Syrian Refugees: 82956
Sample Information: Number of Interviews: 2294 | Number of Male interviewed: 869 | Number of female interviewed: 1425 | Age Range: 12-88 | Data collected between October 2014 - February 2015
!
!
!
!
!
!
!
!
!
!
!
!
!
!
!
!
!
!
!
!
!
!
!!
!
!
!
!
!
!
!
!
!
!
!
!
!
!
Aakar
Hermel
Miniyeh-Danniyeh
Baalbek
Zgharta
Assessed Villages
Host CommunitiesMale Female
DisplacedMale Female
EmploymentHealthElectricityRoadsDrinking WaterEducationWaste Water MgmtDomestic WaterWinterisationSecurityShelterSolid Waste MgmtFoodNFIsOtherTransportHygiene ItemsRegistration
0%1%0%1%2%2%1%0%8%1%8%
10%9%6%7%
23%22%
0%1%0%1%3%4%2%1%5%1%
12%7%9%8%9%
15%22%
3%0%1%0%2%7%2%
13%0%
19%0%2%
10%4%1%2%
15%18%
3%1%0%0%3%9%3%
15%0%
18%1%4%7%7%1%1%9%
19%
GOVERNORATE PROFILES

Host DisplacedHost Displaced
Children and Women
respondents reported cases of unregistered births3% 15%
of respondents heard of cases of abuse, exploitation or sexual violence in last 6 months
of respondents know of services available for women and children atrisk or survivors of violence, abuse or exploitation
0%0%
Vulnerable population groups living within community
Separated women
Widowed women
Unaccompanied children minors
Pregnant women
Girls married before 18
Reasons why women may not be participating in the labor force
Safety concerns Safety concerns
Household responsibilities Household responsibilities
Traditional values/customs Traditional values/customs
Main activities for out of school boys under 18
Household chores/Child care Begging
Informal employment Informal employment
Begging Household chores/Child care
Main activities for out of school girls under 18
Other Other
Household chores/Child care Household chores/Child care
Informal employment Informal employment
Population groups engaged in income generation
Male adolescents (12-17) Women (18+)
Men (18+) Men (18+)
Women (18+) Male adolescents (12-17)
Education
reported there are no non-formal education opportunities
of caregivers reported children enrolled 2013-1435%66%
of caregivers reported children enrolled 2014-1529%66%
adolescents were enrolled 2013-1436%77%
adolescents are enrolled 2014-1569%18%
Top reported challenges in accessing education
No affordable transportation No affordable transportation
Cost of school fees Cost of school fees
Cost of school supplies Cost of school supplies
In the last 3 months
of respondents reported noticeable excess refuse/garbage
of respondents reported noticeable presence of flies, rodents, and insects
Public collection
Main type of solid waste disposal
Solid Waste Management
Wastewater Management
reported flooding in immediate surroundings36% 46%
of respondents HH have access to showering and washing facilities84%99%
Main wastewater systems
Open air/Pit latrines
None
Public networkPrivate collection
Types of toiletsTraditional pit
No toilet in home
Flush
Open air
Improved pit Non-formal education opportunities72%72%
Public collection
Cases of abuses and services
51% 56%
52% 60%
Out of 543 caregivers
Orphans
17% 14%
26%
1%
20%
28%
17% 19%
31%
17%
1%
18%
1% 1%
Governorate ProfileAkkar May 2015
Out of 543 caregivers
Out of 301 adolescents
Out of 301 adolescents
Out of 576 caregivers
Out of 576 caregivers
Out of 280 adolescents
Out of 280 adolescents
Reported flooding or presence of stagnant water within community in the last 12 months
Refuse/garbage
Presence of pests
Access to showering and washing facilities
Birth registration
Health
Top 3 challenges in accessing health services
No affordable transportation No affordable transportation
Cost of medicines/medication Cost of medicines/medication
Cost of health services Cost of health services
Most commonly reported child illnessesDiarrhea Diarrhea
Acute respiratory diseases Skin rashes
Skin rashes Acute respiratory diseases
took their children to be vaccinated in polio campaign 37%39%
Fear of vaccines
Mistrust campaign
Not aware
Already vaccinated
Distance to site
No need for vaccine
Cost
No documents
Reasons for not participating in polio campaigns
Participated in polio campaigns in last 3 months
Average reported proportion of
REACH Informingmore effectivehumanitarian action
Other
4+57+39+t32+64+4+t
17+43+39+1+t55+27+3+9+6+t
17+63+3+3+14+t 12+47+6+6+6+23+t
GOVERNORATE PROFILES

Reported Top Needs
Host Displaced
May 2015Baalbek-El Hermel
Shelter
Kind of occupancy arrangement
Average monthly household rent
$181 $113
Main types of accommodation reported
Do not know
YesNo
have heard reports of evictions
Reported evictions
Collective centre/shelter
Garage/Shop/Worksite
One room structure
Factory/Warehouse
Homeless/No shelter
Unfinished building
Tent/Handmade shelter in settlement
Independent house/apartment
Owned apartment/house
Provided by employer
Assistance/Charity
Unfurnished rental/Land
Hosted
Furnished rental
Squatting
Host Displaced
Social Stability*
Lack of Social interaction
Lack of confidence ininstitutions
Negative views ofinternational actors
Social fragmentation
Restrictions ondisplaced communities
Lack of conflict mitigationmechanisms
Very low
Very high
Reported issues causing community divisions
Overstretched resources Housing shortages/rent increase
Job shortages
Youth violence and unemployment Youth violence and unemployment
Potential sources of tensions related to:
Demographic Pressure
of hosts reportedsignificant population increase in the last 3 years
of displaced reportedsignificant population increase in the last 6 months
Top 3 reasons for moving in
Lack of affordable housing More employment opportunities
Knew friends/family Safety concerns
Safety concerns Knew friends/family
Last 3 years Last 6 months
91% 93%
Host Displaced
Governorate Profile
Income & Poverty
Most common mode of employmentRegular Irregular/temporary
as reported by respondents$1035 $253
Main sources of income
Unskilled agricultural labour Food vouchers
Unskilled non-agricultural labour Unskilled agricultural labour
Informal commerce Unskilled non-agricultural labour
Reported changes in unemployment in last 3 years/6 months
Most Commonly Reported HH expenditures on basic food staples51 - 60% 81 - 90%
Most Commonly Reported HH expenditures on essential non-food items21 - 30% 0 - 10%
Top coping mechanisms to cover cost of basic needs
Borrow money/food Reduce meal portion size
Cheaper food Cheaper food
Credit Reduce number of meals
Average monthly HH income
Increased Increased
Average hours of electricity reported per day
Main source of electricityPublic connection
$71 $36
Public connection
Average monthly HH expenditure reported
12h 9h
Water
Average monthly expenditure on drinking water per HH
$29 $28
Top sources for drinking and domestic water
Average monthly expenditure on domestic water per HH
$36 $30
Bottled water
Water Trucking
Natural Spring
Well
Tap water
Other natural sources
Drinking Domestic
100%
50%
0%
Drinking Domestic
Electricity
REACH Informingmore effectivehumanitarian action
Job shortages
11+3+66+18+2+t 2+44+8+25+14+7+t46+34+10+3+5+2+t
4+76+20+t
14+51+9+12+7+7t
2+80+18+t
35+12+22+28+1+2 2+8+40+34+0+16 21+7+13+31+1+28 3+4+18+36+2+38
43+32+13+34+31+55cx+1+1+1+1+1+1
Population groups covered: Lebanese, Syrian, PRL, PRS | Average HH size: 6 | Cadastre Population: 135098 | Lebanese living under US$4: 85086 | Syrian Refugees: 84650
Sample Information: Number of Interviews: 1560 | Number of Male interviewed: 587 | Number of female interviewed: 973 | Age Range: 12-92 | Data collected between October 2014 - February 2015
!
!
!
!
!
!
!
!
!
!
!
!
!
!!
!
!
!
!
!
!
!
!
Baalbek
Hermel
Aakar
Jbayl
Zahleh
Koura Zgharta
Batroun
Metn
Miniyeh-Danniyeh
Bcharreh
Kesrouane
Baabda
Trablous
Aaley
Assessed Villages
Host CommunitiesMale Female
DisplacedMale Female
EmploymentHealthElectricityRoadsDrinking WaterEducationWaste Water MgmtDomestic WaterWinterisationSecurityShelterSolid Waste MgmtFoodNFIsOtherTransportHygiene ItemsRegistration
0%1%1%3%1%1%1%1%4%3%7%8%5%7%
16%19%20%
0%2%1%3%1%2%2%1%4%4%7%9%5%
10%15%17%19%
0%1%0%0%6%
13%0%9%0%
20%2%1%
10%7%0%3%
11%16%
0%0%0%0%9%
10%0%
11%1%
18%1%1%9%
10%0%5%
11%14%
* Disclaimer: As a result of access constraints data collection was conducted in a number of communities with a modified assessment tool omitting most social stability indicators
GOVERNORATE PROFILES
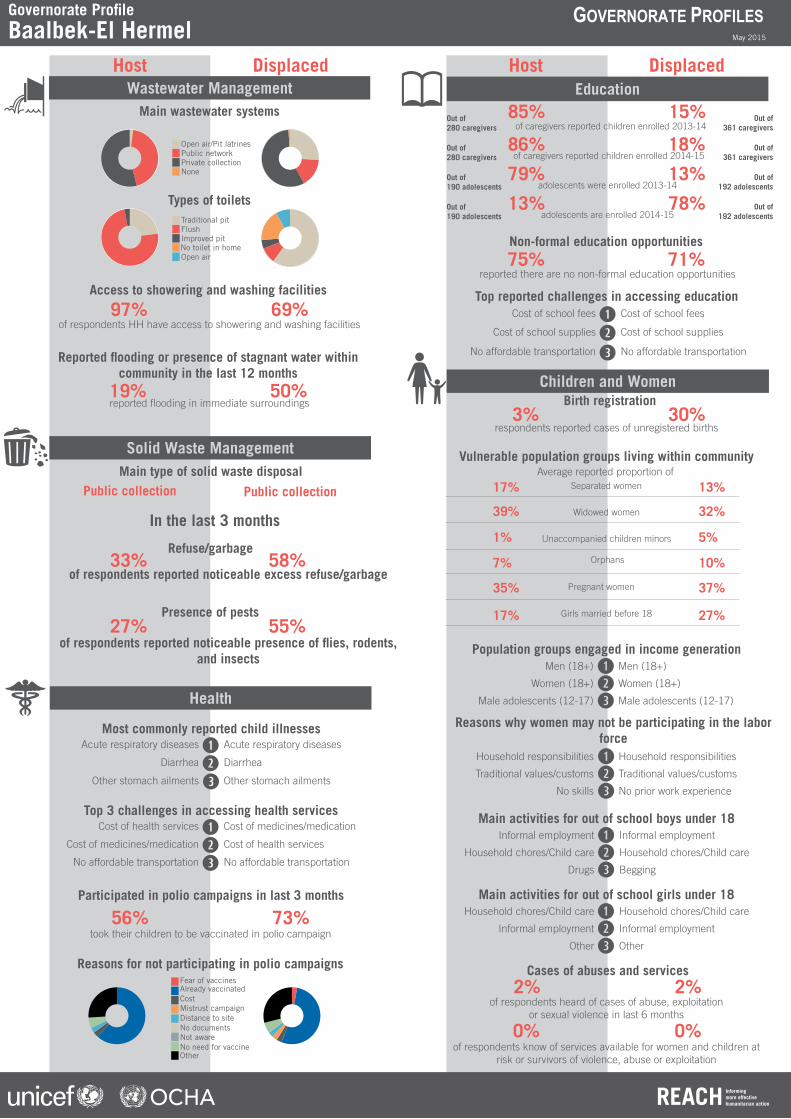
Host DisplacedHost Displaced
Children and Women
respondents reported cases of unregistered births3% 30%
of respondents heard of cases of abuse, exploitation or sexual violence in last 6 months
of respondents know of services available for women and children atrisk or survivors of violence, abuse or exploitation
0%0%
Vulnerable population groups living within community
Separated women
Widowed women
Unaccompanied children minors
Pregnant women
Girls married before 18
Reasons why women may not be participating in the labor force
No skills No prior work experience
Household responsibilities Household responsibilities
Traditional values/customs Traditional values/customs
Main activities for out of school boys under 18
Drugs Begging
Informal employment Informal employment
Household chores/Child care Household chores/Child care
Main activities for out of school girls under 18
Other Other
Household chores/Child care Household chores/Child care
Informal employment Informal employment
Population groups engaged in income generation
Male adolescents (12-17) Male adolescents (12-17)
Men (18+) Men (18+)
Women (18+) Women (18+)
Education
reported there are no non-formal education opportunities
of caregivers reported children enrolled 2013-1415%85%
of caregivers reported children enrolled 2014-1518%86%
adolescents were enrolled 2013-1413%79%
adolescents are enrolled 2014-1578%13%
Top reported challenges in accessing education
No affordable transportation No affordable transportation
Cost of school fees Cost of school fees
Cost of school supplies Cost of school supplies
In the last 3 months
of respondents reported noticeable excess refuse/garbage
of respondents reported noticeable presence of flies, rodents, and insects
Public collection
Main type of solid waste disposal
Solid Waste Management
Wastewater Management
reported flooding in immediate surroundings19% 50%
of respondents HH have access to showering and washing facilities69%97%
Main wastewater systems
Open air/Pit latrines
None
Public networkPrivate collection
Types of toiletsTraditional pit
No toilet in home
Flush
Open air
Improved pit Non-formal education opportunities71%75%
Public collection
Cases of abuses and services
33% 58%
27% 55%
Out of 280 caregivers
Orphans
17% 13%
39%
1%
7%
35%
17% 27%
37%
10%
5%
32%
2% 2%
Governorate ProfileBaalbek-El Hermel May 2015
Out of 280 caregivers
Out of 190 adolescents
Out of 190 adolescents
Out of 361 caregivers
Out of 361 caregivers
Out of 192 adolescents
Out of 192 adolescents
Reported flooding or presence of stagnant water within community in the last 12 months
Refuse/garbage
Presence of pests
Access to showering and washing facilities
Birth registration
Health
Top 3 challenges in accessing health services
No affordable transportation No affordable transportation
Cost of health services Cost of medicines/medication
Cost of medicines/medication Cost of health services
Most commonly reported child illnessesAcute respiratory diseases Acute respiratory diseases
Diarrhea Diarrhea
Other stomach ailments Other stomach ailments
took their children to be vaccinated in polio campaign 73%56%
Fear of vaccines
Mistrust campaign
Not aware
Already vaccinated
Distance to site
No need for vaccine
Cost
No documents
Reasons for not participating in polio campaigns
Participated in polio campaigns in last 3 months
Average reported proportion of
REACH Informingmore effectivehumanitarian action
Other
2+44+54+t23+74+3+t
26+16+57+1+t60+9+5+18+8+t
62+3+3+6+26+t 3+53+3+3+3+6+29+t
GOVERNORATE PROFILES

Reported Top Needs
Host Displaced
May 2015Beirut
Shelter
Kind of occupancy arrangement
Average monthly household rent
$407 $410
Main types of accommodation reported
Do not know
YesNo
have heard reports of evictions
Reported evictions
Collective centre/shelter
Garage/Shop/Worksite
One room structure
Factory/Warehouse
Homeless/No shelter
Unfinished building
Tent/Handmade shelter in settlement
Independent house/apartment
Owned apartment/house
Provided by employer
Assistance/Charity
Unfurnished rental/Land
Hosted
Furnished rental
Squatting
Host Displaced
Social Stability
Lack of Social interaction
Lack of confidence ininstitutions
Negative views ofinternational actors
Social fragmentation
Restrictions ondisplaced communities
Lack of conflict mitigationmechanisms
Very low
Very high
Reported issues causing community divisions
Youth violence and unemployment Youth violence and unemployment
Job shortagesYouth violence and unemployment Political affiliations
Potential sources of tensions related to:
Demographic Pressure
of hosts reportedsignificant population increase in the last 3 years
of displaced reportedsignificant population increase in the last 6 months
Top 3 reasons for moving in
Knew friends/family More shelter options
More employment opportunities Safety concerns
Safety concerns More employment opportunities
Last 3 years Last 6 months
97% 96%
Host Displaced
Governorate Profile
Income & Poverty
Most common mode of employmentRegular Regular
as reported by respondents$1508 $538
Main sources of income
Unskilled non-agricultural labour Informal commerce
Formal commerce Unskilled non-agricultural labour
Informal commerce Food vouchers
Reported changes in unemployment in last 3 years/6 months
Most Commonly Reported HH expenditures on basic food staples31 - 40% 81 - 90%
Most Commonly Reported HH expenditures on essential non-food items11 - 20% 0 - 10%
Top coping mechanisms to cover cost of basic needs
Borrow money/food Reduce number of meals
Cheaper food Cheaper food
Credit Credit
Average monthly HH income
Increased Increased
Average hours of electricity reported per day
Main source of electricityPublic connection
$86 $47
Public connection
Average monthly HH expenditure reported
19h 17h
Water
Average monthly expenditure on drinking water per HH
$48 $42
Top sources for drinking and domestic water
Average monthly expenditure on domestic water per HH
$45 $33
Bottled water
Water Trucking
Natural Spring
Well
Tap water
Other natural sources
Drinking Domestic
100%
50%
0%
Drinking Domestic
Electricity
REACH Informingmore effectivehumanitarian action
Job shortages
3+2+1+9+1+58+24+2+t 6+4+15+2+46+22+5+t34+33+20+8+4+1+t
15+50+35+t10+59+31+t
73+1+19+5+1+1 2+0+62+12+1+23 73+0+21+3+0+1 1+0+67+9+0+23
57+70+43+60+53+80cx+1+1+1+1+1+1
Population groups covered: Lebanese, Syrian, PRL, PRS | Average HH size: 5 | Cadastre Population: 5869 | Lebanese living under US$4: 3434 | Syrian Refugees: 5001
Sample Information: Number of Interviews: 394 | Number of Male interviewed: 149 | Number of female interviewed: 245 | Age Range: 12-80 | Data collected between October 2014 - February 2015
!
!
!
!
!
!
Beirut
Metn
Baabda Assessed Villages
Host CommunitiesMale Female
DisplacedMale Female
EmploymentHealthElectricityRoadsDrinking WaterEducationWaste Water MgmtDomestic WaterWinterisationSecurityShelterSolid Waste MgmtFoodNFIsOtherTransportHygiene ItemsRegistration
0%1%2%5%4%3%6%9%4%6%3%7%8%5%4%
11%21%
0%0%1%2%3%1%9%
11%0%9%4%
12%5%7%6%
12%18%
0%1%1%1%
11%10%1%
10%1%7%2%2%
16%6%1%1%
13%16%
1%0%0%0%
11%12%0%
13%1%7%3%0%
20%3%0%1%
11%14%
20+41+19+16+4+t
GOVERNORATE PROFILES

Host DisplacedHost Displaced
Children and Women
respondents reported cases of unregistered births9% 13%
of respondents heard of cases of abuse, exploitation or sexual violence in last 6 months
of respondents know of services available for women and children atrisk or survivors of violence, abuse or exploitation
1%1%
Vulnerable population groups living within community
Separated women
Widowed women
Unaccompanied children minors
Pregnant women
Girls married before 18
Reasons why women may not be participating in the labor force
Low levels of or no education Safety concerns
Household responsibilities Household responsibilities
Traditional values/customs Traditional values/customs
Main activities for out of school boys under 18
Begging Begging
Informal employment Informal employment
Household chores/Child care Household chores/Child care
Main activities for out of school girls under 18
Begging Other
Household chores/Child care Household chores/Child care
Informal employment Informal employment
Population groups engaged in income generation
Male adolescents (12-17) Women (18+)
Men (18+) Men (18+)
Women (18+) Male adolescents (12-17)
Education
reported there are no non-formal education opportunities
of caregivers reported children enrolled 2013-1428%73%
of caregivers reported children enrolled 2014-1521%73%
adolescents were enrolled 2013-1424%96%
adolescents are enrolled 2014-1592%16%
Top reported challenges in accessing education
No affordable transportation Discrimination at school from teachers
Cost of school fees Cost of school fees
Cost of school supplies Cost of school supplies
In the last 3 months
of respondents reported noticeable excess refuse/garbage
of respondents reported noticeable presence of flies, rodents, and insects
Private collection
Main type of solid waste disposal
Solid Waste Management
Wastewater Management
reported flooding in immediate surroundings22% 26%
of respondents HH have access to showering and washing facilities93%97%
Main wastewater systems
Open air/Pit latrines
None
Public networkPrivate collection
Types of toiletsTraditional pit
No toilet in home
Flush
Open air
Improved pit Non-formal education opportunities57%62%
Public collection
Cases of abuses and services
43% 44%
40% 47%
Out of 83 caregivers
Orphans
24% 10%
32%
4%
11%
37%
15% 19%
29%
11%
6%
19%
11% 3%
Governorate ProfileBeirut May 2015
Out of 83 caregivers
Out of 50 adolescents
Out of 50 adolescents
Out of 97 caregivers
Out of 97 caregivers
Out of 51 adolescents
Out of 51 adolescents
Reported flooding or presence of stagnant water within community in the last 12 months
Refuse/garbage
Presence of pests
Access to showering and washing facilities
Birth registration
Health
Top 3 challenges in accessing health services
Long waits for consultation Long waits for consultation
Cost of health services Cost of medicines/medication
Cost of medicines/medication Cost of health services
Most commonly reported child illnessesAcute respiratory diseases Acute respiratory diseases
Diarrhea Diarrhea
Other Other stomach ailments
took their children to be vaccinated in polio campaign 80%60%
Fear of vaccines
Mistrust campaign
Not aware
Already vaccinated
Distance to site
No need for vaccine
Cost
No documents
Reasons for not participating in polio campaigns
Participated in polio campaigns in last 3 months
Average reported proportion of
REACH Informingmore effectivehumanitarian action
Other
1+97+2+t4+96+t
1+98+1+t28+70+1+1t
86+5+9+t 73+9+18+t
GOVERNORATE PROFILES
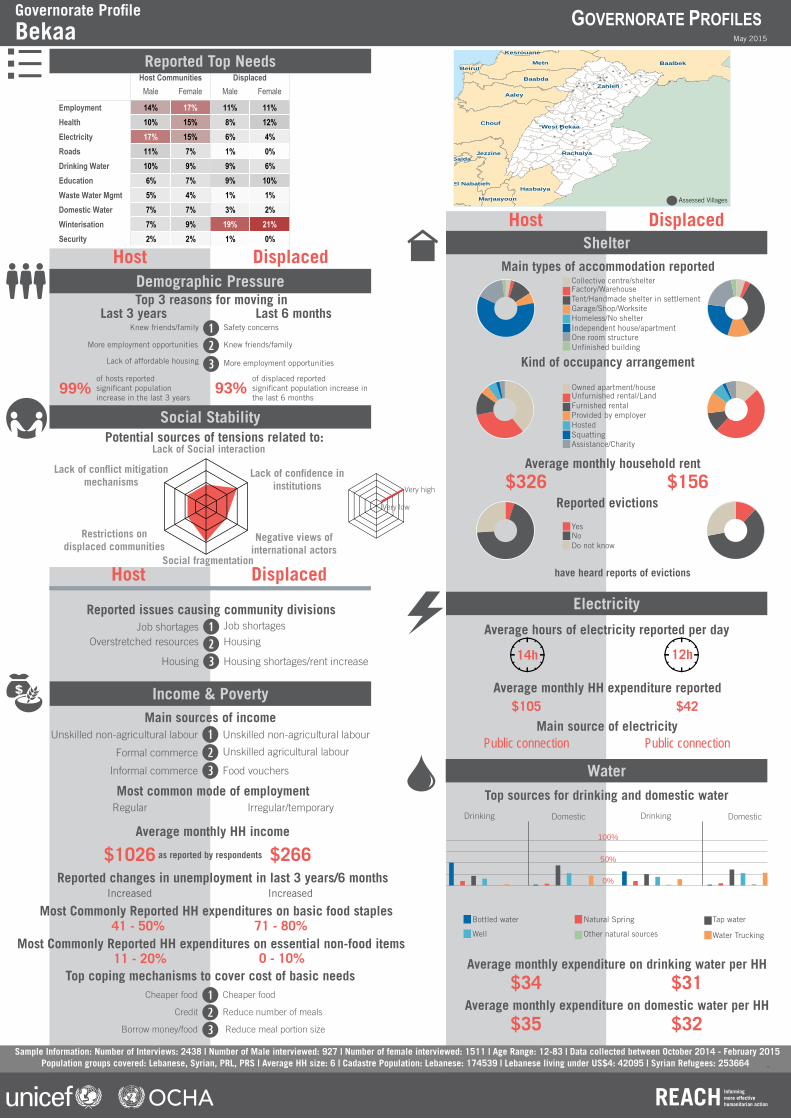
!
!
!
!
!
!
!
!!
!
!
!
!
!
!
!
!
!
!
!
! !
!
!
!
!
!
!!
!
!
!!
!
!
!
!!
!
!
Chouf
Zahleh
Rachaiya
BaalbekMetn
Aaley
West Bekaa
Jezzine
Baabda
HasbaiyaEl Nabatieh
Marjaayoun
Beirut
Kesrouane
Saida
Reported Top Needs
Host Displaced
May 2015Bekaa
Shelter
Kind of occupancy arrangement
Average monthly household rent
$326 $156
Main types of accommodation reported
Do not know
YesNo
have heard reports of evictions
Reported evictions
Collective centre/shelter
Garage/Shop/Worksite
One room structure
Factory/Warehouse
Homeless/No shelter
Unfinished building
Tent/Handmade shelter in settlement
Independent house/apartment
Owned apartment/house
Provided by employer
Assistance/Charity
Unfurnished rental/Land
Hosted
Furnished rental
Squatting
Host Displaced
Social Stability
Lack of Social interaction
Lack of confidence ininstitutions
Negative views ofinternational actors
Social fragmentation
Restrictions ondisplaced communities
Lack of conflict mitigationmechanisms
Very low
Very high
Reported issues causing community divisions
Housing Housing shortages/rent increase
Job shortagesOverstretched resources Housing
Potential sources of tensions related to:
Demographic Pressure
of hosts reportedsignificant population increase in the last 3 years
of displaced reportedsignificant population increase in the last 6 months
Top 3 reasons for moving in
Lack of affordable housing More employment opportunities
Knew friends/family Safety concerns
More employment opportunities Knew friends/family
Last 3 years Last 6 months
99% 93%
Host Displaced
Governorate Profile
Income & Poverty
Most common mode of employmentRegular Irregular/temporary
as reported by respondents$1026 $266
Main sources of income
Informal commerce Food vouchers
Unskilled non-agricultural labour Unskilled non-agricultural labour
Formal commerce Unskilled agricultural labour
Reported changes in unemployment in last 3 years/6 months
Most Commonly Reported HH expenditures on basic food staples41 - 50% 71 - 80%
Most Commonly Reported HH expenditures on essential non-food items11 - 20% 0 - 10%
Top coping mechanisms to cover cost of basic needs
Borrow money/food Reduce meal portion size
Cheaper food Cheaper food
Credit Reduce number of meals
Average monthly HH income
Increased Increased
Average hours of electricity reported per day
Main source of electricityPublic connection
$105 $42
Public connection
Average monthly HH expenditure reported
14h 12h
Water
Average monthly expenditure on drinking water per HH
$34 $31
Top sources for drinking and domestic water
Average monthly expenditure on domestic water per HH
$35 $32
Bottled water
Water Trucking
Natural Spring
Well
Tap water
Other natural sources
Drinking Domestic
100%
50%
0%
Drinking Domestic
Electricity
REACH Informingmore effectivehumanitarian action
Job shortages
3+2+11+6+60+16+2+t 5+3+34+13+22+20+3+t39+33+13+5+5+2+3+t
12+60+28+t
13+49+11+12+7+2+6+t
5+69+26+t
50+10+21+15+1+3 2+4+44+27+1+22 31+10+25+19+2+14 2+5+35+27+3+28
45+77+50+77+45+45 cx+1+1+1+1+1+1
Population groups covered: Lebanese, Syrian, PRL, PRS | Average HH size: 6 | Cadastre Population: Lebanese: 174539 | Lebanese living under US$4: 42095 | Syrian Refugees: 253664Sample Information: Number of Interviews: 2438 | Number of Male interviewed: 927 | Number of female interviewed: 1511 | Age Range: 12-83 | Data collected between October 2014 - February 2015
Assessed Villages
Host CommunitiesMale Female
DisplacedMale Female
EmploymentHealthElectricityRoadsDrinking WaterEducationWaste Water MgmtDomestic WaterWinterisationSecurityShelterSolid Waste MgmtFoodNFIsOtherTransportHygiene ItemsRegistration
0%0%2%3%2%2%1%2%9%7%4%7%9%7%
15%15%17%
0%1%1%1%4%2%1%2%7%7%5%6%
10%11%17%10%14%
1%1%0%1%5%
14%1%9%0%
21%2%1%
10%6%0%4%
12%11%
1%0%0%1%4%
13%1%
13%1%
19%3%1%9%9%1%6%8%
11%
GOVERNORATE PROFILES

Host DisplacedHost Displaced
Children and Women
respondents reported cases of unregistered births6% 38%
of respondents heard of cases of abuse, exploitation or sexual violence in last 6 months
of respondents know of services available for women and children atrisk or survivors of violence, abuse or exploitation
0%1%
Vulnerable population groups living within community
Separated women
Widowed women
Unaccompanied children minors
Pregnant women
Girls married before 18
Reasons why women may not be participating in the labor force
Safety concerns Safety concerns
Household responsibilities Traditional values/customs
Traditional values/customs Household responsibilities
Main activities for out of school boys under 18
Begging Begging
Informal employment Informal employment
Household chores/Child care Household chores/Child care
Main activities for out of school girls under 18
Begging Other
Household chores/Child care Household chores/Child care
Informal employment Informal employment
Population groups engaged in income generation
Male adolescents (12-17) Women (18+)
Men (18+) Men (18+)
Women (18+) Male adolescents (12-17)
Education
reported there are no non-formal education opportunities
of caregivers reported children enrolled 2013-1420%76%
of caregivers reported children enrolled 2014-1518%76%
adolescents were enrolled 2013-1420%86%
adolescents are enrolled 2014-1581%8%
Top reported challenges in accessing education
No affordable transportation No affordable transportation
Cost of school fees Cost of school fees
Cost of school supplies Cost of school supplies
In the last 3 months
of respondents reported noticeable excess refuse/garbage
of respondents reported noticeable presence of flies, rodents, and insects
Public collection
Main type of solid waste disposal
Solid Waste Management
Wastewater Management
reported flooding in immediate surroundings33% 49%
of respondents HH have access to showering and washing facilities72%98%
Main wastewater systems
Open air/Pit latrines
None
Public networkPrivate collection
Types of toiletsTraditional pit
No toilet in home
Flush
Open air
Improved pit Non-formal education opportunities61%67%
Public collection
Cases of abuses and services
45% 54%
46% 60%
Out of 405 caregivers
Orphans
26% 12%
40%
4%
10%
41%
26% 29%
39%
11%
6%
29%
6% 4%
Governorate ProfileBekaa February 2015
Out of 405 caregivers
Out of 310 adolescents
Out of 310 adolescents
Out of 651 caregivers
Out of 651 caregivers
Out of 316 adolescents
Out of 316 adolescents
Reported flooding or presence of stagnant water within community in the last 12 months
Refuse/garbage
Presence of pests
Access to showering and washing facilities
Birth registration
Health
Top 3 challenges in accessing health services
No affordable transportation No affordable transportation
Cost of health services Cost of medicines/medication
Cost of medicines/medication Cost of health services
Most commonly reported child illnessesAcute respiratory diseases Diarrhea
Diarrhea Acute respiratory diseases
Other Skin rashes
took their children to be vaccinated in polio campaign 89%82%
Fear of vaccines
Mistrust campaign
Not aware
Already vaccinated
Distance to site
No need for vaccine
Cost
No documents
Reasons for not participating in polio campaigns
Participated in polio campaigns in last 3 months
Average reported proportion of
REACH Informingmore effectivehumanitarian action
Other
1+65+34+t6+93+1+t
23+29+47+1+t43+27+9+13+8+t
3+77+2+1+3+2+12+t 4+63+2+2+4+25+t
GOVERNORATE PROFILES

Reported Top Needs
Host Displaced
May 2015Mount Lebanon
Shelter
Kind of occupancy arrangement
Average monthly household rent
$385 $329
Main types of accommodation reported
Do not know
YesNo
have heard reports of evictions
Reported evictions
Collective centre/shelter
Garage/Shop/Worksite
One room structure
Factory/Warehouse
Homeless/No shelter
Unfinished building
Tent/Handmade shelter in settlement
Independent house/apartment
Owned apartment/house
Provided by employer
Assistance/Charity
Unfurnished rental/Land
Hosted
Furnished rental
Squatting
Host Displaced
Social Stability
Lack of Social interaction
Lack of confidence ininstitutions
Negative views ofinternational actors
Social fragmentation
Restrictions ondisplaced communities
Lack of conflict mitigationmechanisms
Very low
Very high
Reported issues causing community divisions
Overstretched resources Political affiliations
Job shortagesPolitical affiliations Political affiliations
Potential sources of tensions related to:
Demographic Pressure
of hosts reportedsignificant population increase in the last 3 years
of displaced reportedsignificant population increase in the last 6 months
Top 3 reasons for moving in
Lack of affordable housing Knew friends/family
More employment opportunities Safety concerns
Knew friends/family More employment opportunities
Last 3 years Last 6 months
96% 88%
Host Displaced
Governorate Profile
Income & Poverty
Most common mode of employmentRegular Irregular/temporary
as reported by respondents$1389 $482
Main sources of income
Unskilled non-agricultural labour Informal commerce
Formal commerce Unskilled non-agricultural labour
Informal commerce Food vouchers
Reported changes in unemployment in last 3 years/6 months
Most Commonly Reported HH expenditures on basic food staples41 - 50% 41 - 50%
Most Commonly Reported HH expenditures on essential non-food items11 - 20% 0 - 10%
Top coping mechanisms to cover cost of basic needs
Credit Reduce meal portion size
Cheaper food Cheaper food
Borrow money/food Reduce number of meals
Average monthly HH income
Increased Increased
Average hours of electricity reported per day
Main source of electricityPublic connection
$127 $65
Public connection
Average monthly HH expenditure reported
13h 13h
Water
Average monthly expenditure on drinking water per HH
$38 $36
Top sources for drinking and domestic water
Average monthly expenditure on domestic water per HH
$49 $45
Bottled water
Water Trucking
Natural Spring
Well
Tap water
Other natural sources
Drinking Domestic
100%
50%
0%
Drinking Domestic
Electricity
REACH Informingmore effectivehumanitarian action
Job shortages
2+2+2+6+65+20+3+t 4+4+5+13+40+27+7+t37+35+18+6+3+1+t
17+52+31+t8+64+28+t
67+6+20+4+1+2 1+2+52+14+0+30 45+8+34+5+1+6 3+3+56+10+1+26
60+68+47+71+70+68cx+1+1+1+1+1+1
Population groups covered: Lebanese, Syrian, PRL, PRS | Average HH size: 5 | Cadastre Population: 625671 | Lebanese living under US$4: 104280 | Syrian Refugees: 147203
Sample Information: Number of Interviews: 2834 | Number of Male interviewed: 1070 | Number of female interviewed: 1764 | Age Range: 12-92 | Data collected between October 2014 - February 2015
!
! !
!
!!
!
!
!
!
!!
!
!
!
!
!
!
!
!!
!!
!
!
!
!
!! !! !
!
!
!!
!
!
!
!
!!!
!
Baalbek
Chouf
Jbayl
Zahleh
Metn
Rachaiya
Aaley
West Bekaa
Kesrouane
Saida
Baabda
Jezzine
Batroun
El Nabatieh
Bcharreh
Beirut
Hasbaiya
Assessed Villages
Host CommunitiesMale Female
DisplacedMale Female
EmploymentHealthElectricityRoadsDrinking WaterEducationWaste Water MgmtDomestic WaterWinterisationSecurityShelterSolid Waste MgmtFoodNFIsOtherTransportHygiene ItemsRegistration
0%1%3%2%2%2%3%5%3%9%4%7%7%6%
15%13%17%
0%1%2%1%2%2%2%4%3%
10%4%5%8%8%
20%11%16%
1%1%0%1%5%
10%0%
12%1%
13%3%1%
16%4%0%3%
15%13%
3%1%0%1%4%
12%0%
12%2%
10%4%0%
12%7%0%5%8%
18%
18+43+16+17+4+1+1+t
GOVERNORATE PROFILES

Host DisplacedHost Displaced
Children and Women
respondents reported cases of unregistered births7% 23%
of respondents heard of cases of abuse, exploitation or sexual violence in last 6 months
of respondents know of services available for women and children atrisk or survivors of violence, abuse or exploitation
0%2%
Vulnerable population groups living within community
Separated women
Widowed women
Unaccompanied children minors
Pregnant women
Girls married before 18
Reasons why women may not be participating in the labor force
Low levels of or no education No skills
Household responsibilities Household responsibilities
Traditional values/customs Traditional values/customs
Main activities for out of school boys under 18
Begging Begging
Informal employment Informal employment
Household chores/Child care Household chores/Child care
Main activities for out of school girls under 18
Begging Other
Household chores/Child care Household chores/Child care
Informal employment Informal employment
Population groups engaged in income generation
Male adolescents (12-17) Women (18+)
Men (18+) Men (18+)
Women (18+) Male adolescents (12-17)
Education
reported there are no non-formal education opportunities
of caregivers reported children enrolled 2013-1435%80%
of caregivers reported children enrolled 2014-1520%80%
adolescents were enrolled 2013-1423%90%
adolescents are enrolled 2014-1587%12%
Top reported challenges in accessing education
No affordable transportation No affordable transportation
Cost of school fees Cost of school fees
Cost of school supplies Cost of school supplies
In the last 3 months
of respondents reported noticeable excess refuse/garbage
of respondents reported noticeable presence of flies, rodents, and insects
Public collection
Main type of solid waste disposal
Solid Waste Management
Wastewater Management
reported flooding in immediate surroundings33% 29%
of respondents HH have access to showering and washing facilities90%98%
Main wastewater systems
Open air/Pit latrines
None
Public networkPrivate collection
Types of toiletsTraditional pit
No toilet in home
Flush
Open air
Improved pit Non-formal education opportunities53%60%
Public collection
Cases of abuses and services
34% 33%
37% 44%
Out of 496 caregivers
Orphans
32% 11%
38%
3%
11%
37%
14% 17%
29%
5%
4%
18%
11% 5%
Governorate ProfileMount Lebanon May 2015
Out of 496 caregivers
Out of 337 adolescents
Out of 337 adolescents
Out of 660 caregivers
Out of 660 caregivers
Out of 379 adolescents
Out of 379 adolescents
Reported flooding or presence of stagnant water within community in the last 12 months
Refuse/garbage
Presence of pests
Access to showering and washing facilities
Birth registration
Health
Top 3 challenges in accessing health services
Long waits for consultation No affordable transportation
Cost of medicines/medication Cost of medicines/medication
Cost of health services Cost of health services
Most commonly reported child illnessesDiarrhea Diarrhea
Acute respiratory diseases Acute respiratory diseases
Other stomach ailments Skin rashes
took their children to be vaccinated in polio campaign 76%73%
Fear of vaccines
Mistrust campaign
Not aware
Already vaccinated
Distance to site
No need for vaccine
Cost
No documents
Reasons for not participating in polio campaigns
Participated in polio campaigns in last 3 months
Average reported proportion of
REACH Informingmore effectivehumanitarian action
Other
1+74+25+t1+99+0+t
4+76+20+t27+68+3+2+t
4+71+1+1+1+8+14+t 8+42+1+4+1+16+28+t
GOVERNORATE PROFILES

Reported Top Needs
Host Displaced
May 2015North
Shelter
Kind of occupancy arrangement
Average monthly household rent
$740 $272
Main types of accommodation reported
Do not know
YesNo
have heard reports of evictions
Reported evictions
Collective centre/shelter
Garage/Shop/Worksite
One room structure
Factory/Warehouse
Homeless/No shelter
Unfinished building
Tent/Handmade shelter in settlement
Independent house/apartment
Owned apartment/house
Provided by employer
Assistance/Charity
Unfurnished rental/Land
Hosted
Furnished rental
Squatting
Host Displaced
Social Stability
Lack of Social interaction
Lack of confidence ininstitutions
Negative views ofinternational actors
Social fragmentation
Restrictions ondisplaced communities
Lack of conflict mitigationmechanisms
Very low
Very high
Reported issues causing community divisions
Overstretched resources Targeted aid and foreign assistance
Job shortagesYouth violence and unemployment Youth violence and unemployment
Potential sources of tensions related to:
Demographic Pressure
of hosts reportedsignificant population increase in the last 3 years
of displaced reportedsignificant population increase in the last 6 months
Top 3 reasons for moving in
More employment opportunities Lower cost of living
Knew friends/family Safety concerns
Safety concerns Knew friends/family
Last 3 years Last 6 months
94% 91%
Host Displaced
Governorate Profile
Income & Poverty
Most common mode of employmentIrregular/temporary Irregular/temporary
as reported by respondents$740 $272
Main sources of income
Unskilled agricultural labour Unskilled non-agricultural labour
Informal commerce Food vouchers
Unskilled non-agricultural labour Informal commerce
Reported changes in unemployment in last 3 years/6 months
Most Commonly Reported HH expenditures on basic food staples61 - 70% 51 - 60%
Most Commonly Reported HH expenditures on essential non-food items41 - 50% 21 - 30%
Top coping mechanisms to cover cost of basic needs
Reduce number of meals Rely on food vouchers
Credit Cheaper food
Cheaper food Credit
Average monthly HH income
Increased Increased
Average hours of electricity reported per day
Main source of electricityPublic connection
$65 $37
Public connection
Average monthly HH expenditure reported
11h 11h
Water
Average monthly expenditure on drinking water per HH
$22 $25
Top sources for drinking and domestic water
Average monthly expenditure on domestic water per HH
$20 $23
Bottled water
Water Trucking
Natural Spring
Well
Tap water
Other natural sources
Drinking Domestic
100%
50%
0%
Drinking Domestic
Electricity
REACH Informingmore effectivehumanitarian action
Job shortages
2+13+8+61+15+1+t 7+18+7+14+40+11+3+t52+30+13+1+3+1+t
2+74+24+t1+74+25+t
28+21+32+16+0+3 1+14+44+27+0+14 26+15+31+20+2+7 1+8+45+27+0+19
42+73+45+65+49+42cx+1+1+1+1+1+1
Population groups covered: Lebanese, Syrian, PRL, PRS | Average HH size: 6 | Cadastre Population: 403238 | Lebanese living under US$4: 214105 | Syrian Refugees: 154054
Sample Information: Number of Interviews: 2371 | Number of Male interviewed: 896 | Number of female interviewed: 1475 | Age Range: 12-87 | Data collected between October 2014 - February 2015
!
!
!
!
!
!!
!
!
!
!
!
!
!
!!!
!
!
!
!
!
!
!
!
!
!
!
!
!
!
!
!
!
!!!
!
Aakar
Jbayl
Baalbek
Batroun
HermelKoura
ZghartaMiniyeh-Danniyeh
Bcharreh
Trablous
Kesrouane
Assessed Villages
Host CommunitiesMale Female
DisplacedMale Female
EmploymentHealthElectricityRoadsDrinking WaterEducationWaste Water MgmtDomestic WaterWinterisationSecurityShelterSolid Waste MgmtFoodNFIsOtherTransportHygiene ItemsRegistration
1%1%1%1%2%3%2%1%
10%1%5%
10%9%6%5%
20%23%
0%1%1%2%3%4%2%2%
10%1%4%4%8%8%8%
19%25%
1%1%0%0%1%6%1%
15%1%
21%0%2%
10%7%0%1%
16%18%
3%1%1%1%3%7%3%
16%1%
16%1%2%9%9%0%3%
11%13%
14+60+14+6+4+2+t
GOVERNORATE PROFILES
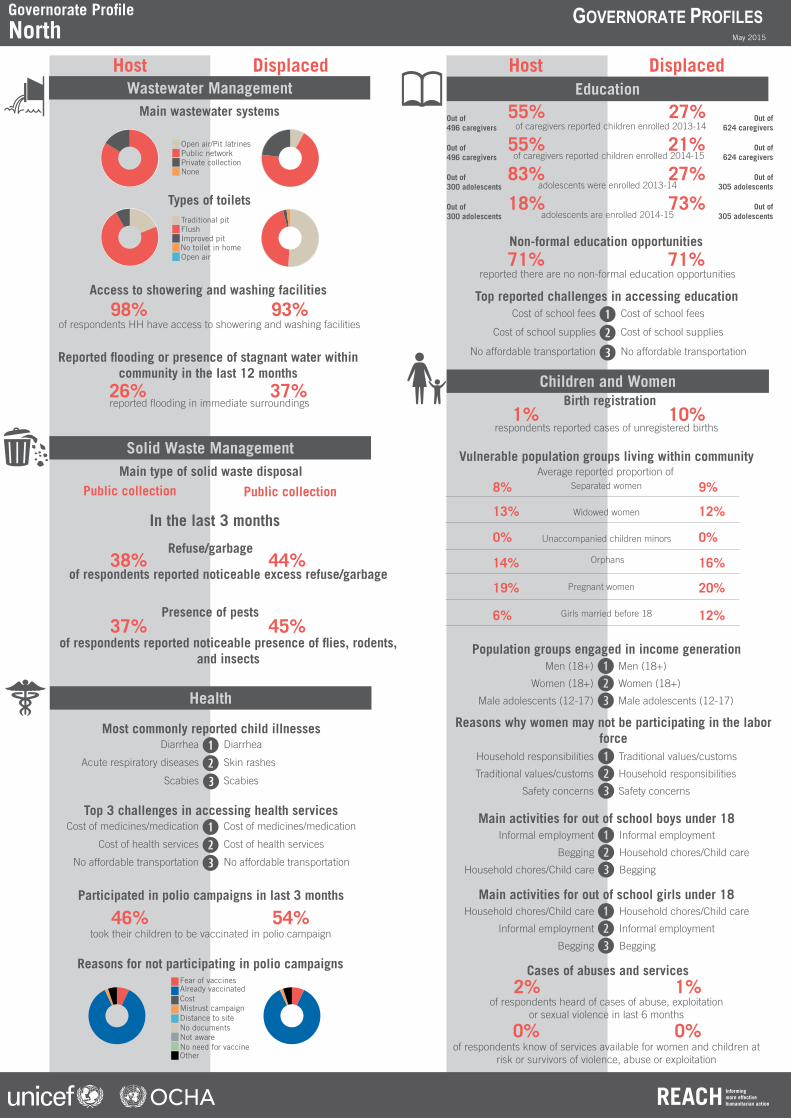
Host DisplacedHost Displaced
Children and Women
respondents reported cases of unregistered births1% 10%
of respondents heard of cases of abuse, exploitation or sexual violence in last 6 months
of respondents know of services available for women and children atrisk or survivors of violence, abuse or exploitation
0%0%
Vulnerable population groups living within community
Separated women
Widowed women
Unaccompanied children minors
Pregnant women
Girls married before 18
Reasons why women may not be participating in the labor force
Safety concerns Safety concerns
Household responsibilities Traditional values/customs
Traditional values/customs Household responsibilities
Main activities for out of school boys under 18
Household chores/Child care Begging
Informal employment Informal employment
Begging Household chores/Child care
Main activities for out of school girls under 18
Begging Begging
Household chores/Child care Household chores/Child care
Informal employment Informal employment
Population groups engaged in income generation
Male adolescents (12-17) Male adolescents (12-17)
Men (18+) Men (18+)
Women (18+) Women (18+)
Education
reported there are no non-formal education opportunities
of caregivers reported children enrolled 2013-1427%55%
of caregivers reported children enrolled 2014-1521%55%
adolescents were enrolled 2013-1427%83%
adolescents are enrolled 2014-1573%18%
Top reported challenges in accessing education
No affordable transportation No affordable transportation
Cost of school fees Cost of school fees
Cost of school supplies Cost of school supplies
In the last 3 months
of respondents reported noticeable excess refuse/garbage
of respondents reported noticeable presence of flies, rodents, and insects
Public collection
Main type of solid waste disposal
Solid Waste Management
Wastewater Management
reported flooding in immediate surroundings26% 37%
of respondents HH have access to showering and washing facilities93%98%
Main wastewater systems
Open air/Pit latrines
None
Public networkPrivate collection
Types of toiletsTraditional pit
No toilet in home
Flush
Open air
Improved pit Non-formal education opportunities71%71%
Public collection
Cases of abuses and services
38% 44%
37% 45%
Out of 496 caregivers
Orphans
8% 9%
13%
0%
14%
19%
6% 12%
20%
16%
0%
12%
2% 1%
Governorate ProfileNorth May 2015
Out of 496 caregivers
Out of 300 adolescents
Out of 300 adolescents
Out of 624 caregivers
Out of 624 caregivers
Out of 305 adolescents
Out of 305 adolescents
Reported flooding or presence of stagnant water within community in the last 12 months
Refuse/garbage
Presence of pests
Access to showering and washing facilities
Birth registration
Health
Top 3 challenges in accessing health services
No affordable transportation No affordable transportation
Cost of medicines/medication Cost of medicines/medication
Cost of health services Cost of health services
Most commonly reported child illnessesDiarrhea Diarrhea
Acute respiratory diseases Skin rashes
Scabies Scabies
took their children to be vaccinated in polio campaign 54%46%
Fear of vaccines
Mistrust campaign
Not aware
Already vaccinated
Distance to site
No need for vaccine
Cost
No documents
Reasons for not participating in polio campaigns
Participated in polio campaigns in last 3 months
Average reported proportion of
REACH Informingmore effectivehumanitarian action
Other
0+84+16+t19+73+8+t
8+69+23+t51+45+2+2+t
7+86+2+5+t 7+86+2+5+t
GOVERNORATE PROFILES

Reported Top Needs
Host Displaced
May 2015South
Shelter
Kind of occupancy arrangement
Average monthly household rent
$888 $324
Main types of accommodation reported
Do not know
YesNo
have heard reports of evictions
Reported evictions
Collective centre/shelter
Garage/Shop/Worksite
One room structure
Factory/Warehouse
Homeless/No shelter
Unfinished building
Tent/Handmade shelter in settlement
Independent house/apartment
Owned apartment/house
Provided by employer
Assistance/Charity
Unfurnished rental/Land
Hosted
Furnished rental
Squatting
Host Displaced
Social Stability
Lack of Social interaction
Lack of confidence ininstitutions
Negative views ofinternational actors
Social fragmentation
Restrictions ondisplaced communities
Lack of conflict mitigationmechanisms
Very low
Very high
Reported issues causing community divisions
Housing Strain resources
Job shortagesOverstretched resources Political affiliations
Potential sources of tensions related to:
Demographic Pressure
of hosts reportedsignificant population increase in the last 3 years
of displaced reportedsignificant population increase in the last 6 months
Top 3 reasons for moving in
Safety concerns Knew friends/family
Knew friends/family Safety concerns
Lack of affordable housing Lower cost of living
Last 3 years Last 6 months
96% 92%
Host Displaced
Governorate Profile
Income & Poverty
Most common mode of employmentRegular Irregular/temporary
as reported by respondents$886 $323
Main sources of income
Formal commerce Food vouchers
Unskilled non-agricultural labour Unskilled non-agricultural labour
Informal commerce Unskilled agricultural labour
Reported changes in unemployment in last 3 years/6 months
Most Commonly Reported HH expenditures on basic food staples51 - 60% 41 - 50%
Most Commonly Reported HH expenditures on essential non-food items11 - 20% 0 - 10%
Top coping mechanisms to cover cost of basic needs
Borrow money/food Borrow money/food
Cheaper food Cheaper food
Credit Reduce number of meals
Average monthly HH income
Increased Increased
Average hours of electricity reported per day
Main source of electricityPublic connection
$80 $48
Public connection
Average monthly HH expenditure reported
13h 12h
Water
Average monthly expenditure on drinking water per HH
$29 $28
Top sources for drinking and domestic water
Average monthly expenditure on domestic water per HH
$31 $31
Bottled water
Water Trucking
Natural Spring
Well
Tap water
Other natural sources
Drinking Domestic
100%
50%
0%
Drinking Domestic
Electricity
REACH Informingmore effectivehumanitarian action
Job shortages
2+1+2+4+65+24+2+t 7+3+4+10+46+24+6+t43+36+12+3+4+2+t
5+77+18+t
17+46+13+10+4+7t
3+80+17+t
51+5+23+17+2+3 2+5+51+22+2+19 44+3+38+9+3+3 2+4+63+14+2+16
60+68+47+71+70+68cx+1+1+1+1+1+1
Population groups covered: Lebanese, Syrian, PRL, PRS | Average HH size: 6 | Cadastre Population: 197361 | Lebanese living under US$4: 76898 | Syrian Refugees: 33599
Sample Information: Number of Interviews: 1101 | Number of Male interviewed: 419 | Number of female interviewed: 682 | Age Range: 12-82 | Data collected between October 2014 - February 2015
!
!
!
!
!
!
!
!
!!
!
!
!
!
!
!
!
!
!
!
!!
Sour
Saida
Jezzine
El Nabatieh
Bent Jbayl
Chouf
Marjaayoun
Hasbaiya
West Bekaa
Assessed Villages
Host CommunitiesMale Female
DisplacedMale Female
EmploymentHealthElectricityRoadsDrinking WaterEducationWaste Water MgmtDomestic WaterWinterisationSecurityShelterSolid Waste MgmtFoodNFIsOtherTransportHygiene ItemsRegistration
0%1%1%3%1%1%3%2%4%5%4%6%8%9%
18%16%19%
0%2%2%4%1%3%2%3%2%4%5%7%5%
13%17%10%21%
1%1%0%0%6%9%0%
10%1%
17%2%1%
13%4%1%7%
12%15%
1%0%0%0%
10%7%0%
11%1%
18%2%1%
10%6%1%7%6%
19%
17+46+13+10+4+3+7+t
GOVERNORATE PROFILES

Host DisplacedHost Displaced
Children and Women
respondents reported cases of unregistered births5% 16%
of respondents heard of cases of abuse, exploitation or sexual violence in last 6 months
of respondents know of services available for women and children atrisk or survivors of violence, abuse or exploitation
1%3%
Vulnerable population groups living within community
Separated women
Widowed women
Unaccompanied children minors
Pregnant women
Girls married before 18
Reasons why women may not be participating in the labor force
Safety concerns No prior work experience
Household responsibilities Household responsibilities
Traditional values/customs Traditional values/customs
Main activities for out of school boys under 18
Begging Other
Informal employment Informal employment
Household chores/Child care Household chores/Child care
Main activities for out of school girls under 18
Other Other
Household chores/Child care Household chores/Child care
Informal employment Informal employment
Population groups engaged in income generation
Male adolescents (12-17) Male adolescents (12-17)
Men (18+) Men (18+)
Women (18+) Women (18+)
Education
reported there are no non-formal education opportunities
of caregivers reported children enrolled 2013-1434%73%
of caregivers reported children enrolled 2014-1531%72%
adolescents were enrolled 2013-1425%88%
adolescents are enrolled 2014-1586%23%
Top reported challenges in accessing education
No affordable transportation No affordable transportation
Cost of school supplies Cost of school fees
Cost of school fees Cost of school supplies
In the last 3 months
of respondents reported noticeable excess refuse/garbage
of respondents reported noticeable presence of flies, rodents, and insects
Public collection
Main type of solid waste disposal
Solid Waste Management
Wastewater Management
reported flooding in immediate surroundings24% 22%
of respondents HH have access to showering and washing facilities93%100%
Main wastewater systems
Open air/Pit latrines
None
Public networkPrivate collection
Types of toiletsTraditional pit
No toilet in home
Flush
Open air
Improved pit Non-formal education opportunities74%70%
Public collection
Cases of abuses and services
37% 33%
33% 33%
Out of 195 caregivers
Orphans
25% 11%
38%
3%
12%
38%
18% 21%
28%
7%
3%
21%
10% 2%
Governorate ProfileSouth May 2015
Out of 195 caregivers
Out of 130 adolescents
Out of 130 adolescents
Out of 304 caregivers
Out of 304 caregivers
Out of 146 adolescents
Out of 146 adolescents
Reported flooding or presence of stagnant water within community in the last 12 months
Refuse/garbage
Presence of pests
Access to showering and washing facilities
Birth registration
Health
Top 3 challenges in accessing health services
No affordable transportation No affordable transportation
Cost of medicines/medication Cost of medicines/medication
Cost of health services Cost of health services
Most commonly reported child illnessesAcute respiratory diseases Diarrhea
Diarrhea Acute respiratory diseases
Other stomach ailments Other stomach ailments
took their children to be vaccinated in polio campaign 78%78%
Fear of vaccines
Mistrust campaign
Not aware
Already vaccinated
Distance to site
No need for vaccine
Cost
No documents
Reasons for not participating in polio campaigns
Participated in polio campaigns in last 3 months
Average reported proportion of
REACH Informingmore effectivehumanitarian action
Other
1+67+32+t9+86+5+t
5+63+32+t39+56+3+2+t
86+14+t 86+14+t
GOVERNORATE PROFILES

Defining Communitiy Vulnerability in Lebanon – September 2014 - February 2015
109
ANNEX III: LIST OF COMMUNITIES AND INTERVIEWS COMPLETED UNDER PHASE 2B DATA COLLECTION
A full list of community profiles is available for each of the communities assessed.
Akkar
District Cadastre Pcode Village /
Neighbourhood
Host community respondents Displaced community respondents
Total Lebanese PRL Syrian PRS Lebanese
returnees Iraqi
Male Female Male Female Male Female Male Female Male Female Male Female
Akkar
Aakkar El-Aatiqa LBN51004 Aaklar El Attiqa 14 24 0 0 12 20 0 0 0 0 0 0 70
Aamayer LBN51252 Wadi Khaled 12 22 0 0 13 20 0 0 0 0 0 0 67
Aandqet LBN51007 Andqat 14 20 0 0 12 20 0 0 0 0 0 0 66
Aarqa LBN51012 Aarqa 12 20 0 0 12 20 0 0 0 0 0 0 64
Bebnine LBN51026 Bebnine 12 20 0 0 12 20 0 0 0 0 0 0 64
berqayel LBN51038 Berqayel 12 20 0 0 12 20 0 0 0 0 0 0 64
Bezbina LBN51039 Bezbina 13 21 0 0 12 20 0 0 0 0 0 0 66
Biret Aakkar LBN51040 Bire 12 20 0 0 12 20 0 0 0 0 0 0 64
Chaqdouf LBN51272 Chaqdouf 12 20 0 0 7 0 0 0 0 0 0 0 39
Chir Hmairine LBN51273 Cheikh Aayash 12 24 0 0 12 21 0 0 0 0 0 0 69
Darine LBN51057 Darine 12 20 0 0 12 21 0 0 0 0 0 0 65
Deir Dalloum LBN51041 Borj el Arab 12 21 0 0 12 20 0 0 0 0 0 0 65
Fnaydeq LBN51130 Fnaideq 15 19 0 0 12 20 0 0 0 0 0 0 66
Halba LBN51137 Halba 13 20 0 0 13 23 0 0 0 0 0 0 69
Hayssa LBN51036 Bellanet el Hissa 12 20 0 0 12 20 0 0 0 0 0 0 64
Hrar LBN51152 Hrar 11 20 0 0 16 20 0 0 0 0 0 0 67
Khirbet Daoud Aakkar LBN51168 Khirbet Daoud 12 20 0 0 12 20 0 0 0 0 0 0 64
Khreibet Ej-Jindi LBN51176 Kousha 13 19 0 0 12 21 0 0 0 0 0 0 65
Kouachra LBN51294 Kawashra 12 19 0 0 12 21 0 0 0 0 0 0 64
Machha LBN51178 Machha 12 20 0 0 12 21 0 0 0 0 0 0 65
Machta Hammoud LBN51195 Mqaible 16 29 0 0 15 21 0 0 0 1 0 0 82
Mazareaa Jabal Akroum LBN51019 Akroum 12 20 0 0 12 20 0 0 0 0 0 0 64

Defining Communitiy Vulnerability in Lebanon – September 2014 - February 2015
110
District Cadastre Pcode Village /
Neighbourhood
Host community respondents Displaced community respondents
Total Lebanese PRL Syrian PRS Lebanese
returnees Iraqi
Male Female Male Female Male Female Male Female Male Female Male Female
Mazraat En-Nahriyé LBN51002 Aaidamoun 12 20 0 0 12 20 0 0 0 0 0 0 64
Michmich Aakkar LBN51193 Mechmech 14 25 0 0 12 20 0 0 0 0 0 0 71
Minyara LBN51308 Minyara 13 21 0 0 12 20 0 0 0 0 0 0 66
Ouadi El-Jamous LBN51208 Ouadi Ej jamous 12 20 0 0 16 20 0 0 0 0 0 0 68
Qabaait LBN51043 Bzaita 12 20 0 0 0 0 0 0 0 0 0 0 32
Qbaiyat Aakkar LBN51054 Dahr El Ballane 13 21 0 0 12 20 0 0 0 0 0 0 66
Qleiaat Aakkar LBN51111 El Qlaiaat 12 20 0 0 12 20 0 0 0 0 0 0 64
Qoubber Chamra LBN51223 Qoubbet Chamra 12 22 0 0 12 20 0 0 0 0 0 0 66
Rahbé LBN51224 Rahbe 13 19 0 0 0 0 0 0 0 0 0 0 32
Sindianet Zeidane LBN51238 Sindianet Zeidane 12 20 0 0 12 20 0 0 0 0 0 0 64
Tall Aabbas El-Gharbi LBN51245
Tall Aabbas el
Gharbi 12 20 0 0 13 21 0 0 0 0 0 0 66
Tall Meaayan Tall Kiri LBN51332 Tal Meaayan 12 20 0 0 13 19 0 0 0 0 0 0 64
Tikrit LBN51251 Takrit 13 29 0 0 12 20 0 0 0 0 0 0 74
Tleil LBN51127 Tleil 12 20 0 0 12 20 0 0 0 0 0 0 64
Grand Total 451 755 0 0 418 669 0 0 0 1 0 0 2294

Defining Communitiy Vulnerability in Lebanon – September 2014 - February 2015
111
Beirut and Mount Lebanon
District Cadastre Pcode Village /
Neighbourhood
Host community respondents Displaced community respondents
Total Lebanese PRL Syrian PRS Lebanese
returnees Iraqi
Male Female Male Female Male Female Male Female Male Female Male Female
Aley
Aaley LBN31002 Aaley ej Jdide 12 20 0 0 12 21 0 0 0 0 0 0 65
Aaramoun Aaley LBN31091 Mounsa Aaley 12 20 0 0 12 20 0 0 0 0 0 0 64
Bayssour Aaley LBN31024 Baissour 12 20 0 0 12 20 0 0 0 0 0 0 64
Bchamoun LBN31025 Bchamoun 12 20 0 0 13 19 0 0 0 0 0 0 64
Choueifat El-Aamrousiyé LBN31003 Aamroussieh
Choueifat 12 20 0 0 11 25 0 0 0 0 0 0 68
Choueifat El-Quoubbé LBN31096 Qoubbe Choueifat 12 20 0 0 13 19 0 0 0 0 0 0 64
Mansouriyet Bhamdoun LBN31083 Mansouriye et Ain el
Marj 13 21 0 0 12 20 0 0 0 0 0 0 66
Baabda
Baabda LBN320009 Baabda 12 20 0 0 11 20 0 0 0 0 1 0 64
Furn Ech-Chebbak LBN320048 Furn ech Chebak 18 21 0 0 12 20 0 0 0 0 0 0 71
Hadath Beyrouth LBN320050 Hadet 12 20 0 0 12 22 0 0 0 0 0 0 66
Hammana LBN320051 Hammana 13 20 0 0 12 20 0 0 0 0 0 0 65
Kfar Chima LBN320068 Kfarchima 12 20 0 0 12 20 0 0 0 0 0 0 64
Beirut
Achrafieh foncière LBN11017 El Ghabe 13 20 0 0 12 20 0 0 0 0 0 0 65
Bachoura foncière LBN11006 Bachoura 15 20 0 0 12 20 0 0 0 0 0 0 67
Mazraa foncière LBN11054 Tariq El Jdide 13 21 0 0 11 20 0 0 0 0 0 0 65
Msaitbé foncière LBN11040 Moussaitbe 12 20 0 0 12 20 0 0 0 0 0 0 64
Ras Beyrouth foncière LBN11020 El Manara 12 20 0 0 12 20 0 0 0 0 0 0 64
Zqaq el-Blat foncière LBN11058 Zoqaq el Blat 13 21 0 0 12 23 0 0 0 0 0 0 69
Chouf
Aalmane Ech-Chouf LBN33001 Aalmane Ech Chouf 14 20 0 0 12 26 0 0 0 0 0 0 72
Baaqline LBN33080 El Qachaya 12 19 0 0 12 22 0 0 0 0 0 0 65
Barja LBN33024 Barja 12 20 0 1 13 24 0 0 0 0 0 0 70
Chhim LBN33045 Chhime 12 22 0 1 12 23 0 0 0 0 0 0 70
Damour LBN33182 Saadiyat 12 20 0 0 12 20 0 0 0 0 0 0 64
Daraiya Ech-Chouf LBN33056 Daraiya 12 20 0 0 12 20 0 0 0 0 0 0 64

Defining Communitiy Vulnerability in Lebanon – September 2014 - February 2015
112
District Cadastre Pcode Village /
Neighbourhood
Host community respondents Displaced community respondents
Total Lebanese PRL Syrian PRS Lebanese
returnees Iraqi
Male Female Male Female Male Female Male Female Male Female Male Female
Jdeidet Ech-Chouf LBN33036 Boqaata 12 23 0 0 12 17 0 0 0 0 0 0 64
Jiyé LBN33109 Jiye 12 20 0 1 12 20 0 0 0 0 0 0 65
Ketermaya LBN33113 Ketermaya 12 20 0 0 12 20 0 0 0 0 0 0 64
Mazboud LBN33141 Mazboud 13 18 0 2 12 20 0 0 0 0 0 0 65
Naamé LBN33163 Naame 13 19 1 1 12 19 0 1 0 0 0 0 66
Rmeilet Ech-Chouf LBN33181 Rmaile 12 19 0 1 11 21 0 0 0 0 0 0 64
Sibline LBN33187 Sibline 13 16 0 4 12 9 0 11 0 0 0 0 65
El Metn
Antelias LBN36105 Antelias 12 20 0 0 13 19 0 0 0 0 0 1 65
Baouchriyé LBN36170 Sad el Baouchriye 12 20 0 0 10 18 0 0 0 0 2 3 65
Bourj Hammoud LBN36040 Borj Hammoud 12 20 0 0 12 22 0 0 0 0 0 0 66
Broummana El-Matn LBN36042 Broumana 13 20 0 0 15 19 0 0 0 0 0 0 67
Dekouané LBN36069 Deir-er-Raai es
Saleh 15 20 0 0 11 19 0 0 0 0 1 1 67
Fanar LBN36091 Fanar 11 20 0 0 16 22 0 0 0 0 0 0 69
Jall Ed-Did LBN36106 Jall Ed Dib 13 19 0 0 12 23 0 0 0 0 0 0 67
Jdaidet El-Matn LBN36107 Jdaide 12 20 0 0 12 18 0 0 0 0 0 2 64
Mansouriyet El-Matn LBN36123 Mansouriye 12 20 0 0 18 20 0 0 0 0 0 0 70
Sinn El-Fil LBN36108 Jisr El Bacha 12 24 0 0 12 20 0 0 0 0 0 0 68
Zalqa LBN36005 Aaqbe 12 21 0 0 11 20 0 0 0 0 1 0 65
Jbeil Aamchit LBN34006 Aamchit 11 21 0 0 13 20 0 0 0 0 0 0 65
Jbayl LBN34120 Jbail 12 20 0 0 12 19 0 0 0 0 0 1 64
Kesrwane
Ghazir LBN35091 Ghazir 12 20 0 0 13 20 0 0 0 0 0 0 65
Jounie Ghadir LBN35089 Ghadir 14 19 0 0 11 19 0 0 0 0 1 0 64
Jounié Sarba LBN35166 Sarba 13 20 0 0 12 22 0 0 0 0 1 0 68
Zouk Mkayel LBN35179 Zouq Mkayel 11 25 0 0 15 13 0 0 0 0 0 0 64
Zouk Mousbeh LBN35010 Adonis Kesserwan 12 19 0 0 10 27 0 0 0 0 0 0 68
Grand Total 1376 2235 4 11 1343 2218 3 19 0 2 7 8 7226

Defining Communitiy Vulnerability in Lebanon – September 2014 - February 2015
113
Bekaa
District Cadastre Pcode Village /
Neighbourhood
Host community respondents Displaced community respondents
Total Lebanese PRL Syrian PRS Lebanese
returnees Iraqi
Male Female Male Female Male Female Male Female Male Female Male Female
Baalbek
Aain Baalbek LBN21035 El Ain 12 20 0 0 12 20 0 0 0 0 0 0 64
Baalbek LBN21010 Baalbek 12 22 0 0 11 20 0 0 0 0 0 0 65
Bouday LBN21060 Hfayer 12 20 0 0 12 20 0 0 0 0 0 0 64
Brital LBN21023 Britel 13 19 0 0 12 20 0 0 0 0 0 0 64
Chaat LBN21026 Chaat 12 20 0 0 12 20 0 0 0 0 0 0 64
Chmistar LBN21028 Chmistar 12 20 0 0 12 20 0 0 0 0 0 0 64
Deir El-Ahmar LBN21031 Deir El Ahmar 12 20 0 0 11 21 0 0 0 0 0 0 64
Douris LBN21033 Douris 13 22 0 0 11 20 0 0 0 0 0 0 66
Fekehe LBN21043 Fakehe 12 20 0 0 12 20 0 0 0 0 0 0 64
Hadath Baalbek LBN21088 Masnaa es Zohr 17 22 0 0 13 19 0 0 0 0 0 0 71
Haouch Er-Rafqa LBN21063 Houch Er Rafqa 12 18 0 0 14 20 0 0 0 0 0 0 64
Iaat LBN21064 Iaat 12 21 0 0 12 20 0 0 0 0 0 0 65
Laboué LBN21082 Laboue 12 20 0 0 14 21 0 0 0 0 0 0 67
Nabi Chit LBN21128 Nabi Chit 12 20 0 0 4 19 0 0 0 0 0 0 55
Qaa Baalbek LBN21135 El Qaa 11 18 0 0 6 7 0 0 0 0 0 0 42
Qsarnaba LBN21141 Qsarnaba 13 19 0 0 12 20 0 0 0 0 0 0 64
Ras Baalbek Es-Sahel LBN21144 Ras Baalbek 12 20 0 0 12 20 0 0 0 0 0 0 64
Serraaine Et-Tahta LBN21150 Saraain el Faouqa 12 21 0 0 12 19 0 0 0 0 0 0 64
Taibet Baalbek LBN21156 Taibe 12 20 0 0 12 20 0 0 0 0 0 0 64
Talia LBN21157 Talia 11 21 0 0 13 20 0 0 0 0 0 0 65
Taraiya LBN21162 Taraiya 12 20 0 0 12 20 0 0 0 0 0 0 64
Temnine El-Faouqa LBN21161 Tamnine El Faouqa 12 21 0 0 13 21 0 1 0 0 0 0 68
Temnine Et-Tahta LBN21160 Tammine et Tahta 11 19 0 0 14 21 0 0 0 0 0 0 65
Youmine LBN21167 Younine 11 15 0 0 3 6 0 0 0 0 0 0 35
El Hermel Hermel LBN22015 Bouaida 12 20 0 0 12 20 0 0 0 0 0 0 64
Rachaya
Dahr El-Ahmar LBN23013 Dahr el Ahmar 12 20 0 0 12 20 0 0 0 0 0 0 64
Khirbet Rouha LBN23025 Khirbet Rouha 12 20 0 0 12 20 0 0 0 0 0 0 64
Rachaiya LBN23038 Rachaiya 14 21 0 0 12 20 0 0 0 0 0 0 67
Rafid Rachaiya LBN23039 Rafid 14 20 0 0 12 20 0 0 0 0 0 0 66
Ghazzé LBN24015 Ghazze 12 21 0 0 12 19 0 0 0 0 0 0 64

Defining Communitiy Vulnerability in Lebanon – September 2014 - February 2015
114
District Cadastre Pcode Village /
Neighbourhood
Host community respondents Displaced community respondents
Total Lebanese PRL Syrian PRS Lebanese
returnees Iraqi
Male Female Male Female Male Female Male Female Male Female Male Female
West Bekaa
Haouch El-Harime LBN24017 Houch el Harime 12 20 0 0 13 20 0 0 0 0 0 0 65
Joubb Jannine LBN24020 Joub Jannine 12 20 0 0 12 20 0 0 0 0 0 0 64
Kamed El-Laouz LBN24022 Kamed el Laouz 12 20 0 0 12 19 0 1 0 0 0 0 64
Kfar Denis LBN23022 Kfar Danis 12 21 0 0 12 19 0 0 0 0 0 0 64
Khirbet Qanafar LBN24025 Khirbet Qanafar 12 20 0 0 12 20 0 0 0 0 0 0 64
Lala LBN24026 Lala 11 22 0 0 10 21 0 0 0 0 0 0 64
Manara (Hammara) BG LBN24030 Hammara 12 20 0 0 12 19 0 1 0 0 0 0 64
Mansoura BG LBN24031 Mansoura 12 19 0 0 13 20 0 0 0 0 0 0 64
Marj BG LBN24013 El Marj 13 20 0 0 11 19 2 0 0 0 0 0 65
Qaraaoun LBN24034 Qaraoun 12 20 0 0 12 20 0 0 0 0 0 0 64
Souairi LBN24038 Souairi 12 22 0 0 13 19 0 0 0 0 0 0 66
Zahle
Aali En-Nahri LBN25001 Aali en Nahri 12 21 0 0 12 20 0 0 0 0 0 0 65
Aanjar (Haouch Moussa) LBN25002 Haouch Moussa Anjar
14 20 1 0 12 19 0 1 0 0 0 0 67
Ablah LBN25003 Ablah 16 20 0 0 12 20 0 0 0 0 0 0 68
Barr Elias LBN25006 Bar Elias 11 22 2 0 12 19 0 1 0 0 0 0 67
Chtaura LBN25012 Chtaura 14 22 0 0 12 20 0 0 0 0 0 0 68
Dalhamiyet Zahlé LBN25016 Dalhamiye 13 19 0 0 12 20 0 0 0 0 0 0 64
Fourzol LBN25022 Fourzol 13 20 0 0 12 20 0 0 0 0 0 0 65
Jdita LBN25034 Jdita 13 17 0 0 18 20 0 0 0 1 0 0 69
Kfarzabad LBN25037 Kfar Zabad 13 21 0 0 12 20 0 0 0 0 0 0 66
Majdel Aanjar LBN25042 Majdel Anjar 12 21 0 0 12 20 0 0 0 0 0 0 65
Maksé LBN25047 Meksi 12 20 0 0 13 20 0 0 0 0 0 0 65
Qabb Elias LBN25057 Qabb Elias 0 0 0 0 12 20 0 0 0 0 0 0 32
Raait LBN25061 Raite 12 20 0 0 12 20 0 0 0 0 0 0 64
Riyaq LBN25064 Rayak 12 20 0 0 11 21 0 0 0 0 0 0 64
Saadnayel LBN25065 Saadnayel 12 20 0 0 11 22 1 0 0 0 0 0 66
Taalbaya LBN25067 Taalabaya 12 20 0 0 11 19 0 2 0 0 0 0 64
Taanayel LBN25068 Taanayel 12 20 0 0 12 20 0 0 0 0 0 0 64
Terbol Zahlé LBN25072 Terbol 12 20 0 0 12 20 0 0 0 0 0 0 64
Zahlé Aradi LBN25027 Haouch el Oumara Aradi
12 20 0 0 12 20 0 0 0 1 0 0 65
Zahlé El-Maallaqa LBN25036 Karak Nouh 13 20 0 0 13 19 0 0 0 0 0 0 65
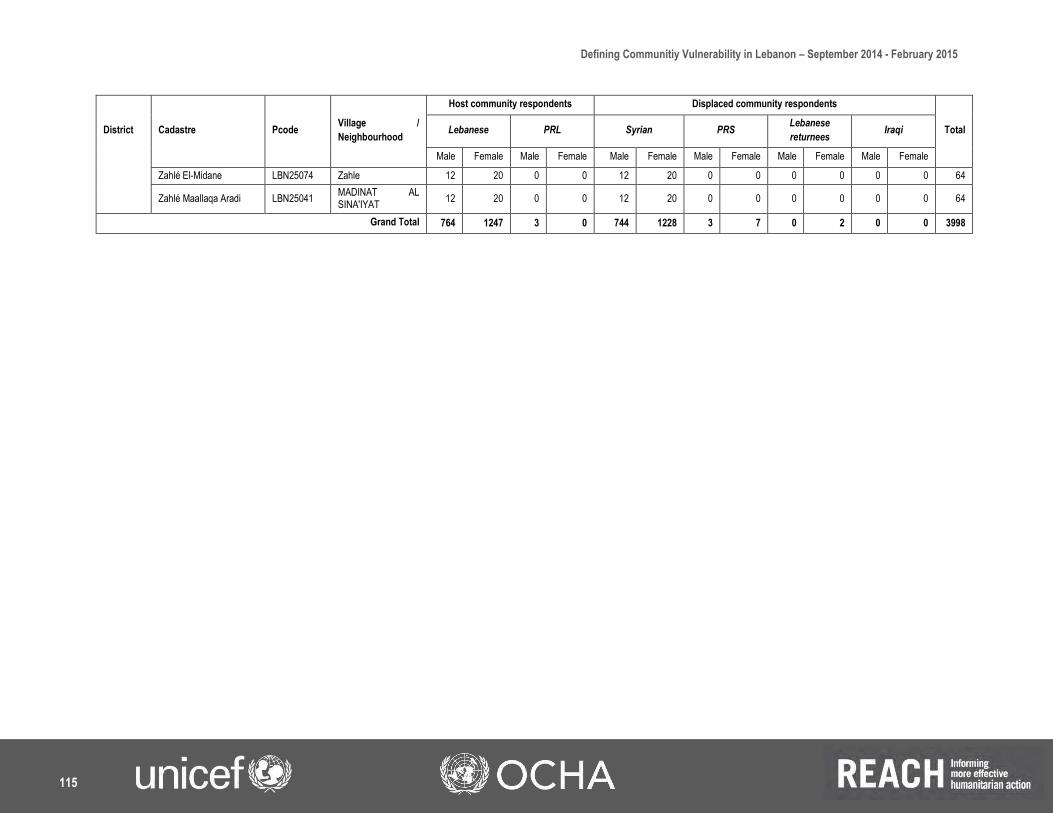
Defining Communitiy Vulnerability in Lebanon – September 2014 - February 2015
115
District Cadastre Pcode Village /
Neighbourhood
Host community respondents Displaced community respondents
Total Lebanese PRL Syrian PRS Lebanese
returnees Iraqi
Male Female Male Female Male Female Male Female Male Female Male Female
Zahlé El-Midane LBN25074 Zahle 12 20 0 0 12 20 0 0 0 0 0 0 64
Zahlé Maallaqa Aradi LBN25041 MADINAT AL SINA'IYAT
12 20 0 0 12 20 0 0 0 0 0 0 64
Grand Total 764 1247 3 0 744 1228 3 7 0 2 0 0 3998

Defining Communitiy Vulnerability in Lebanon – September 2014 - February 2015
116
South
District Cadastre Pcode Village /
Neighbourhood
Host community respondents Displaced community respondents
Total Lebanese PRL Syrian PRS Lebanese
returnees Iraqi
Male Female Male Female Male Female Male Female Male Female Male Female
Hasbaya Chebaa LBN42008 Chebaa 12 20 0 0 12 20 0 0 0 0 0 0 64
Hasbaiya LBN42017 Hasbaiya 12 20 0 0 13 19 0 0 0 0 0 0 64
Jezzine Jezzine LBN62049 Jezzine 12 20 0 0 12 20 0 0 0 0 0 0 64
Saida
Aadloun LBN61003 Aadloun 12 20 0 0 12 20 0 0 0 0 0 0 64
Aanqoun LBN61004 Aanqoun 12 22 0 0 12 20 0 0 0 0 0 0 66
Babliyé LBN61013 Babliyeh 9 7 0 0 5 9 0 0 0 0 0 0 30
Darb Es-Sim LBN61021 Darb es Sim 11 20 1 0 14 22 0 0 0 0 0 0 68
Hlaliyé Saida LBN61034 Hlaliye 12 19 2 3 12 20 0 0 0 0 0 0 68
Kfar Hatta Saida LBN61045 Kfar Hatta 10 6 0 0 12 21 0 0 0 0 0 0 49
Maghdouché LBN61057 Maghdouche 11 21 0 0 13 23 0 0 0 0 0 0 68
Miyé ou Miyé LBN61010 Ain el Hiloue 0 0 12 20 0 0 12 20 0 0 0 0 64
Zrariye LBN61109 Zrariye 1 0 0 0 0 0 0 0 0 0 0 0 1
Sour
Aabbassiyet Sour LBN63001 Aabbassiye 0 0 0 0 12 20 0 0 0 0 0 0 32
Aain Baal LBN63009 Ain Baal 12 21 0 0 13 21 0 0 0 0 0 0 67
Borj Ech-Chemali LBN63018 Borj ech Chmali 0 0 12 20 1 0 12 19 0 0 0 0 64
Chehabiyé LBN63032 Chehabiye 12 21 0 0 11 20 0 0 0 0 0 0 64
Maaraké LBN63066 Maarake 12 20 0 0 12 20 0 0 0 0 0 0 64
Mheilib LBN63023 Bourghliye 13 20 0 0 10 19 2 1 0 0 0 0 65
Qana LBN63089 Qana 12 20 0 0 12 21 0 0 0 0 0 0 65
Sour LBN63092 Rachidiye 0 0 13 20 4 6 8 15 0 0 1 0 67
Srifa LBN63102 Srifa 1 4 0 0 1 1 0 0 0 0 0 0 7
Tayr Debbé LBN63104 Tair Debba 12 19 0 1 11 18 1 2 0 0 0 0 64
Grand Total 639 1055 40 64 622 1009 35 57 0 1 1 0 3523

Defining Communitiy Vulnerability in Lebanon – September 2014 - February 2015
117
Tripoli T5
District Cadastre Pcode Village /
Neighbourhood
Host community respondents Displaced community respondents
Total Lebanese PRL Syrian PRS Lebanese
returnees Iraqi
Male Female Male Female Male Female Male Female Male Female Male Female
Batroun
Batroun LBN52013 Batroun 13 19 0 0 12 20 0 0 0 0 0 0 64
Chikka LBN52026 Chekka 12 20 0 0 12 20 0 0 0 0 0 0 64
Kfar Aabida LBN52075 Kfar Aabida 12 21 0 0 12 20 0 0 0 0 0 0 65
Bcharre Bcharré LBN53006 Bcharre 12 20 0 0 12 20 0 0 0 0 0 0 64
El Koura
Ain Aakrine LBN54003 Ain Aakrine 12 20 0 0 13 20 0 0 0 0 0 0 65
Deddé LBN54025 Dedde 13 20 0 0 12 20 0 0 0 0 0 0 65
Enfé LBN54031 Enfe 12 21 0 0 12 20 0 0 0 0 0 0 65
Kfar Aaqqa LBN54037 Kfar Aaqqa 12 20 0 0 12 20 0 0 0 0 0 0 64
Kousba LBN54044 Kousba 12 19 0 0 12 21 0 0 0 0 0 0 64
Ras Masqa LBN54022 Dahr AlAin 12 20 0 0 12 20 0 0 0 0 0 0 64
El Mineh Dennieh
Aassoun LBN55005 Aassoun 13 20 0 0 12 21 0 0 0 0 0 0 66
Bakhaaoun LBN55016 Bechtayel 13 20 0 0 12 20 0 0 0 0 0 0 65
Beddaoui LBN55040 El Beddaoui 12 20 0 0 12 20 0 0 0 0 0 0 64
Bqaa Sefrine LBN55029 Bqaa Safrin 12 21 0 0 12 20 0 0 0 0 0 0 65
Deir Aammar LBN55037 Deir Amar 12 20 0 0 12 20 0 0 0 0 0 0 64
Izal LBN55058 Izal 12 20 0 0 12 20 0 0 0 0 0 0 64
Kfar Habou LBN55067 Kfar Habou 12 21 0 0 12 21 0 0 0 0 0 0 66
Minie LBN55045 El Minie 12 21 0 0 12 20 0 0 0 0 0 0 65
Sfiré LBN55052 Sfire 12 20 0 0 12 20 0 0 0 0 0 0 64
Sir Ed-Danniyé LBN55083 Sir Ed Danniye 16 20 0 0 12 19 0 0 0 0 0 0 67
Zouq Bhannine LBN55027 Bhannine 12 20 0 0 12 20 0 0 0 0 0 0 64
Tripoli
Mejdlaiya Zgharta LBN56022 Fouwar 13 20 0 0 11 20 0 0 0 0 0 0 64
Mhammaret LBN56026 Mhamra 12 20 0 0 12 20 0 0 0 0 0 0 64
Mina Jardin LBN56008 Mina Jardin 12 19 0 0 12 21 0 0 0 0 0 0 64
Mina N:3 LBN56002 El Mina 12 20 0 0 16 19 0 0 0 0 0 0 67
Qalamoun LBN56003 Qalamoun 13 20 0 0 12 21 0 0 0 0 0 0 66
Trablous El-Haddadine LBN56019 Bab Al Ramel 12 20 0 0 13 20 0 0 0 0 0 0 65
Trablous El-Qobbe LBN56010 Qoubbe 13 20 0 0 11 20 0 0 0 0 0 0 64
Trablous et Tabbaneh LBN56012 Tabbaneh 12 20 0 0 12 20 0 0 0 0 0 0 64
Trablous Et-Tell LBN56013 Tal 12 20 0 0 12 23 0 0 0 0 0 0 67

Defining Communitiy Vulnerability in Lebanon – September 2014 - February 2015
118
District Cadastre Pcode Village /
Neighbourhood
Host community respondents Displaced community respondents
Total Lebanese PRL Syrian PRS Lebanese
returnees Iraqi
Male Female Male Female Male Female Male Female Male Female Male Female
Trablous Ez-Zahrieh LBN56017 Zahrieh 12 22 0 0 12 20 0 0 0 0 0 0 66
Trablous Ez-Zeitoun LBN56027 Shok 12 20 0 0 12 21 0 0 0 0 0 0 65
Trablous jardins LBN56021 Dam Wal Farz 14 20 0 0 13 20 0 0 0 0 0 0 67
Zgharta
Arde LBN57010 Arde 12 21 0 0 12 20 0 0 0 0 0 0 65
Miriata LBN57066 Miryata 12 20 1 0 13 21 0 0 0 0 0 0 67
Miziara LBN57067 Miziara 12 21 0 0 0 0 0 0 0 0 0 0 33
Zgharta LBN57077 Zgharta 12 17 0 0 12 24 0 0 0 0 0 0 65
Grand Total 457 743 1 0 438 732 0 0 0 0 0 0 2371

Defining Communitiy Vulnerability in Lebanon – September 2014 - February 2015
119
ANNEX IV: PHASE 2A FOCUS GROUP DISCUSSION TOOL FOCUS GROUP
DISCUSSION QUESTIONNAIRE
Hello, my name is ________, and this is my colleague, _________. We work for REACH, an international
organisation that conducts assessments to inform humanitarian and development planning. The purpose of this
session is to understand how general conditions in your village/neighbourhood have changed and what – if anything
– makes your community and its residents feel vulnerable. We hope that the results from these sessions will help
humanitarian actors to make informed decisions about vulnerabilities, needs and priorities within your community.
Rules and comments:
- Respect all opinions and responses. We encourage all of you to participate and voice your opinions. Please listen to one another and voice disagreements respectfully and politely.
- Only one at a time. We want to make sure everyone is heard and the discussion is organised. Therefore, we ask you to respect the person who is speaking and wait for them to finish speaking.
- The discussion is anonymous and confidential. Though we collect your names and contact information, this will be kept in our records only in case we need to clarify something you said. We will record this conversation but it is only to ensure that our notes of the discussion are accurate.
Date
Facilitator Note Taker
Village/Neighbourhood
Population Group ☐Host community male respondents (18+ years)
☐Host community female respondents (18+ years)
☐Host community male adolescents (12-17 years)
☐Host community female adolescents (12-17 years)
☐Displaced male respondents (18+ years)
☐Displaced female respondents (18+ years)
☐Displaced male adolescents (12-17 years)
☐Displaced female adolescents (12-17 years)
Nationality ☐Lebanese ☐Palestinian refugee from Lebanon
☐Syrian ☐Palestinian refugee from Syria
☐Lebanese returnee ☐Other: ______________________
Participants Names &
Age

Defining Communitiy Vulnerability in Lebanon – September 2014 - February 2015
120
1) How long have you been residing in this village/neighbourhood?
For host community: If less than 3 years, where did you move to this community from? For displaced groups: Where did you move to this community from?
2) Have there been any changes in the population size in the last 6 months? In the last 3 years (host
community only)?
a. If yes, what types of changes have there been? Has there been an increase/decrease? b. If yes, who has been moving into/away from the village/neighbourhood? c. If yes, what was their purpose for moving here/away?
3) Have there been any changes in the level of poverty within your village/neighbourhood in the last 6 months?
In the last 3 years (host community only)?
a. How has it changed? b. What do you think is the main reason for this change? c. Which groups do you think are most affected by these changes in poverty levels? (EX:
women, girls, boys, elderly.) How are they more affected?
4) Have there been changes in the cost of living in your village/neighbourhood in the last 6 months? In the last
3 years (host community only)?
a. Cost of basic food staples (bread, milk, rice and eggs) b. Cost of essential non-food items (bedding, kitchen items and gas) c. Cost of essential hygiene items (soap, cleaning detergents, sanitary pads and diapers) d. Are community members able to afford these materials and items (basic food, essential
NFIs and hygiene items) on a regular basis?
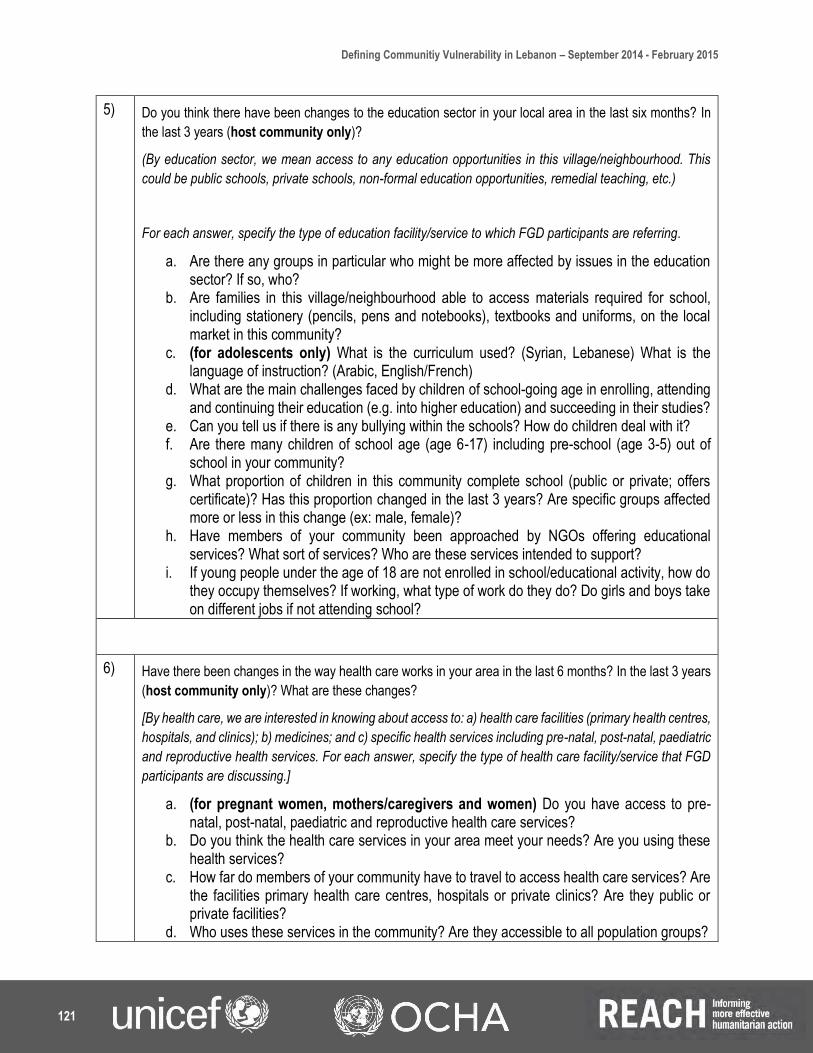
Defining Communitiy Vulnerability in Lebanon – September 2014 - February 2015
121
5) Do you think there have been changes to the education sector in your local area in the last six months? In
the last 3 years (host community only)?
(By education sector, we mean access to any education opportunities in this village/neighbourhood. This
could be public schools, private schools, non-formal education opportunities, remedial teaching, etc.)
For each answer, specify the type of education facility/service to which FGD participants are referring.
a. Are there any groups in particular who might be more affected by issues in the education sector? If so, who?
b. Are families in this village/neighbourhood able to access materials required for school, including stationery (pencils, pens and notebooks), textbooks and uniforms, on the local market in this community?
c. (for adolescents only) What is the curriculum used? (Syrian, Lebanese) What is the language of instruction? (Arabic, English/French)
d. What are the main challenges faced by children of school-going age in enrolling, attending and continuing their education (e.g. into higher education) and succeeding in their studies?
e. Can you tell us if there is any bullying within the schools? How do children deal with it? f. Are there many children of school age (age 6-17) including pre-school (age 3-5) out of
school in your community? g. What proportion of children in this community complete school (public or private; offers
certificate)? Has this proportion changed in the last 3 years? Are specific groups affected more or less in this change (ex: male, female)?
h. Have members of your community been approached by NGOs offering educational services? What sort of services? Who are these services intended to support?
i. If young people under the age of 18 are not enrolled in school/educational activity, how do they occupy themselves? If working, what type of work do they do? Do girls and boys take on different jobs if not attending school?
6) Have there been changes in the way health care works in your area in the last 6 months? In the last 3 years
(host community only)? What are these changes?
[By health care, we are interested in knowing about access to: a) health care facilities (primary health centres,
hospitals, and clinics); b) medicines; and c) specific health services including pre-natal, post-natal, paediatric
and reproductive health services. For each answer, specify the type of health care facility/service that FGD
participants are discussing.]
a. (for pregnant women, mothers/caregivers and women) Do you have access to pre-natal, post-natal, paediatric and reproductive health care services?
b. Do you think the health care services in your area meet your needs? Are you using these health services?
c. How far do members of your community have to travel to access health care services? Are the facilities primary health care centres, hospitals or private clinics? Are they public or private facilities?
d. Who uses these services in the community? Are they accessible to all population groups?
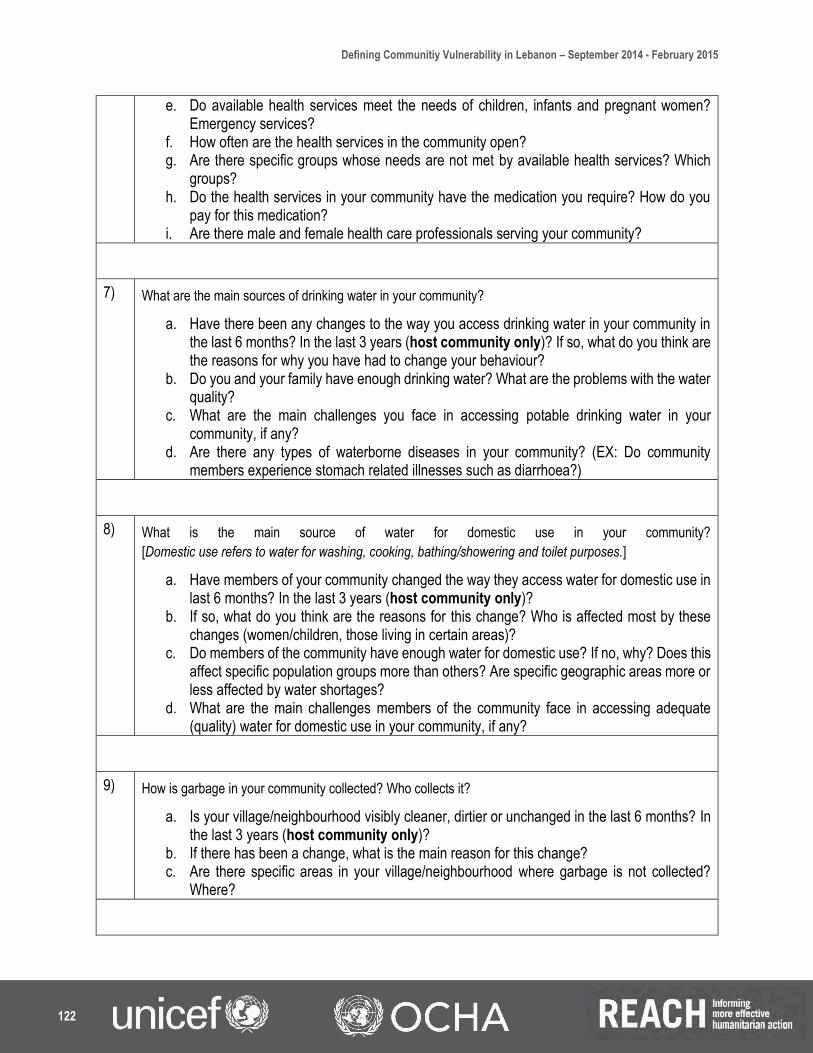
Defining Communitiy Vulnerability in Lebanon – September 2014 - February 2015
122
e. Do available health services meet the needs of children, infants and pregnant women? Emergency services?
f. How often are the health services in the community open? g. Are there specific groups whose needs are not met by available health services? Which
groups? h. Do the health services in your community have the medication you require? How do you
pay for this medication? i. Are there male and female health care professionals serving your community?
7) What are the main sources of drinking water in your community?
a. Have there been any changes to the way you access drinking water in your community in the last 6 months? In the last 3 years (host community only)? If so, what do you think are the reasons for why you have had to change your behaviour?
b. Do you and your family have enough drinking water? What are the problems with the water quality?
c. What are the main challenges you face in accessing potable drinking water in your community, if any?
d. Are there any types of waterborne diseases in your community? (EX: Do community members experience stomach related illnesses such as diarrhoea?)
8) What is the main source of water for domestic use in your community?
[Domestic use refers to water for washing, cooking, bathing/showering and toilet purposes.]
a. Have members of your community changed the way they access water for domestic use in last 6 months? In the last 3 years (host community only)?
b. If so, what do you think are the reasons for this change? Who is affected most by these changes (women/children, those living in certain areas)?
c. Do members of the community have enough water for domestic use? If no, why? Does this affect specific population groups more than others? Are specific geographic areas more or less affected by water shortages?
d. What are the main challenges members of the community face in accessing adequate (quality) water for domestic use in your community, if any?
9) How is garbage in your community collected? Who collects it?
a. Is your village/neighbourhood visibly cleaner, dirtier or unchanged in the last 6 months? In the last 3 years (host community only)?
b. If there has been a change, what is the main reason for this change? c. Are there specific areas in your village/neighbourhood where garbage is not collected?
Where?
Defining Communitiy Vulnerability in Lebanon – September 2014 - February 2015
123
10) What is the main system for wastewater disposal in your community?
a. Has your community experienced changes with how waste water has been managed in the last 6 months? In the last 3 years (host community only)?
b. If there has been a change, how has wastewater systems changed? c. If there has been a change, what is the main reason for this change? d. Are there specific areas in your community in which waste water disposal systems are
inadequate? e. Does everyone in your community have access to a toilet in their homes? Are there specific
types of homes/shelters that do not have toilets/latrines at home? f. Are there specific groups in your village/neighbourhood that do not have access to suitable
toilet facilities (e.g. girls, women)?
11) Are essential hygiene items such as soap, cleaning detergents, sanitary pads and diapers readily available
in your community? If not, why?
a. Where can these items be purchased? b. Who in your households usually purchases these hygiene items (e.g. men, women and
children)? How come these members usually purchase these items? c. Do any community members benefit from water, sanitation and hygiene services provided
by NGOs or other local organisations? If yes, how were people able to access this support? Are these services provided to specific groups or the entire community?
d. Are there any social or cultural beliefs in your community which might hinder people’s hygiene practices?
12) What sort of accommodations do people live in in your community?
a. Has the type of accommodation that residents live in in this community changed in the last 6 months? In the last 3 years (host community only)? If there has been a change, what has been the change in common types of accommodation?
b. Has the type of occupancy (rental furnished, rental unfurnished, purchasing land, etc.) changed in the last 6 months? In the last 3 years (host community only)? If there has been a change, what has been the change in common types of occupancy?
c. Does the existing availability of housing/shelter meet the needs of your community? d. Does the existing type of housing/accommodation provide adequate protection to your
family members? (EX: lockable doors, suitable toilet facilities for women/girls) e. What are the main challenges in accessing suitable and safe accommodation in this
community? Do some groups face more challenges in accessing suitable and safe accommodation here?
f. Are the majority of shelters weatherproof? If not, has there been any aid organisations trying to provide support to these households? Who do they provide support to exactly (specific population groups)?

Defining Communitiy Vulnerability in Lebanon – September 2014 - February 2015
124
13) What is the main source of electricity in your community? (EX: public network, generator)
a. Has the electricity supply in your community changed in last six months? In the last 3 years (host community only)?
b. Do you have enough electricity to meet your needs? c. What are the main challenges you face in accessing electricity in your community? d. Are there significant differences in electricity provision during the summer and winter
months?
14) What are the main sources of income for community residents?
a. Has your community experienced changes in the way people earn their living in the last 6 months? In the last 3 years (host community only)?
b. What has been the change in income generating activities among community residents? (Ex: potential change in wages, unemployment rates, different job opportunities/businesses in area)
c. How many members of your family work? Do men and women in your community engage in different types of income generating activities?
15) How do residents in this community feel about local government institutions? Differentiate between the
municipality, municipal unions and mukhtars.
a. How satisfied are you with local government institutions in providing basic services and public infrastructure within this village/neighbourhood?
b. What would make you more satisfied with local government authorities and officials in your community?
c. Are there any NGOs working in the area? If yes, what do they do? Tell us the name of the NGO(s).
16) Are there different religious or national groups living in this village/neighbourhood? If yes, do these different
groups interact with each other in your community? What types of interactions do they have (at the market,
at school, weddings/family occasions)?
a. Have all these groups been long-term residents in your community? If not, which groups are new? When did they arrive?
b. Do you think there is tension between different groups in your community? If yes, what are the main reasons for these tensions?
c. What do you think could be done to lower tensions within your community?
17) Have there been any incidents of tension and/or violence in your village/neighbourhood in the last 6 months?
In the last 3 years (host community only)?

Defining Communitiy Vulnerability in Lebanon – September 2014 - February 2015
125
Could include:
- Unrest (ex: Protests) - Crime (ex: vandalism, theft, drug use/selling, prostitution) - Verbal disagreements (shouting, yelling, harassment) - Physical violence (domestic violence, rape/sexual assault, targeted killings/murder, armed
violent incidents, fighting) - Bombings, shelling, abduction
(Specify type of incident that participants report.)
a. If yes, who was involved in these incidents of tension/violence? Specify the instigator (doer) and victim/target for each type of incident.
b. What do you think is the main reason for these incidents occurring?
18) What are the problems facing women in this community?
19) Are marriages and child births registered in your community? Are there any challenges families face in
registering marriages and child births? If so, what are they?
20) Are there girls under the age of 18 years who are married in this community? If so, who are these girls under
18 married to (ex: Syrian-Syrian, Syrian-Lebanese)?
21) Are there displaced children living here without their parents? If so, who do they live with?
22) What services are available for vulnerable women or children in your community? (These include pregnant
women, widows, abused/exploited women or children, unaccompanied children, orphans, etc.)
a. If yes, who is able to access these services? b. What problems prevent you from accessing these services? (These can include problems
like transportation, fear of reporting, no trust in services, no knowledge of services, local laws, etc.)
23) Can you list the 3 factors in your community that, if changed or improved, would increase the overall wellbeing
and living conditions of residents in your village/neighbourhood?

Defining Communitiy Vulnerability in Lebanon – September 2014 - February 2015
126
ANNEX V: PHASE 2B INDIVIDUAL INTERVIEW SURVEY TOOL

Defining Communitiy Vulnerability in Lebanon – September 2014 - February 2015
127

Defining Communitiy Vulnerability in Lebanon – September 2014 - February 2015
128

Defining Communitiy Vulnerability in Lebanon – September 2014 - February 2015
129

Defining Communitiy Vulnerability in Lebanon – September 2014 - February 2015
130

Defining Communitiy Vulnerability in Lebanon – September 2014 - February 2015
131

Defining Communitiy Vulnerability in Lebanon – September 2014 - February 2015
132

Defining Communitiy Vulnerability in Lebanon – September 2014 - February 2015
133
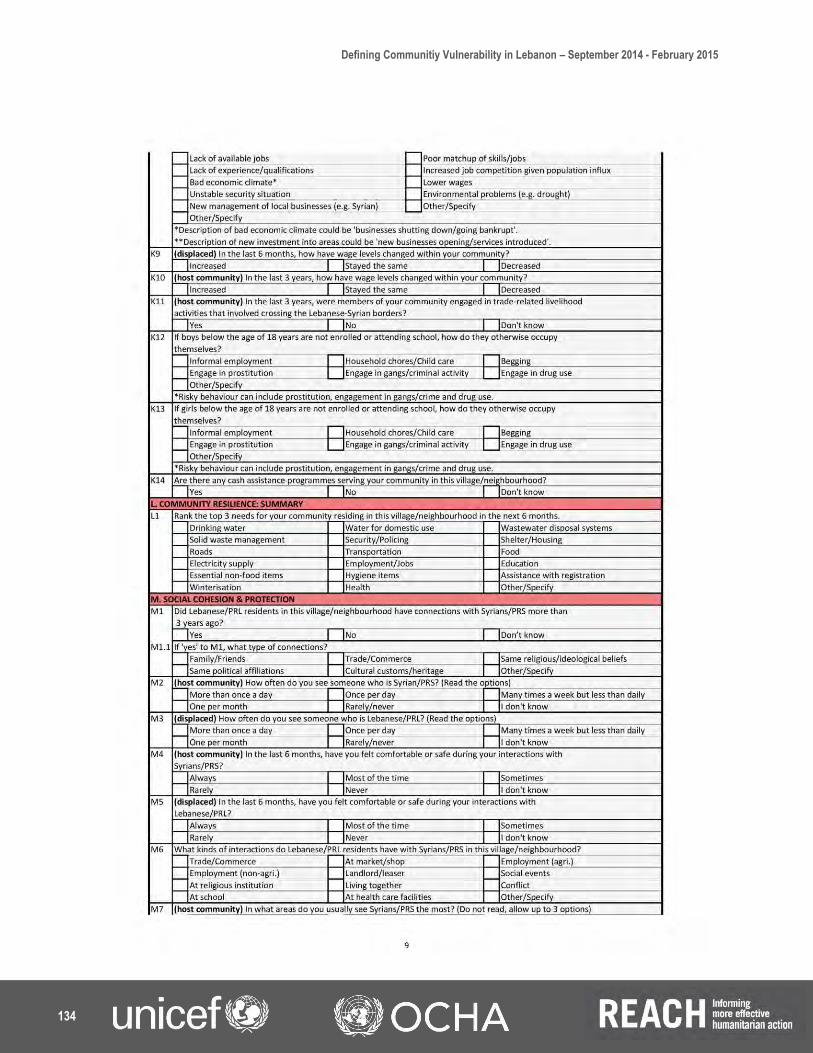
Defining Communitiy Vulnerability in Lebanon – September 2014 - February 2015
134

Defining Communitiy Vulnerability in Lebanon – September 2014 - February 2015
135

Defining Communitiy Vulnerability in Lebanon – September 2014 - February 2015
136