Embed Size (px)
Citation preview
accelerated paper
Compact Solid-State 213 nm Laser Enables Standoff DeepUltraviolet Raman Spectrometer: Measurements of NitratePhotochemistry
Sergei V. Bykov,a Michael Mao,b Katie L. Gares,a Sanford A. Ashera,*a University of Pittsburgh, Department of Chemistry, Pittsburgh, PA 15260 USAb UVisIR Inc., Suite 102, 23600 Mercantile Road, Beachwood, OH 44122 USA
We describe a new compact acousto-optically Q-switched diode-
pumped solid-state (DPSS) intracavity frequency-tripled neodymium-
doped yttrium vanadate laser capable of producing �100 mW of
213 nm power quasi-continuous wave as 15 ns pulses at a 30 kHz
repetition rate. We use this new laser in a prototype of a deep
ultraviolet (UV) Raman standoff spectrometer. We use a novel high-
throughput, high-resolution Echelle Raman spectrograph. We
measure the deep UV resonance Raman (UVRR) spectra of solid
and solution sodium nitrate (NaNO3) and ammonium nitrate
(NH4NO3) at a standoff distance of �2.2 m. For this 2.2 m standoff
distance and a 1 min spectral accumulation time, where we only
monitor the symmetric stretching band, we find a solid state NaNO3
detection limit of �100 lg/cm2. We easily detect �20 lM nitrate
water solutions in 1 cm path length cells. As expected, the aqueous
solutions UVRR spectra of NaNO3 and NH4NO3 are similar, showing
selective resonance enhancement of the nitrate (NO3�) vibrations.
The aqueous solution photochemistry is also similar, showing
facile conversion of NO3� to nitrite (NO2
�). In contrast, the observed
UVRR spectra of NaNO3 and NH4NO3 powders significantly differ,
because their solid-state photochemistries differ. Whereas solid
NaNO3 photoconverts with a very low quantum yield to NaNO2, the
NH4NO3 degrades with an apparent quantum yield of �0.2 to
gaseous species.
Index Headings: Compact laser; Standoff spectrometer; Ultraviolet;
UV; Deep UV Raman; UV resonance Raman; UVRR; Nitrate
photochemistry; Standoff detection; Explosives detection.
INTRODUCTION
An important advantage of Raman spectroscopy is its
ability to remotely identify chemical substances based
on their unique vibrational signatures.1–9 The detection
ability of Raman spectroscopy is mainly limited by the
inherent weakness of the Raman effect since only a
small fraction of the scattered light exchanges energy
with the vibrational states of the irradiated molecules.
This inelastically scattered light carries information
about molecular structure. In addition, only a small
fraction of scattered light can be monitored and analyzed
if the Raman spectra are measured remotely. This
decreases the sensitivity of standoff Raman measure-
ments, making detection of trace quantities difficult.
Excitation of the Raman spectra in the deep ultraviolet
(UV) can give rise to a significantly increased selectivity
and sensitivity of Raman measurements due to the
resonance enhancement, the m4 dependence of Raman
scattering intensity, and the lack of fluorescent interfer-
ence in this spectral region.10 Ultraviolet resonance
Raman excitation has been shown to be advantageous
for detecting trace explosive materials.3,11–13
The development of deep UV standoff spectrometers
has been slowed by the lack of suitable deep UV
lasers.14 Optimal excitation wavelengths are crucial for
UV resonance Raman (UVRR) measurements since
Raman band cross sections, sampling volumes, and
photochemistry significantly depend on excitation wave-
length. Today, UV Raman excitation usually uses
neodymium-doped yttrium aluminum garnet third
(355 nm), fourth (266 nm), and fifth (213 nm) harmonics,
or the second harmonics of visible Ar-ion laser lines at
257, 248, 244, and 229 nm or UV-tunable (193–240 nm)
fourth harmonics of the Ti:Sapphire oscillators. These
lasers show 2–20 mW output powers below 244 nm.
These lasers can only be used as a part of stationary
Raman spectrometers since they are large and heavy,
require water cooling, and have electrically inefficient
power supplies. High-power low-duty cycle excimer
lasers, such as ArF at 193 nm and KrF at 248 nm require,
use of reactive halogen-containing gases. Standoff
Raman instruments would best use small, portable,
high-electrical power-efficient UV lasers.
In this study, we report on the development of a new
compact solid-state deep UV (213 nm) laser that will find
application in compact standoff deep UV Raman instru-
ments. We demonstrate deep UV Raman spectral
standoff measurements of solid and solution sodium
nitrate (NaNO3) and ammonium nitrate (NH4NO3) at
distances of �2.2 m. We also examine the photochem-
istry of nitrates that occur with 213 nm excitation.
Received 26 March 2015; accepted 17 April 2015.
* Author to whom correspondence should be sent. E-mail: asher@pitt.
edu.
DOI: 10.1366/15-07960
Volume 69, Number 8, 2015 APPLIED SPECTROSCOPY 8950003-7028/15/6908-0895/0
Q 2015 Society for Applied Spectroscopy
Our 213 nm laser excitation falls within absorption
bands of many energetic molecules since nitro (-NO2)
and nitrate ester (ONO2) groups as well as nitrate anions
(NO3-) found in explosives absorb strongly around
213 nm. This 213 nm UV excitation gives rise to
significant resonance enhancement of molecules, such
as nitrates, trinitrotoluene (TNT), pentaerythritol tetrani-
trate (PETN), and cyclotrimethylene trinitramine (RDX).11
INSTRUMENTATION
The 213 nm UV Laser. The 213 nm laser shown in Fig. 1
was designed and manufactured by UVisIR Inc. (Beach-
wood, OH). It consists of an acousto-optically Q-
switched, diode-pumped solid-state (DPSS) neodymi-
um-doped yttrium vanadate (Nd:YVO4) laser that is
frequency quintupled to 213 nm. It operates at a 30 kHz
repetition rate, generating 15 ns pulses at the 1064 nm
fundamental. Although Nd:YVO4 has been long known as
a laser medium,15 it became popular only recently due to
advances in the ability to manufacture high-quality
optical crystals. Nd:YVO4 has one of the highest
stimulated emission cross sections among laser crys-
tals,16 and it is capable of operation at high repetition
rates, from kilohertz to megahertz. Its broad and strong
808.5 nm absorption band often eliminates the necessity
for pump wavelength stabilization. All of these reasons
make Nd : YVO4 an ideal material for compact, high-
efficient, and high-power DPSS lasers.
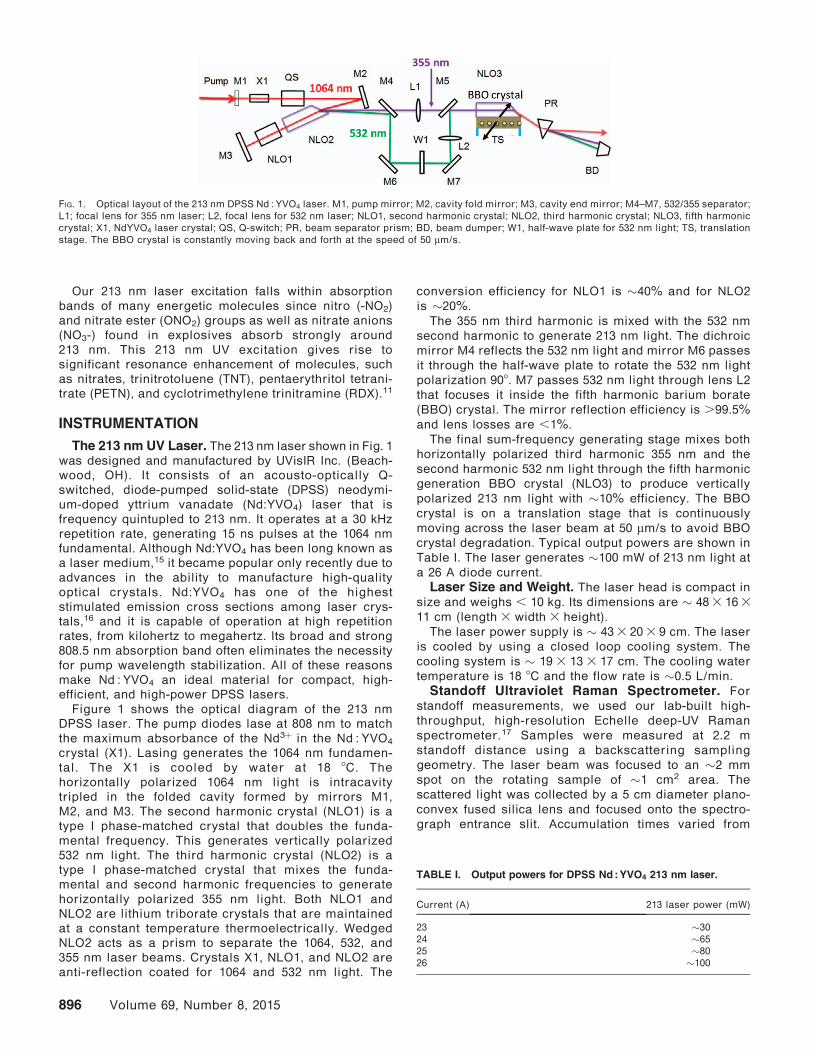
Figure 1 shows the optical diagram of the 213 nm
DPSS laser. The pump diodes lase at 808 nm to match
the maximum absorbance of the Nd3þ in the Nd : YVO4
crystal (X1). Lasing generates the 1064 nm fundamen-
tal. The X1 is cooled by water at 18 8C. The
horizontally polarized 1064 nm light is intracavity
tripled in the folded cavity formed by mirrors M1,
M2, and M3. The second harmonic crystal (NLO1) is a
type I phase-matched crystal that doubles the funda-
mental frequency. This generates vertically polarized
532 nm light. The third harmonic crystal (NLO2) is a
type I phase-matched crystal that mixes the funda-
mental and second harmonic frequencies to generate
horizontally polarized 355 nm light. Both NLO1 and
NLO2 are lithium triborate crystals that are maintained
at a constant temperature thermoelectrically. Wedged
NLO2 acts as a prism to separate the 1064, 532, and
355 nm laser beams. Crystals X1, NLO1, and NLO2 are
anti-reflection coated for 1064 and 532 nm light. The
conversion efficiency for NLO1 is �40% and for NLO2
is �20%.
The 355 nm third harmonic is mixed with the 532 nm
second harmonic to generate 213 nm light. The dichroic
mirror M4 reflects the 532 nm light and mirror M6 passes
it through the half-wave plate to rotate the 532 nm light
polarization 908. M7 passes 532 nm light through lens L2
that focuses it inside the fifth harmonic barium borate
(BBO) crystal. The mirror reflection efficiency is .99.5%and lens losses are ,1%.
The final sum-frequency generating stage mixes both
horizontally polarized third harmonic 355 nm and the
second harmonic 532 nm light through the fifth harmonic
generation BBO crystal (NLO3) to produce vertically
polarized 213 nm light with �10% efficiency. The BBO
crystal is on a translation stage that is continuously
moving across the laser beam at 50 lm/s to avoid BBO
crystal degradation. Typical output powers are shown in
Table I. The laser generates �100 mW of 213 nm light at
a 26 A diode current.
Laser Size and Weight. The laser head is compact in
size and weighs , 10 kg. Its dimensions are � 483 16311 cm (length 3 width 3 height).
The laser power supply is � 433 203 9 cm. The laser
is cooled by using a closed loop cooling system. The
cooling system is � 19 3 13 3 17 cm. The cooling water
temperature is 18 8C and the flow rate is �0.5 L/min.
Standoff Ultraviolet Raman Spectrometer. For
standoff measurements, we used our lab-built high-
throughput, high-resolution Echelle deep-UV Raman
spectrometer.17 Samples were measured at 2.2 m
standoff distance using a backscattering sampling
geometry. The laser beam was focused to an �2 mm
spot on the rotating sample of �1 cm2 area. The
scattered light was collected by a 5 cm diameter plano-
convex fused silica lens and focused onto the spectro-
graph entrance slit. Accumulation times varied from
FIG. 1. Optical layout of the 213 nm DPSS Nd : YVO4 laser. M1, pump mirror; M2, cavity fold mirror; M3, cavity end mirror; M4–M7, 532/355 separator;
L1; focal lens for 355 nm laser; L2, focal lens for 532 nm laser; NLO1, second harmonic crystal; NLO2, third harmonic crystal; NLO3, fifth harmonic
crystal; X1, NdYVO4 laser crystal; QS, Q-switch; PR, beam separator prism; BD, beam dumper; W1, half-wave plate for 532 nm light; TS, translation
stage. The BBO crystal is constantly moving back and forth at the speed of 50 lm/s.
TABLE I. Output powers for DPSS Nd : YVO4 213 nm laser.
Current (A) 213 laser power (mW)
23 �3024 �6525 �8026 �100
896 Volume 69, Number 8, 2015
�10 s to �5 min. The incident 213 nm light irradiance on
a rotating sample for standoff measurements was
�30 mW/cm2.
To compare the NaNO3 and NH4NO3 213 nm photo-
chemistry, we measured non-standoff UV Raman
spectra of solid and solution nitrate samples after
extensive irradiation with 213 nm light. These non-
standoff measurements used spectrographs described
previously.18,19 Spectra were detected using a liquid
nitrogen cooled charge-coupled device camera (Spec-
10, Princeton Instruments). For non-standoff measure-
ments, we used a 213 nm incident irradiance on a
rotating sample of �130 mW/cm2.
Samples. The solid-state UVRR measurements of
NH4NO3 and NaNO3 (J.T. Baker) used samples crushed
into fine powders that were compacted into the groove of
a rotating cell. For the detection limit measurements, a
small amount (�1 and �3 mg) of the fine NaNO3 powder
inside the groove of the metal rotating cell (�1 cm2
surface area) was moistened with 200 proof ethanol
(Decon Laboratories). After drying, the nitrate powder
adhered to the groove bottom surface.
For the mass change measurements, we used dense
melted nitrate samples. Approximately 50 mg of NH4NO3
and NaNO3 powders were heated �10 8C above their
melting points inside small Teflon cups and then slowly
cooled to room temperature.
For solution measurements, nitrates were dissolved
in water at 2 M, 0.5 M, 0.02 M, 2 mM, 0.2 mM, and
0.02 mM concentrations. Raman spectra of solution
samples were measured in a 1 cm path length fused
silica capped cuvette that was continuously stirred with
a magnetic stir bar.
SOLID NITRATES
The strong �200 nm nitrate (NO�3 ) p!p* electronic
transition strongly enhances the NO�3 stretching vibra-
tions.11 Figure 2 shows the 213 nm excited standoff UV
Raman spectra of the NO�3 symmetric stretching vibra-
tion (m1) obtained from samples where different amounts
of NaNO3 powder adhered to the bottom of the rotating
cell groove. In this experiment, the laser beam was
focused to an �2 mm diameter spot to exactly illuminate
the width of the rotating groove, which had a total area of
�1 cm2.
The m1NO�3 vibration gives rise to an intense UV
resonance Raman band at �1065 cm�1. At a 2.2 m
standoff distance, this band is clearly detectable in the
UVRR spectrum of 1 mg/cm2 nitrate powder with 60 s
spectral accumulation time (see Fig. 2). We estimate a
detection limit for these 1 min measurements monitoring
only the m1NO�3 vibration of �100 lg/cm2.
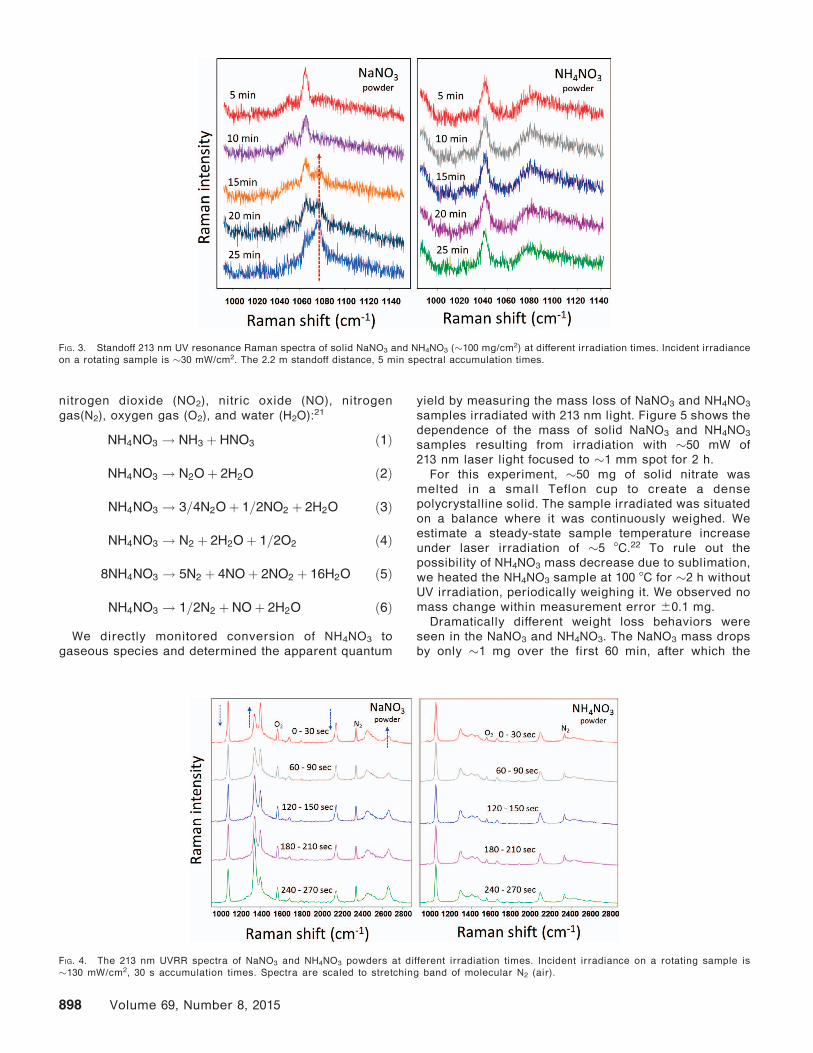
We irradiated nitrate powders for extended times to
investigate the effect of photochemistry on the UVRR
spectra. Figure 3 shows the 213 nm excited standoff
UVRR of the NO�3 symmetric stretching vibrations of
NaNO3 and NH4NO3 powders. The m1 of solid NH4NO3 is
at �1045 cm�1, whereas that of solid NaNO3 is at
�1065 cm�1. We previously demonstrated that illumina-
tion of solid NaNO3 within its 200 nm absorption band
results in formation of nitrite (NO�2 ) and molecular
oxygen.20 This solid-state photodecomposition perturbs
the NO�3 at crystal lattice sites adjacent to the photolyzed
NO�3 . This results in �13 cm�1 upshift of the m1symmetric Raman band frequency. For a 213 nm UV
irradiance of �30 mW/cm2, the upshifted m1(NO�3 ) bandat �1078 cm�1 appears in UVRR spectra after �15 min
irradiation (Fig. 3). After �25 min, the �1078 cm�1 bandintensity becomes larger than that the unperturbed
�1068 cm�1 band.In contrast to NaNO3, the NH4NO3 UV Raman
spectrum does not similarly change with extended
UV irradiation (Fig. 3). This indicates that significantly
different solid-state photochemistry occurs for NH4NO3
compared to NaNO3.
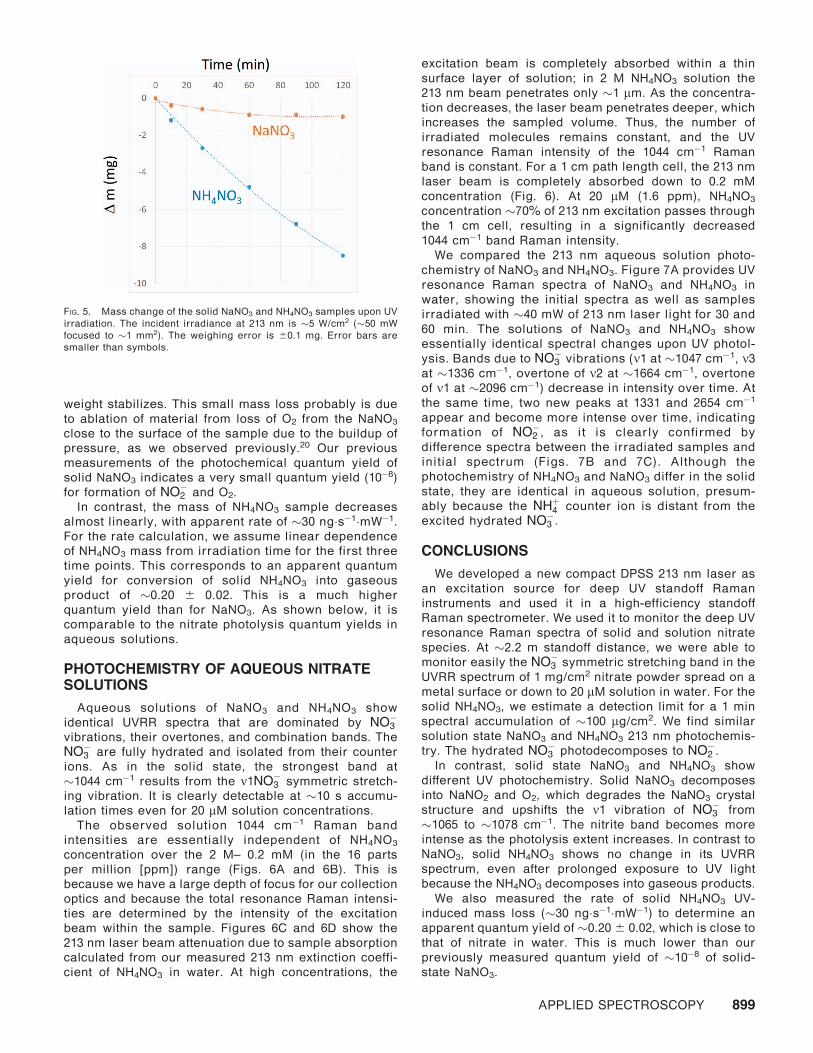
To gain insight into UV photochemistry of NaNO3 and
NH4NO3, we irradiated these powders with �130 mW/cm2
of 213 nm laser light over different time periods (Fig. 4).
As the UV irradiation exposure of NaNO3 increases, the
NO�3 Raman band intensities decrease. This includes the
m1 at �1068 cm�1, m3 at �1385 cm�1, overtone of m2 at
�1670 cm�1, and overtone of m1 at �2133 cm�1, indicatingNaNO3 decomposition. At the same time, the photoprod-
uct NO�2 Raman bands at �1331 and �2654 cm�1
increase.20
In contrast, the NH4NO3 UVRR spectrum (Fig. 4) does
not change upon UV irradiation as we observed with the
Fig. 3 standoff measurements. Given that we show below
that the sample weight decreases upon 213 nm excita-
tion, we presume that the UV-induced decomposition
products are gaseous and do not redeposit on the
NH4NO3 surface.
Ultraviolet-induced decomposition of ammonium ni-
trate can be a complex process and may follow one or
more of the pathways of its thermal decomposition,
which give rise to ammonia (NH3), nitrous oxide (N2O),
FIG. 2. Standoff 213 nm UVRR spectra of different quantities of solid
NaNO3 powder on the bottom of rotating cell groove (�1 cm2 total area).
The 2.2 m standoff distance, 60 s accumulation time, incident irradiance
is �30 mW/cm2. Raw and smoothed (Savitzky–Golay) spectra are
overlaid.
APPLIED SPECTROSCOPY 897
nitrogen dioxide (NO2), nitric oxide (NO), nitrogen
gas(N2), oxygen gas (O2), and water (H2O):21
NH4NO3 ! NH3 þ HNO3 ð1Þ
NH4NO3 ! N2Oþ 2H2O ð2Þ
NH4NO3 ! 3=4N2Oþ 1=2NO2 þ 2H2O ð3Þ
NH4NO3 ! N2 þ 2H2Oþ 1=2O2 ð4Þ
8NH4NO3 ! 5N2 þ 4NOþ 2NO2 þ 16H2O ð5Þ
NH4NO3 ! 1=2N2 þ NOþ 2H2O ð6Þ
We directly monitored conversion of NH4NO3 to
gaseous species and determined the apparent quantum
yield by measuring the mass loss of NaNO3 and NH4NO3
samples irradiated with 213 nm light. Figure 5 shows the
dependence of the mass of solid NaNO3 and NH4NO3
samples resulting from irradiation with �50 mW of
213 nm laser light focused to �1 mm spot for 2 h.
For this experiment, �50 mg of solid nitrate was
melted in a small Teflon cup to create a dense
polycrystalline solid. The sample irradiated was situated
on a balance where it was continuously weighed. We
estimate a steady-state sample temperature increase
under laser irradiation of �5 8C.22 To rule out the
possibility of NH4NO3 mass decrease due to sublimation,
we heated the NH4NO3 sample at 100 8C for �2 h without
UV irradiation, periodically weighing it. We observed no
mass change within measurement error 60.1 mg.
Dramatically different weight loss behaviors were
seen in the NaNO3 and NH4NO3. The NaNO3 mass drops
by only �1 mg over the first 60 min, after which the
FIG. 4. The 213 nm UVRR spectra of NaNO3 and NH4NO3 powders at different irradiation times. Incident irradiance on a rotating sample is
�130 mW/cm2, 30 s accumulation times. Spectra are scaled to stretching band of molecular N2 (air).
FIG. 3. Standoff 213 nm UV resonance Raman spectra of solid NaNO3 and NH4NO3 (�100 mg/cm2) at different irradiation times. Incident irradiance
on a rotating sample is �30 mW/cm2. The 2.2 m standoff distance, 5 min spectral accumulation times.
898 Volume 69, Number 8, 2015
weight stabilizes. This small mass loss probably is due
to ablation of material from loss of O2 from the NaNO3
close to the surface of the sample due to the buildup of
pressure, as we observed previously.20 Our previous
measurements of the photochemical quantum yield of
solid NaNO3 indicates a very small quantum yield (10�8)for formation of NO�2 and O2.
In contrast, the mass of NH4NO3 sample decreases
almost linearly, with apparent rate of �30 ng�s�1�mW�1.For the rate calculation, we assume linear dependence
of NH4NO3 mass from irradiation time for the first three
time points. This corresponds to an apparent quantum
yield for conversion of solid NH4NO3 into gaseous
product of �0.20 6 0.02. This is a much higher
quantum yield than for NaNO3. As shown below, it is
comparable to the nitrate photolysis quantum yields in
aqueous solutions.
PHOTOCHEMISTRY OF AQUEOUS NITRATESOLUTIONS
Aqueous solutions of NaNO3 and NH4NO3 show
identical UVRR spectra that are dominated by NO�3vibrations, their overtones, and combination bands. The
NO�3 are fully hydrated and isolated from their counter
ions. As in the solid state, the strongest band at
�1044 cm�1 results from the m1NO�3 symmetric stretch-
ing vibration. It is clearly detectable at �10 s accumu-
lation times even for 20 lM solution concentrations.
The observed solution 1044 cm�1 Raman band
intensities are essentially independent of NH4NO3
concentration over the 2 M– 0.2 mM (in the 16 parts
per million [ppm]) range (Figs. 6A and 6B). This is
because we have a large depth of focus for our collection
optics and because the total resonance Raman intensi-
ties are determined by the intensity of the excitation
beam within the sample. Figures 6C and 6D show the
213 nm laser beam attenuation due to sample absorption
calculated from our measured 213 nm extinction coeffi-
cient of NH4NO3 in water. At high concentrations, the
excitation beam is completely absorbed within a thin
surface layer of solution; in 2 M NH4NO3 solution the
213 nm beam penetrates only �1 lm. As the concentra-
tion decreases, the laser beam penetrates deeper, which
increases the sampled volume. Thus, the number of
irradiated molecules remains constant, and the UV
resonance Raman intensity of the 1044 cm�1 Raman
band is constant. For a 1 cm path length cell, the 213 nm
laser beam is completely absorbed down to 0.2 mM
concentration (Fig. 6). At 20 lM (1.6 ppm), NH4NO3
concentration �70% of 213 nm excitation passes through
the 1 cm cell, resulting in a significantly decreased
1044 cm�1 band Raman intensity.
We compared the 213 nm aqueous solution photo-
chemistry of NaNO3 and NH4NO3. Figure 7A provides UV
resonance Raman spectra of NaNO3 and NH4NO3 in
water, showing the initial spectra as well as samples
irradiated with �40 mW of 213 nm laser light for 30 and
60 min. The solutions of NaNO3 and NH4NO3 show
essentially identical spectral changes upon UV photol-
ysis. Bands due to NO�3 vibrations (m1 at �1047 cm�1, m3at �1336 cm�1, overtone of m2 at �1664 cm�1, overtoneof m1 at �2096 cm�1) decrease in intensity over time. At
the same time, two new peaks at 1331 and 2654 cm�1
appear and become more intense over time, indicating
formation of NO�2 , as it is clearly confirmed by
difference spectra between the irradiated samples and
initial spectrum (Figs. 7B and 7C). Although the
photochemistry of NH4NO3 and NaNO3 differ in the solid
state, they are identical in aqueous solution, presum-
ably because the NHþ4 counter ion is distant from the
excited hydrated NO�3 .
CONCLUSIONS
We developed a new compact DPSS 213 nm laser as
an excitation source for deep UV standoff Raman
instruments and used it in a high-efficiency standoff
Raman spectrometer. We used it to monitor the deep UV
resonance Raman spectra of solid and solution nitrate
species. At �2.2 m standoff distance, we were able to
monitor easily the NO�3 symmetric stretching band in the
UVRR spectrum of 1 mg/cm2 nitrate powder spread on a
metal surface or down to 20 lM solution in water. For the
solid NH4NO3, we estimate a detection limit for a 1 min
spectral accumulation of �100 lg/cm2. We find similar
solution state NaNO3 and NH4NO3 213 nm photochemis-
try. The hydrated NO�3 photodecomposes to NO�2 .In contrast, solid state NaNO3 and NH4NO3 show
different UV photochemistry. Solid NaNO3 decomposes
into NaNO2 and O2, which degrades the NaNO3 crystal
structure and upshifts the m1 vibration of NO�3 from
�1065 to �1078 cm�1. The nitrite band becomes more
intense as the photolysis extent increases. In contrast to
NaNO3, solid NH4NO3 shows no change in its UVRR
spectrum, even after prolonged exposure to UV light
because the NH4NO3 decomposes into gaseous products.
We also measured the rate of solid NH4NO3 UV-
induced mass loss (�30 ng�s�1�mW�1) to determine an
apparent quantum yield of �0.20 6 0.02, which is close to
that of nitrate in water. This is much lower than our
previously measured quantum yield of �10�8 of solid-
state NaNO3.
FIG. 5. Mass change of the solid NaNO3 and NH4NO3 samples upon UV
irradiation. The incident irradiance at 213 nm is �5 W/cm2 (�50 mW
focused to �1 mm2). The weighing error is 60.1 mg. Error bars are
smaller than symbols.
APPLIED SPECTROSCOPY 899
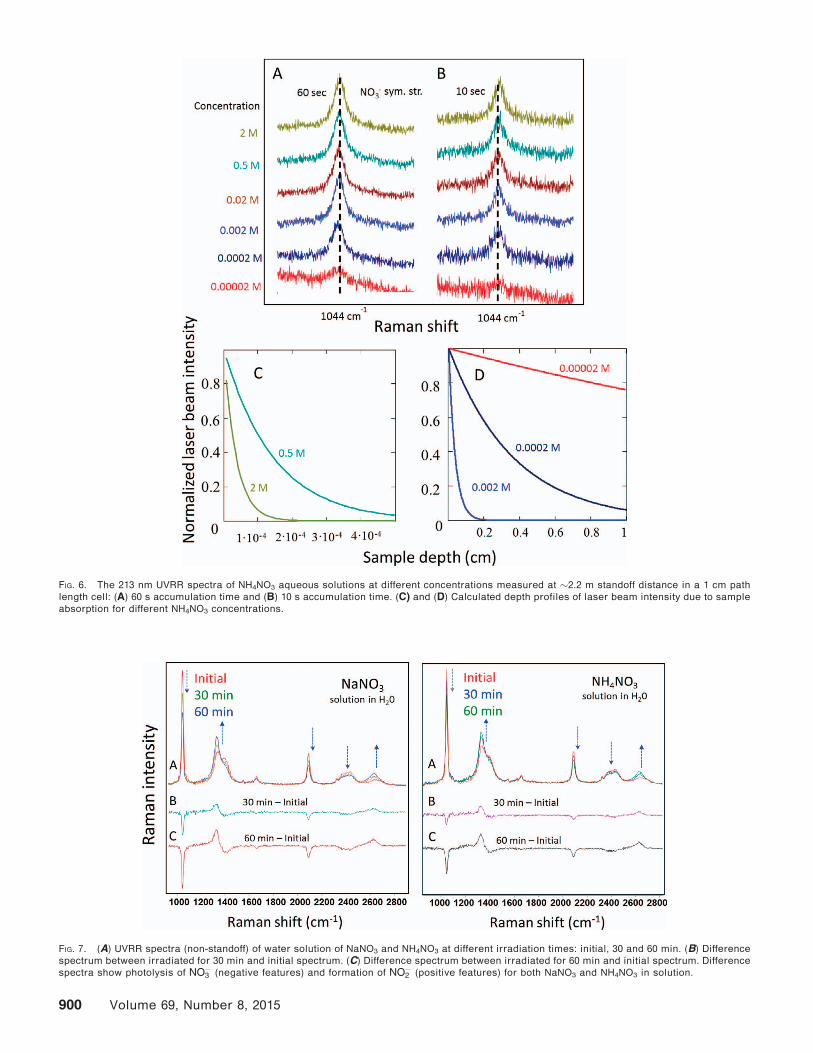
FIG. 7. (A) UVRR spectra (non-standoff) of water solution of NaNO3 and NH4NO3 at different irradiation times: initial, 30 and 60 min. (B) Difference
spectrum between irradiated for 30 min and initial spectrum. (C) Difference spectrum between irradiated for 60 min and initial spectrum. Difference
spectra show photolysis of NO�3 (negative features) and formation of NO�2 (positive features) for both NaNO3 and NH4NO3 in solution.
FIG. 6. The 213 nm UVRR spectra of NH4NO3 aqueous solutions at different concentrations measured at �2.2 m standoff distance in a 1 cm path
length cell: (A) 60 s accumulation time and (B) 10 s accumulation time. (C) and (D) Calculated depth profiles of laser beam intensity due to sample
absorption for different NH4NO3 concentrations.
900 Volume 69, Number 8, 2015
ACKNOWLEDGMENT
This work was supported by an Office of Naval Research (ONR)
N00014-12-1-0021 contract.
1. J.C. Carter, S.M. Angel, M. Lawrence-Snyder, J. Scaffidi, R.E.
Whipple, J.G. Reynolds. ‘‘Standoff Detection of High Explosive
Materials at 50 Meters in Ambient Light Conditions Using a Small
Raman Instrument’’. Appl. Spectrosc. 2005. 59(6): 769-775.2. L.C. Pacheco-Londono, W. Ortiz-Rivera, O.M. Primera-Pedrozo,
S.P. Hernandez-Rivera. ‘‘Vibrational Spectroscopy Standoff Detec-
tion of Explosives’’. Anal. Bioanal. Chem. 2009. 395(2): 323-335.
3. D.D. Tuschel, A.V. Mikhonin, B.E. Lemoff, S.A. Asher. ‘‘DeepUltraviolet Resonance Raman Excitation Enables Explosives
Detection’’. Appl. Spectrosc. 2010. 64(4): 425-432.4. S.M. Angel, N.R. Gomer, S.K. Sharma, C. McKay. ‘‘Remote Raman
Spectroscopy for Planetary Exploration: A Review’’. Appl. Spec-
trosc. 2012. 66(2): 137-150.
5. A.K. Misra, S.K. Sharma, T.E. Acosta, J.N. Porter, D.E. Bates.
‘‘Single-Pulse Standoff Raman Detection of Chemicals from 120
M Distance During Daytime’’. Appl. Spectrosc. 2012. 66(11):
1279-1285.
6. E.L. Izake, B. Cletus, W. Olds, S. Sundarajoo, P.M. Fredericks, E.
Jaatinen. ‘‘Deep Raman Spectroscopy for the Non-Invasive Standoff
Detection of Concealed Chemical Threat Agents’’. Talanta. 2012. 94:342-347.
7. A. Ehlerding, I. Johansson, S. Wallin, H. Ostmark. ‘‘Resonance-Enhanced Raman Spectroscopy on Explosives Vapor at Standoff
Distances’’. Int. J. Spectrosc. 2012. 158715.8. S.K. Sharma, J.N. Porter, A.K. Misra, C.E. Helsley, D.E. Bates.
‘‘Scanning Time-Resolved Standoff Raman Instrument for Large-
Area Mineral Detection on Planetary Surfaces’’. Eur. J. Mineral.
2013. 25(5): 715-720.
9. M. Skulinova, C. Lefebvre, P. Sobron, E. Eshelman, M. Daly, J.F.
Gravel, J.F. Cormier, F. Chateauneuf, G. Slater, W. Zheng, A.
Koujelev, R. Leveille. ‘‘Time-Resolved Stand-Off UV-Raman
Spectroscopy for Planetary Exploration’’. Planet. Space Sci.
2014. 92: 88-100.
10. S.A. Asher, C.R. Johnson. ‘‘Raman Spectroscopy of a Coal Liquid
Shows that Fluorescence Interference is Minimized with Ultraviolet
Excitation’’. Science. 1984. 225(4659): 311-313.11. M. Ghosh, L. Wang, S.A. Asher. ‘‘Deep-Ultraviolet Resonance
Raman Excitation Profiles of NH4NO3, PETN, TNT, HMX, and RDX’’.Appl. Spectrosc. 2012. 66(9): 1013-1021.
12. A.W. Fountain III, S.D. Christesen, R.P. Moon, J.A. Guicheteau, E.D.
Emmons. ‘‘Recent Advances and Remaining Challenges for the
Spectroscopic Detection of Explosive Threats’’. Appl. Spectrosc.
2014. 68(8): 795-811.
13. E.D. Emmons, A. Tripathi, J.A. Guicheteau, A.W. Fountain III, S.D.
Christesen. ‘‘Ultraviolet Resonance Raman Spectroscopy of Explo-
sives in Solution and the Solid State’’. J. Phys. Chem. A. 2013.
117(20): 4158-4166.
14. S.D. Christesen, A.W. Fountain III, E.D. Emmons, J.A. Guicheteau.
‘‘Raman Detection of Explosives’’. In: P.M. Pellegrino, E.L. Holthoff,
M.E. Farrell, editors. Laser-Based Optical Detection of Explosives.
Boca Raton, FL: CRC Press, 2015. Pp. 99-122.
15. J.R. O’Connor. ‘‘Unusual Crystal-Field Energy Levels and Efficient
Laser Properties of YVO4:Nd’’. Appl. Phys. Lett. 1966. 9(11): 407-409.16. L. DeShazer. ‘‘Vanadate Crystals Exploit Diode-Pump Technology’’.
Laser Focus World. 1994. 30: 88-93.
17. S.V. Bykov, B. Sharma, S.A. Asher. ‘‘High-Throughput, High-
Resolution Echelle Deep-UV Raman Spectrometer’’. Appl. Spec-
trosc. 2013. 67(8): 873-883.
18. S.A. Asher, C.R. Johnson, J. Murtaugh. ‘‘Development of a New UV
Resonance Raman Spectrometer for the 217-400 nm Spectral
Region’’. Rev. Sci. Instrum. 1983. 54: 1657-1662.
19. S. Bykov, I. Lednev, A. Ianoul, A. Mikhonin, C. Munro, S.A. Asher.
‘‘Steady-State and Transient Ultraviolet Resonance Raman Spec-
trometer for the 193–270 nm Spectral Region’’. Appl. Spectros. 2005.59(12): 1541-1552.
20. S.A. Asher, D.D. Tuschel, T.A. Vargson, L. Wang, S.J. Geib. ‘‘SolidState and Solution Nitrate Photochemistry: Photochemical Evolu-
tion of the Solid State Lattice’’. J. Phys. Chem. A. 2011. 115(17):
4279-4287.
21. S. Chaturvedi, P.N. Dave. ‘‘Review on Thermal Decomposition of
Ammonium Nitrate’’. J. Energ. Mater. 2013. 31(1): 1-26.
22. M. Lax. ‘‘Temperature Rise Induced by a Laser Beam’’. J. Appl.Phys. 1977. 48(9): 3919-3924.
APPLIED SPECTROSCOPY 901


![I]Iodine- -CIT · COSTIS (Compact Solid Target Irradiation System) solid target holder. COSTIS is designed for irradiation of solid materials. IBA Cyclotron COSTIS Solid Target](https://img.pdfslide.net/doc/110x75/5e3b25610b68cc381f725e57/iiodine-costis-compact-solid-target-irradiation-system-solid-target-holder.jpg)