Embed Size (px)
Citation preview
Lemu et al. World Journal of Engineering Research and Technology
www.wjert.org
1
COMPACTED BEHAVIOUR OF CEMENT STABILIZED LATERITIC
SOIL AND ITS ECONOMIC BENEFIT OVER SELECTIVE BORROW
MATERIAL IN ROAD CONSTRUCTION: A CASE STUDY IN
WOLAYITA SODO
Dumessa Gudissa Lemu*1 and R. K. Verma
2
1
(MSc) Department of Civil Engineering, Institute of Technology, Ambo University,
Ambo, Ethiopia.
2 (Ph.D) Department of Civil Engineering, Institute of Technology, Arba Minch University,
Arba Minch, Ethiopia.
Article Received on 14/12/2017 Article Revised on 05/01/2018 Article Accepted on 26/01/2018
ABSTRACT
This study assessed the effects of cement on the behavior of compacted
lateritic soil collected from WolayitaSodo, Southern Ethiopia, to
examine the benefits of cement stabilized lateritic over selective
borrow material both in the quality and saving cost. The basic index
and engineering properties of lateritic soil were determined following
the ASTM procedure and classified as A-7-5 and inorganic silt according to the AASHTO
classification system and Unified Soil Classification System, respectively. The soil samples
were subsequently stabilized with 3%, 5%, 7%, and 9% cement. Results showed that
stabilization of the lateritic soils with cement increased the Maximum Dry Density,
California Bearing Ratio, and Unconfined Compressive Strength while there was a reduction
in Optimum Moisture Content as cement up to7%. The effect of curing time indicated
marginal on the compaction characteristics and CBR, whereas it revealed substantial effects
in unconfined compressive strength tests results. Therefore, it is concluded that Lateritic soils
from WolayitaSodo stabilized with 5% cement proved better quality than the selective
borrow material taken from the existing nearby areas and its economic benefits over selective
borrow material by 26.95%. Thus, the stabilization of lateritic with cement around
wjert, 2018, Vol. 4, Issue 2, 01-34.
World Journal of Engineering Research and Technology
WJERT
www.wjert.org
ISSN 2454-695X Case Study
SJIF Impact Factor: 4.326
*Corresponding Author
Dumessa Gudissa Lemu
(MSc) Department of Civil
Engineering, Institute of
Technology, Ambo
University, Ambo, Ethiopia.
Lemu et al. World Journal of Engineering Research and Technology
www.wjert.org
2
WolayitaSodois effective in the constructions of stable and durable sub-grade and sub-base
course layer.
KEYWORDS: Lateritic Soil, Cement Content, stabilization, selective borrow material, Cost.
INTRODUCTION
The cost-effectiveness of any road project depends on up the availability of the natural
material that utilized in the construction of pavement layers. One such naturally occurring
material is laterite, which locally known as red clay soil – a type of residual soil that occurs
extensively in humid tropical and sub-tropical zones of the world, including Ethiopia, central,
southern and western Africa (Netterberg, 2014). Ethiopia is a country in the ways of
developments, many highway and railway projects are to be constructed in all over the
country. Thus, those projects along with many thousand kilometers by their nature; pass
through different topography, climate, type of soil and drainage condition. In all the area
these projects pass through, it is difficult to get the soil that meets minimum quality
requirements. The forces engineers to find other solutions such as stabilization with additives
or replacing with the material that has the desired quality. Studies identify that lateritic soil
(red clay soil) is found in Western part of Ethiopia such as Assosa, Najo –Mandi, BegiJarso
and Southern part around Wolayita Sodo, Dilla, NegelleBorana. In WolayitaSodo, where the
present study has been conducted, all forming factors such as rolling slope with good water
runoff, distinct rainy season and having warm summer are fulfilled for the formation of
lateritic soils. The previous study also identified that the area is dominated by brown,
redcolorsoil, which has appreciable amounts of Sesquioxide (Hanna, 2008). As (Netterberg,
2014) Laterites have not been used in the upper layers of pavement (sub-base and base
course) for some reasons: - The materials commonly exhibit gaps in the grading curve, High
Plasticity Indices (greater than 15) and Lower Soaked CBR Value. Therefore, the use of
lateritic soil was limited. As a result, other more expensive options are adopted such as
hauling over long distances other natural gravels which meet the standard specifications. The
study area, WolayitaSodo, is a junction for five nearby towns such as Arba Minch, Gofa,
Hossana, Jimma, and Shashamane. The construction of the road connects Arba Minch,
Hossana and Shashamane were completed recently, whereas the roads connect Gofa and
Jimma is a gravel road, in the future Ethiopia road authority planned to upgrade to a sealed
standard. A document obtained from Ethiopia road authoritySodo district indicates that in the
construction of Alaba- Humbo road, the contractor's use selective borrow material nearby the
Lemu et al. World Journal of Engineering Research and Technology
www.wjert.org
3
area in the construction of subgrade and sub-base layers of the pavements of the road passes
through side town where lateritic soil exists. When road pavement layers constructed, it is
difficult to get materials that fulfill all the quality requirements specified by road authority
standards. In such cases, to find the solution by using different alternative method either by
replacement of the poor material with high-quality materials or stabilization with an
appropriate binder such as Portland cement or hydrated lime. Thus, they improve the quality
of the material to the required standards by saving cost and time. Using soil improvement
techniques rather than using other methods, such as replacing or adding reinforced soil, either
regarding performance and ease of work and also from an economic aspect and the speed of
work, is thus justifiable. Soil specimens were taken from WolayitaSodo town along the main
road that comes from Shashemene to Arba Minch. Before sampling, visual site investigations
were made to consider the different soil types and to sample evenly in the town. The three
different areas were selected for the data collection: Golla, near the new bus station (in the
town) and WolayitaSodo University. For each area, two test pits at a half kilometer distance
were selected. Two samples at the depths of 1.5 and 2.5 meters below the ground level were
selected from each pit. This study, therefore, intends to take advantage of cement as a
stabilizer of lateritic soil used for construction subgrade and subbase layers of road pavement
over the uses of gravel borrow material for heavy traffic loaded road (trunk roads) and assess
the effects of cement on the compaction characteristics of lateritic soil, strength
characteristics and swelling properties.
Statement of the Problem
Studies have been done by Zelalem (2005), Wakuma (2007), Hanna (2008) and Wossen
(2009) on the investigation of the index / engineering properties lateritic soil, shear strength
parameters of lateritic soil and appropriate laboratory procedure to characterize lateritic soil
in different parts of the country, but no emphases have been laid on the behavior of lateritic
soil stabilized with cement. The influence of cement on compaction characteristics of lateritic
soil such as maximum dry density and optimum moisture content and also strength
characteristics including CBR and unconfined compressive strength; and plasticity index of
Wolayitasodo soil have not studied yet. Therefore, it was felt essential to study the properties
of lateritic soils, its behavior when stabilized with cement. In addition to this, it is of
paramount to know the cost benefits of cement stabilized over replacing borrow material.
Thus, this study tries to fill all gaps mentioned above.
Lemu et al. World Journal of Engineering Research and Technology
www.wjert.org
4
OBJECTIVE OF THE STUDY
General objective
The main objective of the study is to assess the behavior of compacted lateritic soil stabilized
with cement and to evaluate cost-benefit analysis of lateritic soil stabilized with cement over
selective borrow material for the construction of subgrade and sub-base course highway
around WolayitaSodo town, Ethiopia.
Specific objectives
The specific objectives of the study were to:
To determine the effect cement content on the plasticity index, the compaction
characteristics, the CBR value and unconfined compressive strength of compacted
lateritic soil.
To determine the effects of curing time on the compaction characteristics, CBR value and
unconfined compressive strength.
To compare the cost of cement stabilization and selective borrows material for the study
area.
Description of study area
The study area, WolayitaSodo town is located in the Southern Nations, Nationalities and
Peoples Regional State (SNNPRS) within latitude N06.87237o
- N06.83168o and longitude
E037.770969o- E037.75458
o at the entrance of the town from Shashemene and exit to Arba
Minch respectively. Two trunk roads connect the town with Addis Ababa through
Shashemene, 390km from Addis Ababa and through Butajera- Hossana or Butajera-
Alabakulito 307 km. This study was made along the main road passing through sodo town. It
is the parts of Alaba – Humbo project, measures about 6 km starting from entrance of the
soda town from Shashamane (locally called Golla area) up to exit to the Arba Minch (at
edges of the wolayitaSodo University). This portion of road was constructed by Keangnam
ENT. Ltd and has supervised by Beza Consulting Engineers PLC. The study area was divided
into three parts based the soil colors. In each area two test pits were located at distance
intervals of 500m. This distance is equal to the maximum intervals already used in sampling
to check quality of the existing subgrade quality by Beza consulting engineer’s plc.
According to (Hanna, 2008), the records from 1992 to 2007 taken from the meteorological
station at WolayitaSodo town, the mean annual is 1343 mm. The rainfall season is from May
to October and it has two peaks (May and August) without having a distinct dry season
Lemu et al. World Journal of Engineering Research and Technology
www.wjert.org
5
between the peaks. The mean annual temperature is 19.9°C and monthly values range
between 17.7°C in July and 22.1°C in February and March.
MATERIALS AND RESEARCH METHODOLOGY
Materials
Characterization of the main materials used in this report is found essential to predict the
necessary behavior of treated soil. This includes Portland pozzolana cement and soil.
Portland Pozzolana Cement (PPC)
The Portland pozzolana cement used in this research was manufactured by Mugher Cement
Factory. The component Portland pozzolana cement listed on the company website was 5%
gypsum and pumice (15% - 30%). The chemical and mineralogical compositions of Portland
pozzolana cement of the Mugher Cement Factory (Table 2.1) have accepted and adopted as
per analysis made by Dinku and Gudissa, 2010 (Journal of the EEA).
Table 2.1: Chemicals and Mineralogical composition of Mugher Portland Pozzolana
Cement.
Chemical composition Percentages (%)
SiO2 22.15
Fe2O3 3.43
Al2O3 5.76
CaO 65.05
MgO 1.05
SO3 1.04
Others 1.52
Mineralogical composition Percentages (%)
C3S 47.11
C2S 27.96
C3A 9.46
C4AF 10.44
[Source, Journal of EEA. Vol. 27] (Dinku and Gudissa, 2010)
Soil
Soil which was collected from the study area was the main material for the research activities.
It was to be stabilized with the Portland pozzolana cement manufactured by Mugher Cement
Factory. The soil in the study area mostly consisted of red soil, has been defined as lateritic
soil (Hanna, 2008). However, characterization of the soil was necessary for establishing the
effect of cement stabilization, and therefore it was done by conducting various tests described
in the next sections. The test pits were named and abbreviated for simplification.
Lemu et al. World Journal of Engineering Research and Technology
www.wjert.org
6
Table 2.2: Test pits name and descriptions.
GP1= Golla Area
Pit One
GP2= Golla Area
Pit Two
NBSP1 = New Bus Station
Pit One
NBSP2 = New Bus Station
Pit Two
WSUP1= Wolayita sodo
university pit one
WSUP2= Wolayita Sodo
University Pit Two
Table 2.3: Test pits name and corresponding depth.
GP11= Golla area
pit one at depth
1.5m
GP12= Golla area
pit one at depth
2.5m
GP21= Golla area
pit two at depth
1.5m
GP22=Golla area
pit two at depth
2.5m
NBSP11= New Bus
Station Pit One at
depth 1.5m
NBSP12= New Bus
Station Pit One at
depth 2.5m
NBSP21= New Bus
Station Pit two at depth
1.5m
NBSP22= New Bus
Station Pit two at depth
2.5m
WSUP11= WolayitaSodo
University pit one at depth
1.5m
WSUP12= WolayitaSodo
University pit one at depth
2.5m
WSUP21= WolayitaSodo
University pit two at depth
1.5m
WSUP22= WolayitaSodo
University pit two at depth
2.5m
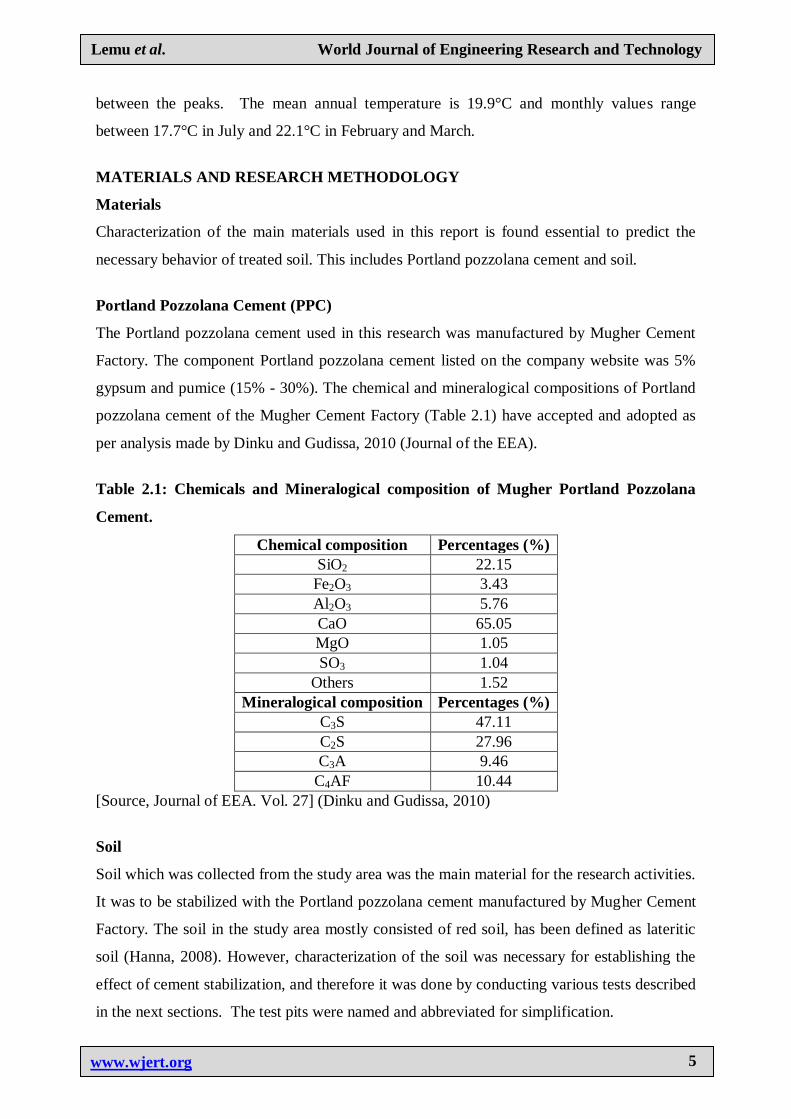
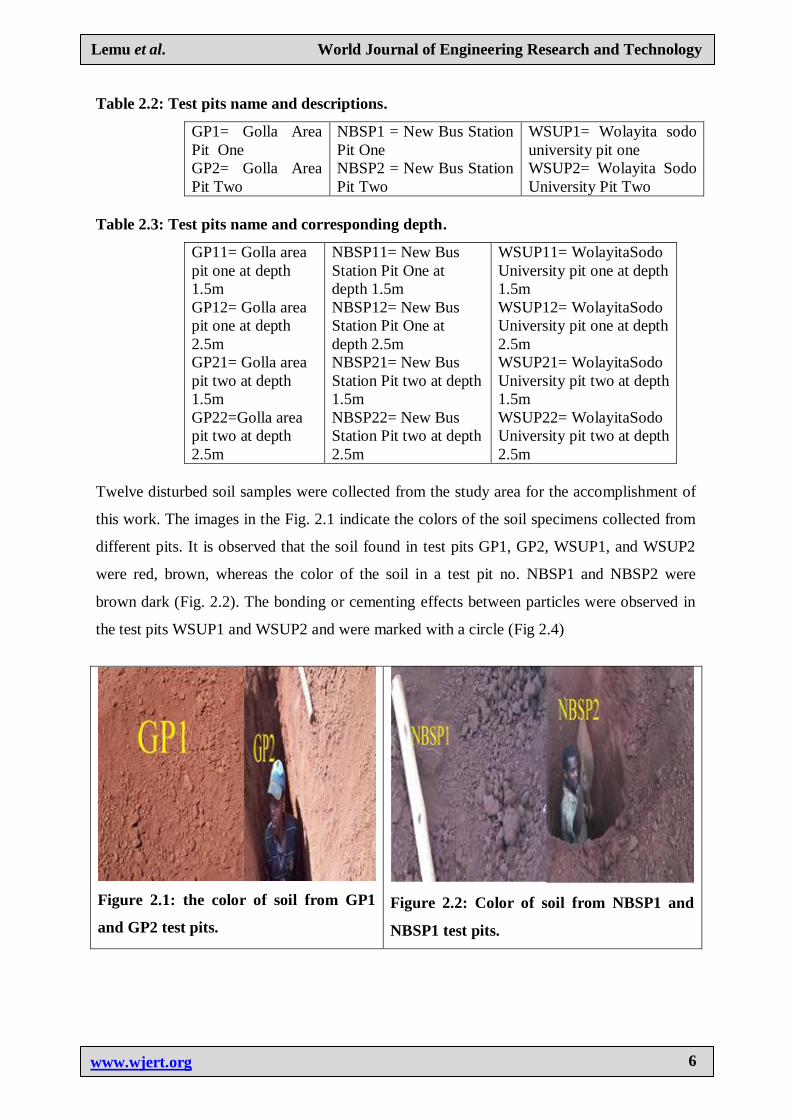
Twelve disturbed soil samples were collected from the study area for the accomplishment of
this work. The images in the Fig. 2.1 indicate the colors of the soil specimens collected from
different pits. It is observed that the soil found in test pits GP1, GP2, WSUP1, and WSUP2
were red, brown, whereas the color of the soil in a test pit no. NBSP1 and NBSP2 were
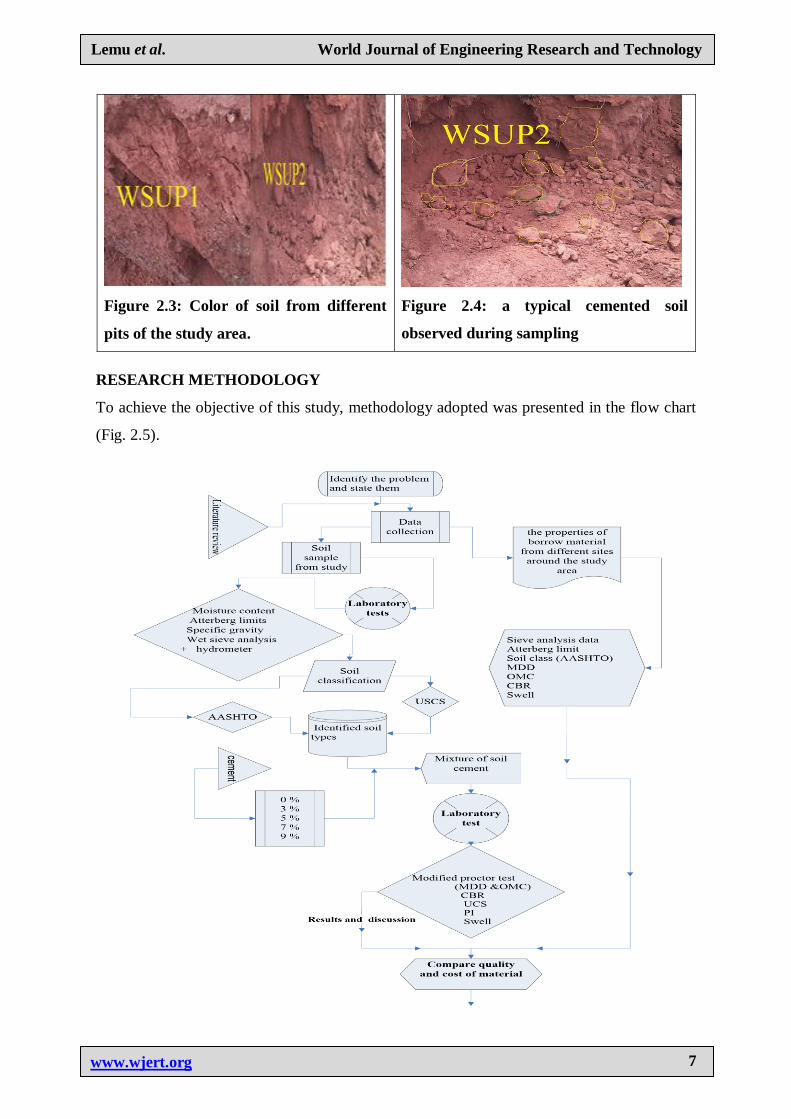
brown dark (Fig. 2.2). The bonding or cementing effects between particles were observed in
the test pits WSUP1 and WSUP2 and were marked with a circle (Fig 2.4)
Figure 2.1: the color of soil from GP1
and GP2 test pits.
Figure 2.2: Color of soil from NBSP1 and
NBSP1 test pits.
Lemu et al. World Journal of Engineering Research and Technology
www.wjert.org
7
Figure 2.3: Color of soil from different
pits of the study area.
Figure 2.4: a typical cemented soil
observed during sampling
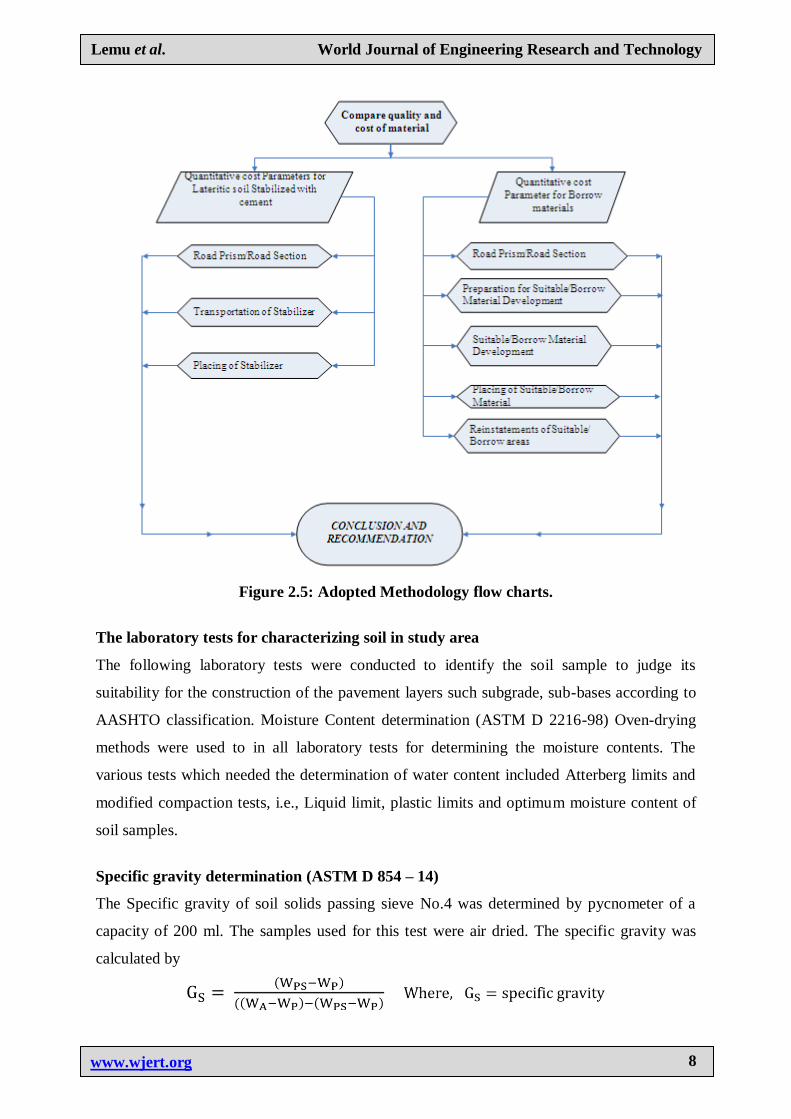
RESEARCH METHODOLOGY
To achieve the objective of this study, methodology adopted was presented in the flow chart
(Fig. 2.5).
Lemu et al. World Journal of Engineering Research and Technology
www.wjert.org
8
Figure 2.5: Adopted Methodology flow charts.
The laboratory tests for characterizing soil in study area
The following laboratory tests were conducted to identify the soil sample to judge its
suitability for the construction of the pavement layers such subgrade, sub-bases according to
AASHTO classification. Moisture Content determination (ASTM D 2216-98) Oven-drying
methods were used to in all laboratory tests for determining the moisture contents. The
various tests which needed the determination of water content included Atterberg limits and
modified compaction tests, i.e., Liquid limit, plastic limits and optimum moisture content of
soil samples.
Specific gravity determination (ASTM D 854 – 14)
The Specific gravity of soil solids passing sieve No.4 was determined by pycnometer of a
capacity of 200 ml. The samples used for this test were air dried. The specific gravity was
calculated by
Lemu et al. World Journal of Engineering Research and Technology
www.wjert.org
9
Wp = mass of empty, clean pycnometer (grams)
WPS = mass of empty pycnometer + mass of dry soil (grams)
W𝐁 = Mass of pycnometer + dry soil + water (grams)
WA = Mass of pycnometer + water (grams)
Particle Size Distribution (ASTM D 422-63)
Wet sieve analysis was performed on 1000 grams of air-dry soil specimen. The soil
specimens consisted of flocculated particles, and therefore these were placed in water for a
minimum period of 18 hours for deflocculating. Each sample was then washed on the sieve
No. 200 to separate the course from fine fraction until clean water started coming out. Both
fractions, i.e., + and – 200 mm sieve contents, were placed in an oven for drying. Sieve
analysis was carried out on the coarse fraction. The sieve size used for this test included
9.5mm, 4.75mm, 2.36mm, 1.18mm, 0.6mm, 0.3mm, 0.15mm and 0.075mm. Hydrometer
analysis was performed in assessing the quantities of silt and clay in the fine fraction for each
soil specimen.
Atterberg Limits (ASTM D 4318-00)
Atterberg limits of lateritic soil under study were determined on air dried, and oven dried
samples treating them as tropical soils. Samples collected from the study area were spread in
a thin layer in open air for a considerable period, but not less than two days to dry.
Casagrande liquid limit apparatus was used for the determination of liquid limit on soil
samples passing sieve No.10. However, the specimen mixed with a suitable quantity of water
was kept for 16 hours to mature and then used for liquid determination. A plastic limit was
also determined on samples passing No.10 sieve and well matured. A limited quantity of
well-matured soil specimen was used to roll into threads of 3 mm diameter. The plasticity
index was then computed for each soil based on the values obtained from the liquid and
plastic limit. The liquid limit and plasticity index was utilized to classify each soil.
Soil Classification (ASTM D 2487-06 and ASTM D3282-09)
For the soil classification of soil, AASHTO and USCS were adopted because AASTO is
widely used in highway engineering and USCS is equally widely is used for general
engineering purposes. Both the classification systems are based on the particle-size
distribution and Atterberg limits. Both systems divide the soils into two major categories,
coarse grained and fine grained, as separated by the No. 200 sieve. According to the
AASHTO system, the soil is considered fine-grained when more than 35% passes through the
Lemu et al. World Journal of Engineering Research and Technology
www.wjert.org
10
No. 200 sieve. According to the USCS, soil is considered fine-grained when more than 50%
passes through the No. 200 sieve. Both the systems have developed their charts for the
demarcation of soil in various zones which have been used in this study.
Comparative study of original soil and treated soil with cement
Sample preparation
Lateritic soil available in the study area was not competent for the construction of good
quality of pavement layers and therefore traditionally, it was being replaced by another soil of
better engineering properties. It was therefore thought to study the soil as it was and with
Portland pozzolana cement treatment. Air dried lateritic soil were sieved through the sieve
No.4 (4.75mm) to remove courser particles, then mixed with different cement contents 3%,
5%, 7% and 9 % by dry weight percentages.
The procedures followed in all the preparation of mixture as follows
Suitable quantities of air dry lateritic soils were measured for conducting of each of the tests
i.e. modified proctor test, CBR, UCS tests. Specified cement amount was uniformly spread
on the dry soil sample and each mix was thoroughly mixed by hand till a uniform mixture of
color appeared. Soil samples proposed for Modified Proctor test were mixed with a suitable
quantity of water based on the dry weight of the sample taking 8%, 16%, 24%, 32%, and
40% as percentages of water to be added so as to find the amount of optimum water content
which could be corresponding to the maximum dry density. The wet samples so mixed with
cement were placed in airtight plastic bags for curing period of 2 hours on the first day, then
7, 14 and 28 days at room temperature. The moisture contents were checked daily or as
required and the mixed soil cement agitated to prevent flocculation of the clay particles.
Cement mixed lateritic soil was compacted at modifying proctor test densities as per ASTM
D1557 – 12 after curing periods of 2 hours, 7, 14 and 28 days to study the effect of curing
period on the maximum dry density and optimum moisture content. Similar procedure for the
preparation of soil-cement specimens were adopted for other tests too i.e., CBR and UCS
tests. These tests were, however conducted on optimum moisture content and dry density was
confirmed after each test.
Laboratory tests on untreated and cement treated lateritic soil
The procedure adopted for conducting the compaction test, CBR and UCS tests on soil and
treated-lateritic soil are discussed in the following sub-sections. The untreated and cement
treated lateritic soil was compacted by the same energy as was used while compacting the
Lemu et al. World Journal of Engineering Research and Technology
www.wjert.org
11
soil specimen in the Modified Proctor test to achieve maximum dry density and optimum
moisture content to study the relative effects of percentages of Portland pozzolana cement on
the lateritic soil. Similar studies were made in case of CBR and UCS tests, effects of curing
period are also studied.
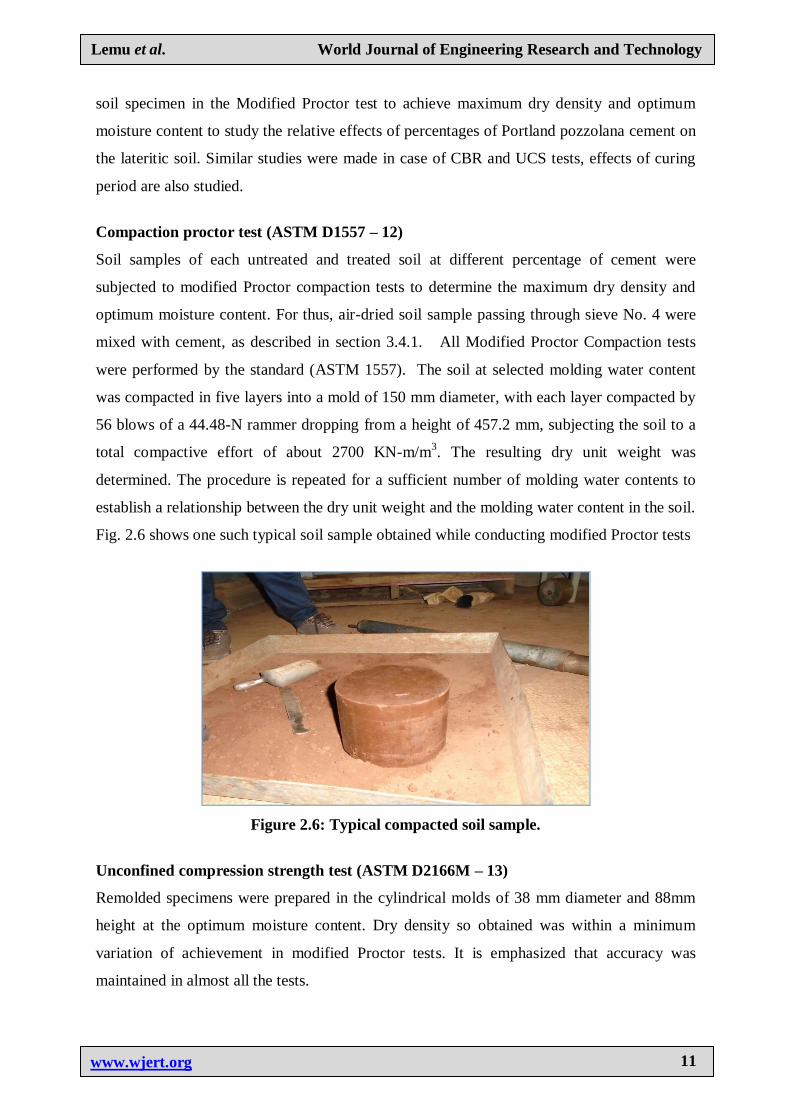
Compaction proctor test (ASTM D1557 – 12)
Soil samples of each untreated and treated soil at different percentage of cement were
subjected to modified Proctor compaction tests to determine the maximum dry density and
optimum moisture content. For thus, air-dried soil sample passing through sieve No. 4 were
mixed with cement, as described in section 3.4.1. All Modified Proctor Compaction tests
were performed by the standard (ASTM 1557). The soil at selected molding water content
was compacted in five layers into a mold of 150 mm diameter, with each layer compacted by
56 blows of a 44.48-N rammer dropping from a height of 457.2 mm, subjecting the soil to a
total compactive effort of about 2700 KN-m/m3. The resulting dry unit weight was
determined. The procedure is repeated for a sufficient number of molding water contents to
establish a relationship between the dry unit weight and the molding water content in the soil.
Fig. 2.6 shows one such typical soil sample obtained while conducting modified Proctor tests
Figure 2.6: Typical compacted soil sample.
Unconfined compression strength test (ASTM D2166M – 13)
Remolded specimens were prepared in the cylindrical molds of 38 mm diameter and 88mm
height at the optimum moisture content. Dry density so obtained was within a minimum
variation of achievement in modified Proctor tests. It is emphasized that accuracy was
maintained in almost all the tests.
Lemu et al. World Journal of Engineering Research and Technology
www.wjert.org
12
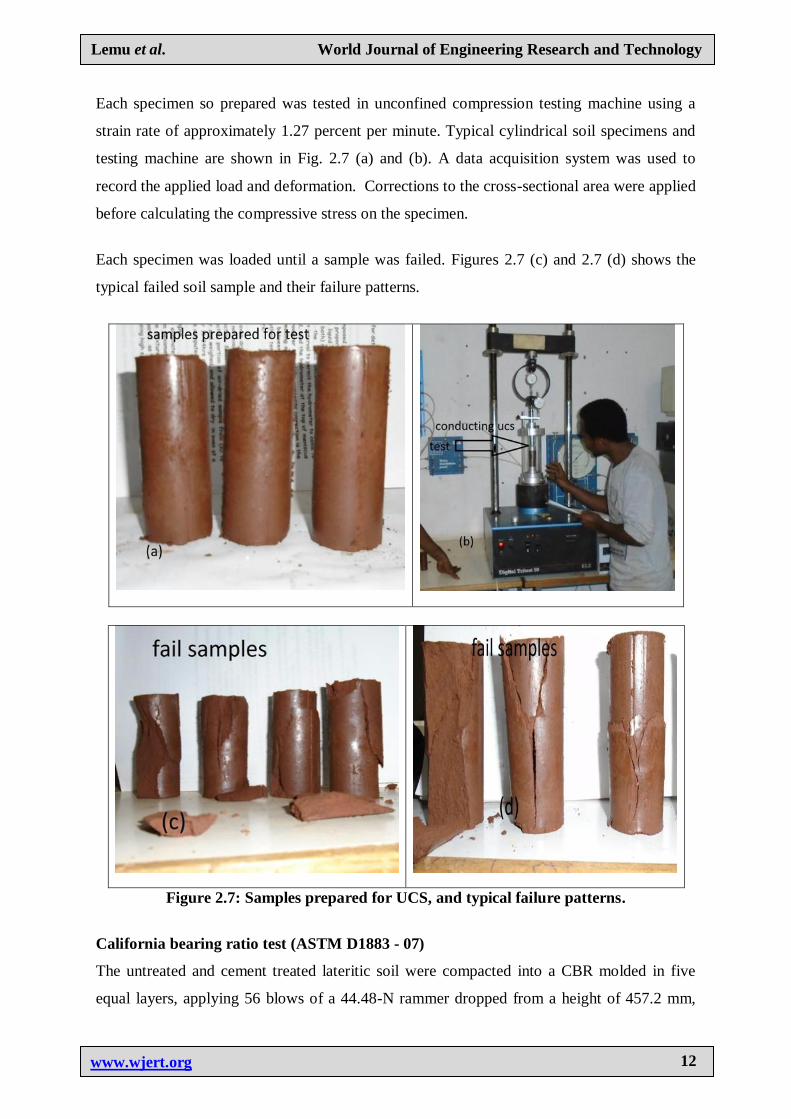
Each specimen so prepared was tested in unconfined compression testing machine using a
strain rate of approximately 1.27 percent per minute. Typical cylindrical soil specimens and
testing machine are shown in Fig. 2.7 (a) and (b). A data acquisition system was used to
record the applied load and deformation. Corrections to the cross-sectional area were applied
before calculating the compressive stress on the specimen.
Each specimen was loaded until a sample was failed. Figures 2.7 (c) and 2.7 (d) shows the
typical failed soil sample and their failure patterns.
Figure 2.7: Samples prepared for UCS, and typical failure patterns.
California bearing ratio test (ASTM D1883 - 07)
The untreated and cement treated lateritic soil were compacted into a CBR molded in five
equal layers, applying 56 blows of a 44.48-N rammer dropped from a height of 457.2 mm,
Lemu et al. World Journal of Engineering Research and Technology
www.wjert.org
13
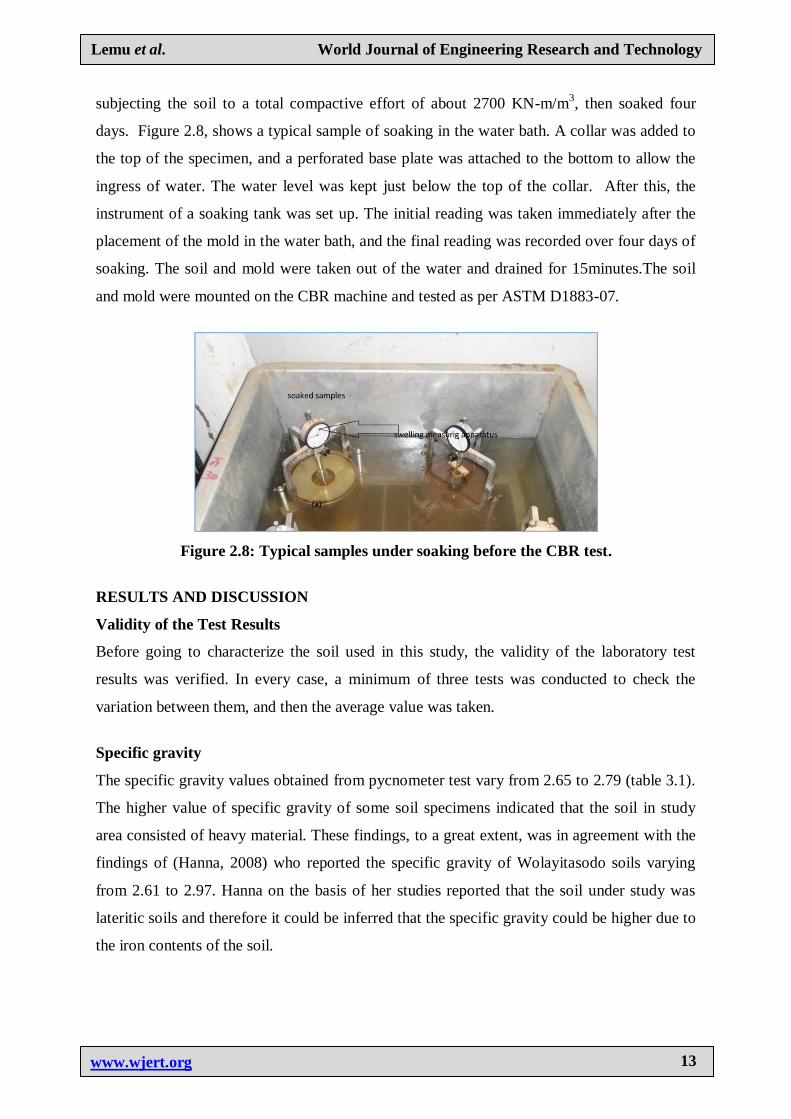
subjecting the soil to a total compactive effort of about 2700 KN-m/m3, then soaked four
days. Figure 2.8, shows a typical sample of soaking in the water bath. A collar was added to
the top of the specimen, and a perforated base plate was attached to the bottom to allow the
ingress of water. The water level was kept just below the top of the collar. After this, the
instrument of a soaking tank was set up. The initial reading was taken immediately after the
placement of the mold in the water bath, and the final reading was recorded over four days of
soaking. The soil and mold were taken out of the water and drained for 15minutes.The soil
and mold were mounted on the CBR machine and tested as per ASTM D1883-07.
Figure 2.8: Typical samples under soaking before the CBR test.
RESULTS AND DISCUSSION
Validity of the Test Results
Before going to characterize the soil used in this study, the validity of the laboratory test
results was verified. In every case, a minimum of three tests was conducted to check the
variation between them, and then the average value was taken.
Specific gravity
The specific gravity values obtained from pycnometer test vary from 2.65 to 2.79 (table 3.1).
The higher value of specific gravity of some soil specimens indicated that the soil in study
area consisted of heavy material. These findings, to a great extent, was in agreement with the
findings of (Hanna, 2008) who reported the specific gravity of Wolayitasodo soils varying
from 2.61 to 2.97. Hanna on the basis of her studies reported that the soil under study was
lateritic soils and therefore it could be inferred that the specific gravity could be higher due to
the iron contents of the soil.
Lemu et al. World Journal of Engineering Research and Technology
www.wjert.org
14
Table 3.1: Average specific gravity values of different pit tests.
Test pits GP1 GP2 NBSP1 NBSP2 WSUP1 WSUP2
Average specific gravity 2.79 2.72 2.65 2.69 2.74 2.76
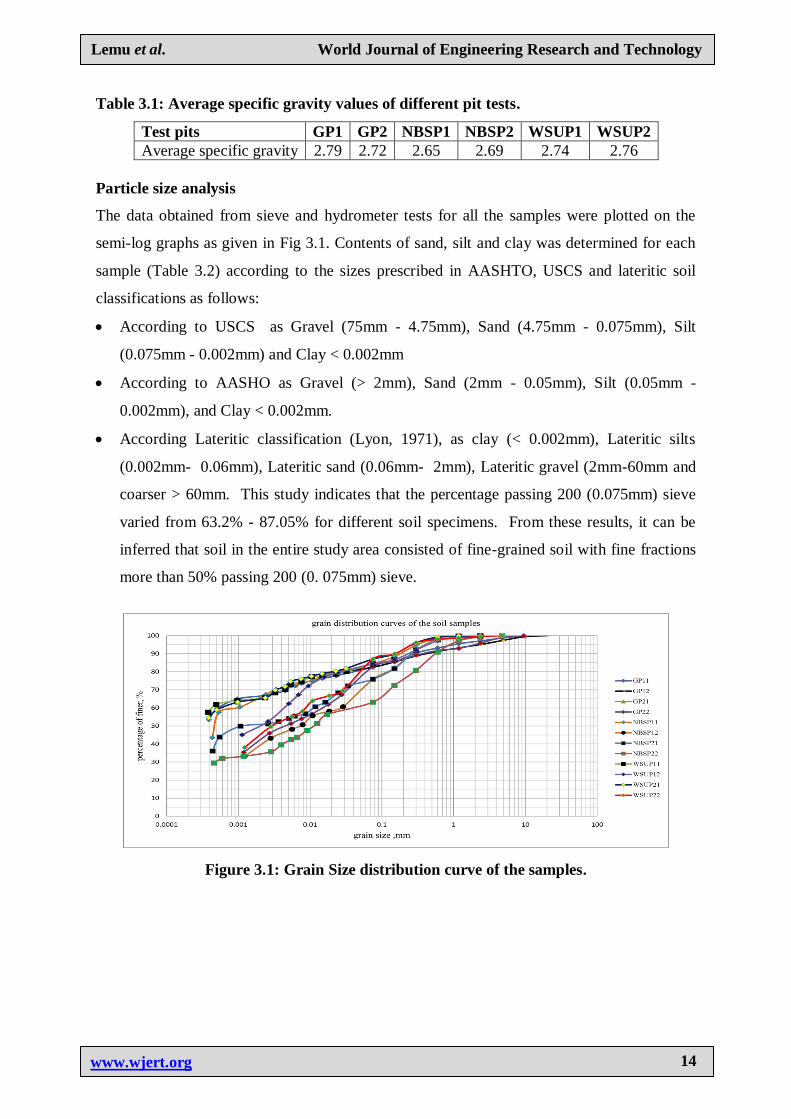
Particle size analysis
The data obtained from sieve and hydrometer tests for all the samples were plotted on the
semi-log graphs as given in Fig 3.1. Contents of sand, silt and clay was determined for each
sample (Table 3.2) according to the sizes prescribed in AASHTO, USCS and lateritic soil
classifications as follows:
According to USCS as Gravel (75mm - 4.75mm), Sand (4.75mm - 0.075mm), Silt
(0.075mm - 0.002mm) and Clay < 0.002mm
According to AASHO as Gravel (> 2mm), Sand (2mm - 0.05mm), Silt (0.05mm -
0.002mm), and Clay < 0.002mm.
According Lateritic classification (Lyon, 1971), as clay (< 0.002mm), Lateritic silts
(0.002mm- 0.06mm), Lateritic sand (0.06mm- 2mm), Lateritic gravel (2mm-60mm and
coarser > 60mm. This study indicates that the percentage passing 200 (0.075mm) sieve
varied from 63.2% - 87.05% for different soil specimens. From these results, it can be
inferred that soil in the entire study area consisted of fine-grained soil with fine fractions
more than 50% passing 200 (0. 075mm) sieve.
Figure 3.1: Grain Size distribution curve of the samples.
Lemu et al. World Journal of Engineering Research and Technology
www.wjert.org
15
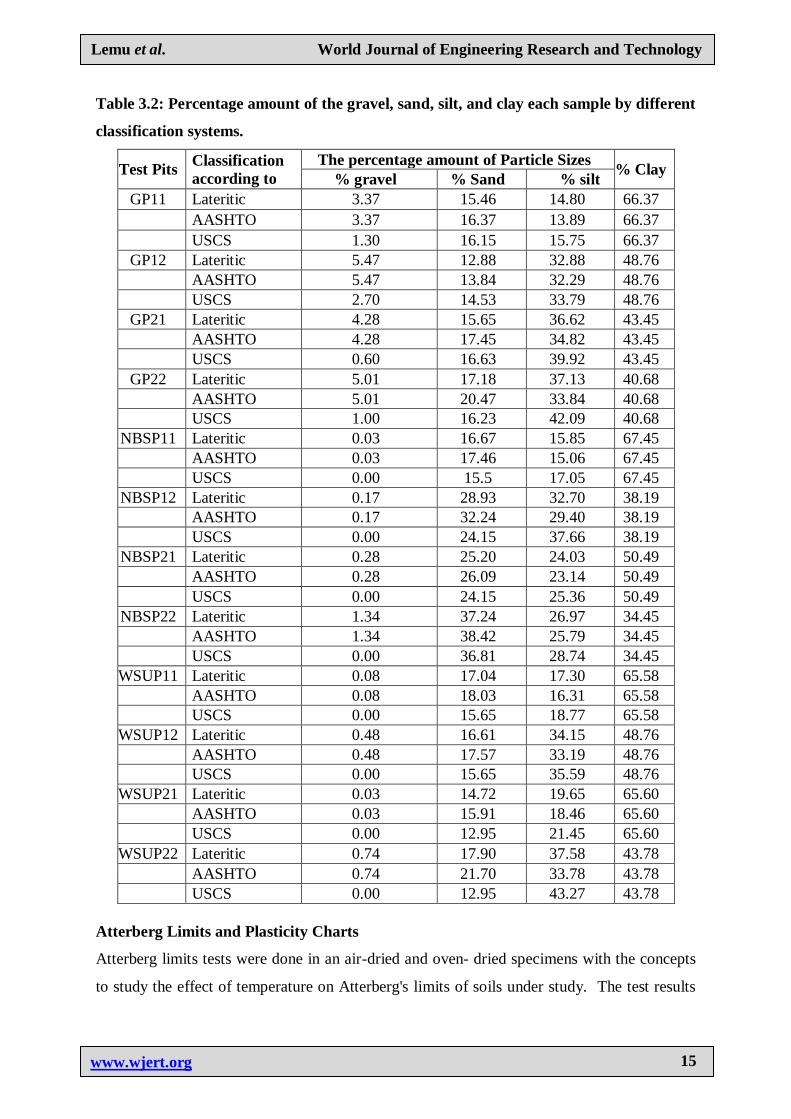
Table 3.2: Percentage amount of the gravel, sand, silt, and clay each sample by different
classification systems.
Test Pits Classification
according to
The percentage amount of Particle Sizes % Clay
% gravel % Sand % silt
GP11 Lateritic 3.37 15.46 14.80 66.37
AASHTO 3.37 16.37 13.89 66.37
USCS 1.30 16.15 15.75 66.37
GP12 Lateritic 5.47 12.88 32.88 48.76
AASHTO 5.47 13.84 32.29 48.76
USCS 2.70 14.53 33.79 48.76
GP21 Lateritic 4.28 15.65 36.62 43.45
AASHTO 4.28 17.45 34.82 43.45
USCS 0.60 16.63 39.92 43.45
GP22 Lateritic 5.01 17.18 37.13 40.68
AASHTO 5.01 20.47 33.84 40.68
USCS 1.00 16.23 42.09 40.68
NBSP11 Lateritic 0.03 16.67 15.85 67.45
AASHTO 0.03 17.46 15.06 67.45
USCS 0.00 15.5 17.05 67.45
NBSP12 Lateritic 0.17 28.93 32.70 38.19
AASHTO 0.17 32.24 29.40 38.19
USCS 0.00 24.15 37.66 38.19
NBSP21 Lateritic 0.28 25.20 24.03 50.49
AASHTO 0.28 26.09 23.14 50.49
USCS 0.00 24.15 25.36 50.49
NBSP22 Lateritic 1.34 37.24 26.97 34.45
AASHTO 1.34 38.42 25.79 34.45
USCS 0.00 36.81 28.74 34.45
WSUP11 Lateritic 0.08 17.04 17.30 65.58
AASHTO 0.08 18.03 16.31 65.58
USCS 0.00 15.65 18.77 65.58
WSUP12 Lateritic 0.48 16.61 34.15 48.76
AASHTO 0.48 17.57 33.19 48.76
USCS 0.00 15.65 35.59 48.76
WSUP21 Lateritic 0.03 14.72 19.65 65.60
AASHTO 0.03 15.91 18.46 65.60
USCS 0.00 12.95 21.45 65.60
WSUP22 Lateritic 0.74 17.90 37.58 43.78
AASHTO 0.74 21.70 33.78 43.78
USCS 0.00 12.95 43.27 43.78
Atterberg Limits and Plasticity Charts
Atterberg limits tests were done in an air-dried and oven- dried specimens with the concepts
to study the effect of temperature on Atterberg's limits of soils under study. The test results
Lemu et al. World Journal of Engineering Research and Technology
www.wjert.org
16
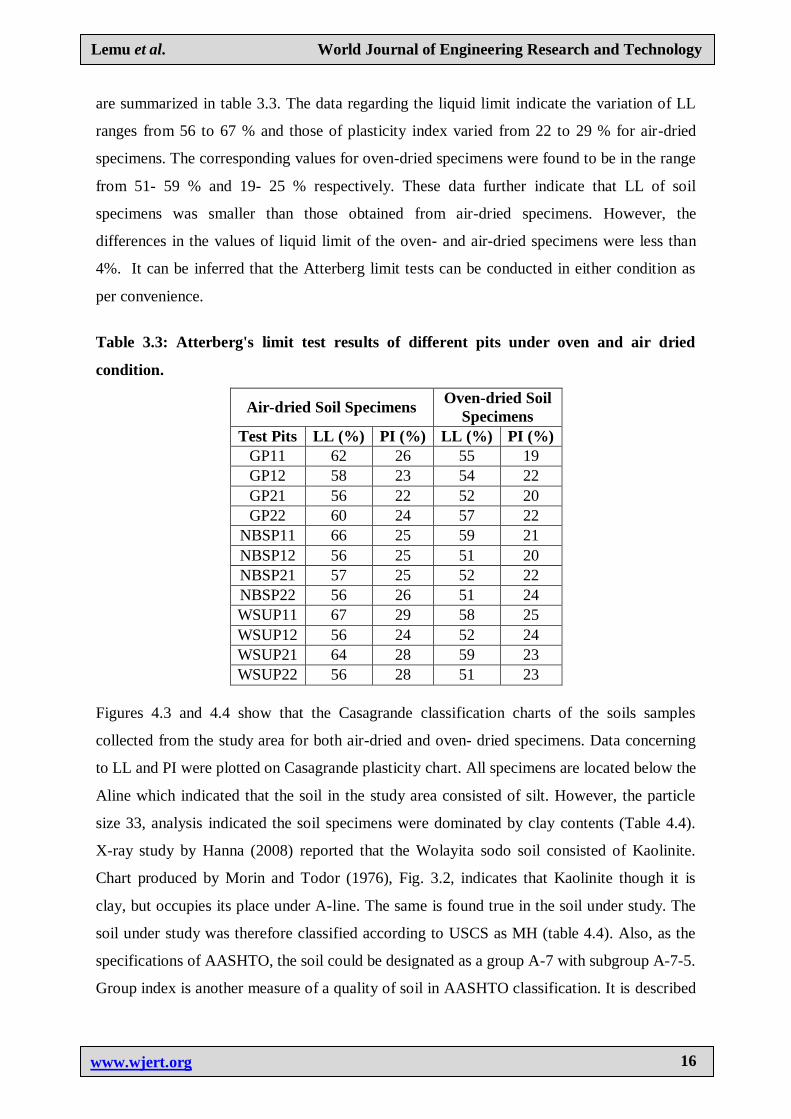
are summarized in table 3.3. The data regarding the liquid limit indicate the variation of LL
ranges from 56 to 67 % and those of plasticity index varied from 22 to 29 % for air-dried
specimens. The corresponding values for oven-dried specimens were found to be in the range
from 51- 59 % and 19- 25 % respectively. These data further indicate that LL of soil
specimens was smaller than those obtained from air-dried specimens. However, the
differences in the values of liquid limit of the oven- and air-dried specimens were less than
4%. It can be inferred that the Atterberg limit tests can be conducted in either condition as
per convenience.
Table 3.3: Atterberg's limit test results of different pits under oven and air dried
condition.
Air-dried Soil Specimens Oven-dried Soil
Specimens
Test Pits LL (%) PI (%) LL (%) PI (%)
GP11 62 26 55 19
GP12 58 23 54 22
GP21 56 22 52 20
GP22 60 24 57 22
NBSP11 66 25 59 21
NBSP12 56 25 51 20
NBSP21 57 25 52 22
NBSP22 56 26 51 24
WSUP11 67 29 58 25
WSUP12 56 24 52 24
WSUP21 64 28 59 23
WSUP22 56 28 51 23
Figures 4.3 and 4.4 show that the Casagrande classification charts of the soils samples
collected from the study area for both air-dried and oven- dried specimens. Data concerning
to LL and PI were plotted on Casagrande plasticity chart. All specimens are located below the
Aline which indicated that the soil in the study area consisted of silt. However, the particle
size 33, analysis indicated the soil specimens were dominated by clay contents (Table 4.4).
X-ray study by Hanna (2008) reported that the Wolayita sodo soil consisted of Kaolinite.
Chart produced by Morin and Todor (1976), Fig. 3.2, indicates that Kaolinite though it is
clay, but occupies its place under A-line. The same is found true in the soil under study. The
soil under study was therefore classified according to USCS as MH (table 4.4). Also, as the
specifications of AASHTO, the soil could be designated as a group A-7 with subgroup A-7-5.
Group index is another measure of a quality of soil in AASHTO classification. It is described
Lemu et al. World Journal of Engineering Research and Technology
www.wjert.org
17
by the following equation
GI= (F- 35) [0.2+0.005 (LL - 40)] + 0.01 (F-15) (PI-10)
Where F is the percent passing No.200 sieve. Other notations are usual. According to group
index, the suitability of the subgrade is judged by its value. Higher the value of group index,
lower will be the quality of the soil as subgrade material. The values of group indices are
presented in Table 4.4. From the data presented, it is found that group indices in the soil
specimens varied from 19 to 28. Any value equal to 20 or more indicates that the soil
subgrade is related to poor quality. By these data, the soil in study area consisting of lateritic
soil can be placed in the category of ‘fair to poor quality.' This might be the reason that
lateritic soil in the study area was replaced by selective borrows material to provide stable
subgrade and sub-base materials.
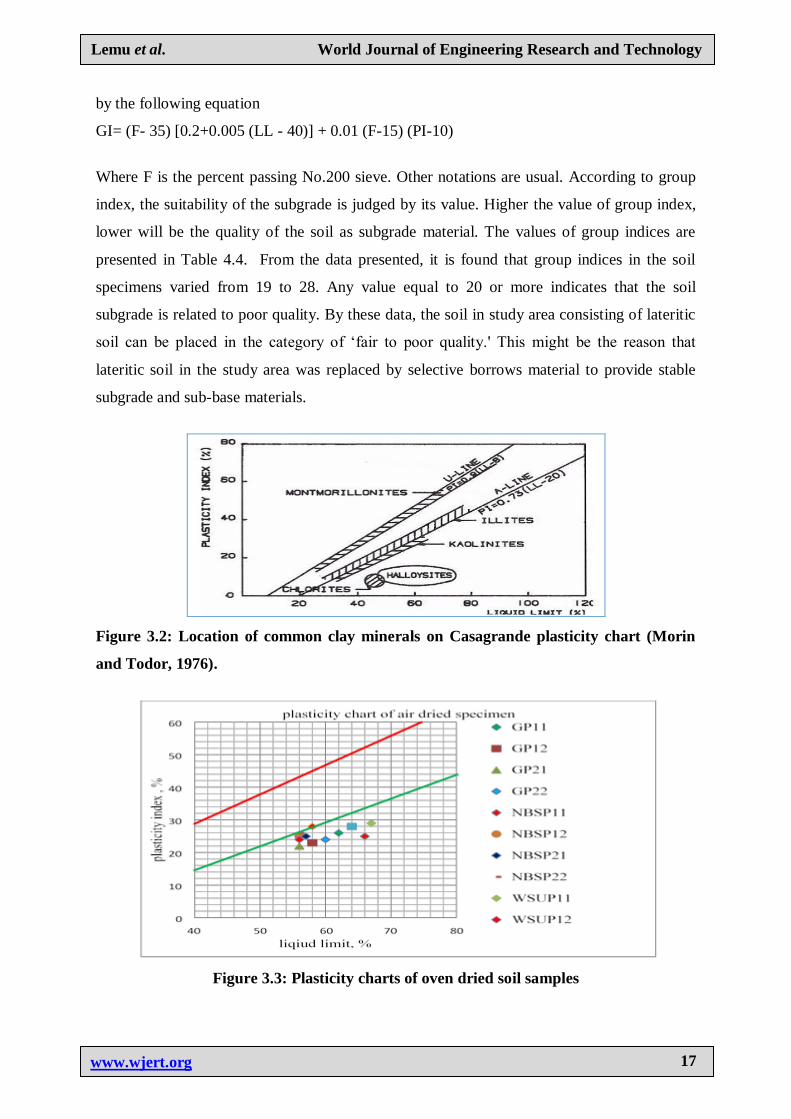
Figure 3.2: Location of common clay minerals on Casagrande plasticity chart (Morin
and Todor, 1976).
Figure 3.3: Plasticity charts of oven dried soil samples
Lemu et al. World Journal of Engineering Research and Technology
www.wjert.org
18
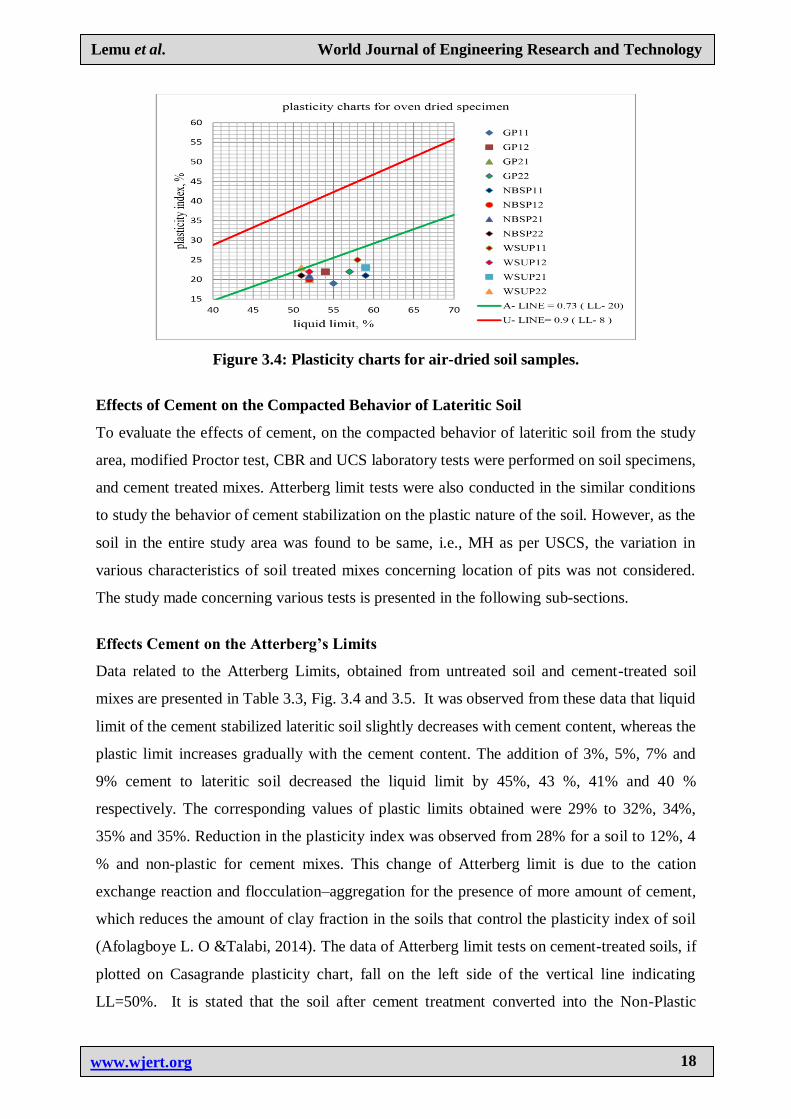
Figure 3.4: Plasticity charts for air-dried soil samples.
Effects of Cement on the Compacted Behavior of Lateritic Soil
To evaluate the effects of cement, on the compacted behavior of lateritic soil from the study
area, modified Proctor test, CBR and UCS laboratory tests were performed on soil specimens,
and cement treated mixes. Atterberg limit tests were also conducted in the similar conditions
to study the behavior of cement stabilization on the plastic nature of the soil. However, as the
soil in the entire study area was found to be same, i.e., MH as per USCS, the variation in
various characteristics of soil treated mixes concerning location of pits was not considered.
The study made concerning various tests is presented in the following sub-sections.
Effects Cement on the Atterberg’s Limits
Data related to the Atterberg Limits, obtained from untreated soil and cement-treated soil
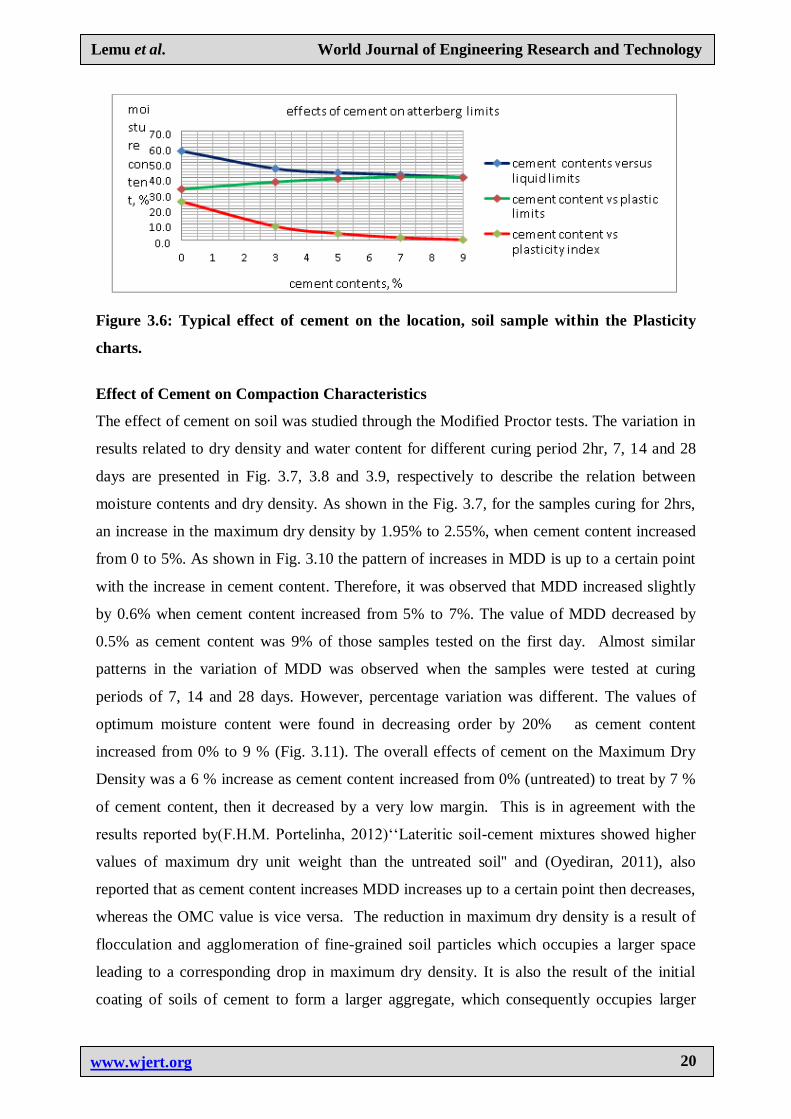
mixes are presented in Table 3.3, Fig. 3.4 and 3.5. It was observed from these data that liquid
limit of the cement stabilized lateritic soil slightly decreases with cement content, whereas the
plastic limit increases gradually with the cement content. The addition of 3%, 5%, 7% and
9% cement to lateritic soil decreased the liquid limit by 45%, 43 %, 41% and 40 %
respectively. The corresponding values of plastic limits obtained were 29% to 32%, 34%,
35% and 35%. Reduction in the plasticity index was observed from 28% for a soil to 12%, 4
% and non-plastic for cement mixes. This change of Atterberg limit is due to the cation
exchange reaction and flocculation–aggregation for the presence of more amount of cement,
which reduces the amount of clay fraction in the soils that control the plasticity index of soil
(Afolagboye L. O &Talabi, 2014). The data of Atterberg limit tests on cement-treated soils, if
plotted on Casagrande plasticity chart, fall on the left side of the vertical line indicating
LL=50%. It is stated that the soil after cement treatment converted into the Non-Plastic
Lemu et al. World Journal of Engineering Research and Technology
www.wjert.org
19
material. These results are in agreement with the results reported by Oyediran (2011) on the
stabilization of lateritic by cement.
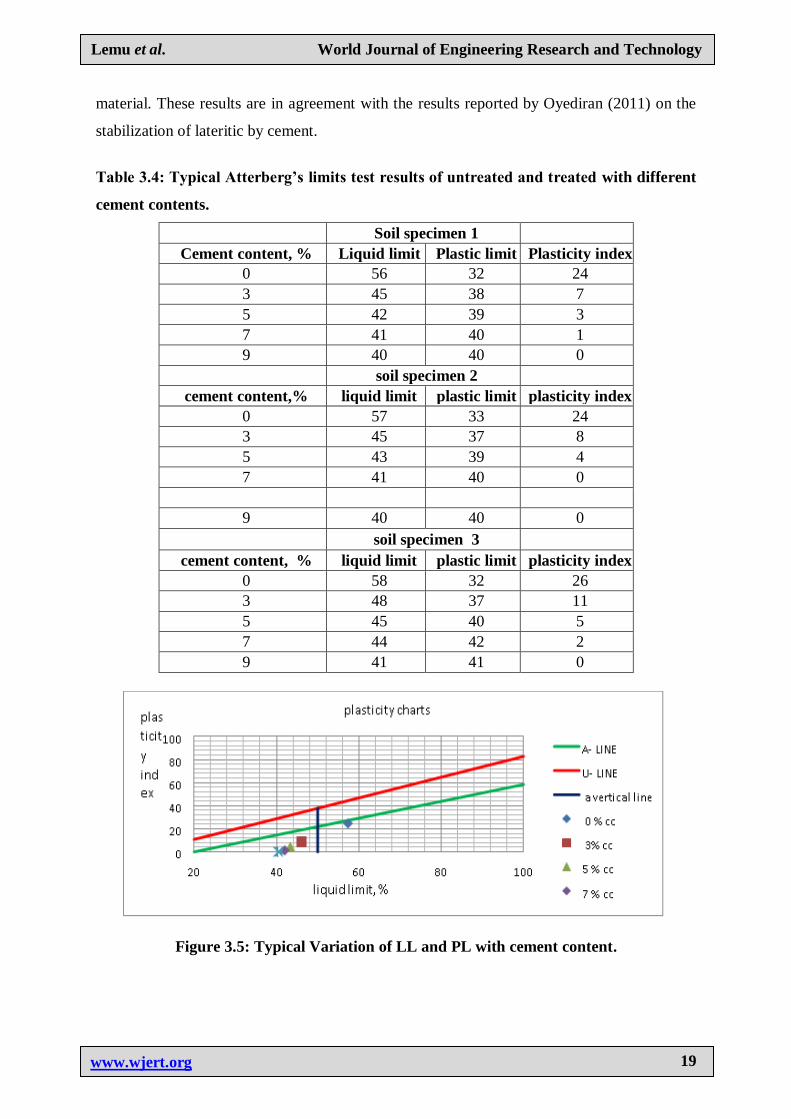
Table 3.4: Typical Atterberg’s limits test results of untreated and treated with different
cement contents.
Soil specimen 1
Cement content, % Liquid limit Plastic limit Plasticity index
0 56 32 24
3 45 38 7
5 42 39 3
7 41 40 1
9 40 40 0
soil specimen 2
cement content,% liquid limit plastic limit plasticity index
0 57 33 24
3 45 37 8
5 43 39 4
7 41 40 0
9 40 40 0
soil specimen 3
cement content, % liquid limit plastic limit plasticity index
0 58 32 26
3 48 37 11
5 45 40 5
7 44 42 2
9 41 41 0
Figure 3.5: Typical Variation of LL and PL with cement content.
Lemu et al. World Journal of Engineering Research and Technology
www.wjert.org
20
Figure 3.6: Typical effect of cement on the location, soil sample within the Plasticity
charts.
Effect of Cement on Compaction Characteristics
The effect of cement on soil was studied through the Modified Proctor tests. The variation in
results related to dry density and water content for different curing period 2hr, 7, 14 and 28
days are presented in Fig. 3.7, 3.8 and 3.9, respectively to describe the relation between
moisture contents and dry density. As shown in the Fig. 3.7, for the samples curing for 2hrs,
an increase in the maximum dry density by 1.95% to 2.55%, when cement content increased
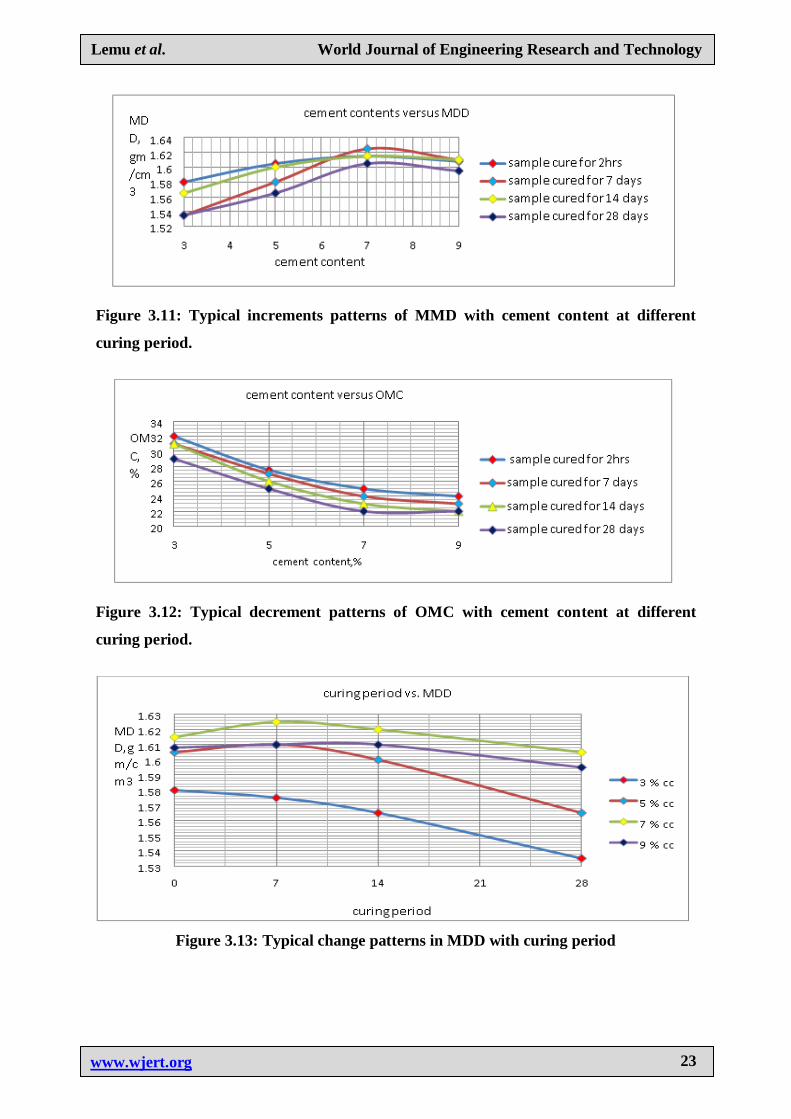
from 0 to 5%. As shown in Fig. 3.10 the pattern of increases in MDD is up to a certain point
with the increase in cement content. Therefore, it was observed that MDD increased slightly
by 0.6% when cement content increased from 5% to 7%. The value of MDD decreased by
0.5% as cement content was 9% of those samples tested on the first day. Almost similar
patterns in the variation of MDD was observed when the samples were tested at curing
periods of 7, 14 and 28 days. However, percentage variation was different. The values of
optimum moisture content were found in decreasing order by 20% as cement content
increased from 0% to 9 % (Fig. 3.11). The overall effects of cement on the Maximum Dry
Density was a 6 % increase as cement content increased from 0% (untreated) to treat by 7 %
of cement content, then it decreased by a very low margin. This is in agreement with the
results reported by(F.H.M. Portelinha, 2012)‘‘Lateritic soil-cement mixtures showed higher
values of maximum dry unit weight than the untreated soil'' and (Oyediran, 2011), also
reported that as cement content increases MDD increases up to a certain point then decreases,
whereas the OMC value is vice versa. The reduction in maximum dry density is a result of
flocculation and agglomeration of fine-grained soil particles which occupies a larger space
leading to a corresponding drop in maximum dry density. It is also the result of the initial
coating of soils of cement to form a larger aggregate, which consequently occupies larger
Lemu et al. World Journal of Engineering Research and Technology
www.wjert.org
21
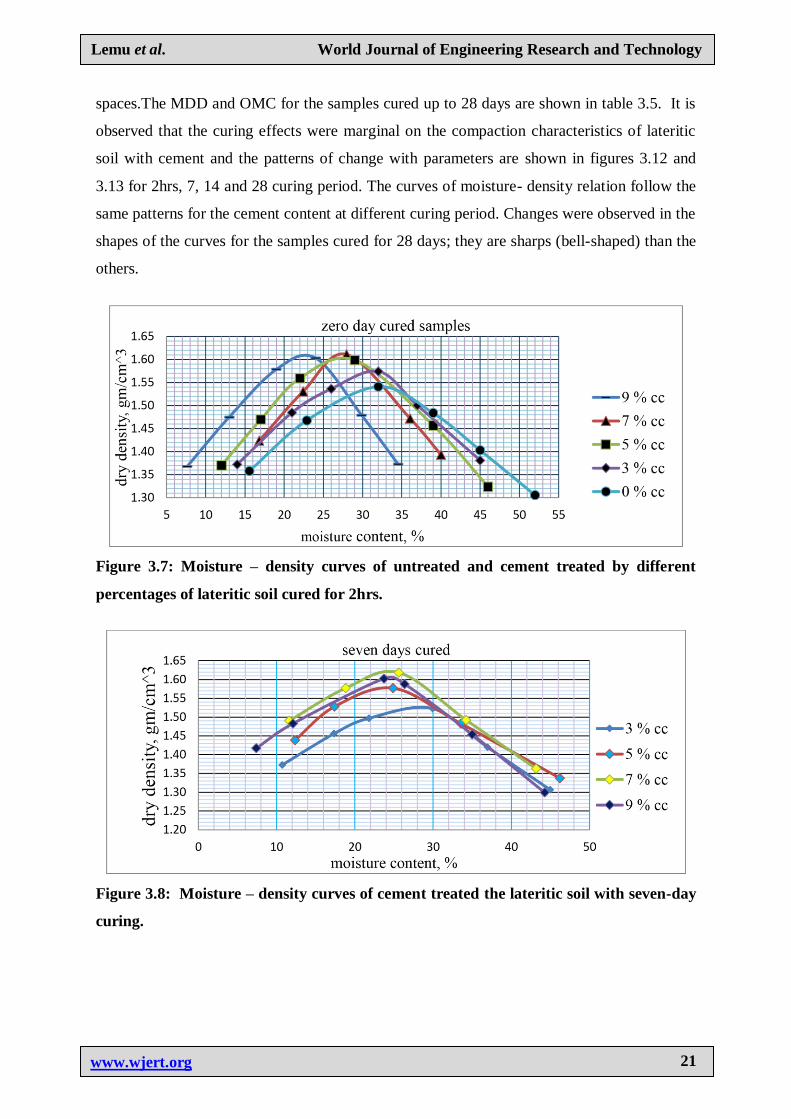
spaces.The MDD and OMC for the samples cured up to 28 days are shown in table 3.5. It is
observed that the curing effects were marginal on the compaction characteristics of lateritic
soil with cement and the patterns of change with parameters are shown in figures 3.12 and
3.13 for 2hrs, 7, 14 and 28 curing period. The curves of moisture- density relation follow the
same patterns for the cement content at different curing period. Changes were observed in the
shapes of the curves for the samples cured for 28 days; they are sharps (bell-shaped) than the
others.
Figure 3.7: Moisture – density curves of untreated and cement treated by different
percentages of lateritic soil cured for 2hrs.
Figure 3.8: Moisture – density curves of cement treated the lateritic soil with seven-day
curing.
Lemu et al. World Journal of Engineering Research and Technology
www.wjert.org
22
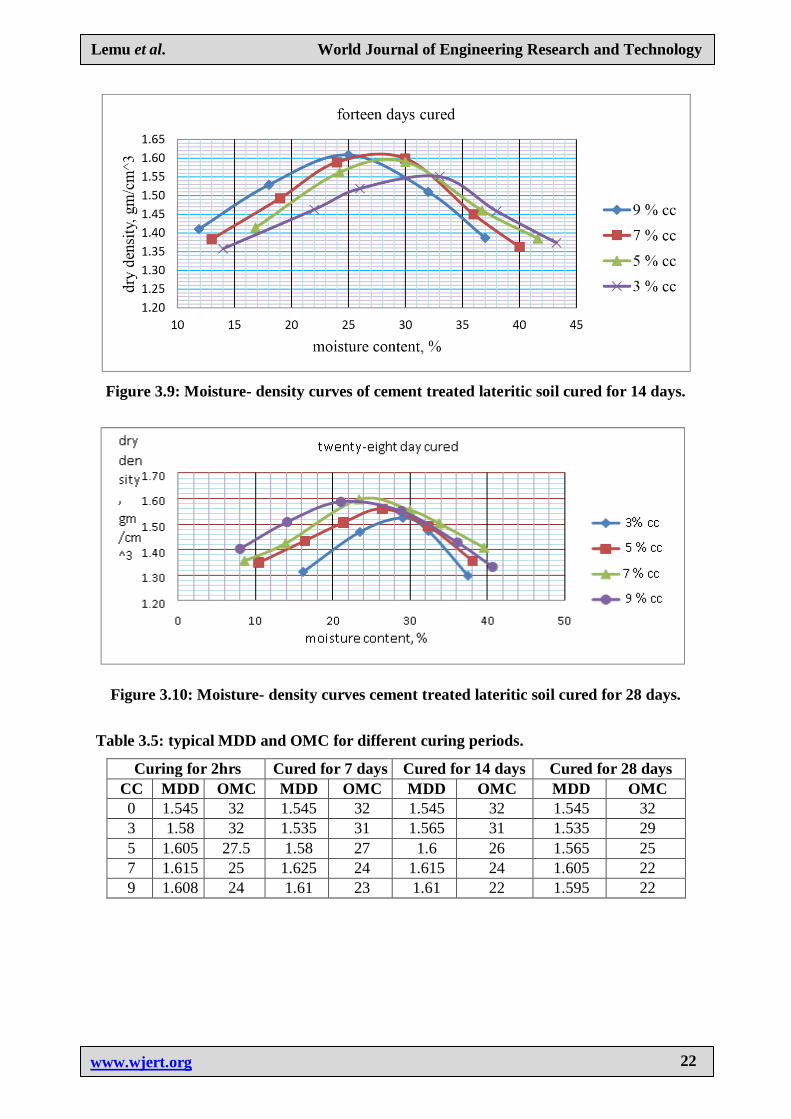
Figure 3.9: Moisture- density curves of cement treated lateritic soil cured for 14 days.
Figure 3.10: Moisture- density curves cement treated lateritic soil cured for 28 days.
Table 3.5: typical MDD and OMC for different curing periods.
Curing for 2hrs Cured for 7 days Cured for 14 days Cured for 28 days
CC MDD OMC MDD OMC MDD OMC MDD OMC
0 1.545 32 1.545 32 1.545 32 1.545 32
3 1.58 32 1.535 31 1.565 31 1.535 29
5 1.605 27.5 1.58 27 1.6 26 1.565 25
7 1.615 25 1.625 24 1.615 24 1.605 22
9 1.608 24 1.61 23 1.61 22 1.595 22
Lemu et al. World Journal of Engineering Research and Technology
www.wjert.org
23
Figure 3.11: Typical increments patterns of MMD with cement content at different
curing period.
Figure 3.12: Typical decrement patterns of OMC with cement content at different
curing period.
Figure 3.13: Typical change patterns in MDD with curing period
Lemu et al. World Journal of Engineering Research and Technology
www.wjert.org
24
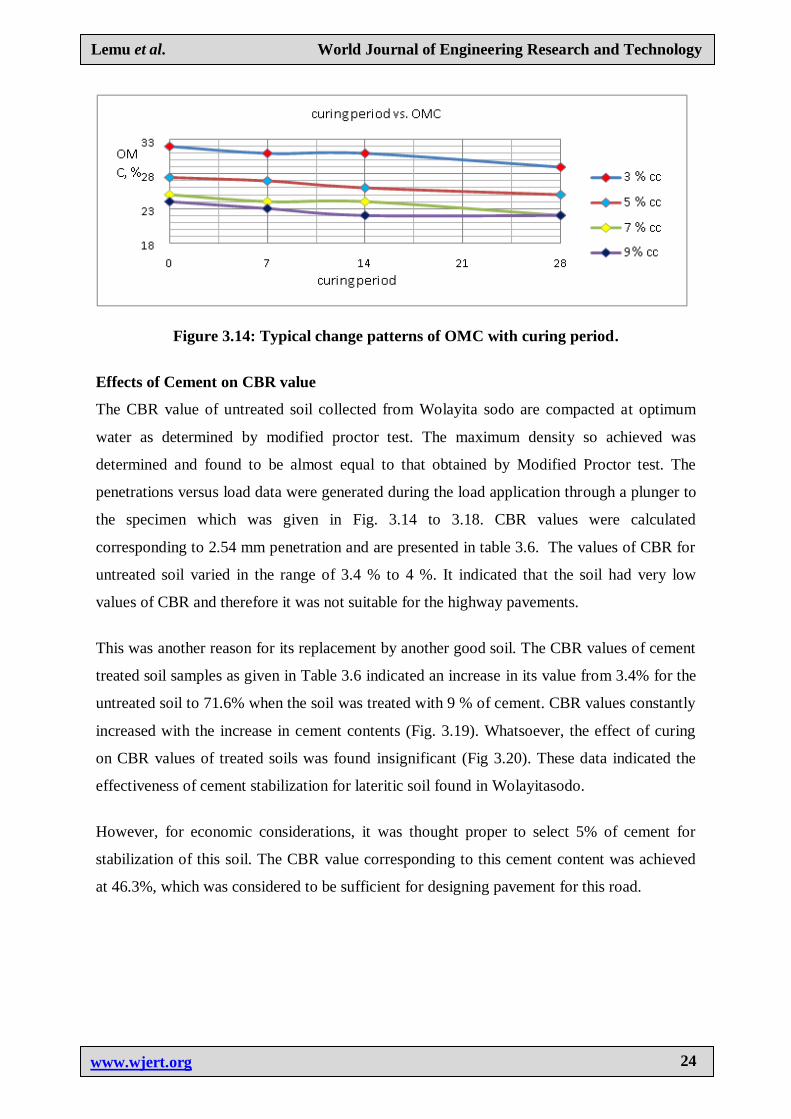
Figure 3.14: Typical change patterns of OMC with curing period.
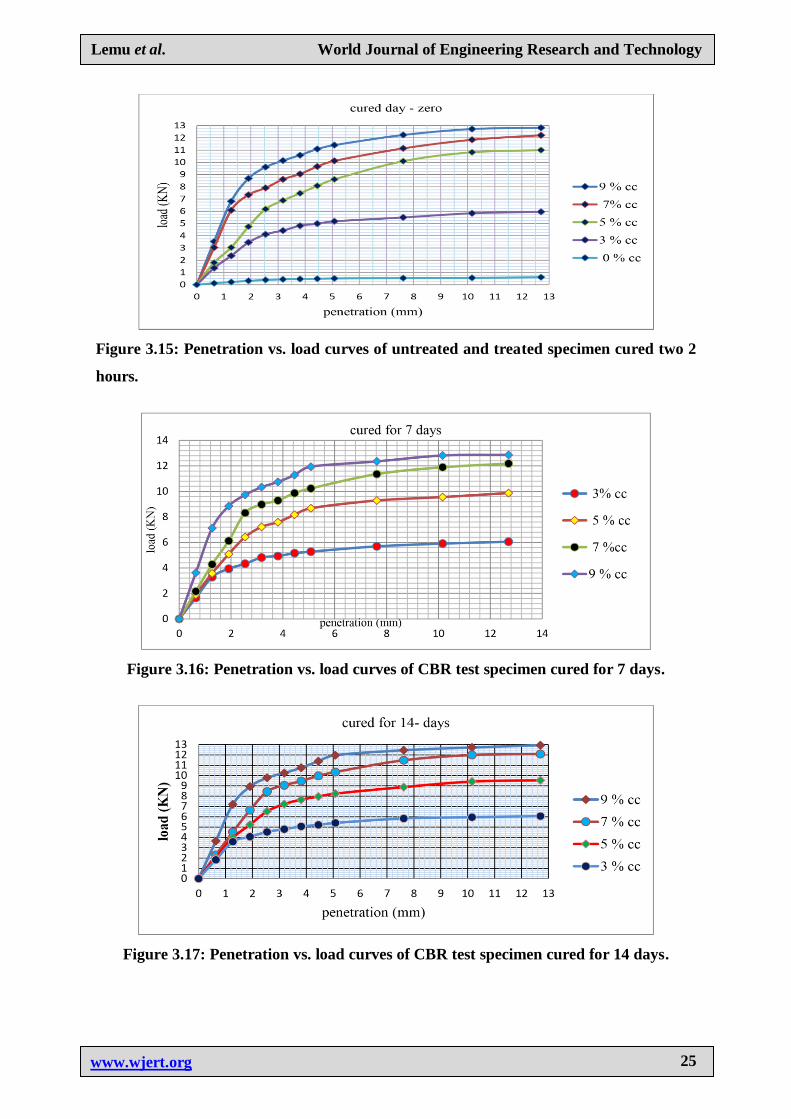
Effects of Cement on CBR value
The CBR value of untreated soil collected from Wolayita sodo are compacted at optimum
water as determined by modified proctor test. The maximum density so achieved was
determined and found to be almost equal to that obtained by Modified Proctor test. The
penetrations versus load data were generated during the load application through a plunger to
the specimen which was given in Fig. 3.14 to 3.18. CBR values were calculated
corresponding to 2.54 mm penetration and are presented in table 3.6. The values of CBR for
untreated soil varied in the range of 3.4 % to 4 %. It indicated that the soil had very low
values of CBR and therefore it was not suitable for the highway pavements.
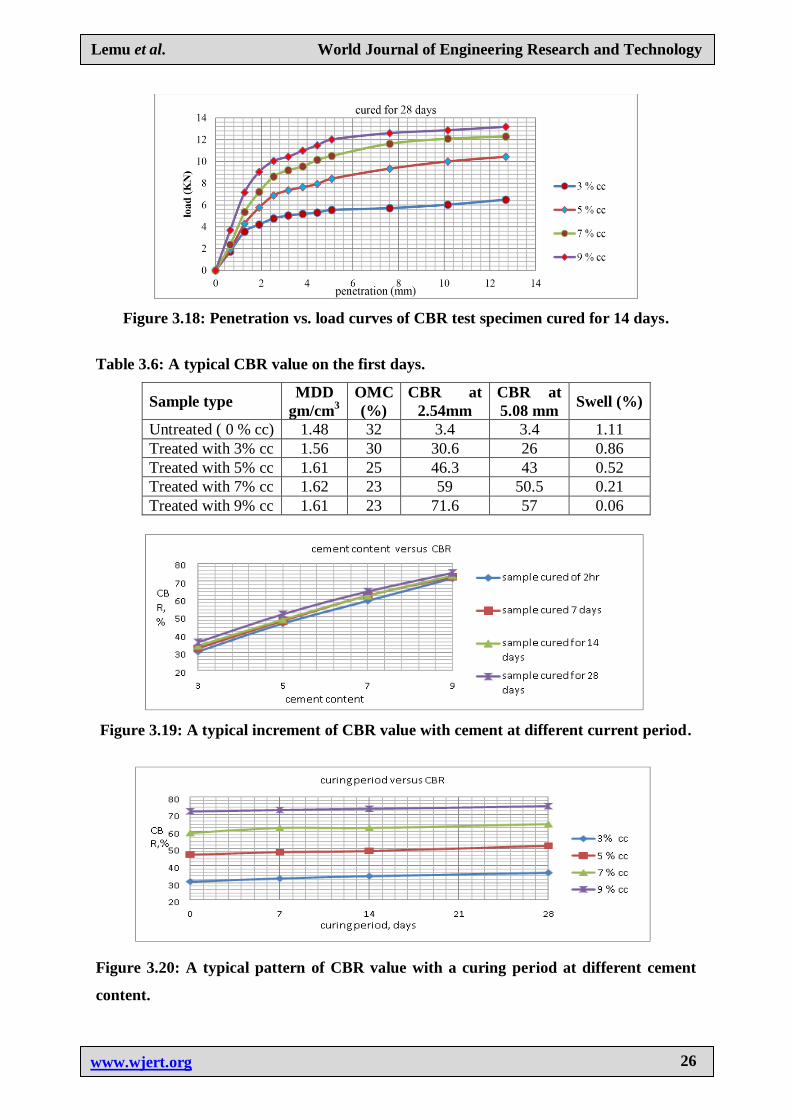
This was another reason for its replacement by another good soil. The CBR values of cement
treated soil samples as given in Table 3.6 indicated an increase in its value from 3.4% for the
untreated soil to 71.6% when the soil was treated with 9 % of cement. CBR values constantly
increased with the increase in cement contents (Fig. 3.19). Whatsoever, the effect of curing
on CBR values of treated soils was found insignificant (Fig 3.20). These data indicated the
effectiveness of cement stabilization for lateritic soil found in Wolayitasodo.
However, for economic considerations, it was thought proper to select 5% of cement for
stabilization of this soil. The CBR value corresponding to this cement content was achieved
at 46.3%, which was considered to be sufficient for designing pavement for this road.
Lemu et al. World Journal of Engineering Research and Technology
www.wjert.org
25
Figure 3.15: Penetration vs. load curves of untreated and treated specimen cured two 2
hours.
Figure 3.16: Penetration vs. load curves of CBR test specimen cured for 7 days.
Figure 3.17: Penetration vs. load curves of CBR test specimen cured for 14 days.
Lemu et al. World Journal of Engineering Research and Technology
www.wjert.org
26
Figure 3.18: Penetration vs. load curves of CBR test specimen cured for 14 days.
Table 3.6: A typical CBR value on the first days.
Sample type MDD
gm/cm3
OMC
(%)
CBR at
2.54mm
CBR at
5.08 mm Swell (%)
Untreated ( 0 % cc) 1.48 32 3.4 3.4 1.11
Treated with 3% cc 1.56 30 30.6 26 0.86
Treated with 5% cc 1.61 25 46.3 43 0.52
Treated with 7% cc 1.62 23 59 50.5 0.21
Treated with 9% cc 1.61 23 71.6 57 0.06
Figure 3.19: A typical increment of CBR value with cement at different current period.
Figure 3.20: A typical pattern of CBR value with a curing period at different cement
content.

Lemu et al. World Journal of Engineering Research and Technology
www.wjert.org
27
The effect of swelling was studied for untreated soil and cemented treated soil mixes. It was
found that the swell was not significant for the soil itself (0.8%) as indicated in Fig.4.21.
Whatsoever, cement treatment reduced the swell to 0.2 to zero percent if it was treated by 3%
and 9% of cement respectively.
Figure 3.21: a typical patterns decrement of swell percentage with cement.
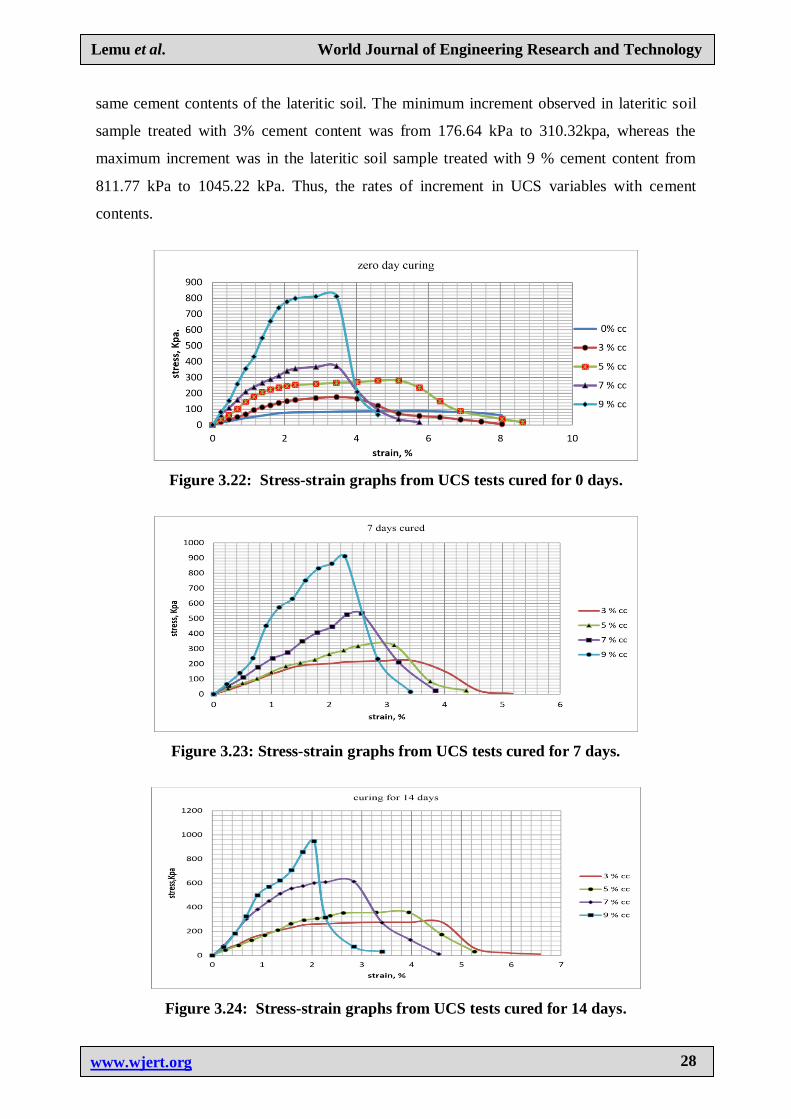
Effects of Cement Unconfined Compressive Strength
The data generated for unconfined compression tests are presented in the form of graphs in
Fig. 3.22, 3.23, 3.24 and 3.25. The figures illustrate the stress, strain behavior of original
lateritic soil and cement treated lateritic soil under vertical load. Untreated compacted lateritic
soil specimens had unconfined compressive strength 103.98kpa, whereas those for treated
with cement by 3%, 5%, 7% and 9% were 176.64kpa, 280.52kpa, 372.06kpa, and 811.77kpa
respectively for the sample cured for two hours only. The values indicated an increasing
trend in UCS of treated specimens. The rate of increment in unconfined compressive strength
is low as cement content increased from zero to 3% and it is increased to the maximum rate
of increment up to120% as cement increased from 7% to 9% in the first days mixing.
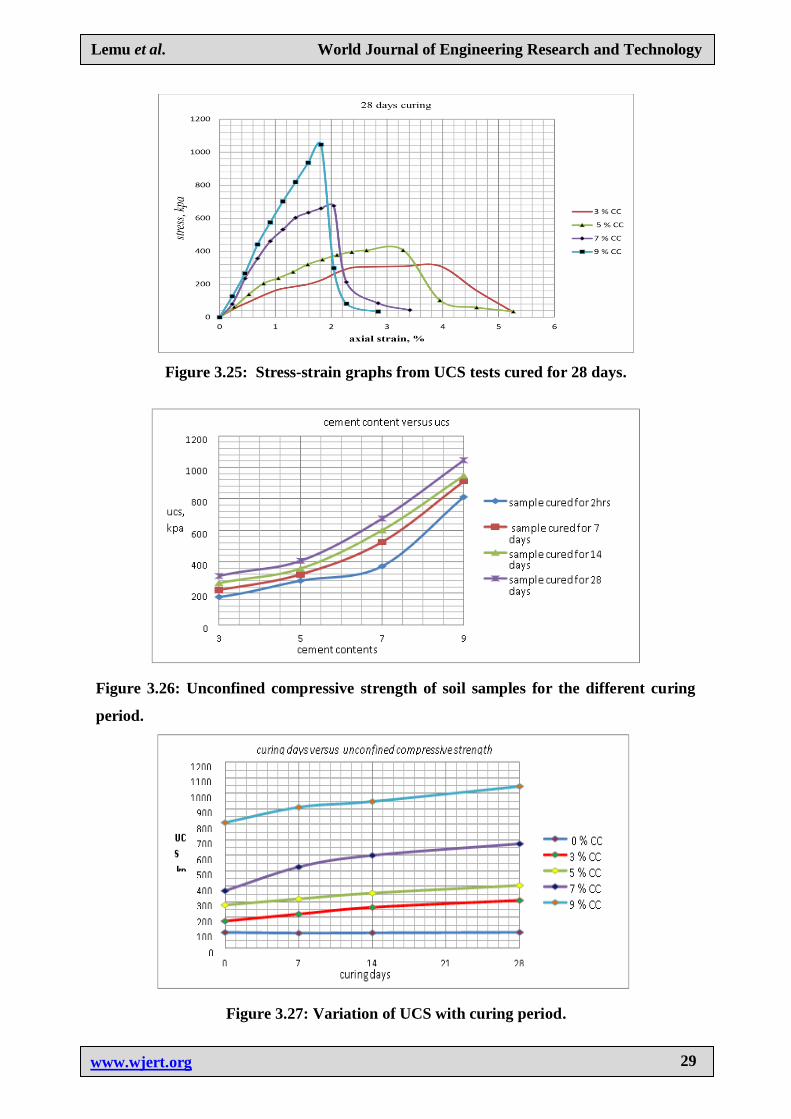
The trends of changes in UCS with various percentages of cement content of the lateritic soil
are presented in Fig. 3.26 for the sample cured at 2hour, 7 days, 14 days and 28 days. This
results in agglomeration in large size particles and caused the increase in compressive
strength.
The effect of curing period was observed on unconfined compressive strength and is
presented in Fig. 3.22. It was observed that UCS increased with curing period within the
Lemu et al. World Journal of Engineering Research and Technology
www.wjert.org
28
same cement contents of the lateritic soil. The minimum increment observed in lateritic soil
sample treated with 3% cement content was from 176.64 kPa to 310.32kpa, whereas the
maximum increment was in the lateritic soil sample treated with 9 % cement content from
811.77 kPa to 1045.22 kPa. Thus, the rates of increment in UCS variables with cement
contents.
Figure 3.22: Stress-strain graphs from UCS tests cured for 0 days.
Figure 3.23: Stress-strain graphs from UCS tests cured for 7 days.
Figure 3.24: Stress-strain graphs from UCS tests cured for 14 days.
Lemu et al. World Journal of Engineering Research and Technology
www.wjert.org
29
Figure 3.25: Stress-strain graphs from UCS tests cured for 28 days.
Figure 3.26: Unconfined compressive strength of soil samples for the different curing
period.
Figure 3.27: Variation of UCS with curing period.
Lemu et al. World Journal of Engineering Research and Technology
www.wjert.org
30
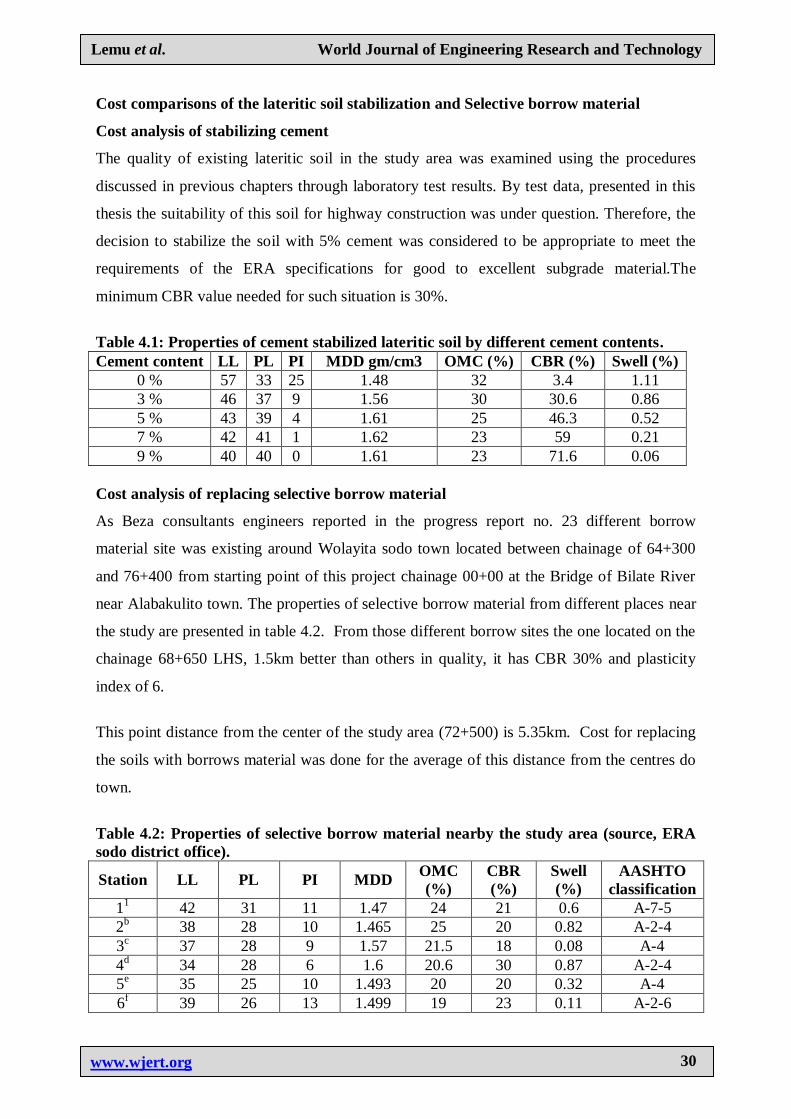
Cost comparisons of the lateritic soil stabilization and Selective borrow material
Cost analysis of stabilizing cement
The quality of existing lateritic soil in the study area was examined using the procedures
discussed in previous chapters through laboratory test results. By test data, presented in this
thesis the suitability of this soil for highway construction was under question. Therefore, the
decision to stabilize the soil with 5% cement was considered to be appropriate to meet the
requirements of the ERA specifications for good to excellent subgrade material.The
minimum CBR value needed for such situation is 30%.
Table 4.1: Properties of cement stabilized lateritic soil by different cement contents.
Cement content LL PL PI MDD gm/cm3 OMC (%) CBR (%) Swell (%)
0 % 57 33 25 1.48 32 3.4 1.11
3 % 46 37 9 1.56 30 30.6 0.86
5 % 43 39 4 1.61 25 46.3 0.52
7 % 42 41 1 1.62 23 59 0.21
9 % 40 40 0 1.61 23 71.6 0.06
Cost analysis of replacing selective borrow material
As Beza consultants engineers reported in the progress report no. 23 different borrow
material site was existing around Wolayita sodo town located between chainage of 64+300
and 76+400 from starting point of this project chainage 00+00 at the Bridge of Bilate River
near Alabakulito town. The properties of selective borrow material from different places near
the study are presented in table 4.2. From those different borrow sites the one located on the
chainage 68+650 LHS, 1.5km better than others in quality, it has CBR 30% and plasticity
index of 6.
This point distance from the center of the study area (72+500) is 5.35km. Cost for replacing
the soils with borrows material was done for the average of this distance from the centres do
town.
Table 4.2: Properties of selective borrow material nearby the study area (source, ERA
sodo district office).
Station LL PL PI MDD OMC
(%)
CBR
(%)
Swell
(%)
AASHTO
classification
11 42 31 11 1.47 24 21 0.6 A-7-5
2b 38 28 10 1.465 25 20 0.82 A-2-4
3c 37 28 9 1.57 21.5 18 0.08 A-4
4d 34 28 6 1.6 20.6 30 0.87 A-2-4
5e 35 25 10 1.493 20 20 0.32 A-4
6f 39 26 13 1.499 19 23 0.11 A-2-6
Lemu et al. World Journal of Engineering Research and Technology
www.wjert.org
31
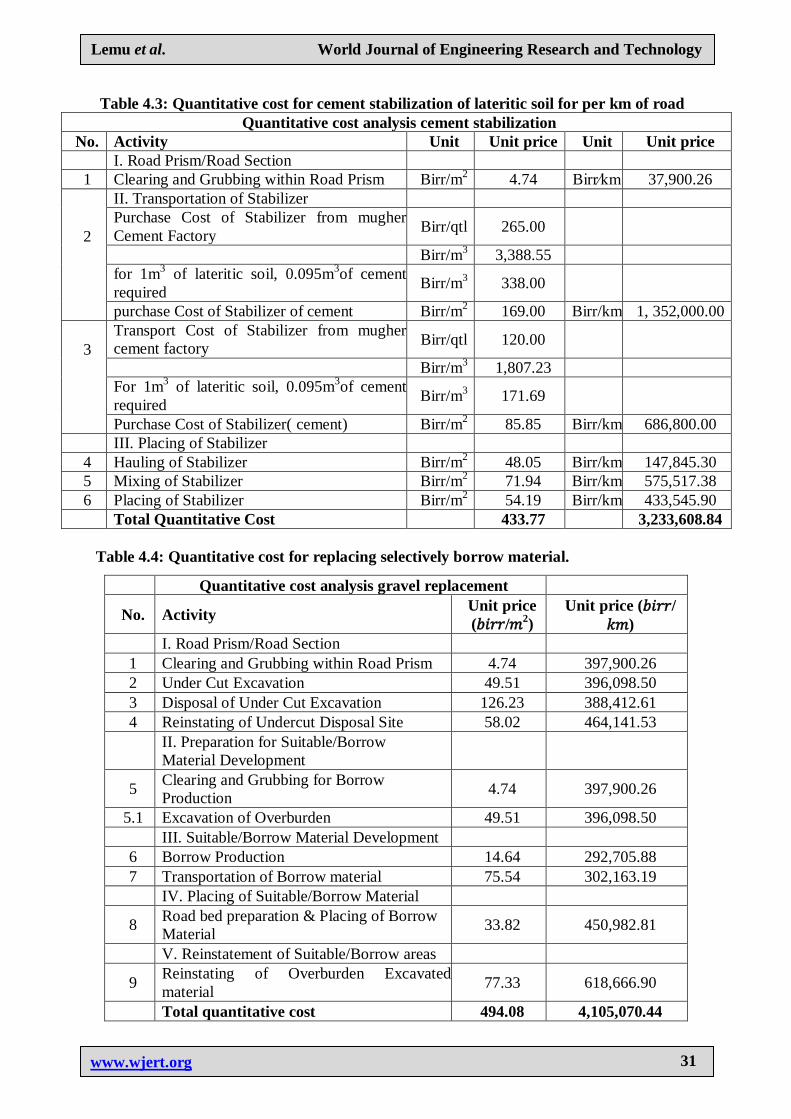
Table 4.3: Quantitative cost for cement stabilization of lateritic soil for per km of road
Quantitative cost analysis cement stabilization
No. Activity Unit Unit price Unit Unit price
I. Road Prism/Road Section
1 Clearing and Grubbing within Road Prism Birr/m2 4.74 Birr⁄km 37,900.26
2
II. Transportation of Stabilizer
Purchase Cost of Stabilizer from mugher
Cement Factory Birr/qtl 265.00
Birr/m3 3,388.55
for 1m3 of lateritic soil, 0.095m
3of cement
required Birr/m
3 338.00
purchase Cost of Stabilizer of cement Birr/m2 169.00 Birr/km 1, 352,000.00
3
Transport Cost of Stabilizer from mugher
cement factory Birr/qtl 120.00
Birr/m3 1,807.23
For 1m3 of lateritic soil, 0.095m
3of cement
required Birr/m
3 171.69
Purchase Cost of Stabilizer( cement) Birr/m2 85.85 Birr/km 686,800.00
III. Placing of Stabilizer
4 Hauling of Stabilizer Birr/m2 48.05 Birr/km 147,845.30
5 Mixing of Stabilizer Birr/m2 71.94 Birr/km 575,517.38
6 Placing of Stabilizer Birr/m2 54.19 Birr/km 433,545.90
Total Quantitative Cost 433.77 3,233,608.84
Table 4.4: Quantitative cost for replacing selectively borrow material.
Quantitative cost analysis gravel replacement
No. Activity Unit price
(𝑏𝑖𝑟𝑟/𝑚2)
Unit price (𝑏𝑖𝑟𝑟/
𝑘𝑚)
I. Road Prism/Road Section
1 Clearing and Grubbing within Road Prism 4.74 397,900.26
2 Under Cut Excavation 49.51 396,098.50
3 Disposal of Under Cut Excavation 126.23 388,412.61
4 Reinstating of Undercut Disposal Site 58.02 464,141.53
II. Preparation for Suitable/Borrow
Material Development
5 Clearing and Grubbing for Borrow
Production 4.74 397,900.26
5.1 Excavation of Overburden 49.51 396,098.50
III. Suitable/Borrow Material Development
6 Borrow Production 14.64 292,705.88
7 Transportation of Borrow material 75.54 302,163.19
IV. Placing of Suitable/Borrow Material
8 Road bed preparation & Placing of Borrow
Material 33.82 450,982.81
V. Reinstatement of Suitable/Borrow areas
9 Reinstating of Overburden Excavated
material 77.33 618,666.90
Total quantitative cost 494.08 4,105,070.44
Lemu et al. World Journal of Engineering Research and Technology
www.wjert.org
32
4.3 Comparison of quantitative cost- benefits cement stabilization and replacing
selective borrow material
The comparisons of the cost benefits were made from tables 4.3 and 4.4. As shown in the
tables, the total quantitative cost of cement stabilization was estimated as 3,233,608.84
Birr/km against the cost of 4,105,070.44 Birr / km for replacing selective borrow material
from a 5km distance. The saving in cost for cement stabilization thus estimated came out to
be 26.95%.
CONCLUSION AND RECOMMENDATION
Conclusion
Based on the laboratory test results in this study, effects of the cement on the lateritic soil
samples of WolayitaSodo area, the following conclusions can be drawn:
The lateritic soil used in this study was dominated by fine-grained soil with 63.5%87.5%
passing sieve no. 200 (0.075mm). Its plasticity index is above 19 % for air and oven dried
condition. It was classified as the A-7-5 group with group index above 20 based on the
AASHTO soil classification system and MH by USCS soil classification system. All
specimens from Wolayita sodo are located below the A-line which indicated that the soil in
the study area consisted of silt. The addition of cement to this soil was decreasing the liquid
limit and increases plastic limits. This causes the reduction of plasticity index, which
improves the workability of the soil. The cement has changed the compaction characteristics
of lateritic soil collected from the study area. As the cement content increases, the MDD,
CBR, and UCS increase, while there was a reduction in the OMC. The effects of the Curing
period were marginal on the compaction characteristics and CBR value, while it has a
substantial effect in UCS.
Stabilization of lateritic soils with 5 % of cement content in the study area was effective both
in quality and cost.
Recommendation
To achieve uniform compaction, it is recommended to use automatic compactors in
determining the compaction parameters, CBR and UCS the soil. The Pavement performance
is closely related to the stiffness of the underlying base and subgrade materials. Tests to
measure the stiffness of untreated lateritic soil and cement treated lateritic soils, such as
resilient modulus tests, should be considered in the future researches. More so, as this study
Lemu et al. World Journal of Engineering Research and Technology
www.wjert.org
33
follows the procedures using quantitative only cost parameters for the cost-benefit analysis, it
is suggested to evaluate the benefits accurately the qualitative cost of replacing and
stabilizing, which needs more investigation in collaboration with all stakeholders to establish
a sound indicator that could help in making a decision in using either replace by selective
material or stabilizing locally available with additives.
REFERENCES
1. Afolagboye L. O &Talabi, A. O. Effect of curing time on the unconfined compressive
strength of lateritic soil stabilized with tyre ash. Impact: International Journal of
Research in Applied Natural and Social Sciences (IMPACT: IJRANSS), 2014; 190-199.
2. Amu, O. a. Characteristics of bamboo leaf ash stabilization on the lateritic soil in highway
construction. Int. J. Eng. Technology, 2010.
3. Amu, O. O. Geotechnical properties of lateritic soil stabilized with sugarcane straw ash.
American journal of scientific and industrial research, 2011; 323-331.
4. Beeghly, J. H. Recent experiences with lime-fly ash stabilization Of Pavement Subgrade
Soils, Base, and Recycled Asphalt. Lexington,: the University of Kentucky, Center for
Applied Energy Research, 2003.
5. Bello, A. Influence of Compaction Delay on CBR and UCS of Cement Stabilized
Lateritic Soil. The Pacific Journal of Science and Technology, 2011; 87-98.
6. Charman, J. H. Laterite in road pavements. London: London Construction Industry
Research and Information Association Special Publication, 1988.
7. Dinku and Gudissa, W. a. The use of limestone powder as an alternative cement
replacement material: an experimental study. Journal of eea, 2010; 27.
8. F.H. Beinroth, H. E. Properties, classification, and management of oxisols. International
Journal of Scientific & Engineering Research, 2014; 5(6): 631-632-636.
9. F.H.M. Portelinha, D. L. Modification of a Lateritic Soil with Lime and Cement; An
Economical Alternative for Flexible Pavement Layers, 2012; 51-63.
10. Gidigasu, M. Laterite Soil Engineering. Elsevier Scientific Publishing Co., 1976.
11. Hanna, T. Study of index properties and shear strength parameters of laterite soil in
southern part of Ethiopia the case of Wolayita sodo. Addis Ababa, 2008.
12. Huat, B. B., Sew, G. S., & Ali, F. H. Tropical Residual Soils Engineering. London:
Taylor & Francis Routledge, 2004.
13. Jiregna, D. Detail Investigation on Index Properties of Lateritic Soils - The Case of
Nedjo-Mendi-Assosa. Addis A baba: Addis Ababa university faculty of technology, 2008.
Lemu et al. World Journal of Engineering Research and Technology
www.wjert.org
34
14. Lyon, A. Laterite and lateritic soils and other problem soils of Africa. Baltimore,
Maryland, u. s. a.: agency for international development aid/csd-2164, 1971.
15. Mu'azu, M. A. Influence of Compactive Effort on Bagasse Ash with Cement Treated
Lateritic Soil. Leonardo Electronic Journal of Practices and Technologies, 2007.
16. Netterberg, D. F. Review of Specifications for the Use of Laterite in Road Pavements.
South Africa Council for Scientific & Industrial Research, 2014.
17. Onyelowe, K. C. Cement Stabilized Akwuete Lateritic Soil and the Use of Bagasse Ash
as Admixture. International Journal of Science and Engineering Investigations, 2012;
16-20.
18. Osinubi K. J. Lime modification of black cotton soil, 1995.
19. Oyediran, I. A. Effect of Increasing Cement Content on Strength and Compaction
Parameters of some Lateritic Soils of Southwestern Nigeria. EGJE, 2011; 16: 1501-1514.
20. Raychaudhuri, S. The occurrence, distribution, classification, and management of laterite
and lateritic soils. Journee Georges Aubert, 1980.
21. SaravutJaritngam, W. O. Development of Strength Model of Laterit ic Soil-Cement.
ENGINEERING JOURNAL, 2013; 70- 77.
22. Stewart, S. a. Engineering Report for Alemgen- Hossana – Sodo road design project.
Addis Ababa, Ethiopia, 1998.
23. Suksiritawonkul, A. Stabilization of dredged sludge as construction materials. Graduate
school, Kasetsart University, 2007.
24. Townsed, F. Geotechnical characteristics of residual soils. Proceeding of American
Society of Civil Engineers, 1985; 111: 77-93.
25. Wakuma, F. Investigating the Index Properties of Residual Tropical Soils of Western
Ethiopia (The Case of Asossa). Addis Ababa Addis Ababa University Faculty of
Technology, 2007.
26. Wesley, L. D. Fundamentals of soil mechanics for sedimentary and residual soils.
Hoboken, New Jersey: John Wiley & Sons, Inc., 2009.
27. Wossen, M. The investigation into the appropriate laboratory testing procedures for the
determination of the index properties of the Lateritic Soils of Western Ethiopia. Addis
Ababa: Addis Ababa university faculty of technology, 2009.
28. Zelalem, A. Basic Engineering Properties of Lateritic Soils Found in Nejo – Mendi Road
Construction Area, Wollega. Addis Ababa: Msc.thesis Addis Ababa University, 2005.