Embed Size (px)
Citation preview
MISCELLANEOUS PAPER S-68-15
COMPACTION OF COHESIONLESSMATERIALS
by
4 J. R. ComptonW. E. Strohm, Jr.
August 1968
Sponsored by
Office, Chief of Engineers
U. S. Army
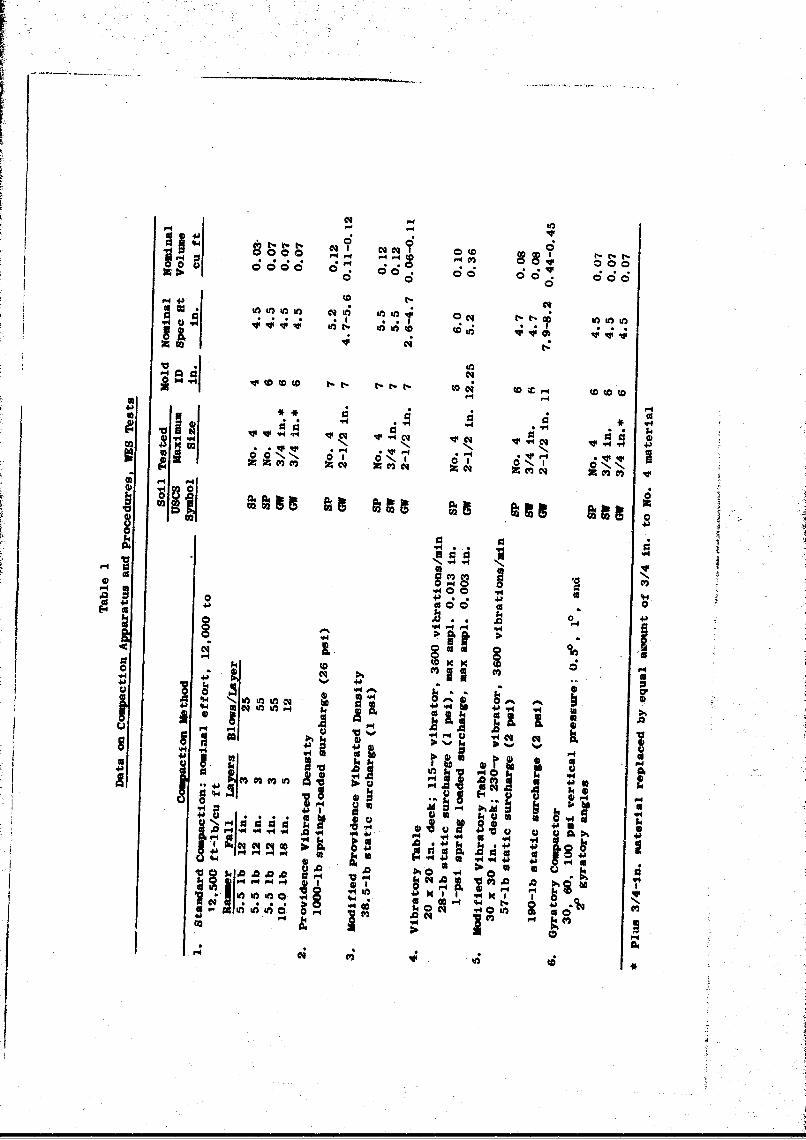
Conducted by
U. S. Army Engineer Waterways Experiment StationCORPS OF: ENGINEERS
Vicksburg, Mississippi
ANMY.MRC VICKSBURG. MIS.
nf wwagwoppma flae
Unclassified
DOCUMENT CONTROL DATA.- R &D
1. ORIGINIATtIw ACTIllY fOP~eft on") 'at. .. aw aacaImURI CLAmulCAlaON
U. S. Army Engineer Waterways Experiment Station 1 UnclassificdVicksburg, Mi-sissippi 1*06 sem-i
2. UP@UIT TSTLIL
COM.PACTION OF COHSIO1NLESS M4PTERIAIB
Final reprt kt~
Joseph R. ComptonWililim E. Strohm, Jr.
0. 049FUT DATE TA. TOTAL NO. OPPAt 11WI Or *a"UAugust 1968 592
COUTRACT OlRNaT NO. Sa ORIONATORI RUPORT NMM"MW
~. OJCT ~Miscellaneous Paper S-68-15
W0 OTN= RPORT now~ ie m ow to In m u
I O T TIOM STATtaEMT
E t mit 'adoc outside he es of '0
%I. suIp 7aEMYANT MOTtO1 12. &POMUORIMO MILITARY ACTIVITY
Office, Chief of Engineers, U. S. ArmyWashington, D. C.
IS 1=9AC~~ report contains data or) laboratory and field compaction of cohesionlesssoils obtained from a survey of Corps of Engineers division laboratories, and resultsof different types of laboratory compaction tests performed in the U. S. Army EngineerWaterways Experiment Station (WES) laboratory on three cohesionless materials. Thetests at WES were conducted to study various laboratory compaction test methods used for
1cohesionless materials.* The three materials tested were a poorly graded sand (SP), awell-graded sand (SW), and a sandy gravel (GW). Impact, Providence vibrated density,vibratory table, and gyratory compaction test methods were used. Replicate tests wereconducted on each soil to determine the variations in maxiam dry density resulting fromdifferent test methods. Different technicians conducted the replicate tests in orderthat the variations in test results due to different techniques could be determined.Selected tests were also conducted on dry and z.t specimens to determine the effect ofwater content on resulting densities. Gyratory tests were conducted using differentangles of,~cvration and different vertical pressures to determine the effects of thesevariables. 'Based on the results of the compaction tests on the three materials usedin the s A'it is concluded that the vibratory table test method gives the bestresults &Wd he Providence vibrated density test method gives results comparativelyclose to thos derived from the vibratory table test method.
DO$ =V"4. 0*12llW0 1.0 Unclassified
Unclassified
Kii 4.M LINK a LINK * LINK C
MOE~. wy OLE OT POLI WT
Cohesionless soils
Soils.--compaction
Unclassified
. RE.WORD
The investigation reported herein was authorized by letter from the
Office, (hief of Engin,'ers (ENGWE), dated 2 March 1959, subject: Proposed
Civil Works Tnvestigation Program - FY 1960.
The investigation was initiated during FY 1960. During the period
FY 1959-FY 1961, a survey was wade of Corps division laboratories to obtain
information concerning current compaction procedures for cohesionless
soils. Laboratory compaction tests were performed in the U. S. Army Engi-
neer Waterways Experiment Station (WES) laboratory on two soils (a poorly
graded sand (SP), and a sandy gravel (GW)) during the period FY 1960-
FY 1964. Interim reports of the test results were prepared in FY 1963
and FY 1964. Additional laboratory compaction tests were performed on
a third soil, a well-graded sand (SW), in FY 1965.
This investigation was conducted under the general direction of
Messrs. W. J. Turnbull, W. G. Shockley, A. A. Maxwell, J. R. Compton, and
R. W. Cunny.
Principal engineers conducting the investigation and analyzing
results were Messrs. R. C. Sloan and W. E. Strohm, Jr. This report was
prepared by Messrs. Compton and Strohm.
Directors of the WES during the preparation and publication of
this report were COL Edmund H. Lang, CE; COL Alex G. Sutton, Jr., CE;
COL John R. Oswalt, Jr., CE; and COL Levi A. Brown, CE. Technical
Director was Mr. J. B. Tiffany.
iii
CONTENTS
Page
FOPEWORD . . . . . . . . . . . . . . . . . . ii
CONVERSION FACTORS, BRITISH TO METRIC UNITS OF MEASUREMENT . . . . viiSUMMARY . .. .. .. .. .. .. .. .. .. .. .. .. .. . .. ix
PART I: INTRODUCTION. . . . . . . . . . . . . . . . . . . . . . . 1
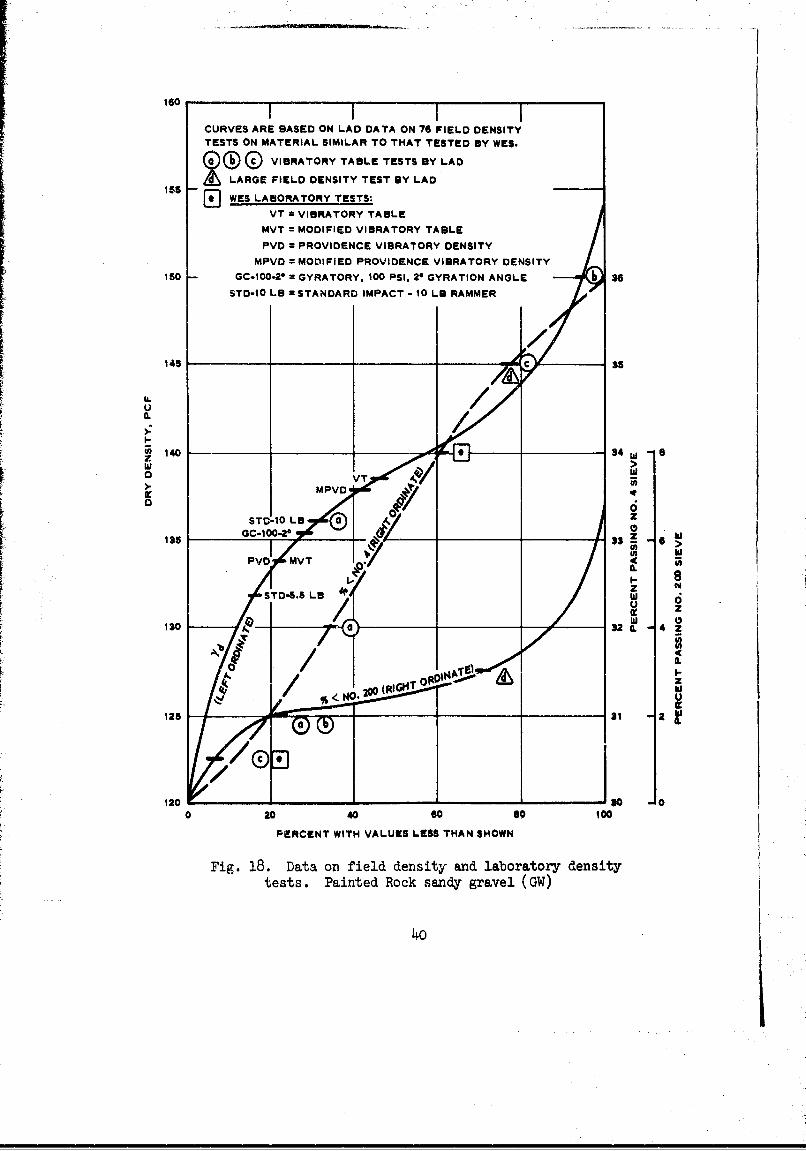
Purpose and Scope . . . . . . ................... 1Background . ..................... . . 2
PART II: WES LABORATORY INVESTIGATION. . . . ......... . 3
Materials Tested . . . . . . .................. 3Test Apparatus and Procedures .... .... ............... 6Test Results . . . . . ............ . . . . .. 14
PART III: COMPARISON OF FIELD AND LABORATORY COMPACTION DATA... 30
Survey of CE Offices. . .................... 30Comparison of Laboratory Test Results with Field Data
on Materials Tested at WES. . . . . . . . . . . . . . . . . 32
PART IV: CONCLUSIONS AND RECOMMENDATIONS. . ............ .
TABLES 1-13
V
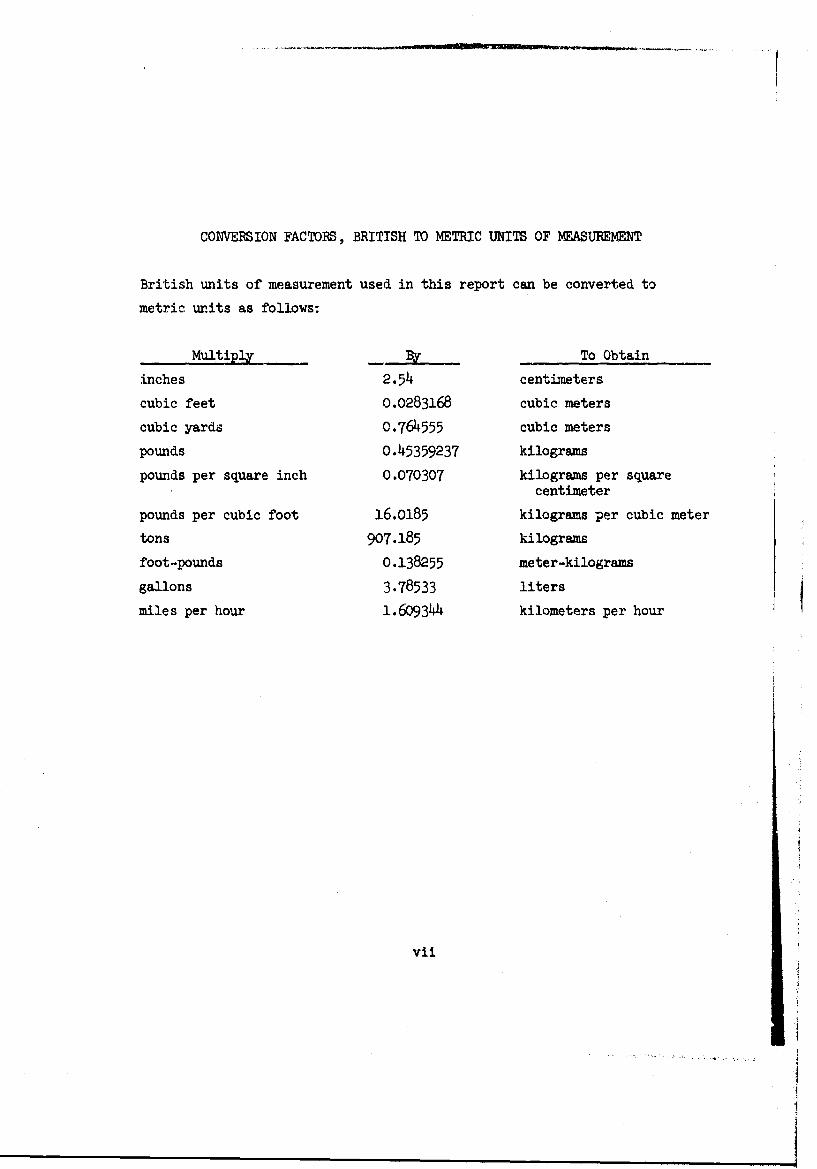
CONVERSION FACTORS, BRITISH TO METRIC UNITS OF MEASUREMENT
British units of measurement used in this report can be converted to
metric units as follows:
Multiply EX To Obtain
inches 2.54 centimeters
cubic feet 0.0283168 cubic meters
cubic yards 0.764555 cubic meters
pounds 0.45359237 kilograms
pounds per square inch 0.070307 kilograms per squarecentimeter
pounds per cubic foot 16.O185 kilograms per cubic meter
tons 907.185 kilograms
foot-pounds 0.138255 meter-kilograms
gallons 3.78533 liters
miles per hour 1.609344 kilometers per hour
vii
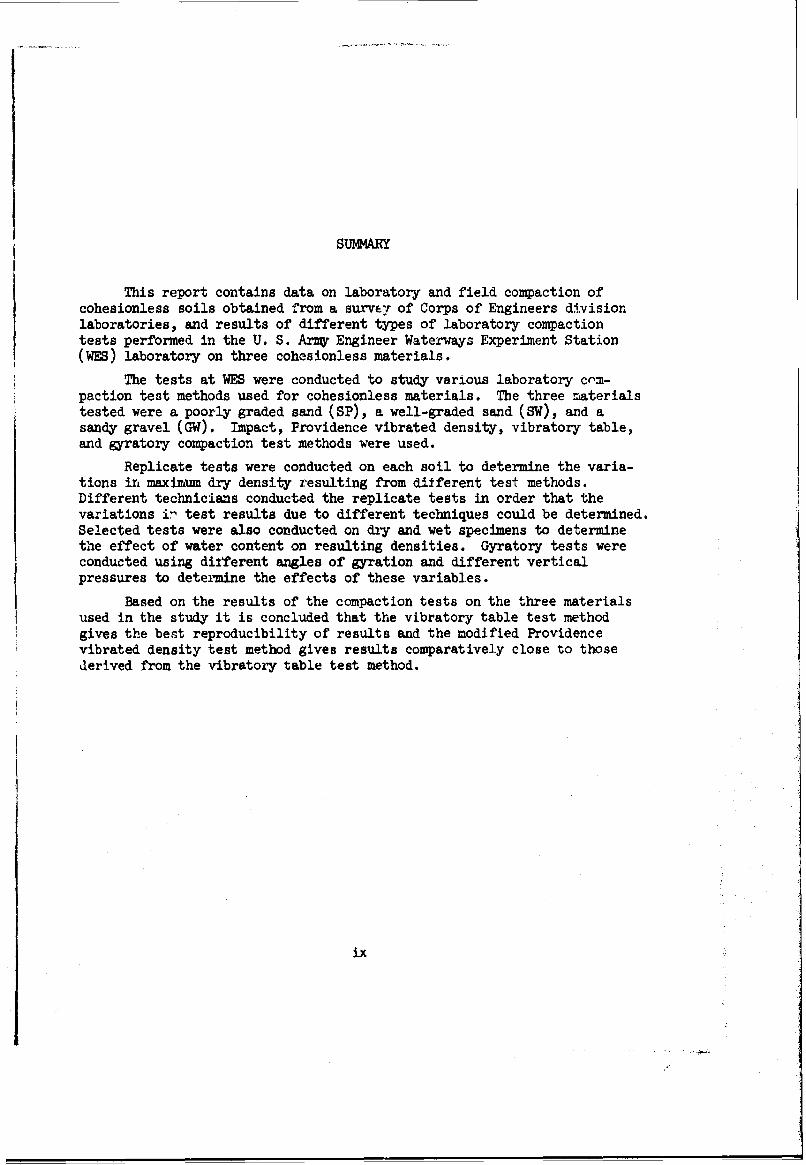
SUMMARY
This report contains data on laboratory and field compaction ofcohesionless soils obtained from a survey of Corps of Engineers divisionlaboratories, and results of different types of laboratory compactiontests performed in the U. S. Army Engineer Waterways Experiment Station(WES) laboratory on three cohesionless materials.
The tests at WES were conducted to study various laboratory com-paction test methods used for cohesionless materials. The three materialstested were a poorly graded sand (SP), a well-graded sand (SW), and asandy gravel (GW). Impact, Providence vibrated density, vibratory table,and gyratory compaction test methods were used.
Replicate tests were conducted on each soil to determine the varia-tions in maximum dry density resulting from different test methods.Different technicisns conducted the replicate tests in order that thevariations ir test results due to different techniques could be determined.Selected tests were also conducted on d2y and wet specimens to determinethe effect of water content on resulting densities. Gyratory tests wereconducted using different angles of gyration and different verticalpressures to determine the effects of these variables.
Based on the results of the compaction tests on the three materialsused in the study it is concluded that the vibratory table test methodgives the best reproducibility of results and the modified Providencevibrated density test method gives results comparatively close to thosederived from the vibratory table test method.
ix
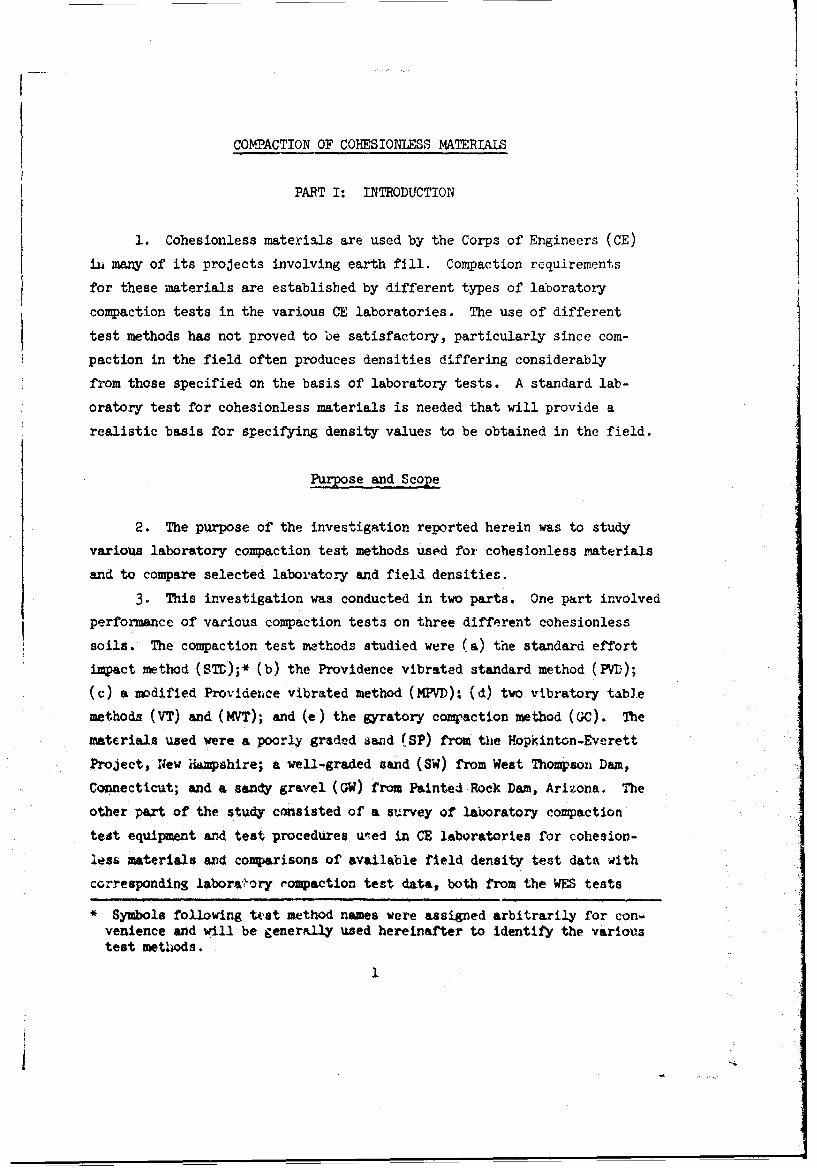
COMPACTION OF COHESIONLESS MATERIALS
PART I: INTRODUCTION
1. Cohesionless materials are used by the Corps of Engineers (CE)
in many of its projects involving earth fill. Compaction requirements
for these materials are established by different types of laboratory
compaction tests in the various CE laboratories. The use of different
test methods has not proved to be satisfactory, particularly since com-
paction in the field often produces densities differing considerably
from those specified on the basis of laboratory tests. A standard lab-
oratory test for cohesionless materials is needed that will provide a
realistic basis for specifying density values to be obtained in the field.
Purpose and Scope
2. The purpose of the investigation reported herein was to study
various laboratory compaction test methods used for cohesionless materials
and to compare selected laboratory and field densities.
3. This investigation was conducted in two parts. One part involved
performance of various compaction tests on three different cohesionless
soils. The compaction test methods studied were (a) the standard effort
impact method (STD);* (b) the Providence vibrated standard method (PVD);
(c) a modified Providence vibrated method (MPVD): (d) two vibratory table
methods (VT) and (MVT); and (e) the gyratory compaction method (GC). The
materials used were a poorly graded iand (SP) from the Hopkinton-Everett
Project, New Hampshire; a well-graded sand (SW) from West Thompson Dam,
Connecticut; and a sandy gravel (GW) from Painted Rock Dam, Arizona. The
other part of the study consisted of a survey of laboratory compaction
teat equipment and test procedures ueed in CE laboratories for cohesion-
less materials and comparisons of available field density test data with
corresponding labora'ory compaction test data, both from the WFS tests
* Symbols following tAest method names were assigned arbitrarily for con-venience and will be generally used hereinafter to identify the varioustest methods.
1
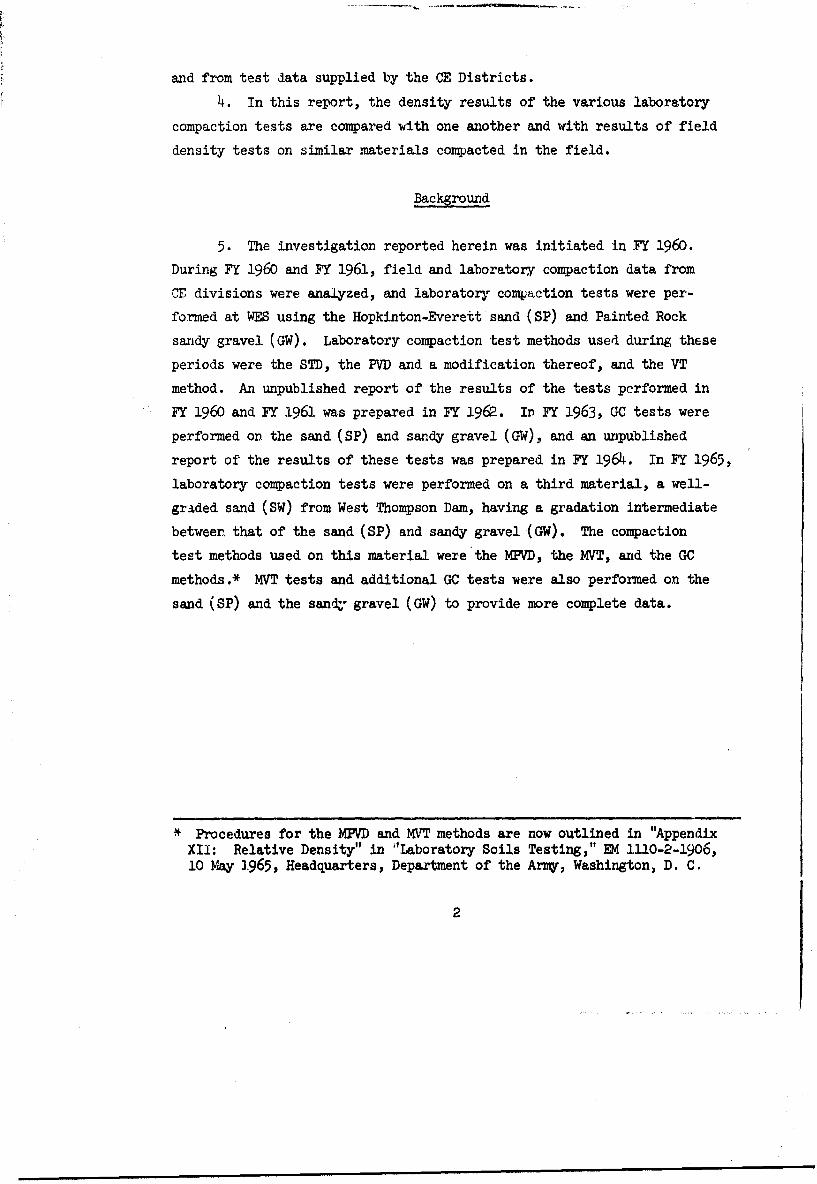
and from test data supplied by the CE Districts.
4. In this report, the density results of the various laboratory
compaction tests are compared with one another and with results of field
density tests on similar materials compacted in the field.
Background
5. The investigation reported herein was initiated in FY 1960.
During FY 1960 and FY 1961, field and laboratory compaction data from
CE divisions were analyzed, and laboratory compaction tests were per-
formed at WES using the Hopkinton-Everett sand (SP) and Painted Rock
sandy gravel (GW). Laboratory compaction test methods used during these
periods were the STD, the PVD and a modification thereof, and the VT
method. An unpublished report of the results of the tests performed in
FY 1960 and FY 1961 was prepared in FY 1962. In FY 1963, GC tests were
performed on the sand (SP) and sandy gravel (GW), and an unpublished
report of the results of these tests was prepared in FY 1964. In FY 1965,
laboratory compaction tests were performed on a third material, a well-
graded sand (SW) from West Thompson Dam, having a gradation intermediate
between that of the sand (SP) and sandy gravel (GW). The compaction
test methods used on this material were the MPVD, the MVT, and the GC
methods.* MVT tests and additional GC tests were also performed on the
sand (SP) and the sand;- gravel (GW) to provide more complete data.
Procedures for the MPVD and MVT methods are now outlined in "AppendixXII: Relative Density" in "'Laboratory Soils Testing," EM 1110-2-1906,10 May 1965, Headquarters, Department of the Army, Washington, D. C.
2
PART II: WES LARATORY INVESTIGATION
Materials Tested
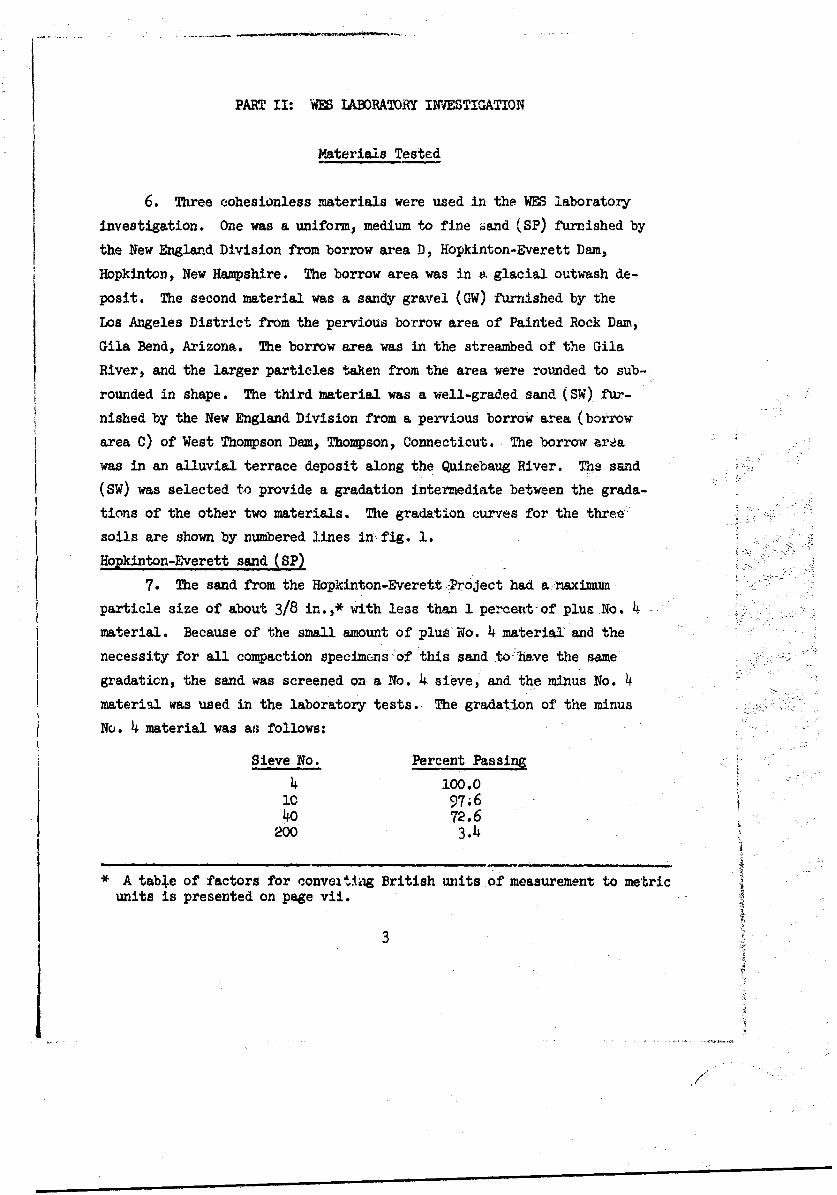
6. Three cohesionless materials were used in the WES laboratory
investigation. One was a uniform, medium to fine iand (SP) furnished by
the New England Division from borrow area D, Hopkinton-Everett Dam,
Hopkinton, New Hampshire. The borrow area was in s glacial outwash de-
posit. The second material was a sandy gravel (GW) furnished by the
Los Angeles District from the pervious borrow area of Painted Rock Dam,
Gila Bend, Arizona. The borrow area was in the streambed of the Gila
River, and the larger particles taken from the area were rounded to sub-
rounded in shape. The third material was a well-graded sand (SW) fur-
nished by the New England Division from a pervious borrow area (borrow
area C) of West Thompson Dam, Thompson, Connecticut. The borrow area
was in an alluvial terrace deposit along the Quinebaug River. The sand
(SW) was selected to provide a gradation intermediate between the grada-
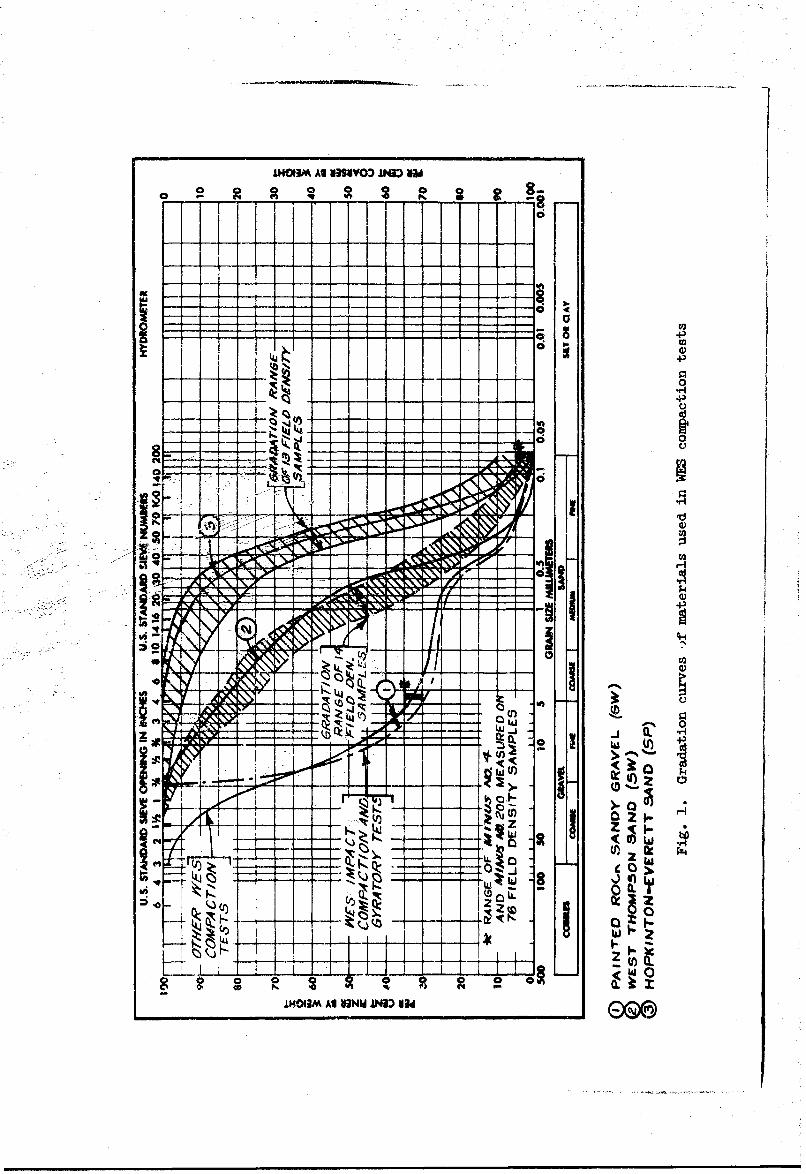
tions of the other two materials. The gradation curves for the three-
soils are shown by numbered lines in fig. 1.
Hopkinton-Everett sand (SP)
7. The sand from the Hopkinton-EverettPr oject had a naximum
particle size of about 3/8 in.,* with less than 1 percent-of plus No. 4
material. Because of the small amount of plus No. 4 material and the
necessity for all compaction specimcns of this sand to have the same
gradaticn, the sand was screened on a No. 4 sieve, and the minus No. 4
material was used in the laboratory tests. The gradation of the minus
No. 4 material was ao follows:
Sieve No. Percent Pas-sing
4 100.010 97;640 72.6
200 3.4
* A table of factors for conveiting British units of measurement to metricunits is presented on page vii.
3
1HO3M At V3SVVO3 IND liU
C,.
- -4-------
C4 It
00
rkr
0)ImolamAs NNWIND V
Painted Rock sandy gravel (GW)
8. The sandy gravel from Painted Rock Dam had a maximum particle
size of about 4 in., with about 68 percent of plus No. 4 material. In
order to produce compaction specimens of as near3y identical gradation
as possible, the sandy gravel was sieved into the following fractions:
Passing Retained on
2-1/2 in. 1-1/2 in.1-1/2 in. 1 in.I in. 3/4 in.3/4 in. 1/2 in.1/2 in. 3/8 in.3/8 in. 1/4 in.1/4 in. No. 3No. 3 No. 4No.4 --
The separate fractions were then recombined in proper proportions as
samples were needed for the compaction tests. Impact and gyratory com-
paction tests were performed on samples of the sanay gravel having a
maximum particle size of 3/4 in. with replacement of the plus 3/4-in.
material by an equal amount of material passing the 3/4-in. sieve and
retained on the No. 4 sieve (see broken gradation curve 1 in fig. 1);
other compaction tests (PVD and VT) were performed on samples having a
maximum particle size of 2-1/2 in. (see solid-line gradation curve 1
in fig. 1). Where materials have more than 10 percent of plus 2-1/2-in.
material, the customary procedure in the PVD test is to replace the
plus 2-i/2-in. material with an equal weight of material passing the
2-1/2-in. sieve and retained on the 1-in. sieve. Since the sandy gravel
tested had only a few percent of plus 2-1/2-in. material, the PVD tests
were performed on the minus 2-1/2-in. fraction without replacement. This
material was also used in the VT tests.
West Thompson sand (SW)
9. The sand (SW) from West Thompson Dam had a maximum particle
size of 3/4 in. and 15 percent of plus No. 4 material. The sand was re-
ceived in bags, and gradation tests on representative specimens from each
of six bags selected at random indicated a maximum variation in gradation
5
- -
of only about 5 percent; it was therefore concluded that the sand in all
bags was essentially of the same gradation. To ensure that material for
each compaction specimen had as nearly identical gradation as possible,
the specimens were prepared by recombining the following fractions in the
percentages shown below:
Passing Retained on Percent
3/4 in. No. 4 15No. 4 No. 10 13No. 10 No. 20 16No. 20 No. 40 32No. 40 No. 200 24No.200 -- 0
Total 100
Test Apparatus and Procedures
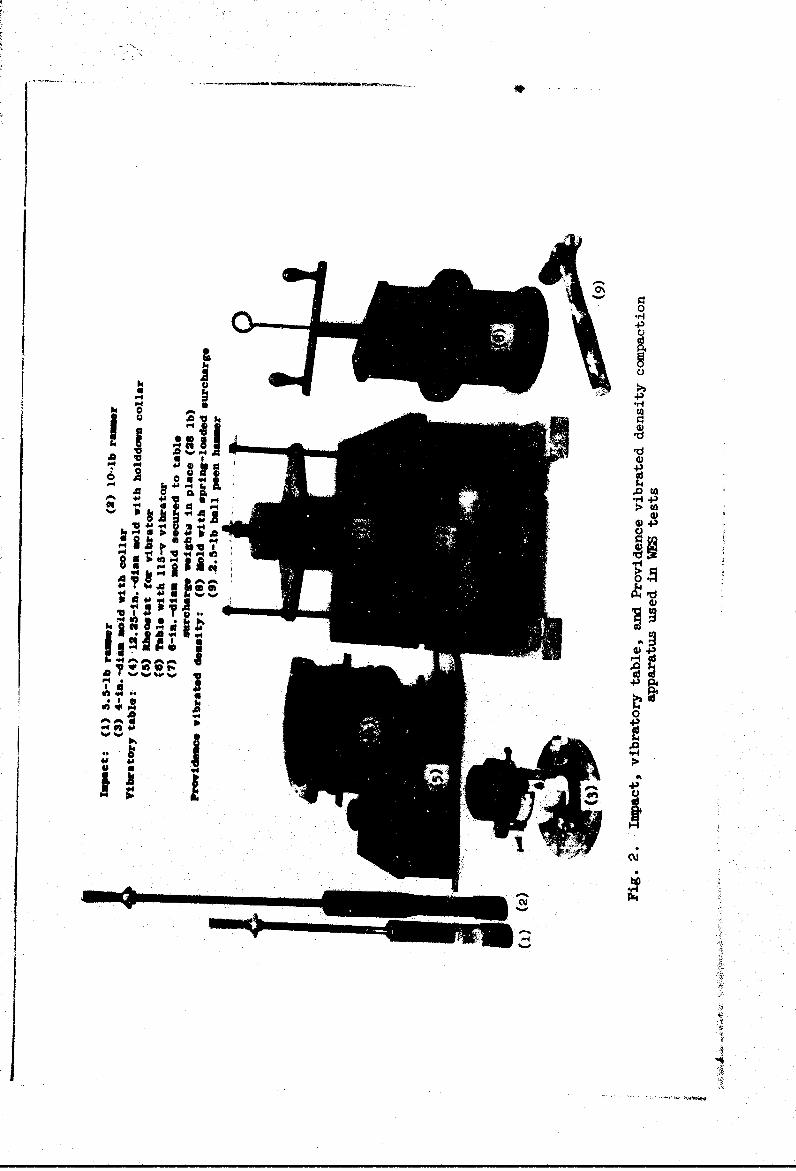
10. Data on the compaction apparatus and procedures used are sum-
marized in table 1. Fig. 2 shows some of the compaction test apparatus
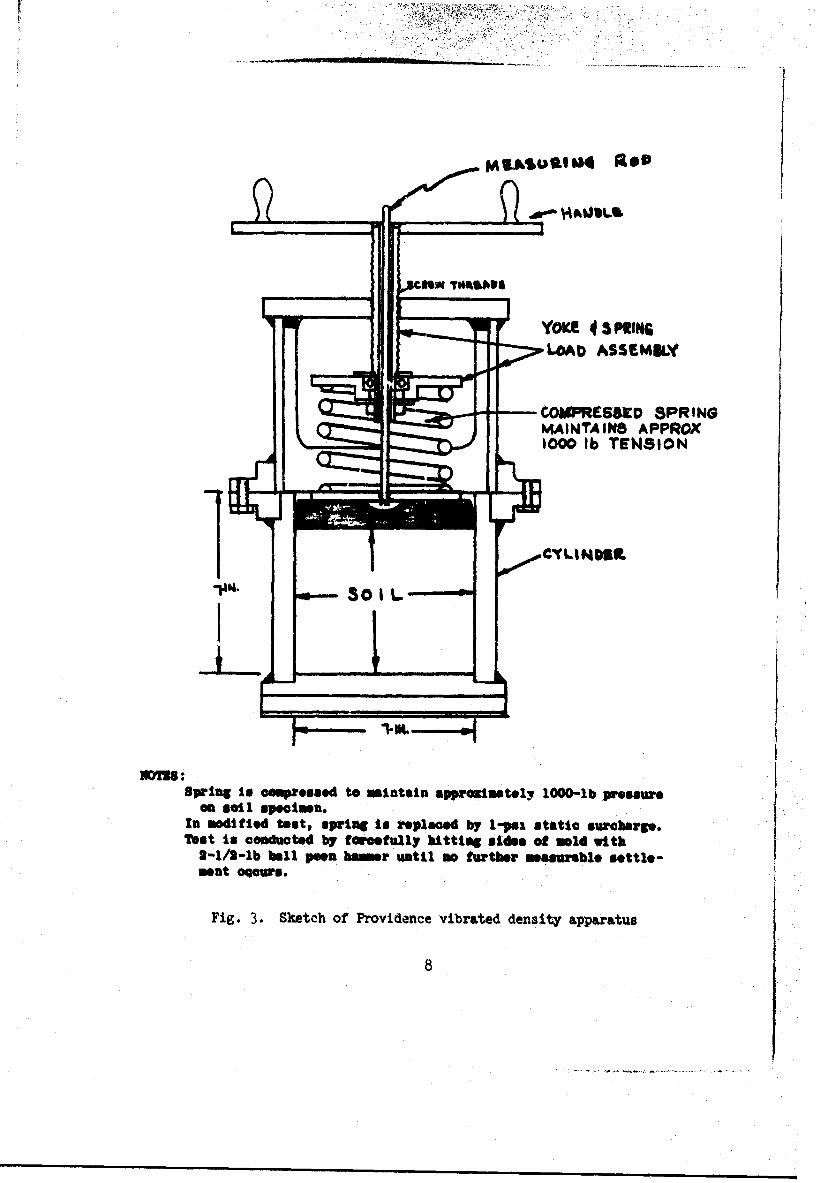
used in the tests. A schematic diagram of the Providence apparatus is
shown in fig. 3. The apparatus for the modified Providence and modified
vibratory table methods are illustrated in Appendix XII, "Relative
Density," EM 1110-2-1906,* but are not shown in this report. The gyra-
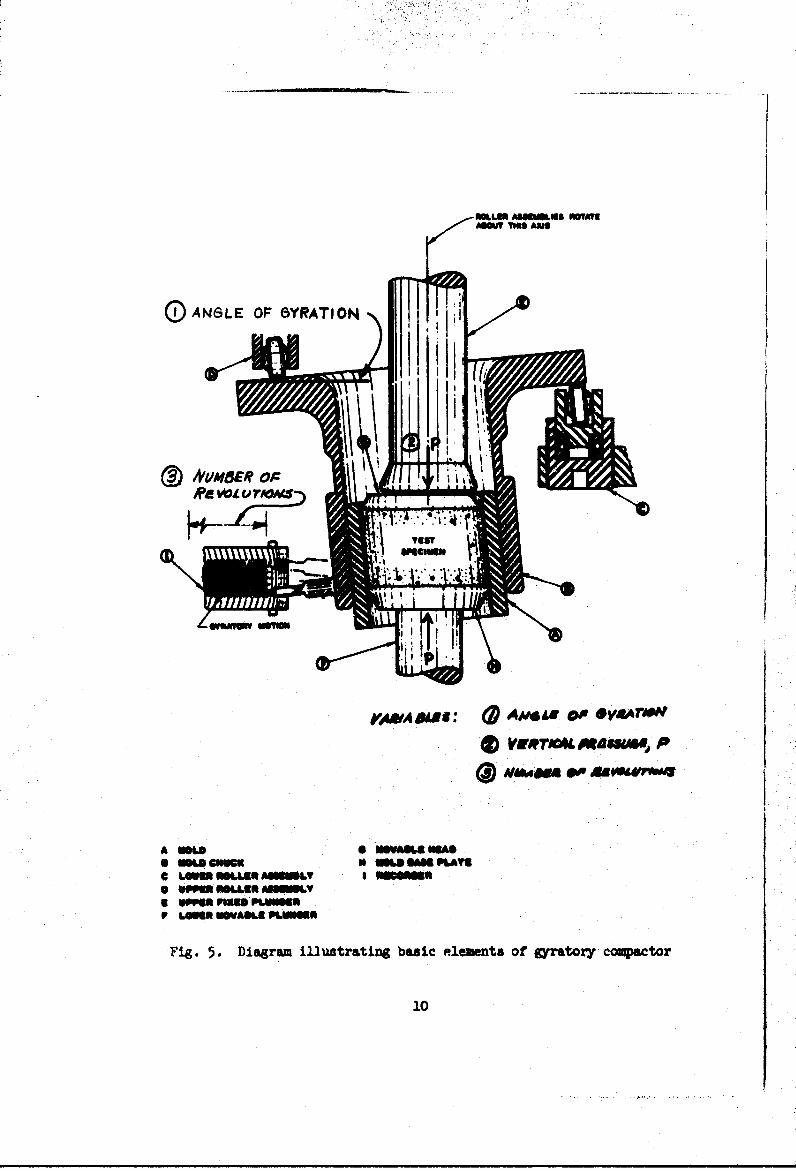
tory compaction apparatus is shown in figs. 4 and 5. The procedures used
in conducting the tests are briefly described in the following paragraphs.
STD tests
11. 8TD tests were performed on the sand (SP) and the sandy gravel
(GW) as shown in table 1. Molds of both 4- and 6-in. inside diameter were
used in compacting the sand to check possible effects of mold size on
density and optimum water content. The 5.5-lb rammer was used as the
standard rammer for compaction tests on the sand (SP) and sandy gravel
(GW); supplemental tests using a 10-lb ramer were performed on the sandy
gravel. Essentially the same compaction effort was used in all impact
tests; the effort was equivalent to that of the STD test (12,400 ft-lb
* Headquarters, Department of the Army, "Laboratory Soils Testing,"EK 1110-2-1906, 10 May 1965, Washington, D. C.
6
43
100
A 'k0 4.3
.4)I -A 10,s 4
40 a
4-) -I
43
O'% 4)
U~q4..
" ;:LbAI ASSEMILY
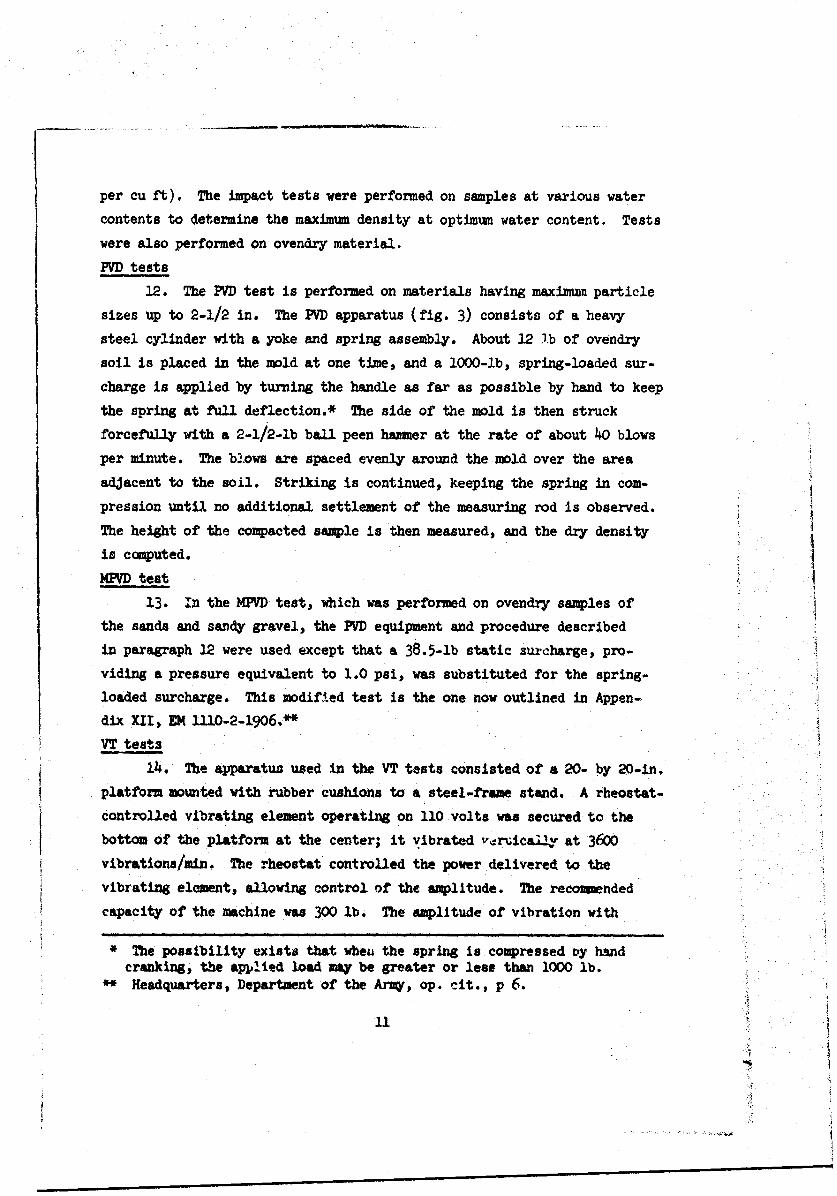
COMPRESSED SPRINGMIAINTA INS APPROX
Spring Is coWprssod to mintain aprcmlmately 1000-lb pressurean sell specimen.,
IA modified test# spring Is replaced by IVps& static surcharge.Toot is comducted b7 forcefully bitting sides at miold with
2-1/2-lb ball peen hamimer until no further easable settlo-
Fig. 3. Sketch of Providence vibrated density apparatus
8
Fig. 4. Gyntory coqactor
0D ANGLE OF GYRATION
MIBA OFA'*aW~
MA 01. V r/dA"Ki
* usw snugs N OW MPAYo ~um eugs asinmepee""m
* P~sesae aiusm9*ff sng sun.ems
U Ills UaSL PISSURl
Fig. 5. Diagram illustrating basic eients of gyratory compactor
10
per cu ft). The impact tests were performed on samples at various water
contents to determine the maximum density at optimum water content. Tests
were also performed on ovendry material.
PVD tests
12. The PVD test is performed on materials having maximum particle
sizes up to 2-1/2 in. The PYD apparatus (fig. 3) consists of a heavy
steel cylinder with a yoke and spring assembly. About 12 Ib of ovendry
soil is placed in the mold at one time, and a 1000-b, spring-loaded sur-
charge is applied by turning the handle as far as possible by hand to keep
the spring at full deflection.* The side of the mold is then struck
forcefully with a 2-1/2-lb ball peen heamer at the rate of about 40 blows
per minute. The blows are spaced evenly around the mold over the area
adjacent to the soil. Striking is continued, keeping the spring in com-
pression until no additional settlement of the measuring rod is observed.
The height of the compacted sample is then measured, and the dry density
is computed.
MID test
13. In the MPVD test, which was performed on ovendry samples of
the sands and sandy gravel, the PVD equipment and procedure described
in paragraph 12 were used except that a 38.5-lb static surcharge, pro-
viding a pressure equivalent to 1.0 psi, was substituted for the spring-
loaded surcharge. This modified test is the one now outlined in Appen-
dix XII, EM l110-2-1906.*VT tests
14. The apparatus used in the VT tests consisted of a 20- by 20-in.
platform mounted with rubber cushions to a steel-fre stand. A rheostat-
controlled vibrating element operating on 110 volts was secured to the
bottom of the platform at the center; it vibrated v rvici!. at 3600
vibrations/man. The rheostat controlled the power delivered to the
vibrating element, allowing control of the amplitude. The recommended
capacity of the machine was 300 lb. The amplitude of vibration with
* The possibility exists that when the spring is compressed Dy handcranking, the applied load may be greater or less than 1000 lb.
** Headquarters, Department of the Arm, op. cit., p 6.
U,
the rheostat set at maximum power was measured with an electrical
potentiometer and recorder with various lead weights and with the 12.25-
or 6-in.-diam molds filled with soil and fastened rigidly to the platform.
Ihe total weight of the 12.25-in.-diam mold filled with sandy gravel (GW)
and spring loaded was about 158 lb, and ma-imum amplitude obtainable was
0.003 in. The total weight of the 6-in.-diam mold filled with sand (SP)
and loaded with a 28-lb surcharge was about 66 lb, and the maximum
amplitude obtainable was 0.013 in.; with no weight on the vibrating
table, the maximum amplitude was 0.043 in.
15. Ovendry samples of the sand (SP) were compacted by vibration
in the 6-in.-diam by 7-in.-deep mold secured to the platform by a collar
and bolts. A hand scoop was used to place the soil in the molds in a
single operation. A static surcharge of 1.0 psi was applied prior to
vibration. Ovendry samples of the sandy gravel (G W) were compacted by
vibration in the 12.25-in.-diam by 12-in.-deep mold, which was secured
to the vibrating platform like the smaller mold. A surcharge spring
load of 1.0 psi was applied to the top of the soil prior to vibration.
The vibration time for both materials was varied from 8 to 20 min; no
significant additional settlement was noted after 8 min of vibration.
MVT tests
16. The MVT apparatus i3 similar to that described above, except
that the vibratory table and vibrator are heavier, and greater amplitudes
are produced. The frequency of this electromagnetic vibrator type ap-
paratus is 3600 vibrations/min, and for the 11-in.-diam mold filled with
soil and loadcd with the static surcharge, the amplitude was approximately
0.02 in. A source of two-phase, 230-volt alternating current is required
for the vibrator. Maximum density tests on the ovendry sands were per-
formed using a 0.1-cu-ft mold (6 in. diam), and tests on tle sandy gravel
(2-i/2-in. maximum particle size) were performed using a 0.5-cu-ft mold
(11 in. diam). The test procedures used were those now outlined in
Appendix XII, EM i1i0-2-1906.*
Tbid.
12
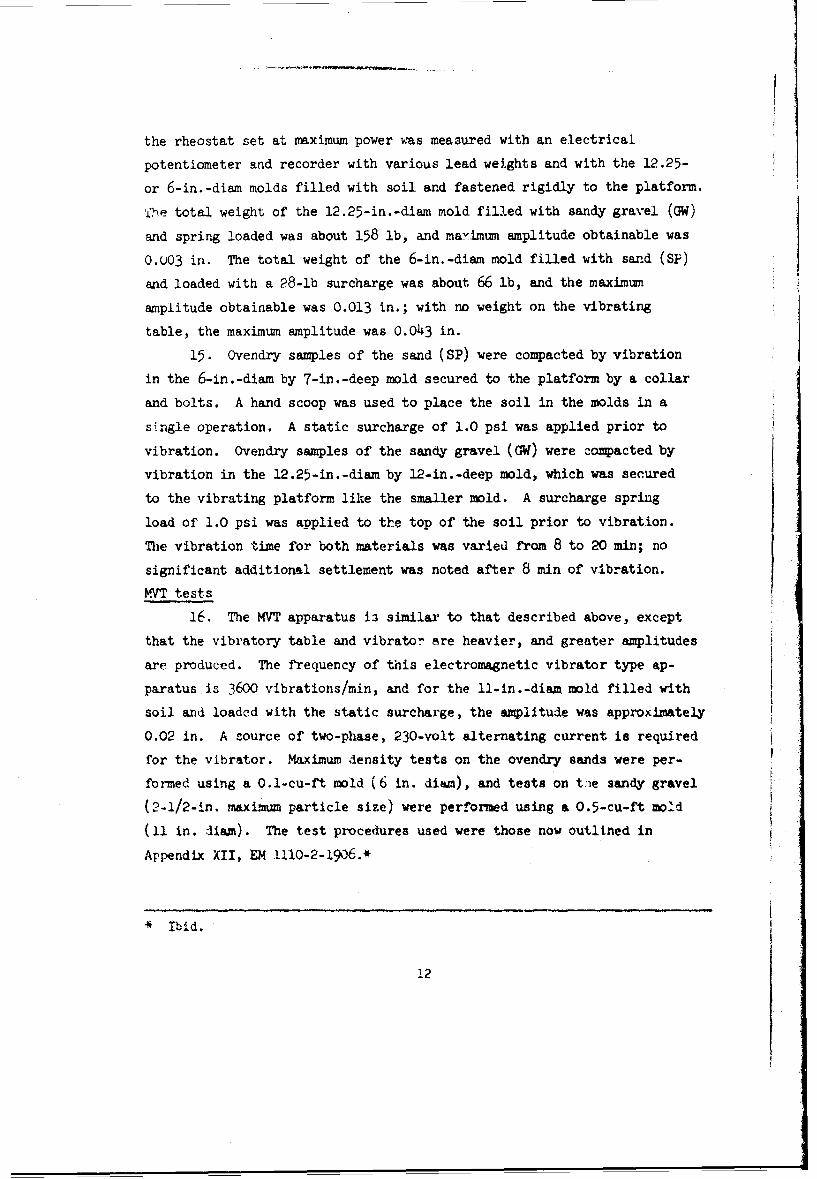
GC tests*
17. The gyratory compactor used in this investigation was the first
one designed and constructed at WES modified to accommodate a 6-in.-diam
specimen. The gyratory compactor is shown in fig. 4. Later models in-
corporate refinements found lacking in tnis pilot model, but the com-
paction principle has remained unchanged.
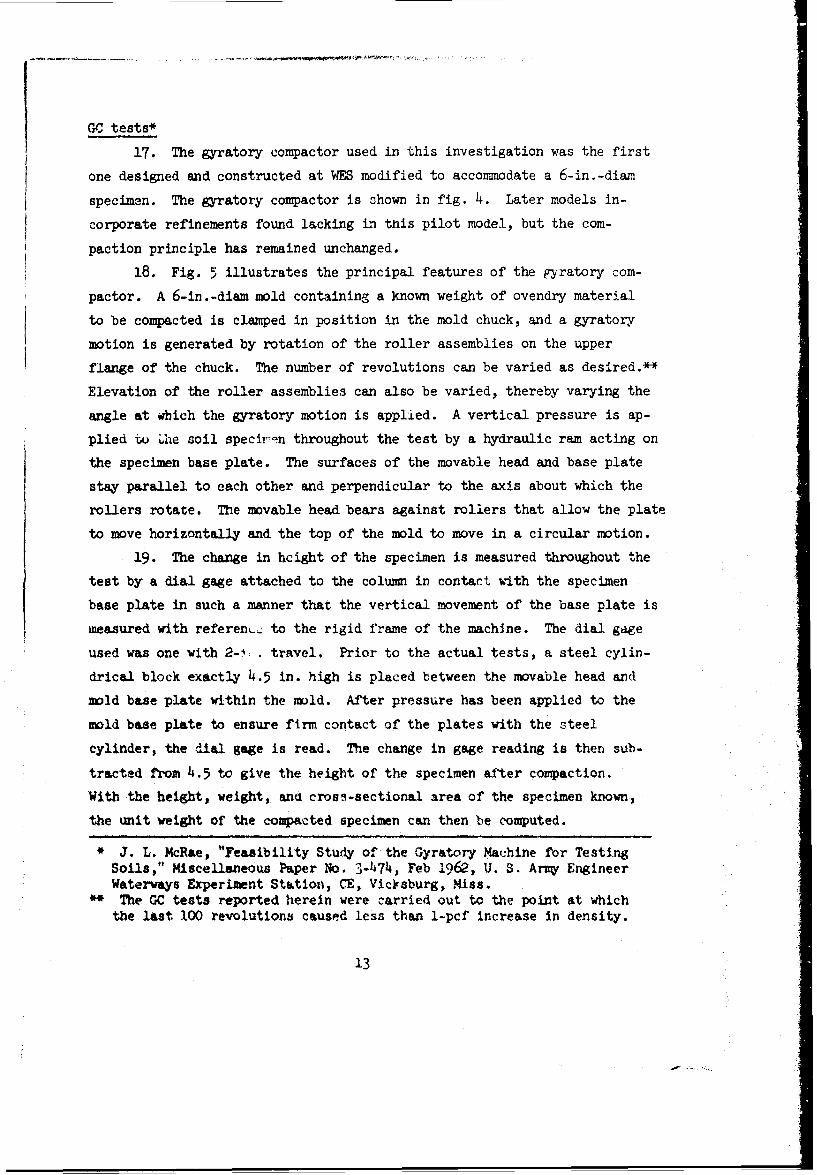
18. Fig. 5 illustrates the principal features of the pyratory com-
pactor. A 6-in.-diam mold containing a known weight of ovendry material
to be compacted is clamped in position in the mold chuck, and a gyratory
motion is generated by rotation of the roller assemblies on the upper
flange of the chuck. The number of revolutions can be varied as desired.**
Elevation of the roller assemblies can also be varied, thereby varying the
angle at which the gyratory motion is applied. A vertical pressure is ap-
plied u Uhe soil specii'-n throughout the test by a hydraulic ram acting on
the specimen base plate. The surfaces of the movable head and base plate
stay parallel to each other and perpendicular to the axis about which the
rollers rotate. The movable head bears against rollers that allow the plate
to move horizontally and the top of the mold to move in a circular motion.
19. The change in hcight of the specimen is measured throughout the
test by a dial gage attached to the colunm in contact with the specimen
base plate in such a manner that the vertical movement of the base plate is
measured with referen . to the rigid frame of the machine. The dial gage
used was one with 2-!,. travel. Prior to the actual tests, a steel cylin-
drical block exactly 4.5 in. high is placed between the movable head and
mold base plate within the mold. After pressure has been applied to the
mold base plate to ensure firm contact of the plates with the steel
cylinder, the dial gage is read. The change in gage reading is then sub-
tracted from 4.5 to give the height of the specimen after compaction.
With the height, weight, and cross-sectional area of the specimen known,
the unit weight of the compacted specimen can then be computed.
* J. L. McRae, "Feasibility Study of the Gyratory Machine for Testing
Soils," Miscellaneous Paper No. 3-474, Feb 1962, U. S. Arvy EngineerWaterways Experiment Station, CE, VicIrsburg, Miss.
** The GC tests reported herein were carried out to the point at whichthe last 100 revolutions caused less than l-pcf increase in density.
13
Test Results
Hopkinton-Everett sand (SP)
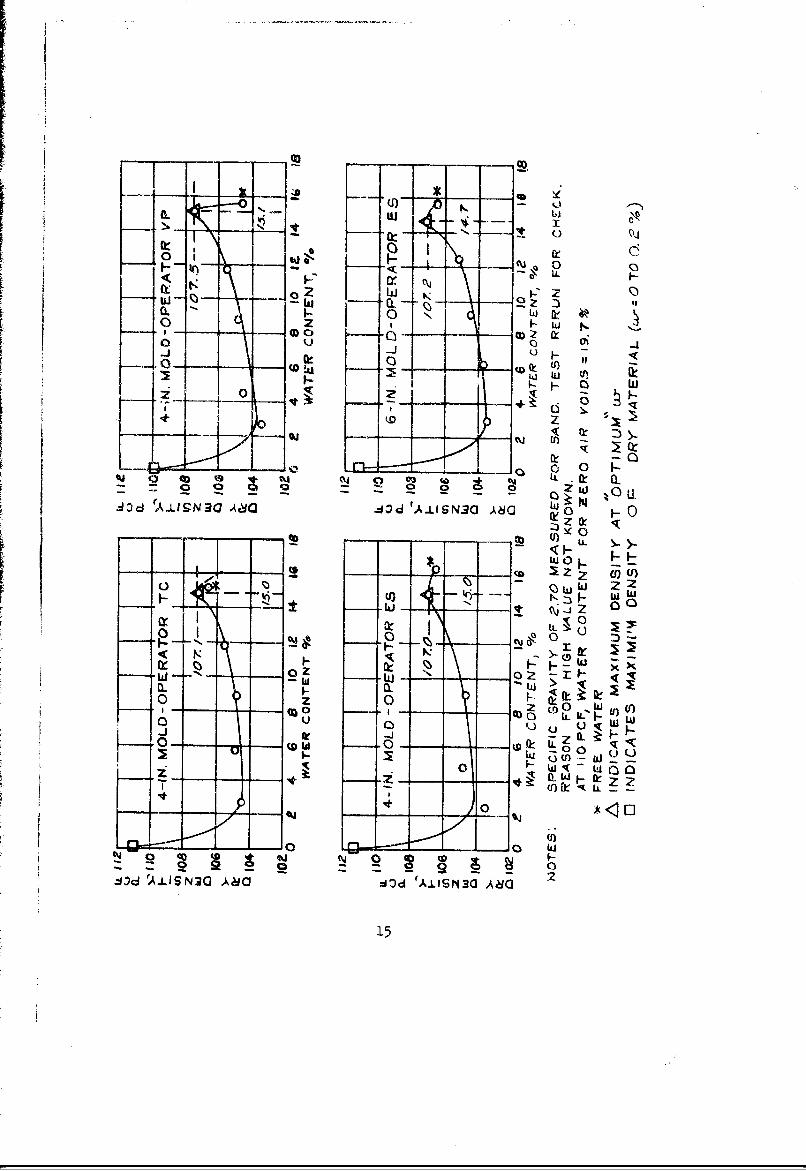
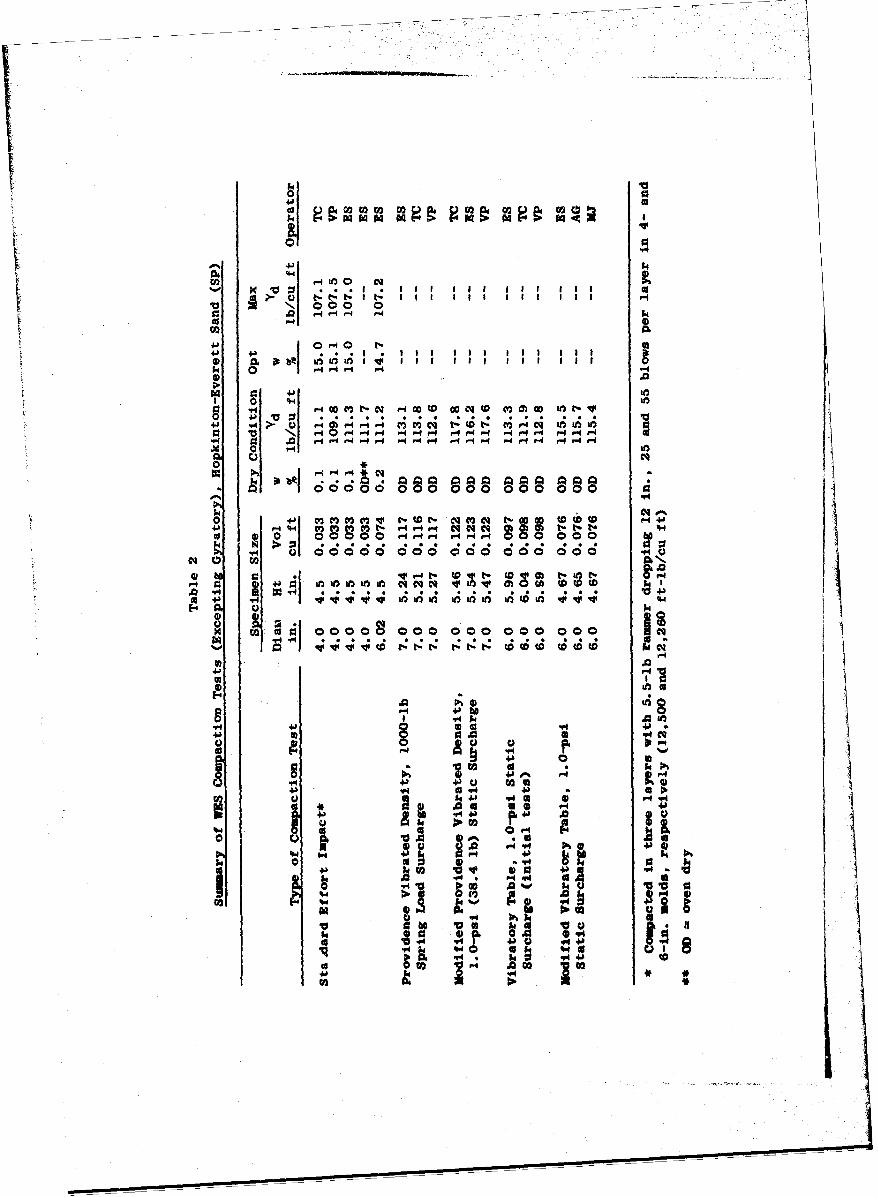
20. Tests other than GC. The results of all tests performed on
the Hopkinton-Everett sand (SP) except the GC tests are shown in table 2.
Density values are further summarized in table 4. It can be seen in
table 4 that higher densities (by 3.8 pcf on the average) were achieved
in the STD tests when the material was compacted dry than when it was
compacted at optimum water content. Compaction curves for the STD tests
are shown in fig. 6. These curves indicate very close agreement in deln-
sities obtained in the STD tests conducted by different operators when the
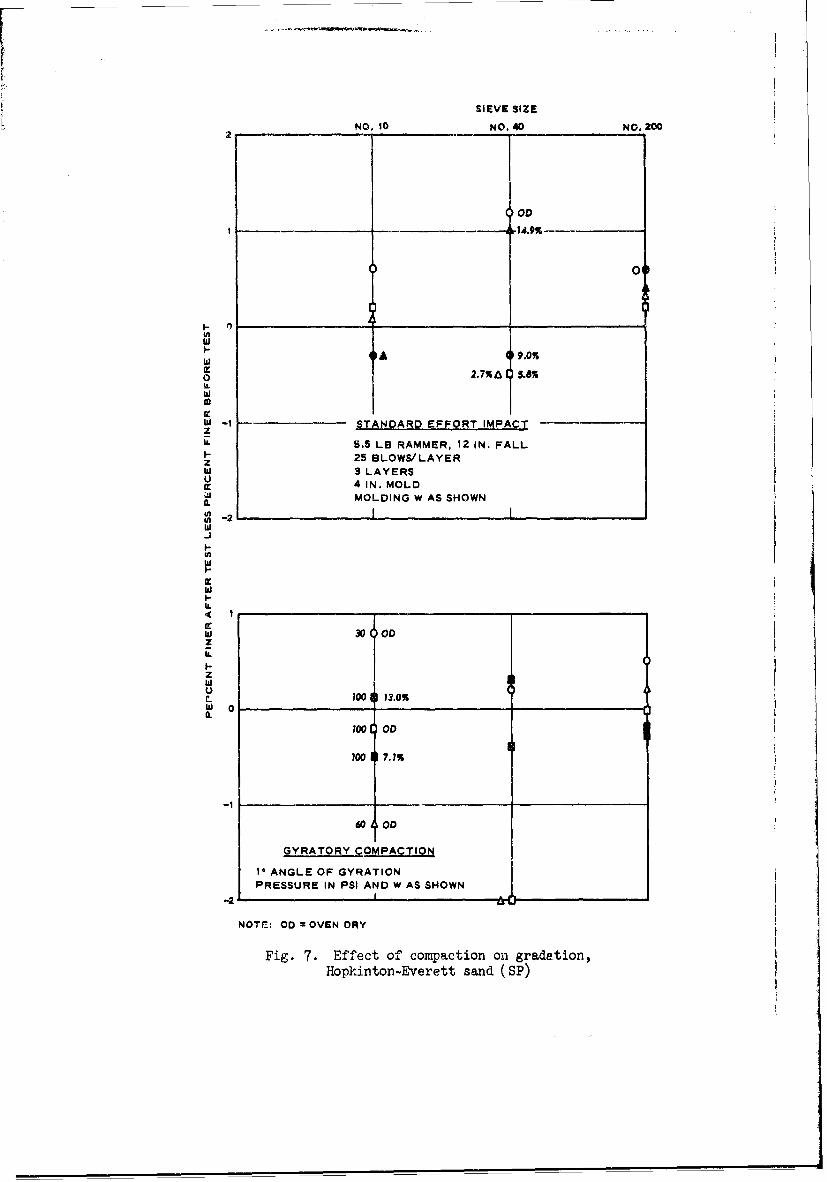
sand was compacted at optimum water content. Gradation tests performed
after impact compaction with the 5.5-lb rammer showed less than 1 percent
increase in the amount of' material passing any one sieve, indicating that
particle degradation was probably minor (see fig. 7).
21. The MPVD method produced an average density about 4 pcf higher
than that obtained with the original PVD method. Also, density variations
between different technicians were slightly greater with the MFVD method
than ,-1ith the PM method (1.6 versus 1.2 pcf). Sililarly, the average
density obtained using the MVT method was 2.8 pcf higher than that ob-
tained using the VT method (paragraph 14), with slightly more variation
in density values obtained by tne various technicians than when using
the VT method.
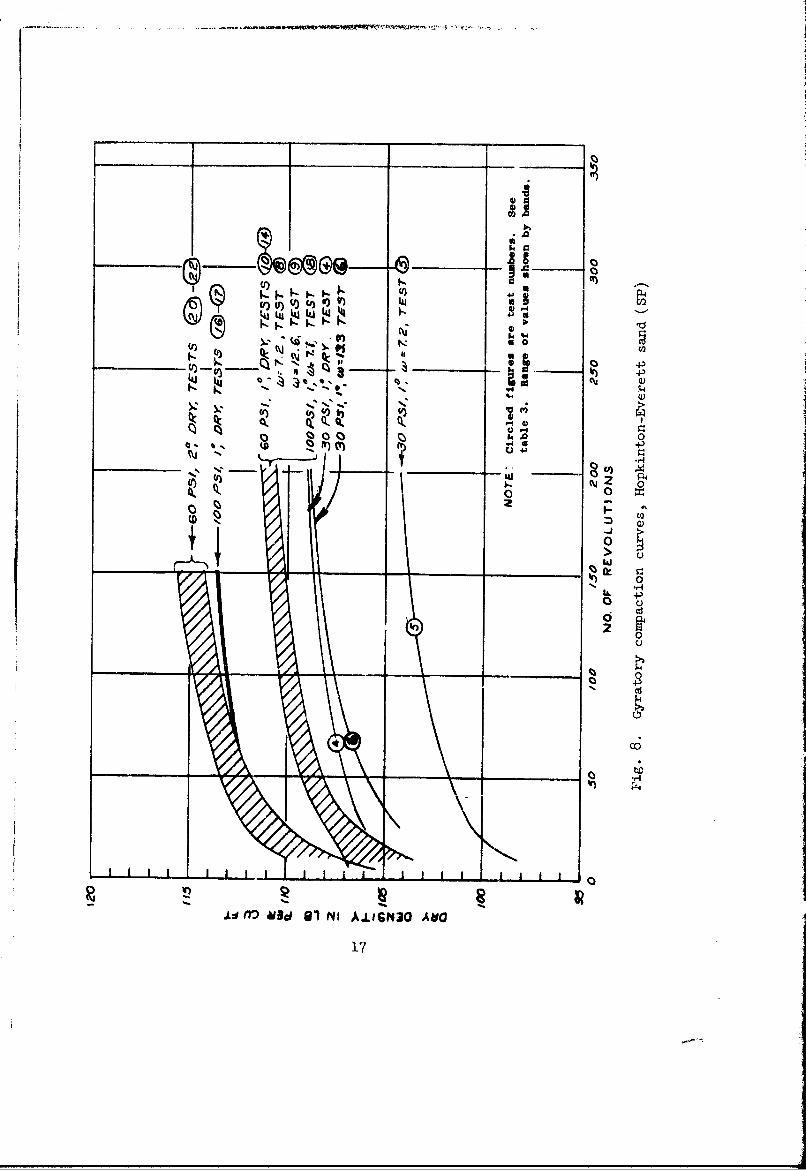
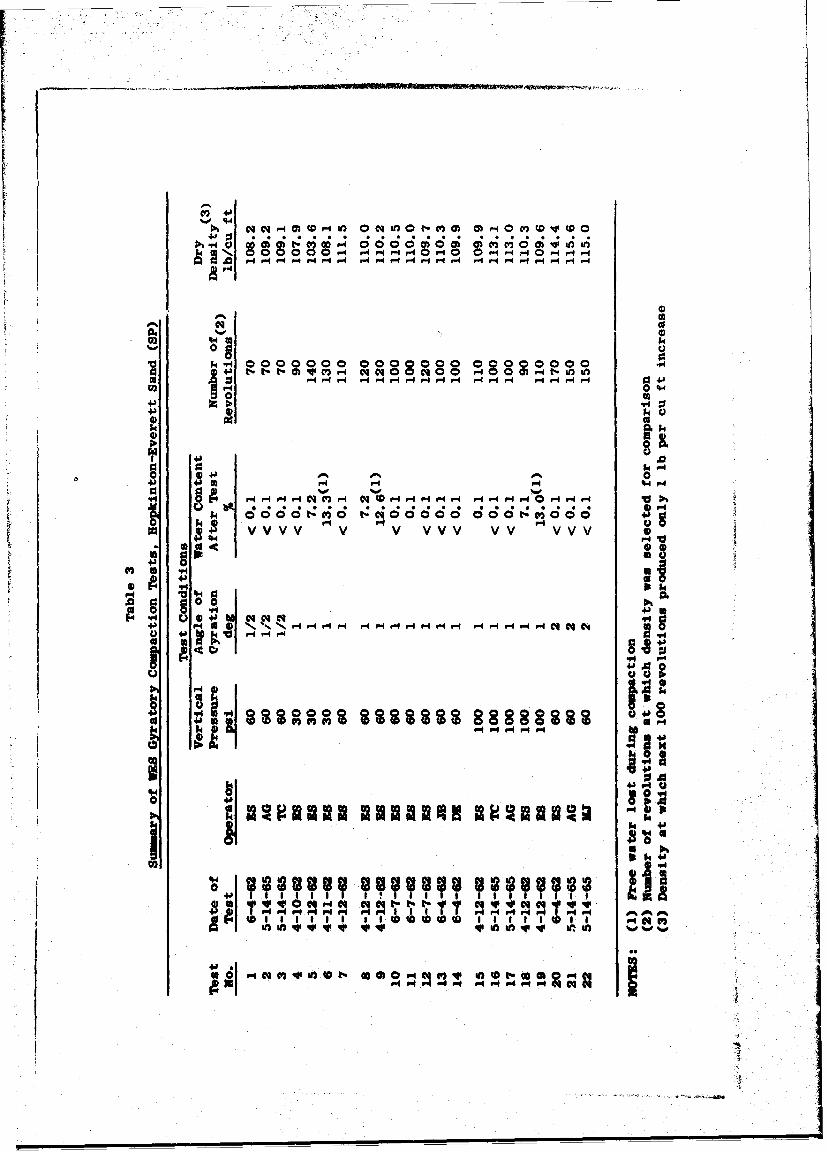
22. GC tests. Twenty-two GC tests were conducted on the sand (SP)
prepared at thr( different initial water contents: (a) essentially oven-
Iry, (b) about 7 percent, and (c) about 15 percent (free water was noted
in every test on these specimens). Vertical pressures of 30, 60, and
100 psi and angles of gyration of 1/2, 1, and 2 deg were used. Those
densities of the specimens at which the next 100 revolutions produced
only about 1-pcf increase were used for comparing results of the various
tests. Plots of density versus number of revolutions for all tests except
those with 1/2-deg angle of gyration are shown in fig. 8. The test con-
ditions and density results are summarized in table 3.
23. Comparison of results of five sets of mechanical analysis tests
14
_IIt-. li z
-u - -'-I l cJ 0 3C2 ul v 9
OD cc------s
40 0
4JdAJ.SN3 ).-9N3 AdQ w
$~ (9
WO F
N~L IN
z zD 0
0 0
-10 I0
co T y1
-J7 rALISN30 kaa :dd 'A.LISN30 AdO 2
15
SIEVE SIZENO. 10 NO. 40 NO. 200
2
00
-14.9%
I-ulw
I- 41A 419.0%
O 2.7%& 5.8%
w
W -l STANDARD EFFORT IMPACT
U. 5.5 LB RAMMER, 12 IN. FALL1- 25 BLOWS/LAYERzILI 3 LAYERSiU 4 IN. MOLD
wJ MOLDING W AS SHOWN
E -2Id-J
I-
I"
It.' 1 _ _ _ _ _
I 30 OD
IU.
I-III, IIu(r_ 10011 13.0%
W 0
100 OD
7o0 1 7.1%
60 00
GYRATORY COMPACTION
1 ANGLE OF GYRATION IPRESSURE IN PSI AND w AS SHOWN
-2I
NOTE: 00 =OVEN DRY
Fig. 7. Effect of compaction on gradation,Hopkinton-Everett sand (SP)
aI4C4
(zJ~~~ R I.JuU&~~ J
'~0-~ go
1I-. 4S
C6 -
Ad 40 Al 1NIALroj N
17w
conducted before and after gyratory compaction indicated that no signifi-
cant degradation of particles occurred during the tests (see fig. 7). The
small variations in percent passing any one screen appeared to be random
scatter.
24. As can be seen in fig. 8, the density of specimens compacted
using an angle of gyration of 1 deg under a pressure of 60 psi was rela-
tively insensitive to change in water content. On the other hand, under
the low vertical pressure of 30 psi, the density (103.6 pcf) at the inter-
mediate water content was substantially lower than those of the dry and
wet material (107.9 and 108.1 pcf, respectively).
25. Tests by different operators and repeated tests by the same
operator indicated excellent reproducibility of results, the greatest
variation being 3.2 pcf for tests using 1-deg gyratory angle and 100-psi
vertical pressure (see table 4). The densities obtained on dry specimens
using various angles of gyration and two vertical pressures can be readily
compared in table 4. The highest densities were obtained on dry material
using 2-deg gyratory angle and 60-psi vertical pressure; these densities
averaged 115.0 pcf or 6.2 pcf higher than the average density obtained
using a i/2-de angle and 60-psi pressure. However, if a 2-deg gyratory
angle and 100-psi pressure had been used, even higher densities might have
been obtained.
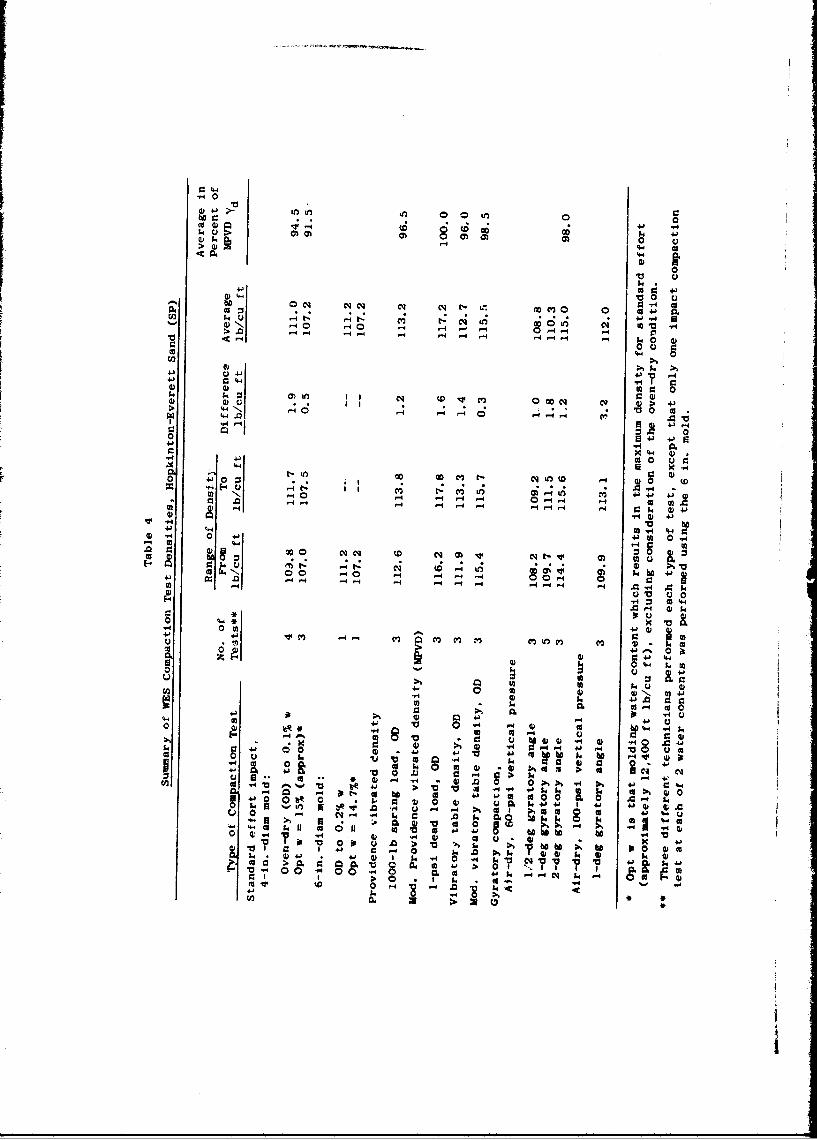
26. Summary. The differences in densities obtained by three dif-
ferent operators ranged from 0.3 pcf (in the MVT test) to 1.9 pcf (in the
STD tests on dry material). Except for these latter tests, the differences
were generally about 1 percent of the average or less. Highest densities
were obtained in the MPVD test (average 117.2 pcf), followed closely by
the WIT test (average 115.5 pcf) and the GC test with 2-deg gyratory angle
and 60-psi vertical pressure (average 115.0 pcf). Densities of other
tests ranged down as low as 107.2 pcf.
West Thompson sand (SW)
27. Three MPVD tests, three MVT tests, and nine GC tests were per-
formed on the West Thompson sand (SW) to provide additional information
on a gradation intermediate between the Hopkinton-Everett sand (SP) and
the Painted Rock sandy gravel (GW). The GC tests were performed under a
18
vertical pressure of 60 psi at gyratory angles of 1/2, 1, and 2 deg. The
three tests at each angle of gyration were performed by different
operators.
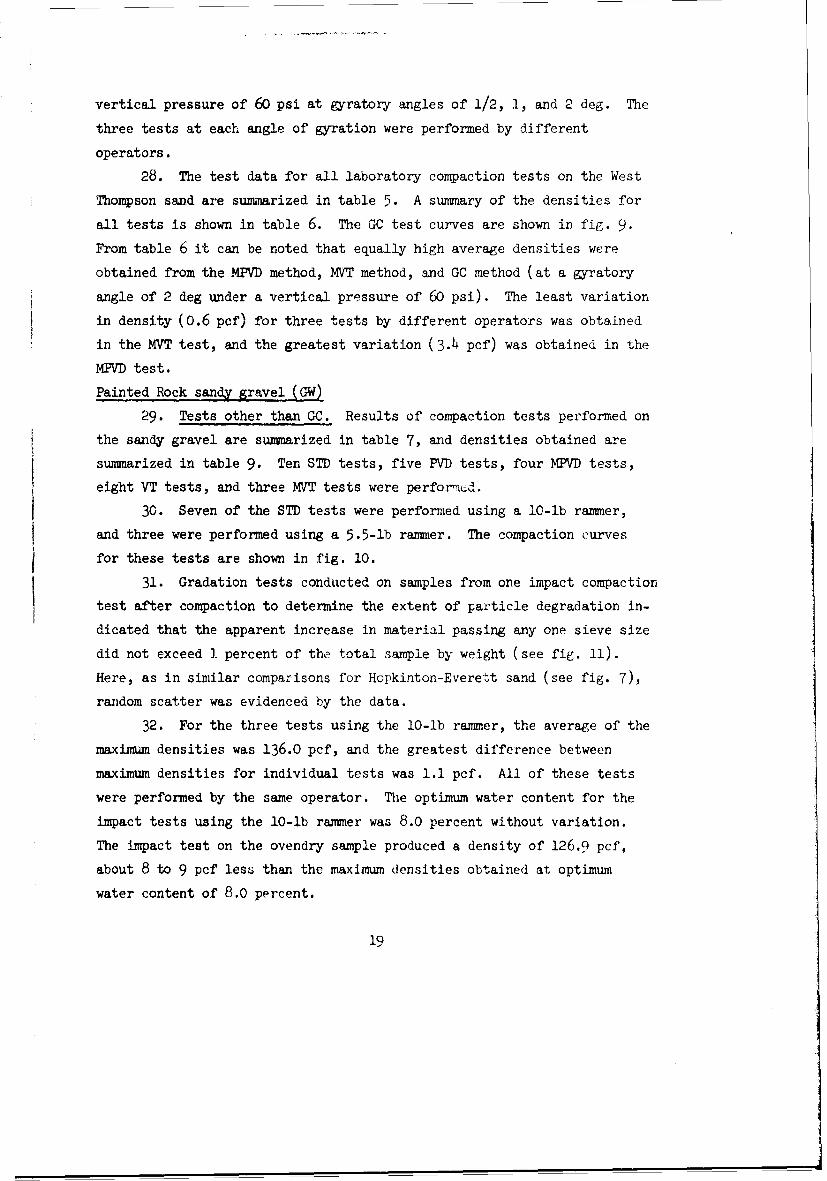
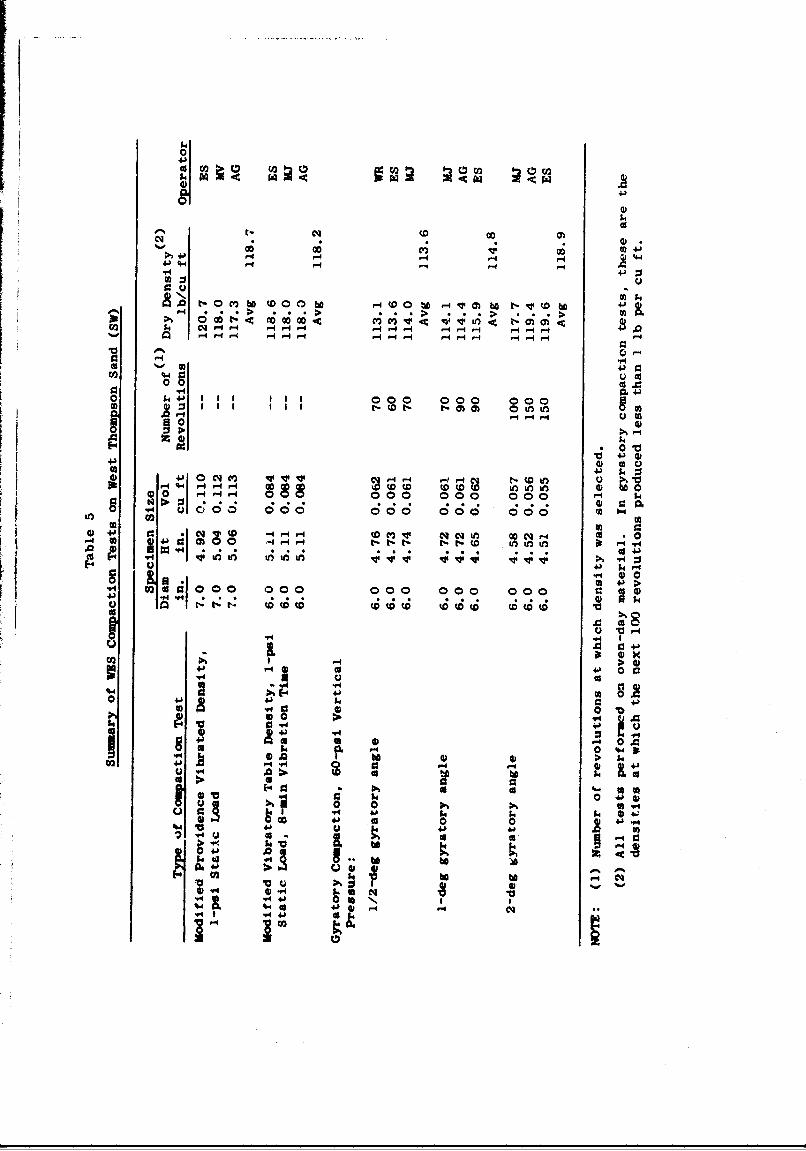
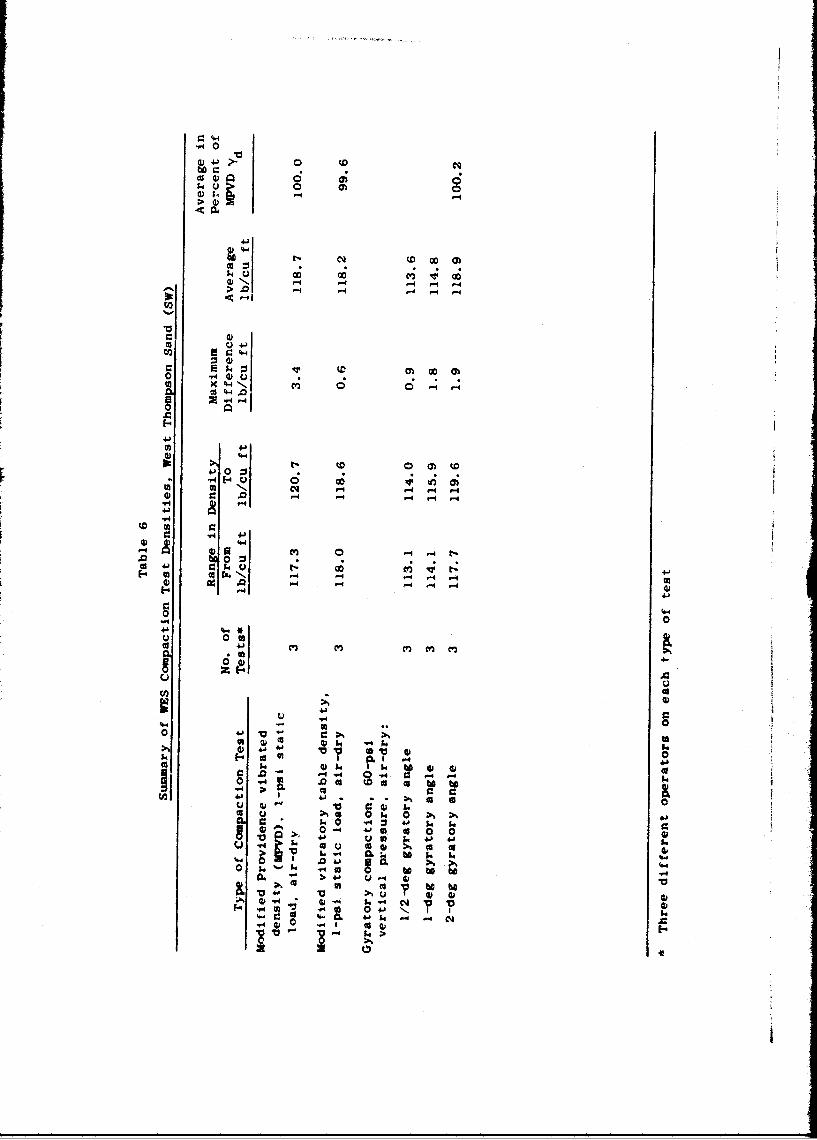
28. The test data for all laboratory compaction tests on the West
Thompson sand are summarized in table 5. A summary of the densities for
all tests is shown in table 6. The GC test curves are shown in fig. 9.
From table 6 it can be noted that equally high average densities were
obtained from the MFVD method, MVT method, and GC method (at a gyratory
angle of 2 deg under a vertical pressure of 60 psi). The least variation
in density (0.6 pcf) for three tests by different operators was obtained
in the MVT test, and the greatest variation (3.4 pcf) was obtained in the
MVD test.
Painted Rock sandy gravel (GW)
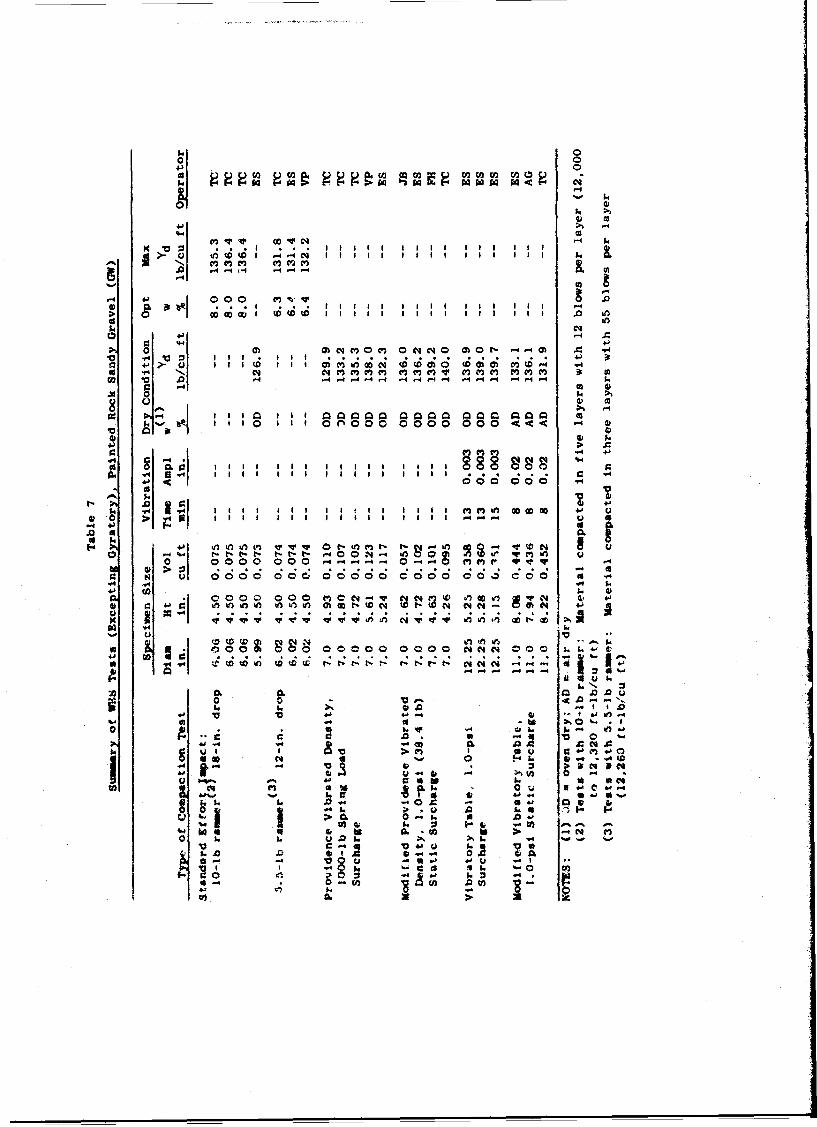
29. Tests other than GC. Results of compaction tests performed on
the sandy gravel are summarized in table 7, and densities obtained are
summarized in table 9. Ten STD tests, five PVD tests, four MPVD tests,
eight VT tests, and three MVT tests were performed.
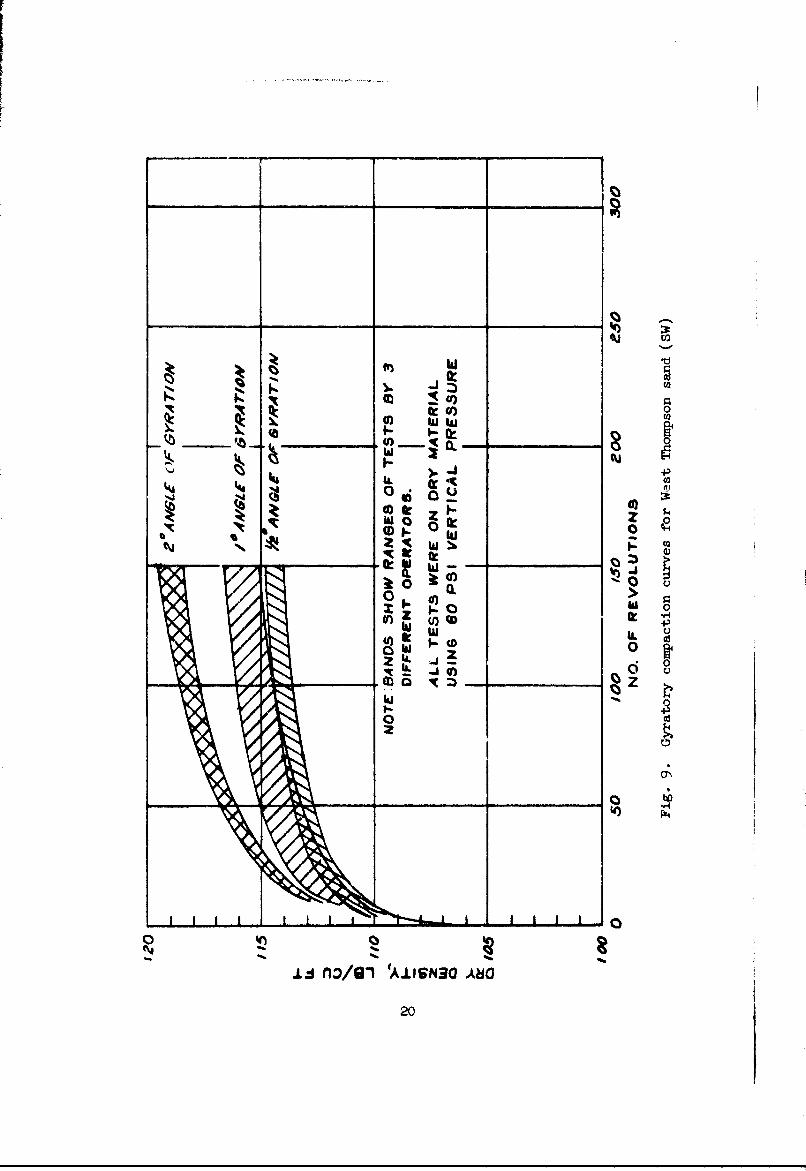
30. Seven of the STD tests were performed using a 10-lb rammer,
and three were performed using a 5.5-lb rammer. The compaction curves
for these tests are shown in fig. 10.
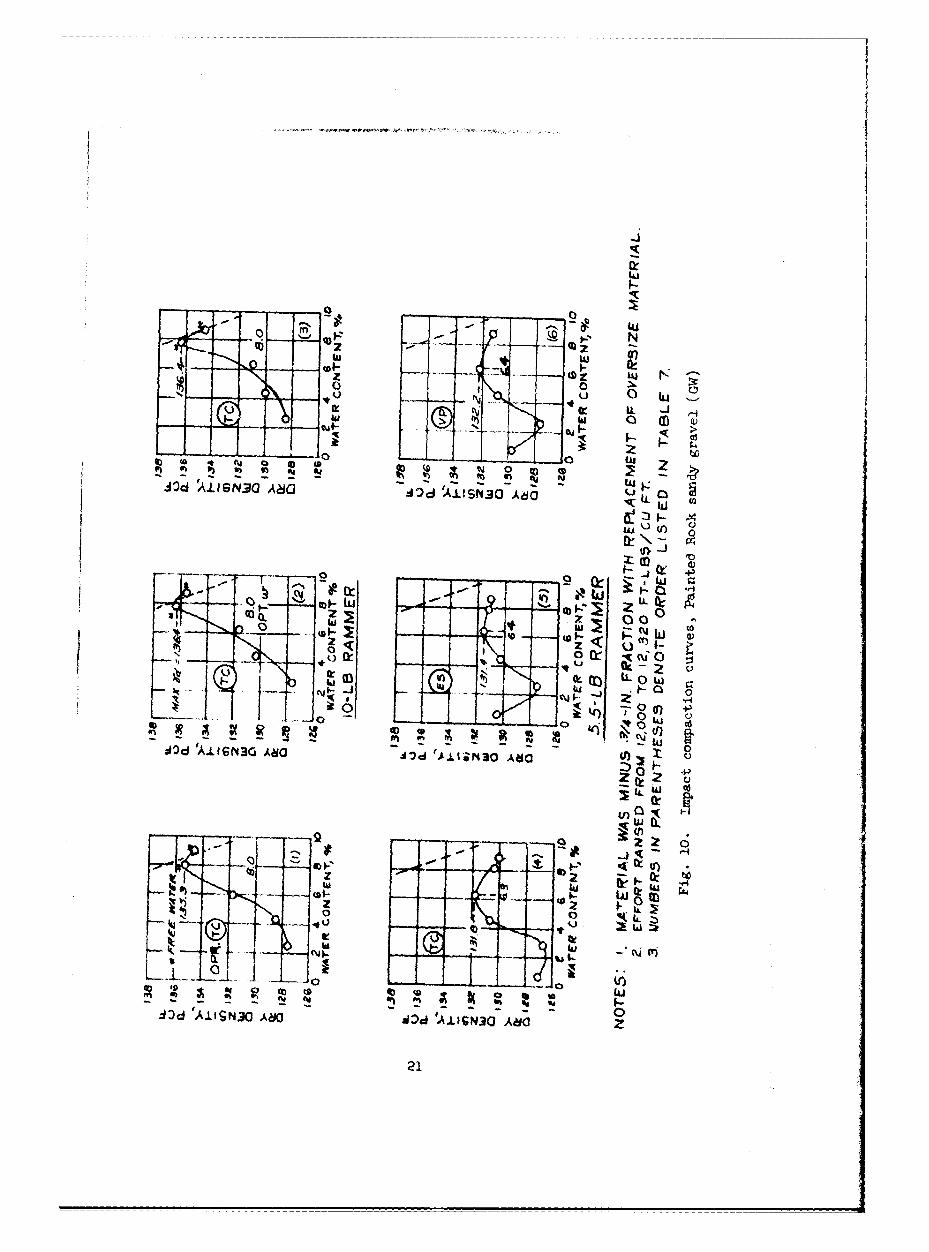
31. Gradation tests conducted on samples from one impact compaction
test after compaction to determine the extent of particle degradation in-
dicated that the apparent increase in material passing any one sieve size
did not exceed 1 percent of the total sample by weight (see fig. 11).
Here, as in similar comparisons for Hopkinton-Everett sand (see fig. 7),
random scatter was evidenced by the data.
32. For the three tests using the 10-lb rammer, the average of the
maximum densities was 136.0 pcf, and the greatest difference between
maximum densities for individual tests was 1.1 pcf. All of these tests
were performed by the same operator. The optimum water content for the
impact tests using the 10-lb rammer was 8.0 percent without variation.
The impact test on the ovendry sample produced a density of 126.9 pcI,
about 8 to 9 pcf less than the maximum densities obtained at optimum
water content of 8.0 percent.
19
IId
qt 0~t )0Qz 0) 0) hi.I
J~4-)
N~ ~ ~ a 0ft;
oC
d0)
z 0
U w~c ILw ~0 0
0) 0
ooo
200
oLL
CV >
4Q D <aQ iu A.I Nl
NIZ 00
ZLS43 AdL3
--
C4 (x 0Wd 'AtN O AI q ±~3 d
00 23.
SIEVE SIZE
0.525 IN. 0.371 IN. NO. 4 NO. 10 NO. 40 NO. 200
A 10 A
A0 - 8.0% I
4.0%2.0%
STANDARD EFFORT IMPACT 9.0%___________ 6.0% _______
10 LB RAMMER, 18 IN. FALL
12 BLOWS/LAYERS LAYERShi6 IN. MOLD
w MOLDING W AS SHOWN
0
wz
z
h +4.1
W. 2x-l
I-
T _ 100 4
w
hi- 2 - - -
hi10 O.3
-, . ... ,,
hi10 0
PRESSURE IN PSI ANn w AS SHOWN
hii
NOTE 00 8 OVIN 0RY
F I I.. .IN ,SI A .. -wmA'tion onS-OW-z _ _ __<,- zm !.. ,:- vl. ...,,
33. The impact compaction tests on the sandy gravel using the
5.5-lb rammer produced an average maximum density of 131.8 pcf, or about
3 pcf less than the average maximum density obtained using the 10-lb
ramer, even though the same total energy was used. The optimum water
content for tests with the 5.5-lb rammer was 6.4 percent. The greatest
difference between maximum densities for individual tests with the 5.5-lb
rammer was 0.8 pcf; these tests were performed by three different
operators.
34. The densities obtained on ovendry material having a maximum
particle size cf 2-1/2 in. averaged 133.7 pcf in the five PVD tests, with
a maximum difference of 8.1 pcf for individual tests. The first three
PVD densities shown in table 7 are listed in the order in which the tests
were performed by the same technician. Although new material was used for
each sample, the density increased each time, with the maximum difference
being 5.4 pcf, which is about the same as the maximum difference for the
tests performed by different technicians. The average density for the
four MPVD tests was 137.8 pcf, with a maximum difference in density be-
tween individual tests of 4.0 pcf. Each test was performed by a different
operator.
35. VT tests were performed on ovendry samples of the minus 2-1/2-
in. material using a 12.25-in.-diam mold. Preliminary tests showed that
great care had to be taken to prevent segregation in placing this material
in the mold. Otherwise, the densities obtained were low and could not be
duplicated. Vibration times ranged from 8 to 15 min.
36. Samples of the well-graded sandy gravel were prepared by placing
the required weight of each fraction in a pan. Since the particle sizes
ranged up to 2-1/2 in., it was found that segregation would occur during
placement in the mold, unless the prepared sample was spread out in a thin
layer in the pan with the larger particle sizes uniformly distributed, and
care was taken to ensure that each scoop placed in the mold contained a
uniform mixture of all particle sizeC. Initial vibratory tests performed
on material not placed as described gave maximum densities averaging about
10 pcf less than those for carefully placed material.
37. The three MVT tests conducted by different operators produced
23
densities that ranged from 131.9 to 136.1 pcf and averaged 133.7 pcf.
Comparison in table 7 of the densities obt i.ied for the five compaction
methods (other than the gyratory) used on the sandy gravel indicates that
the most consistent results were obtained with the STD method. The least
consistent results were obtained with the PVD method, in which the maxi-
mum difference between individual densities was about 8 pcf, and there
were large variations in results of tests conducted by the same operator.
There were also large differences in results of the MPVD and MVT tests,
though only about half of that for the PVD test.
38. GC tests. The GC tests were performed on the minus 3/4-in.
portion of the sandy gravel (GW), with the plus 3/4-in. fraction replaced
by an equal amount of material pass4ng the 3/4-in. sieve and retained on
the Nc. 4 sieve. The gradation curve for the material tested corresponded
very closely with that used in the STD tesr-s, as shown in fig. 1.
39. Twenty tests were conducted on material prepared at three dif-
ferent initial water contLnts: (a) about ovendry, (b) 4 percent, and
(c) about 8 percent (corresponding to optimum water content for STD com-
paction). The tests were conducted at vertical pressures of 30, 60, and
100 ps& and angles of gyration of 1/2, 1, and 2 deg. A number of tests
with the same testing conditions were performed by different technicians
to determine the effect that using different operators would have on the
test results.
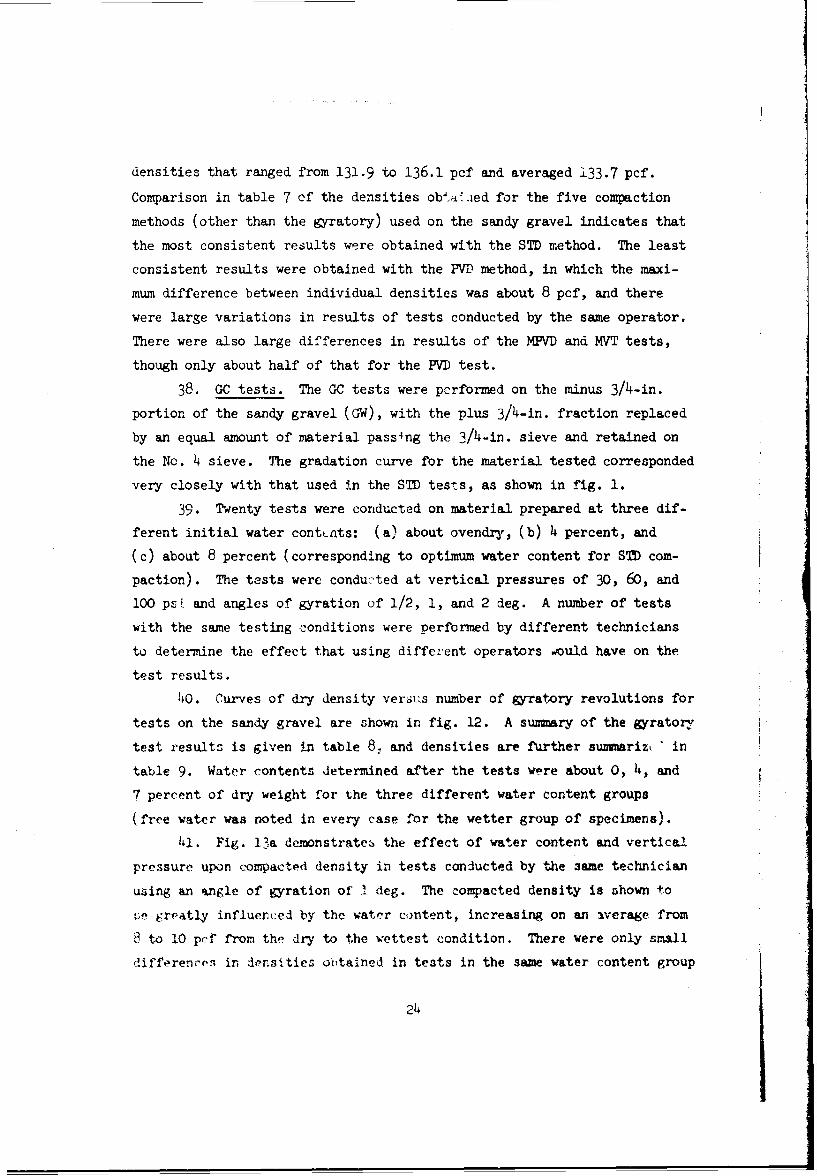
40. Curves of dry density versrs number of gyratory revolutions for
tests on the sandy gravel are shown in fig. 12. A summary of the gyratory
test results is given in table 8. and densities are further summariz(' in
table 9. Water contents determined after the tests were about 0, 4, and
7 percent of dry weight for the three different water content groups
(free water was noted in every case for the wetter group of specimens).
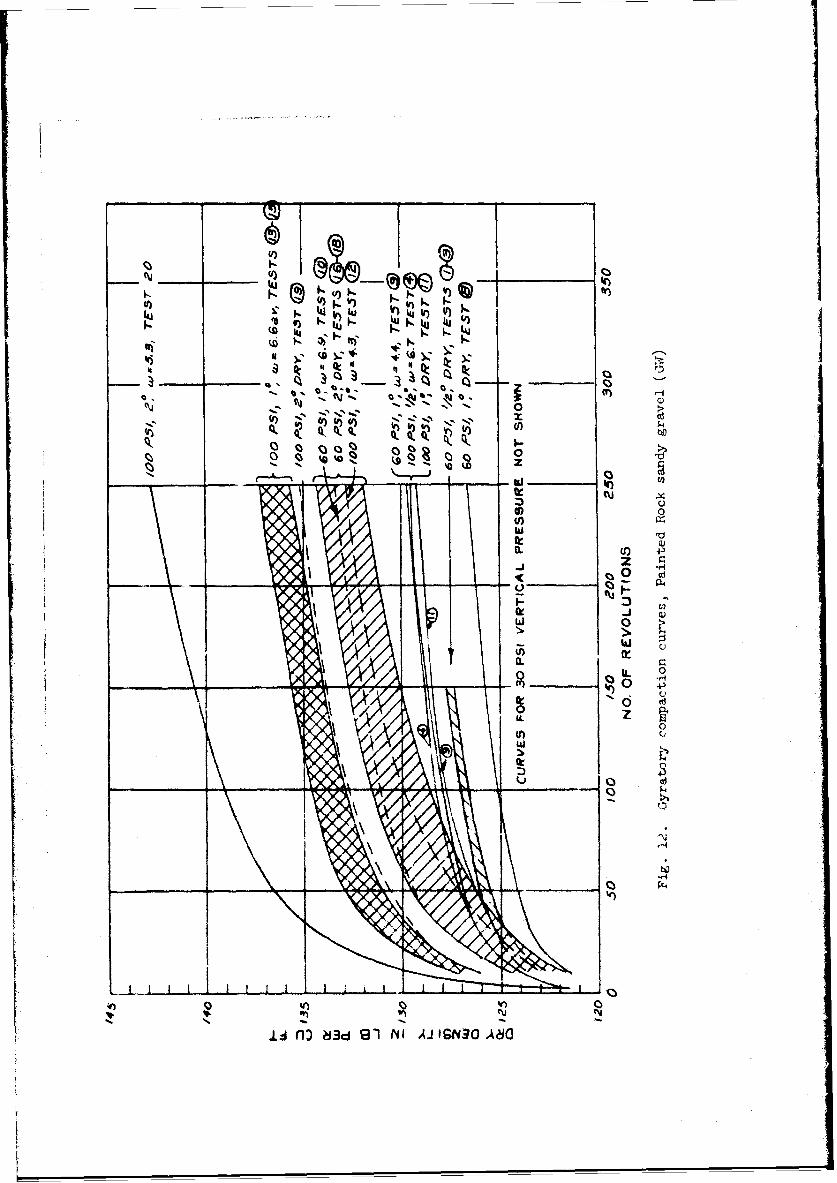
h. Fig. 13a de.instrate the effect of water content and vertical
pressure upon compacted density in tests conducted by the same technician
using an angle of gyration of . deg. The compacted density is shown to
ufe ereatly influerced by the water content, increasing on an average from
to 10 pcf from the dry to the wettest condition. There were only small
differences in densities obtained in tests in the same water content group
24
(I-j
tV4. V44
%- IQ
k9 z
*~ - Q~C'~ ~w
wfe
MJ Q
IA 0 1
0(n C.
_ _ _ _ _ _
iL Al n) 3d 181 NI AJIG<N20 Ada
I VERTICAL PftESSURE,PSI
OV 1 EN DRY 70 05 A
V3- 4.4%
24 126 128 .30 132 ?94 !8 138ecLB PER CUBIC Foor
a. EFFECT OF WATER CONTENT AND VERTICAL PRESSUJRE
(DOP
021 ___ __0
10-
LL ~IA
- II
194 126 128 /30 /32 134 /8 -71Xdl 18 PER cueIc FOOT
b. EFFECT OF ANGLEA GYRATION AND VERTICAL PRESSURE
NOTE' ALL TESTS BY OPERATOR© 9 EXETTOS OE A 30WHICH ARE AVERAGES -')F TESTS BY 3 OPERATOPS
Fig. 13. Effects of various factors on densities in gyratorycompaction tests, Painted Rock sandy gravel (GW)
26
for the 30- and 60-psi pressures using an angle of gyration of 1 deg. The
greatest difference was 1.4 pcf for the dry specimens, and the average
difference uas only 0.4 pcf. On the other hand, the tests using 100-psi
pressure showed considerably higher densities than those asing lower
pressures, averaging 3 pcf higher. Thus, while the GC test density for
this material appears to be affected most by water content, vertical
pressure and angle of gyration are also i !mortant factors (fig. .13b).
42. The resulting densities for tests on the dry specimens con-
ducted with a vertical pressure of 60 psi by different operators were
witnin 1 pcf for an angle of gyration of 1/2 deg, while for 2 deg, the
difference in densities amounted to 2.7 pcf.
43. Varying the angle of gyration had a large effect on the com-
pacted densities of the sandy gravel. Fig. 13b shows that increasing the
angle of gyration from 1 to 2 deg resulted in a density increase of about
7 pcf for the dry condition under vertical pressures of 60 and 100 psi,
and about the same for the 6 percent w condition under 100 psi. The ef-
fect of reducing the astgle of gyration from 1 to 1/2 deg was not clearly
defined in the tests, as the dry material increased about 2 pcf in density
under a vertical pressure of 60 psi, and the wettest material decreased
about 8 pcf under a vertical pressure of 100 psi.
44. Five pairs cf gradation tests were conducted on the material
before and after conpaction (see fig. 11). After compaction, the percent
of material passing was generally 1 to 2 percentage points more than that
befo- comnaction. While random scatter can be expected in replicate
tests on the same material, the consistent trend of the data suggests
there was a slight amount of degradation of particles during gyratory
compaction, but it was so small that it had no practical significance.
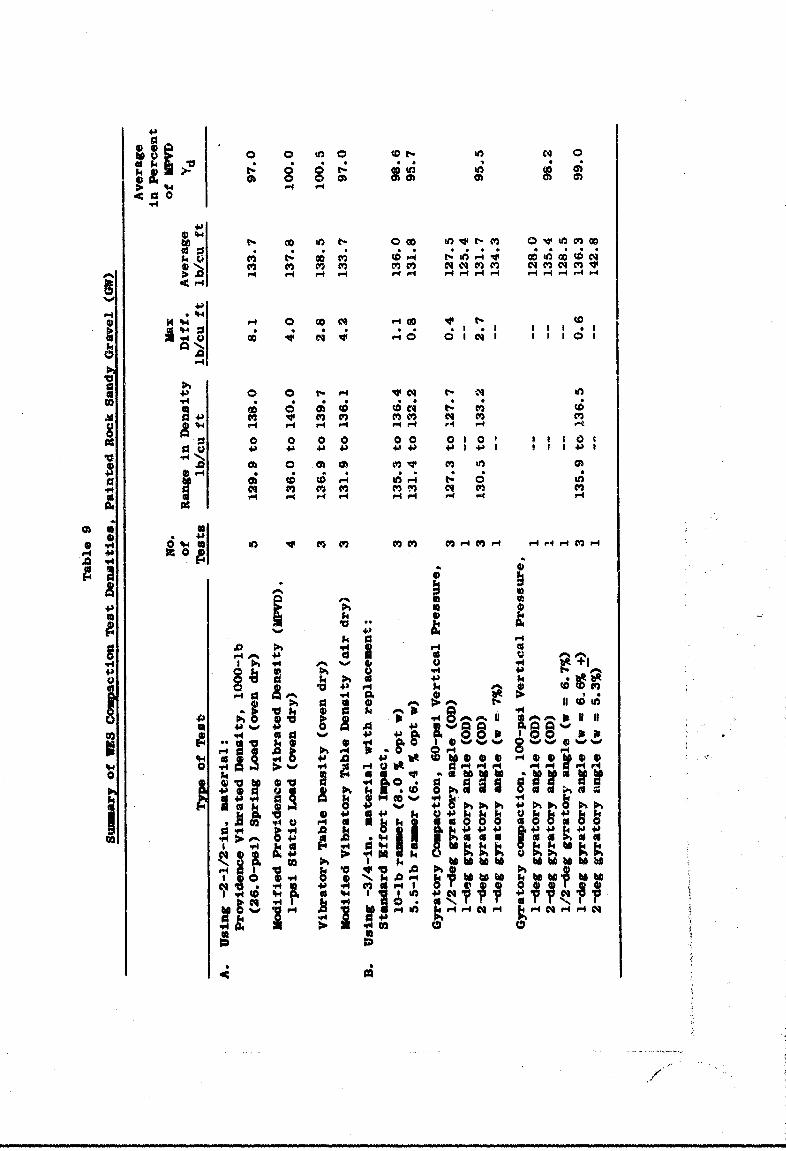
45. Sua.r As shown in tuble 9, the highest densities using
minus 2-1/2-in. material were obtained in the MPIVD and the VT tests
(137.8 and 138.5 pcf, respectively). The average density obtained in the
MVT test was 133.7 pcf, about 4 pcf lower. Densities ranging from 98.2 to
99.0 percent of MPVD density were obtained on minus 3/4-i.n. material with
replacement in the STD tcsts using the 10-lb rammer on material at optimum
water content, and in two GC tests using 100-psi pressure (one with
27
Iovendry material and using a 2-deg gyratory angle, and one at 6.6 percent
water content and using 1-deg gyratory angle).
46. The least variation in densities with different operators was
obtained using minus 3/4-in. material with replacement in two of three
sets of GC tests and in the STD tests (0.4 to 1.1 pef). The greatest
variation using minus 2-1/2-in. material was in the PVD test (8.1 pcf).
Variation in densities of MPVD and MVT tests conducted by different op-
erators was about 4 pcf. The differences in results for the materials
with different -maximum particle sizes reflect the difficulty of preparing
uniform specimens with the material having particles up to 2-1/2 in., as
discussed in paragraph 36.
Sumnary of test results
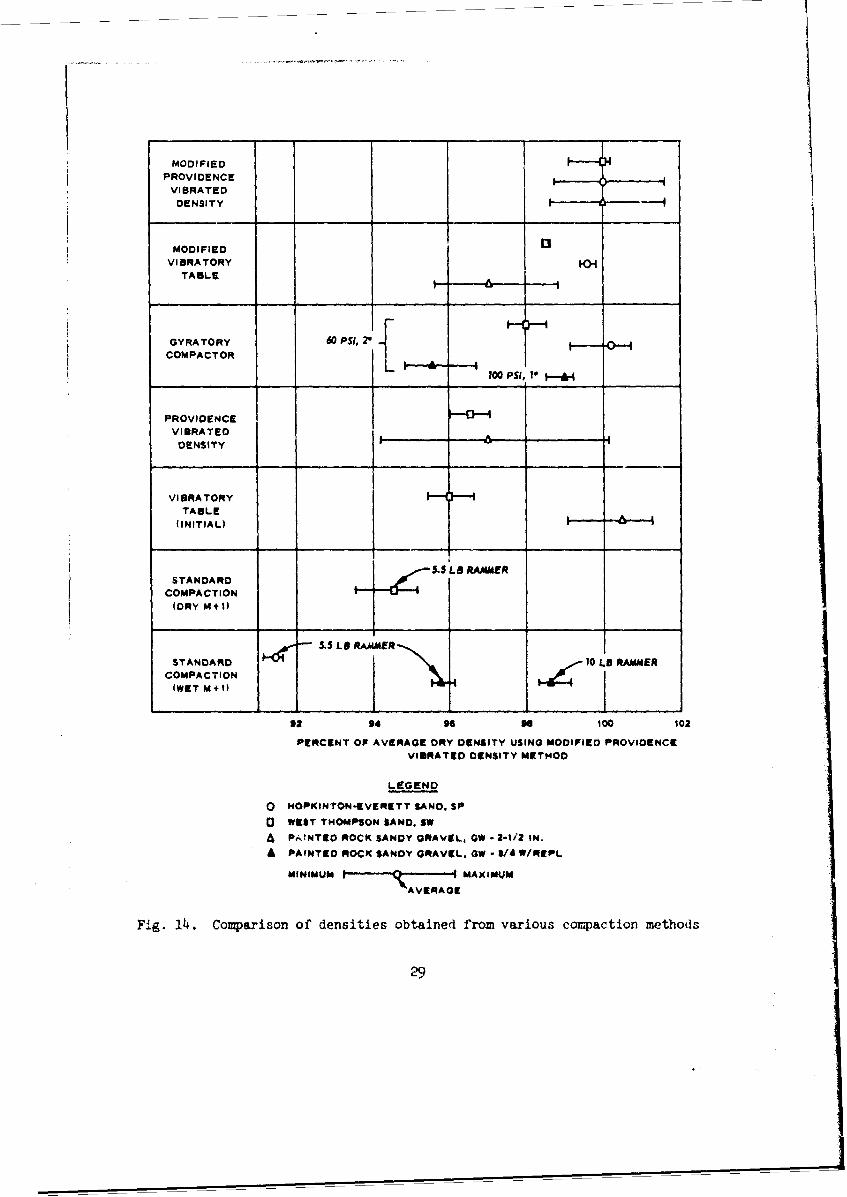
47. Fig. 14 shows the range of densities and average density ob-
tained through use of the principal test methods on the three soils. The
M.VD test generally produced the highest densities for all three soils,
although these densities are sometimes equaled or slightly exceeded on a
given soil using other test methods. The MVT and the GC tests gave den-
sities for the three soils that average about 98 percent of the NMVD
results. Also, the MVT and GC tests showed less spread of results than
the MPVD tests. The STD test using the standard 5.5-lb ramer gave low
density values for the two soils tested (SP and GW), but a density value
of 98.6 percent of MPVD when a 10-lb rammer was used. The STD tests on
wet material did, however, consistently show a much smaller range of
densities than any other tests.
28
MODIFIEDPROVIDENCE
VI BRA TEDDENSITY 1 ---
MODIFIEDVIBRATORY 0
TABLE
GYRATORY 60 PSI, 20 *-COMPACTOR L
100 PSI, 1# A-.
PROVIDENCEDVIBRA TED
DENSITY ~ 6--
VIBRATORYTABLE
(INITIAL)T
is5 L RAMMERSTANDARD
COMPACTION(DRY M+ 1)
STANDARD &LP E-N16 10 8B RAMMERCOMPACTION
1
(WET M + U
92 94 91 00 102
PERCENT Of AVERAGE DAY DENSITY USING MODIFIED PROVIDENCEVIBRATED DENSITY METHOD
LEGEND
o HOPKINTON-EVERETT SAND. SP
E) WIEST THOMPSON %AND. SW
SPAINTED ROCK SANDY GRAVEL, OW - 2-liZ IN.
£PAINTED ROCK SANDY GRAVEL. 4W - I/& W/REPL
MINIMUM MAXIMUM
AVERAGE
Fig. 14. Comparison of densities obtained f~rom various compaction methods
29
PART III: COMPARISON OF FIELD AND LABORATORY COMPACTION DATA
Survey of CE Offices
48. The Divisions and Districts of the Corps of Engineers were
surveyed during FY 1960 to determine their construction experience with
cohesionle.Ls materials, including the types of laboratory compaction tests
used, field compaction procedures, and methods used in field density con-
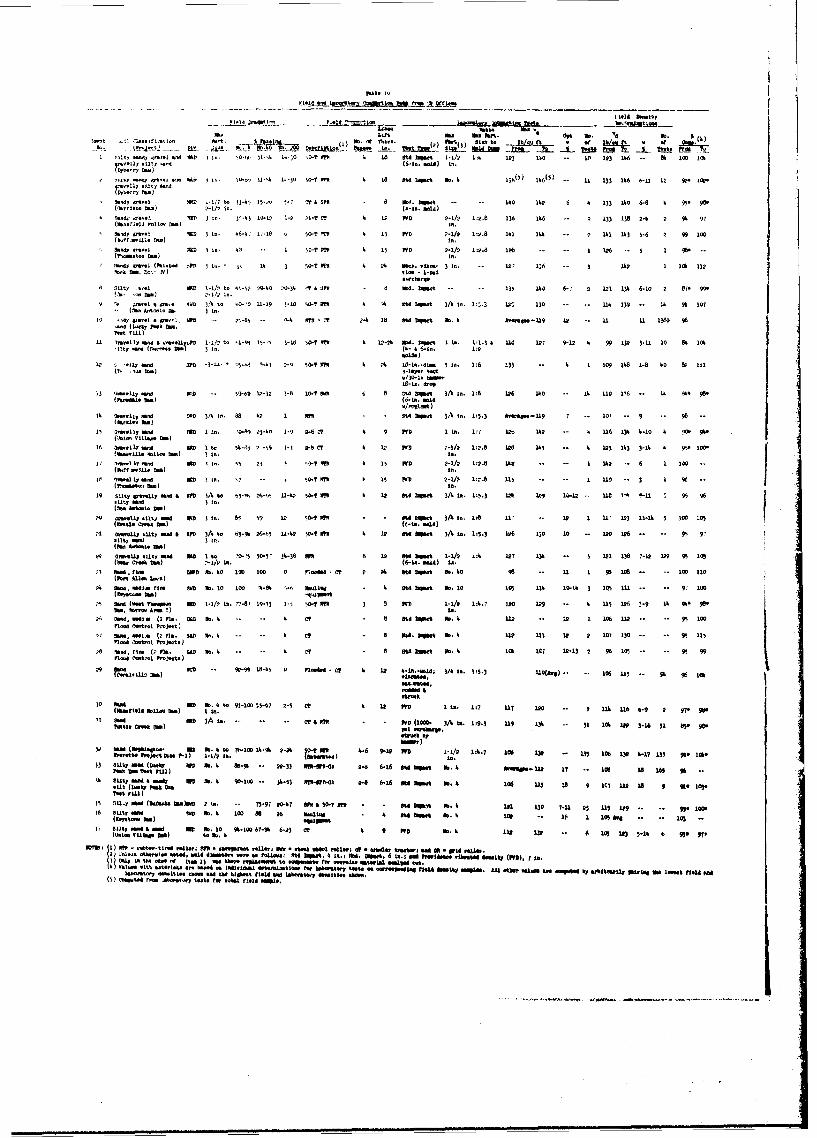
trol testing. Data received on 37 soils are presented in table 10. Data
from a number of other projects were received, but these are not included
for a number of reasons, but primarily because gradation data for estab-
lishing the similarity of field materials with laboratory samples were
not included. In 25 of the 37 items listed in table 10, the individual
laboratory results could not be paired with the individual field test
results on the same soils. The percent compaction values shown in the
table for these soils were arbitrarily computed by comparing the lowest
field value to the lowest laboratory value reported and the highest field
value to the highest laboratory value reported. Furthermore, in some
instances the laboratory compaction tests were conducted on specimens from
which significant portions of large particles had been scalped; compari-
sons of field densities on unscalped material with unadjusted results of
the laboratory test. on scalped material are, of course, subject to con-
siderable error.
i9. Comparisons of field and laboratory compaction data for the
Hopkinton-Everett sand (SP), the West Thompson sand (SW), and the Painted
Rock sandy gravel (GW) used in the WES laboratory investigations described
in Part II are discussed in paragraphs 52-70.
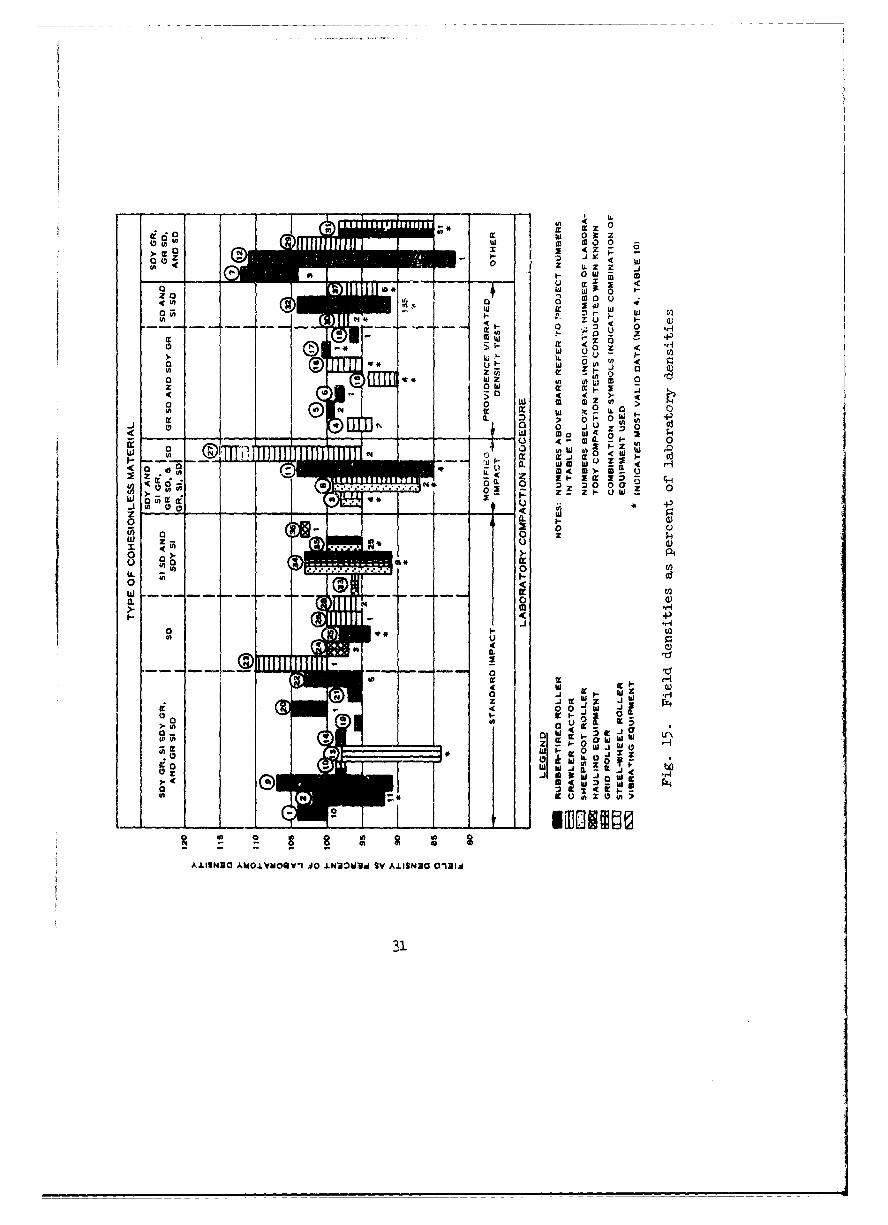
50. Fig. 15 shows the ranges of field densities for each project
,xpress-d in percent cf laboratory density values reported by the Divisions
and/or Dstric'ts and grouped according to method of compaction and soil
type. Gradation of materials ranged from sandy gravels to silty send,
and projects within each compaction test group are arranged in the order
of 1-creasing coarcenes. of material. In general, three principal methods
w,re u:3c:d y the Cor. offices in compaction tests on cohesionless
?0
a L -1 )e <
u a:,0w
I A)
aGfn 11 w w
0 z z
0 0 -d
Z. 0
> 000 dc -
4 0w
- M a I- n 4
400 >- IIL IIt r
kLI3N ~ ~ ~ ~ ~ ~ ~ I- aW~VOV jO±ZdSVALSUOO1
31 C
materials--standard impact compaction, modified impact compaction, and
Providence vibrated density. In some cases, variations of the impact and
Providence procedures were being used; these include rodding the specimen
and pounding the mold with sledge hammers or other heavy objects. As
shown in fig. 15, field compaction was arcomplished with a wide variety of
equipment: rubber-tired rollers, tractors, sheepsfoot rollers, grid
rollers, steel-wheel rollers, hauling equipment, and vibrating equipment.
51. For the data shown in fig. 15, the ratios of field densities to
corresponding laboratory densities had the least spread when the Providence
vibrated density procedure was used. Corresponding field densities ranged
from 90 to 104 percent of the Providence vibrated densities, whereas with
the other methods the range of field densities in terms of laboratory
results was much broador, ranging from 82 to 115 percent. Field densities
expressed as percentages of laboratory densities showed no consistent
relations with field compaction procedures, maximum particle sizes, or
gradation analyses.
Comparison of Laboratory Test Results withField Data on Materials Tested at WES
52. As previously stated, one objective of this investigation was
to determine a laboratory compaction test procedure that will produce
densities that can be achieved economically in the field with conventional
field compaction equipment and at which the soil will have satisfactory
engineering properties. The following paragraphs present field compaction
data on the Hopkinton-Everett sand (SP), West Thompson sand (SW), and
Painted Rock sandy gravel (GW) and a comparison of the densities obtained
in the laboratory with densities measured in the field on materials with
gradations similar to those of the materials used in the laboratory tests.
Hopkinton-Everett sand (SP)
53. The sand (SP) used in the WES laboratory investigation was ob-
tained from borrow area D, which was used for the construction of dike P-1
at the Hopkinton-Everett project. Construction control data for lil-e P-i
I'aurnished by the New England Division (NED) included description of the
methods of field compaction and density sampling and the results of 135
32
field density determinations, 135 Providence vibratory density tests, 97
gradation tests, and 74 one-point standard inpact determinations.*
54. Dike P-i, which contains approximately 254,000 cu yd of mate-
rial, consists of a large pervious section with an upstream inclined
impervious zone. ThL material used in the dike was excavated, hauled,
and spread with 18-cu-yd scrapers. The scrapers spread the material in
2- to 4-in. layers until a 9- to 12-in. loose lift had been attained.
Additional spreading was accomplished with graders. The material was
wetted to a saturated condition (defined as the presence of free water in
the imprints of vehicle tires) by sprinkling from two motorized watering
units that operated continuously during placement and compaction. Ap-
proximately 18 gal of water was placed for each cubic yard of fill. In
general, material for the pervious section was placed during rainy weather
when the impervious fill could not be worked. Compaction of the pervious
material was accomplished by four or six coverages of the 9- to 12-in.
lifts with a 50-ton, 4-wheel, rubber-tired roller, using 85-psi tire
pressure.
55. Field density tests were performed on material one lift below
the surface using the water balloon method. Providence vibrated density
tests were performed on ovendry material obtained from each field den-
sity sample, and the resulting density was compared with the measured in-
place density to determine percent compaction. Samples of material also
were taken from locations adjacent to the point at which field density
tests had been couducted for a one-point standard effort compaction test
to obtain data for comparison with standard effort compaction test curves
and to provide information relating percent compaction at field moisture
versus percent compaction based on the Frovidence test. The one-point
compaction tests were performed on the minus No. 4 fraction, while the
Providence test was performed on the total sample.
56. The maximum particle sizes of the 97 field density samples on
which gradation data were obtained ranged up to 1-1/2 in., and particle
* A single density determination made by applying standard impact com-paction on material at field water content.
33
size distribution varied o-rer a fairly wide range. In comparing WES
laboratory densities with field densities, only data on field samples
whose particle size distributions were comparable to those of the sand
supplied for the WES tests were used. There were only 3 of the 97
field density samples with similar gradations. The gradation of the sand
used in the WES laboratory tests is shown in fig. 1 by curve number 3, and
the gradation range for the 13 field density samples selected for compari-
son is shown by the hatched area.
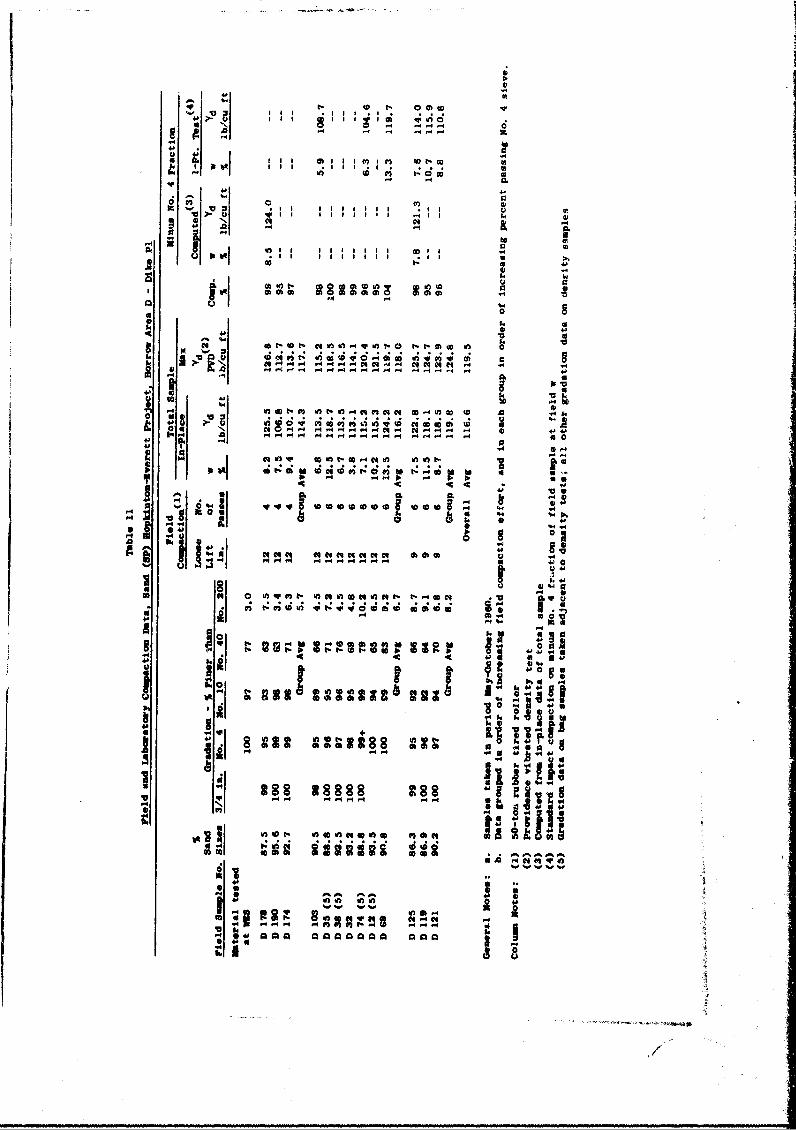
57. The data for the field samples are shown in table 11. These
data are listed in groups in order of increasing compaction effort, and
within groups in the order of increasing percent passing the No. 4 sieve.
The field densities of the 13 samples ranged from 106.8 to 125.5 pcf and
averaged 116.6 pcf. Both of the widely separated end values were deter-
mined on fill from an area that received the lowest field compaction ef-
fort (four passes over a 12-in. loose lift); the three density determina-
tions in this area averaged 114.3 pcf. The field densities for the seven
samples compacted by six passes over a 12-in. loose lift ranged from 113.1
to 124.2 pcf and averaged 116.2 pcf; the densities of six of the samples
were within +2.3 and -2.4 pcf of this average. The field densities of
the three samples at the highest field compaction effort of six passes
over a 9-in. loose lift ranged from 118.1 to 122.8 pcf and averaged 119.8
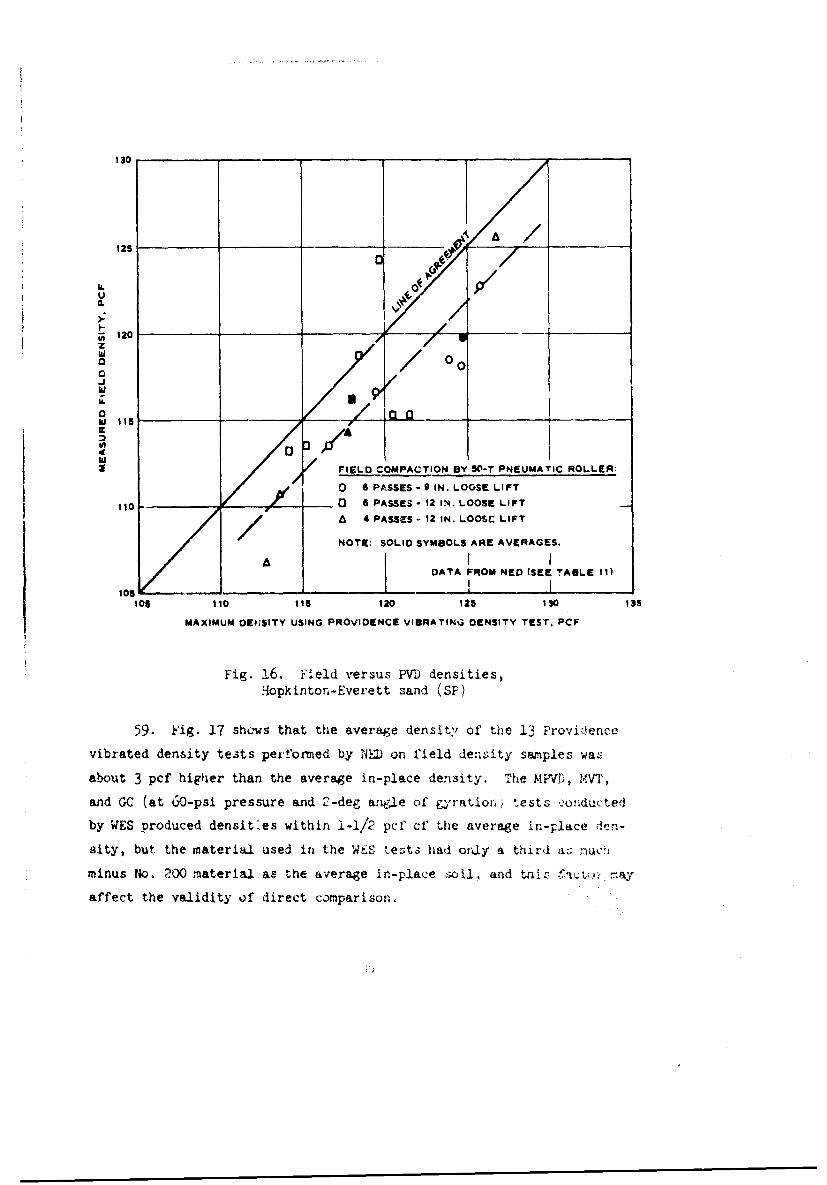
pcf, with a maximum difference of about 5 pcf. Fig. 16 is a plot of field
densities versus densities determined by Providence vibrated density tests
conducted on the sample material by NED. The plot shows that the field
densities averaged about 3 pcf less than those of the Providence tests.
58. In an attempt to find reasons other than variations in compac-
tion efforts for the wide variations in field densities, comparisons were
made of dry density versus water content, percent of minus No. 200 mate-
rial, uniformity coefficient, percent sand sizes (No. 4 to No. 200), and
grain size for various percentage fractions. No relation appeared to
exist between density and any of these parameters, with one possible ex-
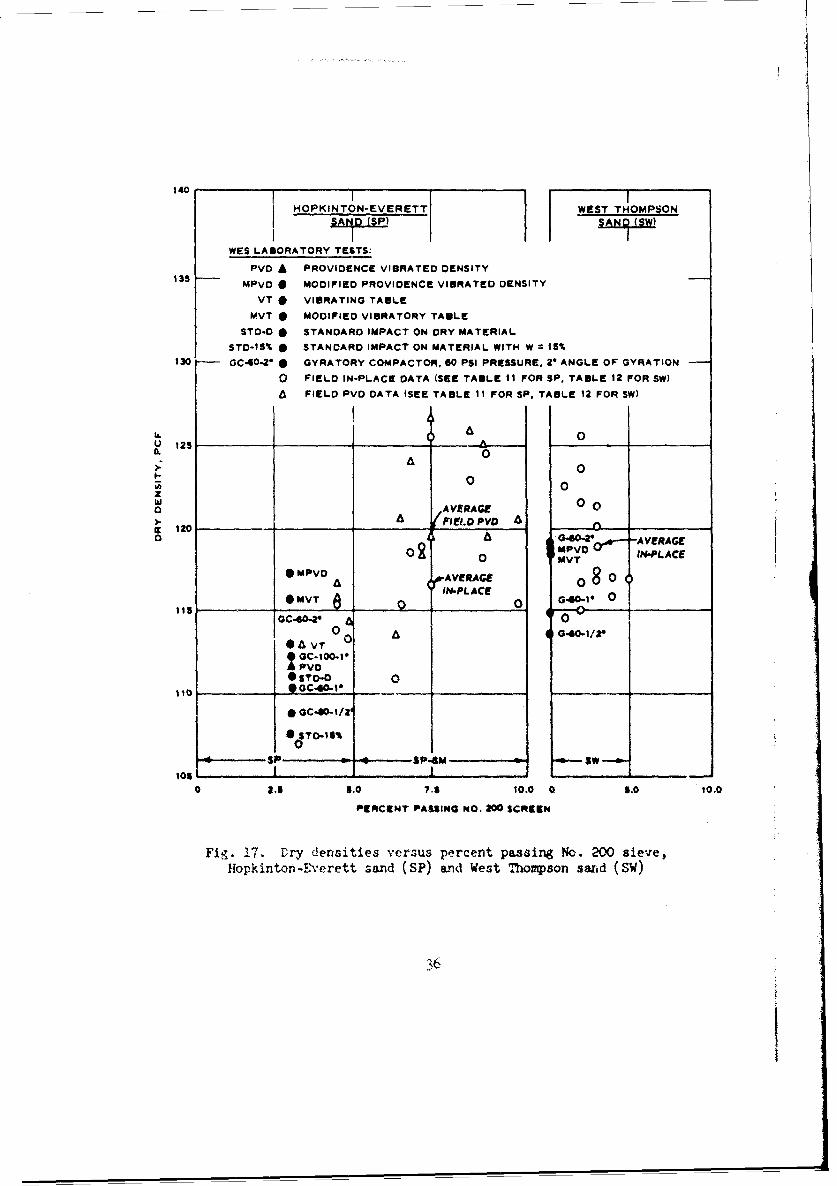
ception as indicated in fig. 17 where there appears to be some tendency
for density to decrease with increase in percent passiag the No. 200
s icve.
34
130
a a
S120z
a / 0
/ FIELD_ COMPACTION e._ 8O-T PNE.UMATIC ROLL.L'
O4 6 PASSES -P9IN. LOOSE LIFT1 _0 ______ " 6 PASSES -12 IN.LOOSE LIFT _1/0,, • PASSS , ,NI L~ LIFT
a/
NOTE: SOLID SYMBOLS ARE AVERAGES.
10904AI
0OT RO PASSE -9E IN. LOOEIF
,oI I ... I105 !10 115 120 12S 150 135
MAXIMUM OENISITY USING PROVIDENCE VIBRATING DENSITY TEST. PCF
Fig. 16. Field versus PVD densities,.opkinton-Everett sand (SP)
59. Fig. 17 shews that the average densit , of the 13 Frovidencc
vibrated density tests perfonned by NM on field density samples was
about 3 pcf higher than the average In-place density. The MFVD, MVT,
and GC (at 60-psi pressure and 2-deg angle of a.yrationi. tests _,onducted
by WES produced densit.es within 1-1/2 pcf cf the average in-place iten-
sity, but the material used in the WtS testi had only a third a; nuci
minus No. 200 material as the average in-place soi, and this $ict; may
affect the validity of direct comparison.
140
HOPKINTON-EVERETT WEST THOMPON21AR.125) .AND (SW)
WES LABORATORY TESTS:
PVD A PROVIDENCE VIBRATED DENSITYMPVD 0 MODIFIED PROVIDENCE VIBRATED DENSITY
VT 0 VIBRATING TABLE
MVT 0 MODIFIED VIBRATORY TABLE
STDO 0 STANDARD IMPACT ON DRY MATERIAL
STD-15% 0 STANDARD IMPACT ON MATERIAL WITH W = 15%
130 GC40-2* 0 GYRATORY COMPACTOR, 60 PSI PRESSURE, 2* ANGLE OF GYRATION
0 FIELD IN-PLACE DATA (SEE TABLE 11 FOR SP. TABLE 12 FOR SW)
A FIELD PVD DATA (SEE TABLE 11 FOR SP, TABLE 12 FOR SW)
U 125 -- 4--- 0A 0
I 0
z
___ A AVERAG>. A FIE1. D P VD
S1200 A 04-2 -AVERAGE
02 0 MPVo ,- IN-PLACEMVT• MPVD AVERAGE o 8 0
0 II4.0 N-PLACE
t0s 0 140- 0
0 *VT 0
I GC-1OG-'*Pvo
0 STO-O 0
1o _ OC -- __ ____
0-8I a - SP - 1-----SP4N SWIo s . I .... I . .
0 2.8 6.0 7.8 10.0 0 1.0 10.0
P9RCENT PASSING NO. 200 SCRIEN
Fig. 17. Dry densities versus percent passing No. 200 sieve,flopkinton-Everett sand (SP) and West Thompson saxid (SW)
36 :.I
West Thompson Dam sand (SW)
60. The sand (SW) used in the WES laboratory investigation was ob-
tained from borrow area C, a terrace deposit, which was compacted in the
pervious zone downstream of the impervious zone. Field compaction control
data furnished by NED contained results of 14 field density tests on sand
having gradations similar to those of the sand used in the WES laboratory
tests; data on these 14 field density tests were compared with data from
the WES laboratory tests on the sand (SW) and are summarized in table 12.
The range in gradation of the 14 field density samples is compared in
fig. 1 with the gradation of the sand used ii the WES laboratory tests.
61. The sand used in the pervious -one was excavated, hauled, and
spread in approximately 4-in. layers by 16-cu-yd scrapers until an 8 -in.
loose lift was attained. Additional spreading of the material as neces-
sary was accomplished using a grader. Moisture control was not required,
and compaction was accomplished by three coverages of a 50-ton pneumatic
roller with tire pressures of 95 psi towed by a D-8 crawler tractor at
speeds of 3 to 4 mph. Field densities were determined using the water
balloon method on material below a depth of 6 in. beneath the compacted
soil surface. The volume of the density hole was generally in excess of
1/10 cu ft. Gradations and water contents were determined for the total
density samples. Providence vibrated density tests were generally per-
formed on the material from each field density test to determine the per-
cent compaction. When the gradation of the field density sample was the
same as that of a sample on which a Providence density test had previously
been performed, the percent compaction was estimated using the density
value from the previous test.
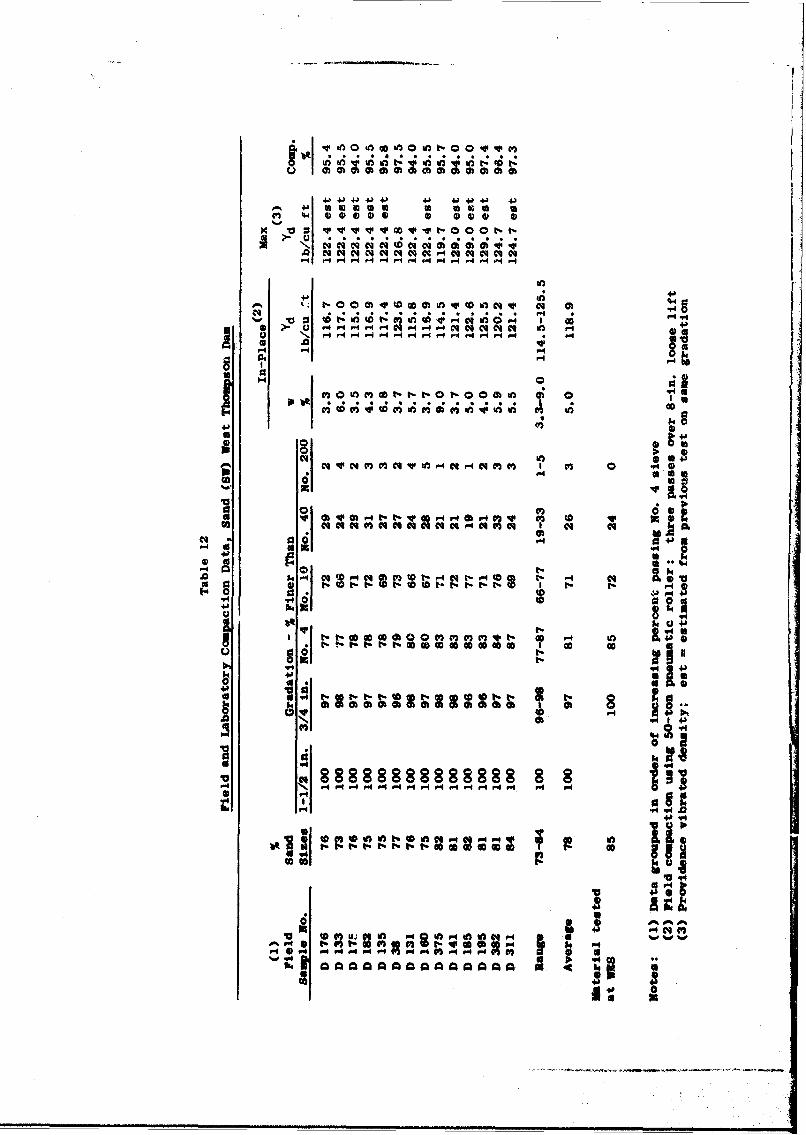
62. The data from the field density samples, shown in table 12, are
listed in order of increasing percent passing the No. 4 sieve. The field
densities of the 14 samples ranged from 114.5 to 125.5 pcf and averaged
118.9 pcf. The maximum particle size was 1-1/2 in., and the percent of
minus 3/4-in. material ranged from 96 to 98. The percent of mdnus No. 4
material ranged fiom 77 to 87, and the pcrc,.nt of minus No. 200 material
ranged from 1 to 5. The reason for the wia range in field densities is
not kuown, although a number of factort , such as nonuniform coverage by
1'7
equipment and variations in material gradation and moisture content,
could have contributed to the density variations.
63. Fig. 17 shows that the densities rroduced by the MPVD, MVT,
and GC (at 60-psi vertical pressure and 2-deg angle of gyation) tests
at WES differed within a range of only 0.7 pcf. The average density of
these three tests (118.6 pcf) was only 0.3 pcf less than the average in-
place density of the 14 representative field test densities.
Sandy gravel (GW),Painted Rock Dam, Arizona
64. The sandy gravel used in the WES laboratory tests was obtained
from the pervious borrow area that was 'he source of material for con-
struction of the zone IV pervious sections of Painved Rock Dam. Informa-
tion furnished by the Los Angeles District on material similar in grada-
tion to that usc4 in the WES laboratory tests included the results of
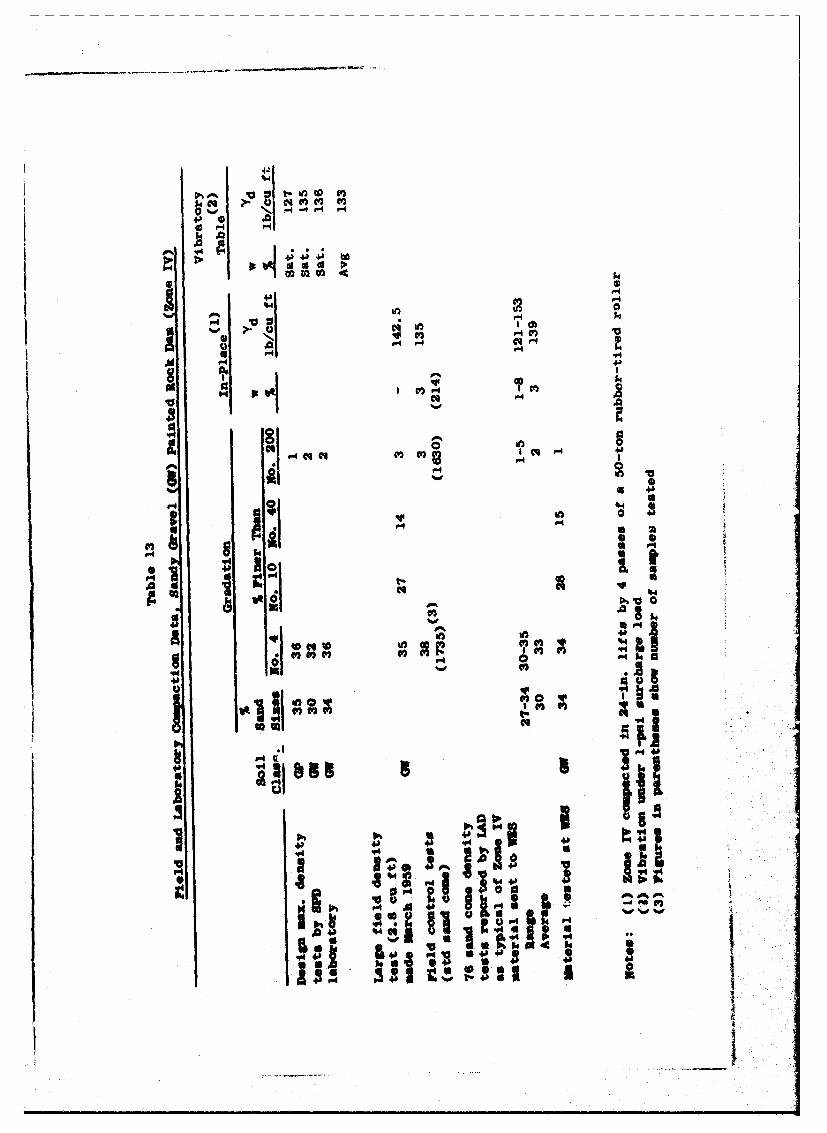
three VT tests, one large-scale field density determination, and data onroutine field density control tests. These data are summarized in
table 13.
65. Painted Rock Dam contains approximately 7,000,000 cu yd of pri-
marily pervious material with impervious material in a central core sec-
tion. During constr-Lction, pervious material similar to the sandy gravel
used in the WES tests was prewetted in the borrow area, excavated, and
placed in zon. 1V of the embankment in 24 -in. layers. Compaction was ob-
tained with four passes of a 50-ton rubber-tired roller.
66. As part of the design of Painted Rock Dam, maximum density
tests were performed ih the. South Pacific Division (SPD) Laboratory on
samples -f the pervious material. The maximum density was determined by
vibrating a completely saturated specimen in a cylindrical mold under a
surcher;e pre ..surc of approximately 1 psi, using vibration apparatus
sjhilar t. that used in the WES laboratory tests. Maximum densities of
127, 135, and 136 pcf were obtained in ihese tests on samples of zone IV
sandy gravel having gradatilons similar to those of the sandy iravel tested
in the WES laboratory.
67. In the largc-scale field density test in zone IV, 401.5 lb
(dry weight) of material was removed from an excavated hole. The volume
38
of the excavation was measured using calibrated sand in a manner similar
to the conventional sand cone density method. The dry density of the total
sample was 142.5 pcf. The total sample contained U lb (approximately 3
percent) of plus 3-in. material and 122 lb (approximately 30 percent) of
plus i-in. material. Densities of 142.5 and 134.4 pcf were computed forthe minus 3-in. fraction and the minus 1-in. fraction, respectively, as-
suming a specific gravity of 2.65 for the oversize material.
68. Routine field density tests were conducted using the sar cone
density method. The dry weight of each field density sample avtraged
about 16 lb. The water content and percent material retained on the
No. 4 sieve and passing the No. 200 sieve were determined for each field
density sample.
69. Fig. 18 compares the densities and gradations of 76 field com-
paction L atrol tests on fill material similar to the WES-tested material
with the densities obtained by the Los Angeles District in vibratory table
tests and with densities and material gradation of the WES tests.
70. The WES VT and MPVD tests produced densities within 1.2 pcf of
the 50-percent field density value (139 pcf) for the 76 samples. However,
the three SPD vibratory table tests gave densities from 3 to 12 pcf lower.
The WES STD test using a 10-lb rammer and GC tests using 100-psi pressure
and 2-deg gyratory angle produced densities about 3.5 pcf higher than the
average density of the 76 samples.
39
i60
CURVES ARE BASED ON LAD DATA ON 76 FIELD DENSITYTESTS ON MATERIAL SIMILAR TO THAT TESTED BY WES.
02D ( VIBRATORY TABLE TESTS BY LADLARGE FIELD DENSITY TEST BY LAD
155 ~ WES LABORATORY TESTS:
VT = VIBRATORY TAULEMVT =MODIFIED VIBRA TORY TAB3LEPVD = PROVIDENCE VIBRATORY DENSITY
MPVO MODIFIED PROVIDENCE VIBRATORY DENSITY
150 - GC-100-20 = GYRATORY. 100 PSI, 20 GYRATION ANGLE 3us
STD-10 LB Z STANDARD IMPACT - 10 LB RAMMER
140 3
UU
L(
0
0 -02 06 0135EN WIT VAUE LESWA HW
Fig. ~ ~ ~ ~ ~ ~ ~ ~ ~ ~ t >8 aao 'eddniyadlbrtr esttests Pane c anygavl(W
1~.8
PART IV: CONCLUSIONS AND RECOMENDATIONS
71. A valid comparison of laboratory versus field density data
could not be made because a statistically significant number of paired
observations was not available at the time this study was made. Much
field compaction data on pervious fills have been accumulated since that
time. The results of these field density tests should be compared sta-
tistically with the results of companion laboratory control density tests
for the pervious fills being placed in Corps of Engineers projects.
72. The wide range of density values in replicate tests on the
sandy gravel (GW) with 2-1/2-in. maximum size indicates the difficulty
of placing well-graded material with large particle sizes into test molds
in a consistent manner.
73. The flexibility of the gyratory compactor in reproducing desired
density values within close limits offers certain advantages. There is no
question but that the gyratory compactor can be made to produce any de-
sired density up to and above those attained by the other compaction
methods. A definite need exists for further study to develop an optimum
procedure for the gyratory compactor to produce densities matching desired
field densities for various granular materials. Emphasis should be placed
on a procedure utilizing a higher gyratory angle (say 2-1/2 deg), a realis-
tic pressure (say 100 psi), and a minimum number of revolutions, with
degradation effects no greater than those found in the field.
74. Of the test methods investigated in this study, the highest
densities were obtained with the MPVD method. The next highest den-
sities were obtained with the MVT method, which produced densities that
averaged 1 to 2 pcf less than those of the MPVD method. Since the re-
producibility of results using either method is. quite good, their use
for field control testing is justified.*
* Since this s'urvey, the vibratory table method (or when its use is notfeasible, the modified Providence vibrated density method) has been spe-cified for determining the maximm density of cohesiorless materials(see Headquarters, Department of the Army, op cit., p 6).
41
j - q
4-) j t': cqq, 0
'0 1 0
-~ ~ cq
'.4 wtr V4V v4q
-0
V44
0 0
0400 %0 4
43
CO4
4 0 3
S q.4
60) 4)
ri~ 14~ %4
Cq OD 41 0 0, . -4 -
(A .0.J3 13 1P4 .4 q 0 V4
4 P-4 Pto 1i0 ~ Qi~ 44 x ~ 1 m
i ~ ~~ 000cqCc; 0) ' 4
00
r4~
64 m 4 r
0CH-H u q go m :04c 9 mw t .
+1 v v; t4 i t4 P; c u; o"4
P-4 0 1 1 r 1 1 " a8 "
Be o14 4 0 0i It
v r- I-.4~" ccc to I t- to~-c m t- 46
4. %1 A4 --"" 444 a i.4 U;464 (4r 4 4-"44
m cc 00000o 0o 000 00
"4~~~~I. cc'cl~ cc
e* *4*
4
0-
U4.)
"w4
.54f w4 4.5--)
84 44 000 " ~ 4"4a
coo 0 0
P4 P4 r%% %4 P -I 4 P4 P4 P 4 M..g P4 P-1 m 4 .4 mr4-
4d m
) -- P4--
u4 .41N- 7 0 0
> (D 4.1:00 4)
V u41-4J4-4
0
M) 0- 0!0 t O 0m4II e t- 0cq Lm 4) 4> I- -4- 4 '-'- 4 -4, 0
4-0. 90
.4 04) 4- ) 4 . 4
(D~~0 0 0o -.44)
4m -4 U 4G)l 00
4J0 . .. 2. .
0 X 44)4)V4 4.1 0.40 4-40rt) V 4)0 t:
0) .4 1
4 0 4 - q tO - uN) -4 .0 -I4 . . 4 ... ~ .4)
. 40 0 4.0 4 0) 24 .
v to4) 4) 1'C' C:C'04 0 ,1
4) 1 0 .j4)84. C!4 4 8
es 0 2 0 4eq ~ ~ (0o o4
1- -4 24 0. 04J)
1' Q o 44 4 4 00~ ~~~~ 4)')*4- 4 . 0 0
'.4 0 -m ) 0
C.) ~~~~~ ~ ~ .0 0~'2 0 . 2 . . 0 -4-.fl~~~~~4- N . 4 0 0 0 Io ~ ~ 44)
0~~~4 6 m~~- 0 4 4 4
In 'A0 '41211 44rM k ~ 3 0 ~ ' OU 0
011 93 04 .44.4 2. 0 .~ l- *Cl, 0.
C4 4 J
p.4 r4 .. .
m b0t k o0 b )b -. a4
00o0 Vg Vwt -mI
-H$4J
0 m> >1
0l 1. V
41 m U
-, 4.' 0:14I0MM I VI q. q t Dt 0 V0 4.' r- 4- 880 0 co 00'
to 02 0 to
4 goe 4Jita)
V4 ~ ~~~ ~ ~ ~ tn0L 0vv vvV> H:
0) 0
4$4tz tz 0
144
4JP24-q4I
I; 44
03- 0) i 0
.~4I
cc ct C!O
m .4-4
0 04-4
U) r4
) N C4 '4 '4
ONcc U.) 9 &4 N 0 - -4 904 0i .4 m
-44 4.
0 4
0ot00
4.)1
4-N 'a
4.)1
> 4.) bo
U 0 -4 4Jf 0 0 -- 0
.0
CJ 0 4 4.- - 4)4p v4 1.4 N5.0 41 J I. iU
C .~- $4 -4
0. - 4i as>)
UUVCO ~ ~ ~ ~ ~ D to~0 UC)0.i ca~ 02~,OtJ -4 W 44
4.0 FAr4-
14 44J4 44-
> 01 G O
O IfO
V! C'. C l C ! C41 .0 40 .' 4-,
4J 03 M in OD N( (0 TD 0'moe (O cO0O (1) -CO W V
0 09 K1 -4-0 no no On 0 000 0 0 0 4c -C 0
> A0M
A. .1 *1 I10 0 c0.05C;8 C;C
000 000 0000 G00 0. 00 0
a 4 0 0000 00aco0 0 0 0 ccDC;;(6O
km W) m do t- w N 44 N 04 41
040
a ~ ~ ~ ~ ~ ' ~ 20 0 00 00ceC'4 000 3. .- G41
Id - I I
-I '.
0U0 v. > lm4
(9 O ~ P.. OU K'3~.'mc~ 3. 3 i
6~~~t.; 06.~- .' O
VD v~~ ~ . 1 S
to *,. o.
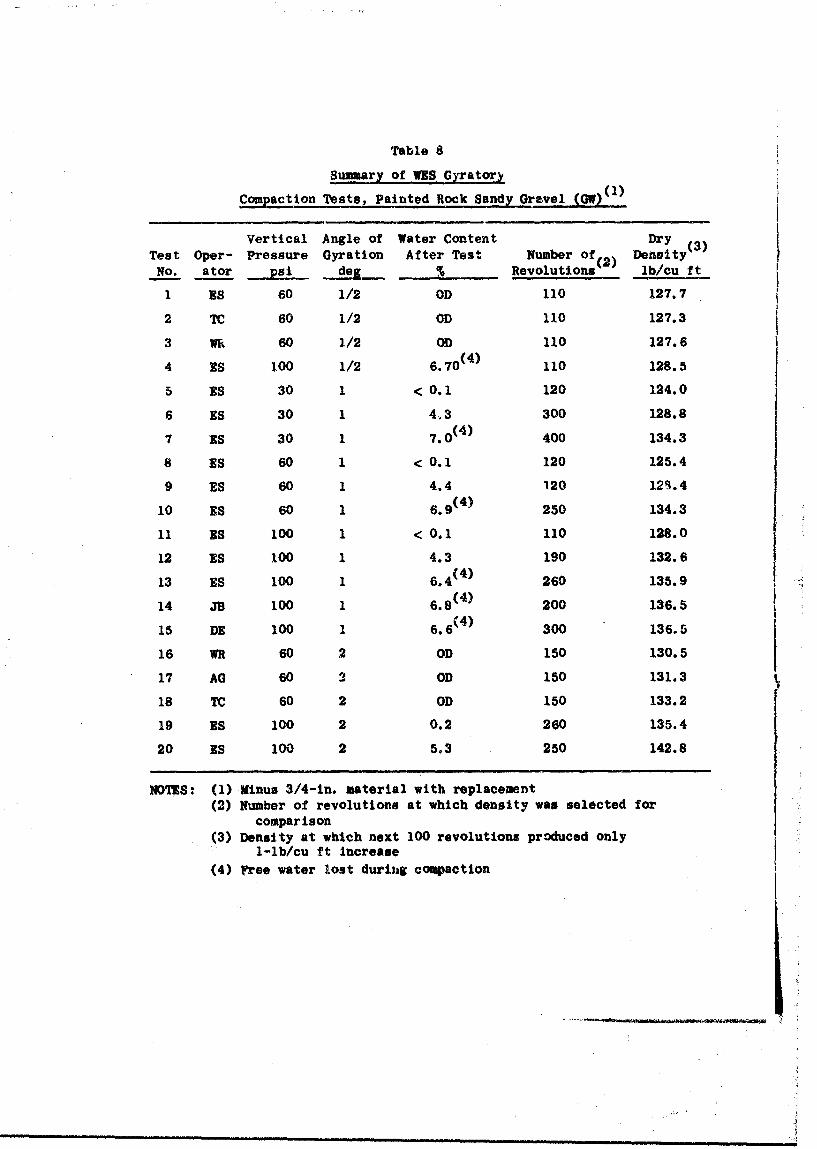
Table 8
Summary of WES Gyratory
Compaction Tests, Painted Rock Sandy Gravel (GW))
Vertical Angle of Water Content Dry (3)
Test Oper- Pressure Gyration After Test Number of(2) Density "3
No. ator psi deg % Revolutions lb/cu ft
1 ES 60 1/2 OD 110 127.7
2 TC 60 1/2 OD 110 127.3
3 Wk 60 1/2 OD 110 127.6
4 ES 100 1/2 6.70(4 ) 110 128.5
5 ES 30 1 < 0.1 120 124.0
6 ES 30 1 4-.3 300 128.8
7 ES 30 1 7.0(4 ) 400 134.3
8 ES 60 1 < 0.1 120 125.4
9 ES 60 1 4.4 120 129.4
10 ES 60 1 6.9(4 )- 250 134.3
11 ES 100 1 < 0.1 110 128.0
12 ES 100 1 4.3 190 132.6
13 Es 100 1 6.4 260 135.9
14 JB 100 1 6.8(4) 200 136.5
15 DE 100 1 6.6(4) 300 136.5
16 WR 60 2 OD 150 130.5
17 AG 60 2 OD 150 131.3
18 TC 60 2 OD 150 133.2
19 ES 100 2 0.2 260 135.4
20 ES 100 2 5.3 250 142.8
NOTES: (1) Minus 3/4-in. material with replacement(2) Number of revolutions at which density was selected for
comparison
(3) Density at which next 100 revolutions produced only1-lb/cu ft Increase
(4) Free water lost during compaction
i
V.
0o 0 sfl t.k 04 0
.4
t. ~ ~ ~ ~ 0 00 .0 00oircqO~~'
- ~ ~ ~ ~ ~ ~ ~ 0 04 M- v4r'4 .444. 444-
) kAd44
$V4
M 4-
m 0
44 .1.* .
S 0 0 00 ~00 1' 1
4* . 4.0 0 0)0 1.00
o~ 49 404 24
a -4 94C P'.4 0% i-'. .4
t b
*. of0~
v44
$40 0 4
%4 4,, a).V.4V to 4 M 4Me f4Me
2271la Mail r-I 8.1.37
a-' Lu% a. an 't.tOt l. V b
'1.Y .0,I-1 Mn In !l.-2 l7j-7
1. i8- M 4233 Is 10 94p 1-1/2 1:4 123 180 in 12 13 16 -- a 10 10,
~ 1,i,. ,- 1-1-3 $.7 0-T W23 le 18 8t"lo 32.8 4"601 1460) - 11 133 186 6-13 11 9p. top
z aY .)ft., Z3.1 Wn :l/21W 31-4S 15-1- 517 N81 & 8M 1Wi.~. 1h- )he 18 1 133 18h 18 9K. 95.
.5..On ivrD* 1 i,n)7-43 17.10 1-2 P1-31?T 6 1; I "-1/n 1:2.8 136 146 P- 133 138 24h 2 94 97(=n.7*Ia 7o11, ma) in.
I sam, -! . D '37 In.. 46. 1 -12 ' 5o-3339 8 17 FWD 2-I/I w,.8 181 IIA p. 181 143 5-6 2 99 100)&.rr n o.1t.xO I.,B73flrng.1 311 Ii.. 03 .. L 50-T R" 8 15 227 2-1/2 112.8 128 6- 1 126 .-- 1 1 9--(,-.- ow 1) Inl.
g-; (hi ".:t"l 721 .' 1 ) 14 3 70-?~ M 28 . ".b.nl0. 3 I. - 127 1,6 -. 1 12 1 104 112
8 1117 "-I AM1 1:1/7 t, 415p 29-87 N1-34 If A d" - 7 Md.u -. - 135 182 8-/ 121 138 6-i0 2 OF. 39"l.., . -- 1,/2 In.
9 ans swi 3A8 1/87 .0-70 1-17 3.-1o0. 8-R" 4 A8 id E t )A 1.. 1:,.3 IRS 130 -- -- 11 139 -- 18 91 101-, (574n12nin 0b in.
10 -1 V.n~ .1 . ., WD - n- -- 7-8 F"3- Or 2-6 II) "ad Del ft. 8 A-m .- U9 12 -- U 1 110 98-3 ( L1-4i 'ak ft.,lint fil1)
11 1-111 If0 3 o 01y2 1-1/2 to -a-93 IS- 1-Il 50- R21 8 2-18 "d. 1rwvb, 3 1.. 1:1.3 11 II 17 9.2 4 99 13 3-11 10 Ok 108Q7t, 31 2ond .a 3 1n. (k- a 6-1n. 1 :2
12 -. %1ad 311 -3-1.1'' 7,5..n I-43 2-9 50-tT PT 8 28 1l-L..-di 1., 1:6 133 k- 1 109 to7 1-8 80 &2 III
/LO-Il. &n
.3 *-.lln1ywbw W'D - 59-9 12- t? 3-8 10-?T s 6 8 3,d4 o BMW 8A1. 1:8 126 1AD .- 18 110 136 .. 18 ak. 98.
18 a-11, a'ti ORD3/h in. 8 8 be I 21 -F M MtA 3A in. 1-7.3 dkati..19 ? .. 21 .. 9 .. 98
11 !-11,y~ W3D I In. *-77?3-4. 1-9 D.87 M 8 9 WO I in. 1:1 126 1ke -- 6 11134 -10 4 90. 94.
10, aw.,.112..1. aM It 54-a3 ?-59 1-3 C-T1 4 12 321 ;-Ile 1:2.8 126 183 -- 8 12 143 3-18 8 95. 10o-A32lnII. a113 C33) I In. I..
V1I' wa.iina M11 1. , 23 5 77419 4 15 FWD 2-I/2 1:2-8 182 - - 1 182 -. 86 1 108 -(I..r_7,U. Ma) In,.1
37 37aI.., in7.. M".84 2 IS 13 W 2-1/P 1:2.8 Ms5 I Ito 1 .0 -3 1 q6 -
19 Silty gro.Lly ti I W2 b3-3 77-10, nt, 1-42 50427 M 8 12 Mt4704 3A81W. 175.3 128 3k9 10-1 .- Ue I- w-1 ; 95 96WI17 "'2 1 Ii.13. A.M. OW)
(nt. Cl m) (6-I.. .. 1i)
?1 0iol12 .1112 tu44 il 3A8 W 63-9. 26-5 1.1-82 WIT- M2 h 12 Mi Dom 3A8 &.- 1:7.3 126 1,0 10 .- 12 L-6*- - 97 7
(Own A.U.1. ZMa27 la.Ilyity3. 3m 1OW I 8to 50-V' 14-34 195 6 LP ltd Dhm 1-1/e 1. 127 13h .. 5 121 138 7-12 in2 95 103
(m, 213.3 a-) -. A, In. (6-i.. p.14) Id.2732,i 237 32 W f.80o 10M 108 0 Flowld -7 C 2 38 A U. et 3tf.80o 19 u- 1 1 968 - -108 110U
21 ad~4.111 il 21 18 996~7 ali1 id b.t 32. 10 105 118 10-18 3 103 111 - 9 1UD
" god (Mt'2 . Wt 1-1/ n. f-I19-13 1-7 501 M 3 3 No 1-1/0 1:.. 120 129 -- US1 126 !-q 18 9ik 99
ftm7 71,m13 (121.. no1 lb.8 k- c- 0 aid - l wt 32.8 1U2 *. 12 1 106 1W - - 97 108
M7ad4, -1. J2".. MD13In.8 - u C? a2 PA mo N..~l a 1W2 13 1p 2 107 10- 95 0511
M27 m f2.t. (p M. M 1813.8 -- k- C8 2a a" Dow 32.8 101 W2 12-13 2 97 131- 5M 99
,9 nI1 1/) In 14 W3) 06U3949,1
30 Mesa 41D In. 493-L D -S-67 P-5 C? 4 12 1" 11.. 1,7 117 120 - 2 11A8 1183.9 a 97w 91332att.1 40111 A) I 18.'1 sm. in /1. - - 8291 P29 (1000. i 3/8.1,9.3 US9 138A - 71 1218 -85 5 8
.%M9. by
.v bo i.(aowi14a. NO 11b.8 it 7h-10D 14-9k 2.04 ?8. "RP 8.6 9.19 WI 1-1/ 1-8.T ICU 139 . 135 10b 138 b-17 135 91. 10k.
33 11132 -34 (h..Iy Net AD. 4 ad-*2- 22-33 M1-318.09 2-6 6-16 3W iuhi 32. 8 MOW-e 112 17 *. too Is 196 9bat mU4 a may WD311190)0
3 1t1d.32 E . -18 38.33 ff141-0 94 6-16 ami Imp% at.8 19 115 us to 10 110 18 9 91 1031
3 1 . 134 AN .. 1 (DW MAW 2 W.-.. 13-97 20-87 M29& 30.T MI b id Doc 32. 8 121 &30 7-1 8 1312 . - 94IR38 Silly and 4 13.8 10838s 26 N..113 4 8 m IMPM. 1b.4 10 If 16 1 1 I4 q-. 103 -
1, Sit m A.W3 MR NO. 10 94-10 67-94 6-03 Of 8 9 NO 32.8 1 l 3t IV . 6 10)1 M* 5-19 6 93. 37170.1.. 811314. ma) t. 3b. h
12J-b. ~;pi3. 3. .14 dilwdin -i. W911. 994ft ftf b , I It.1 mi. vows. 8 18.1OM 193284.39. nlb83441.137 (Pre), r i.ftI t-1 LIN 31 nt itts 13 OF th1332314413 t W~l3i 832st ft. 13 o~r t. aer1 c.313 m13.
35 7.W.W r-. "Ak"%10,i I.49. I. s0o" f1114 NEMO.
v U'
I~I~blt' 0to-0 Chm( 0(
2 70
00
44 0
M~~ ~ ~ M 4a 4M C I9 41
41
4.1
1060'~.4S~ ~ v~a
M 44 .4
31 10,01 V0C4C24 ~ W~ 4
0 4
Ch 0 im v4
41
%4i- I8 - 2
4 14 4 4 .4 4.1 1 *.4
'Al
.4Pmlq man a an a a.m
4-b +j 4141 4 .) 4J4 J 4 +0 aos 0 a6
M2 0 600:0 0 000
4J
c ;
C~ q 14VMI
j~ 0n C4U~In-0
00
V) H V; ; )v ;V4J h.4
0 02
I 60
N ~ ~ CC.CC V0 C14 i 4v o11clmcj M I M
v4)v(A0.1-t -
.441
o% 006. c o0 0
.451
I 4
4.1 Wf~ 0too P-42 N
oi C4 M10 to P" kt P410 b
.0 4.0 -
j ; 4;4 b
0 0
I 0
0 m-44CF
-4 0l M4
la -1
U V3.994
r4.
eq -4
460
44A
1 4 a"4 V0f
I I *a44'a t, Iq
"41 41
41S w