Embed Size (px)
Citation preview

Nat�Lab� Technical Note ������
Date of issue� ����
Powder formation in silane
plasma�s�
W�H�M� Lodders
Company Con�dential �������c�Philips Electronics ����
������ Company Con�dential �����
Authors� address data� W�H�M� Lodders WB�� lodders�natlab�research�philips�com
c�Philips Electronics N�V� ����
All rights are reserved� Reproduction in whole or in part isprohibited without the written consent of the copyright owner�
ii c�Philips Electronics NV ����

Company Con�dential ����� ������
Technical Note� �� ���
Title� Powder formation in silane plasma�s�
Author�s�� W�H�M� Lodders
Part of project� Philips Solid State Course
Customer� Company con�dential
Keywords� Plasma Enhanced Chemical Vapour Deposition silane plasmaamorphous silicon powder formation �� transition
Abstract� This literature survey is performed as a part of the Philips Solidstate course� It deals with powder formation in silane containing plasma�s� In recent studies substantial progress has beenmade� A detailed powder formation mechanism has evolvedwhich also accounts for the occurence of a so called �� transition� Based on the understanding of the particle formationmechanism and the dynamics of particles in a gas�ow� e�ectivemeans to minimise powder formation e�ects have been developed�
Conclusions� The formation of powder in a silane plasma takes place in threesteps� In the �rst step particles of � nm diameter are formed byclustergrowth via ionmolecular interactions like SiH�
� � SiH�
� Si�H�� � H�� Si�H�
� � SiH� � Si�H�� � H� etc� In the next
step the particles of � nm coagulate to a diameter of � nm andin the last step the particles grow to �� nm� Powder formation induces a plasma transition from collisional �wave riding�at the sheath boudaries ��regime� to �Joule heating� in theplasma bulk �referred to here as the �regime�� This transitionis associated with powder accumulation in the plasma enhancing by a factor of � �� the electron atachment rate� Powderformation is e�ectively suppressed in modulated plasma�s athigher gas temperature�
c�Philips Electronics NV ���� iii

������ Company Con�dential �����
iv c�Philips Electronics NV ����
Company Con�dential ����� ������
Contents
� Introduction �
� Particle formation mechanism �
� Particle characteristics ���� The particle precursors� initial cluster growth � � � � � � � � � � � � � � ���� Particle composition and size � � � � � � � � � � � � � � � � � � � � � � � ���� Where in the plasma does the particle formation take place� � � � � � � �
� Minimisation of particle density ���� Removal of particles from the plasma by using grooves in the electrode ��� The eect of gas temperature � � � � � � � � � � � � � � � � � � � � � � � ��� The eect of reactor design � � � � � � � � � � � � � � � � � � � � � � � � � ���� The eect of plasma�modulation � � � � � � � � � � � � � � � � � � � � � � �
References �
Distribution
c�Philips Electronics NV ���� v

������ Company Con�dential �����
vi c�Philips Electronics NV ����

Company Con�dential ����� ������
� Introduction
Plasma deposition of amorphous silicon ��Si�H� is particularly suited to large areaelectronics for optical imaging devices� matrix�addressed arrays� and solar cells� toname just a few commercial applications� However� it has become clear that particu�late contamination presents a major problem by limiting manufactoring productivityand device reliability� Modern trends� toward larger circuit dimension together withsmaller feature size and higher component densities� will aggravate the risk of particlerelated yield losses� for example� a single defect on a matrix array could mean theloss of the entire display whereas a defect on a silicon wafer may damage only oneof many separate devices� Since particulates in processing plasmas are serious obsta�cles to microelectronics fabrication� great attention has been placed on clarifying theirformation kinetics and suppressing their growth� In this note the recent literature onparticle formation in silane plasma�s is reviewed� This work is performed as a part ofthe Philips Solid state course�
� Particle formation mechanism
Inspection of a Plasma Enhanced Chemical Vapour Deposition PECVD� reactor showsthat after a few depositions of amorphous silicon dust formation has taken place�
If we look closely� the cold reactorparts in the machine are covered with dust�The dust formation in the plasma can be devided into three steps� Firstly� growth ofparticles up to � nm in size takes place� then in the second step agglomeration takesplace and in the thirth step particle growth saturates�Perrin et al ��� and Fridman et al ��� have given a detailed discussion of the mechanisminvolved� Fig� �� shows typical silane plasma characteristics� In the �rst microsecondthe plasma ignites and reaches a steady state� The Rf voltage Vrf � and the Rf currentJrf reach steady values almost immediately� The plasma now operates in the so called��regime�In this regime the Vrf and the Jrf stay the same and the reactions that take place areions with molecules� In this regime the particle diameter can grow up to a few nm�There is no dust measured in the plasma because the dust particles up to a few nmare to small for the most sensitive detectionmethods�Fridman assumes that the reaction mechanism starts with SiH�
� negative�ion forma�tion by dissociative attachment� Then the negatively charged clustergrowth takes placeby ion�molecular reactions like� SiH�
� � SiH� � Si�H�� � H�� Si�H�
� � SiH� � Si�H��
� H�� see �g� ��� As the negative cluster size increases the probability of the reactionwith the vibrationaly excited molecules decreases because of the strong eect of vibra�tional temperature relaxation on the cluster surface� When the particles size reaches acritical value the chain reaction of cluster growth becomes much slower and is �nallystopped by the ion�ion recombination process� The typical time of � nm particle for�mation by this mechanism is shown to about � ms at room temperature� The nextthing we want to know is� why do these particles stay in the plasma� The trappingof negatively charged particles in any discharge is connected with the repelling forces
c�Philips Electronics NV ���� �

������ Company Con�dential �����
exerted on such particles in the electrostatic sheaths when they reach the edge of theplasma� But for the supersmall particles under consideration here� � � nm� the elec�tron attachment time is as long as ��� ms and almost two orders of magnitude longerthen the fast ion�ion recombination time� so most of the particles are neutral in thisperiod� However the trapping of neutral particles becomes clear taking into account�that for � nm particles the electron attachment time is not longer than the residencetime� and each neutral particle was charged at least once during the residence time�It�s very important to note here� that the rate coe�cient of twobody electron non�dissociative attachment increases strongly with the particle size� For this reason� theattachment time of particles much less than � nm is much longer than the recidencetime� and there is no posibilitie to get charged even once� Hence small particles arenot trapped in plasma� Only big particles� � � nm� survive� this is the size selectivetrapping eect�After this step � appears� In this step the particles of a few nm coagulate to par�ticles with a radius of �� � ��� nm� The fast coagulation phenomenon occurs whenthe growing concentration of survived monodispersed � nm particles reaches a criticalvalue about ���� � ���� cm��� For such concentrations the attachment of small negativeions like SiH�
�� to � nm particles becomes faster than the chain reaction to grow newparticles� New chains of dust formation are almost suppressed and the total particlemass and respectively the production of particle concentration and cube of their ra�dius� remains almost constant� In this fast coagulation process the mass increase by asurface deposition process is negligible� The particle density after coagulation is ��� ���� cm���The temperature doesn�t aect the critical value of ���� � ���� cm��� However� thetypical induction time before coagulation is shown to be about ��� ms for room tem�perature� and much longer for ��� K� This can be explained� taking into account theselective trapping eect discussed above� The trapped production rate for ��� K ismuch slower than for room temperature� but the critical particle concentration valueremains the same�A possible mechanism that causes coagulation is secondairy emission� which producespositive ion attachment� which results in negative ion and neutral chain reaction whichresults in neutrals � These charged particles and neutral ones start to react with ea�chother to form a larger particle coagulate �g� �� ����After the coagulation� the enhanced attachment to multiply charged particles makesthe plasma more resistive� A strong decrease of the free electron concentration and asmall increase of gastemperature takes place� Consequently the Vrf decreases and Jrfincreases see �g� ��� The point where the particles start to coagulate� and the plasmabecomes resistive is called the ��� transition�Finally saturation takes place� In the third step large particles continue to grow byradical condensation� The Vrf and the Jrf stay stable� see �g� ��� This regime is calledthe ��regime� If very large particles are formed the plasma starts to cough because aninstable plasma is created� The particles that have reached a critical value weight� are�ushed out of the plasma� The corresponding electron density �uctuations are shownin �g� �� ����If we look at the magnitude of the self�bias voltage� the DC�bias� during the whole
c�Philips Electronics NV ����

Company Con�dential ����� ������
process described above we see that its value drops upon coagulation� In the ��regime�the DC�bias slightly increases at �rst and than stays at a constant low value �g� � ���
� Particle characteristics
��� The particle precursors� initial cluster growth
Howling ��� used a mass spectrometer to study the occurrence of negative and posi�tive molecular ion groups in a power�modelated plasma� The plasma contains silanecontaining particles� Fig� �� shows the negative and positive ion�mass spectra� ob�tained with low mass resolution� Each peak represents the combined intensities ofthose polymeric silicon ion groups irrespective of their hydrogen content� Negativepolysiliconhydride ionic clusters where observed right up to �� amu mass limit of themass spectrometer� corresponding to hexadecasilicon hydride anions �Si�Hx�
�� Clearly�heavy negative ions do exist in this silane plasma and could conceivably be the poly�merisation pathway to larger clusters� and ultimately to powder particles� These nega�tive molecular ions are singly charged by incorporation of an electron into a molecularorbital� The positive ion masses in �g� �� are limited to only �� amu� correspondingto pentasiliconium ions �Si�H�� possibly because the activation energy barriers inhibitfurther cluster growth� The positive ion size might also be limited because of ion�ionrecombination losses� or because they are e�ciently evacuated from the plasma� Theweak intermediate peaks in the positive ion spectrum are due to ions of type �SiHO��where the oxygen comes from residual water outgassing from the reactor walls� Therelative ion currents� measured for negative and positive ions and for ions formed fromneutral radicals in the mass spectrometer ionizer by �� eV electrons are shown in�g ��� The density of negative relative to positive ions is di�cult to quantify becauseof the dierent plasma conditions afterglow and power�on period respectively� dur�ing extraction of each type from the plasma ���� Nevertheless� it is unlikely that anycharge�dependent correction factor would increase faster than exponentially with mass�see �g� �� ���� Therefore we can conclude from �g� �� and �� that the negative ionsattain much higher masses than the positive ions�
��� Particle composition and size
Dutta ��� analysed powder in the reactorchamber after the deposition of some layers�He found dierently coloured powders in the chamber� namely a reddish brown colouredpowder on the Rf�electrode and yellow colourred powder on the walls� He looks withIR�spectroscopy if there are dierences between dierently coloured dust particles�Fig� �a� represents the spectra of ��Si�H powders prepared by a plasma CVD processat ��� �C under the conditions for the deposition of device quality thin �lms� while�g� �b� and �c� represent the IR spectra of the reddish�brown powder and the yellowpowder� respectively� Strong bands at ���� ��� and ��� cm�� can be assigned tothe silicon�hydrogen �SiH and SiH�� wagging and bending mode vibrations� while theband between ���� � ���� cm�� arises from the silicon�hydrogen �Si�H� SiH�� and
c�Philips Electronics NV ���� �

������ Company Con�dential �����
SiH��n� stretching vibration� The Si�H� SiH�� and SiH��n stretching modes are usualyobserved in highly porous ��Si�H �lms with large void fractions� The Si�H stretchingbond is predominant in the amorphous silicon powders� For the red powders� theSiH� stretching at ���� cm��� and for the yellow powders� the SiH��n stretching at���� cm��� are relatively more dominant modes as compared to the amorphous siliconpowders� The compositional dierences between the powders are small� Exposure toatmosphere oxidizes the powders as can be noticed from the prominent silicon�oxygenabsorption band centred around ��� cm��� oxygen�hydrogen bending at ���� cm��
and the O�Si�O wagging mode vibrations at ��� cm��� In addition there is also thepresence of the Si�O� mode at ��� cm��� Due to the larger surface area of the smallerparticles yellow powder� we notice a much pronounced oxidation of these powders�We ourselves also investigated PECVD powder with IR�spectrometry� A typical IR�spectrum measured just after deposition is given in �g� ��� This spectrum does notindicate the presence of oxygen in the powder� Fig� ��� shows a spectrum obtainedafter air exposure of the powder� This clearly indicates oxidation after exposure�Shiratani et al ��� studied the time evolution of size and density of the PECVD�powderparticles using polarization�sensitive laser�light scattering PSLLS�� Fig� ��� shows thatlittle particles are always present � � nm�� After a while coagulation occurs� in�g� ��� after � sec� The particle diameter is then � ��� nm� So we have at a giventime particles of � � nm and particles of ��� nm� SEM and TEM pictures are givenin �g ������ ��� ����� The displayed morphology indicates that the powder particles of��� nm consist of little particles of � � nm�
��� Where in the plasma does the particle formation takeplace�
Watanabe et al ���� studied the distribution of dust particles in the dicharge space ina modulated plasma� Fig� ��� and �� show the spatial distribution of the powderparticles as a function of the time elapsed after the plasma initiation� Fig� ��� showsa typical spatial pro�le of particulate size and density obtained� Particulates begin tobe observed around the sheat edge near the Rf electrode� particulate size and densityamount to �� � ��� nm and ��� � �� cm�� during a short time of � � � s after the Rfpower being turned on� Smaller particles in an early nucleation phase can be observedusing a Langmuir probe technique� The ratio M
��M� between negatively charged
small particles M�� and positive ions M�� can be determined� Fig� �� shows this
ratio as a function of plasma on�time� It can be seen that the ratio M��M� increases
with Ton and becomes large in the sheath edge region � � �� mm away from theRf electrode� This trend of localization becomes weak with increasing �ow rate and�at a high �ow rate over about �� sccm � the region of large M
��M� tends to shift
downstream not shown�� Thus� particulate amounts are predominantly rich aroundthe sheath edge near the electrode� especially the Rf electrode� and can be somewhatmodi�ed by the gas�ow�
� c�Philips Electronics NV ����

Company Con�dential ����� ������
� Minimisation of particle density
��� Removal of particles from the plasma by using grooves inthe electrode
Selwyn ���� investigated the places where powder is trapped in the discharge space as afunction of electrode shape� Probe measurements have shown that particle traps havea higher plasma potential then the surrounding plasma regions� possibly explaining thedrift of particles to these localized regions� Particle traps are local plasma disturbances�Accordingly� the intensity of optical emission spectroscopy EOS� will vary spatiallydue to the presence of traps� This approach may be used to map quantitatively thepresence and intensity of particle traps and to correlate these formations with featureson the tool electrode� For instance the ����� nm Ar neutral emission line is monitored�The time�dependent OES signal is converted to a map of intensity of the ����� nmneutral Ar emissionline versus horizontal and height coordinates above the electrode�This� we call an isophotal map because the counters denote lines of equal emissionintensity in this phase space� Fig� ��� and ��� show such isophotal maps for a �atand a grooved electrode respectively� Particles are subtracted to well de�nd localizedregions in the grooves and tend to collect preferentially in or above grooves� therebyreducing the density of the particles elsewhere in the discharge space� By connectingthe grooves and channeling them to the pump port� particles may be purged from theplasma�
��� The e�ect of gas temperature
The eect of the gas temperature on particle formation is demonstrated in �g� ���showing the Laser Induced Particle Explosive Evaporation LIPEE� emission intensityIb as a function of Ton� on a logarithmic time scale� for �ve dierent gas temperatures�varying from ambient temperature to �� �C� The silane and argon �ows are� respec�tively� ��� and �� sccm� We note that the appearance of initial emission intensity andalso the start of the coagulation steep increase� are delayed at higher gastemperatures�More exactly� the initial emission intensity appears quasi�instantaneously after somemilliseconds� at ambient temperature� while the appearance starts ��� ms later at ���C� sec later at ��� �C and approximately at ��s Rf discharge duration for �� �C�We also see from �g� ��� that the delay between the appearance of the �rst emissionintensity and the start of the coagulation is roughly constant� of the order of somehunderds of miliseconds� Why does the delay for coagulation increase so strongly� if weincrease the gas temperature� Boufendi ���� discussed� that the growth of supersmallparticle precursors proceeds via a chain of negative�ion molecular reactions� stimulatedby vibrational excitation� A small increase of the gas temperature accelerates vibra�tional relaxation� diminishes the level of vibrational excitation� thereby deminishes thechain reaction rate� and so it makes the process of particle growth much longer�
c�Philips Electronics NV ���� �
������ Company Con�dential �����
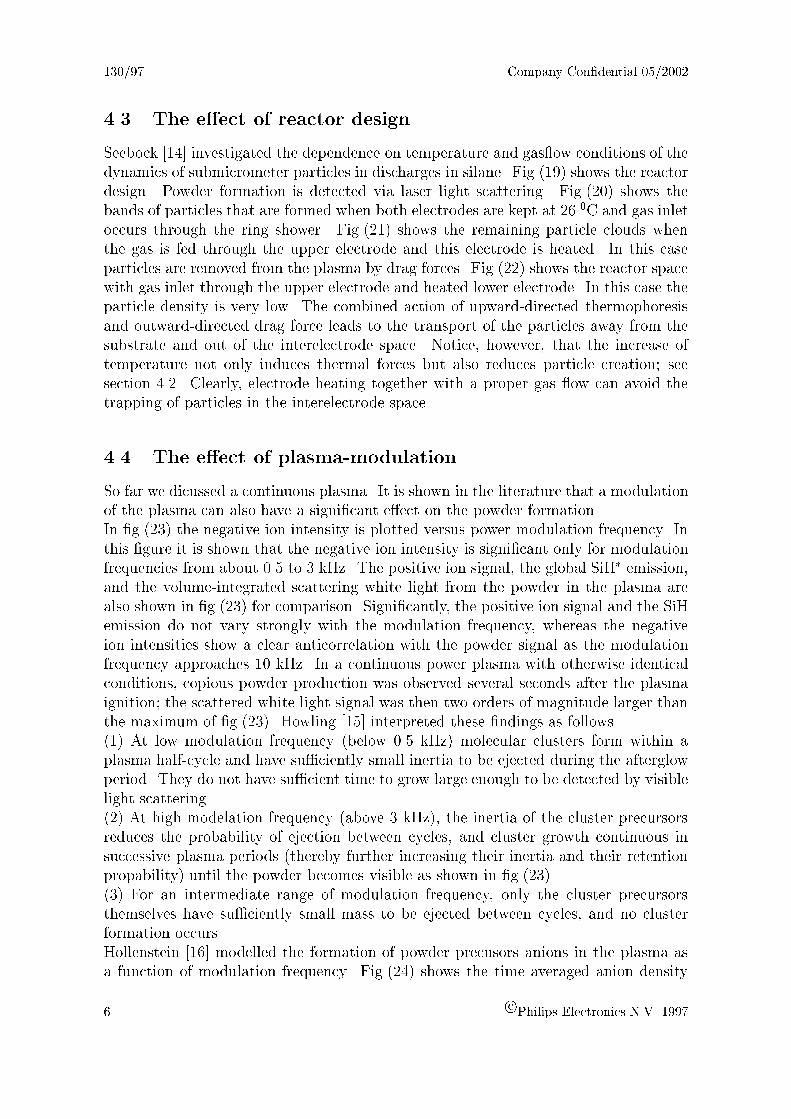
��� The e�ect of reactor design
Seebock ���� investigated the dependence on temperature and gas�ow conditions of thedynamics of submicrometer particles in discharges in silane� Fig� ��� shows the reactordesign� Powder formation is detected via laser light scattering� Fig� ��� shows thebands of particles that are formed when both electrodes are kept at �� �C and gas inletoccurs through the ring shower� Fig� ��� shows the remaining particle clouds whenthe gas is fed through the upper electrode and this electrode is heated� In this caseparticles are removed from the plasma by drag forces� Fig� ��� shows the reactor spacewith gas inlet through the upper electrode and heated lower electrode� In this case theparticle density is very low� The combined action of upward�directed thermophoresisand outward�directed drag force leads to the transport of the particles away from thesubstrate and out of the interelectrode space� Notice� however� that the increase oftemperature not only induces thermal forces but also reduces particle creation� seesection ���� Clearly� electrode heating together with a proper gas �ow can avoid thetrapping of particles in the interelectrode space�
��� The e�ect of plasmamodulation
So far we dicussed a continuous plasma� It is shown in the literature that a modulationof the plasma can also have a signi�cant eect on the powder formation�In �g� ��� the negative ion intensity is plotted versus power modulation frequency� Inthis �gure it is shown that the negative ion intensity is signi�cant only for modulationfrequencies from about �� to � kHz� The positive ion signal� the global SiH� emission�and the volume�integrated scattering white light from the powder in the plasma arealso shown in �g� ��� for comparison� Signi�cantly� the positive ion signal and the SiHemission do not vary strongly with the modulation frequency� whereas the negativeion intensities show a clear anticorrelation with the powder signal as the modulationfrequency approaches �� kHz� In a continuous power plasma with otherwise identicalconditions� copious powder production was observed several seconds after the plasmaignition� the scattered white light signal was then two orders of magnitude larger thanthe maximum of �g� ���� Howling ��� interpreted these �ndings as follows� �� At low modulation frequency below �� kHz� molecular clusters form within aplasma half�cycle and have su�ciently small inertia to be ejected during the afterglowperiod� They do not have su�cient time to grow large enough to be detected by visiblelight scattering� �� At high modelation frequency above � kHz�� the inertia of the cluster precursorsreduces the probability of ejection between cycles� and cluster growth continuous insuccessive plasma periods thereby further increasing their inertia and their retentionpropability� until the powder becomes visible as shown in �g� ���� �� For an intermediate range of modulation frequency� only the cluster precursorsthemselves have su�ciently small mass to be ejected between cycles� and no clusterformation occurs �Hollenstein ���� modelled the formation of powder precusors anions in the plasma asa function of modulation frequency� Fig� ��� shows the time averaged anion density
� c�Philips Electronics NV ����

Company Con�dential ����� ������
versus modulation frequency� Here the data obtained for ions containing up to � siliconatoms were used to derive equations for extrapolation to higher�mass negative ions� Ex�trapolation to higher�mass negative ions in �g� ��� indicates that the macro�molecularanion densities would fall to zero for a wide range of modulation frequencies below �kHz� This is because the plasma periods are then too short for the polymerization chainto propagate from monosilicon hydride anions to highly polymerized species before al�most all of the low�mass species are lost in the subsequent �o� period� Equilibriumbetween the diminished supply from preceding negative ions and the polymerizationof the polysilicon hydride anion itself results in a strongly diminished density of thehighly polymerized anions� Above � kHz� the sheaths do not fully collapse and highmass negative ions reach signi�cant densities� At very low modulation frequencies�the polymerisation in a single plasma period propagates su�ciently far to clusterscontaining perhaps �� or � silicon atoms � to initialise particle growth�Thus� plasma modulation in the frequency range ���� kHz can eectively suppresspowder formation�
c�Philips Electronics NV ���� �

������ Company Con�dential �����
References
��� J� Perrin� C� Bohm� R� Etemadi� and A� Lloret� Plasma Sources Sci� Technol��� �� ������
��� A� A� Fridman� L� Boufendi� T� Hbid� B�V� Potapkin� and A� Bouchoule� J�Appl� Phys� ��� ���� ������
��� M� Shiratani� H� Kawasaki� T� Fukuzawa�T� Yoshioka� Y� Ueda� S� Singh� andY� Watanabe� J� Appl� Phys� ��� ��� ������
��� W� W� Stoels� E� Stoels� G� M� W� Kroesen� and F� J� de Hoog� J� Appl�Phys� ��� ���� �����
�� Y� Watanabe� M� Shiratani�T� Fukuzawa� and H� Kawasaki� Plasma SourcesSci� Technol� �� � ������
��� A� A� Howling� J� L� Sansonnens J� L� Dorier� and Ch� Hollestein J� Appl�Phys� �� ���� ������
��� L� J� Overzet J� H� Beberman� and J� T� Verdeyen� J� Appl� Phys� ��� ���� ������
��� J� Dutta� W� Basca� Ch� Hollenstein� J� Appl� Phys� ��� ���� �����
��� M� Shiratani� H� Kawasaki� T� Fukuzawa� H� Tsuruoka� T� Yoshioka� and Y�Watanabe� Appl� Phys� Lett� �� ���� ������
���� L� Boufendi� and A� Bouchoule� Plasma Sources Sci� Technol� �� ��� ������
���� Y� Watanabe� and M� Shiratani� Plasma Sources Sci� Technol� �� ��� ������
���� G� S� Selwyn� Plasma Sources Sci� Technol� �� ��� ������
���� L�Boufendi� J� Hermann� A� Bouchoule� B� Debreuil� E� Stoels� W� W� Stof�fels� and M� L� de Giorgi� J� Appl� Phys� ��� ��� ������
���� R� J� Seebock� W� Bohme� W� E� Kohler� M� Romheld� and S� Veprek� PlasmaSources Sci� Technol� �� �� ������
��� A� A� Howling� J� L� Dorier and Ch� Hollestein� Appl� Phys� Lett� ��� ���� ������
���� Ch� Hollenstein� J� L� Dorier� J� Dutta� L� Sansonnens� and A� A� Howling�Plasma Sources Sci� Technol� �� ��� ������
c�Philips Electronics NV ����

Company Con�dential ����� ������
Figure �� Development of the transition towards powder formation after plasma igni�tion in a SiH� ���� MHz radiofrequency discharge at ���� mbar and ��� �C charac�terized by the evolution of SiH� at ��� nm and of the electrical properties ����
Figure �� Physical scheme of �rst generation of supersmall particle growth ����
c�Philips Electronics NV ���� �

������ Company Con�dential �����
Figure �� Coagulation model in rapid growth phase� a� Negatively charged� positivelycharged and neutral particles of nearly the same size coexist at start of rapid growth�Particulate density nd is much higher than electron density ne� b� Positively chargedsmall particulates are coagulated selectively with negatively charged larger particulates� c� Coagulation rate decreases considerably in growth saturation phase� because mostparticles are charged negatively ����
�� c�Philips Electronics NV ����

Company Con�dential ����� ������
Figure �� The time dependent He�Ne scattering signal forward scattering at � fromparticles that �ushed out of the discharge through the vertical slits in the cavity� dashedcurve� and the electron density solid curve�� The gas mixture contains � SiH� inargon� the pressure is ��� mTorr� the gas�ow is � sccm and the Rf power is ��W ����
Figure � Time evolution of laser light scattering LLS� intensity intregrated overdischarge space Vdc and powerfactor cos� as a parameter of Rf power� D������Ton��s� He�SiH� ��� ��sccm� ��Pa ���
c�Philips Electronics NV ���� ��

������ Company Con�dential �����
Figure �� Mass spectra of negative and positive molecular ion groups for a � kHz mod�ulation frequency� time averaged over ��� modulation cycles� This raw data� acquiredwith low mass resolution� is uncorrected for any mass dependent fall�o in sensitivity�The vertical broken lines at intervals of �� amu mark the masses of bare silicon clusters����
Figure �� Relative ion currents measured for negative and positive ions and for ionsformed from neutral radicals in the mass spectrometer ionizer by �� eV electrons�Modulationfrequency � kHz� The straight lines are exponential �ts to the data whichare normalized to unity for the mono�silicon groups ����
� c�Philips Electronics NV ����

Company Con�dential ����� ������
Figure �� Infrared spectra of a� typical hydrogenated amorphous silicon powder b�reddish brown powder and c� yellow powder ����
Figure �� Typical infrared spectrum of powder made in the Balzers VIS ��� PECVDreactor Nat� Lab��
c�Philips Electronics NV ���� ��

������ Company Con�dential �����
Figure ��� Typical infrared spectrum of powder particles fabricated in VIS ��� reactorafter exposure to oxigen�
Figure ��� Time evolution of size a� and density b� of particulates at mm belowupper powered electrode measured using PSLLS solid lines�� Circles and trianglesshow CMD�s and corresponding densities of particulates deduced from SEM observationin small�size and large�size groups� respectively ����
�� c�Philips Electronics NV ����

Company Con�dential ����� ������
Figure ��� SEM photograph of a particle� He�SiH� ��� ��sccm� ��Pa� ��W� Ton����s ����
Figure ��� Transmission electron micrograph of a particle formed after a plasma of ��s duration� Its diameter is about ��� nm �����
c�Philips Electronics NV ���� ��

������ Company Con�dential �����
Figure ��� Spatial distribution of particle size and density between electrodes on dis�charge column axis at t���� and � s after discharge initiation� Ton�� s� �� W� �SiH��He� �� scccm� �� Pa� �����
Figure �� Spatial distribution of M��M� for Ton��� ms a�� ��� ms b�� ��� ms c��
�� ms d� and ���� ms e�� �� W� �� � SiH��He� �� sccm� �� Pa� �����
�� c�Philips Electronics NV ����

Company Con�dential ����� ������
Figure ��� Optical emission spectroscopy isophotal map of Ar neutral emission signal ����� nm line� over a �at� uniform electrode cover �����
Figure ��� Optical emission spectroscopy isophotal map of Ar neutral emission signal ����� nm line� over a grooved electrode type ��� The dimensions of the groove are �mm deep x �� mm wide� The groove extends the entire length of the ��� mm squareelectrode �����
c�Philips Electronics NV ���� ��

������ Company Con�dential �����
Figure ��� LIPEE emission intensity as a function of Rf plasma discharge duration fordierent gas temperatures �����
Figure ��� Schematic view of the parallel�plate plasma reactor used for the investiga�tions� The gas inlet was either through the ring shower surrounding the lower electrodeor through �ve holes in the centre of the upper electrode� Both electrodes were elec�trically heatable and temperature controlled �����
� c�Philips Electronics NV ����

Company Con�dential ����� ������
Figure ��� Two bands of trapped particles between the electrode of the reactor� Bothelectrodes are kept at �� �C� The forward power was �� W �����
Figure ��� Particle traps above the substrate with gas inlet through ring shower�forward power �� Watt� Tel��� �C Tue��� �C �����
c�Philips Electronics NV ���� ��

������ Company Con�dential �����
Figure ��� View of the reactor space with gas inlet through the upper electrode andheated lower electrode Tle��� �C� Tue��� �C�� The particle contamination is belowthe detection limit �����
� c�Philips Electronics NV ����

Company Con�dential ����� ������
Figure ��� Dependance of the negative ion intensities and the total scattered lightfrom powder on the power modulation frequency� The positive ion signal and theglobal SiH� emission are shown for comparison� Closed symbols are referred to theleft�hand axis� open symbols are referred to the to the right�hand axis� SiH�
�� Si�H���
and Si�H�� represent the mono� di� and trisilicon negative ion groups� respectively�
The positive ion intensity is taken from the integrated positive ion mass spectrum�Substrate temperature �� �C� time�averaged plasma power ��W ����
c�Philips Electronics NV ���� �

������ Company Con�dential �����
Figure ��� Estimation of time�averaged anion densities� as a function of modulationfrequency� extrapolated to anions containing � silicon atoms polymerization ratesassumed independent of size for anions of six or more silicon atoms�� Insets show thetime�varying density during a modulation cycle for three frequencies� at ��� Hz� thepolymerisation chain has insu�cient time to propagate to the highest masses� � kHz�the elementary anions are lost before signi�cant polymerisation can occur� and at ��kHz� all anions are trapped and high densities are reached �����
c�Philips Electronics NV ����

Company Con�dential ����� ������
author�s� W�H�M� Lodders
title Powder formation in silane plasma�s�
Distribution
Nat�Lab��PI WB�PRL Redhill� UKPL�NAP Briarcli Manor� USALEP Limeil�Br evannes� FrancePFL Aachen� BRDCP!T WAH
Director� Dr� G�E� Thomas WY Department Heads� Dr� M�H� van Maaren WB �
Dr� A�H� van Ommen WAY �Abstract
W�A�M� Brankaert Nat�Lab� WB �Dr� J� Bruinink Nat�Lab� WB �Dr� G� Cnossen Nat�Lab� WB �Ing� J�P� Damen Nat�Lab� WB �Dr� R� van Asselt Nat�Lab� WB �Dr� J�A�M�M� v� Haaren Nat�Lab� WB �A�G�H� Verhulst Nat�Lab� WB �Dr� U van Slooten Nat�Lab� WB �G�G�H� van de Spijker Nat�Lab� WB �Dr�Ir� H� Cornelissen Nat�Lab� WB �Dr�Ir� L�J�M� Schlangen Nat�Lab� WB �Ing� F�A�M� Paulissen Nat�Lab� WB �Ing�J� van den Eerenbeemd Nat�Lab� WB �Ing� T�h� van den Donk Nat�Lab� WB �Dr� S� Stallinga Nat�Lab� WB �Dr�Ir� K�E� Kuijk Nat�Lab� WB �
Full report
Lic� A� Geelen�Snijkers Nat�Lab� WB �T�C�T� Geuns Nat�Lab� WB �Dr� M�T� Johnson Nat�Lab� WB �Ing� W� Lodders Nat�Lab� WB �Dr� G� Oversluizen Nat�Lab� WB �Ing� A�A� van der Put Nat�Lab� WB �Dr� T�J� Vink Nat�Lab� WB �Ing� R� Verbeek Nat�Lab� WB �
c�Philips Electronics NV ���� �

������ Company Con�dential �����
Dr� S� Battersby PRL RedhillDr� J�A� Chapman PRL RedhillDr� S� Deane PRL RedhillI�D� French PRL RedhillDr� I�G� Gale PRL RedhillDr� D�T� Murley PRL RedhillDr� J� Sandoe PRL RedhillDr� P� Saraga PRL RedhillDr� J�M� Shannon PRL RedhillDr� A� Knapp PRL RedhillDr� J� Chapman PRL Redhill
Dr� N�A�J�M� van Aerle FPD Techn� Centre WAY �Dr� S�J� Bijlsma FPD Techn� Centre WAY �Dr� J�W� Lenderink FPD Techn� Centre WAY �Ing� H� Kuntzel FPD Techn� Centre WAY �Dr� K�J�B�M� Nieuwesteeg FPD Techn� Centre WAY �Dr� M� Pitt FPD Techn� Centre WAY �T� Sakai FPD Techn� Centre WAY �
Dr�Ir�C�L�M�van der KlauwFPD WAY �T� Jacobs FPD WAY �Ir� A�G�M� Jonkers FPD WAY �
J�C� Stuve FPD General Management WAYp
Drs� A�J� Raap Octrooien WAHIng� A�H�M� Raaymakers FPD Pilot SFHpDr� P�H�A� Spijkers FPD Pilot SFHp
� c�Philips Electronics NV ����


![hnical ce T data. - mercedes-benz.ie · PDF file40 echnical T data hnical ce T data. Permissible GVW [t] 3.5 4.6 5.0 3.5 4.6 5.0 4x2 drive system 70 kW (95 hp) at 3800 rpm](https://img.pdfslide.net/doc/110x75/5ab7937f7f8b9ac1058b9957/hnical-ce-t-data-mercedes-benzie-echnical-t-data-hnical-ce-t-data-permissible.jpg)