Embed Size (px)
Citation preview

Strictly private and confidential
Company Analysis and Financial Due Diligence October 2012

© CRISIL Limited. All Rights Reserved.
This page is intentionally left blank

© CRISIL Limited. All Rights Reserved.
To,
Mr Hari K
National Stock Exchange of India Limited
Exchange Plaza
Plot No. C/1, G Block
Bandra - Kurla Complex
Bandra (E)
Mumbai - 400051 Date: October 29, 2012 Dear Sir,
This is with reference to your request to provide a Company Analysis and Financial Due Diligence report (“FDD
Report”) covering the limited scope and for the purpose of potential listing of Veto Switchgears and Cables Pvt
Ltd (“the Company”) on the EMERGE Platform of the National Stock Exchange (NSE).
We enclose our Company Analysis and FDD Report dated October 22, 2012. This Company Analysis and FDD Report
is based on the information provided by the Company to us and also on the meetings with the Management of the
Company.
For the purpose of preparing the Company Analysis and FDD Report, we have not independently verified the
information provided by the Company or collected by us from other sources. CRISIL does not guarantee the
accuracy, adequacy or completeness of any information contained in such Reports. CRISIL especially states that it
has no financial liability whatsoever to you / Company / users of the Reports. CRISIL’s Reports submitted to NSE
do not constitute recommendations to list or not to list the Company on the SME Exchange.
All the Company Analysis and FDD Reports submitted by CRISIL are confidential and are meant for the internal
use only of NSE and should not be used for purpose other than the potential listing of the Company on SME
Exchange.
This Letter shall form an integral part of the Company Analysis and FDD Reports.
We appreciate the opportunity given to us to conduct financial due diligence on Veto Switchgears and Cables Pvt
Ltd.
Yours faithfully, For CRISIL Limited Mohit Modi Director – CRISIL Research

© CRISIL Limited. All Rights Reserved. Page | 4
Company Overview
Executive Summary Analysis of Financial Statements Appendix
Table of contents
Company Analysis 6
Financial Due Diligence 9
Company Overview 9
Executive Summary 13
Analysis of Financial Statements (Standalone) 18
Income Statement Analysis 18
Balance Sheet Analysis 30
Appendix 40
Appendix 1: Summary of loan agreements 40
Appendix 2: Profile of Board of Directors 41
Appendix 3: VEIPL’s summary financials and shareholding structure 42
Disclaimer / Important notice 43
Scope of Work 44

© CRISIL Limited. All Rights Reserved. Page | 5
Company Overview
Executive Summary Analysis of Financial Statements Appendix
Glossary of terms
AS – Accounting Standards
bps – Basis points
Capex – Capital expenditure
CAGR – Cumulative average growth rate
CC – Cash Credit
CFO – Chief Financial Officer
COGS – Cost of goods sold
CWIP – Capital work in progress
DRHP – Draft Red Herring Prospectus
EBITDA – Earnings Before Interest Tax Depreciation and Amortisation
EPS – Earnings per share
FG – Finished goods
FIFO – First in first out
FS – Financial statements
FYXX – Financial year ended March 31, 20XX
GFA – Gross fixed assets
KG – Kilogram
MAT – Minimum Alternative Tax
MIS – Management Information System
Mn - million
NDA – Non disclosure agreement
PAT – Profit after tax
PBT – Profit before tax
RM – Raw materials
SG&A – Selling, general and administrative
sq. ft. – Square feet
SEZ – Special Economic Zone
w.e.f – With effect from
y-o-y – year-on-year

© CRISIL Limited. All Rights Reserved. Page | 6
Company Overview
Executive Summary Analysis of Financial Statements Appendix
Company Analysis
Company background
Incorporated in 2003 as a partnership firm called Veto Industries, the company’s name was changed to ‘Veto Switchgears and Cables’ in April 2007.
Subsequently in June 2007, the partnership firm was converted into a private limited entity and was re-named ‘Veto Switchgears and Cables Private Ltd’. The
company was rechristened as ‘Veto Switchgears and Cables Ltd’ (VSCL) in 2012. It manufactures and sells wires and cables and electrical accessories in India.
The product portfolio encompasses industrial, stand, telephone cables and co-axial wires, general and modular switches, ceiling and rechargeable fans,
compact fluorescent lamps (CFLs) and other electrical accessories. Except for CFLs and fans (the production of which are outsourced), all products are
manufactured in Hardwar, Uttarakhand. Electrical accessories are sold under the ‘Veto’ brand while wires and cables are sold under the ‘Vimal Power’ brand.
The company is promoted by Veto Electropowers (India) Pvt. Ltd (VEIPL), which is a subsidiary of Gurnani Holding Pvt. Ltd, which in turn is owned by the
Gurnani family. VEIPL manufactures and exports wires and PVC cables to the Gulf countries.
Key positives
■ VSCL manufactures and sells wires, cables and electrical accessories. The company has a diversified product basket, which includes around 20 product
categories. It sells electrical accessories under the ‘Veto’ brand, and wires and cables under the ‘Vimal Power’ brand. In FY12, wires and cables
contributed 54% to Veto’s revenues and the rest was contributed by electrical accessories.
■ VSCL has an extensive presence in Rajasthan and derives 70% of its revenues from the state. The company is also present in Delhi, Gujarat, Madhya
Pradesh, West Bengal and Assam and has nearly 2,400 dealers overall. ‘Veto’ and ‘Vimal Power’ are well known brands in the north-western region of
India. The company leverages its dealer network by introducing new products or variants of existing products.
■ The company’s promoters have a long standing presence in PVC (polyvinyl chloride) wires and cables business, which has enabled the company to expand
the electrical accessories business and increase its dealer network in the domestic market.
■ VSCL stands to benefit from the healthy growth expected in the various segments - (a) Switchgears: Domestic switchgear market is expected to grow at 12-
15% with modular switches market posting the fastest growth, (b) Wires and Cables: Domestic wires and cables segment has grown at 25% CAGR over FY08-
12 and is expected to register steady growth in the future (c) Compact fluorescent lamps (CFLs): Volumes are expected to grow at 10% annually over the
next few years, and (d) Consumer appliances: Veto is present only in the fans business; the fan segment is expected to register healthy growth led by low
penetration levels especially in rural areas.
© CRISIL Limited. All Rights Reserved. Page | 7
Company Overview
Executive Summary Analysis of Financial Statements Appendix
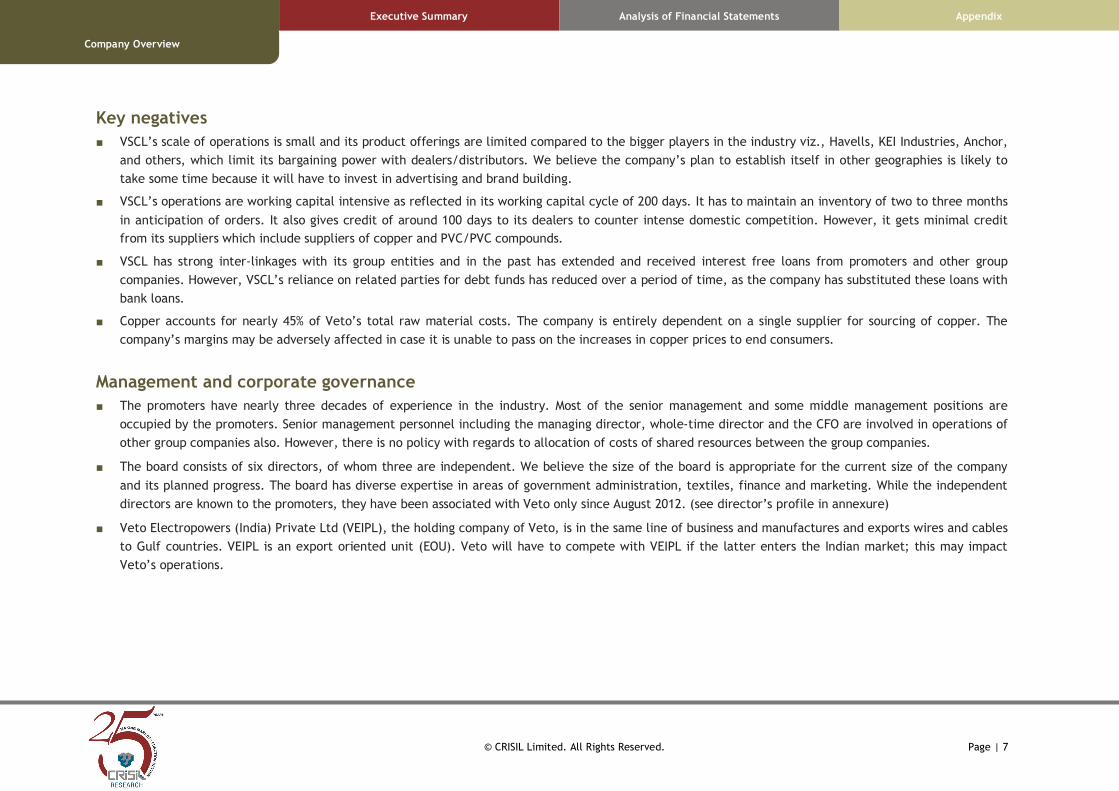
Key negatives
■ VSCL’s scale of operations is small and its product offerings are limited compared to the bigger players in the industry viz., Havells, KEI Industries, Anchor,
and others, which limit its bargaining power with dealers/distributors. We believe the company’s plan to establish itself in other geographies is likely to
take some time because it will have to invest in advertising and brand building.
■ VSCL’s operations are working capital intensive as reflected in its working capital cycle of 200 days. It has to maintain an inventory of two to three months
in anticipation of orders. It also gives credit of around 100 days to its dealers to counter intense domestic competition. However, it gets minimal credit
from its suppliers which include suppliers of copper and PVC/PVC compounds.
■ VSCL has strong inter-linkages with its group entities and in the past has extended and received interest free loans from promoters and other group
companies. However, VSCL’s reliance on related parties for debt funds has reduced over a period of time, as the company has substituted these loans with
bank loans.
■ Copper accounts for nearly 45% of Veto’s total raw material costs. The company is entirely dependent on a single supplier for sourcing of copper. The
company’s margins may be adversely affected in case it is unable to pass on the increases in copper prices to end consumers.
Management and corporate governance
■ The promoters have nearly three decades of experience in the industry. Most of the senior management and some middle management positions are
occupied by the promoters. Senior management personnel including the managing director, whole-time director and the CFO are involved in operations of
other group companies also. However, there is no policy with regards to allocation of costs of shared resources between the group companies.
■ The board consists of six directors, of whom three are independent. We believe the size of the board is appropriate for the current size of the company
and its planned progress. The board has diverse expertise in areas of government administration, textiles, finance and marketing. While the independent
directors are known to the promoters, they have been associated with Veto only since August 2012. (see director’s profile in annexure)
■ Veto Electropowers (India) Private Ltd (VEIPL), the holding company of Veto, is in the same line of business and manufactures and exports wires and cables
to Gulf countries. VEIPL is an export oriented unit (EOU). Veto will have to compete with VEIPL if the latter enters the Indian market; this may impact
Veto’s operations.
© CRISIL Limited. All Rights Reserved. Page | 8
Company Overview
Executive Summary Analysis of Financial Statements Appendix
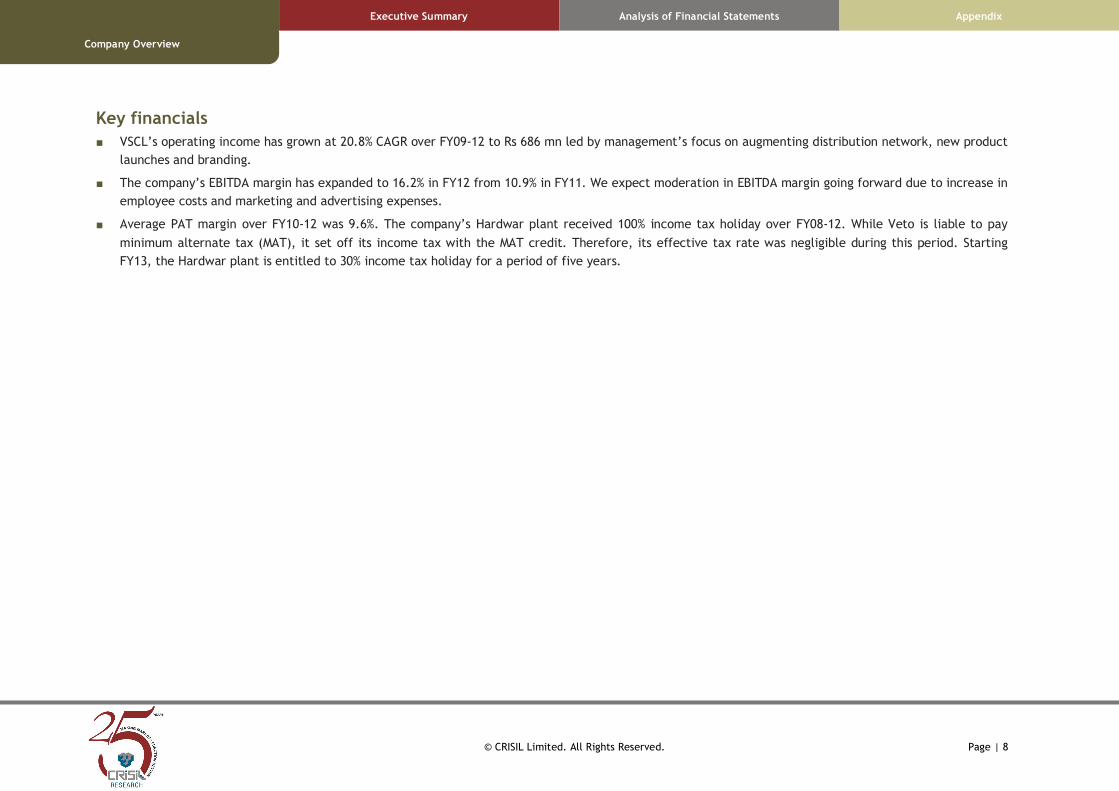
Key financials
■ VSCL’s operating income has grown at 20.8% CAGR over FY09-12 to Rs 686 mn led by management’s focus on augmenting distribution network, new product
launches and branding.
■ The company’s EBITDA margin has expanded to 16.2% in FY12 from 10.9% in FY11. We expect moderation in EBITDA margin going forward due to increase in
employee costs and marketing and advertising expenses.
■ Average PAT margin over FY10-12 was 9.6%. The company’s Hardwar plant received 100% income tax holiday over FY08-12. While Veto is liable to pay
minimum alternate tax (MAT), it set off its income tax with the MAT credit. Therefore, its effective tax rate was negligible during this period. Starting
FY13, the Hardwar plant is entitled to 30% income tax holiday for a period of five years.

© CRISIL Limited. All Rights Reserved. Page | 9
Company Overview
Executive Summary Analysis of Financial Statements Appendix
Financial Due Diligence
Company Overview
Background and Key Milestones
■ Jaipur-based VSCL manufactures and sells wires, cables and electrical accessories in India.
■ Veto Industries, incorporated in 2003 as a partnership firm, changed its name to Veto Switchgears and Cables in April 2007.
■ In May 2007, the company’s Hardwar facility commenced operations.
■ In June 2007, the partnership firm Veto Switchgears and Cables was converted into a private limited entity and renamed as Veto Switchgears and Cables
Pvt. Ltd. In 2012, the company was renamed as Veto Switchgears and Cables Ltd (VSCL).
■ The product portfolio encompasses industrial, stand, telephone cables and co-axial wires, general and modular switches, ceiling and rechargeable fans,
CFLs, and other electrical accessories.
Product and Brand Profile
■ VSCL’s products are sold primarily under the ‘Veto’ and ‘Vimal Power’ brands in north-west India, through a network of nearly 2,400 dealers.
■ Brand ‘Veto’ is owned by Veto Switchgears and Cables Ltd (VSCL). It was acquired by the company in 2006. All the electrical accessories (switches, fans,
CFL and others) are sold under the ‘Veto’ brand.
■ Brand ‘Vimal Power’ is owned by Veto Electropowers (India) Private Ltd (VEIPL), which is the majority shareholder in VSCL. The wires and cables are sold
under the ‘Vimal Power’ brand.
© CRISIL Limited. All Rights Reserved. Page | 10
Company Overview
Executive Summary Analysis of Financial Statements Appendix
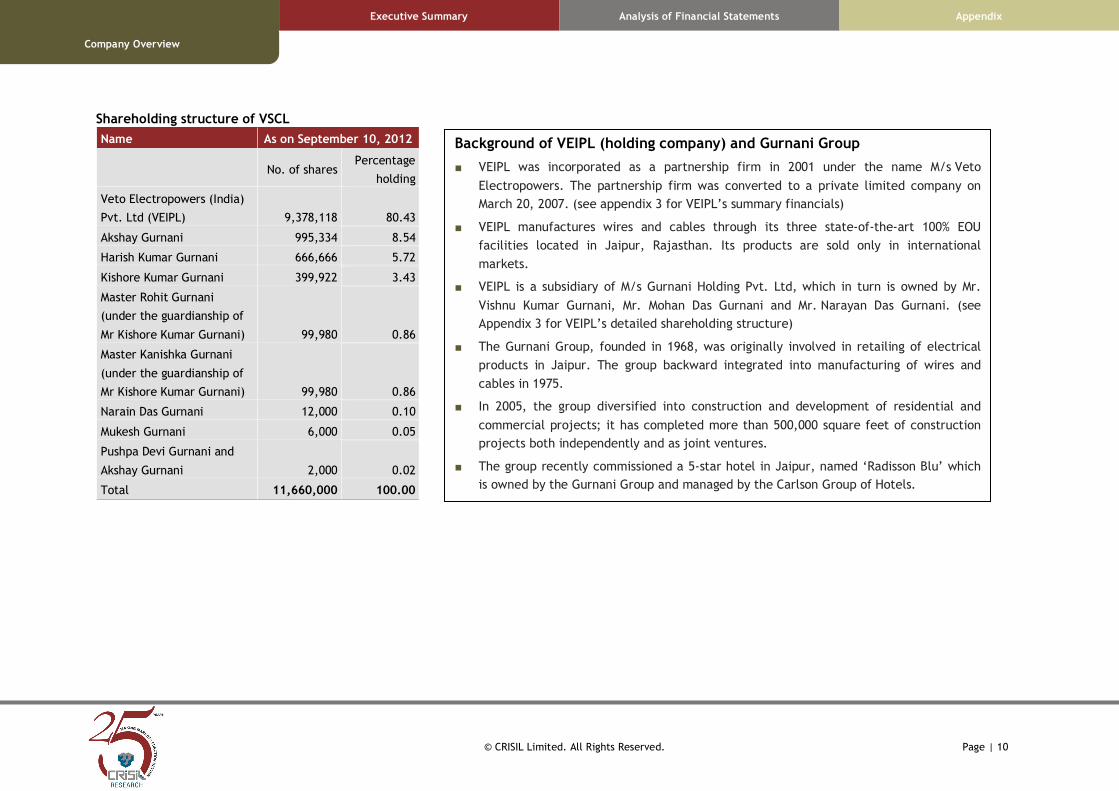
Shareholding structure of VSCL
Name As on September 10, 2012
No. of shares Percentage
holding
Veto Electropowers (India)
Pvt. Ltd (VEIPL) 9,378,118 80.43
Akshay Gurnani 995,334 8.54
Harish Kumar Gurnani 666,666 5.72
Kishore Kumar Gurnani 399,922 3.43
Master Rohit Gurnani
(under the guardianship of
Mr Kishore Kumar Gurnani) 99,980 0.86
Master Kanishka Gurnani
(under the guardianship of
Mr Kishore Kumar Gurnani) 99,980 0.86
Narain Das Gurnani 12,000 0.10
Mukesh Gurnani 6,000 0.05
Pushpa Devi Gurnani and
Akshay Gurnani 2,000 0.02
Total 11,660,000 100.00
Background of VEIPL (holding company) and Gurnani Group
■ VEIPL was incorporated as a partnership firm in 2001 under the name M/s Veto
Electropowers. The partnership firm was converted to a private limited company on
March 20, 2007. (see appendix 3 for VEIPL’s summary financials)
■ VEIPL manufactures wires and cables through its three state-of-the-art 100% EOU
facilities located in Jaipur, Rajasthan. Its products are sold only in international
markets.
■ VEIPL is a subsidiary of M/s Gurnani Holding Pvt. Ltd, which in turn is owned by Mr.
Vishnu Kumar Gurnani, Mr. Mohan Das Gurnani and Mr. Narayan Das Gurnani. (see
Appendix 3 for VEIPL’s detailed shareholding structure)
■ The Gurnani Group, founded in 1968, was originally involved in retailing of electrical
products in Jaipur. The group backward integrated into manufacturing of wires and
cables in 1975.
■ In 2005, the group diversified into construction and development of residential and
commercial projects; it has completed more than 500,000 square feet of construction
projects both independently and as joint ventures.
■ The group recently commissioned a 5-star hotel in Jaipur, named ‘Radisson Blu’ which
is owned by the Gurnani Group and managed by the Carlson Group of Hotels.

© CRISIL Limited. All Rights Reserved. Page | 11
Company Overview
Executive Summary Analysis of Financial Statements Appendix
Details of VSCL’s subsidiaries
Group companies Year of
incorporation
VSCL’s
shareholding*
Description
Veto Electricals Pvt. Ltd 24/03/2008 90.00 The company currently does not have any operations. During FY10, it acquired 3 acres of land in Mahindra World City SEZ for
Rs 17 mn. The management plans to set up an export oriented manufacturing unit for electrical accessories here. This unit is
expected to commence operations in two to three years.
Veto Lighting Pvt. Ltd 17/11/2009 51.00 The company currently does not have any operations. The management originally intended to foray into retailing of electrical
goods through this entity. However, the company’s future plans are uncertain.
Vankon Switchgears and
Cables Pvt. Ltd
20/04/2011 98.00 The company currently does not have any operations. The management originally intended to sell products under the
‘Vankon’ brand which is owned by this company. However, future plans for this entity are uncertain.
Manufacturing facility overview
■ VSCL’s manufacturing facility is located in Hardwar, Uttarakhand on 60,000 square feet of constructed building area. It enjoys tax benefits being offered
by the central government under section 80-IC of the Income Tax Act. All of the company’s products (except fans and CFL) are being manufactured at this
facility.
■ Key tax benefits:
•••• 100% income tax exemption for first five years starting FY08
•••• 30% income tax exemption for five years starting FY13
•••• The company is, however, liable to pay MAT
Installed annual assembly capacity
Capacity As of FY12
Wires and cables 14.08 lakh bundles
Electrical accessories 380 lakh pieces

© CRISIL Limited. All Rights Reserved. Page | 12
Company Overview
Executive Summary Analysis of Financial Statements Appendix
Manufacturing process
Electrical Accessories
Raw material
Moulding
Powder
Brass
Parts
Drawing of copper on drawing
machine
Packing
material
Injecting Moulding/Hand Moulding
Moulding goods to buffing machine for smoothing of edges
Testing/Sorting
Worker table for tightening of brass parts
Testing/Sorting by worker
Testing/Sorting in lab machine
Packing in inner box
Packing in outer box
Packing in cartons
Dispatch
Wires and Cables
Raw material
Drawing of copper on drawing machine
Twisting & rewinding of copper on Twisting & Rewinding Machine
Extruder—PVC lamination of PVC Compound on twisted copper as per required
size of wire
Rolling of PVC insulated copper wire/aluminium wire
Cutting Machine – Cutting of wire for coil size
Stitching of bundles
Packing in boxes
Packing in cartons
Dispatch

© CRISIL Limited. All Rights Reserved. Page | 13
Executive Summary
Company Overview Analysis of Financial Statements Appendix
Executive Summary
Key Findings – Employee costs
Salary paid to key management personnel is on the lower side; Mr Dinesh Gurnani (whole-time director) and Mr P.V. Sharma (Group CFO) have
not drawn any salary in the past
Background Comments / implications Management Comments
■ Salaries paid to key management personnel are on the
lower side compared to their position/experience.
■ Mr Vishnu Gurnani (managing director) did not receive
any salary during FY08-11, and received only Rs 79,000 as
compensation in FY12.
■ Mr Dinesh Gurnani (whole-time director) has not received
any salary in the past. Group CFO, Mr P.V. Sharma, while
involved in the operations of VSCL, does not receive any
salary from the company.
■ Salaries of other key managerial personnel (other than
promoters) are also lower than market standards.
■ Mr Vishnu Gurnani, Mr Dinesh Gurnani and Mr P.V. Sharma
hold key managerial positions in other group companies
also. However, there is no group-wide policy for
allocation of cost between group entities, for shared
resources.
■ The company does not have a policy of paying sitting fees
to its board of directors. Independent directors have
been appointed on the board of directors in August 2012.
■ The current salary cost may not be
representative of future costs. Salary
costs could increase post fund raising,
as the company attains higher scale of
operations. VSCL plans to add 100
employees post IPO.
■ Given the size of the operations, the
quantum of salary increase may have
an adverse impact on profitability.
Employee cost as a percentage of sales
has decreased from 7.5% in FY11 to
6.2% in FY12.
■ As there is no group-wide policy on
payment of salaries to shared
management personnel, VSCL’s current
employee costs may not be appropriate
in relation to the scale of its
operations.
■ Compensation to Mr Vishnu Gurnani has
been fixed at Rs 1.44 mn per annum
and will be paid from FY13 onwards.
Similarly, Mr Dinesh Gurnani’s salary
has been fixed at Rs 0.6 mn per annum
and will be paid from FY13 onwards.
■ Mr P.V. Sharma will continue to receive
his salary from VEIPL, even though he
will be involved in VSCL’s operations.
■ The company gives around 10% salary
hikes to its employees each year and is
likely to continue with this policy.
Employee costs increased at a slower
rate in FY12 as some high salaried
employees left the company and were
not replaced.
■ The company has fixed sitting fees for
the directors at Rs 3,000 per board
meeting per member. The same will be
paid for future board meetings.
© CRISIL Limited. All Rights Reserved. Page | 14
Executive Summary
Company Overview Analysis of Financial Statements Appendix
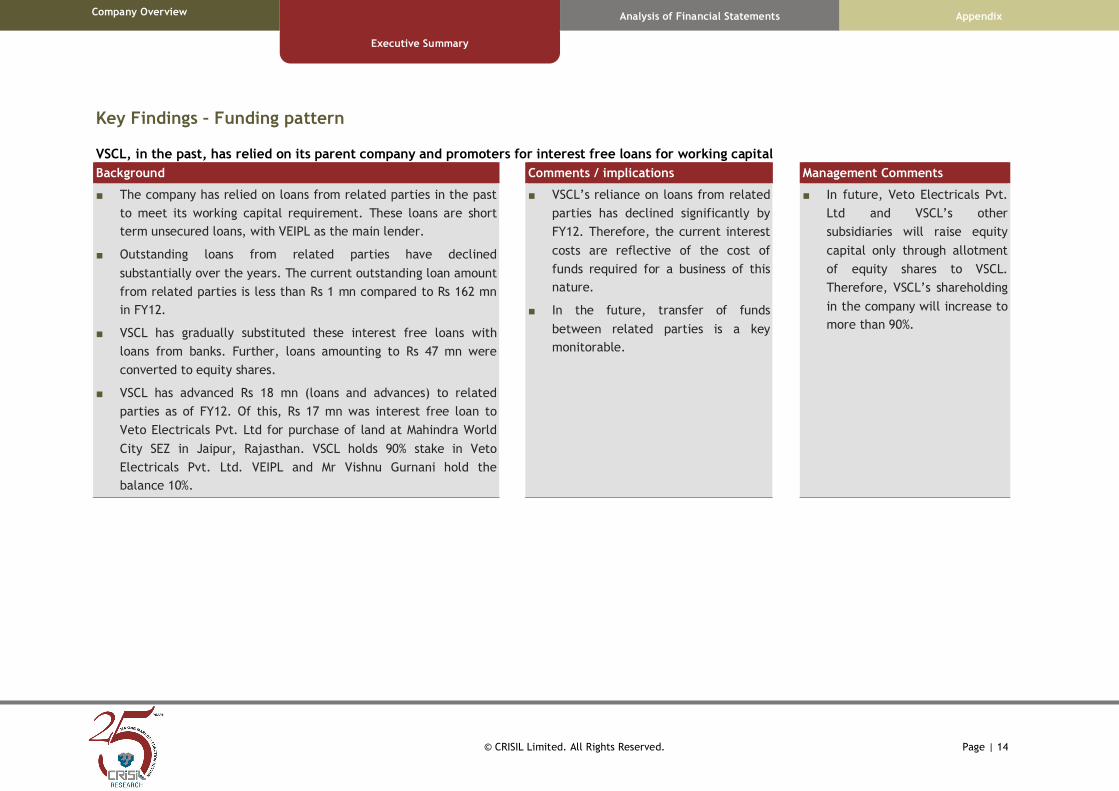
Key Findings – Funding pattern
VSCL, in the past, has relied on its parent company and promoters for interest free loans for working capital
Background Comments / implications Management Comments
■ The company has relied on loans from related parties in the past
to meet its working capital requirement. These loans are short
term unsecured loans, with VEIPL as the main lender.
■ Outstanding loans from related parties have declined
substantially over the years. The current outstanding loan amount
from related parties is less than Rs 1 mn compared to Rs 162 mn
in FY12.
■ VSCL has gradually substituted these interest free loans with
loans from banks. Further, loans amounting to Rs 47 mn were
converted to equity shares.
■ VSCL has advanced Rs 18 mn (loans and advances) to related
parties as of FY12. Of this, Rs 17 mn was interest free loan to
Veto Electricals Pvt. Ltd for purchase of land at Mahindra World
City SEZ in Jaipur, Rajasthan. VSCL holds 90% stake in Veto
Electricals Pvt. Ltd. VEIPL and Mr Vishnu Gurnani hold the
balance 10%.
■ VSCL’s reliance on loans from related
parties has declined significantly by
FY12. Therefore, the current interest
costs are reflective of the cost of
funds required for a business of this
nature.
■ In the future, transfer of funds
between related parties is a key
monitorable.
■ In future, Veto Electricals Pvt.
Ltd and VSCL’s other
subsidiaries will raise equity
capital only through allotment
of equity shares to VSCL.
Therefore, VSCL’s shareholding
in the company will increase to
more than 90%.

© CRISIL Limited. All Rights Reserved. Page | 15
Executive Summary
Company Overview Analysis of Financial Statements Appendix
Key Findings – Lease rent agreements
Lease rental terms with related parties may not reflect commonly accepted market practices
Background Comments / implications Management Comments
■ VSCL has taken on lease 2,400 square feet of built up area
from its promoter Mr Vishnu Gurnani for monthly rent of Rs
5,000. The lease rental is subject to increase at 10% per annum
(agreement date: August 9, 2012). In our opinion, the lease
rental is below the market rate.
■ VSCL has taken on lease 2,500 square feet built up area from
Gurnani Infra Developers Pvt. Ltd for monthly rent of Rs
15,000. The company has also given Rs 20 mn as interest free
security deposit to the lessor (agreement date: August 8,
2012).
■ Monthly lease rental rate of Rs 5,000
for corporate office premises is low
compared to market standards. The
company’s rental expenses will
increase in case the lease rates are
revised upwards.
■ In our opinion, interest free security
deposit of Rs 20 mn for leasing of
warehouse space is high, given the
nature of use of the property and the
monthly lease rental.
■ Not applicable

© CRISIL Limited. All Rights Reserved. Page | 16
Executive Summary
Company Overview Analysis of Financial Statements Appendix
Key Findings: Company needs to strengthen its quality of MIS and internal control
Limited scope on account of quality of information
Background Comments / implications Management comments
We noted gaps and limitations in the information provided for the
purpose of due diligence. Gaps in information include:
■ Quarterly / half-yearly financial statements – Although not a
statutory requirement, the company has not maintained historical
quarterly and half-yearly financial statements.
■ MIS – the company does not maintain monthly / periodical MIS that
captures the key operating metrics, profitability and key balance
sheet numbers. The company also does not capture the data on
state-wise sales.
■ Apart from the corporate office in Jaipur, VSCL has six branch
offices – Hardwar, Delhi, Ghaziabad, Mumbai, Bhiwandi and Surat.
Consolidated operational data on product-wise sales (volumes and
amount), debtors, creditors and others was not available. The
company also did not have historical data on revenue split between
key product segments viz. electrical accessories and wires and
cables.
■ The weak quality of MIS and internal
control is a characteristic of SME companies
due to the small scale of operations.
■ Our analysis has been restricted due to
limitations in data. CRISIL Research was not
able to conduct analysis on quarterly /
monthly trends on profitability and other
key matrices.
■ The management was accommodative in
providing data. Some information required
for the purpose of due diligence was
prepared by the management for the first
time.
■ Although management has been able to
manage the business effectively till now, it
will have to strengthen MIS and internal
controls to monitor operations centrally
with increasing scale.
■ Not applicable
© CRISIL Limited. All Rights Reserved. Page | 17
Analysis of Financial Statements
Company Overview Executive Summary Appendix
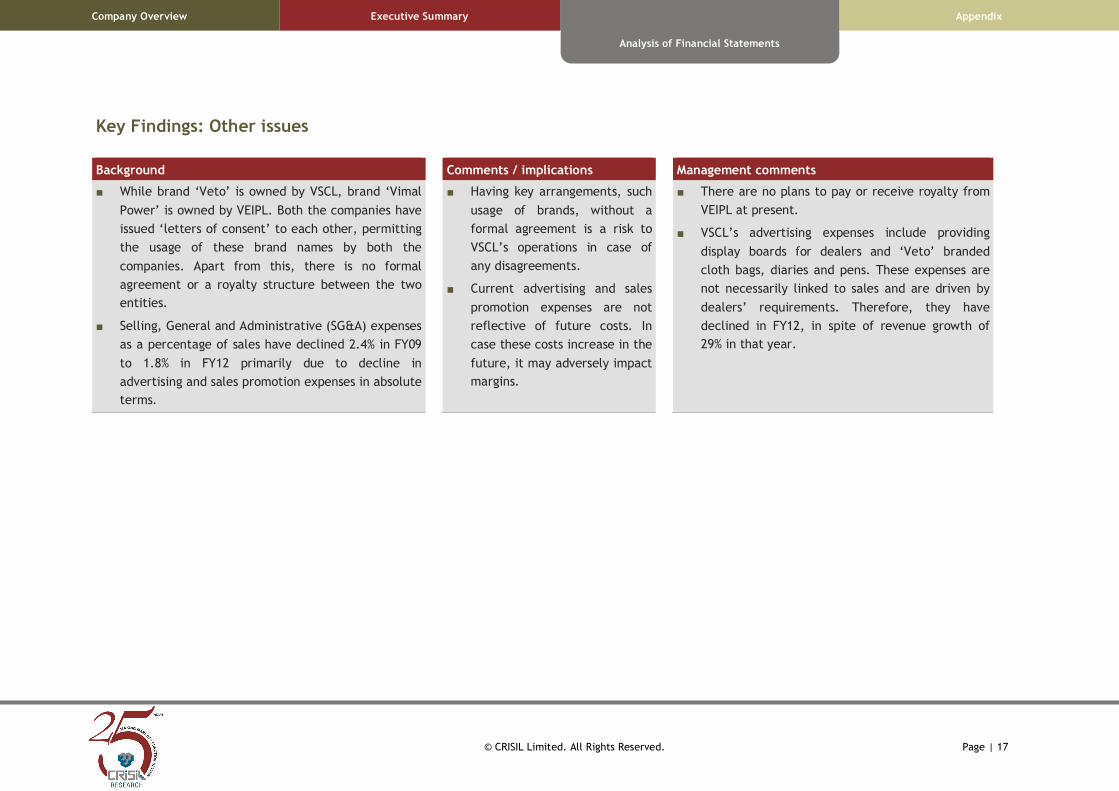
Key Findings: Other issues
Background Comments / implications Management comments
■ While brand ‘Veto’ is owned by VSCL, brand ‘Vimal
Power’ is owned by VEIPL. Both the companies have
issued ‘letters of consent’ to each other, permitting
the usage of these brand names by both the
companies. Apart from this, there is no formal
agreement or a royalty structure between the two
entities.
■ Selling, General and Administrative (SG&A) expenses
as a percentage of sales have declined 2.4% in FY09
to 1.8% in FY12 primarily due to decline in
advertising and sales promotion expenses in absolute
terms.
■ Having key arrangements, such
usage of brands, without a
formal agreement is a risk to
VSCL’s operations in case of
any disagreements.
■ Current advertising and sales
promotion expenses are not
reflective of future costs. In
case these costs increase in the
future, it may adversely impact
margins.
■ There are no plans to pay or receive royalty from
VEIPL at present.
■ VSCL’s advertising expenses include providing
display boards for dealers and ‘Veto’ branded
cloth bags, diaries and pens. These expenses are
not necessarily linked to sales and are driven by
dealers’ requirements. Therefore, they have
declined in FY12, in spite of revenue growth of
29% in that year.

© CRISIL Limited. All Rights Reserved. Page | 18
Analysis of Financial Statements
Company Overview Executive Summary Appendix
Analysis of Financial Statements (Standalone)
Income Statement Analysis
Rs mn Common size statement
Particulars FY09 FY10 FY11 FY12 FY09 FY10 FY11 FY12
Income
Gross sales 418 504 566 729 107.3% 107.2% 106.5% 106.2%
Less: trade discount (28) (34) (35) (43) -7.3% -7.2% -6.5% -6.2%
Operating income 389 470 531 686 100.0% 100.0% 100.0% 100.0%
Expenditure
Raw material consumed 291 368 374 499 74.8% 78.4% 70.3% 72.7%
Change in inventory (5) (29) 9 (7) -1.3% -6.2% 1.7% -1.1%
Power and Fuel 4 5 5 6 1.1% 1.0% 1.0% 0.9%
Employee costs 30 37 40 42 7.7% 7.8% 7.5% 6.2%
Other manufacturing Expenses 4 7 6 8 1.0% 1.4% 1.2% 1.1%
Other expenses 13 13 12 15 3.3% 2.8% 2.4% 2.2%
SG&A 10 13 15 13 2.4% 2.7% 2.8% 1.8%
EBITDA 43 57 71 111 10.9% 12.2% 13.3% 16.2%
Depreciation 8 9 9 11 1.9% 1.9% 1.7% 1.5%
EBIT 35 49 62 100 9.0% 10.4% 11.6% 14.6%
Interest 8 8 13 26 2.2% 1.7% 2.4% 3.8%
Operating PBT 26 40 49 74 6.8% 8.6% 9.2% 10.9%
Other income 0 0 0 1 0.1% 0.1% 0.1% 0.1%
Exceptional inc/(exp) 1 - (0) - 0.4% 0.0% 0.0% 0.0%
PBT 27 41 49 75 7.3% 8.7% 9.3% 11.0%
Tax provision 2 (3) 1 3 0.5% -0.5% 0.1% 0.5%
PAT (Reported) 26 44 49 72 6.8% 9.3% 9.1% 10.5%
Less: Exceptionals 1 - (0) - 0.4% 0.0% 0.0% 0.0%
Adjusted PAT 25 44 49 72 6.4% 9.3% 9.2% 10.5%

© CRISIL Limited. All Rights Reserved. Page | 19
Analysis of Financial Statements
Company Overview Executive Summary Appendix
Revenue Analysis
Revenue details
(Rs mn) FY09 FY10 FY11 FY12
Manufactured goods sales 284 396 443 575
y-o-y change 57.0% 39.0% 12.0% 29.9%
Traded goods sales 133 108 123 153
y-o-y change 69.4% -18.7% 13.7% 24.7%
Total gross sales 418 504 566 729
y-o-y change 60.8% 20.6% 12.4% 28.7%
Less: trade discount (28) (34) (35) (43)
Trade discount as % of gross sales -6.8% -6.7% -6.1% -5.9%
Net sales / operating income 389 470 531 686
y-o-y change 55.9% 20.8% 13.1% 29.1%
Distribution network
No. of dealers FY09 FY10 FY11 FY12
Number of dealers 1,366 1,878 2,187 2,375
Average revenue per
dealer (Rs) 284,952 250,288 243,022 288,798
■ VSCL’s operating income has grown to Rs 686 mn by FY12 at a three-year CAGR of
21% The company sells around 20 products, which can broadly be classified into
two categories – wires and cables and electrical accessories. The wires and cables
business contributed 54% and 58% to VSCL’s revenues in FY12 and FY11,
respectively. The rest was contributed by electrical accessories. We are unable to
comment on the revenue contribution prior to FY11 as the same has not been
provided by the company.
■ Sales of traded goods averaged 21% of total gross sales in the past three years.
Traded goods include, among other products, CFLs and fans which VSCL does not
manufacture and has outsourced to local companies.
■ We are unable to comment on the historical growth in product realisations and
sales volumes as the company has not shared these data with us.
■ The company directly sells to dealers/retailers and has over 2,300 dealers as of
FY12, most of them located in Rajasthan. VSCL derives its maximum revenue from
Rajasthan (over 70%). In the recent years, it has ventured into other states
including Gujarat, Delhi, Madhya Pradesh, West Bengal and Assam. In the future,
the company intends to export electrical accessories.
■ The company reports both gross sales and net sales – net of discount and duties.
For our analysis, we have used net sales.

© CRISIL Limited. All Rights Reserved. Page | 20
Analysis of Financial Statements
Company Overview Executive Summary Appendix
■ VSCL’s dealer base has grown at around 20% CAGR over FY09-12, which we believe has led to revenue growth. As the company has increased its dealer
base, its average revenue per dealer has declined, except in FY12.
■ According to the management, VSCL has been able to pass on the increases in prices of key raw materials (such as copper, PVC/PVC compounds and others)
to end consumers. This is also reflected in the company’s raw material cost, which has remained constant at around 72% of sales over FY10-12.
Consequently, we believe that product realisations have also grown during the past few years.
■ As per our discussions with the management, the company added fans and CFLs to its product portfolio and has contributed around Rs 60 mn to the
company’s revenues in FY12. Remaining sales have been derived from existing products.
■ The company has given an average discount of 6% on sales to dealers. These are usually given to dealers placing large orders with the company or in order
to clear old inventory.
■ The company has two umbrella brands under which it sells all its products – ‘Veto’ and ‘Vimal Power’. While ‘Veto’ is owned by VSCL, ‘Vimal Power’ is
owned by its parent, VEIPL. VSCL has issued a ‘consent letter’ to VEIPL, permitting it to use the brand name ‘Veto’. VEIPL has also issued a ‘consent letter’
to VSCL, permitting it to use the brand name ‘Vimal Power’. However, these companies are not paying any royalty to each other.
■ ‘Veto’ was acquired by the promoters in 2006 for a sum of Rs 11,000, which in our opinion is very low.
■ Within its two umbrella brands, VSCL has other brands such as ‘Carino’, ‘Power’, ‘Puf’, ‘FM’ etc.
Seasonality of revenues
The company’s revenues are typically seasonal - Q2 contributes the highest sales, followed by Q4. Sales are usually higher in Q2 as this period is followed by
the festive season (Diwali) leading to strong demand for VSCL’s products in the residential real estate sector. Historical quarterly/half yearly revenue
breakdown is unavailable as the company has not maintained quarterly/half yearly financials in the past.

© CRISIL Limited. All Rights Reserved. Page | 21
Analysis of Financial Statements
Company Overview Executive Summary Appendix
Production and capacity utilisation
■ VSCL’s installed capacity for wires and cables is 14.08 lakh bundles whereas for electrical accessories it is 380 lakh pieces. The company increased its
capacity for manufacturing electrical accessories from 140 lakh pieces to 380 lakh pieces in FY11 in anticipation of growth in demand.
•••• Capacity expansion in FY10-11 in electrical accessories comprised investment of around Rs 25 mn in construction of additional space within the
company’s factory premises, investment in dies and furniture. This created space for more workers for the assembly operations and therefore
increased VSCL’s throughput capacity.
■ Production of electrical accessories declined from 91.43 lakh pieces in FY10 to 82.33 lakh pieces in FY12. As per the management:
•••• The company launched new products/brands during the initial years and ran promotional schemes to market new products. Therefore, volume offtake
from the dealers was higher in the initial years, leading to higher production.
•••• Company’s sales portfolio keeps changing and the same products may not contribute to sales in the same proportion each year. Therefore volumes
cannot be compared across the years.
■ Production of wires and cables declined in FY11 to 3.32 lakh bundles from 4.23 lakh bundles in FY10. As per the management, significant volatility in
copper prices in FY11 resulted in lower demand from end users, leading to lower capacity utilization in wires and cables manufacturing.
■ We have not been able to verify the product-wise production volume data, as the same was not available with the management.
FY09 FY10 FY11 FY12
Wires and cables
Installed capacity (lakh bundles) 14.08 14.08 14.08 14.08
Capacity utilisation (%) 18.25% 30.00% 23.58% 30.82%
Production (lakh bundles) 2.57 4.23 3.32 4.34
Electrical accessories
Installed capacity (lakh pieces) 140 140 380 380
Capacity utilisation (%) 24.41% 65.30% 23.40% 15.48%
Production (lakh pieces) 34.18 91.43 88.93 82.33

© CRISIL Limited. All Rights Reserved. Page | 22
Analysis of Financial Statements
Company Overview Executive Summary Appendix
Raw material cost
Rs mn FY09 FY10 FY11 FY12
Copper 98 149 171 223
PVC/PVC Compounds 15 20 20 31
Packing materials 8 12 10 14
Stores and spares consumed 1 1 1 1
Traded goods purchased 103 95 97 130
Freight inward 2 2 2 2
Other costs 64 89 72 98
Total 291 368 374 499
Less: Change in inventory (5) (29) 9 (7)
Raw material costs net of
change in inventory
286 339 383 491
Raw material cost (% of sales) 73.5% 72.1% 72.0% 71.6%
Imported raw materials 6% 0% 1% 0%
Indigenous 94% 100% 99% 100%
Raw material cost per unit FY09 FY10 FY11 FY12
Copper (Rs mn) 98 149 171 223
Volume consumed (kg) 349,456 477,624 387,095 455,113
Average cost per unit (Rs/kg) 282 313 442 491
MCX average daily price for the
period (Rs/kg)
262 291 373 407
PVC/PVC compound (Rs mn) 15 20 20 31
Volume consumed (kg) 262,618 361,209 314,587 460,557
Average cost per unit (Rs/kg) 58 56 63 68
■ Raw material cost as a percentage of sales has remained around 72% during FY10-12. We expect this to be on account of VSCL’s ability to pass on the
increases in raw material costs to end consumers. Nearly 100% of VSCL’s raw materials are procured domestically.
■ Copper is the key raw material and accounts for 45% of raw material costs as of FY12. Company’s sole copper supplier is Sterlite Industries. Other raw
materials include brass, aluminium and PVC/PVC compounds.
© CRISIL Limited. All Rights Reserved. Page | 23
Analysis of Financial Statements
Company Overview Executive Summary Appendix
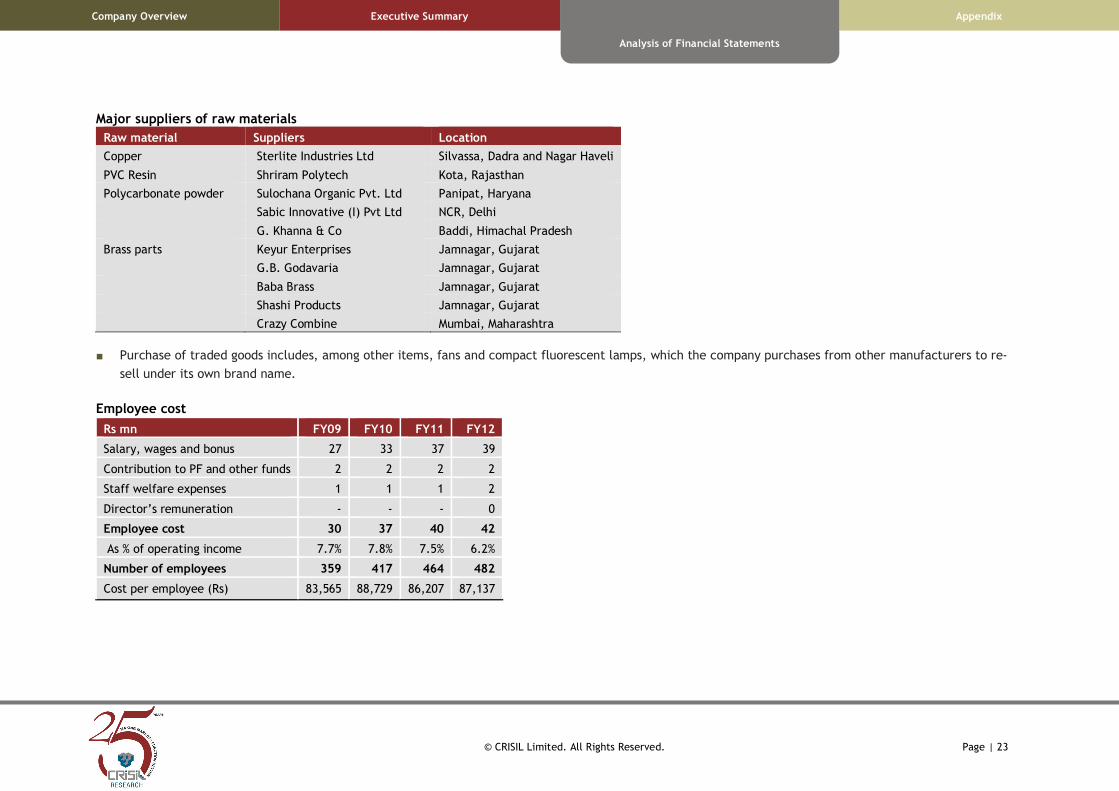
Major suppliers of raw materials
Raw material Suppliers Location
Copper Sterlite Industries Ltd Silvassa, Dadra and Nagar Haveli
PVC Resin Shriram Polytech Kota, Rajasthan
Polycarbonate powder Sulochana Organic Pvt. Ltd Panipat, Haryana
Sabic Innovative (I) Pvt Ltd NCR, Delhi
G. Khanna & Co Baddi, Himachal Pradesh
Brass parts Keyur Enterprises Jamnagar, Gujarat
G.B. Godavaria Jamnagar, Gujarat
Baba Brass Jamnagar, Gujarat
Shashi Products Jamnagar, Gujarat
Crazy Combine Mumbai, Maharashtra
■ Purchase of traded goods includes, among other items, fans and compact fluorescent lamps, which the company purchases from other manufacturers to re-
sell under its own brand name.
Employee cost
Rs mn FY09 FY10 FY11 FY12
Salary, wages and bonus 27 33 37 39
Contribution to PF and other funds 2 2 2 2
Staff welfare expenses 1 1 1 2
Director’s remuneration - - - 0
Employee cost 30 37 40 42
As % of operating income 7.7% 7.8% 7.5% 6.2%
Number of employees 359 417 464 482
Cost per employee (Rs) 83,565 88,729 86,207 87,137

© CRISIL Limited. All Rights Reserved. Page | 24
Analysis of Financial Statements
Company Overview Executive Summary Appendix
■ Employee cost as a percentage of sales has decreased from 7.7% in FY09 to 6.2% in FY12. We believe this is partly because of economies of scale.
■ According to the management, the company has historically given an average increase of 10-12% in salaries and wages. However, employee cost has grown
at around 7% in FY12. The management attributes this to some employees leaving the company during FY12. In our opinion, current employee cost is not
fully reflective of the true costs and therefore likely to increase going forward.
■ Members of the Gurnani family drew Rs 2.3 mn in salary from VSCL in FY12. The managing director, Mr Vishnu Gurnani, has received Rs 79,000 in salary in
FY12 and was not paid any salary during the earlier years. The company has fixed his remuneration at Rs 1.4 mn per annum going forward.
■ Mr Dinesh Gurnani, whole-time director, has not received any salary from VSCL in the past. According to the management, his remuneration has been fixed
at Rs 0.6 mn per annum from the current financial year.
■ During our interactions with the management, we learned that Mrs Pushpa Gurnani and Ms Jyoti Gurnani have ceased to be employees of VSCL and
therefore will not receive any remuneration from the company in the future.
Remuneration of promoters
Rs mn FY09 FY10 FY11 FY12
Vishnu Kumar Gurnani - - - 0.1
Rajesh Kumar Gurnani 0.5 0.2 0.2 0.2
Ragini Gurnani - - - 0.0
Dharam Gurnani 0.2 0.2 0.2 0.2
Sarita Gurnani 0.0 0.1 0.2 0.2
Pushpa Gurnani - 0.2 0.6 0.6
Jyoti Gurnani - 0.2 0.6 0.6
Priyanka Gurnani 0.1 - - -
Total 0.8 0.9 1.8 1.9
■ In our opinion, salaries of the key managerial personnel are on the lower side and the company may have to raise the salary levels if it has to retain the
key employees. Mr P.V. Sharma, Group CFO, receives his salary from VEIPL and not from VSCL.

© CRISIL Limited. All Rights Reserved. Page | 25
Analysis of Financial Statements
Company Overview Executive Summary Appendix
Remuneration of key managerial personnel (other than promoters)
Key managerial personnel Designation Salary (Rs mn)
P.V. Sharma Group CFO 1.0
Govind Ram Gurnani AVP, Marketing 0.4
Vasudev Lalwani AVP, Marketing 0.6
Mohammad Khalid Production Head 0.5
Sanjeev Nigam Sr Manager, Finance and Accounts 0.6
Vandana Ravi Company Secretary 0.3
■ VSCL came into existence starting June 20, 2007. Until FY12, the company followed the policy of accounting the gratuity on cash basis. However the same
was not in conformity with AS 15 prescribed by Institute of Chartered Accountants of India (ICAI) in relation to disclosure of present value of obligations
with respect to the retirement/ future benefits to be paid to the employees and was in contravention of section 211(3C) of the Act. The Accounting
Standard stipulates that these liabilities should be accounted for in the books of accounts on accrual basis. The company has now created a gratuity fund
of Rs 34.64 mn and has obtained a gratuity bond dated August 28, 2012 from Life Insurance Corporation of India, and thus is in compliance with the
prescribed Accounting Standard.
•••• The company has paid a premium of Rs 3.2 mn towards the gratuity bond during FY13. Going forward, this premium is expected to amount to Rs 0.6-
0.7 mn per annum, as per our discussions with the management.
■ The paid up share capital of VSCL has increased beyond Rs 50 mn w.e.f. March 31, 2011. In terms of section 383A of the Companies Act, the company was
required to appoint a company secretary. Veto could not appoint the company secretary during FY12 but has obtained a compliance certificate from the
qualified practicing company secretary for the said year as required. However VSCL has appointed a whole time company secretary w.e.f. May 01, 2012.

© CRISIL Limited. All Rights Reserved. Page | 26
Analysis of Financial Statements
Company Overview Executive Summary Appendix
Power and other manufacturing expenses
FY09 FY10 FY11 FY12
Power and fuel (Rs mn) 4 5 5 6
Power and fuel (% of sales) 1.1% 1.0% 1.0% 0.9%
Other manufacturing expenses (Rs mn) 4 7 6 8
Other manufacturing expenses (% of sales) 1.0% 1.4% 1.2% 1.1%
■ Power and fuel forms a small proportion of the company’s total costs as it does not have manufacturing machineries which consume a large amount of
electricity.
■ Other manufacturing expenses (which include expenses such as factory rent, insurance, repairs to plant and building and others) as a percentage of sales
have decreased by around 1.4% in FY10 to 1.1% in FY12 due to economies of scale.
Selling, general and administrative (SG&A) & other expenses
Rs mn FY09 FY10 FY11 FY12
Advertising and sales promotion expenses 6 6 7 4
% of sales 1.6% 1.3% 1.3% 0.6%
Commission on sales - 3 3 2
% of sales - 0.6% 0.5% 0.3%
Transportation, Freight and handling charges 3 4 5 6
% of sales 0.9% 0.8% 1.0% 0.9%
Other expenses 13 13 12 15
% of sales 3.4% 2.8% 2.4% 2.2%
Total SG&A and other expenses 23 26 27 28
% of sales 5.8% 5.5% 5.1% 4.1%
■ SG&A expenses as a percentage of sales have declined 2.4% in FY09 to 1.8% in FY12 primarily due to decline in advertising and sales promotion expenses.
VSCL’s advertising expenses include providing display boards for dealers and ‘Veto’ branded cloth bags, diaries and pens. According to the management,
these expenses are not necessarily linked to sales and are driven by dealers’ requirements. Therefore, they have declined in FY12, in spite of revenue
growth of 29% in that year. However, we find the same to be abnormal. Other SG&A costs include commission on sales and transportation, freight and
handling charges which form a small proportion.
© CRISIL Limited. All Rights Reserved. Page | 27
Analysis of Financial Statements
Company Overview Executive Summary Appendix
■ The company does not have any policy for provisioning for bad and doubtful debts and product warranties.
■ Other expenses include rent, rates & taxes, travelling and conveyance, and other expenses. VSCL has leased the following properties from its related
parties:
•••• VSCL’s corporate office at Jaipur. The company has taken on lease 2,400 square feet of built up area from its promoter Mr Vishnu Gurnani for a
monthly rent of Rs 5,000. The lease rental is subject to increase at 10% per annum (agreement date: August 9, 2012). In our opinion, the lease rental is
below the market rate.
•••• VSCL’s branch office at Surat. The company has taken office space on lease from Gurnani Infra Developers Pvt. Ltd (promoter group company) for a
monthly rent of Rs 8,000. The lease rental is subject to increase at 5% per annum (agreement date: February 11, 2011).
•••• Warehouse at Jaipur. VSCL has taken on lease 2,500 square feet built up area from Gurnani Infra Developers Pvt. Ltd. for a monthly rent of Rs 15,000.
The company has also given Rs 20 mn as interest free security deposit to the lessor (agreement date: August 8, 2012).
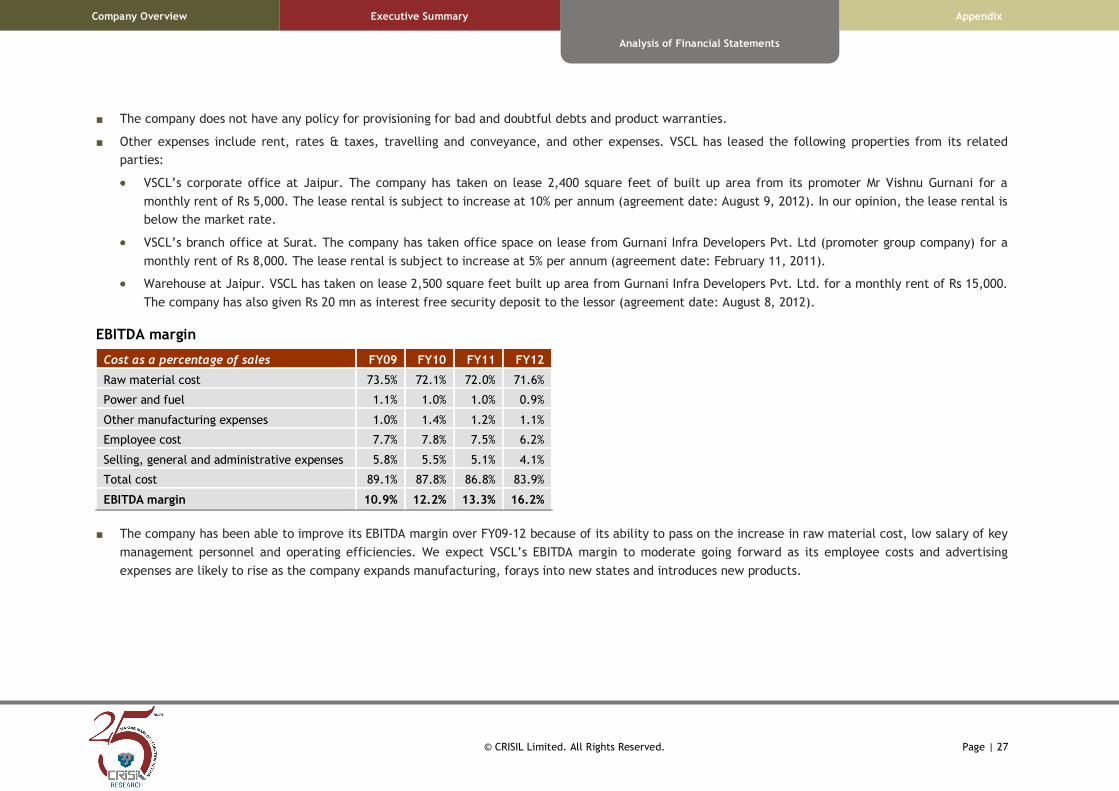
EBITDA margin
Cost as a percentage of sales FY09 FY10 FY11 FY12
Raw material cost 73.5% 72.1% 72.0% 71.6%
Power and fuel 1.1% 1.0% 1.0% 0.9%
Other manufacturing expenses 1.0% 1.4% 1.2% 1.1%
Employee cost 7.7% 7.8% 7.5% 6.2%
Selling, general and administrative expenses 5.8% 5.5% 5.1% 4.1%
Total cost 89.1% 87.8% 86.8% 83.9%
EBITDA margin 10.9% 12.2% 13.3% 16.2%
■ The company has been able to improve its EBITDA margin over FY09-12 because of its ability to pass on the increase in raw material cost, low salary of key
management personnel and operating efficiencies. We expect VSCL’s EBITDA margin to moderate going forward as its employee costs and advertising
expenses are likely to rise as the company expands manufacturing, forays into new states and introduces new products.

© CRISIL Limited. All Rights Reserved. Page | 28
Analysis of Financial Statements
Company Overview Executive Summary Appendix
Interest cost
Table below illustrates the break-up of interest cost over the period under review:
Rs mn FY09 FY10 FY11 FY12
Interest cost 7 7 12 24
Bank charges 1 1 1 1
Total 8 8 13 26
Year end debt 233 238 200 204
Interest rate on average debt (%) 4.0% 3.4% 5.9% 12.8%
■ Interest expense has increased significantly from FY09 to FY12. VSCL relied on interest free loans from related parties in the past due to which interest
costs were low at 4.0% in FY09. However, the company has gradually reduced its dependence on such loans and has replaced them with working capital
loans from banks. Further, unsecured loans amounting to Rs 47 mn were converted to equity shares. As a result, its interest costs have increased over
FY09-12. Total debt, however, has declined from Rs 233 mn in FY09 to Rs 204 mn in FY12.
Depreciation
Cost as a percentage of sales FY09 FY10 FY11 FY12
Depreciation expense (Rs mn) 8 9 9 11
Depreciation expense (% of sales) 1.9% 1.9% 1.7% 1.5%
Gross block (Rs mn) 70 95 100 116
Depreciation rate (% of average gross block) 11.7% 10.6% 9.3% 9.8%
■ The depreciation expense increased from Rs 8 mn in FY09 to Rs 11 mn in FY12 because of investments in factory building, plant and machinery, furniture
and fixtures and vehicles. Average depreciation rate declined after FY09 due to lower capex and written down value method of charging depreciation.
© CRISIL Limited. All Rights Reserved. Page | 29
Analysis of Financial Statements
Company Overview Executive Summary Appendix
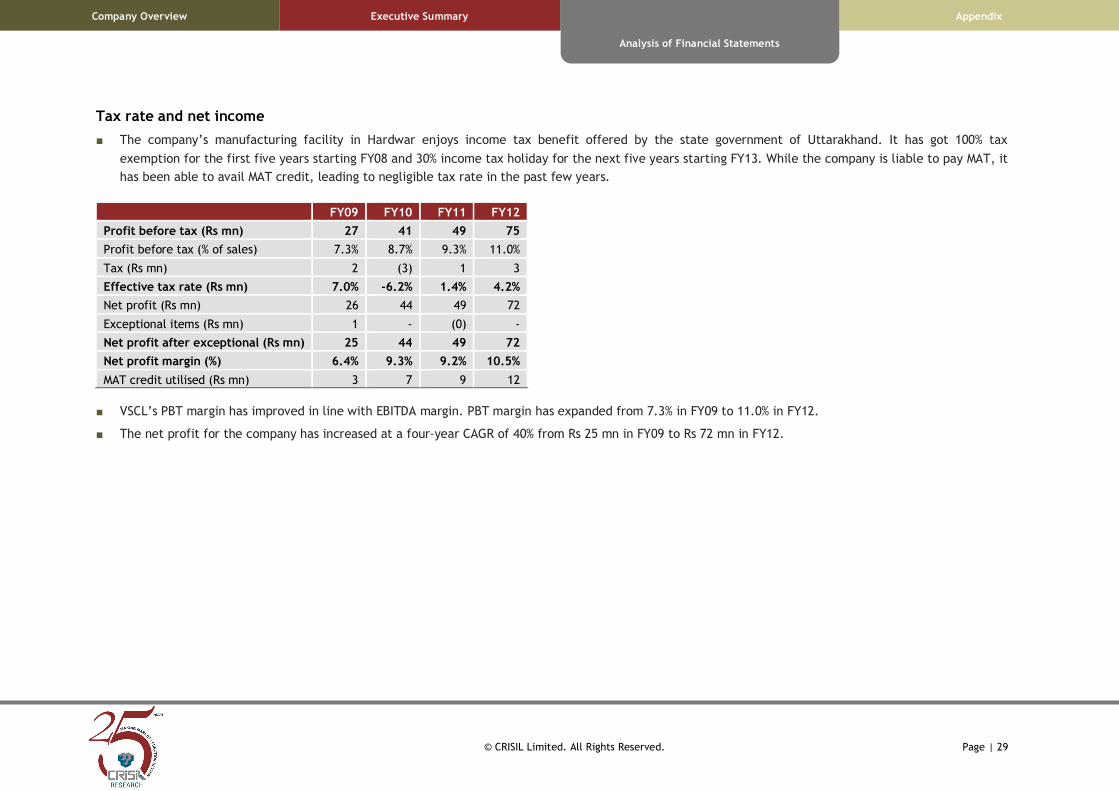
Tax rate and net income
■ The company’s manufacturing facility in Hardwar enjoys income tax benefit offered by the state government of Uttarakhand. It has got 100% tax
exemption for the first five years starting FY08 and 30% income tax holiday for the next five years starting FY13. While the company is liable to pay MAT, it
has been able to avail MAT credit, leading to negligible tax rate in the past few years.
FY09 FY10 FY11 FY12
Profit before tax (Rs mn) 27 41 49 75
Profit before tax (% of sales) 7.3% 8.7% 9.3% 11.0%
Tax (Rs mn) 2 (3) 1 3
Effective tax rate (Rs mn) 7.0% -6.2% 1.4% 4.2%
Net profit (Rs mn) 26 44 49 72
Exceptional items (Rs mn) 1 - (0) -
Net profit after exceptional (Rs mn) 25 44 49 72
Net profit margin (%) 6.4% 9.3% 9.2% 10.5%
MAT credit utilised (Rs mn) 3 7 9 12
■ VSCL’s PBT margin has improved in line with EBITDA margin. PBT margin has expanded from 7.3% in FY09 to 11.0% in FY12.
■ The net profit for the company has increased at a four-year CAGR of 40% from Rs 25 mn in FY09 to Rs 72 mn in FY12.

© CRISIL Limited. All Rights Reserved. Page | 30
Analysis of Financial Statements
Company Overview Executive Summary Appendix
Balance Sheet Analysis (Rs mn) FY09 FY10 FY11 FY12 Particulars FY09 FY10 FY11 FY12
Liabilities Activity ratios
Equity share capital 27 50 53 54 Inventory days 139 123 119 119
Share premium - - 7 7 Creditors days 51 37 45 54
Reserves and surplus 46 90 138 211 Debtor days 115 104 117 113
Net worth 73 140 198 271 Working capital days 194 211 194 187
Convertible debt - - - - Gross asset turnover (x) 6.1 5.7 5.5 6.3
Other debt 233 238 200 204 Net asset turnover (x) 7.0 7.2 7.4 9.3
Total debt 233 238 200 204 Sales/operating assets (x) 6.4 6.7 7.1 8.7
Deferred tax liability (net) 5 2 2 2
Total liabilities 311 380 400 477 Liquidity ratio
Assets Current ratio (x) 5.4 7.6 6.5 5.5
Net fixed assets 58 73 70 77
Capital WIP 10 - 6 5 Capital structure ratios
Total fixed assets 68 73 76 82 Debt-equity (x) 3.2 1.7 1.0 0.8
Investments 0 1 2 4 Net debt/equity (x) 2.9 1.6 0.9 0.7
Current assets Interest coverage 4.2 6.0 4.8 3.9
Inventory 124 130 142 179
Sundry debtors 132 144 181 225 Profitability / Return ratios
Loans and advances 21 63 37 56 EBITDA margin (%) 10.9 12.2 13.3 16.2
Cash & bank balance 21 15 21 18 Adj PAT Margin (%) 6.4 9.2 9.1 10.5
Marketable securities - - - - RoE (%) 41.5 40.9 28.8 30.8
Total current assets 298 352 381 478 RoCE (%) 12.9 14.2 15.9 23.0
Current liabilities
Creditors 48 42 56 85
Provisions 7 4 2 2
Total current liabilities 55 46 59 87
Net current assets 243 306 322 391
Intangibles/Misc. Expenditure 0 0 0 0
Total assets 311 380 400 477
© CRISIL Limited. All Rights Reserved. Page | 31
Analysis of Financial Statements
Company Overview Executive Summary Appendix
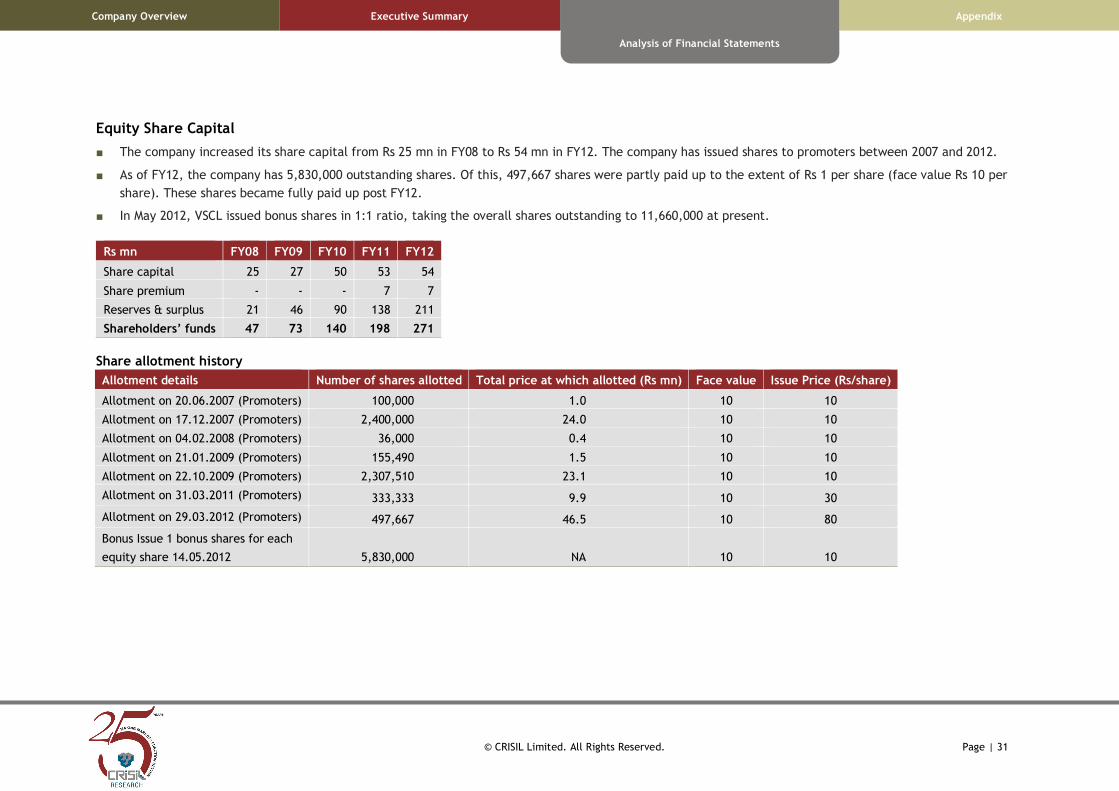
Equity Share Capital
■ The company increased its share capital from Rs 25 mn in FY08 to Rs 54 mn in FY12. The company has issued shares to promoters between 2007 and 2012.
■ As of FY12, the company has 5,830,000 outstanding shares. Of this, 497,667 shares were partly paid up to the extent of Rs 1 per share (face value Rs 10 per
share). These shares became fully paid up post FY12.
■ In May 2012, VSCL issued bonus shares in 1:1 ratio, taking the overall shares outstanding to 11,660,000 at present.
Rs mn FY08 FY09 FY10 FY11 FY12
Share capital 25 27 50 53 54
Share premium - - - 7 7
Reserves & surplus 21 46 90 138 211
Shareholders’ funds 47 73 140 198 271
Share allotment history
Allotment details Number of shares allotted Total price at which allotted (Rs mn) Face value Issue Price (Rs/share)
Allotment on 20.06.2007 (Promoters) 100,000 1.0 10 10
Allotment on 17.12.2007 (Promoters) 2,400,000 24.0 10 10
Allotment on 04.02.2008 (Promoters) 36,000 0.4 10 10
Allotment on 21.01.2009 (Promoters) 155,490 1.5 10 10
Allotment on 22.10.2009 (Promoters) 2,307,510 23.1 10 10
Allotment on 31.03.2011 (Promoters) 333,333 9.9 10 30
Allotment on 29.03.2012 (Promoters) 497,667 46.5 10 80
Bonus Issue 1 bonus shares for each
equity share 14.05.2012 5,830,000 NA 10 10

© CRISIL Limited. All Rights Reserved. Page | 32
Analysis of Financial Statements
Company Overview Executive Summary Appendix
Borrowings
Details of the company’s borrowings
Rs mn FY09 FY10 FY11 FY12
Working capital loan (secured) 39 73 105 187
Interest free loans from related parties (unsecured/short term) 162 141 74 0
Term loans (secured) 23 15 10 2
Long term debt due within one year 8 8 9 10
Hire purchase loans (secured) 1 2 1 5
Total loans 233 238 200 204
■ Interest free loans from related parties
These are short term unsecured loans and are interest free. Over FY09-12, Rs 47 mn of such loans were converted into equity by allotting shares to the
promoters. As of FY12, the outstanding amount of these loans has declined significantly.
Name of the related party FY09 FY10 FY11 FY12
Veto Electropowers (India) Pvt. Ltd 154 119 74 0
Narain Das Gurnani - - 0 -
Babu Lal Gurnani 7 0 - -
Kishore Kumar Gurnani - 0 - -
Vishnu Kumar Gurnani 0 - - -
Kanchan Cables Pvt. Ltd 1 13 - -
Shipra Plastics - 7 - -
Gurnani Infra Developers Pvt. Ltd - 1 - -
Total 162 141 74 0

© CRISIL Limited. All Rights Reserved. Page | 33
Analysis of Financial Statements
Company Overview Executive Summary Appendix
■ Working capital loan
The working capital loan of Rs 187 mn has been taken from Indian Overseas Bank. (For details, please refer to Appendix 1)
■ Term loans
Term loans comprise the secured term loan taken from Indian Overseas Bank. (For details, please refer to Appendix 1)
■ Hire Purchase Loans
Hire Purchase Loans comprise vehicle financing obtained from BMW Financial Services, HDFC Bank and ICICI Bank. (For details, please refer to Appendix 1)
Fixed Assets
Composition of net fixed assets
Rs mn FY09 FY10 FY11 FY12
Leasehold land 8 12 11 11
Factory building 14 24 23 21
Plant & machinery 30 30 28 29
Office equipment 1 1 0 0
Furniture and fixtures 2 3 4 4
Vehicles 3 4 4 11
Total assets 58 73 70 77
CWIP 10 - 6 5
■ VSCL’s assets comprise primarily of plant and machinery and factory building. The installed capacity for wires manufacturing is 14.08 lakh bundles and for
electrical accessories it is 380 lakh pieces. The company expanded its capacity for manufacturing electrical accessories from 140 lakh pieces to 380 lakh
pieces in FY11.
■ The company has purchased land for Rs 17 mn at Mahindra World City SEZ in Jaipur. The land is held in the name of its subsidiary Veto Electricals Pvt. Ltd.
■ Fixed assets are stated at actual cost less accumulated depreciation. Cost comprises the purchase price and any attributable cost of bringing the asset to
its working condition for its intended use. Depreciation on all fixed assets is provided on written down value method as per the rates and in the manner
specified in Scheduled XIV of the Companies Act, 1956.

© CRISIL Limited. All Rights Reserved. Page | 34
Analysis of Financial Statements
Company Overview Executive Summary Appendix
Intangibles
Rs mn FY09 FY10 FY11 FY12
Goodwill 0.3 0.2 0.1 -
Trademark - - 0.001 0.005
■ Goodwill was created upon conversion of the company from a partnership firm to a private limited company in 2007. The company has completely
amortised the goodwill over FY08-12.
■ Trademarks include registered trademarks of some of the company’s key brands. These will be amortised over a period of five years.
Inventory
Veto Switchgears and Cables Ltd FY09 FY10 FY11 FY12
Sales (Rs mn) 389 470 532 686
Inventory (Rs mn) 124 130 142 179
Inventory days (based on sales) 116 101 97 95
Havells (India) Ltd FY09 FY10 FY11 FY12
Sales (Rs mn) 23,415 25,928 31,971 40,109
Inventory (Rs mn) 2,075 3,312 4,699 6,489
Inventory days (based on sales) 32 47 54 59
■ An overview of VSCL’s inventory is as follows:
Rs mn FY09 FY10 FY11 FY12
Raw material 40 31 43 57
Stock in trade 47 34 42 56
Finished goods 33 63 53 61
Packing materials 3 3 3 5
Total 124 130 142 179
■ As on March 31, 2012, the company had around 95 days of inventory (on sales basis) compared to 97 days in FY11 and 101 days in FY10. VSCL’s inventory
days are also higher than industry leader Havells’.
•••• Havells’ sales model involves selling to distributors, who in turn sell to retailers. In this case, distributors purchase the goods from the company and
stock it in their own warehouses. On the other hand, VSCL sells directly to retailers. Retailers usually do not have the capacity to store large amount of
inventory, and therefore VSCL has to stock inventory at its own depots and service the retailers based on demand.
■ The business was in expansion phase and the inventory days were high during FY09. With increase in sales, although inventory on absolute terms has
increased, inventory days have improved over time.

© CRISIL Limited. All Rights Reserved. Page | 35
Analysis of Financial Statements
Company Overview Executive Summary Appendix
■ Stock in trade includes goods that are purchased through trading. These include fans, CFLs, wires and cables.
■ As per the management, the company does not have any work-in-process inventory as the production cycle is very short.
■ Inventory of raw materials, stock of finished goods, packing materials and stock in trade are valued at lower of cost or net realisable value. FIFO is used for
determining the historical cost.
Sundry debtors
FY09 FY10 FY11 FY12
Sales (Rs mn) 389 470 532 686
Debtors (Rs mn) 132 144 181 225
Debtor days 115 104 117 113
■ Sundry debtors mainly include amount receivable from dealers. It also includes loans and advances to related parties. Debtors amounted to Rs 21 mn
outstanding for more than six months as on FY12. Of this, around Rs 8 mn is currently outstanding, as per the management.
Rs mn FY09 FY10 FY11 FY12
Receivables due from related parties 4 21 23 21
■ Receivables from related parties include a loan of Rs 17 mn given to subsidiary Veto Electricals Pvt. Ltd for purchase of land in Jaipur. Other receivables to
related parties are interest free loans given to members of the Gurnani family.
■ According to the management, the company has a policy of giving 90 days credit to its dealers. However, most dealers pay VSCL only when they sell the
goods, which is typically 100-120 days. Hence, the debtor days are over 100 days of sales. VSCL’s top customers are as follows:

© CRISIL Limited. All Rights Reserved. Page | 36
Analysis of Financial Statements
Company Overview Executive Summary Appendix
Top customers (FY10) % of total
sales
Jai Electricals, Jaipur 7%
Sundaram Ele. Pvt. Ltd, Kota 3%
Rahul Sales Corp, Sikar 3%
Imperial Shah Store 2%
Sagar Metal 2%
Vimal House, Bhilwara 2%
Ashoka Industries, Bhilwara 2%
Vaishali Ele., Jaipur 1%
Kunal Electricals, Jaipur 1%
Shivam Marketing, Bhilwara 1%
Top customers (FY11) % of total
sales
Jai Electricals, Jaipur 3%
Sundaram Ele. Pvt. Ltd, Kota 3%
Rahul Sales Corp, Sikar 2%
Sagar Metal 2%
Vimal House, Bhilwara 2%
Jaipur Electrical Install & Tools 2%
Ashoka Industries, Bhilwara 2%
Imperial Shah Store 1%
Prakash Ele. & Deco, Bhilwara 1%
Jaipur Electricals Ins. & Tools, Dubai 1%
Top customers (FY12) % of total
sales
Sagar Metal 3%
Sundaram Ele. Pvt. Ltd, Kota 3%
Vimal House, Bhilwara 2%
Rahul Sales Corp, Sikar 2%
Jaipur Electrical Install & Tools 2%
Jai Electricals, Jaipur 1%
Shivam Marketing, Bhilwara 1%
Prakash Ele. & Deco, Bhilwara 1%
Imperial Shah Store 1%
Gupta Steel Tube, Jaipur 1%
■ Jai Electricals and Jaipur Electricals Ins. & Tools are promoters’ group companies. Pinkcity Build Home Pvt. Ltd is also a promoter group company but sale
to this company has not been disclosed under related party transactions (around 1% of sales in FY12).
Ageing of sundry debtors (ex related parties)
105 106 150
183
22 17 9
21
0%
10%
20%
30%
40%
50%
60%
70%
80%
90%
100%
FY09 FY10 FY11 FY12
(Rs mn)
Due for less than six months Due for more than six months

© CRISIL Limited. All Rights Reserved. Page | 37
Analysis of Financial Statements
Company Overview Executive Summary Appendix
■ The company does not provision for bad and doubtful debts. The company has a policy of taking post-dated cheques, which are collected as security
immediately from the dealers once the goods are sold by the company. VSCL also collects security deposits from its dealers in some cases. As per the
management, the company has not had any bad debts in the past and therefore has not formulated any policy regarding bad debt provisioning.
Loans and advances
Rs mn FY09 FY10 FY11 FY12
Loans to employees 2 5 8 9
Input VAT credit 0.2 1 1 1
Prepaid expenses 0.2 0.002 0.2 0.2
Advance recoverable in cash or kind 13 43 4 10
Loans and advances to others - 0.3 0.2 0.2
Security deposits 1 2 2 2
Advance tax and TDS (net of provisions) - 0.2 - -
MAT credit entitlement 5 12 21 33
Accrued interest - - 0.01 0.01
Total 21 63 37 56
■ Advances recoverable in cash or kind include advance payments made to suppliers.
■ VSCL has accumulated MAT credit entitlement of Rs 33 mn as of FY12. The company’s Hardwar plant enjoyed 100% income tax holiday in FY08-12 and will
receive 30% income tax holiday from FY13-17. However, the company is liable to pay MAT.
Cash and bank
Rs mn FY09 FY10 FY11 FY12
Cash on hand 3 4 1 4
Current account balance 18 10 19 14
Total 21 15 21 18
■ The company had Rs 4 mn in cash and Rs 16 mn in different bank accounts (Indian Overseas Bank, Bank of Baroda and Bank of Rajasthan) as on March 31,
2012.
© CRISIL Limited. All Rights Reserved. Page | 38
Analysis of Financial Statements
Company Overview Executive Summary Appendix
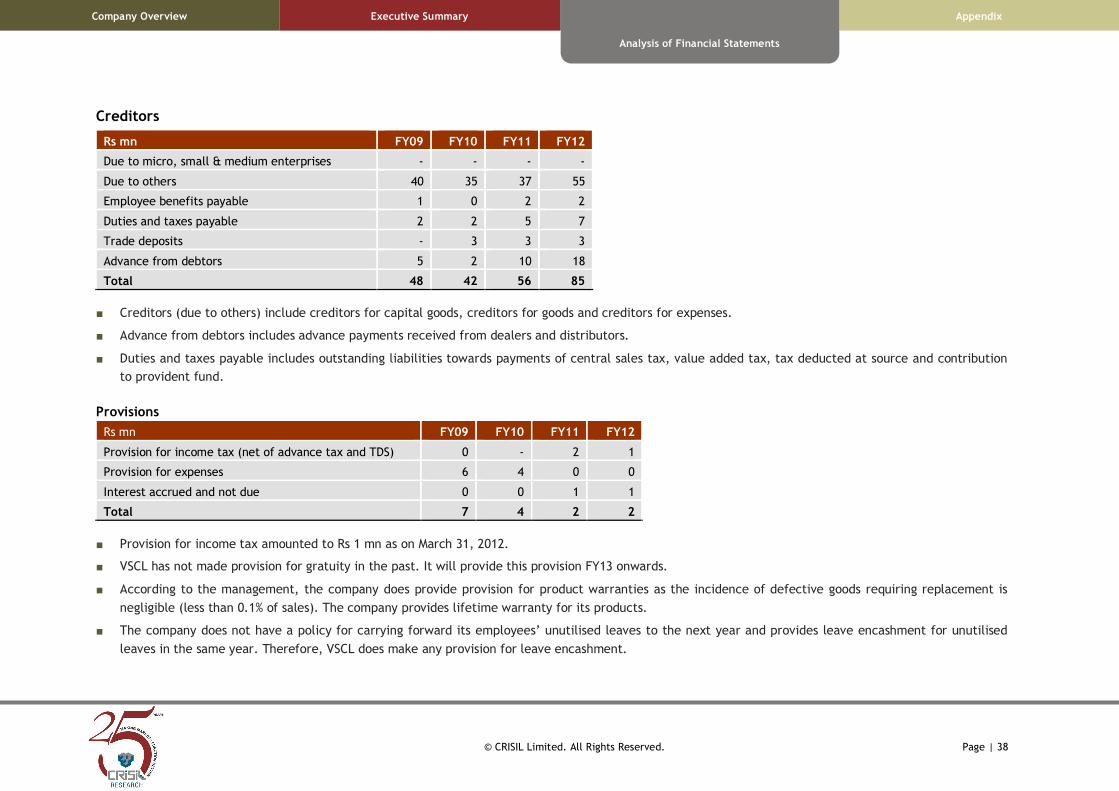
Creditors
Rs mn FY09 FY10 FY11 FY12
Due to micro, small & medium enterprises - - - -
Due to others 40 35 37 55
Employee benefits payable 1 0 2 2
Duties and taxes payable 2 2 5 7
Trade deposits - 3 3 3
Advance from debtors 5 2 10 18
Total 48 42 56 85
■ Creditors (due to others) include creditors for capital goods, creditors for goods and creditors for expenses.
■ Advance from debtors includes advance payments received from dealers and distributors.
■ Duties and taxes payable includes outstanding liabilities towards payments of central sales tax, value added tax, tax deducted at source and contribution
to provident fund.
Provisions
Rs mn FY09 FY10 FY11 FY12
Provision for income tax (net of advance tax and TDS) 0 - 2 1
Provision for expenses 6 4 0 0
Interest accrued and not due 0 0 1 1
Total 7 4 2 2
■ Provision for income tax amounted to Rs 1 mn as on March 31, 2012.
■ VSCL has not made provision for gratuity in the past. It will provide this provision FY13 onwards.
■ According to the management, the company does provide provision for product warranties as the incidence of defective goods requiring replacement is
negligible (less than 0.1% of sales). The company provides lifetime warranty for its products.
■ The company does not have a policy for carrying forward its employees’ unutilised leaves to the next year and provides leave encashment for unutilised
leaves in the same year. Therefore, VSCL does make any provision for leave encashment.

© CRISIL Limited. All Rights Reserved. Page | 39
Analysis of Financial Statements
Company Overview Executive Summary Appendix
Other Matters
Contingent Liabilities
Rs mn FY09 FY10 FY11 FY12
Guarantee given by banks on behalf of the company 0 0 5 0
Estimated amount of contracts remaining to be executed on capital account 0 0 1 1
Total 0 0 6 1
■ As per the information provided to us, there are no significant claims, pending or threatened litigations against the company in the latest available period.
■ The company has not given any significant guarantees, performance bonds, letters of comfort or similar documents of assurance and any indemnities
provided for the benefit of the company.
Other related party transactions
■ VSCL’s purchase of goods from related parties includes purchase of wires and cables from group companies, primarily Vimal Power Cables Pvt. Ltd.
Nature of transaction FY09 FY10 FY11 FY12
Sale of goods (Rs mn) - 14 19 10
Purchase of goods (Rs mn) 78 34 32 20
Rent paid (Rs) 0.2 0.2 0.2 0.3
■ As informed by the management, all the transactions with related parties are on an arm’s length basis.

© CRISIL Limited. All Rights Reserved. Page | 40
Appendix
Company Overview Executive Summary Analysis of Financial Statements
Appendix
Appendix 1: Summary of loan agreements
Lender Nature of loan Primary Security Collateral Security
Balance as at
31st March
2012 (Rs mn)
Interest
Rate
No. of
EMI
Amount
of EMI
Starting
date of Re-
payment
Indian Overseas Bank Term Loan Hypothecation of factory building,
plant & machinery
Personal guarantee
of three directors
7.43 12.25% 60 0.6 3-May-08
Indian Overseas Bank Term Loan Hypothecation of factory building,
plant & machinery
Personal guarantee
of three directors
3.29 12.25% 60 0.10 20-Jan-11
BMW Financial Services
Private Limited
Hire Purchase Loan Hypothecation of vehicle financed Nil 3.30 11.00% 60 0.10 1-Jul-11
HDFC Bank Ltd Hire Purchase Loan Hypothecation of vehicle financed Nil 0.48 9.70% 60 0.00 5-Sep-10
ICICI Bank Ltd Hire Purchase Loan Hypothecation of vehicle financed Nil 2.68 2.22% 36 0.10 15-Nov-11
ICICI Bank Ltd Hire Purchase Loan Hypothecation of vehicle financed Nil 0.07 10.90% 60 0.00 10-May-08
HDFC Bank Ltd Hire Purchase Loan Hypothecation of vehicle financed Nil 0.09 9.70% 36 0.00 5-Dec-09
Indian Overseas Bank Working Capital Loan Hypothecation of stocks of raw
materials, work in process,
finished goods, book debts
Personal guarantee
of three directors
186.51 12.00% NA NA NA
© CRISIL Limited. All Rights Reserved. Page | 41
Appendix
Company Overview Executive Summary Analysis of Financial Statements
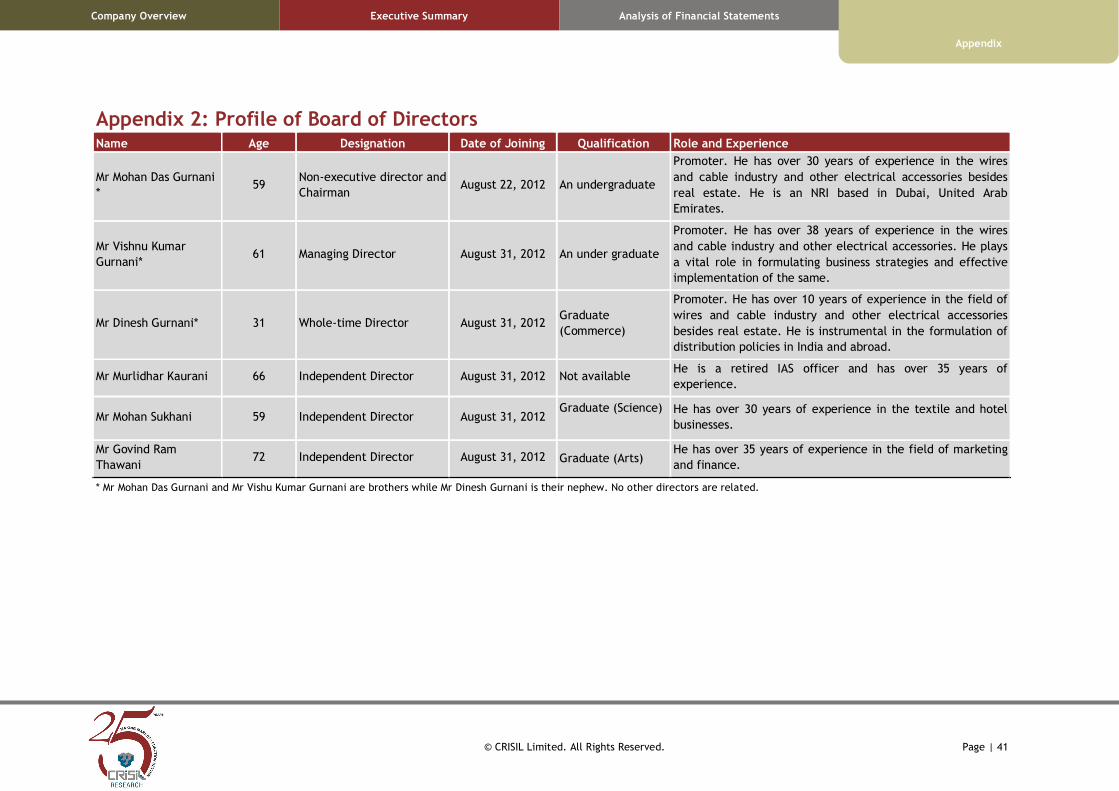
Appendix 2: Profile of Board of Directors Name Age Designation Date of Joining Qualification Role and Experience
Mr Mohan Das Gurnani
* 59
Non-executive director and
Chairman August 22, 2012 An undergraduate
Promoter. He has over 30 years of experience in the wires
and cable industry and other electrical accessories besides
real estate. He is an NRI based in Dubai, United Arab
Emirates.
Mr Vishnu Kumar
Gurnani* 61 Managing Director August 31, 2012 An under graduate
Promoter. He has over 38 years of experience in the wires
and cable industry and other electrical accessories. He plays
a vital role in formulating business strategies and effective
implementation of the same.
Mr Dinesh Gurnani* 31 Whole-time Director August 31, 2012 Graduate
(Commerce)
Promoter. He has over 10 years of experience in the field of
wires and cable industry and other electrical accessories
besides real estate. He is instrumental in the formulation of
distribution policies in India and abroad.
Mr Murlidhar Kaurani 66 Independent Director August 31, 2012 Not available He is a retired IAS officer and has over 35 years of
experience.
Mr Mohan Sukhani 59 Independent Director August 31, 2012 Graduate (Science)
He has over 30 years of experience in the textile and hotel
businesses.
Mr Govind Ram
Thawani 72 Independent Director August 31, 2012 Graduate (Arts)
He has over 35 years of experience in the field of marketing
and finance.
* Mr Mohan Das Gurnani and Mr Vishu Kumar Gurnani are brothers while Mr Dinesh Gurnani is their nephew. No other directors are related.

© CRISIL Limited. All Rights Reserved. Page | 42
Appendix
Company Overview Executive Summary Analysis of Financial Statements
Appendix 3: VEIPL’s summary financials and shareholding structure Rs mn FY10 FY11 FY12
Equity capital 14 131 131
Reserves (excluding revaluation reserves) 411 349 357
Networth 426 480 488
Total income 286 255 363
Profit after tax 15 46 8
Earnings per share (Rs) 10.7 3.5 0.6
Shareholders Percentage holding
Gurnani Holdings Pvt. Ltd. 62.87
JMTC FZCO LLC, Dubai 18.63
Mohan Das Gurnani 6.71
Ms Jyoti Tolani 4.47
Narain Das Gurnani 4.19
Pushpa Devi Gurnani 2.52
Harish Kumar Gurnani 0.62
Total 100.00
Disclaimer / Important notice
This Company Analysis and FDD Report is based on the limited scope of financial due diligence of Veto
Switchgears and Cables Ltd. (“the Company”) The Scope of Work covering the procedures to be
performed for financial due diligence of the Company is defined below. In this Report, we may choose to
not include matters that we believe to be insignificant. There may be matters, other than those noted in
this Report, which might be relevant in the context of the issue and which a wider scope might uncover.
The financial due diligence is based on the audited standalone financial statements for FY10, FY11 and
FY12.
The Report has been issued on the understanding that the Company's management has drawn our
attention to all matters, financial or otherwise, of which they are aware which may have an impact on
our Report upto the date of this Report. Additionally, we have no responsibility to update this Report for
events and circumstances occurring after this date.
Our work does not constitute recommendations about the completion of the operation. This Report also
does not constitute an audit in accordance with the Audit Standards and we have not independently
verified all the matters discussed in this Report and have relied on the explanations and information as
given by the management (verbal as well as written) of the Company. We have assumed the genuineness
of all signatures and the authenticity of all documents submitted to us, whether original or copies. In
this regard, management of the Company is responsible for the proper recording of transactions in the
books of account and maintaining an internal control structure sufficient to permit the preparation of
reliable financial information, including financial accounts. Consequently, we do not express an opinion
on the figures and other information included in this Report. CRISIL does take any responsibility towards
the usage of the Report in any form.
The information and conclusions of this Report should not be the basis for the listing or for any investor
to place a value on the business of the Company or to make a decision whether to acquire or invest in
the Company. Our due diligence and analysis should not be construed as investment advice; specifically,
we do not express any opinion on the suitability or otherwise of entering into any transaction in this
regard. We accept no responsibility for matters not covered by the Report or omitted due to the limited
nature of our analysis. The future plans of the Company, if any, are as informed to us by its
Management. We do not have any view on the same.

Scope of Work
The limited scope of coverage of the Company Analysis and Financial Due diligence Report would be:
i) Study of the financial statements of the Company for the financial periods ended March 31, 2010,
March 31, 2011 and March 31, 2012 (“Historical Period”).
ii) Review and comment on the reasonability and consistency of significant accounting policies
adopted
iii) Highlight significant matters in internal audit reports, audit committee reports and statutory
auditors’ management letters
iv) Analyze quality of earnings with particular focus on:
a) recurring versus non-recurring transactions (income and expenditure)
b) changes in accounting policies
c) impact of related party transactions, if any.
v) Analyze the key drivers of revenue and margin growth with particular reference to:
a) price and volume changes of key products
b) geographical expansion – export revenues vs. domestic revenues
c) key customer wins and losses during the reporting period
d) movement in prices of key raw materials and
e) changes in direct manufacturing costs
vi) Comments on the distribution network, commission, discounting arrangements and credit terms
with distributors.
vii) Analysis of selling costs, discounting policies and marketing overheads.
viii) Analysis of insurance costs including public and product liability insurances.
ix) Analysis of variances in significant administrative overheads.
x) Analysis of movement in head count and employee costs during the reporting period.
xi) Highlight key financial terms in top 5 customer contracts.
xii) Analysis of the cost sheet for the top 5 products and comment on the movements in the costs over
the Historical Period
xiii) Analysis of historical trends in replacement/maintenance capex. Based on discussion with
management, comment if there has been any deferred maintenance/replacement capex.
xiv) Analysis of the basis of capitalization and components of costs such as borrowing costs, pre-
operative expenditure, exchange fluctuations, etc.
xv) Summarize details of investments held, highlighting investments in related entities, if any.
xvi) Analysis of the trends in working capital during the reporting period.
xvii) Analysis of and comment on the ageing profile of receivables and inventories. Inquire into
provisioning policy and comment on provisions for uncollectible amounts and write-offs.
xviii) Analysis of the basis of inventory valuation and reasons for high inventory levels historically.
Emphasize on slow moving/obsolete and non-moving inventories. (physical verification of
inventories will not be conducted)
xix) Comment on other current assets, loans and advances and major creditors. Comment on
recoverability and provisioning for uncollectible amounts.
xx) Comment on the current liabilities including accounts payable and provisions/accruals.

xxi) Obtaining bank reconciliations for key accounts and comment on reconciling items.
xxii) Summarize repayment schedule for the loans outstanding as at the latest available date
Commitments, contingencies and litigation
xxiii) Highlight significant claims, pending or threatened litigations against the company at latest
available period, after discussions with the Management of the Company their views on the likely
outcome of the cases/claims.
xxiv) Highlight significant guarantees, performance bonds, letters of comfort or similar documents of
assurance and any indemnities provided by / or for the benefit of the Company, including details
of such guarantees, etc given by the company for the period under review.
xxv) Status of tax claims and disputes thereof, if any.
Related party transactions
xxvi) Highlight major related party transactions and comment on recoverability / payment of balance
due from / to related parties at period end.
xxvii) Comment on key financial terms and conditions of such related party transactions after
discussions with the Management.
The following areas (indicative list) are excluded from the scope of the Report.
1) Valuation of the Issuer’s business
2) Human Resource review
3) Technical and Commercial Due Diligence
4) Legal and Tax Due Diligence
5) IT review and risk management
6) Physical verification and valuation of fixed assets, inventories and other current assets
7) Third-party confirmations, meetings with suppliers/customers
8) Environmental compliances
9) Overview of the Supply Chain Management
10) Actuarial valuation of the company’s retirement benefit arrangements
11) Checking of accounting records

Contact us
Phone: +91 (22) 3342 3561/ 62
Fax: +91 (22) 3342 3501
E-mail: [email protected] | [email protected]
Our Office
Ahmedabad
706, Venus Atlantis
Nr. Reliance Petrol Pump
Prahladnagar,
Ahmedabad
Phone : 91-79-4024 4500
Fax : 91-79-2755 9863
Hyderabad
3rd Floor, Uma Chambers
Plot No. 9&10, Nagarjuna Hills,
(Near Punjagutta Cross Road)
Hyderabad - 500 482
Phone : 91-40-2335 8103 - 05
Fax : 91-40-2335 7507
Gurgaon
Plot No. 46
Sector 44
Opp. PF Office
Gurgaon - 122 003, India
Phone: + 91 124 6722 000
Bengaluru
W-101, Sunrise Chambers,
22, Ulsoor Road,
Bengalore - 560 042
Phone : 91-80-2558 0899
Fax : 91-80-2559 4801
Kolkata
Horizon, Block 'B', 4th Floor
57 Chowringhee Road
Kolkata - 700 071
Phone : 91-33-2289 1949 - 50 |
Fax : 91-33-2283 0597
Pune
1187/17, Ghole Road,
Shivaji Nagar,
Pune - 411 005
Phone : 91-20-2553 9064 - 67
Fax : 91-20-4018 1930
Chennai
Thapar House,
43/44, Montieth Road, Egmore,
Chennai - 600 008
Phone : 91-44-2854 6205 - 06
Fax : 91-44-2854 7531
About CRISIL Limited
CRISIL is a global analytical company providing ratings, research, and risk and policy advisory services. We are
India's leading ratings agency. We are also the foremost provider of high-end research to the world's largest
banks and leading corporations.
About CRISIL Research
CRISIL Research is the country's largest independent and integrated research house with strong domain
expertise on Indian economy, industries and capital markets. We leverage our unique research platform and
capabilities to deliver superior perspectives and insights to over 1200 domestic and global clients, through a
range of research reports, analytical tools, subscription products and customised solutions.
CRISIL Limited
CRISIL House, Central Avenue, Hiranandani Business Park,
Powai, Mumbai – 400076. India
Phone: + 91 22 3342 3000 Fax: + 91 22 3342 3001
Email: [email protected]
www.crisil.com