Embed Size (px)
Citation preview
RESEARCH REPORT
COMPANY DIRECTORS’ VIEWS REGARDING STAKEHOLDERS
Meredith Jones
Research Fellow Corporate Governance and Workplace Partnerships Project
Faculty of Law The University of Melbourne
Shelley Marshall
Senior Research Fellow Corporate Governance and Workplace Partnerships Project
Faculty of Law The University of Melbourne
Richard Mitchell
Professor, Department of Business Law and Taxation and Department of Management, Monash University and Professorial Fellow, Faculty of Law, The University of
Melbourne
Ian M Ramsay Harold Ford Professor of Commercial Law and
Director, Centre for Corporate Law and Securities Regulation Faculty of Law
The University of Melbourne
Corporate Governance and Workplace Partnerships Project Faculty of Law
The University of Melbourne
2007
2
Published in Melbourne by the Centre for Corporate Law and Securities Regulation and the Centre for Employment and Labour Relations Law Centre for Corporate Law and Securities Regulation Faculty of Law The University of Melbourne Victoria Australia 3010 Phone: + 61 3 8344 5281 Fax: + 61 3 8344 5285 Email: [email protected] Website: http://cclsr.law.unimelb.edu.au Centre for Employment and Labour Relations Law Faculty of Law The University of Melbourne Victoria Australia 3010 Phone: + 61 3 8344 8924 Fax: + 61 3 8344 4623 Email: [email protected] Website: http://www.law.unimelb.edu.au/celrl ISBN 9780734038883 © 2007 M Jones, S Marshall, R Mitchell and I M Ramsay This publication is copyright. Except as permitted under the Copyright Act 1968 (Cth), no part of this publication may in any form or by any means (electronic, mechanical, microcopying, photocopying, recording or otherwise) be reproduced, stored in a retrieval system or transmitted without the specific written permission of the publisher.
3
Table of Contents
1. Introduction......................................................................................................... 4 2. Executive Summary ............................................................................................ 5 3. Aims and Hypotheses........................................................................................ 15 4. Methodology ..................................................................................................... 21 5. The Sample: Key Characteristics...................................................................... 23 6. Directors’ Understanding of Their Duties as Directors .................................... 32 7. Directors’ Priorities........................................................................................... 36 8. The Company’s Relationship with Shareholders.............................................. 43 9. The Company’s Relationship with Employees................................................. 47 10. The Influence of Key Stakeholders................................................................. 55 11. Exploration of Major Relationships................................................................. 61 12. Conclusion .................................................................................................... 122 Appendix 1: Survey Instrument .......................................................................... 125
4
1. Introduction
This research report contains the findings of a survey of company directors undertaken as
part of a broader ‘Corporate Governance and Workplace Partnerships’ project. The
project is being conducted by the Centre for Corporate Law and Securities Regulation
and the Centre for Employment and Labour Relations Law in the Law School at the
University of Melbourne and is funded by an Australian Research Council Discovery
Grant.* The broader project aims to better understand the relationships between corporate
structure, governance and labour relations in Australian companies. In 2005 and 2006
detailed case studies of ten Australian companies were undertaken which explored these
relationships. During structured interviews with managers and union members we gained
valuable information about respondents’ views of a range of matters pertaining to the
interaction of corporate structure, governance and labour relations. We then sought to
obtain further information through a larger quantitative study. Company directors were
chosen as the subjects of this quantitative study.
The object of this report is to provide insight into the results of our survey of directors.
Further analysis of the data is conducted in other publications produced by the Corporate
Governance and Workplace Partnerships project. The website of the project is:
http://cclsr.law.unimelb.edu.au/go/centre-activities/research/corporate-governance-and-
workplace-partnerships-project/index.cfm
* The authors would like to thank Malcolm Anderson for his valuable guidance and assistance with the statistical analysis for this report.
5
2. Executive Summary
In this section, we present, in summary form, our analysis of the results of the survey of
company directors. This follows the structure of the report and presents the key findings
in the areas of directors’ understanding of their duties, directors’ priorities, the company’s
relationship with its shareholders, the company’s relationship with its employees and the
influence of key stakeholders.
2.1 Directors’ Understanding of Their Obligations
A majority of directors (55 percent) believed that acting in the best interests of the
company meant they were required to balance the interests of all stakeholders.
A substantial minority (38.2 percent) believed that acting in the best interests of
the company meant they were required to act in the interests of all stakeholders to
ensure the long term interests of shareholders.
Very few directors equated the best interests of the company with the short-term
interests of shareholders (0.3 percent).
Only a very small proportion (6.6 percent) believed that acting in the best interests
of the company required them to consider the long-term interests of shareholders
only.
An overwhelming majority of directors (94.3 percent) believed that the law
concerning directors’ duties was broad enough to allow them to consider the
interests of stakeholders other than shareholders.
Stakeholder Ranking
When asked to rank company stakeholders in order of priority, 44 percent of
directors ranked shareholders as their number one priority.
40 percent of directors ranked the company as their number one priority.
6
Customers were ranked as the number one stakeholder by 8.2 percent of directors.
Employees were the number one priority for 6.7 percent of directors.
2.2 Directors’ Priorities
Ensuring customers are satisfied, growing the business and ensuring employees
are fairly treated are the matters that were rated as important by the largest
proportion of directors.
Overall, less than half (45 percent) of the directors surveyed felt that increasing
the share price was important to them, although the proportion among directors of
listed companies holding this view was considerably higher (60.4 percent).
When asked what actions they would prioritise in the event of downturn in the
financial performance of the company, the majority of directors surveyed (58.7
percent) indicated that they would prioritise ‘decreasing or suspending the
dividend paid to shareholders’. A further 14.9 percent of directors would prioritise
retrenching staff in the event of a downturn.
In the event of an improvement in the financial performance of the company, 60.8
percent of directors would prioritise an increase in the dividend paid to
shareholders.
24 percent of directors would prioritise an increase in the salary or bonuses paid
to employees and 12 percent would increase the number of employees in the
event of an improvement in the financial performance of the company.
2.3 The Company’s Relationship with its Shareholders
In the majority of companies represented in our sample (77.5 percent) it was the
chief executive officer or managing director who had the most frequent dealings
with shareholders.
46.4 percent of directors indicated that these dealings with shareholders occurred
daily or weekly.
7
The four issues discussed most frequently in meetings between shareholders and
the company were the ‘financial performance of the company’ (94.5 percent),
‘proposed expenditure or investment’ (82.6 percent), ‘proposed new business
strategy’ (82.6 percent) and ‘expenses’ (75.9 percent).
Areas of Tension with Shareholders
There had been areas of tension between the company and its shareholders over
the past year according to 25.6 percent of directors.
Where there had been areas of tension, those areas were most commonly said to
be the ‘financial performance of the company’ (60.4 percent), ‘proposed new
business strategy’ (34.4 percent) and ‘proposed expenditure or investment’ (30.2
percent).
There were significant differences between listed and unlisted companies
regarding the areas of tension between the company and its shareholders. ‘Share
price’ was an area of tension in 43.5 percent of listed companies where there had
been areas of tension, compared with 12.3 percent of unlisted companies.
‘Expenses’ was an area of tension in 26.0 percent of unlisted companies where
there had been areas of tension but was not an area of tension in listed companies.
Overall, concerns were most likely to be raised in private meetings with senior
management with 77.1 percent of directors indicating that this would be the case.
A further 17.7 percent indicated that concerns would be raised at the annual
general meeting.
2.4 The Company’s Relationship with its Employees
The Role of the Law as a Source of Obligations to Employees
42.5 percent of directors believed that the dominant source of their responsibility
to employees was business imperatives, i.e. that their responsibility to employees
8
stemmed from the importance of employees to ensuring the success of the
business.
A further 24.8 percent of directors believed that the dominant source of their
responsibility to employees stemmed from a social or ethical responsibility to
ensure the well being of the employees of the company.
Only 15.8 percent of directors believed that labour laws were the dominant source
of their responsibility to employees, while 16.9 percent believed that corporate
law was the dominant source.
When asked what role the law played in the determination of the human resource
management strategy of the company, directors were fairly evenly divided
between seeing the Workplace Relations Act and other employment laws as
helping to facilitate a best practice approach in their company (37.4 percent) and
regarding those laws as providing bare minimum standards for compliance only
and as having very little to do with their overall human resources strategy (36.3
percent). Very few (3.7 percent) regarded the Workplace Relations Act and other
employment laws as operating as a constraint.
Human Resource Issues Considered at the Board Level
The four human resource issues most likely to have been considered three or more
times at board level over the past year were ‘occupational health and safety’ (73.3
percent), ‘productivity’ (66.3 percent), ‘training’ (65 percent) and ‘performance
management’ (64.2 percent).
‘Industrial disputes’ (10 percent) and ‘enterprise bargaining’ (15.4 percent) were
among the least commonly raised human resources issues according to directors.
Partnership Relations with Employees
A large majority (76.9 percent) of directors believed that the relationship between
the company and its employees could best be described as being one of
partnership.
9
A majority of the directors (70.8 percent) who believed that the relationship was
one of partnership believed that it was a partnership based on the parties having
the same interests and common goals.
The most commonly expressed reason for directors to indicate that the
relationship was not one of partnership was that employees and the company
could not be conceived of separately and therefore could not be parties in
partnership.
2.5 The Influence of Key Stakeholders
81.2 percent of directors believed that shareholders had the power to influence
management, while 78 percent believed that employees had this power. Only 23.6
percent of directors believed that creditors had the power to influence
management.
85.9 percent of directors believed that employees received a high degree of time
and attention from management, compared with 65 percent who believed so in
relation to shareholders and 30.4 percent in relation to creditors.
78.7 percent of directors believed that the demands of shareholders were viewed
by the management team as legitimate and 76.7 percent of directors believed this
in relation to employees. A much smaller proportion (47.3 percent) of directors
agreed that the demands and wishes of creditors were viewed by management as
being legitimate.
87.9 percent of directors agreed that satisfying the demands or wishes of
employees was important to their management team compared with 83.3 percent
of directors who agreed with this statement regarding shareholders, and 54.7
percent regarding creditors.
Employees were perceived to be more active in seeking the attention of
management with 70.5 percent of directors agreeing that employees actively
sought the attention of their management team. A total of 64.6 percent of directors
believed that shareholders had actively sought the attention of management
compared with 21.6 percent who believed the same in relation to creditors.
10
2.6 Key Findings in Relation to Our Hypotheses
As is set out in Section 3 of this report, we aimed to test a number of hypotheses in
conducting the survey. While it is not the aim of the report to draw final conclusions
about those hypotheses,1 we now present an overview of the key findings as they relate to
our hypotheses by way of prelude to further analysis.
Hypothesis 1
Directors perceive that their primary responsibility is to shareholders. This perception
may derive from their understanding of their legal responsibilities, from institutional
frameworks, from responses to pressure from within the company or from a combination
of these factors.
We found that 44 percent of directors did regard shareholders as their number one
priority, but that almost as many (40 percent) regarded the company as their number one
priority. Shareholders were also regarded as having the power to influence management
by a very high proportion of directors (81.2 percent). Satisfying the demands or wishes of
shareholders was believed by 83.3 percent of directors to be important to management.
However, shareholder focussed matters such as increasing the share price were regarded
as being important by a smaller proportion of directors than were matters such as growing
the business and ensuring that customers were satisfied.
Overall, directors did not believe that they were obliged by law to prioritise the interests
of shareholders. A majority (55 percent) believed that acting, as they are obliged to do
under common law and the Corporations Act, in the best interests of the company meant
that they must balance the interests of all stakeholders. A further 38.2 percent of directors
believed that they must ensure the long-term interests of shareholders but by means of
1 These final conclusions will be presented in the book to be published out of the Corporate Governance and Workplace Partnership Project.
11
acting in the interests of all stakeholders. A small proportion of directors (6.6 percent)
believed that they were required to act in the long-term interests of shareholder only and
0.3 percent of directors believed that they were required to ensure the short-term interests
of shareholders by means of acting in the interests of all stakeholders.
We found, however, that directors’ understanding of the requirements of ‘acting in the
best interests of the company’ may have an effect on the extent to which they prioritised
the interests of shareholders. Directors who believed that acting in the best interests of the
company required them to balance the interests of all stakeholders were significantly less
likely than directors who believed that they ultimately were required to act in the interests
of shareholders to rank shareholders as their number one priority (33.8 percent compared
with 55.5 percent).
Hypothesis 2
Directors of companies which are closer to the market/outsider model (typically large
companies with their shares listed on the stock exchange) will be more likely to
emphasise their primary obligation to shareholders in the short-term.
The evidence does not support this hypothesis. In the first case, only a negligible
proportion of directors believed that they must act to ensure the short-term interests of
shareholders. Secondly, there were no significant differences between insider-type
companies and outsider-type companies in relation to this hypothesis.2 We did find that
directors in listed companies (stock market listing being one of the criteria for inclusion
in the market/outsider category of our model) were significantly more likely than
directors in unlisted companies to rank shareholders as their number one priority (55.4
percent compared with 39.7 percent). However, the evidence on the whole suggests that
2 We define ‘market/outsider companies” and ‘relational/insider companies” in section 5. The six criteria for a market/outsider company are: listed company; largest shareholder not represented on the board; no other shareholders represented on the board; higher level of holding by institutional investors; short term debt financing; and creditors not represented on the board. The six criteria for a relational/insider company are: unlisted company; largest shareholder is on the board; other shareholders are on the board; lower level of institutional holding; long term debt financing; and creditors on the board.

12
it is more likely to be the case that shareholders’ interests are given a higher priority in
insider-type companies than in outsider companies. This is seen in the significantly
higher proportion of directors in insider type companies who indicated that shareholders
had the power to influence management (86.9 percent compared with 75 percent in
outsider type companies). It also appears to be the case that shareholders are more active
in pursuing demands in insider companies than they are in outsider companies. Some 75
percent of directors of insider companies indicated that shareholders had been active in
pursuing demands or claims (compared with 53.3 percent in outsider companies) and
70.1 percent of directors of insider companies agreed that shareholders had actively
sought the attention of management compared with 56.3 percent in outsider companies.
Hypothesis 3
Where directors perceive that their primary responsibility is to shareholders, the interests
of employees receive a lower priority.
The evidence regarding this hypothesis is mixed. When we used the shareholder salience
scale as a measure of the orientation toward shareholders, we found some significant
evidence that employees’ interests may receive a lower priority. However, when we used
the director’s understanding of their obligation under law to prioritise shareholders’
interests, we did not find much effect on the interests of employees.
We found some significant differences between the responses of directors who were in
the high range of the shareholder salience scale and those who were in the low range
when it came to board level discussion about restructuring and retrenchment. Directors in
companies in the high range of the shareholder salience scale, namely those who
indicated that shareholders had a high level of influence, were significantly more likely to
indicate that matters relating to restructuring and retrenchment had been discussed at
board level over the past year than were directors in the low range of the scale (18.9
percent compared with 4.8 percent). It was also the case that directors in the high range of
the scale were more likely to indicate that the number of employees in the company had
13
decreased over the past year. This suggests that to some extent the hypothesis is
supported. However, concerning a number of other indicators, such as directors’ priorities
in the event of a downturn in the financial performance of the company, the priority
ranking of employees as stakeholders, and the matters of importance to directors there
were no significant differences between directors in the high range of the scale and those
in the low range.
Looking to whether directors who believed that their primary legal obligation was to
shareholders were less likely to prioritise the interests of employees, we found that this
did not seem to be the case. Directors who believed that acting in the best interests of the
company required them to act in the interests of shareholders ultimately were more likely
than directors who believed that they must balance the interests of all stakeholders to rank
shareholders as their number one priority. However, there were no significant differences
between the groups regarding the priority ranking of employees. Shareholder oriented
directors were less likely than stakeholder oriented directors to prioritise a decrease or
suspension of the dividend payable to shareholders in the event of a deterioration in the
financial performance of the company but were not significantly more likely to decrease
the number of staff or reduce staff salaries or bonuses in such an event.
Hypothesis 4
Directors who prioritise the interests of shareholders in the short-term will be less likely
to consider the relationship between the company and its employees to be one of
partnership. This is because they will be more likely to have a pluralist conception of the
company and to see the relationship as inherently conflictual.
We found that, overall, a large majority of directors (76.9 percent) described the
relationship between the company and its employees as one of partnership. The majority
of these directors (70.8 percent) believed that the partnership could be described as one in
which the company and its employees were parties with the same interests.
14
There were very few directors in the sample who prioritised the interests of shareholders
in the short-term. We therefore cannot offer any evidence on the hypothesis. However,
we did find that there were no significant differences in attitudes to partnership between
directors in the high range and those in the low range of the shareholder salience scale.
Similarly, directors who took a shareholder oriented view of their legal obligations were
no less inclined to describe the relationship between the company and its employees as
one of partnership than those who were more stakeholder oriented.
While it appears that directors’ prioritisation of the interests of shareholders is not related
to their belief in the existence of partnership, it does appear that directors’ attitudes to
employees play a significant role. Directors who were in the high range of the
‘employees active’ were significantly more likely to indicate that the relationship was one
of partnership than were directors in the low range of that scale (82 percent compared
with 59.4 percent). Directors in the high range of the ‘employees legitimate’ scale were
similarly more inclined to indicate that the relationship was one of partnership (83.1
percent compared with 63 percent) than were directors in the low range.
15
3. Aims and Hypotheses
In this section, we set out the central aims and key hypotheses for the survey. We also
provide a brief discussion of the background to each hypothesis.
3.1 Hypothesis 1
1. Directors perceive that their primary responsibility is to shareholders. This perception
may derive from their understanding of their legal responsibilities, from institutional
frameworks, from responses to pressure within the company or from a combination of
these factors.
This hypothesis is based on the growing literature on shareholder value and its
implications for labour, and in particular on the work of Mitchell, O’Donnell and
Ramsay3 regarding factors that contribute to the interests of shareholders being given
priority over the interests of other stakeholders in the company. This hypothesis is also
partly drawn from previous similar research on the attitudes of Australian directors
towards their obligations to shareholders and other stakeholders. The ranking exercise in
Q. 1, for example, is taken from the work of Francis,4 who carried out research in
Australia, UK, Japan and the US.
Concerning our first hypothesis, the survey aimed to discover:
• What directors understand their legal obligation to act in the best interests of the
company to mean.
• The extent to which directors perceive that the scope of this legal obligation
allows them to take into account stakeholders’ interests other than shareholders.
3 R. Mitchell, A. O’Donnell and I. Ramsay, ‘Shareholder Value and Employee Interests: Intersections Between Corporate Governance, Corporate Law and Labour Law’ (2005) 23 Wisconsin International Law Journal 417. 4 I. Francis, Future Direction: The Power of the Competitive Board, FT Pitman Publishing, Melbourne 1997.
16
• The extent to which this legal obligation is understood to be focussed on long or
short term objectives.
• The relative value assigned by directors to the shareholders and employees of the
company.
• The extent to which factors other than legal obligation appear to influence
directors’ sense of obligation to these stakeholders of the company. We aimed to
test for director’s sense of moral obligation and the extent to which institutional
arrangements within the company and actual pressure from stakeholders may
influence outcomes for stakeholder groups.
• The relative importance of labour law and corporate law in informing directors’
responsibilities to employees.
3.2 Hypotheses 2 and 3
2. Directors of companies which are closer to the ‘market-outsider’ typology will be
more likely to emphasise their primary obligation to shareholders in the short-term.
3. Where directors perceive that their primary responsibility is to shareholders, the
interests of employees will correspondingly receive lower priority. The degree of the
lower priority will vary on a scale depending on where the company stands in relation
to Hypothesis 1 (primacy of obligation to shareholders) and Hypothesis 2 (short or
long term orientation).
Hypotheses 2 and 3 are related to Hypothesis 1 but are focussed more explicitly on the
insights offered by Gospel and Pendleton.5 They offer a theoretical framework for the
themes being explored based on the dichotomy between market-outsider and relational-
insider systems. The model predicts that particular types of finance and governance will
influence managerial choices in relation to labour management strategies in the areas of
5 H. Gospel and A. Pendleton, ‘Finance, Corporate Governance and the Management of Labour: A Conceptual and Comparative Analysis” (2003) 41 British Journal of Industrial Relations 557; H. Gospel and A. Pendleton (eds), Corporate Governance and Labour Management, Oxford University Press, Oxford, 2005.
17
employment relations (job tenure, skill formation and wage systems); work relations
(functional flexibility and innovation strategy); and industrial relations (voice, collective
bargaining approaches).6
These categories, as well as the broader theory, have been used as the basis of
information gathering and analysis throughout the case studies undertaken as part of the
larger Corporate Governance and Workplace Partnerships Project of which this survey
forms a part. We have been examining the influences on management’s strategic choices
within a framework that looks to the interactions between shareholders, management and
labour to test the extent to which the governance and ownership structures of the
company appear to be the main mechanisms influencing management’s approach to
labour.
Preliminary analysis of the case study material suggested that this model may have some
application at the level of the company in Australia and is therefore worth testing
quantitatively via the survey of directors.
In relation to these hypotheses the survey aimed to discover:
• The extent to which directors of companies that best fit the market / outsider
typology do appear to emphasise the interests of shareholders in the short term.
• The extent to which directors of such companies who do emphasise the interests
of shareholders in the short term appear to place a lesser value on employees’
interests.
• The extent to which there are differences in the relationships between companies
and their shareholders according to the type of company. We aimed to discover,
for example, whether there are differences in the extent of shareholder activism;
in the types of concerns shareholders raise with management; in the mechanisms
6 H.Gospel and A.Pendleton, Financial Structure, Corporate Governance and the Management of Labour, Kings College, London, Research Paper No 6, October 2001, p. 27.
18
by which they raise those concerns; and in the extent to which companies respond
according to company type.
• The extent to which there are differences in the relationship between companies
and their employees according to the type of company. We aimed to understand,
for example, institutional structures such as how the human resources function sits
within the company and the relationship between the board and human resources;
the level of reporting on human resources issues, and the types of issues raised.
3.3 Hypothesis 4
4. Directors who emphasise their primary obligation to shareholders in the short term
will be less likely to consider the relationship between the company and its
employees as one of partnership. This is because they will be more likely to have a
pluralist conception of the company and to see the relationship as inherently
conflictual.
This hypothesis stems from the theoretical exploration of the notion of partnership
conducted by the project,7 the empirical work of Deakin et al,8 and our own case study
research. Using our case studies to explore the notion of partnership, we have been
examining the way that governance and ownership structures impact on the development
of partnership style relationships between employers, employees and trade unions in our
case study companies. We tested for partnership through the use of a number of
indicators drawn from research conducted by the project,9 such as high levels of
participation by employees or employee representatives in decisions about their
employment, job functions and organisational strategy. Flexible job design and a focus on 7 R. Mitchell and O’Donnell, ‘What is Labour Law Doing About Partnerships At Work? British and Australian Developments Compared”, Paper presented at the Corporate Governance and the Management of Labour: Australian Perspectives Workshop, University of Melbourne, 7 and 8 December 2006; M. Jones and S. Marshall, ‘What Do Company Directors Think About Partnership between the Company and its Employees?” Paper presented at the Corporate Governance and the Management of Labour: Australian Perspectives Workshop, University of Melbourne, 7 and 8 December 2006. 8 S. Deakin et al, ‘Partnership, Ownership and Control: The Impact of Corporate Governance on Employment Relations” ESRC Centre for Business Research Working Paper No. 200, June 2001, p. 36 9 D.E. Guest and R. Peccei, ‘Partnership at Work: Mutuality and the Balance of Advantage” (2001) 39 British Journal of Industrial Relations 207.
19
quality are also important indicators and should combine with an emphasis on
performance management and mechanisms designed to align the interests of employees
with the company. This should occur within an environment of employment security and
the pursuit of mutual gains. Both the Deakin case studies and the theoretical model of
Gospel and Pendleton suggest that partnership style relations would be less likely to
occur in a company in which the interests of shareholders are prioritised in the short term.
The most striking finding which arose from the case studies was that self-identification of
a partnership style relationship is rare, and the term appears to lack resonance in the
Australian context. Thus, for the survey of directors we proposed to test whether
directors’ view the relationship between employees and the company as being best
described as one of partnership and the extent to which they appear to have either a single
interest or separate interests conception of relations with employees. The ‘single or
separate interests’ conception derives from the work of Guest and Peccei10 who revived
the terms ‘pluralist’ and ‘unitarist’ to describe approaches based on a clear
acknowledgement of differences of interest between capital and labour, on the one hand,
compared with those which ‘explicitly seek to integrate employer and employee
interests’,11 on the other.
In relation to this hypothesis, the survey aimed to discover:
• Whether directors understand the relationship between the company and
employees as being one of partnership.
• Whether directors tend more toward a unitarist or pluralist conception of the
company.
• Whether directors tend to believe that the interests of employees and the company
are aligned and the same, or rather separate and conflicting.
10 Ibid. 11 Ibid, 209. See also M. Jones and S. Marshall, ‘What do Company Directors think about Partnership between the Company and its Employees?’ Paper presented at the Corporate Governance and the Management of Labour: Australian Perspectives Workshop, University of Melbourne, 7 and 8 December 2006.

20
• Whether understandings of partnership differ according to particular factors such
as directors’ overall priorities, orientation towards shareholders or employees, or
company typology.
21
4. Methodology
The survey was undertaken using a self-completion, mail out survey form which was sent
to 4000 company directors in June 2006. We chose to survey company directors because
the nature of our central question (the relationship between corporate governance and
labour management in Australian companies) suggested that our respondents should be at
the centre of this relationship. While we may have gained more substantive information
about labour management by surveying human resource managers, they would not
necessarily have been central to governance of companies in the way that directors are. In
the main, we sought to test the attitudes and opinions of directors. However, we also
sought factual information about the companies of which they were directors and for this,
directors are an appropriate ‘key informant’.
Our sample was drawn from the Dun and Bradstreet Business Who’s Who. Dun and
Bradstreet selected company directors from across Australia based on the following
criteria:
• a roughly equal distribution of directors from companies in three size (by
employee numbers): 50-100 employees; 101-250 employees and 250+ employees;
and
• a random mix of all industries.
Prior to the final mail out, the survey was piloted by six directors selected through
networks of the researchers. A number of amendments were made to the survey based on
the feedback of these directors. A reminder letter was sent to directors who had not
returned the survey within the first week. We achieved a final sample of 375 usable
completed surveys. This is a low response rate but not uncharacteristically low for
surveys of this kind, i.e. of ‘elite personnel’.12 Around 200 surveys were returned due to
12 See S. Jacoby, E. M. Nason, K. Saguchi, ‘The Role of the Senior HR Executive in Japan and the United States: Employment Relations, Corporate Governance and Value’ (2005) 44 Industrial Relations 207 at 216 and B. Agle, R. K. Mitchell and J. Sonnenfeld, ‘Who Matters to CEOs? An Investigation of Stakeholder Attributes and Salience, Corporate Performance and CEO Values’ (1999) 42 The Academy of Management Journal 507 at 513.
22
incomplete or incorrect mailing details. A further 50 responded with apologies based on
lack of availability of the directors or stated that company policy precluded the
completion of surveys.
The responses were entered using double entry verification of all fields except open
format questions. Analysis was undertaken using the statistical and data management
software package SPSS, with basic statistical tests performed; chi square for crosstabs
and t-test for the comparison of means.
23
5. The Sample: Key Characteristics
5.1 Characteristics of the Directors
The survey asked directors two questions about their status as a director: whether they
were executive or non-executive and whether they were independent or not. The mailing
list used was heavily weighted to executive directors and accordingly our response
sample comprised 92.6 percent executive directors. Twelve percent of directors indicated
that they considered themselves to be an independent director according to the
description provided. This description was based on the Australian Securities Exchange
definition of independence for directors.
5.2 Characteristics of the Companies
In addition, we asked directors, as key informants, a number of questions about the
characteristics of the company of which they were a director. As directors often hold
multiple directorships, they were asked to answer the questions in relation to the
company to which the survey was sent. This section reports on the key characteristics of
the companies in our sample.
Regarding the company’s legal structure, 75.5 percent were proprietary companies and
24.5 percent public companies. Some 16.5 percent were listed on the Australian
Securities Exchange, 0.5 percent were listed on another Australian exchange and 12.0
percent were listed on an international exchange. 26.4 percent of companies produced an
annual report or other report on their social or environmental performance. Listed
companies comprise approximately less than 0.1 percent of total companies registered in
Australia and 22 percent of public companies. Public companies are about 0.57 percent of
total companies.13
13 Australian Securities and Investments Commission, [http://www.asic.gov.au/asic/asic_pub.nsf/byheadline/2006+company+registration+statistics?openDocume
24
The sample comprised a range of company sizes as measured by turnover. Twenty eight
percent of companies had turnover of less than $20 million annually, with a further 28.1
percent in the $20 million to less than $50 million range and 12.7 percent in the $50
million to less than $100 million range. Nearly one third of the sample (30.8 percent) had
turnover of more than $100 million annually.
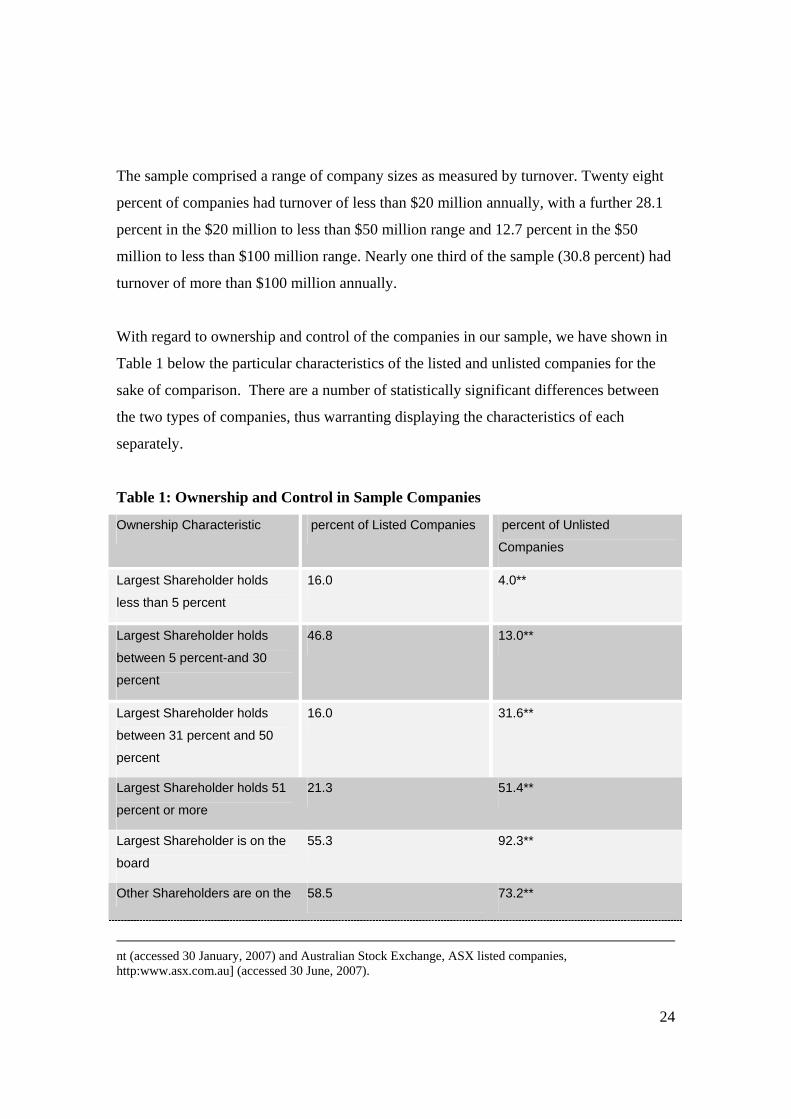
With regard to ownership and control of the companies in our sample, we have shown in
Table 1 below the particular characteristics of the listed and unlisted companies for the
sake of comparison. There are a number of statistically significant differences between
the two types of companies, thus warranting displaying the characteristics of each
separately.
Table 1: Ownership and Control in Sample Companies
Ownership Characteristic percent of Listed Companies percent of Unlisted
Companies
Largest Shareholder holds
less than 5 percent
16.0 4.0**
Largest Shareholder holds
between 5 percent-and 30
percent
46.8 13.0**
Largest Shareholder holds
between 31 percent and 50
percent
16.0 31.6**
Largest Shareholder holds 51
percent or more
21.3 51.4**
Largest Shareholder is on the
board
55.3 92.3**
Other Shareholders are on the 58.5 73.2**
nt (accessed 30 January, 2007) and Australian Stock Exchange, ASX listed companies, http:www.asx.com.au] (accessed 30 June, 2007).
25
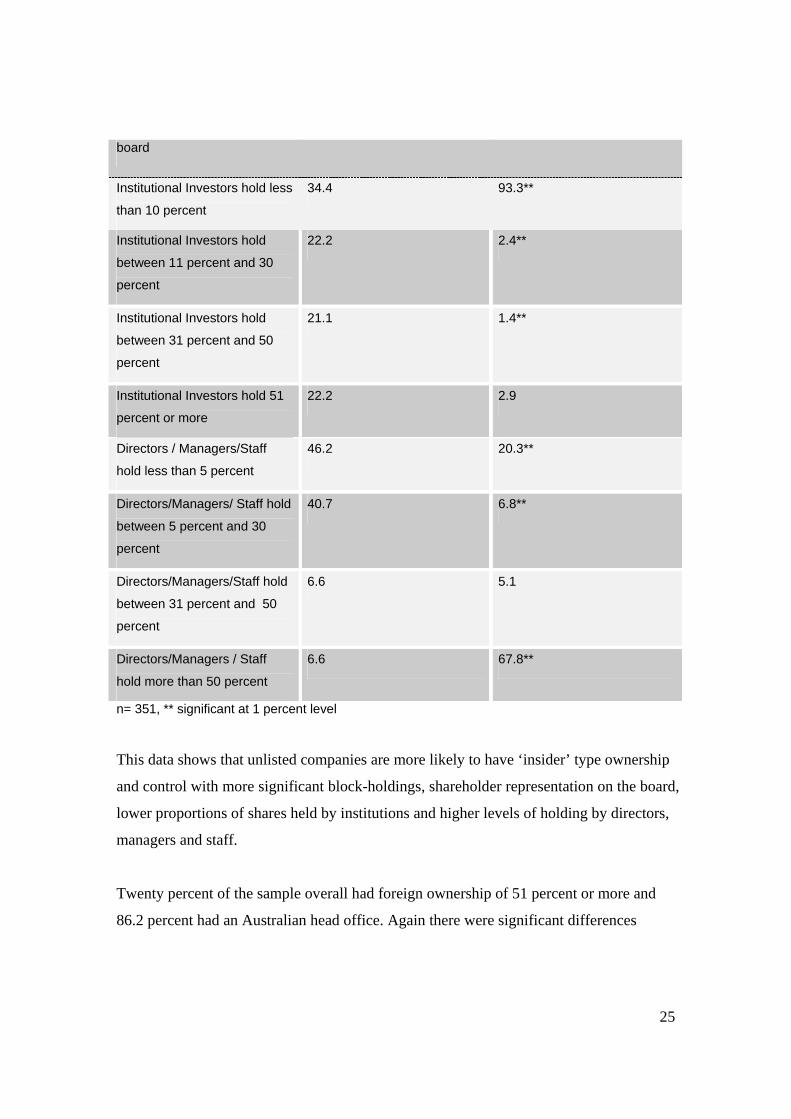
board
Institutional Investors hold less
than 10 percent
34.4 93.3**
Institutional Investors hold
between 11 percent and 30
percent
22.2 2.4**
Institutional Investors hold
between 31 percent and 50
percent
21.1 1.4**
Institutional Investors hold 51
percent or more
22.2 2.9
Directors / Managers/Staff
hold less than 5 percent
46.2 20.3**
Directors/Managers/ Staff hold
between 5 percent and 30
percent
40.7 6.8**
Directors/Managers/Staff hold
between 31 percent and 50
percent
6.6 5.1
Directors/Managers / Staff
hold more than 50 percent
6.6 67.8**
n= 351, ** significant at 1 percent level
This data shows that unlisted companies are more likely to have ‘insider’ type ownership
and control with more significant block-holdings, shareholder representation on the board,
lower proportions of shares held by institutions and higher levels of holding by directors,
managers and staff.
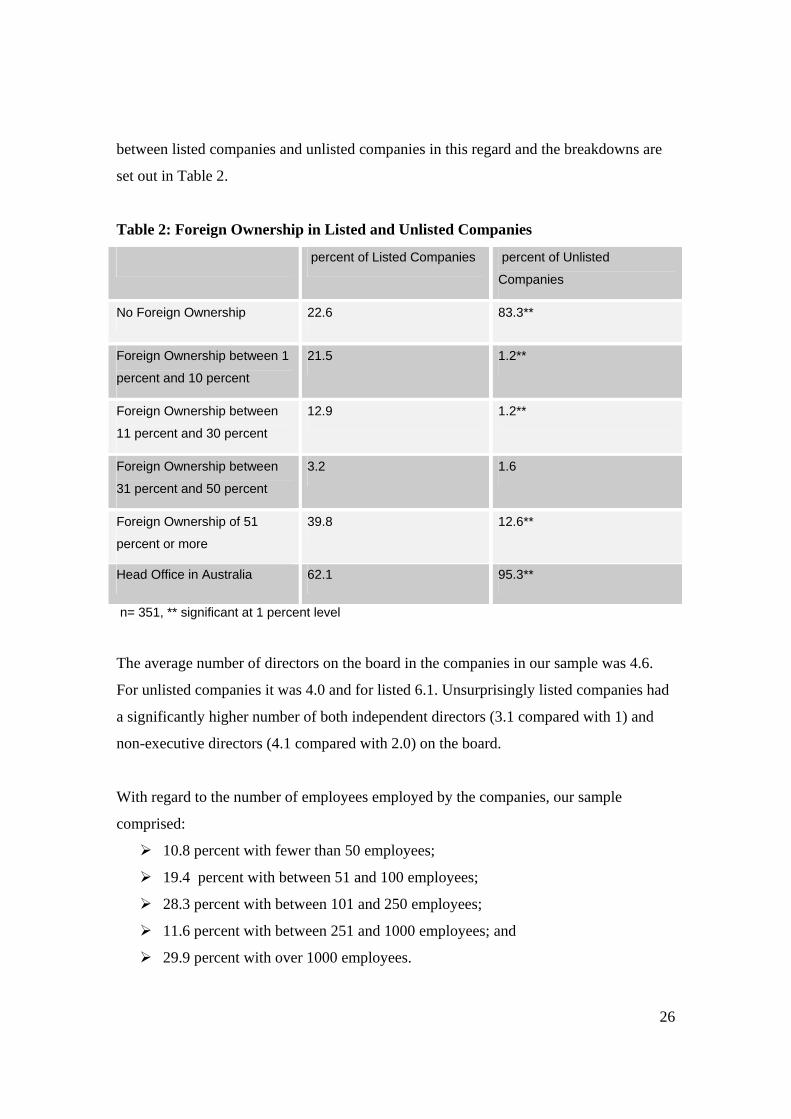
Twenty percent of the sample overall had foreign ownership of 51 percent or more and
86.2 percent had an Australian head office. Again there were significant differences
26
between listed companies and unlisted companies in this regard and the breakdowns are
set out in Table 2.
Table 2: Foreign Ownership in Listed and Unlisted Companies
percent of Listed Companies percent of Unlisted
Companies
No Foreign Ownership 22.6 83.3**
Foreign Ownership between 1
percent and 10 percent
21.5 1.2**
Foreign Ownership between
11 percent and 30 percent
12.9 1.2**
Foreign Ownership between
31 percent and 50 percent
3.2 1.6
Foreign Ownership of 51
percent or more
39.8 12.6**
Head Office in Australia 62.1 95.3**
n= 351, ** significant at 1 percent level
The average number of directors on the board in the companies in our sample was 4.6.
For unlisted companies it was 4.0 and for listed 6.1. Unsurprisingly listed companies had
a significantly higher number of both independent directors (3.1 compared with 1) and
non-executive directors (4.1 compared with 2.0) on the board.
With regard to the number of employees employed by the companies, our sample
comprised:
10.8 percent with fewer than 50 employees;
19.4 percent with between 51 and 100 employees;
28.3 percent with between 101 and 250 employees;
11.6 percent with between 251 and 1000 employees; and
29.9 percent with over 1000 employees.

27
The population we sent the survey to was fairly evenly divided between companies with
between 50 and 100 employees, between 101 and 250 employees and with over 250
employees. Our sample is therefore, slightly over-represented in the 250 or over
employees’ category and slightly under-represented in the 50 to 100 category.
More than half the companies had increased the number of staff in the past year (57.3
percent) while 25.9 percent had remained about the same and 16.8 percent had decreased
the number of staff over that period. The mean percentage of staff represented by trade
unions in the sample was 20.1 percent. We asked directors to identify the main
mechanisms by which the company determined the terms and conditions of its staff. As
Table 3 sets out, most directors reported the use of more than one mechanism.
Table 3: Mechanisms for Setting Terms and Conditions of Employment
n=375
Only a very small proportion (7.5 percent) of directors reported that their company’s
board included an employee representative.
We asked directors about the dominant form of finance for the company and the time
frame for debt financing. The most common form of finance was retained earnings (51.3
Main Mechanisms for Terms and Conditions Mean percent of
Employees Covered
Enterprise Agreement with Union 40.8
Enterprise Agreement directly with Staff 45.1
Common Law Individual Contract 55.4
Australian Workplace Agreement (AWA) 47.2
Award only 52.7
Other 41.3
28
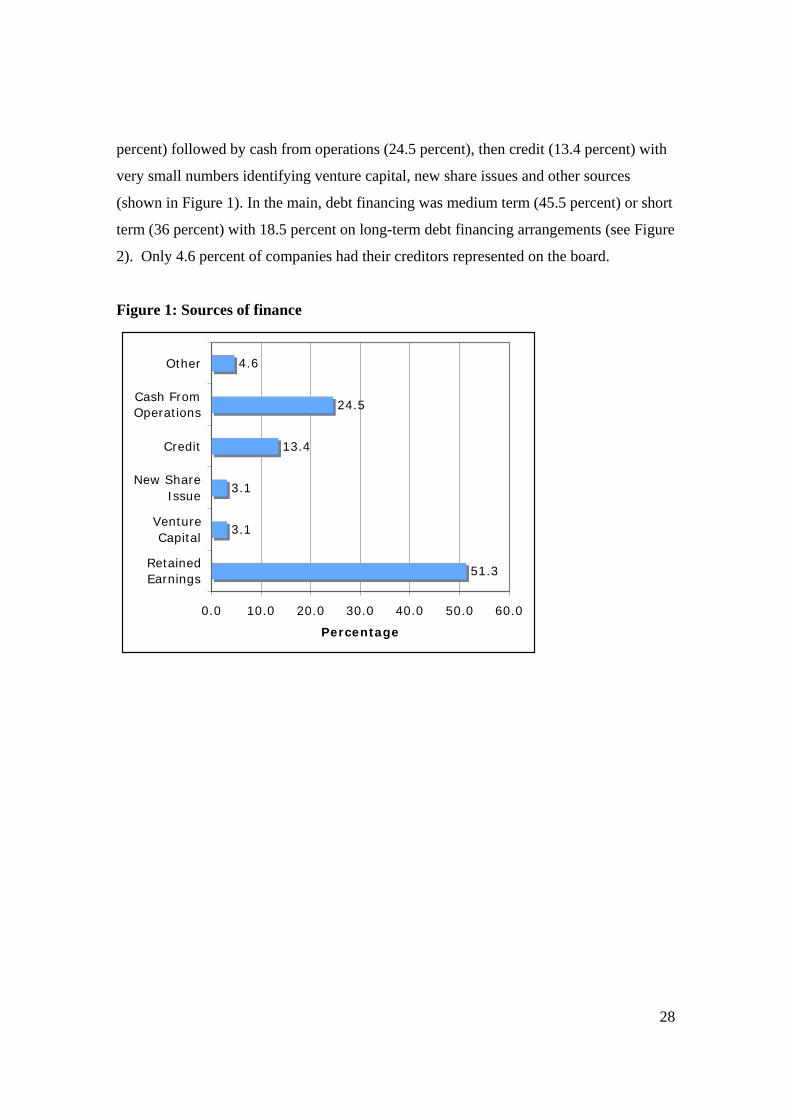
percent) followed by cash from operations (24.5 percent), then credit (13.4 percent) with
very small numbers identifying venture capital, new share issues and other sources
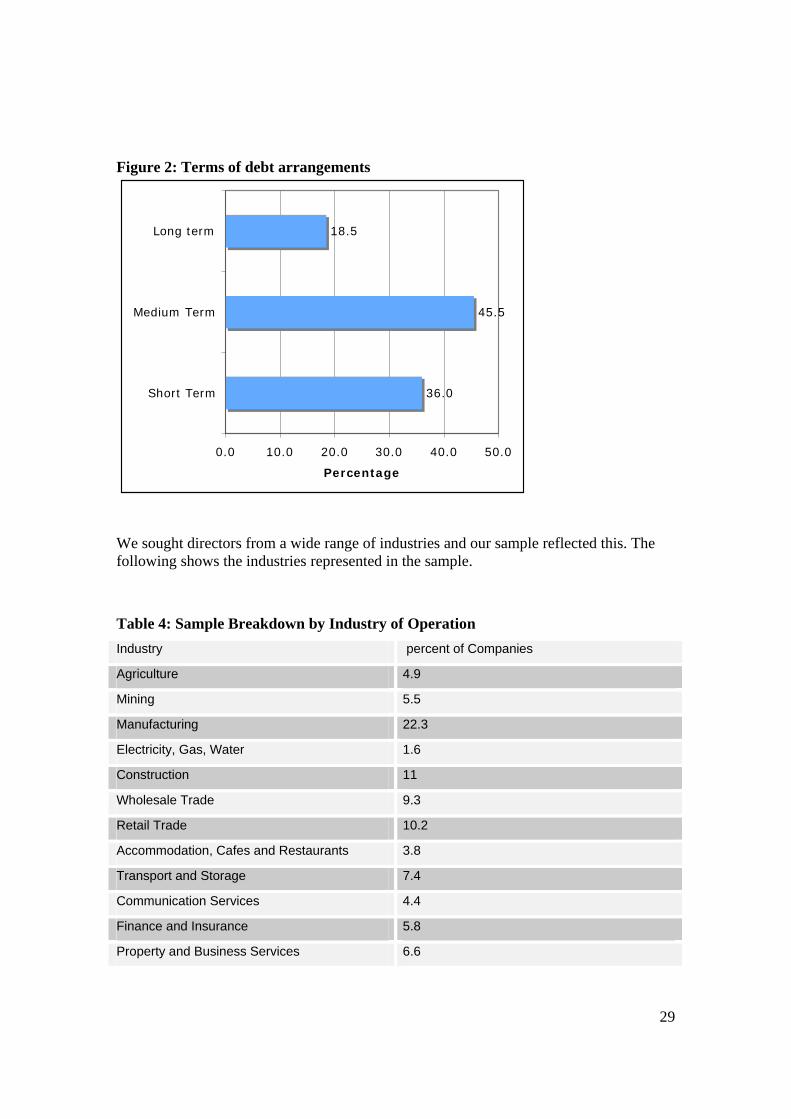
(shown in Figure 1). In the main, debt financing was medium term (45.5 percent) or short
term (36 percent) with 18.5 percent on long-term debt financing arrangements (see Figure
2). Only 4.6 percent of companies had their creditors represented on the board.
Figure 1: Sources of finance
51.3
3.1
3.1
13.4
24.5
4.6
0.0 10.0 20.0 30.0 40.0 50.0 60.0
RetainedEarnings
VentureCapital
New ShareIssue
Credit
Cash FromOperations
Other
Percentage
29
Figure 2: Terms of debt arrangements
36.0
45.5
18.5
0.0 10.0 20.0 30.0 40.0 50.0
Short Term
Medium Term
Long term
Percentage
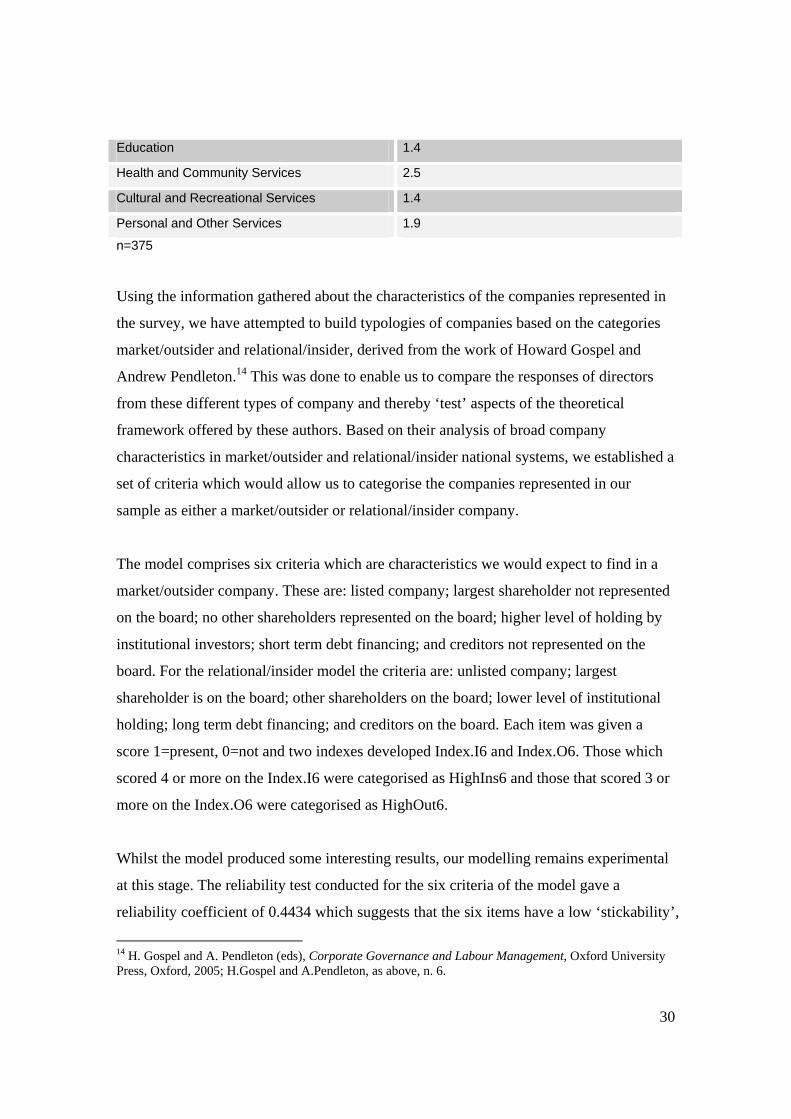
We sought directors from a wide range of industries and our sample reflected this. The following shows the industries represented in the sample.
Table 4: Sample Breakdown by Industry of Operation Industry percent of Companies
Agriculture 4.9
Mining 5.5
Manufacturing 22.3
Electricity, Gas, Water 1.6
Construction 11
Wholesale Trade 9.3
Retail Trade 10.2
Accommodation, Cafes and Restaurants 3.8
Transport and Storage 7.4
Communication Services 4.4
Finance and Insurance 5.8
Property and Business Services 6.6
30
Education 1.4
Health and Community Services 2.5
Cultural and Recreational Services 1.4
Personal and Other Services 1.9
n=375
Using the information gathered about the characteristics of the companies represented in
the survey, we have attempted to build typologies of companies based on the categories
market/outsider and relational/insider, derived from the work of Howard Gospel and
Andrew Pendleton.14 This was done to enable us to compare the responses of directors
from these different types of company and thereby ‘test’ aspects of the theoretical
framework offered by these authors. Based on their analysis of broad company
characteristics in market/outsider and relational/insider national systems, we established a
set of criteria which would allow us to categorise the companies represented in our
sample as either a market/outsider or relational/insider company.
The model comprises six criteria which are characteristics we would expect to find in a
market/outsider company. These are: listed company; largest shareholder not represented
on the board; no other shareholders represented on the board; higher level of holding by
institutional investors; short term debt financing; and creditors not represented on the
board. For the relational/insider model the criteria are: unlisted company; largest
shareholder is on the board; other shareholders on the board; lower level of institutional
holding; long term debt financing; and creditors on the board. Each item was given a
score 1=present, 0=not and two indexes developed Index.I6 and Index.O6. Those which
scored 4 or more on the Index.I6 were categorised as HighIns6 and those that scored 3 or
more on the Index.O6 were categorised as HighOut6.
Whilst the model produced some interesting results, our modelling remains experimental
at this stage. The reliability test conducted for the six criteria of the model gave a
reliability coefficient of 0.4434 which suggests that the six items have a low ‘stickability’,
14 H. Gospel and A. Pendleton (eds), Corporate Governance and Labour Management, Oxford University Press, Oxford, 2005; H.Gospel and A.Pendleton, as above, n. 6.

31
that is, they do not truly belong together. Removing the criteria relating to debt financing
would improve the model (alpha .5143). For the purposes of this research report, however,
we worked with our original model despite its limitations and the results of further
analysis and improvements to the model will be presented in further publications by the
project team.
32
6. Directors’ Understanding of Their Duties as Directors
One of the central aims of the survey was to explore directors’ understandings of their
legal obligations and the way that this might affect their approach to stakeholders. We
were particularly interested in the extent to which shareholders were perceived to be the
most important among several stakeholders. We hypothesised that directors would
perceive that their primary obligation was to shareholders in the short term and that this
would partly be a result of their understanding of their obligations as a director. This
section presents the survey findings on these matters.
In order to set these findings in their legal context, we note that directors’ legal
obligations are owed not to the shareholders as such, but to the company.15 Directors are
legally required to act in the best interests of the company. The interests of the company
are usually regarded by courts as those of the company’s shareholders.16 However, recent
Australian government inquiries have confirmed the legal competence of directors to
adopt a broader set of interests in pursuing corporate strategy.17 Directors are, under the
common law and the Corporations Act, accountable to shareholders in some important
respects, but this does not mean that their interests must always be preferred over other
stakeholders,18 and the limited control rights which shareholders enjoy are, in themselves,
usually too restricted to enable them to dictate corporate strategy to that end.19
We asked directors to indicate which of four statements best represented their
understanding of their obligation to act in the best interests of the company. We also
15 Section 181(1) of the Corporations Act requires directors and other company officers to exercise their powers and discharge their duties ‘in good faith in the best interests of the corporation”. For analysis of the meaning of the ‘interests of the corporation” see R.P. Austin, H.A.J. Ford and I.M Ramsay, Company Directors: Principles of Law and Corporate Governance, LexisNexis Butterworths, Sydney, 2005, Ch 7. 16 Ford, Austin and Ramsay, above n 15, Ch 7. 17 See Corporations and Markets Advisory Committee, The Social Responsibility of Corporations, Report, December 2006, Chapter 3; Parliamentary Joint Committee on Corporations and Financial Services, Corporate Responsibility: Managing Risk and Creating Value, June 2006, Senate Printing Unit, Canberra. 18 See Deakin above, n. 8 at pp.81-82. 19 See Mitchell, O’Donnell and Ramsay, above n. 3, pp. 431-439; Deakin, above n. 8, pp. 81-89; M. Blair and L. Stout, ‘Specific Investment and Corporate Law’ (2006) 7 European Business Organisation Law Review 473.
33
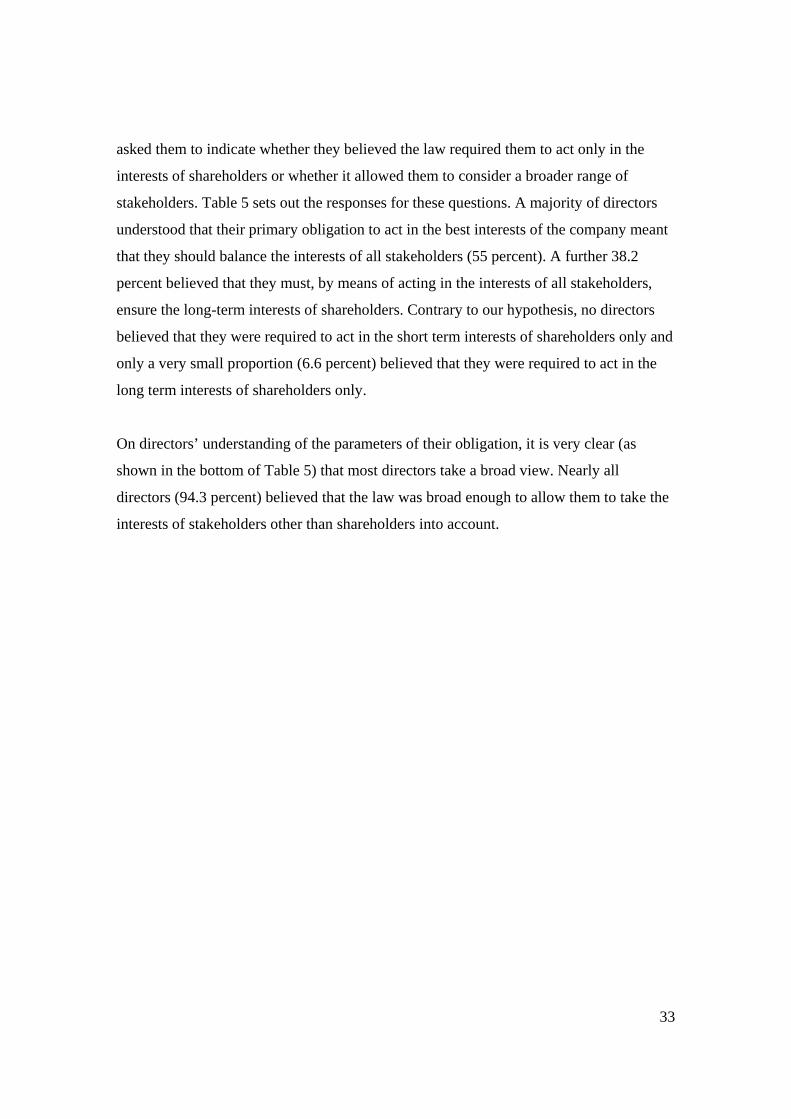
asked them to indicate whether they believed the law required them to act only in the
interests of shareholders or whether it allowed them to consider a broader range of
stakeholders. Table 5 sets out the responses for these questions. A majority of directors
understood that their primary obligation to act in the best interests of the company meant
that they should balance the interests of all stakeholders (55 percent). A further 38.2
percent believed that they must, by means of acting in the interests of all stakeholders,
ensure the long-term interests of shareholders. Contrary to our hypothesis, no directors
believed that they were required to act in the short term interests of shareholders only and
only a very small proportion (6.6 percent) believed that they were required to act in the
long term interests of shareholders only.
On directors’ understanding of the parameters of their obligation, it is very clear (as
shown in the bottom of Table 5) that most directors take a broad view. Nearly all
directors (94.3 percent) believed that the law was broad enough to allow them to take the
interests of stakeholders other than shareholders into account.
34
Table 5: Directors’ Understanding of the Scope of Directors’ Duties
Primary Obligation: I must act in the best interests of
the company and this means acting in the….
percent Yes
Short term interests of shareholders only 0.0
Long term interests of shareholders only 6.6
Interests of all stakeholders to achieve short term
interests of shareholders
0.3
Interests of all stakeholders to achieve long term
interests of shareholders
38.2
Balancing the interests of all stakeholders 55
Parameters of Law on Directors’ Duties percent Yes
I must only be concerned with shareholders’ interests 5.7
Allows me to take account of interests other than
shareholders
94.3
n=368
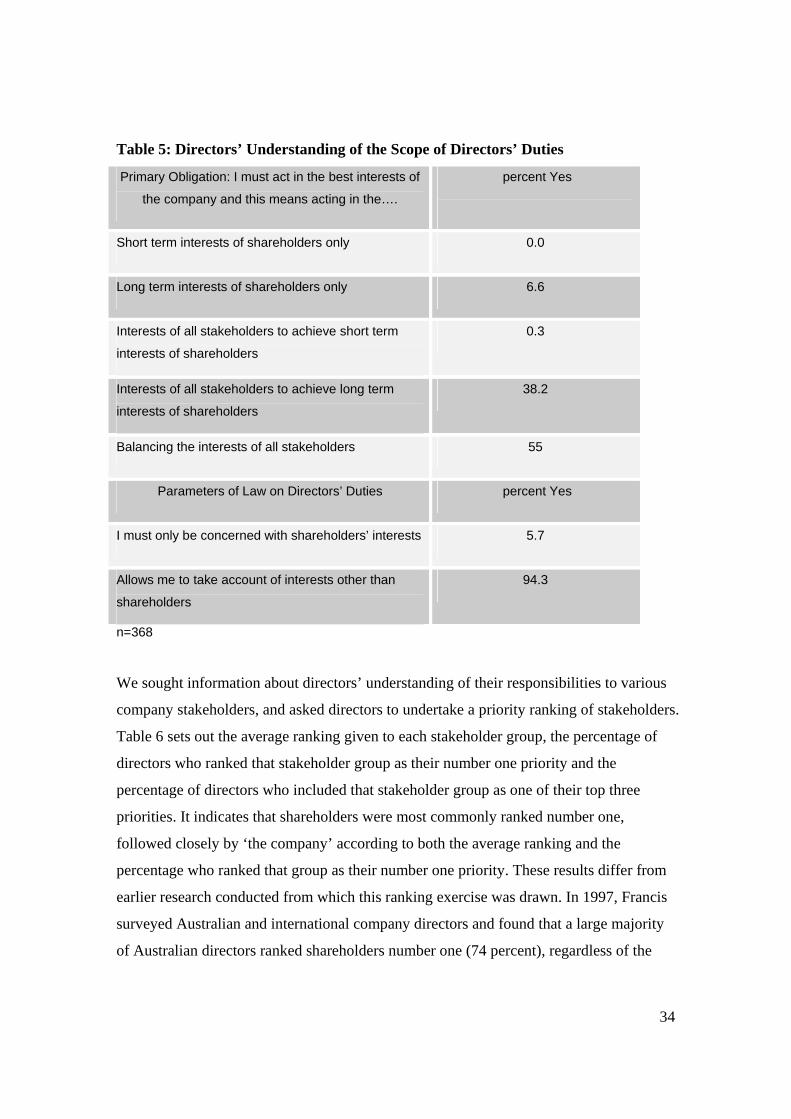
We sought information about directors’ understanding of their responsibilities to various
company stakeholders, and asked directors to undertake a priority ranking of stakeholders.
Table 6 sets out the average ranking given to each stakeholder group, the percentage of
directors who ranked that stakeholder group as their number one priority and the
percentage of directors who included that stakeholder group as one of their top three
priorities. It indicates that shareholders were most commonly ranked number one,
followed closely by ‘the company’ according to both the average ranking and the
percentage who ranked that group as their number one priority. These results differ from
earlier research conducted from which this ranking exercise was drawn. In 1997, Francis
surveyed Australian and international company directors and found that a large majority
of Australian directors ranked shareholders number one (74 percent), regardless of the
35
fact that their actual legal obligation was to the company.20 We found that employees
were highly ranked based on the average ranking given (2.87). However, very few
directors (6.7 percent) ranked employees as their number one priority.
Table 6: Priority Ranking of Company Stakeholders Stakeholder Average Ranking# Percentage
Ranked 1
Percentage included
in Top 3
1. Shareholders 2.23 44.0 78.2
2. The Company 2.25 40.4 71.1
3. Employees 2.87 6.7 72.8
4. Customers 3.53 8.2 44.8
5. Suppliers 5.99 1.2 3.9
6. Lender/Creditors 5.83 0.6 10.6
7. The Community 6.43 0.3 3.4
8. The Environment 7.07 0.6 2.0
9. The Country 8.41 0.3 1.1
n=356
# Directors were asked to rank the list of stakeholders in order of priority between 1 and 9 with 1
being highest priority. The smaller the average rank, the higher the priority.
20 Francis, above n. 4.
36
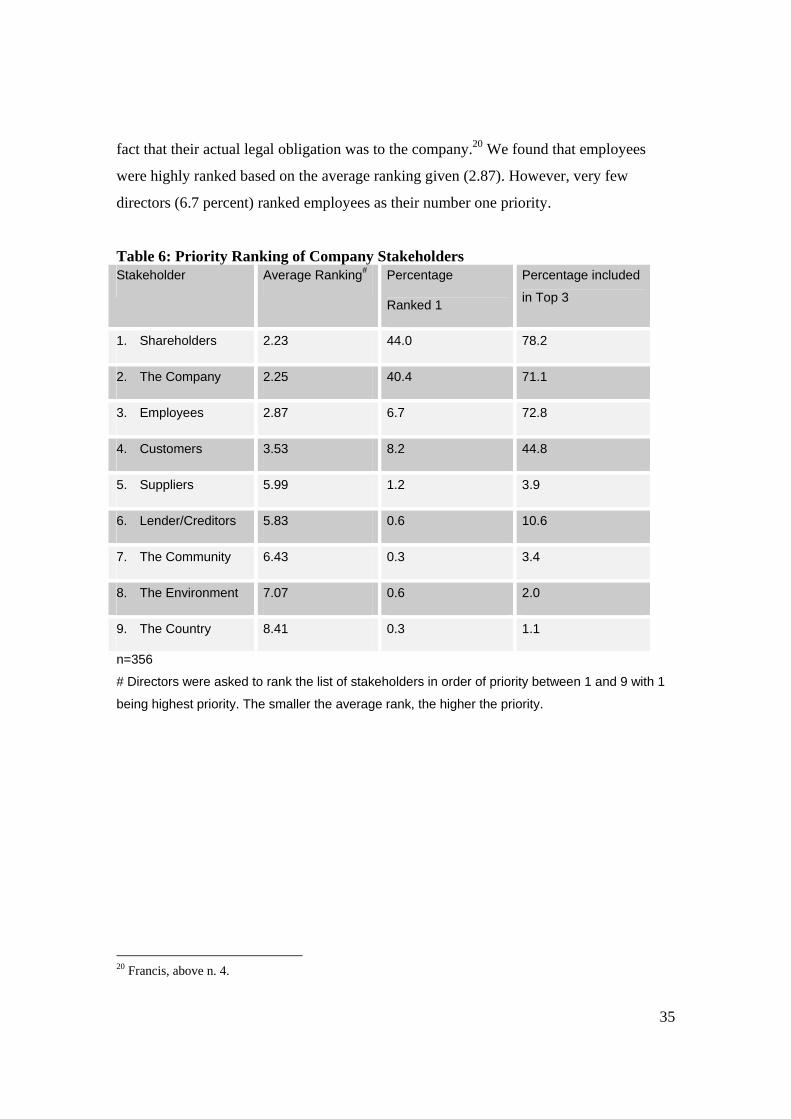
7. Directors’ Priorities
To gain further insight into the way that directors balance their priorities among
particular stakeholders, we sought information about directors’ priorities with respect to
certain policy items. We asked directors to rate a list of items on a scale ranging from
‘not important’ to ‘very important’. In addition, we asked directors to indicate what their
priority actions would be in the event of either an improvement or deterioration in the
financial performance of the company. Our hypothesis was, reflecting the supposition of
the existence of a ‘shareholder primacy’ norm, that directors would place a higher value
on the matters which were directed toward the interests of shareholders, such as ‘dividend
policy’, ‘increasing share price’, ‘reducing costs’ and ‘special dividends’.
Table 7 sets out the proportion of directors who identified each ‘matter’ as either ‘most
important’ or ‘very important’. The most important matters for directors were ‘ensuring
customers/clients are satisfied’ (97.4 percent of directors), ‘growing the business’ (95.4
percent), and ‘ensuring employees are fairly treated’ (94.2 percent). Less than half of the
directors surveyed felt that ‘increasing share price’ or ‘dividend policy’ were important to
them. It is also noteworthy that a larger proportion of directors valued those matters
which may be regarded as being particularly directed to the interests of employees such
as ‘improving employee morale’ (87.3 percent) and ‘safeguarding existing employees’
jobs’ (66.2 percent) than items of specific relevance to shareholders.

37
Table 7: Importance to You as a Director
Item Percentage of Whole Sample Important#
Ensuring Customers/Clients are Satisfied 97.4
Growing the Business 95.4
Ensuring Employees are Fairly Treated 94.2
Improving Productivity 92.8
Improving Employee Morale 87.3
Reducing Costs 80.1
Ensuring Other Stakeholders are Satisfied 67.2
Safeguarding Existing Employee Jobs 66.2
Diversifying and Expanding into New Markets 48.8
Creating Job Opportunities within the
Company
46.3
Increasing Share Price 45.0
Dividend Policy 41.0
Making a Contribution to Society 32.1
Special Dividends 6.6
# Where rated either most, or very important, n=351
To ascertain the extent to which these matters of importance varied according to the
characteristics of the company of which the respondent was director, we cross tabulated
the findings against three company variables: whether the company was listed or unlisted;
whether it was public or proprietary; and whether it fitted the model of market/outsider or
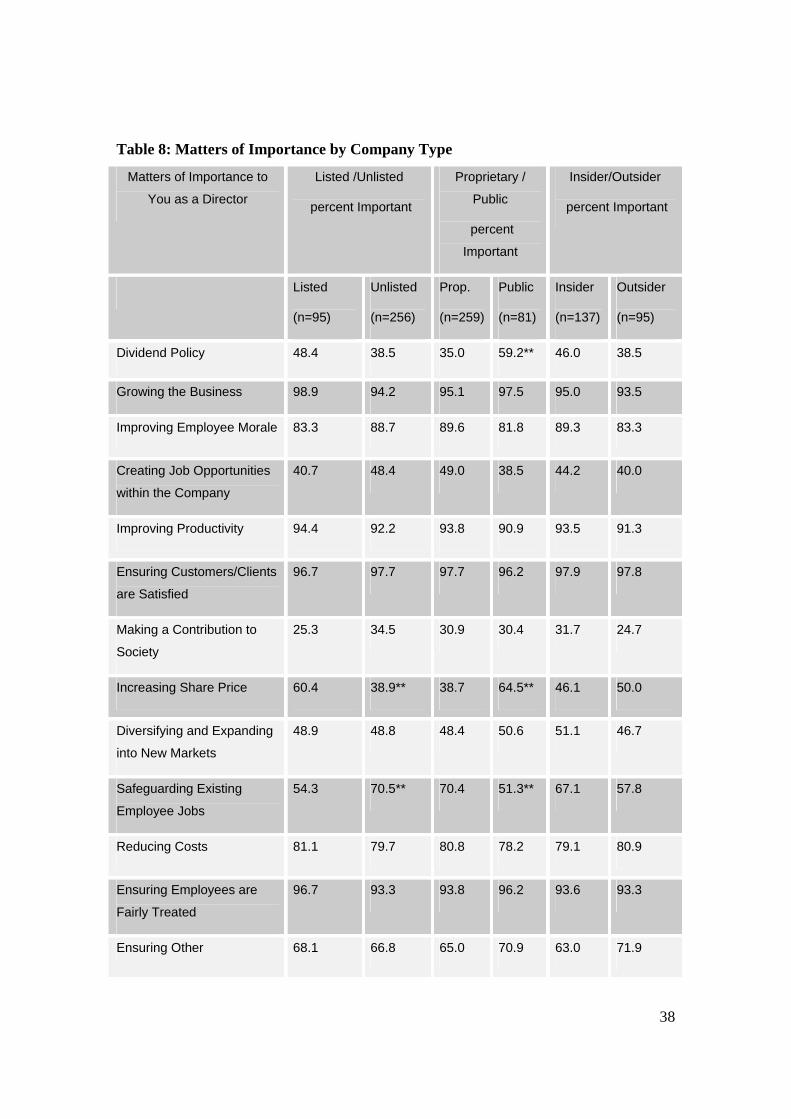
relational/insider. Table 8 shows these breakdowns.
38
Table 8: Matters of Importance by Company Type
Matters of Importance to
You as a Director
Listed /Unlisted
percent Important
Proprietary /
Public
percent
Important
Insider/Outsider
percent Important
Listed
(n=95)
Unlisted
(n=256)
Prop.
(n=259)
Public
(n=81)
Insider
(n=137)
Outsider
(n=95)
Dividend Policy 48.4 38.5 35.0 59.2** 46.0 38.5
Growing the Business 98.9 94.2 95.1 97.5 95.0 93.5
Improving Employee Morale 83.3 88.7 89.6 81.8 89.3 83.3
Creating Job Opportunities
within the Company
40.7 48.4 49.0 38.5 44.2 40.0
Improving Productivity 94.4 92.2 93.8 90.9 93.5 91.3
Ensuring Customers/Clients
are Satisfied
96.7 97.7 97.7 96.2 97.9 97.8
Making a Contribution to
Society
25.3 34.5 30.9 30.4 31.7 24.7
Increasing Share Price 60.4 38.9** 38.7 64.5** 46.1 50.0
Diversifying and Expanding
into New Markets
48.9 48.8 48.4 50.6 51.1 46.7
Safeguarding Existing
Employee Jobs
54.3 70.5** 70.4 51.3** 67.1 57.8
Reducing Costs 81.1 79.7 80.8 78.2 79.1 80.9
Ensuring Employees are
Fairly Treated
96.7 93.3 93.8 96.2 93.6 93.3
Ensuring Other 68.1 66.8 65.0 70.9 63.0 71.9
39
Matters of Importance to
You as a Director
Listed /Unlisted
percent Important
Proprietary /
Public
percent
Important
Insider/Outsider
percent Important
Listed
(n=95)
Unlisted
(n=256)
Prop.
(n=259)
Public
(n=81)
Insider
(n=137)
Outsider
(n=95)
Stakeholders are Satisfied
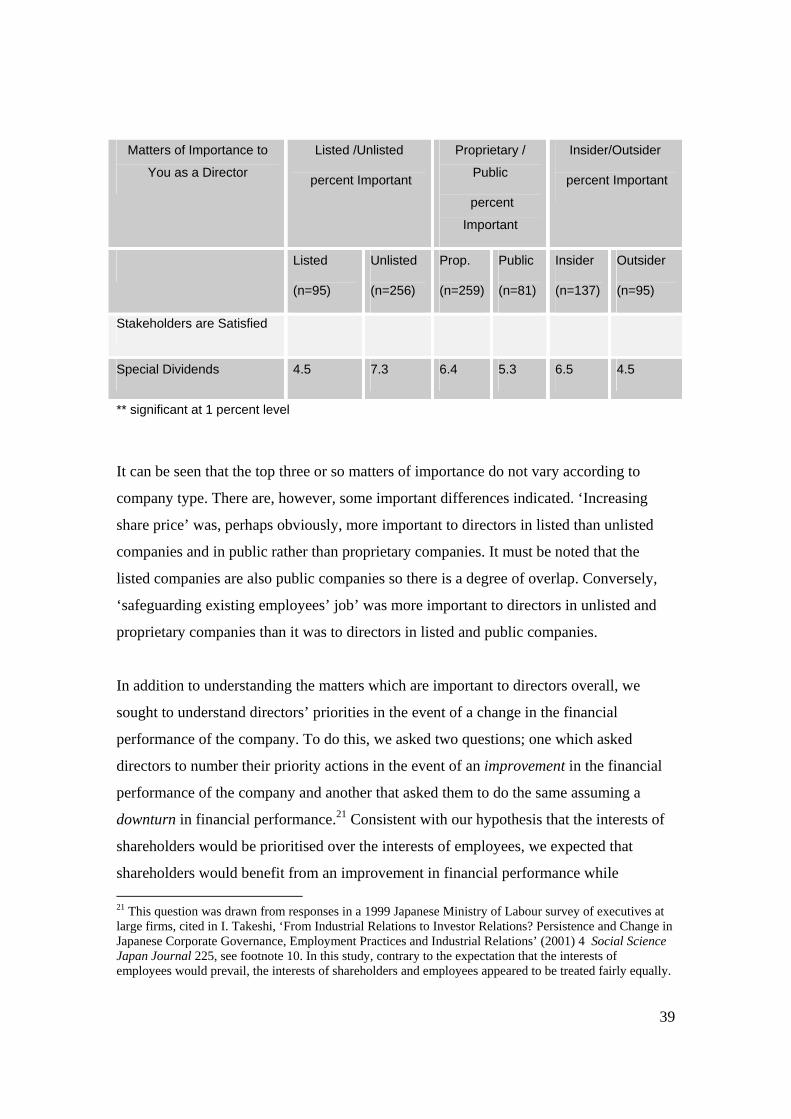
Special Dividends 4.5 7.3 6.4 5.3 6.5 4.5
** significant at 1 percent level
It can be seen that the top three or so matters of importance do not vary according to
company type. There are, however, some important differences indicated. ‘Increasing
share price’ was, perhaps obviously, more important to directors in listed than unlisted
companies and in public rather than proprietary companies. It must be noted that the
listed companies are also public companies so there is a degree of overlap. Conversely,
‘safeguarding existing employees’ job’ was more important to directors in unlisted and
proprietary companies than it was to directors in listed and public companies.
In addition to understanding the matters which are important to directors overall, we
sought to understand directors’ priorities in the event of a change in the financial
performance of the company. To do this, we asked two questions; one which asked
directors to number their priority actions in the event of an improvement in the financial
performance of the company and another that asked them to do the same assuming a
downturn in financial performance.21 Consistent with our hypothesis that the interests of
shareholders would be prioritised over the interests of employees, we expected that
shareholders would benefit from an improvement in financial performance while 21 This question was drawn from responses in a 1999 Japanese Ministry of Labour survey of executives at large firms, cited in I. Takeshi, ‘From Industrial Relations to Investor Relations? Persistence and Change in Japanese Corporate Governance, Employment Practices and Industrial Relations’ (2001) 4 Social Science Japan Journal 225, see footnote 10. In this study, contrary to the expectation that the interests of employees would prevail, the interests of shareholders and employees appeared to be treated fairly equally.
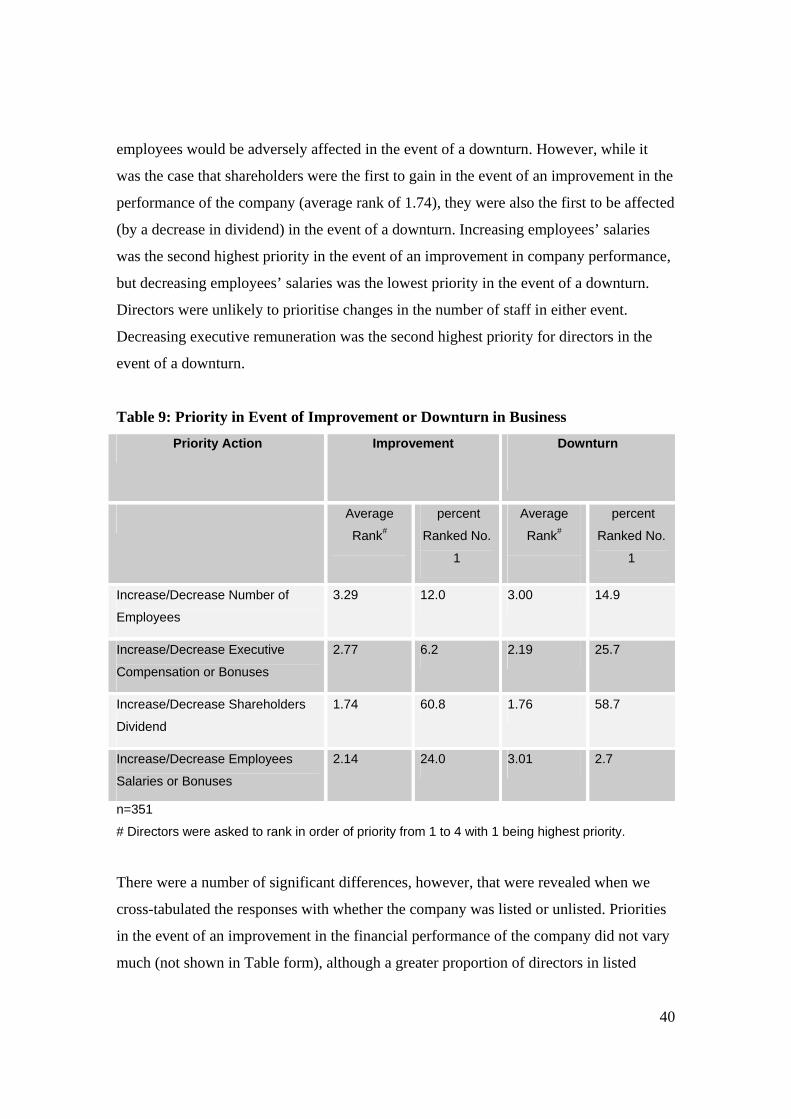
40
employees would be adversely affected in the event of a downturn. However, while it
was the case that shareholders were the first to gain in the event of an improvement in the
performance of the company (average rank of 1.74), they were also the first to be affected
(by a decrease in dividend) in the event of a downturn. Increasing employees’ salaries
was the second highest priority in the event of an improvement in company performance,
but decreasing employees’ salaries was the lowest priority in the event of a downturn.
Directors were unlikely to prioritise changes in the number of staff in either event.
Decreasing executive remuneration was the second highest priority for directors in the
event of a downturn.
Table 9: Priority in Event of Improvement or Downturn in Business
Priority Action Improvement
Downturn
Average
Rank#
percent
Ranked No.
1
Average
Rank#
percent
Ranked No.
1
Increase/Decrease Number of
Employees
3.29 12.0 3.00 14.9
Increase/Decrease Executive
Compensation or Bonuses
2.77 6.2 2.19 25.7
Increase/Decrease Shareholders
Dividend
1.74 60.8 1.76 58.7
Increase/Decrease Employees
Salaries or Bonuses
2.14 24.0 3.01 2.7
n=351
# Directors were asked to rank in order of priority from 1 to 4 with 1 being highest priority.
There were a number of significant differences, however, that were revealed when we
cross-tabulated the responses with whether the company was listed or unlisted. Priorities
in the event of an improvement in the financial performance of the company did not vary
much (not shown in Table form), although a greater proportion of directors in listed
41
companies than directors in unlisted companies prioritised an increase in the shareholder
dividend in the event of an improvement. However, for directors in both types of
company, this was still the number one priority when measured by average rank (average
rank of 1.48 in listed companies with 71.6 percent of directors ranking it number one,
compared with average rank of 1.83 and 56.8 percent of directors in unlisted companies).
These figures are not shown in Table form.
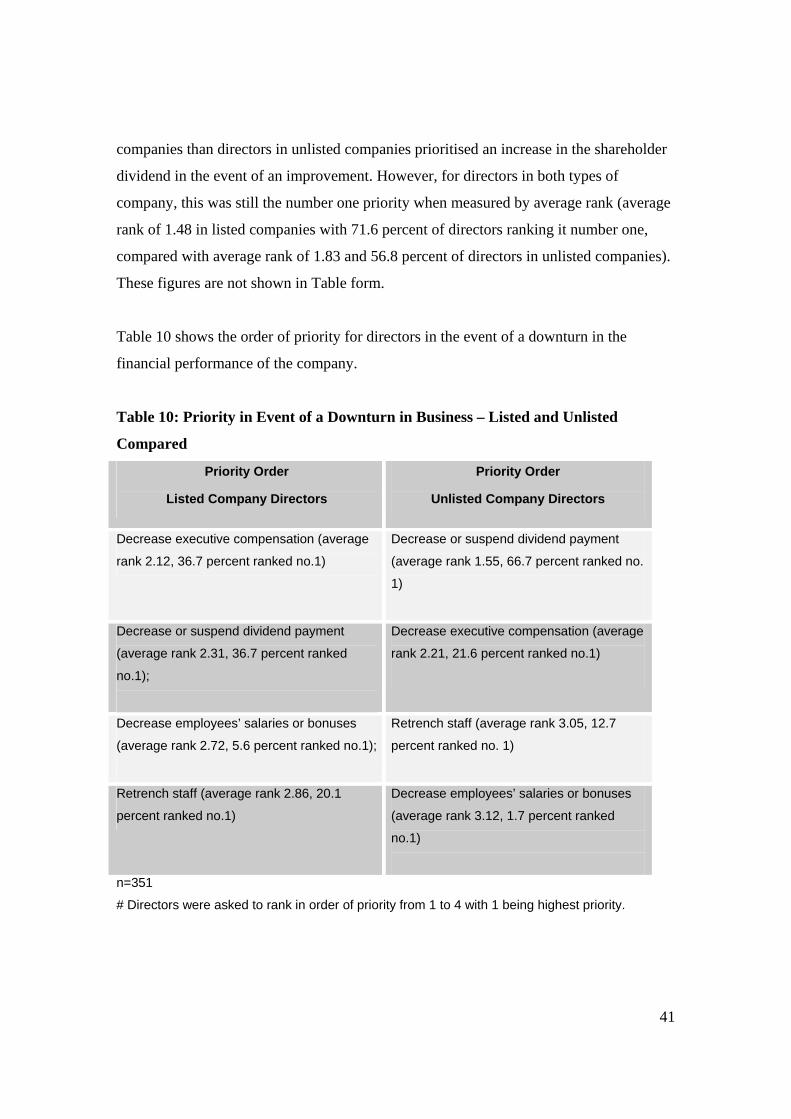
Table 10 shows the order of priority for directors in the event of a downturn in the
financial performance of the company.
Table 10: Priority in Event of a Downturn in Business – Listed and Unlisted
Compared
Priority Order
Listed Company Directors
Priority Order
Unlisted Company Directors
Decrease executive compensation (average
rank 2.12, 36.7 percent ranked no.1)
Decrease or suspend dividend payment
(average rank 1.55, 66.7 percent ranked no.
1)
Decrease or suspend dividend payment
(average rank 2.31, 36.7 percent ranked
no.1);
Decrease executive compensation (average
rank 2.21, 21.6 percent ranked no.1)
Decrease employees’ salaries or bonuses
(average rank 2.72, 5.6 percent ranked no.1);
Retrench staff (average rank 3.05, 12.7
percent ranked no. 1)
Retrench staff (average rank 2.86, 20.1
percent ranked no.1)
Decrease employees’ salaries or bonuses
(average rank 3.12, 1.7 percent ranked
no.1)
n=351
# Directors were asked to rank in order of priority from 1 to 4 with 1 being highest priority.
42
There were statistically significant differences between listed and unlisted companies
with regard to the average rank of both ‘decrease employees’ salaries or bonuses’ and
‘decrease or suspend dividend payments’ with listed companies more likely to prioritise a
decrease in employees’ salaries and less likely to prioritise a decrease in dividend to
shareholders, with the reverse true of unlisted companies. Overall, directors in both listed
and unlisted companies are more likely to prioritise actions affecting shareholders or
executives than actions affecting lower level employees.
43
8. The Company’s Relationship with Shareholders
The survey sought information from directors about the relationship the company had
with its shareholders. In particular, we sought information about the frequency of
dealings with shareholders, the main points of contact between shareholders and the
company, the types of issues raised with management by shareholders and whether there
had been areas of tension between the company and its shareholders. We hoped that these
questions would assist us to understand the influence of shareholders, the way in which
shareholders make their demands felt and the type of matters about which shareholders
raise concerns. We combined these questions with other questions which measured
relative shareholder, employee and creditor influence or ‘salience’.
A majority of directors indicated that the person who dealt most frequently with
shareholders was the Chief Executive Officer (CEO) or managing director; this was the
case in 77.5 percent of cases. The Chair of the board of directors was the next most
commonly indicated with 16.2 percent followed by the Chief Financial Officer or other
senior management (3.7 percent) and other board members (2.6 percent). Nearly half of
the sample indicated that that person would deal with shareholders on a daily (23.2
percent) or weekly (22.1 percent) basis. A further 29.8 percent indicated that they would
deal with shareholders on a monthly basis and 17.5 percent would do so bi-annually or
annually. The frequency of dealing with shareholders is significantly different between
listed and unlisted companies. Some 49.8 percent of directors in unlisted companies
indicated daily or weekly contact with shareholders compared with 37.2 percent of
directors in listed companies.
44
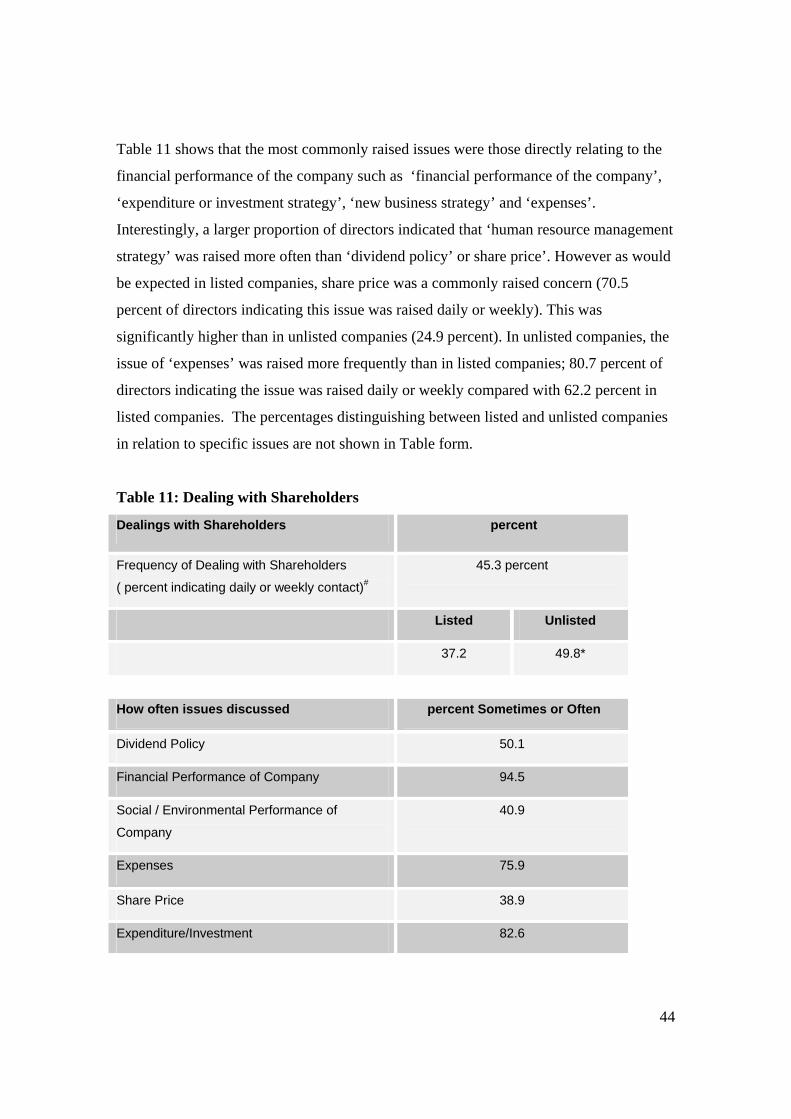
Table 11 shows that the most commonly raised issues were those directly relating to the
financial performance of the company such as ‘financial performance of the company’,
‘expenditure or investment strategy’, ‘new business strategy’ and ‘expenses’.
Interestingly, a larger proportion of directors indicated that ‘human resource management
strategy’ was raised more often than ‘dividend policy’ or share price’. However as would
be expected in listed companies, share price was a commonly raised concern (70.5
percent of directors indicating this issue was raised daily or weekly). This was
significantly higher than in unlisted companies (24.9 percent). In unlisted companies, the
issue of ‘expenses’ was raised more frequently than in listed companies; 80.7 percent of
directors indicating the issue was raised daily or weekly compared with 62.2 percent in
listed companies. The percentages distinguishing between listed and unlisted companies
in relation to specific issues are not shown in Table form.
Table 11: Dealing with Shareholders
Dealings with Shareholders percent
Frequency of Dealing with Shareholders
( percent indicating daily or weekly contact)#
45.3 percent
Listed Unlisted
37.2 49.8*
How often issues discussed percent Sometimes or Often
Dividend Policy 50.1
Financial Performance of Company 94.5
Social / Environmental Performance of
Company
40.9
Expenses 75.9
Share Price 38.9
Expenditure/Investment 82.6
45
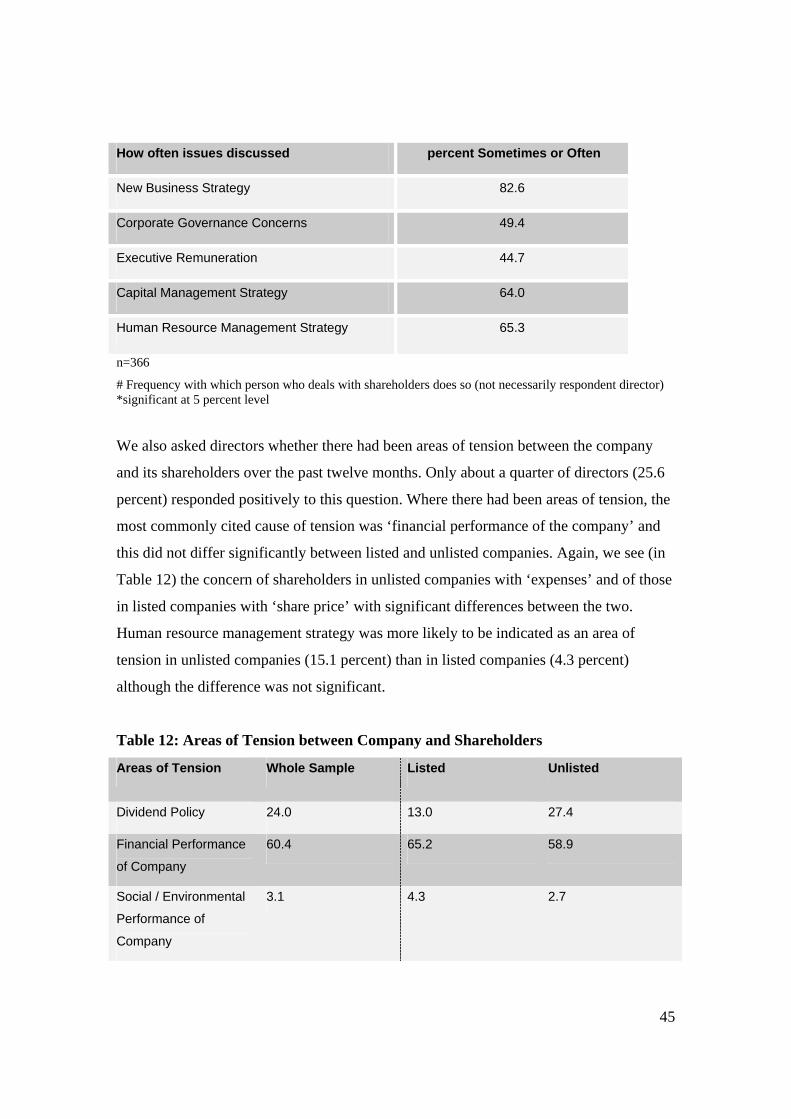
How often issues discussed percent Sometimes or Often
New Business Strategy 82.6
Corporate Governance Concerns 49.4
Executive Remuneration 44.7
Capital Management Strategy 64.0
Human Resource Management Strategy 65.3
n=366
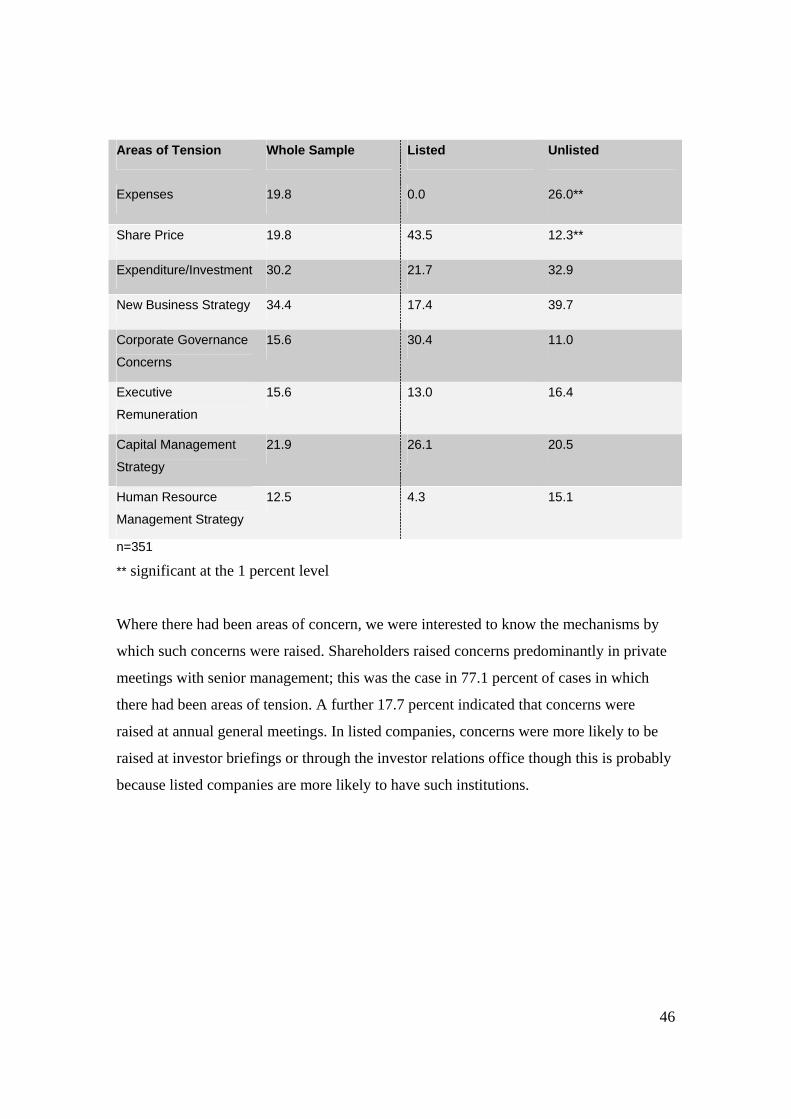
# Frequency with which person who deals with shareholders does so (not necessarily respondent director) *significant at 5 percent level We also asked directors whether there had been areas of tension between the company
and its shareholders over the past twelve months. Only about a quarter of directors (25.6
percent) responded positively to this question. Where there had been areas of tension, the
most commonly cited cause of tension was ‘financial performance of the company’ and
this did not differ significantly between listed and unlisted companies. Again, we see (in
Table 12) the concern of shareholders in unlisted companies with ‘expenses’ and of those
in listed companies with ‘share price’ with significant differences between the two.
Human resource management strategy was more likely to be indicated as an area of
tension in unlisted companies (15.1 percent) than in listed companies (4.3 percent)
although the difference was not significant.
Table 12: Areas of Tension between Company and Shareholders
Areas of Tension Whole Sample Listed Unlisted
Dividend Policy 24.0 13.0 27.4
Financial Performance
of Company
60.4 65.2 58.9
Social / Environmental
Performance of
Company
3.1 4.3 2.7
46
Areas of Tension Whole Sample Listed Unlisted
Expenses 19.8 0.0 26.0**
Share Price 19.8 43.5 12.3**
Expenditure/Investment 30.2 21.7 32.9
New Business Strategy 34.4 17.4 39.7
Corporate Governance
Concerns
15.6 30.4 11.0
Executive
Remuneration
15.6 13.0 16.4
Capital Management
Strategy
21.9 26.1 20.5
Human Resource
Management Strategy
12.5 4.3 15.1
n=351
** significant at the 1 percent level
Where there had been areas of concern, we were interested to know the mechanisms by
which such concerns were raised. Shareholders raised concerns predominantly in private
meetings with senior management; this was the case in 77.1 percent of cases in which
there had been areas of tension. A further 17.7 percent indicated that concerns were
raised at annual general meetings. In listed companies, concerns were more likely to be
raised at investor briefings or through the investor relations office though this is probably
because listed companies are more likely to have such institutions.
47
9. The Company’s Relationship with Employees
A central aim of the survey of directors was to gain an understanding of the relationship
between the company and its employees. Firstly, we sought to understand the role of law
in framing that relationship. Secondly, we aimed to investigate the institutional features
of the relationship between the company and its employees, such as where the human
resources function sits within the company structure (is there a centralised human
resource function, does the human resources manager report to the CEO or managing
director) and the types and frequency of issues relating to employees raised and
considered by the board. Our final area of investigation was in regard to the existence of
partnership style relations between the company and its employees.
To begin with the role of law in framing the relationship with employees, we asked
directors questions about their perception of the dominant source of their obligation to
employees and about the role of the law in the determination of their human resources
strategy.
48
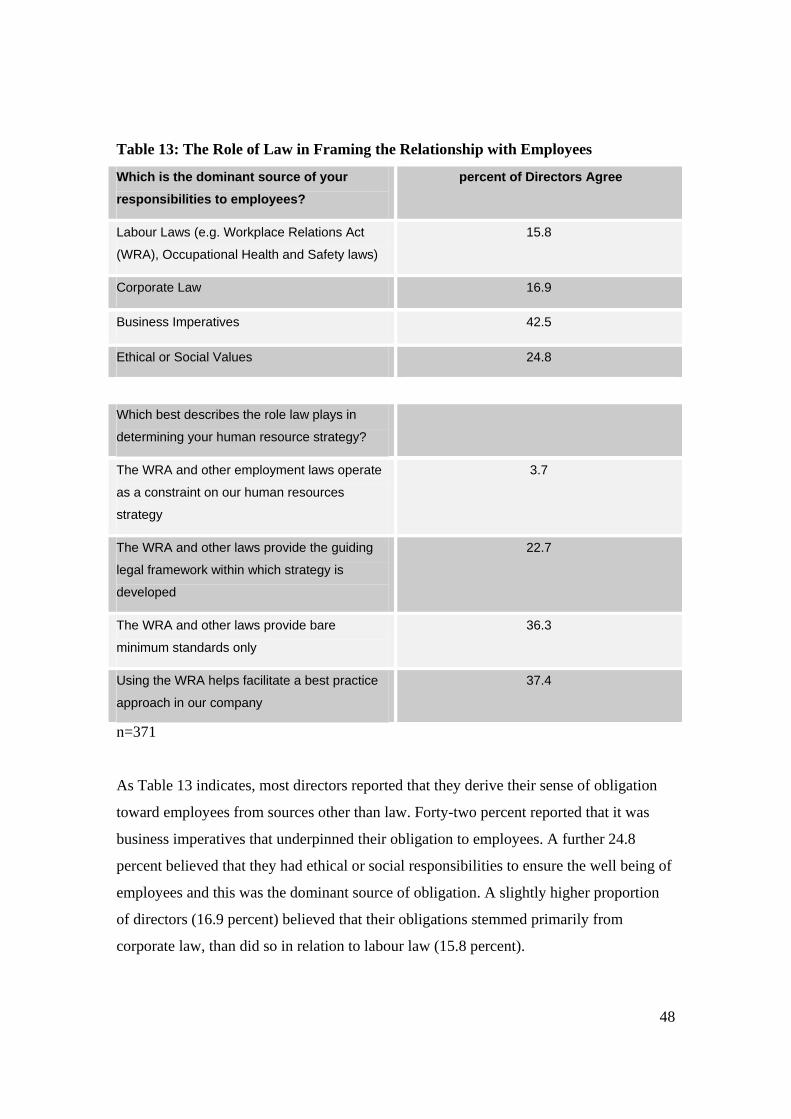
Table 13: The Role of Law in Framing the Relationship with Employees
Which is the dominant source of your responsibilities to employees?
percent of Directors Agree
Labour Laws (e.g. Workplace Relations Act
(WRA), Occupational Health and Safety laws)
15.8
Corporate Law 16.9
Business Imperatives 42.5
Ethical or Social Values 24.8
Which best describes the role law plays in
determining your human resource strategy?
The WRA and other employment laws operate
as a constraint on our human resources
strategy
3.7
The WRA and other laws provide the guiding
legal framework within which strategy is
developed
22.7
The WRA and other laws provide bare
minimum standards only
36.3
Using the WRA helps facilitate a best practice
approach in our company
37.4
n=371
As Table 13 indicates, most directors reported that they derive their sense of obligation
toward employees from sources other than law. Forty-two percent reported that it was
business imperatives that underpinned their obligation to employees. A further 24.8
percent believed that they had ethical or social responsibilities to ensure the well being of
employees and this was the dominant source of obligation. A slightly higher proportion
of directors (16.9 percent) believed that their obligations stemmed primarily from
corporate law, than did so in relation to labour law (15.8 percent).
49
When it comes to the role that law plays in determining the human resources strategy of
the company, directors are divided between seeing it as largely irrelevant and seeing it as
a ‘best practice’ guide. Just over a third of directors believed that the law had little role
beyond the provision of bare minimum standards (36.3 percent), while a similar
proportion believed that the opposite was the case; the law facilitated a ‘best practice’
approach to human resource management for these directors (37.4 percent). Very few
(3.7 percent) felt that labour law acted as a constraint and a further 22.7 percent believed
that labour law played a fairly neutral role: it provided the guiding legal framework
within which the human resources strategy was developed.
There were no significant differences between either listed or unlisted and insider or
outsider companies with regard to directors’ attitudes on the sources of obligation toward
employees.
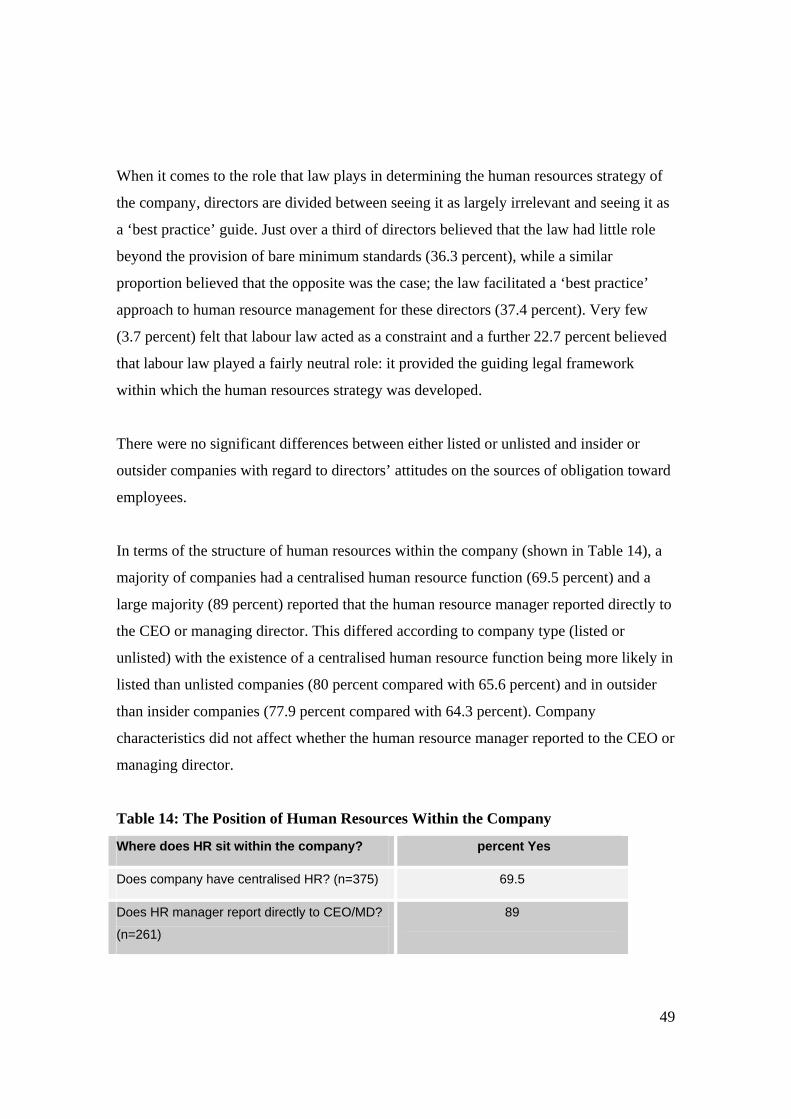
In terms of the structure of human resources within the company (shown in Table 14), a
majority of companies had a centralised human resource function (69.5 percent) and a
large majority (89 percent) reported that the human resource manager reported directly to
the CEO or managing director. This differed according to company type (listed or
unlisted) with the existence of a centralised human resource function being more likely in
listed than unlisted companies (80 percent compared with 65.6 percent) and in outsider
than insider companies (77.9 percent compared with 64.3 percent). Company
characteristics did not affect whether the human resource manager reported to the CEO or
managing director.
Table 14: The Position of Human Resources Within the Company
Where does HR sit within the company? percent Yes
Does company have centralised HR? (n=375) 69.5
Does HR manager report directly to CEO/MD?
(n=261)
89
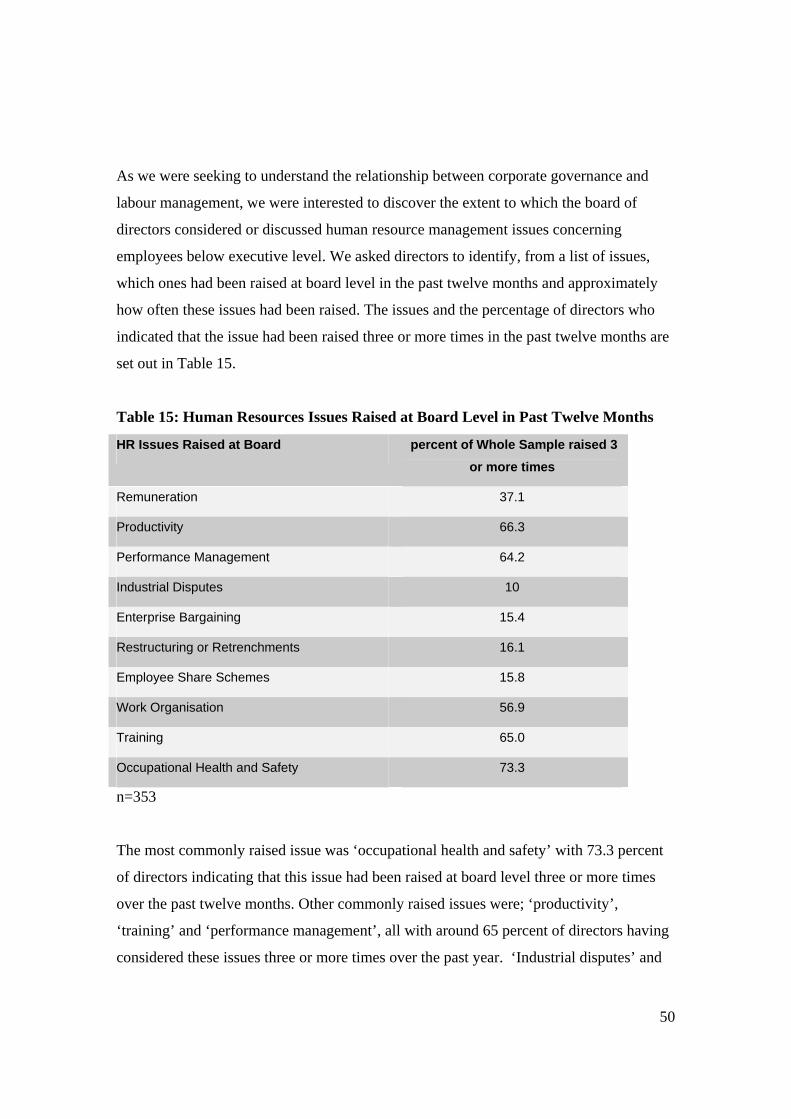
50
As we were seeking to understand the relationship between corporate governance and
labour management, we were interested to discover the extent to which the board of
directors considered or discussed human resource management issues concerning
employees below executive level. We asked directors to identify, from a list of issues,
which ones had been raised at board level in the past twelve months and approximately
how often these issues had been raised. The issues and the percentage of directors who
indicated that the issue had been raised three or more times in the past twelve months are
set out in Table 15.
Table 15: Human Resources Issues Raised at Board Level in Past Twelve Months
HR Issues Raised at Board percent of Whole Sample raised 3 or more times
Remuneration 37.1
Productivity 66.3
Performance Management 64.2
Industrial Disputes 10
Enterprise Bargaining 15.4
Restructuring or Retrenchments 16.1
Employee Share Schemes 15.8
Work Organisation 56.9
Training 65.0
Occupational Health and Safety 73.3
n=353
The most commonly raised issue was ‘occupational health and safety’ with 73.3 percent
of directors indicating that this issue had been raised at board level three or more times
over the past twelve months. Other commonly raised issues were; ‘productivity’,
‘training’ and ‘performance management’, all with around 65 percent of directors having
considered these issues three or more times over the past year. ‘Industrial disputes’ and
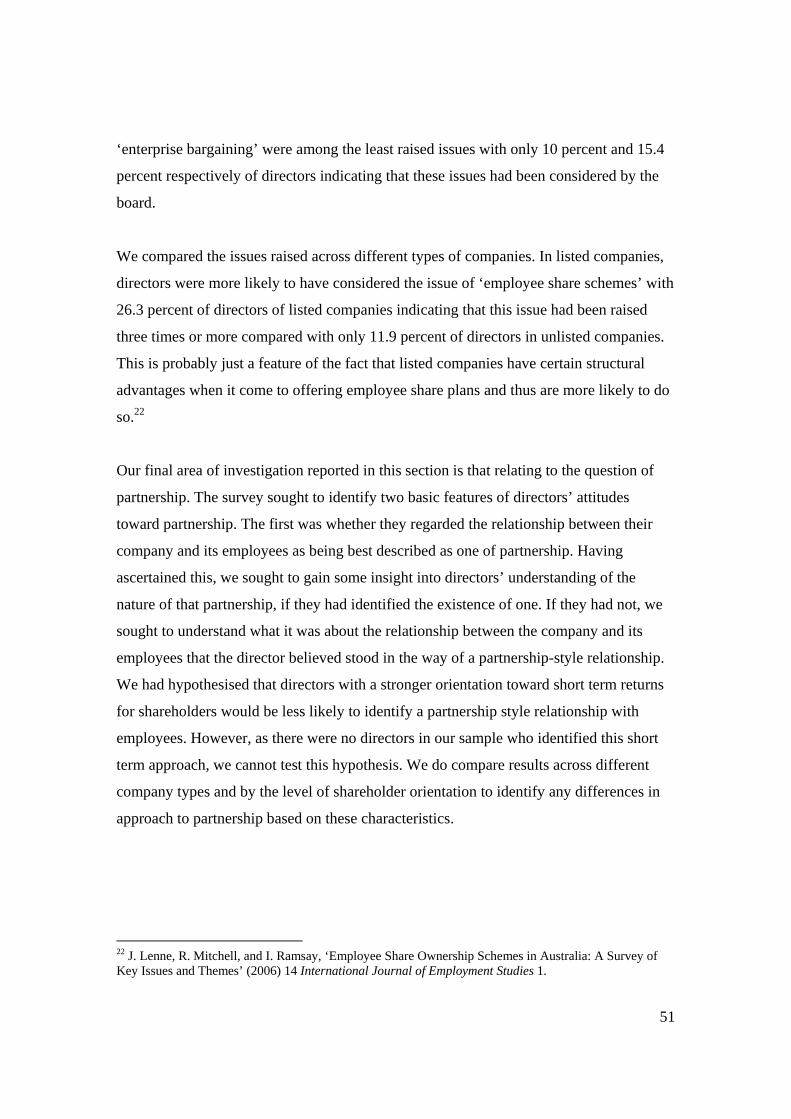
51
‘enterprise bargaining’ were among the least raised issues with only 10 percent and 15.4
percent respectively of directors indicating that these issues had been considered by the
board.
We compared the issues raised across different types of companies. In listed companies,
directors were more likely to have considered the issue of ‘employee share schemes’ with
26.3 percent of directors of listed companies indicating that this issue had been raised
three times or more compared with only 11.9 percent of directors in unlisted companies.
This is probably just a feature of the fact that listed companies have certain structural
advantages when it come to offering employee share plans and thus are more likely to do
so.22
Our final area of investigation reported in this section is that relating to the question of
partnership. The survey sought to identify two basic features of directors’ attitudes
toward partnership. The first was whether they regarded the relationship between their
company and its employees as being best described as one of partnership. Having
ascertained this, we sought to gain some insight into directors’ understanding of the
nature of that partnership, if they had identified the existence of one. If they had not, we
sought to understand what it was about the relationship between the company and its
employees that the director believed stood in the way of a partnership-style relationship.
We had hypothesised that directors with a stronger orientation toward short term returns
for shareholders would be less likely to identify a partnership style relationship with
employees. However, as there were no directors in our sample who identified this short
term approach, we cannot test this hypothesis. We do compare results across different
company types and by the level of shareholder orientation to identify any differences in
approach to partnership based on these characteristics.
22 J. Lenne, R. Mitchell, and I. Ramsay, ‘Employee Share Ownership Schemes in Australia: A Survey of Key Issues and Themes’ (2006) 14 International Journal of Employment Studies 1.
52
Table 16: Directors’ Attitudes to Partnerships with Employees
Relationship with employees is best described as partnership
Yes percent No percent
76.9 23.1 percent
Parties separate interests but common
goals
29.2 Parties same
interests, employees
work under direction
for company goals
38.3
Parties same interests and common
goals
70.8 Parties with separate
and sometimes
conflicting interests
18.5
Employees and
company one and the
same: employees are
part of the company
43.2
n=373
A large majority of directors (76.9 percent) reported that the relationship between the
company and its employees was best described as one of partnership as in set out in Table
16. This was a surprisingly large proportion given our assessment, based on the case
study research, that the notion of partnership had little resonance in the Australian context.
Whilst interviewees did not necessarily reject the idea of partnership, it was not part of
their every day parlance used to describe employee/company relations. This outcome
may, therefore, tell us more about the lack of definitional clarity (we did not define what
we meant by partnership in the survey) than it does about the incidence of partnership
style relations in Australian companies. It has elsewhere been observed that ‘partnership’
is such a broad and ambiguous term, that it is difficult to disagree with. Nevertheless, our
results help to elucidate directors’ understanding both of ‘partnership’ as a concept and
their understanding of the nature of the relationship between employees and the company
by their responses to the second part of the question. A large majority of those who said
‘yes’ to partnership (70.8 percent) believed that the partnership was based on an

53
alignment of interests between the company and employees who worked toward common
goals. A smaller, but not insignificant proportion (29.2 percent) believed that the
partnership was based on a relationship that recognised separate interests but entailed
working toward common goals.
Where directors did not characterise the relationship with employees as a partnership the
largest proportion (43.2 percent) indicated that this was because they understood that it
was not possible to conceive of employees and the company separately. Rather they
conceived employees as part of the company. A further 38.3 percent believed that the
relationship was founded on a ‘command and control’ type relationship with employees
working under direction to further company goals. We had observed in our case study
companies that this conceptualisation of the relationship between employees and the
company was likely to militate against partnership style relations. The final group of ‘no
partnership’ directors believed that the company and its employees had ‘separate and
sometimes conflicting interests’ (18.5 percent). Given that the majority of directors who
did identify a partnership did so on the basis of an alignment of interests and work toward
common goals, it is unsurprisingly that directors who saw the relationship between the
company and its employee as inherently conflictual were unlikely to do so.
As discussed previously, we had hypothesised that directors with a short term focus on
outcomes for shareholders would be less likely to identify partnerships with employees.
The absence of any such directors in our sample made this impossible to test. However,
as discussed in Section 10, we used the shareholder salience scale as a proxy for
shareholder orientation and looked for differences between the responses of directors in
the high range of the scale and those in the low range and found no differences in
response that were significant. This suggests that orientation toward shareholders is not
necessarily inconsistent with partnership relations.
Nonetheless we were able to identify where responses did vary according to company
type. Directors in unlisted companies, while no less likely to identify a partnership
relationship between the company and its employees, were more likely to indicate that

54
they believed that the company and its employees could not be conceived of separately
(51.7 percent of directors in unlisted companies compared with 21.7 percent of listed
company directors). The same finding occurred when we cross-tabulated the partnership
questions with the insider and outsider company models. Insider company directors were
more likely than outsider directors to indicate that they could not conceive of the
company and its employees separately, but no less likely to identify a partnership
relationship.
55
10. The Influence of Key Stakeholders
It is often assumed that companies within Australia operate with a ‘shareholder value’
orientation in corporate governance, and that shareholders’ interests are therefore given
priority over the interests of other key stakeholders, such as employees. We have seen
already that the evidence presented in this survey suggests that this is not always the case.
While a large proportion of directors do rank shareholders as their number one priority,
an almost equal proportion rank the company as their number one priority. Similarly,
directors were not inclined to believe that their legal obligations required them to act
solely in the interests of shareholders, nor were the matters that were most important to
directors related specifically to the interests of shareholders. In this section we explore
the influence of shareholders and other key stakeholder, employees and creditors in more
detail. We measure the influence of shareholders, employees and creditors using a scale
devised in research conducted in the US by Agle, Mitchell and Sonnenfeld into which
stakeholders matter most to CEOs.23 Agle et al sought to move beyond the assumption
that stakeholders have a fixed position of influence in relation to the company and
devised a model of salience (as they call it) or importance which is based on the
assumption that salience depends upon managers’ perceptions of the power, urgency and
legitimacy of stakeholders
The scale was comprised of seven items: directors were asked to rate the extent to which
they agreed or disagreed with certain statements on a scale of one (strongly agree) to 5
(strongly disagree).
23 Derived from B. R. Agle, R.K. Mitchell and J.A. Sonnenfeld, ‘Who Matters to CEOs? An Investigation of Stakeholder Attributes and Salience, Corporate Performance and CEO Values’ (1999) 42 The Academy of Management Journal 507-525, Special Research Forum on Stakeholders, Social Responsibility and Performance Appendix, Table A (with minor modification – some of the items were removed because of duplication).
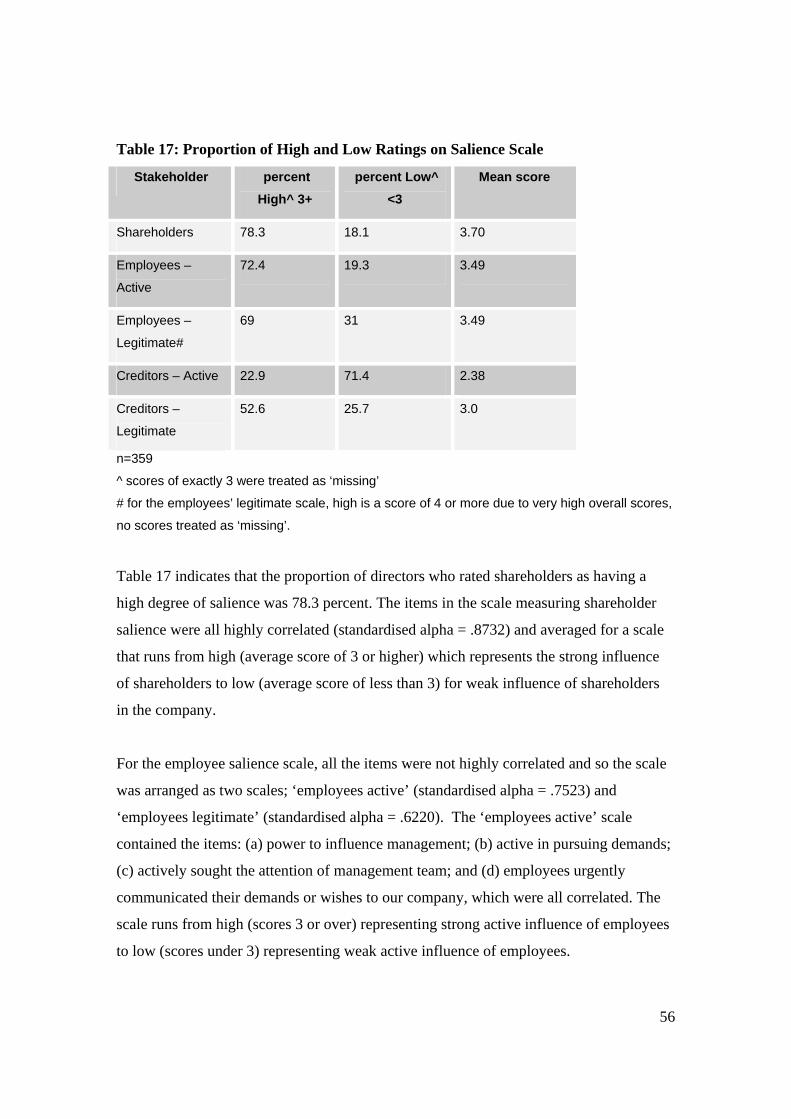
56
Table 17: Proportion of High and Low Ratings on Salience Scale
Stakeholder percent High^ 3+
percent Low^ <3
Mean score
Shareholders 78.3 18.1 3.70
Employees –
Active
72.4 19.3 3.49
Employees –
Legitimate#
69 31 3.49
Creditors – Active 22.9 71.4 2.38
Creditors –
Legitimate
52.6 25.7 3.0
n=359
^ scores of exactly 3 were treated as ‘missing’
# for the employees’ legitimate scale, high is a score of 4 or more due to very high overall scores,
no scores treated as ‘missing’.
Table 17 indicates that the proportion of directors who rated shareholders as having a
high degree of salience was 78.3 percent. The items in the scale measuring shareholder
salience were all highly correlated (standardised alpha = .8732) and averaged for a scale
that runs from high (average score of 3 or higher) which represents the strong influence
of shareholders to low (average score of less than 3) for weak influence of shareholders
in the company.
For the employee salience scale, all the items were not highly correlated and so the scale
was arranged as two scales; ‘employees active’ (standardised alpha = .7523) and
‘employees legitimate’ (standardised alpha = .6220). The ‘employees active’ scale
contained the items: (a) power to influence management; (b) active in pursuing demands;
(c) actively sought the attention of management team; and (d) employees urgently
communicated their demands or wishes to our company, which were all correlated. The
scale runs from high (scores 3 or over) representing strong active influence of employees
to low (scores under 3) representing weak active influence of employees.
57
The ‘employees legitimate’ scale contained the items: (e) demands or wishes of our
employees were viewed as legitimate; (f) employees received a high degree of time and
attention from our management team; and (g) satisfying the demands or wishes of
employees was important. Scores were averaged and run from high (scores 4 and higher)
representing strong legitimate influence of employees in the company to low (scores
under 4) representing weak legitimacy and influence of employees. In this scale only, the
scores would have to have been 4 or 5 to be classified as high because the overall scale
scores were high and there were too few under a score of three.
Similarly with the creditors salience scale, all seven items were not highly correlated, so
the scale was divided into ‘creditors active’ (standardised alpha = .8737) and ‘creditors
legitimate’ (standardised alpha = .7080). The ‘creditors active’ scale contained the items:
(a) power to influence management; (b) active in pursuing demands; (c) actively sought
the attention of management team; (d) creditors urgently communicated their demands or
wishes to our company; and (f) creditors received a high degree of time and attention
from our management team.24
The ‘creditors legitimate’ scale contained two items: (g) satisfying the demands or wishes
of creditors were important to our management team; and (e) demands or wishes were
viewed as legitimate.
Only 22.9 percent of directors were rated in the high range of the ‘creditors active’ scale.
This was a much smaller proportion compared with those whose responses placed them
in the high rage of the ‘shareholders active’ or the ‘employees active’ scale. Just over half
of the directors (52.6 percent) were in the high range of the ‘creditors legitimate’ scale.
The proportion of directors in the high range of the shareholder, ‘employee active’ and
‘employee legitimate’ scales was also similar. Creditors as stakeholders are perceived to
be less active and to have less legitimacy according to these findings.
24 The individual scale items in the employees and creditors 'active' and 'legitimate' scales are so included based on correlation between the items. Therefore the employees ‘active’ scale and the creditors ‘active’ scale are not comprised of the same individual scale items.
58
The following table (Table 18) breaks down the items in the salience scale and shows
both the percentage of directors who agreed (agree and strongly agree) and the mean
score for the item. As can be seen, with the exception of one item, the proportions and the
scores are remarkably similar for both shareholders and employees. The exception to this
is the item “received a high degree of time and attention from our management team”
with which 65 percent of directors agreed in relation to shareholders compared with 85.9
percent in relation to employees. As we have seen from the previous analysis of the
overall scores and comparison of the proportion of directors in the high range of each
scale, creditors are the least influential of the three stakeholders groups. Significantly
smaller proportions of directors agree with all of the items that comprise the scale in
relation to creditors. The items ‘creditors demands or wishes were viewed as legitimate’
and ‘satisfying the demands of creditors was important to our management team’ had the
largest proportion of directors agreeing with them and yet this was only around half of
the directors (47.3 percent and 54.7 percent respectively). These findings suggest that
creditors have some degree of legitimacy but low levels of power and urgency.
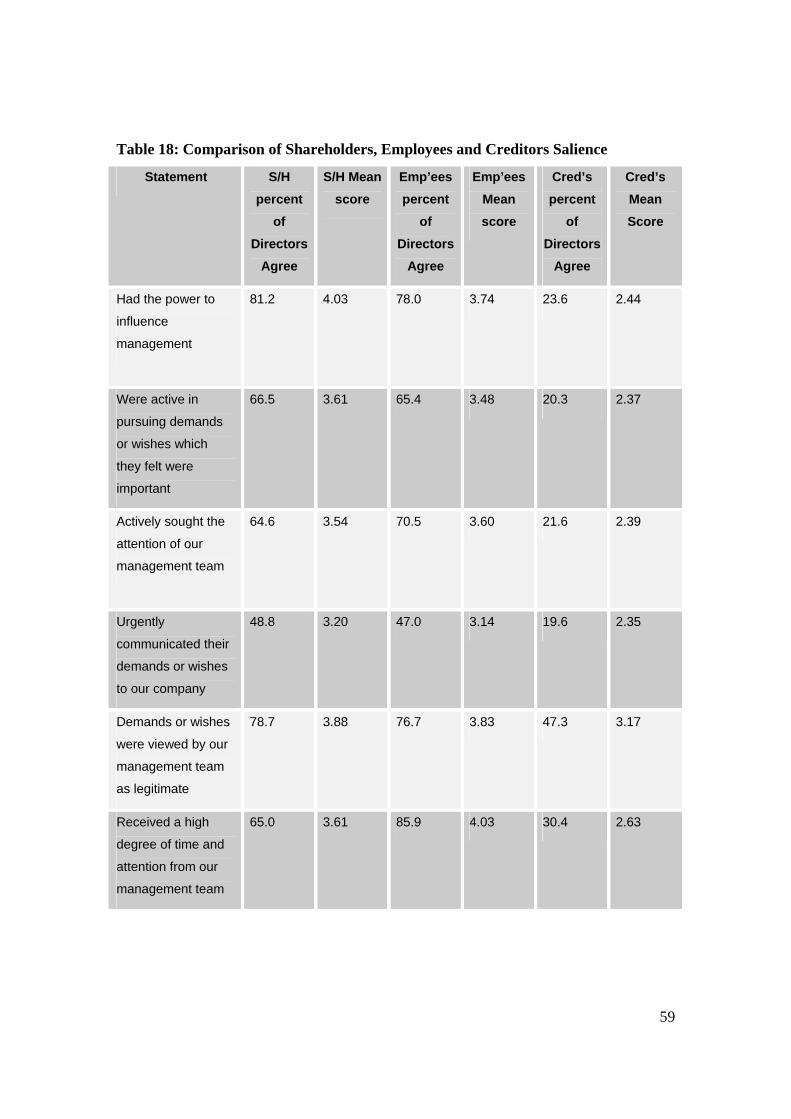
59
Table 18: Comparison of Shareholders, Employees and Creditors Salience
Statement S/H percent
of Directors
Agree
S/H Mean score
Emp’ees percent
of Directors
Agree
Emp’ees Mean score
Cred’s percent
of Directors
Agree
Cred’s Mean Score
Had the power to
influence
management
81.2 4.03 78.0 3.74 23.6 2.44
Were active in
pursuing demands
or wishes which
they felt were
important
66.5 3.61 65.4 3.48 20.3 2.37
Actively sought the
attention of our
management team
64.6 3.54 70.5 3.60 21.6 2.39
Urgently
communicated their
demands or wishes
to our company
48.8 3.20 47.0 3.14 19.6 2.35
Demands or wishes
were viewed by our
management team
as legitimate
78.7 3.88 76.7 3.83 47.3 3.17
Received a high
degree of time and
attention from our
management team
65.0 3.61 85.9 4.03 30.4 2.63
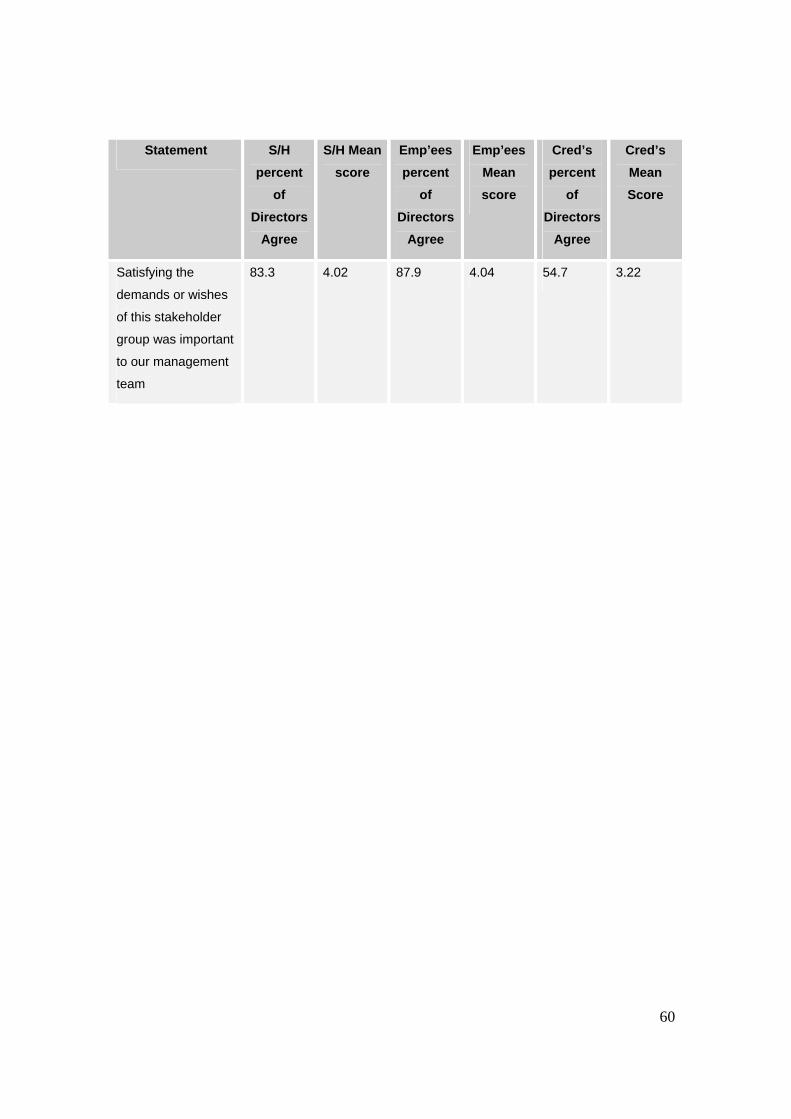
60
Statement S/H percent
of Directors
Agree
S/H Mean score
Emp’ees percent
of Directors
Agree
Emp’ees Mean score
Cred’s percent
of Directors
Agree
Cred’s Mean Score
Satisfying the
demands or wishes
of this stakeholder
group was important
to our management
team
83.3 4.02 87.9 4.04 54.7 3.22
61
11. Exploration of Major Relationships
11.1 The Effect of Shareholder Salience on Directors’ Attitudes
The focus of this section is an analysis of the relationship between the level of
shareholder salience, (ie, the influence of shareholders as perceived by directors) and
directors’ attitudes to other aspects of their role, including their priorities in the event of
an improvement or downturn in the financial performance of the company and the
matters of importance to them in their role as director. We compare the responses of
directors who were in the high range of the shareholder salience scale with those who
were in the low range as a means by which to ascertain the extent to which the influence
of shareholders appears to be related to directors’ attitudes.
Directors’ Values and Priorities: Does Shareholder Salience Make a Difference?
Beginning with directors’ priorities in the event of an improvement or deterioration in the
financial performance of the company, it emerges that priorities in the event of an
improvement or decline in company fortune25 were relatively consistent between
directors who regarded shareholder salience as being high and those who regarded it as
being low. Table 19 shows the results of these questions. There were no significant
differences revealed by this analysis.
25 This question is taken from a 1999 Japanese Ministry of Labour survey of executives of large firms: I. Takeshi, ‘From Industrial Relations to Investor Relations? Persistence and Change in Japanese Corporate Governance, Employment Practices and Industrial Relations’ (2001) 4 Social Sciences Japan Journal 225-241.
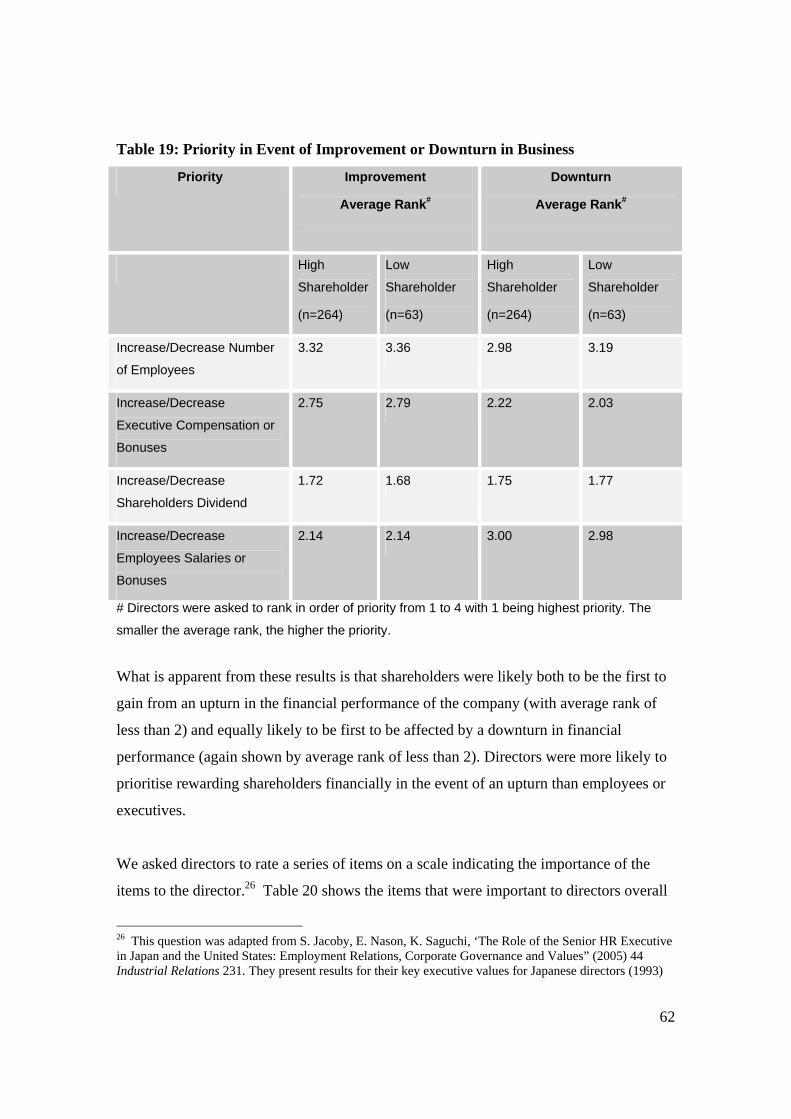
62
Table 19: Priority in Event of Improvement or Downturn in Business
Priority Improvement
Average Rank#
Downturn
Average Rank#
High
Shareholder
(n=264)
Low
Shareholder
(n=63)
High
Shareholder
(n=264)
Low
Shareholder
(n=63)
Increase/Decrease Number
of Employees
3.32 3.36 2.98 3.19
Increase/Decrease
Executive Compensation or
Bonuses
2.75 2.79 2.22 2.03
Increase/Decrease
Shareholders Dividend
1.72 1.68 1.75 1.77
Increase/Decrease
Employees Salaries or
Bonuses
2.14 2.14 3.00 2.98
# Directors were asked to rank in order of priority from 1 to 4 with 1 being highest priority. The
smaller the average rank, the higher the priority.
What is apparent from these results is that shareholders were likely both to be the first to
gain from an upturn in the financial performance of the company (with average rank of
less than 2) and equally likely to be first to be affected by a downturn in financial
performance (again shown by average rank of less than 2). Directors were more likely to
prioritise rewarding shareholders financially in the event of an upturn than employees or
executives.
We asked directors to rate a series of items on a scale indicating the importance of the
items to the director.26 Table 20 shows the items that were important to directors overall
26 This question was adapted from S. Jacoby, E. Nason, K. Saguchi, ‘The Role of the Senior HR Executive in Japan and the United States: Employment Relations, Corporate Governance and Values” (2005) 44 Industrial Relations 231. They present results for their key executive values for Japanese directors (1993)
63
and the comparison between directors in the high range of the shareholder salience scale
and those in the low range. As can be seen, there are very few differences across the
groups. Ensuring that customers and clients were satisfied was the most important item to
directors (97.4 percent of whole sample). Growing the business was also very important
(95.4 percent of sample) as was ensuring employees are fairly treated (94.2 percent of
sample), with improving productivity highly important as well (92.8 percent).
Interestingly, and contrary to the assumption that the shareholder value model of
governance would lead to the prioritisation of shareholders’ interests by directors, the
results show that generally the items that relate to employees’ interests (morale, fair
treatment, safeguarding jobs and creating more job opportunities) were rated as more
important by more directors than those relating to shareholders interests (dividend policy,
share price and special dividends).
It is also noteworthy, and contrary to our hypothesis (Hypothesis 3), that the only
statistically significant difference between the responses of directors was that directors in
the high range of the shareholder salience scale rated ‘ensuring employees are fairly
treated’ as significantly more important than did directors who were in the low range of
the scale. Directors who rated shareholder salience highly were not, however, more likely
to view the items relating to shareholders as more important than directors who gave it a
lower rating.
and recently for Japanese human resource executives, US human resource executives, and US chief financial officers.
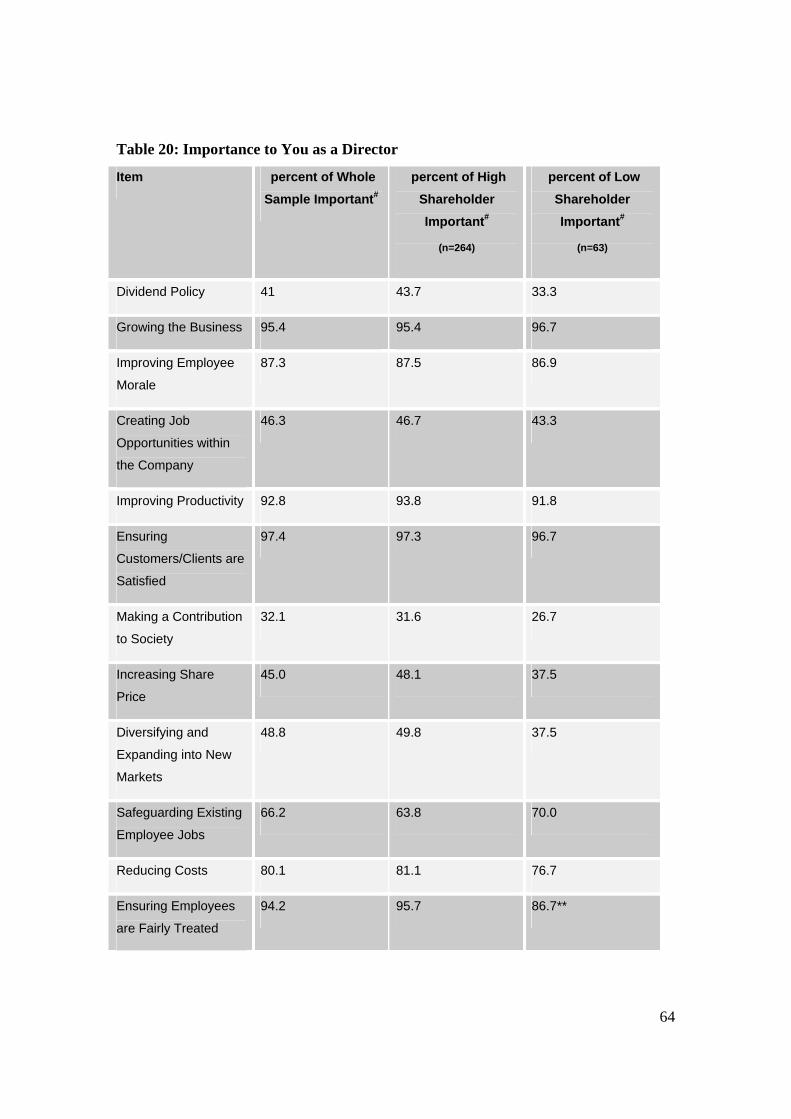
64
Table 20: Importance to You as a Director
Item percent of Whole Sample Important#
percent of High Shareholder Important#
(n=264)
percent of Low Shareholder Important#
(n=63)
Dividend Policy 41 43.7 33.3
Growing the Business 95.4 95.4 96.7
Improving Employee
Morale
87.3 87.5 86.9
Creating Job
Opportunities within
the Company
46.3 46.7 43.3
Improving Productivity 92.8 93.8 91.8
Ensuring
Customers/Clients are
Satisfied
97.4 97.3 96.7
Making a Contribution
to Society
32.1 31.6 26.7
Increasing Share
Price
45.0 48.1 37.5
Diversifying and
Expanding into New
Markets
48.8 49.8 37.5
Safeguarding Existing
Employee Jobs
66.2 63.8 70.0
Reducing Costs 80.1 81.1 76.7
Ensuring Employees
are Fairly Treated
94.2 95.7 86.7**
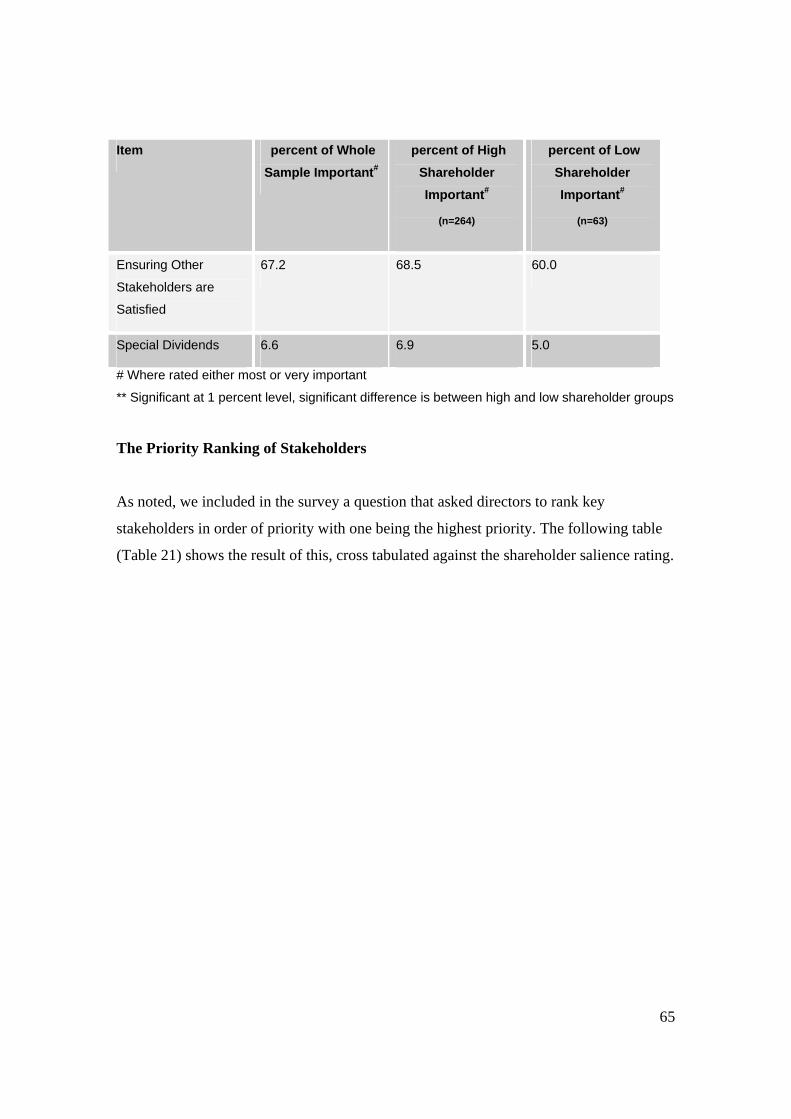
65
Item percent of Whole Sample Important#
percent of High Shareholder Important#
(n=264)
percent of Low Shareholder Important#
(n=63)
Ensuring Other
Stakeholders are
Satisfied
67.2 68.5 60.0
Special Dividends 6.6 6.9 5.0
# Where rated either most or very important
** Significant at 1 percent level, significant difference is between high and low shareholder groups
The Priority Ranking of Stakeholders
As noted, we included in the survey a question that asked directors to rank key
stakeholders in order of priority with one being the highest priority. The following table
(Table 21) shows the result of this, cross tabulated against the shareholder salience rating.
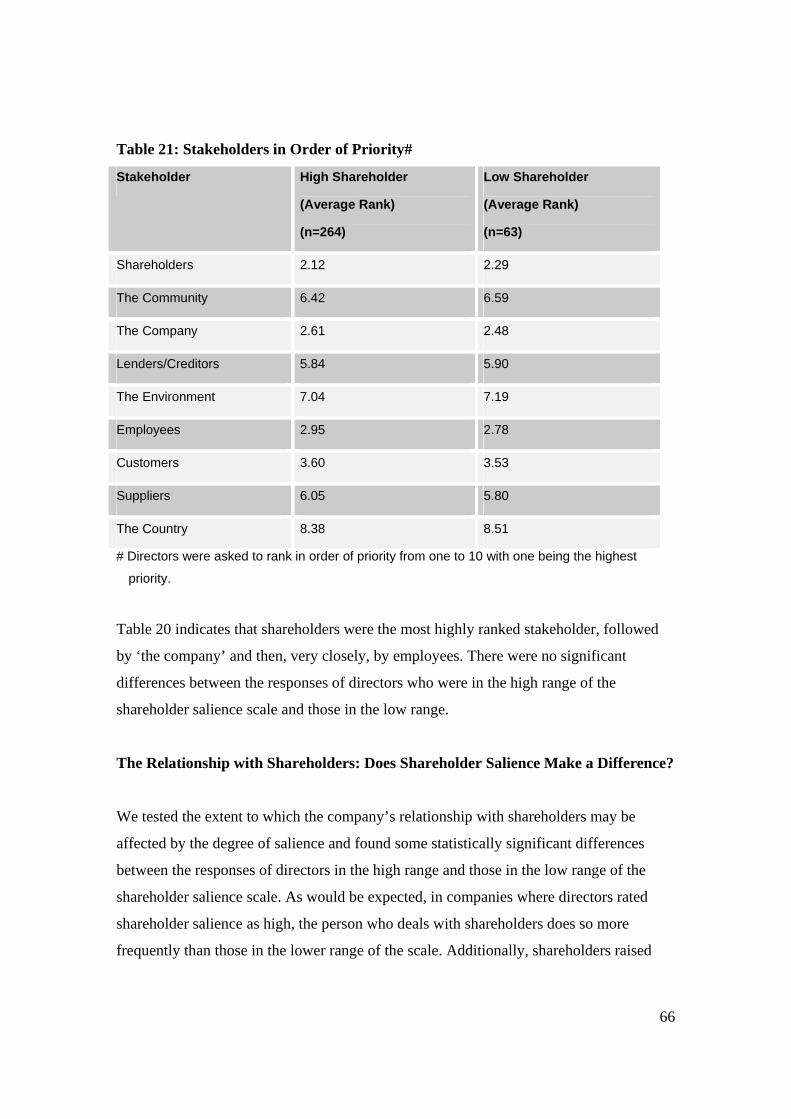
66
Table 21: Stakeholders in Order of Priority#
Stakeholder High Shareholder
(Average Rank)
(n=264)
Low Shareholder
(Average Rank)
(n=63)
Shareholders 2.12 2.29
The Community 6.42 6.59
The Company 2.61 2.48
Lenders/Creditors 5.84 5.90
The Environment 7.04 7.19
Employees 2.95 2.78
Customers 3.60 3.53
Suppliers 6.05 5.80
The Country 8.38 8.51
# Directors were asked to rank in order of priority from one to 10 with one being the highest
priority.
Table 20 indicates that shareholders were the most highly ranked stakeholder, followed
by ‘the company’ and then, very closely, by employees. There were no significant
differences between the responses of directors who were in the high range of the
shareholder salience scale and those in the low range.
The Relationship with Shareholders: Does Shareholder Salience Make a Difference?
We tested the extent to which the company’s relationship with shareholders may be
affected by the degree of salience and found some statistically significant differences
between the responses of directors in the high range and those in the low range of the
shareholder salience scale. As would be expected, in companies where directors rated
shareholder salience as high, the person who deals with shareholders does so more
frequently than those in the lower range of the scale. Additionally, shareholders raised
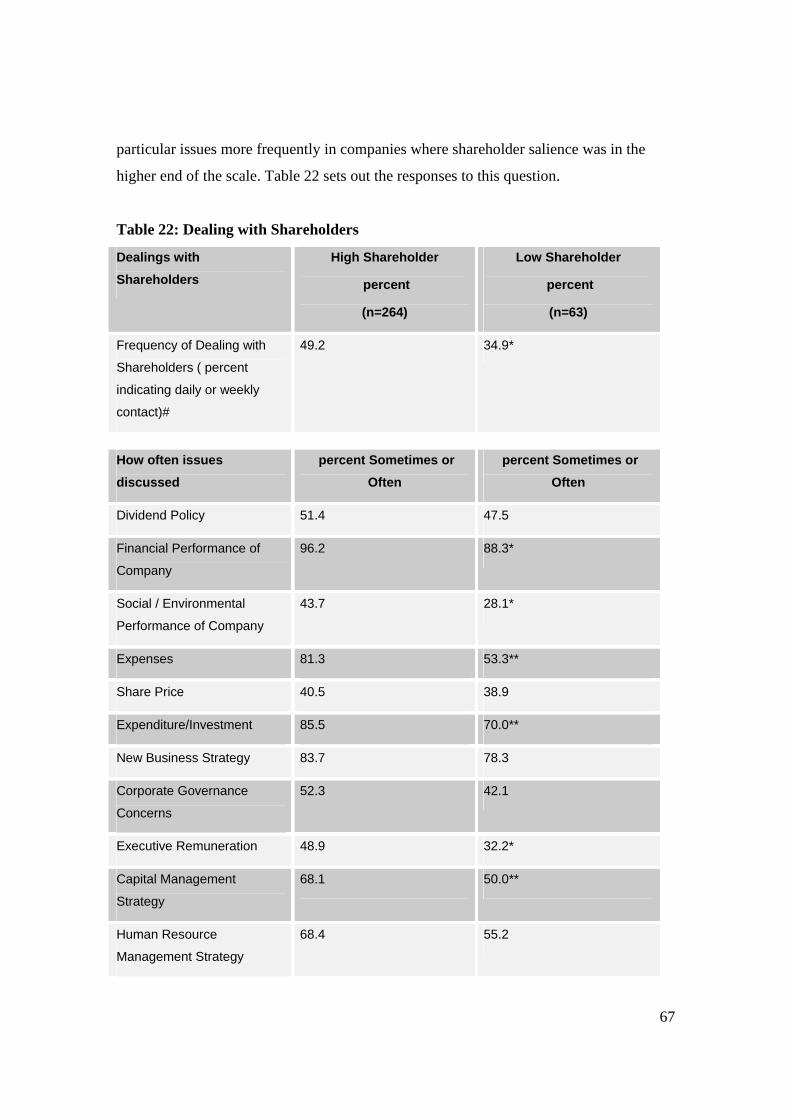
67
particular issues more frequently in companies where shareholder salience was in the
higher end of the scale. Table 22 sets out the responses to this question.
Table 22: Dealing with Shareholders
Dealings with Shareholders
High Shareholder
percent
(n=264)
Low Shareholder
percent
(n=63)
Frequency of Dealing with
Shareholders ( percent
indicating daily or weekly
contact)#
49.2 34.9*
How often issues discussed
percent Sometimes or Often
percent Sometimes or Often
Dividend Policy 51.4 47.5
Financial Performance of
Company
96.2 88.3*
Social / Environmental
Performance of Company
43.7 28.1*
Expenses 81.3 53.3**
Share Price 40.5 38.9
Expenditure/Investment 85.5 70.0**
New Business Strategy 83.7 78.3
Corporate Governance
Concerns
52.3 42.1
Executive Remuneration 48.9 32.2*
Capital Management
Strategy
68.1 50.0**
Human Resource
Management Strategy
68.4 55.2
68
*significant at 5 percent level, ** significant at 1 percent level
# Frequency with which person who deals with shareholders does so (not necessarily respondent
director)
It can be seen that there were highly significant differences between the responses of
directors in the high range of the shareholder salience scale and those in the low range
regarding the frequency with which matters to do with expenses, expenditure or
investment, and capital management strategy were raised. There were significant
differences in the frequency with which financial performance of the company, social or
environmental concerns and executive remuneration were raised – again, being more
frequently raised in companies where directors were in the high range of the scale than in
the lower range.
It is interesting to note the relatively high proportion of each group that reported that
shareholders had discussed matters to do with the company’s human resources strategy
with management. For directors in the high range of the shareholder salience scale, the
percentage was 68.4 compared with 55.2 percent of directors in the lower range.
Another highly significant difference (which is not shown in the tables) emerges in
response to the question about whether there had been areas of tension between company
direction and shareholder expectation in the past twelve months. In companies where
shareholder salience was rated as high, 30 percent of directors indicated that there had
been areas of tension compared with only 12.7 percent of companies where directors
were in the lower range – a difference significant at the 1 percent level. This probably
reflects higher levels of engagement between the company and shareholders in these
companies. However, there was only one significant difference in the responses
indicating what the area(s) of tension were and this was that directors in the low range of
the shareholder salience scale were more likely to report tension over the dividend policy
or payout ratio (62.5 percent of ‘low shareholder’ compared with 19.8 percent of ‘high
shareholder’, significant at the 1 percent level).
69
The three most common areas of tension indicated by directors in the high range of the
shareholder salience scale were financial performance of the company (64.2 percent of
those that indicated there had been areas of tension), new business strategy (38.3 percent)
and expenditure / investment (32.1 percent). For directors in the low range of the
shareholder salience scale, the three most common areas of tension were dividend policy
(62.5 percent of those that indicated that there had been areas of tension), financial
performance of the company (62.5 percent) and expenditure or investment policy (25
percent). Only a small proportion of either group reported tension over the human
resources strategy, with 13.6 percent of ‘high shareholder’ directors and 12.5 percent of
‘low shareholder’ directors.
The Relationship with Employees: Does Shareholder Salience Make a Difference?
Having examined the relationship between directors and shareholders to assess the extent
to which the respondent directors’ sense of shareholder salience appears to make a
difference to this relationship, we move to examine the situation in relation to employees.
Just as we asked directors about the company’s relationship with its shareholders, we
asked about the relationship with employees. We assumed that if shareholders were seen
to be important and influential, then employees’ interests and demands might receive a
lower priority from directors. The results of this are presented now along with
comparisons of the responses of directors in the high range of the shareholder salience
scale and those in the low range.
We asked directors to indicate the issues concerning employees below executive level
which had been raised at board level over the past twelve months. The following table
(Table 23) shows those results.
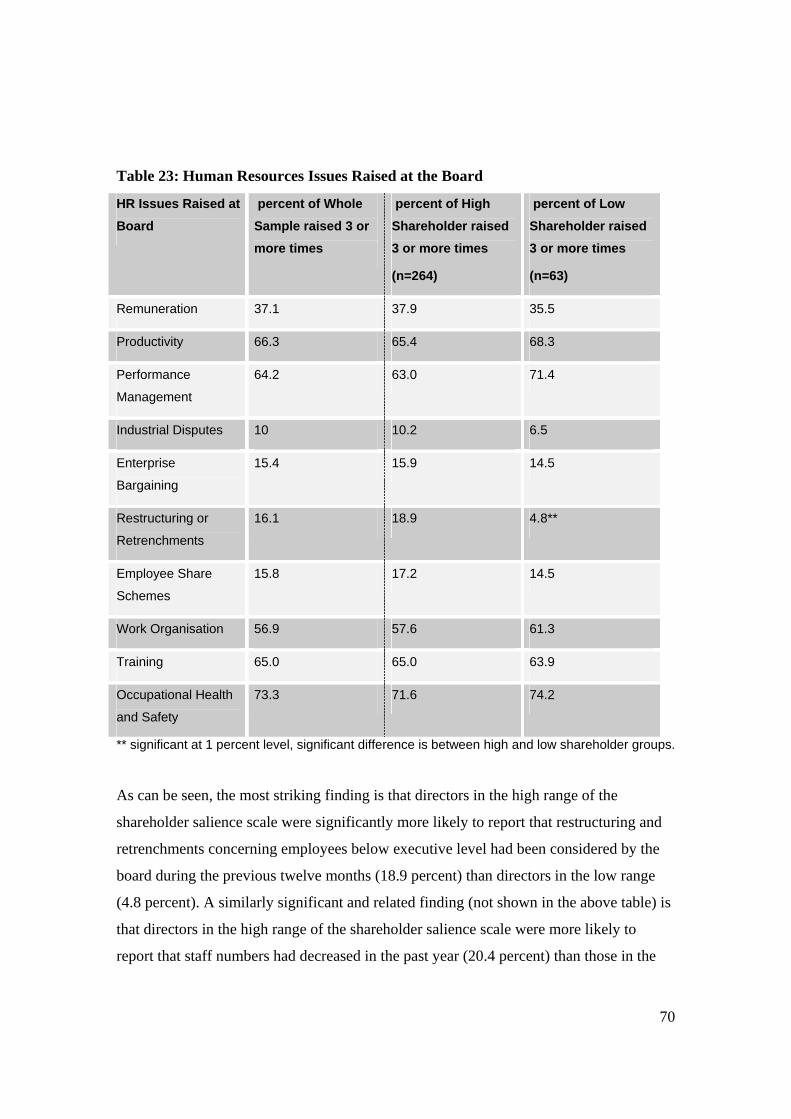
70
Table 23: Human Resources Issues Raised at the Board
HR Issues Raised at Board
percent of Whole Sample raised 3 or more times
percent of High Shareholder raised 3 or more times
(n=264)
percent of Low Shareholder raised 3 or more times
(n=63)
Remuneration 37.1 37.9 35.5
Productivity 66.3 65.4 68.3
Performance
Management
64.2 63.0 71.4
Industrial Disputes 10 10.2 6.5
Enterprise
Bargaining
15.4 15.9 14.5
Restructuring or
Retrenchments
16.1 18.9 4.8**
Employee Share
Schemes
15.8 17.2 14.5
Work Organisation 56.9 57.6 61.3
Training 65.0 65.0 63.9
Occupational Health
and Safety
73.3 71.6 74.2
** significant at 1 percent level, significant difference is between high and low shareholder groups.
As can be seen, the most striking finding is that directors in the high range of the
shareholder salience scale were significantly more likely to report that restructuring and
retrenchments concerning employees below executive level had been considered by the
board during the previous twelve months (18.9 percent) than directors in the low range
(4.8 percent). A similarly significant and related finding (not shown in the above table) is
that directors in the high range of the shareholder salience scale were more likely to
report that staff numbers had decreased in the past year (20.4 percent) than those in the
71
low range (7.9 percent). This finding seems to provide some support for the view that a
strong shareholder orientation in companies may lead to an emphasis on costs and job
reduction.
In terms of other matters raised there were no significant differences.
Partnership with Employees
Finally, regarding the relationship with employees, as reported above, we asked directors
about partnership. We asked them to indicate whether they conceived of the relationship
between their company and its employees as being one of partnership. We also asked
them to indicate whether, if they did conceive of a partnership, it was founded on the
alignment of interests between employees and company or whether it allowed for
difference. If they did not think that a partnership style relationship was operating, we
asked them to identify the reason for this. The responses are shown in the following
tables (Table 24 contains the ‘yes’ responses and Table 25 contains the ‘no’ responses)
cross tabulated with shareholder salience findings.
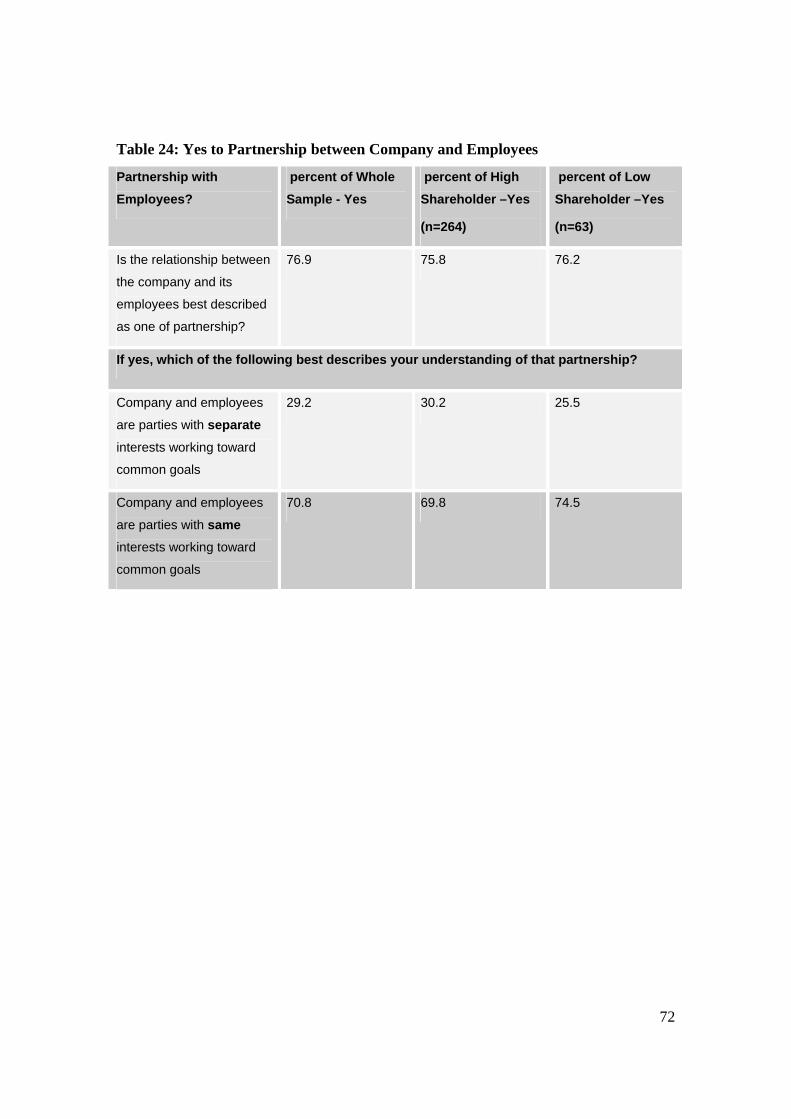
72
Table 24: Yes to Partnership between Company and Employees
Partnership with Employees?
percent of Whole Sample - Yes
percent of High Shareholder –Yes
(n=264)
percent of Low Shareholder –Yes
(n=63)
Is the relationship between
the company and its
employees best described
as one of partnership?
76.9 75.8 76.2
If yes, which of the following best describes your understanding of that partnership?
Company and employees
are parties with separate
interests working toward
common goals
29.2 30.2 25.5
Company and employees
are parties with same interests working toward
common goals
70.8 69.8 74.5
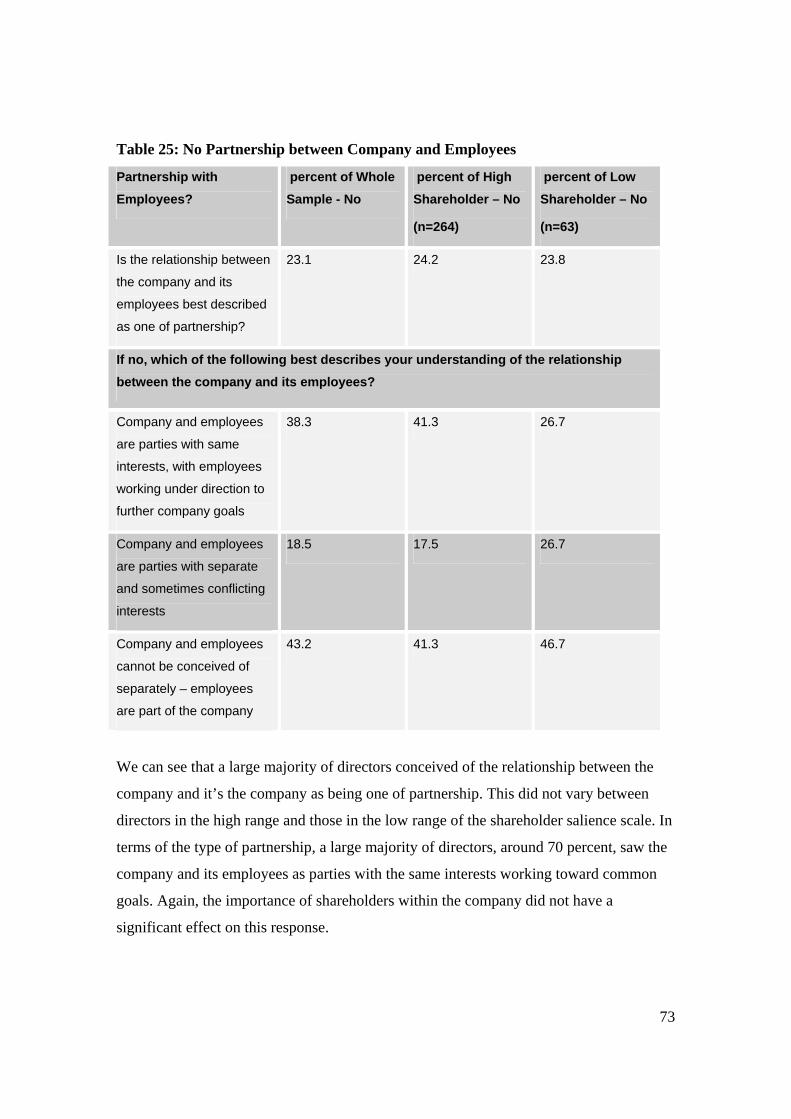
73
Table 25: No Partnership between Company and Employees
Partnership with Employees?
percent of Whole Sample - No
percent of High Shareholder – No
(n=264)
percent of Low Shareholder – No
(n=63)
Is the relationship between
the company and its
employees best described
as one of partnership?
23.1 24.2 23.8
If no, which of the following best describes your understanding of the relationship between the company and its employees?
Company and employees
are parties with same
interests, with employees
working under direction to
further company goals
38.3 41.3 26.7
Company and employees
are parties with separate
and sometimes conflicting
interests
18.5 17.5 26.7
Company and employees
cannot be conceived of
separately – employees
are part of the company
43.2 41.3 46.7
We can see that a large majority of directors conceived of the relationship between the
company and it’s the company as being one of partnership. This did not vary between
directors in the high range and those in the low range of the shareholder salience scale. In
terms of the type of partnership, a large majority of directors, around 70 percent, saw the
company and its employees as parties with the same interests working toward common
goals. Again, the importance of shareholders within the company did not have a
significant effect on this response.

74
In the smaller proportion of companies that did not describe the relationship between
employees and the company as being one of partnership, the most common reason
identified was that employees are part of the company and so cannot be conceived of
separately. There were no significant differences in this respect between directors in the
high range and those in the low range of the shareholder salience scale.
Further Analysis of the Shareholder Salience Scale
As indicated earlier in this report, the items in the shareholder salience scale were all
highly correlated and all comparisons reported thus far in this report have been between
directors in the high range of the scale and those in the low range. However, the items in
the employee salience scale were not as highly correlated and this prompted us to conduct
further analysis in which we categorised directors as belonging to one of four groups
according to their perception of the activity and legitimacy of employees and we then
compared the responses of the different groups. This analysis is presented later in this
section (see Tables 34 and 35). For consistency, we have conducted the same type of
analysis in relation to the shareholder salience scale. The results that follow are
comparisons of responses between four groups of directors:27
Active and Legitimate: Directors with above average scores on all items in the
scale.
Active and Weakly Legitimate: Directors with above average scores on items a, b,
c, and d on the shareholder salience scale28 and below average scores on items e, f
and g.29
27 The four groups are the same as those used to categorise directors’ responses to the employee salience scale items. The groups are a better fit in relation to the employee salience scale as they were devised to reflect the correlation between items in that scale, whereas all items in the shareholder salience scale were highly correlated. 28 These items are: (a) shareholders had the power to influence management; (b) shareholders were active in pursuing demands or wishes which they felt were important; (c) shareholders actively sought the attention of our management team; and (d) shareholders urgently communicated their demands or wishes to our company. 29 These items are: (e) shareholders demands or wishes were viewed as legitimate by our management team; (f) shareholders received a high degree of time and attention from our management team; and (g) satisfying the demands or wishes of shareholders was important to our management team.

75
Passive and Legitimate: Directors with below average scores on items a, b, c, and
d and above average scores on items e, f and g.
Passive and Weakly Legitimate: Directors with below average scores on all items.
Having grouped the directors in this way, we compared the responses of each group with
those of the other groups combined and now report on the statistically significant
differences.
There were some significant differences between the groups regarding the relationship
between the company and its shareholders. First, as would be expected, there was a
relationship between directors’ perception of shareholders as active and the frequency
with which dealings between the company and shareholders occurred. Directors in the
‘active and legitimate’ group were significantly more likely to report daily or weekly
dealings between the company and its shareholders (55 percent compared with 37.9
percent for the combined other groups, significant at the one percent level). Similarly,
directors in the ‘passive and weakly legitimate’ group were less likely to report that
dealings occurred on a daily or weekly basis than directors in the other groups combined
(34.5 percent compared with 50.2 percent, significant at the one percent level).
Directors in the ‘active and legitimate’ group were more likely to report that there had
been tension between shareholders and the company over the past year (33.1 percent
compared with 18.2 percent of directors in the other groups combined, significant at the
one percent level). These directors were also more likely to report that the raising of
shareholder concerns had led to change than were directors in the other groups combined
(48.1 percent of directors in the ‘active and legitimate’ group compared with 23 percent
in the other groups combined, significant at the five percent level). Directors in the
‘passive and weakly legitimate’ group, on the other hand, were less likely to report that
there had been tension between the company and its shareholders (15.9 percent compared
with 28.5 percent of the other groups combined, significant at the one percent level).
These directors were also less likely to report that the raising of shareholder concerns led
76
to change (11.1 percent compared with 43.8 percent of the other groups combined,
significant at the five percent level).
The relationship between the company and its shareholders appears to be a more direct
one where the director is in the group ‘active and legitimate’. This is suggested by the
fact that directors in the ‘active and legitimate’ group were more likely to indicate that
shareholder concerns were raised in private meetings with management (85.2 percent of
that group compared with 67.4 percent of the other groups combined, significant at the
five percent level) whereas directors in the ‘passive and legitimate’ group were more
likely than other directors to indicate that concerns were raised by shareholders through
the investor relations function (35.7 percent compared with 7.2 percent of the other
groups combined, significant at the one percent level), while directors in the ‘passive and
weakly legitimate’ group were the only group to report that shareholder concerns were
raised via proxy advisory services (5.6 percent of these directors compared with none of
the others) or at the annual general meeting (38.9 percent compared with 12.7 percent, a
difference significant at the one percent level).
We also used this more detailed examination of the shareholder salience scale to explore
the relationship between directors’ perceptions of the salience of shareholders and that of
employees. One of the hypotheses that we sought to test through the survey was that
directors who have a strong notion of ‘shareholder primacy’ may tend to place less
emphasis on the interests of employees. However, our findings here suggest that directors
who perceive that shareholders are active and have high levels of legitimacy may also be
more likely to be responsive to the demands or wishes of employees. For example,
directors in the ‘active and legitimate’ group in relation to shareholders were more likely
than other directors to report that ‘employees urgently communicated their demands or
wishes to our company’ (54.7 percent compared with 40.1 percent, a difference
significant at the one percent level) and to report that ‘satisfying the demands or wishes
of employees was important to our management team’ (91.9 percent compared with 84.5
percent of other directors, a difference significant at the five percent level). On the other
hand, directors who had a lower than average perception of the legitimacy of
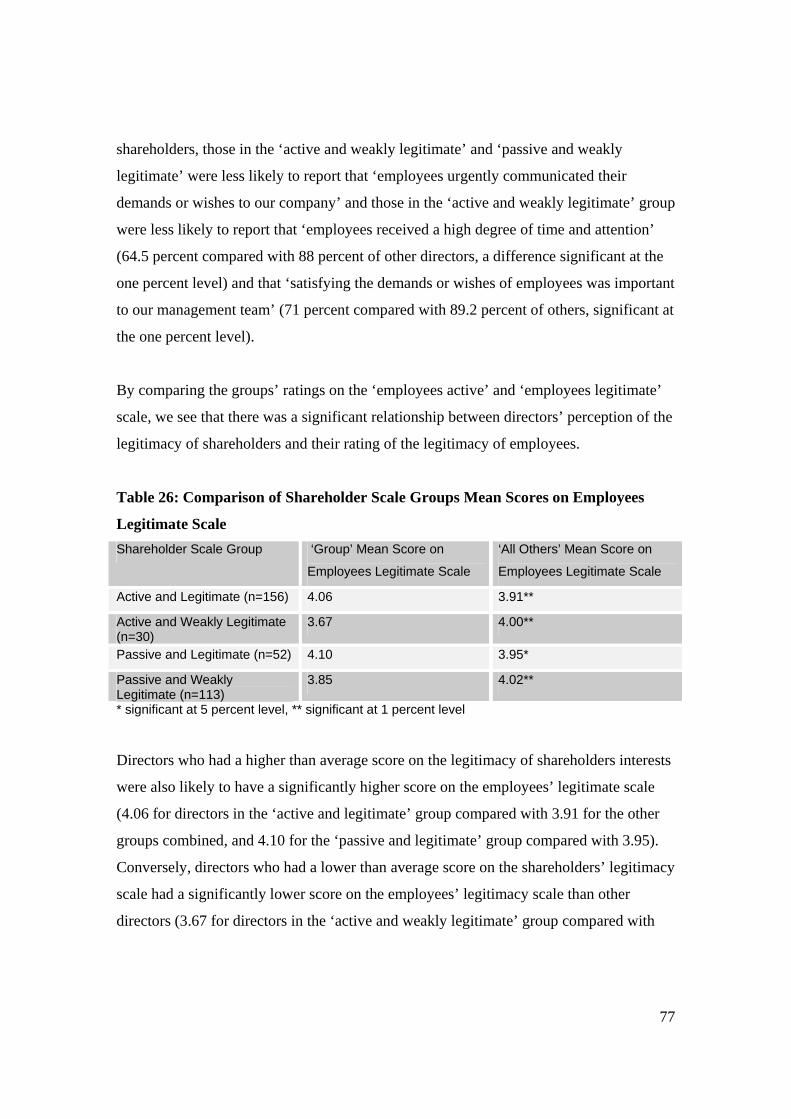
77
shareholders, those in the ‘active and weakly legitimate’ and ‘passive and weakly
legitimate’ were less likely to report that ‘employees urgently communicated their
demands or wishes to our company’ and those in the ‘active and weakly legitimate’ group
were less likely to report that ‘employees received a high degree of time and attention’
(64.5 percent compared with 88 percent of other directors, a difference significant at the
one percent level) and that ‘satisfying the demands or wishes of employees was important
to our management team’ (71 percent compared with 89.2 percent of others, significant at
the one percent level).
By comparing the groups’ ratings on the ‘employees active’ and ‘employees legitimate’
scale, we see that there was a significant relationship between directors’ perception of the
legitimacy of shareholders and their rating of the legitimacy of employees.
Table 26: Comparison of Shareholder Scale Groups Mean Scores on Employees
Legitimate Scale Shareholder Scale Group ‘Group’ Mean Score on
Employees Legitimate Scale
‘All Others’ Mean Score on
Employees Legitimate Scale
Active and Legitimate (n=156) 4.06 3.91**
Active and Weakly Legitimate (n=30)
3.67 4.00**
Passive and Legitimate (n=52) 4.10 3.95*
Passive and Weakly Legitimate (n=113)
3.85 4.02**
* significant at 5 percent level, ** significant at 1 percent level
Directors who had a higher than average score on the legitimacy of shareholders interests
were also likely to have a significantly higher score on the employees’ legitimate scale
(4.06 for directors in the ‘active and legitimate’ group compared with 3.91 for the other
groups combined, and 4.10 for the ‘passive and legitimate’ group compared with 3.95).
Conversely, directors who had a lower than average score on the shareholders’ legitimacy
scale had a significantly lower score on the employees’ legitimacy scale than other
directors (3.67 for directors in the ‘active and weakly legitimate’ group compared with
78
4.0 for the other groups combined and 3.85 for directors in the ‘passive and weakly
legitimate’ group compared with 4.02 for the other groups combined).
A somewhat contrary finding was that in regard to the priority ranking of stakeholders,
directors in the ‘active and legitimate’ group were significantly less likely to rank
employees number one than were other directors (3.2 percent compared with 9.2 percent
of others, the difference is significant at the five percent level). Interestingly though,
directors in this group were not more likely to rank shareholders as number one.
The final area in which differences emerged between groups of directors based on their
perception of the activity and legitimacy of shareholders was regarding the characteristics
of the company of which they were directors. Directors in the ‘active and legitimate’
group were more likely to be directors of proprietary companies (86.1 percent of directors
compared with 67.5 percent of other directors), whereas directors in both the ‘passive and
legitimate’ and ‘passive and weakly legitimate’ groups were less likely to be directors of
proprietary companies (52.9 percent compared with 79.2 percent and 67.9 percent
compared with 78.8 percent respectively). A larger proportion of directors in the ‘passive
and legitimate’ group were directors of listed companies (39.6 percent) than were
directors in the ‘active and legitimate group (6.7 percent).
We see that there is a relationship between where directors are placed within the four
groups and factors such as turnover, the proportion of shares held by the largest
shareholder and shareholder representation on the board. Directors in the ‘active and
legitimate’ group were less likely to be directors of companies with turnover of more than
$100 million (24.4 percent of these directors compared with 35.7 percent of others,
significant at the five percent level), while directors in the ‘passive and legitimate’ group
were more likely to be directors of companies with turnover of $100 million or more
(52.8 percent compared with 27.1 percent, significant at the one percent level).
Directors in the ‘passive and legitimate’ group were more likely to be directors of
companies where the largest shareholder held between five and 30 percent (37.7 percent
79
of this group compared with 20.6 percent of others combined, significant at the one
percent level). Directors in the ‘passive and weakly legitimate’ group were less likely to
be directors of companies where the largest shareholder held over 51 percent of the
shares (32.1 percent compared with 46.8 percent of others, significant at the one percent
level), while directors in the ‘active and legitimate’ group were more likely to be in this
type of company (51.3 percent compared with 35.5 percent, significant at the one percent
level). It was also the case that directors in the ‘active and legitimate’ group were more
likely (89.2 percent compared with 35.5 percent) to be directors of companies in which
the largest shareholder was represented on the board, while directors in the ‘passive and
weakly legitimate’ group were less likely (67.9 percent compared with 84.7 percent) to
be from such companies.
11.2 The Effect of Employee Salience
Having considered the extent to which shareholder salience influences directors, we
move now to consider whether employee salience appears to have an effect on the
relationship between employees and the company, shareholders and the company and
whether directors’ attitudes vary according to whether employee salience is perceived by
directors to be high or low. Assuming that the interests of shareholders and employees
are often conflictual, we might have expected, for instance, that directors for whom
employees were highly influential (or ‘salient’) to take matters concerning employees
more seriously than those that didn’t, and likewise those for whom employees were less
‘salient’ to take matters concerning shareholders more seriously. As noted earlier, the
measure for employee salience was divided into two scales according to correlations
within the scale items. These two scales are called the ‘employees active’ scale and the
‘employees legitimate’ scale.
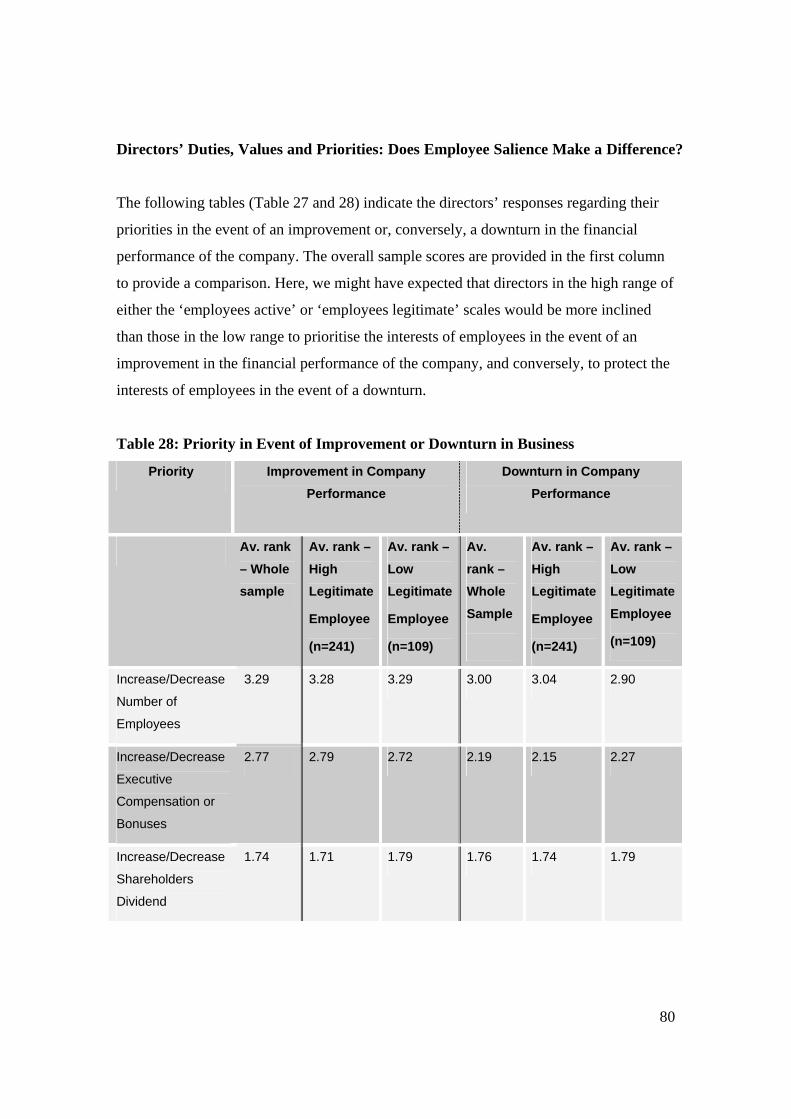
80
Directors’ Duties, Values and Priorities: Does Employee Salience Make a Difference?
The following tables (Table 27 and 28) indicate the directors’ responses regarding their
priorities in the event of an improvement or, conversely, a downturn in the financial
performance of the company. The overall sample scores are provided in the first column
to provide a comparison. Here, we might have expected that directors in the high range of
either the ‘employees active’ or ‘employees legitimate’ scales would be more inclined
than those in the low range to prioritise the interests of employees in the event of an
improvement in the financial performance of the company, and conversely, to protect the
interests of employees in the event of a downturn.
Table 28: Priority in Event of Improvement or Downturn in Business
Priority Improvement in Company Performance
Downturn in Company Performance
Av. rank – Whole sample
Av. rank – High Legitimate
Employee
(n=241)
Av. rank – Low Legitimate
Employee
(n=109)
Av. rank – Whole Sample
Av. rank – High Legitimate
Employee
(n=241)
Av. rank – Low Legitimate Employee
(n=109)
Increase/Decrease
Number of
Employees
3.29 3.28 3.29 3.00 3.04 2.90
Increase/Decrease
Executive
Compensation or
Bonuses
2.77 2.79 2.72 2.19 2.15 2.27
Increase/Decrease
Shareholders
Dividend
1.74 1.71 1.79 1.76 1.74 1.79
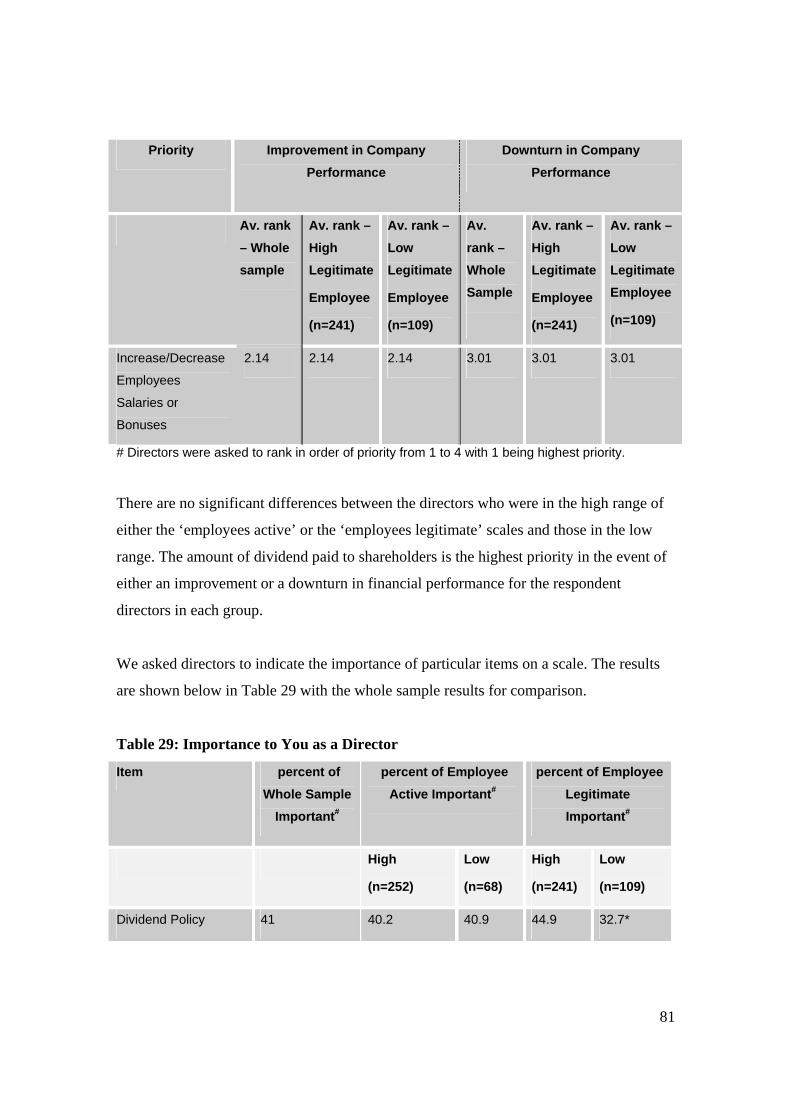
81
Priority Improvement in Company Performance
Downturn in Company Performance
Av. rank – Whole sample
Av. rank – High Legitimate
Employee
(n=241)
Av. rank – Low Legitimate
Employee
(n=109)
Av. rank – Whole Sample
Av. rank – High Legitimate
Employee
(n=241)
Av. rank – Low Legitimate Employee
(n=109)
Increase/Decrease
Employees
Salaries or
Bonuses
2.14 2.14 2.14 3.01 3.01 3.01
# Directors were asked to rank in order of priority from 1 to 4 with 1 being highest priority.
There are no significant differences between the directors who were in the high range of
either the ‘employees active’ or the ‘employees legitimate’ scales and those in the low
range. The amount of dividend paid to shareholders is the highest priority in the event of
either an improvement or a downturn in financial performance for the respondent
directors in each group.
We asked directors to indicate the importance of particular items on a scale. The results
are shown below in Table 29 with the whole sample results for comparison.
Table 29: Importance to You as a Director
Item percent of Whole Sample
Important#
percent of Employee Active Important#
percent of Employee Legitimate Important#
High
(n=252)
Low
(n=68)
High
(n=241)
Low
(n=109)
Dividend Policy 41 40.2 40.9 44.9 32.7*
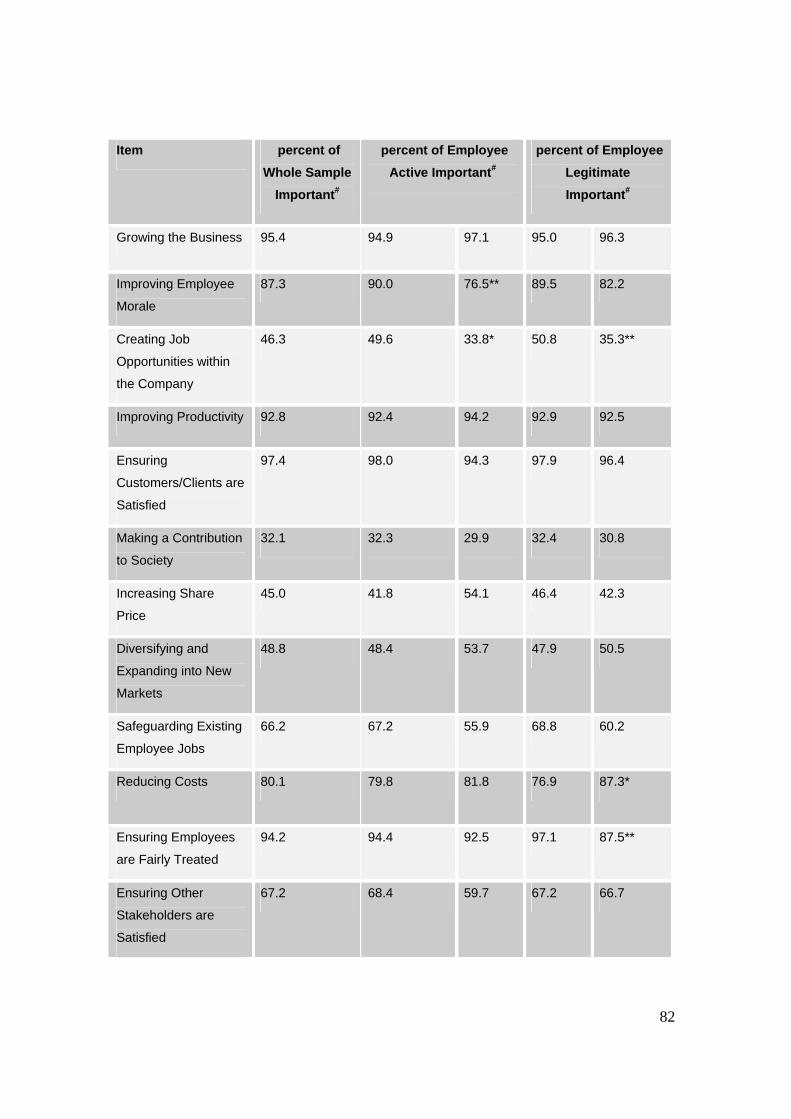
82
Item percent of Whole Sample
Important#
percent of Employee Active Important#
percent of Employee Legitimate Important#
Growing the Business 95.4 94.9 97.1 95.0 96.3
Improving Employee
Morale
87.3 90.0 76.5** 89.5 82.2
Creating Job
Opportunities within
the Company
46.3 49.6 33.8* 50.8 35.3**
Improving Productivity 92.8 92.4 94.2 92.9 92.5
Ensuring
Customers/Clients are
Satisfied
97.4 98.0 94.3 97.9 96.4
Making a Contribution
to Society
32.1 32.3 29.9 32.4 30.8
Increasing Share
Price
45.0 41.8 54.1 46.4 42.3
Diversifying and
Expanding into New
Markets
48.8 48.4 53.7 47.9 50.5
Safeguarding Existing
Employee Jobs
66.2 67.2 55.9 68.8 60.2
Reducing Costs 80.1 79.8 81.8 76.9 87.3*
Ensuring Employees
are Fairly Treated
94.2 94.4 92.5 97.1 87.5**
Ensuring Other
Stakeholders are
Satisfied
67.2 68.4 59.7 67.2 66.7
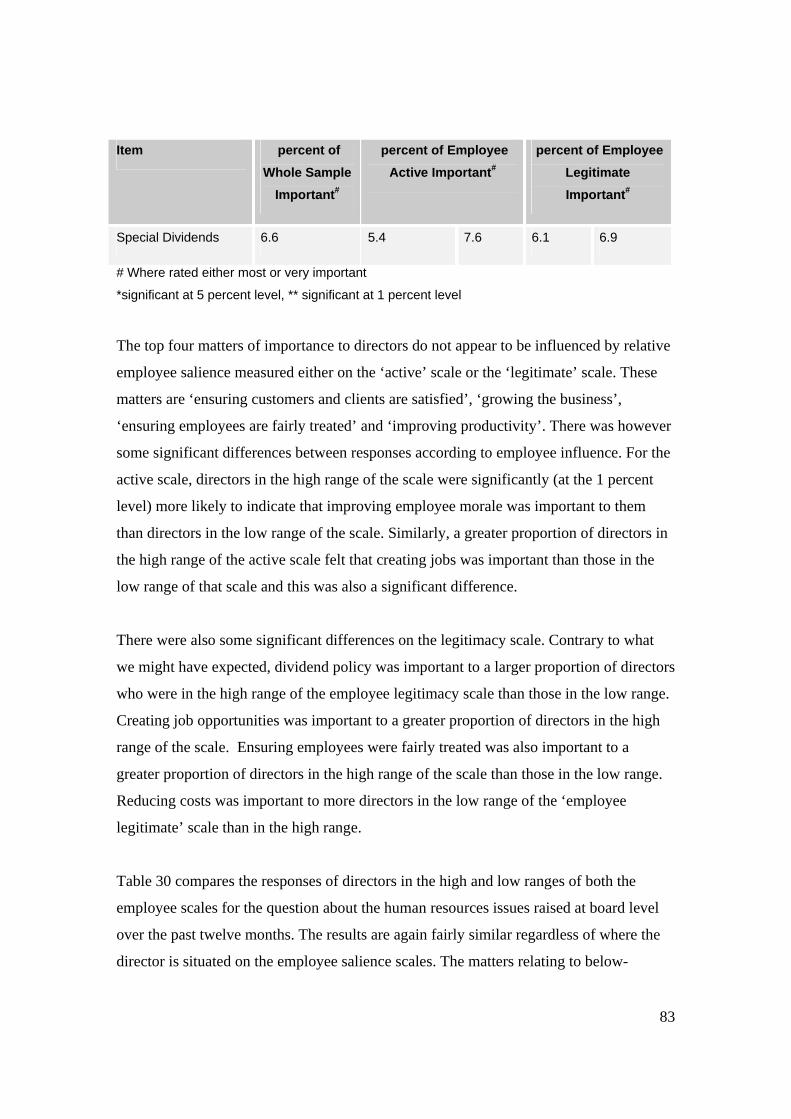
83
Item percent of Whole Sample
Important#
percent of Employee Active Important#
percent of Employee Legitimate Important#
Special Dividends 6.6 5.4 7.6 6.1 6.9
# Where rated either most or very important
*significant at 5 percent level, ** significant at 1 percent level
The top four matters of importance to directors do not appear to be influenced by relative
employee salience measured either on the ‘active’ scale or the ‘legitimate’ scale. These
matters are ‘ensuring customers and clients are satisfied’, ‘growing the business’,
‘ensuring employees are fairly treated’ and ‘improving productivity’. There was however
some significant differences between responses according to employee influence. For the
active scale, directors in the high range of the scale were significantly (at the 1 percent
level) more likely to indicate that improving employee morale was important to them
than directors in the low range of the scale. Similarly, a greater proportion of directors in
the high range of the active scale felt that creating jobs was important than those in the
low range of that scale and this was also a significant difference.
There were also some significant differences on the legitimacy scale. Contrary to what
we might have expected, dividend policy was important to a larger proportion of directors
who were in the high range of the employee legitimacy scale than those in the low range.
Creating job opportunities was important to a greater proportion of directors in the high
range of the scale. Ensuring employees were fairly treated was also important to a
greater proportion of directors in the high range of the scale than those in the low range.
Reducing costs was important to more directors in the low range of the ‘employee
legitimate’ scale than in the high range.
Table 30 compares the responses of directors in the high and low ranges of both the
employee scales for the question about the human resources issues raised at board level
over the past twelve months. The results are again fairly similar regardless of where the
director is situated on the employee salience scales. The matters relating to below-

84
executive level employees raised most often at board level were occupational health and
safety, training, productivity and performance management. There was one statistically
significant difference, with employee share schemes more likely to be raised in
companies where directors are in the high range of the employee legitimacy scale (19
percent of directors in the high range of this scale compared with 9.1 percent of those in
the low range).
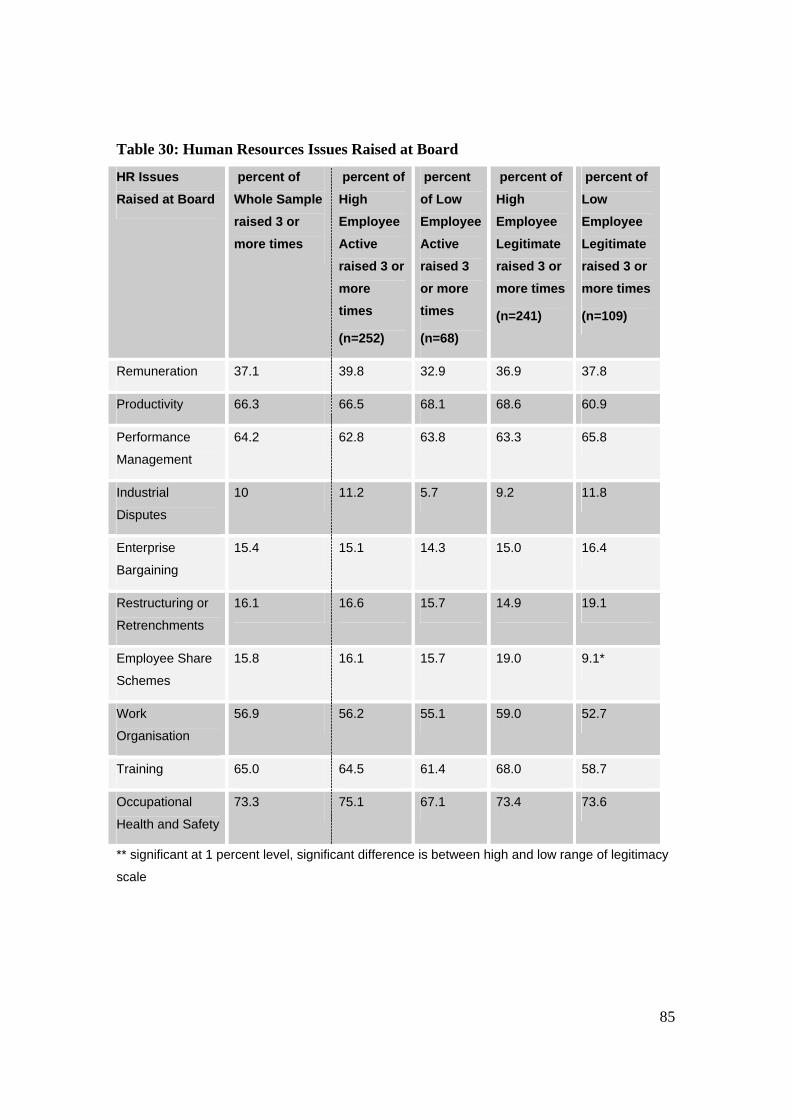
85
Table 30: Human Resources Issues Raised at Board
HR Issues Raised at Board
percent of Whole Sample raised 3 or more times
percent of High Employee Active raised 3 or more times
(n=252)
percent of Low Employee Active raised 3 or more times
(n=68)
percent of High Employee Legitimate raised 3 or more times
(n=241)
percent of Low Employee Legitimate raised 3 or more times
(n=109)
Remuneration 37.1 39.8 32.9 36.9 37.8
Productivity 66.3 66.5 68.1 68.6 60.9
Performance
Management
64.2 62.8 63.8 63.3 65.8
Industrial
Disputes
10 11.2 5.7 9.2 11.8
Enterprise
Bargaining
15.4 15.1 14.3 15.0 16.4
Restructuring or
Retrenchments
16.1 16.6 15.7 14.9 19.1
Employee Share
Schemes
15.8 16.1 15.7 19.0 9.1*
Work
Organisation
56.9 56.2 55.1 59.0 52.7
Training 65.0 64.5 61.4 68.0 58.7
Occupational
Health and Safety
73.3 75.1 67.1 73.4 73.6
** significant at 1 percent level, significant difference is between high and low range of legitimacy
scale
86
Partnership
We have already seen that directors’ perceptions of shareholder salience did not seem to
have a relationship with directors’ responses to the question of partnership and that this
was contrary to our hypothesis. This section compares the responses of directors on the
partnership question in order to ascertain whether employee salience seems to have a
relationship with directors’ understanding of the existence of partnership between the
company and its employees.
Table 31 and Table 32 show these results. The results on the relationship between
partnership and employee salience are useful for our exploration of the notion of
partnership as they show that companies situated in the high range of both the employees
active and employees legitimate scale were significantly more likely to identify a
partnership relationship between the company and its employees. While 82 percent of
those in the high range of the ‘employees active’ scale and 83.1 percent of those in the
high range of the ‘employees legitimate’ scale said that the relationship with employees
was best described as a partnership, only 59.4 percent and 63.1 percent in the low range
of the respective scales did. However, where directors were located on either scale did
not make a difference to the type of partnership identified, nor to the reasons provided for
the non-existence of a partnership relationship. This suggests that while partnership is not
related to shareholder influence as we had hypothesised, it does appear to be related to
employee influence and seems to be more likely where employees are viewed as having
power, legitimacy and voice within the company.
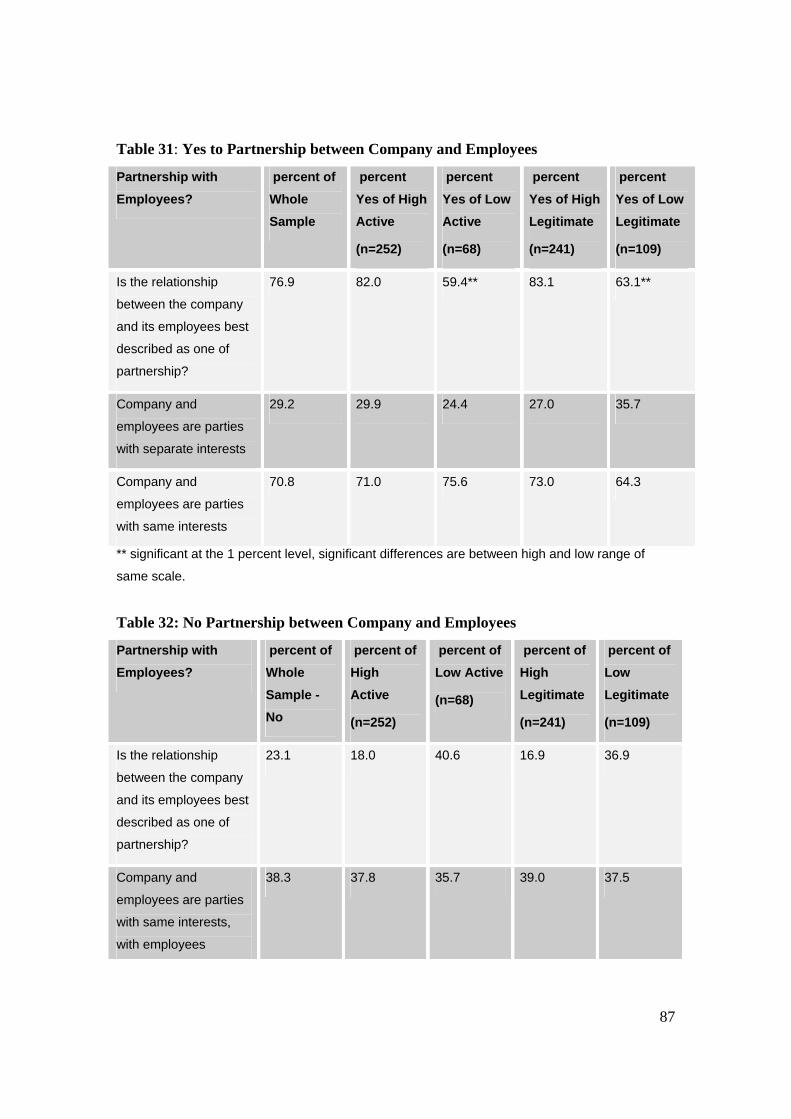
87
Table 31: Yes to Partnership between Company and Employees
Partnership with Employees?
percent of Whole Sample
percent Yes of High Active
(n=252)
percent Yes of Low Active
(n=68)
percent Yes of High Legitimate
(n=241)
percent Yes of Low Legitimate
(n=109)
Is the relationship
between the company
and its employees best
described as one of
partnership?
76.9 82.0 59.4** 83.1 63.1**
Company and
employees are parties
with separate interests
29.2 29.9 24.4 27.0 35.7
Company and
employees are parties
with same interests
70.8 71.0 75.6 73.0 64.3
** significant at the 1 percent level, significant differences are between high and low range of
same scale.
Table 32: No Partnership between Company and Employees
Partnership with Employees?
percent of Whole Sample - No
percent of High Active
(n=252)
percent of Low Active
(n=68)
percent of High Legitimate
(n=241)
percent of Low Legitimate
(n=109)
Is the relationship
between the company
and its employees best
described as one of
partnership?
23.1 18.0 40.6 16.9 36.9
Company and
employees are parties
with same interests,
with employees
38.3 37.8 35.7 39.0 37.5
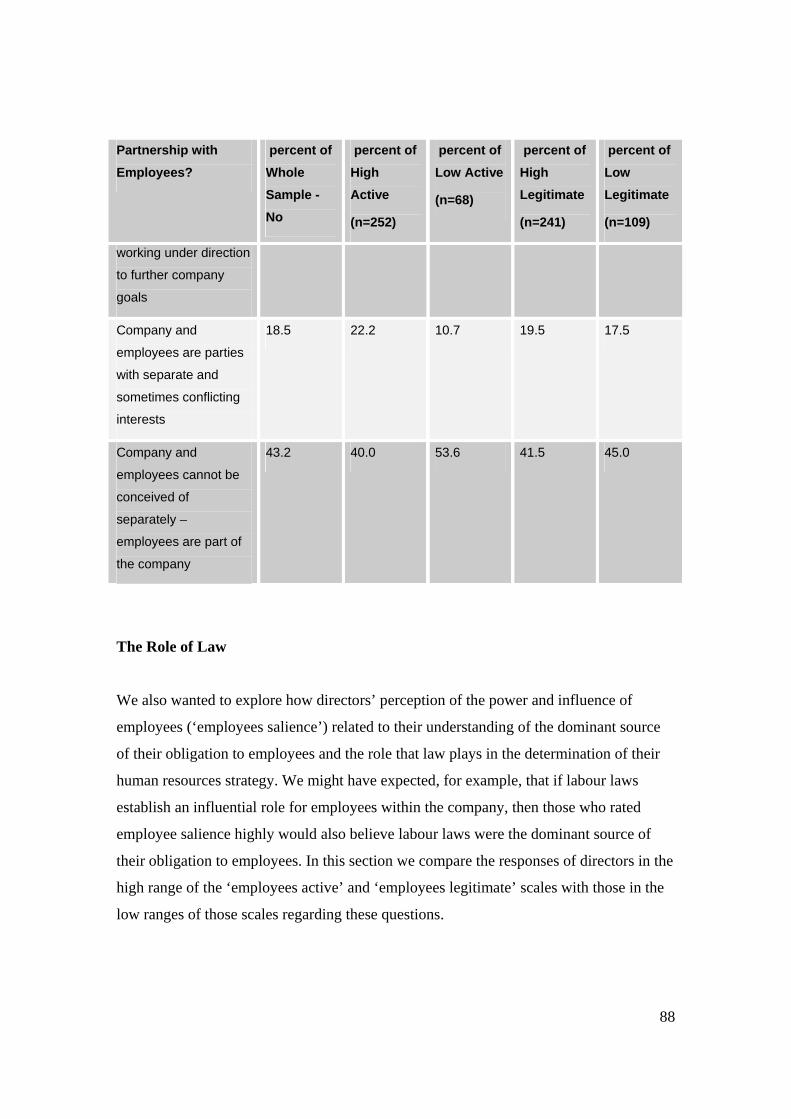
88
Partnership with Employees?
percent of Whole Sample - No
percent of High Active
(n=252)
percent of Low Active
(n=68)
percent of High Legitimate
(n=241)
percent of Low Legitimate
(n=109)
working under direction
to further company
goals
Company and
employees are parties
with separate and
sometimes conflicting
interests
18.5 22.2 10.7 19.5 17.5
Company and
employees cannot be
conceived of
separately –
employees are part of
the company
43.2 40.0 53.6 41.5 45.0
The Role of Law
We also wanted to explore how directors’ perception of the power and influence of
employees (‘employees salience’) related to their understanding of the dominant source
of their obligation to employees and the role that law plays in the determination of their
human resources strategy. We might have expected, for example, that if labour laws
establish an influential role for employees within the company, then those who rated
employee salience highly would also believe labour laws were the dominant source of
their obligation to employees. In this section we compare the responses of directors in the
high range of the ‘employees active’ and ‘employees legitimate’ scales with those in the
low ranges of those scales regarding these questions.
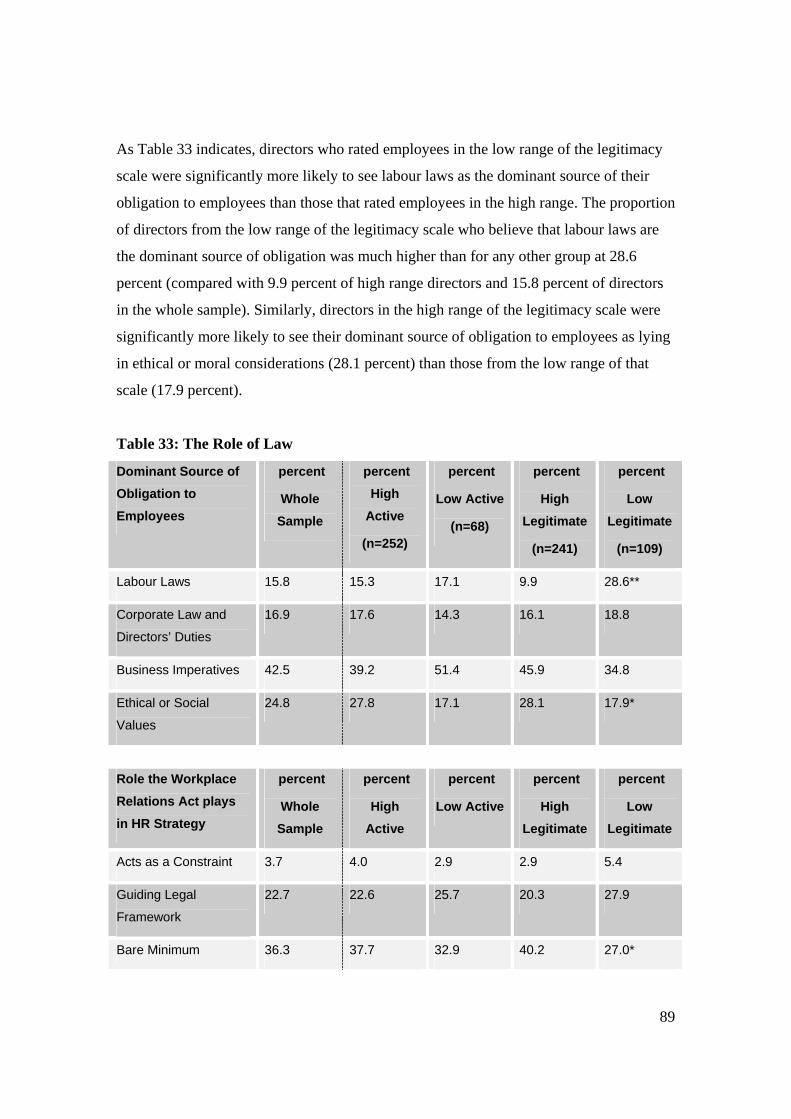
89
As Table 33 indicates, directors who rated employees in the low range of the legitimacy
scale were significantly more likely to see labour laws as the dominant source of their
obligation to employees than those that rated employees in the high range. The proportion
of directors from the low range of the legitimacy scale who believe that labour laws are
the dominant source of obligation was much higher than for any other group at 28.6
percent (compared with 9.9 percent of high range directors and 15.8 percent of directors
in the whole sample). Similarly, directors in the high range of the legitimacy scale were
significantly more likely to see their dominant source of obligation to employees as lying
in ethical or moral considerations (28.1 percent) than those from the low range of that
scale (17.9 percent).
Table 33: The Role of Law
Dominant Source of Obligation to Employees
percent
Whole Sample
percent High
Active
(n=252)
percent
Low Active
(n=68)
percent
High Legitimate
(n=241)
percent
Low Legitimate
(n=109)
Labour Laws 15.8 15.3 17.1 9.9 28.6**
Corporate Law and
Directors’ Duties
16.9 17.6 14.3 16.1 18.8
Business Imperatives 42.5 39.2 51.4 45.9 34.8
Ethical or Social
Values
24.8 27.8 17.1 28.1 17.9*
Role the Workplace Relations Act plays in HR Strategy
percent
Whole Sample
percent
High Active
percent
Low Active
percent
High Legitimate
percent
Low Legitimate
Acts as a Constraint 3.7 4.0 2.9 2.9 5.4
Guiding Legal
Framework
22.7 22.6 25.7 20.3 27.9
Bare Minimum 36.3 37.7 32.9 40.2 27.0*
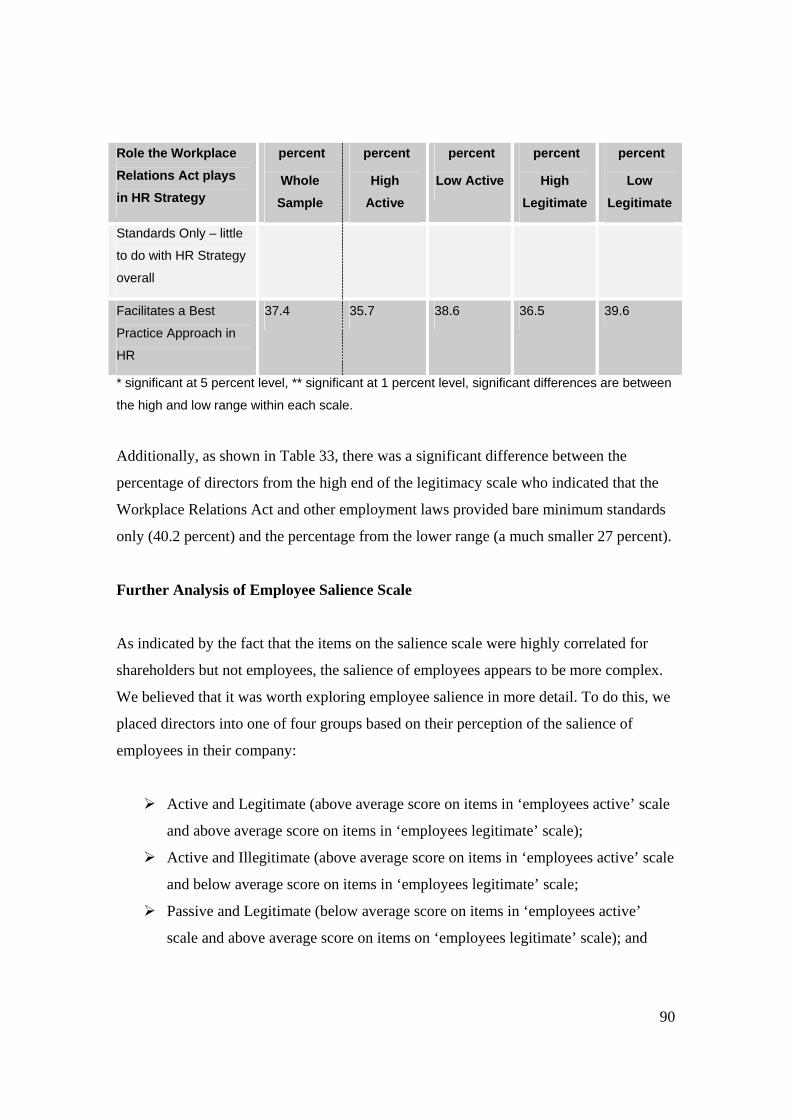
90
Role the Workplace Relations Act plays in HR Strategy
percent
Whole Sample
percent
High Active
percent
Low Active
percent
High Legitimate
percent
Low Legitimate
Standards Only – little
to do with HR Strategy
overall
Facilitates a Best
Practice Approach in
HR
37.4 35.7 38.6 36.5 39.6
* significant at 5 percent level, ** significant at 1 percent level, significant differences are between
the high and low range within each scale.
Additionally, as shown in Table 33, there was a significant difference between the
percentage of directors from the high end of the legitimacy scale who indicated that the
Workplace Relations Act and other employment laws provided bare minimum standards
only (40.2 percent) and the percentage from the lower range (a much smaller 27 percent).
Further Analysis of Employee Salience Scale
As indicated by the fact that the items on the salience scale were highly correlated for
shareholders but not employees, the salience of employees appears to be more complex.
We believed that it was worth exploring employee salience in more detail. To do this, we
placed directors into one of four groups based on their perception of the salience of
employees in their company:
Active and Legitimate (above average score on items in ‘employees active’ scale
and above average score on items in ‘employees legitimate’ scale);
Active and Illegitimate (above average score on items in ‘employees active’ scale
and below average score on items in ‘employees legitimate’ scale;
Passive and Legitimate (below average score on items in ‘employees active’
scale and above average score on items on ‘employees legitimate’ scale); and
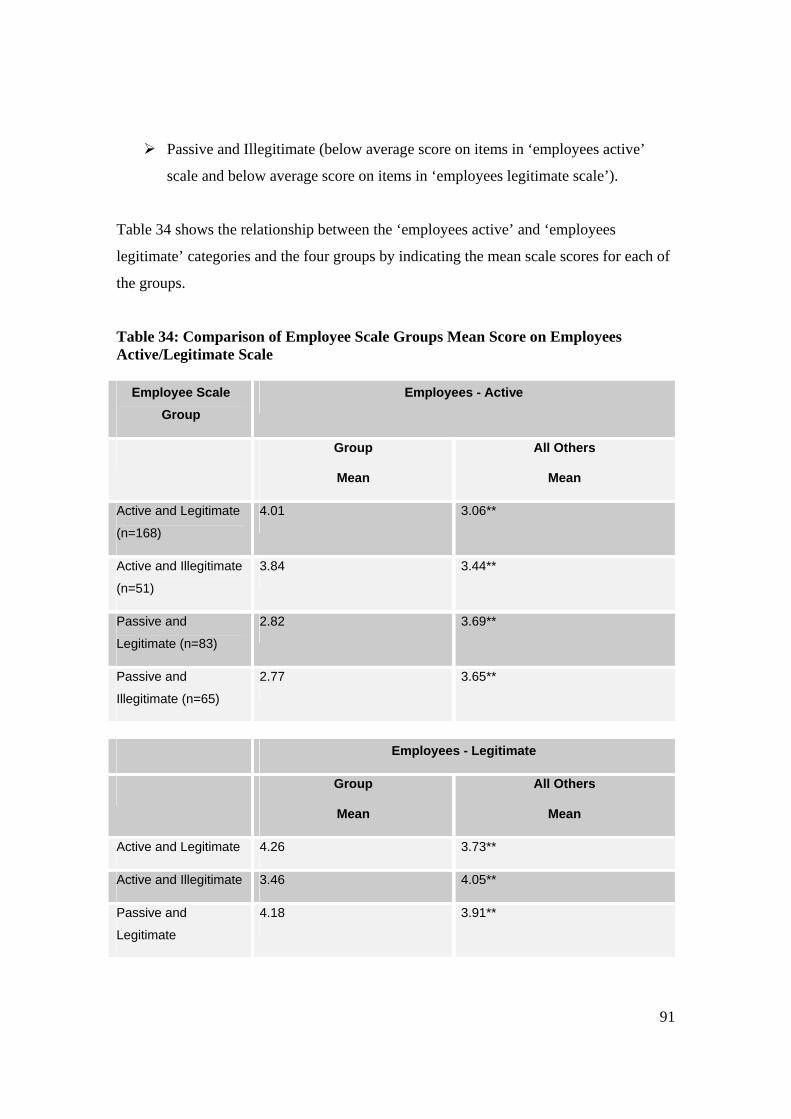
91
Passive and Illegitimate (below average score on items in ‘employees active’
scale and below average score on items in ‘employees legitimate scale’).
Table 34 shows the relationship between the ‘employees active’ and ‘employees
legitimate’ categories and the four groups by indicating the mean scale scores for each of
the groups.
Table 34: Comparison of Employee Scale Groups Mean Score on Employees Active/Legitimate Scale
Employee Scale Group
Employees - Active
Group
Mean
All Others
Mean
Active and Legitimate
(n=168)
4.01 3.06**
Active and Illegitimate
(n=51)
3.84 3.44**
Passive and
Legitimate (n=83)
2.82 3.69**
Passive and
Illegitimate (n=65)
2.77 3.65**
Employees - Legitimate
Group
Mean
All Others
Mean
Active and Legitimate 4.26 3.73**
Active and Illegitimate 3.46 4.05**
Passive and
Legitimate
4.18 3.91**
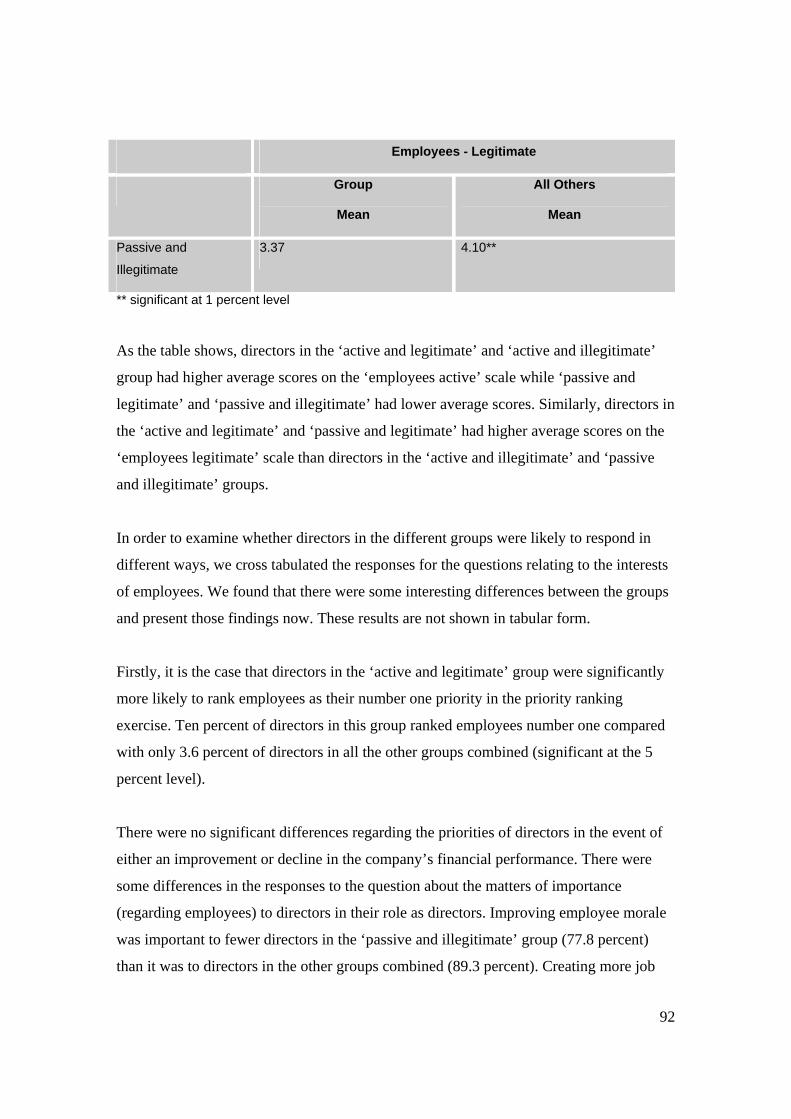
92
Employees - Legitimate
Group
Mean
All Others
Mean
Passive and
Illegitimate
3.37 4.10**
** significant at 1 percent level
As the table shows, directors in the ‘active and legitimate’ and ‘active and illegitimate’
group had higher average scores on the ‘employees active’ scale while ‘passive and
legitimate’ and ‘passive and illegitimate’ had lower average scores. Similarly, directors in
the ‘active and legitimate’ and ‘passive and legitimate’ had higher average scores on the
‘employees legitimate’ scale than directors in the ‘active and illegitimate’ and ‘passive
and illegitimate’ groups.
In order to examine whether directors in the different groups were likely to respond in
different ways, we cross tabulated the responses for the questions relating to the interests
of employees. We found that there were some interesting differences between the groups
and present those findings now. These results are not shown in tabular form.
Firstly, it is the case that directors in the ‘active and legitimate’ group were significantly
more likely to rank employees as their number one priority in the priority ranking
exercise. Ten percent of directors in this group ranked employees number one compared
with only 3.6 percent of directors in all the other groups combined (significant at the 5
percent level).
There were no significant differences regarding the priorities of directors in the event of
either an improvement or decline in the company’s financial performance. There were
some differences in the responses to the question about the matters of importance
(regarding employees) to directors in their role as directors. Improving employee morale
was important to fewer directors in the ‘passive and illegitimate’ group (77.8 percent)
than it was to directors in the other groups combined (89.3 percent). Creating more job
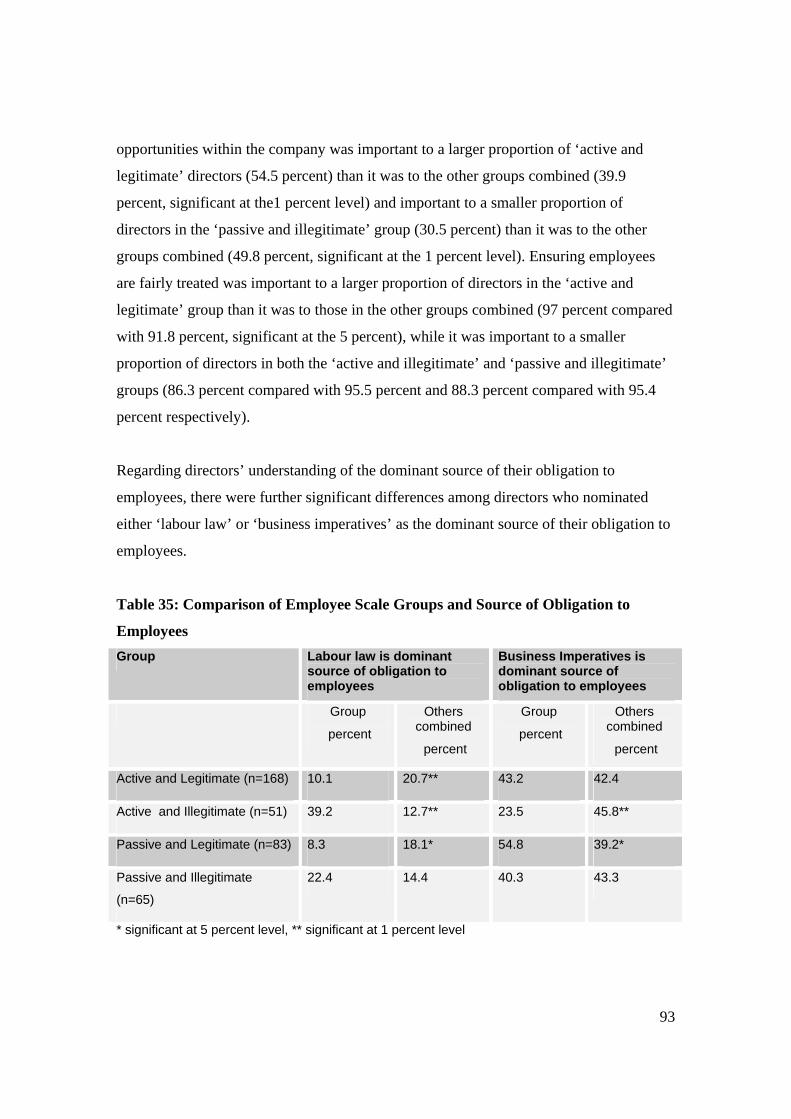
93
opportunities within the company was important to a larger proportion of ‘active and
legitimate’ directors (54.5 percent) than it was to the other groups combined (39.9
percent, significant at the1 percent level) and important to a smaller proportion of
directors in the ‘passive and illegitimate’ group (30.5 percent) than it was to the other
groups combined (49.8 percent, significant at the 1 percent level). Ensuring employees
are fairly treated was important to a larger proportion of directors in the ‘active and
legitimate’ group than it was to those in the other groups combined (97 percent compared
with 91.8 percent, significant at the 5 percent), while it was important to a smaller
proportion of directors in both the ‘active and illegitimate’ and ‘passive and illegitimate’
groups (86.3 percent compared with 95.5 percent and 88.3 percent compared with 95.4
percent respectively).
Regarding directors’ understanding of the dominant source of their obligation to
employees, there were further significant differences among directors who nominated
either ‘labour law’ or ‘business imperatives’ as the dominant source of their obligation to
employees.
Table 35: Comparison of Employee Scale Groups and Source of Obligation to
Employees Group Labour law is dominant
source of obligation to employees
Business Imperatives is dominant source of obligation to employees
Group
percent
Others combined
percent
Group
percent
Others combined
percent
Active and Legitimate (n=168) 10.1 20.7** 43.2 42.4
Active and Illegitimate (n=51) 39.2 12.7** 23.5 45.8**
Passive and Legitimate (n=83) 8.3 18.1* 54.8 39.2*
Passive and Illegitimate
(n=65)
22.4 14.4 40.3 43.3
* significant at 5 percent level, ** significant at 1 percent level
94
As Table 35 indicates, directors in both the ‘active and legitimate’ and ‘passive and
legitimate’ groups were less likely to indicate that labour law is the dominant source of
obligation to employees. Those in the ‘active and illegitimate’ group were more likely
(39.2 percent) than the other groups combined (12.7 percent) to indicate that labour law
was the dominant source of obligation and less likely to indicate that business
imperatives were the dominant source (23.5 percent compared with 45.8 percent). These
findings seem to suggest that it is directors’ sense of the legitimacy of employees claims
that is more important to their outlook than directors’ sense of employees’ activity or
urgency of claim making.
Similarly, directors who were in the ‘active and legitimate’ group were more likely to
indicate that the Workplace Relations Act and other employment laws provided the bare
minimum standards only (42.5 percent compared with 31.4 percent) whereas those in the
‘passive and illegitimate’ group were less likely to indicate this (23.9 percent compared
with 39.1 percent).
As would be expected, a larger proportion of directors in the ‘active and legitimate’
group indicated that the relationship between their company and its employees could best
be described as being one of partnership (89.3 percent compared with 67.2 percent,
significant at the 1 percent level) whereas those in the ‘passive and illegitimate’ group
were less likely to indicate this (60.6 percent compared with 80.8 percent, significant at
the 1 percent level).
Interestingly, there appears to be a relationship between directors’ responses to the
employee salience scale and their responses to items on both the shareholder salience
scale and the creditors scale. Directors in the ‘active and legitimate’ group were more
likely to agree that shareholders had actively sought the attention of management (71.1
percent compared with 59.1 percent), and that shareholders demands or wishes were
perceived as legitimate (84.8 percent compared with 73.2 percent). On the other hand,
directors in the ‘passive and illegitimate’ group were less likely to agree that shareholders
urgently communicated their demands or wishes (36.9 percent compared with 51.2
95
percent), that shareholders demands were viewed as legitimate (67.7 percent compared
with 80.8 percent) and that shareholders received a high degree of time and attention
from management (49.2 percent compared with 68.3 percent).
In relation to creditors, the findings are more complex. Directors in the ‘active and
illegitimate’ group were more likely to agree that creditors were active in pursuing
demands (31.4 percent compared with 18.0 percent) and that creditors urgently
communicated their demands or wishes (39.2 percent compared with 16.0 percent).
However, they were less likely to agree that satisfying the demands or wishes of creditors
was important (40.8 percent compared with 56.0 percent).
Directors in the ‘active and legitimate’ group were more likely to agree that creditors had
received a high degree of time and attention from management (35.5 percent compared
with 24.9 percent) while those in the ‘passive and illegitimate’ group were less likely to
agree with this statement (18.5 percent compared with 32.1 percent).
Overall, these findings suggest that directors’ attitudes to one stakeholder group may be
related to their attitudes to other stakeholder groups. It appears that in some ways,
directors who perceive employees to be active and legitimate are more inclined to be
receptive to claims by shareholders and creditors, while those who perceive employees to
be less active and legitimate are not as likely to be receptive to such claims.
11.3 Company Characteristics
A central issue for the larger Corporate Governance and Workplace Partnerships Project
(of which this directors’ survey is a part) is the relationship between corporate
governance and labour management. As part of the investigation of this question, we
conducted a series of case studies of companies with a range of governance structures.
This enabled us to explore the effect of these different structures on labour management
in those companies and to have some capacity to explore whether there are differences in
approach between, for example, listed and unlisted companies. The survey of directors
96
gave us an opportunity to test these questions quantitatively. In this section, we present
the results of our analysis on these questions. We explore the following questions: first,
whether directors’ attitudes, values and priorities appear to differ according to the type of
company they direct; and second, whether the priority that directors accord to
shareholders, employees and creditors differs according to company type.
Before we move to consider these questions, it is necessary to provide some background
to our analysis. As we described in Section 5, we gathered data from directors about
some of the characteristics of the company of which they were director, including
whether the company was listed or not, its size by turnover, its legal structure (public or
proprietary), the size of the board, and the number of employees. In part, this information
was gathered to allow us to attempt to build typologies of companies based on the
categories ‘market/outsider’ and ‘relational/insider’, derived from the work of Howard
Gospel and Andrew Pendleton.30 Based on their analysis of broad company
characteristics in market/outsider and relational/insider national systems, we established a
set of criteria which would allow us to categorise the companies represented in our
sample as belonging either to the market/outsider or relational/insider group.31 The
selected criteria relate to particular characteristics such as whether there was shareholder
representation on the board, the level of shareholding by institutional investors, and
whether the company was listed or not, among others. This was done to enable us to
compare the responses of directors from these different types of companies and thereby
test aspects of the theoretical framework offered by these authors. Our modelling is,
however, fairly experimental and it is necessary to bear this in mind when considering the
30 H. Gospel and A. Pendleton (eds), Corporate Governance and Labour Management, Oxford University Press, Oxford, 2005; see also H. Gospel and A. Pendleton, Financial Structure, Corporate Governance and the Management of Labour, Research Paper No 6, Kings College London, The University of London, October 2001. 31 The model comprises six criteria which are characteristics we would expect to find in a market/outsider company. These are: listed company; largest shareholder not represented on the board; no other shareholders represented on the board; higher level of holding by institutional investors; short term debt financing; and creditors not represented on the board. For the relational/insider model the criteria are: unlisted company; largest shareholder is on the board; other shareholders on the board; lower level of institutional holding; long term debt financing; and creditors on the boards. Each item was given a score 1=present, 0=not present and two indexes developed Index.I6 and Index.O6. Those which scored 4 or more on the Index.I6 were categorised as HighIns6 and those that scored 3 or more on the Index.O6 were categorised as HighOut6.
97
findings. Reliability tests on the scale items show that they are not highly correlated
(alpha = .4434). This may either point to a flaw in the model used or a more serious
problem with the theoretical argument. For future analysis, the item ‘debt financing’ can
be removed and this would improve the model somewhat (alpha if ‘debt financing’
removed = .5143).
We have presented some of the results of our exploration of the relationship between
company characteristics and directors’ priorities earlier in this report (Section 7). These
findings indicated that the top three priorities for directors did not vary according to
company type, whether between listed and unlisted companies, public and proprietary
companies or ‘insider’ and ‘outsider’ companies. There were, however, some differences
between the responses of directors in listed companies and those in unlisted companies,
with listed company directors more likely to indicate that ‘increasing the share price’ was
important to them while directors of unlisted companies were more likely than those of
listed companies to indicate that ‘safeguarding existing employees jobs’ was important.
Table 8, above, sets out these differences.
When it came to directors’ priorities in the event of deterioration in the financial
performance of the company, we saw that directors in listed companies, public companies
and ‘outsider’ companies were less likely to prioritise a decrease in the dividend paid to
shareholders than were their counterparts in unlisted companies, proprietary companies
and ‘insider’ companies. These findings are discussed in Section 7.
Are there other significant differences between different types of companies that are
evident from the survey? We begin with an examination of the difference between listed
and unlisted companies, and between public and proprietary companies before moving to
consider differences between ‘insider’ and ‘outsider’ companies.
To begin with the findings on the priority order given to stakeholders by directors, we see
that directors in listed companies are more likely than directors in unlisted companies to
rank shareholders as their number one priority. A larger proportion of directors from
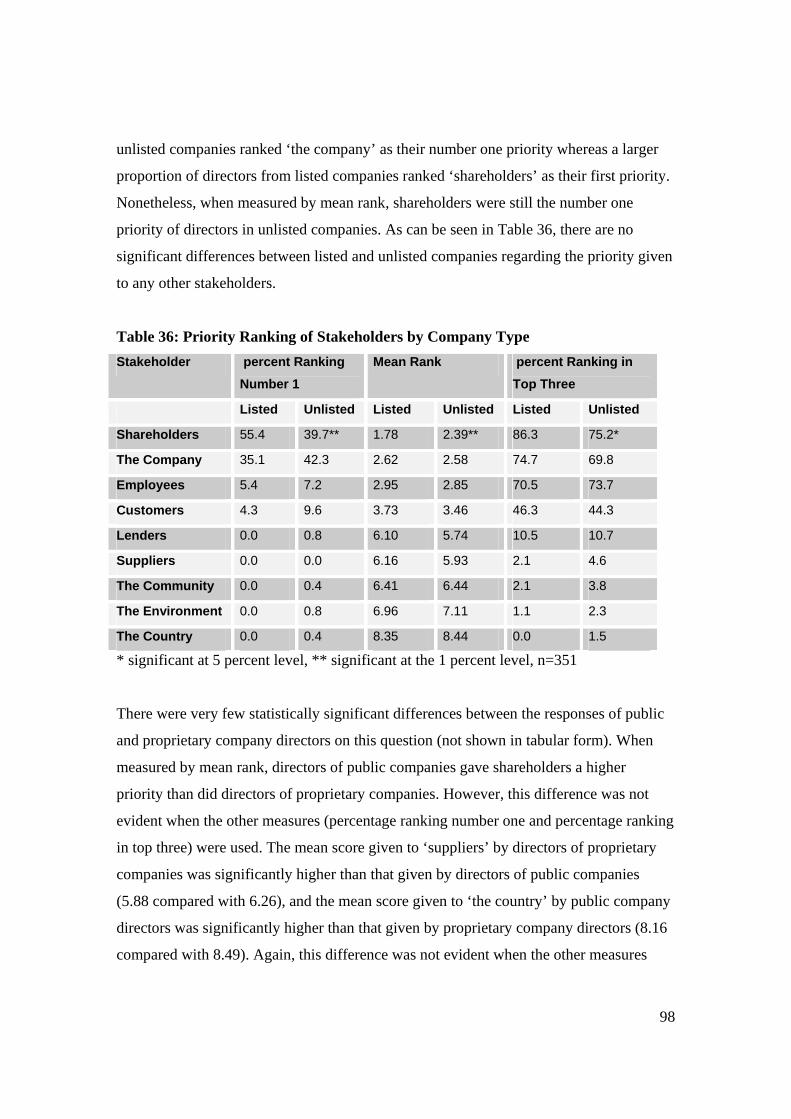
98
unlisted companies ranked ‘the company’ as their number one priority whereas a larger
proportion of directors from listed companies ranked ‘shareholders’ as their first priority.
Nonetheless, when measured by mean rank, shareholders were still the number one
priority of directors in unlisted companies. As can be seen in Table 36, there are no
significant differences between listed and unlisted companies regarding the priority given
to any other stakeholders.
Table 36: Priority Ranking of Stakeholders by Company Type Stakeholder percent Ranking
Number 1
Mean Rank percent Ranking in Top Three
Listed Unlisted Listed Unlisted Listed Unlisted
Shareholders 55.4 39.7** 1.78 2.39** 86.3 75.2*
The Company 35.1 42.3 2.62 2.58 74.7 69.8
Employees 5.4 7.2 2.95 2.85 70.5 73.7
Customers 4.3 9.6 3.73 3.46 46.3 44.3
Lenders 0.0 0.8 6.10 5.74 10.5 10.7
Suppliers 0.0 0.0 6.16 5.93 2.1 4.6
The Community 0.0 0.4 6.41 6.44 2.1 3.8
The Environment 0.0 0.8 6.96 7.11 1.1 2.3
The Country 0.0 0.4 8.35 8.44 0.0 1.5
* significant at 5 percent level, ** significant at the 1 percent level, n=351
There were very few statistically significant differences between the responses of public
and proprietary company directors on this question (not shown in tabular form). When
measured by mean rank, directors of public companies gave shareholders a higher
priority than did directors of proprietary companies. However, this difference was not
evident when the other measures (percentage ranking number one and percentage ranking
in top three) were used. The mean score given to ‘suppliers’ by directors of proprietary
companies was significantly higher than that given by directors of public companies
(5.88 compared with 6.26), and the mean score given to ‘the country’ by public company
directors was significantly higher than that given by proprietary company directors (8.16
compared with 8.49). Again, this difference was not evident when the other measures
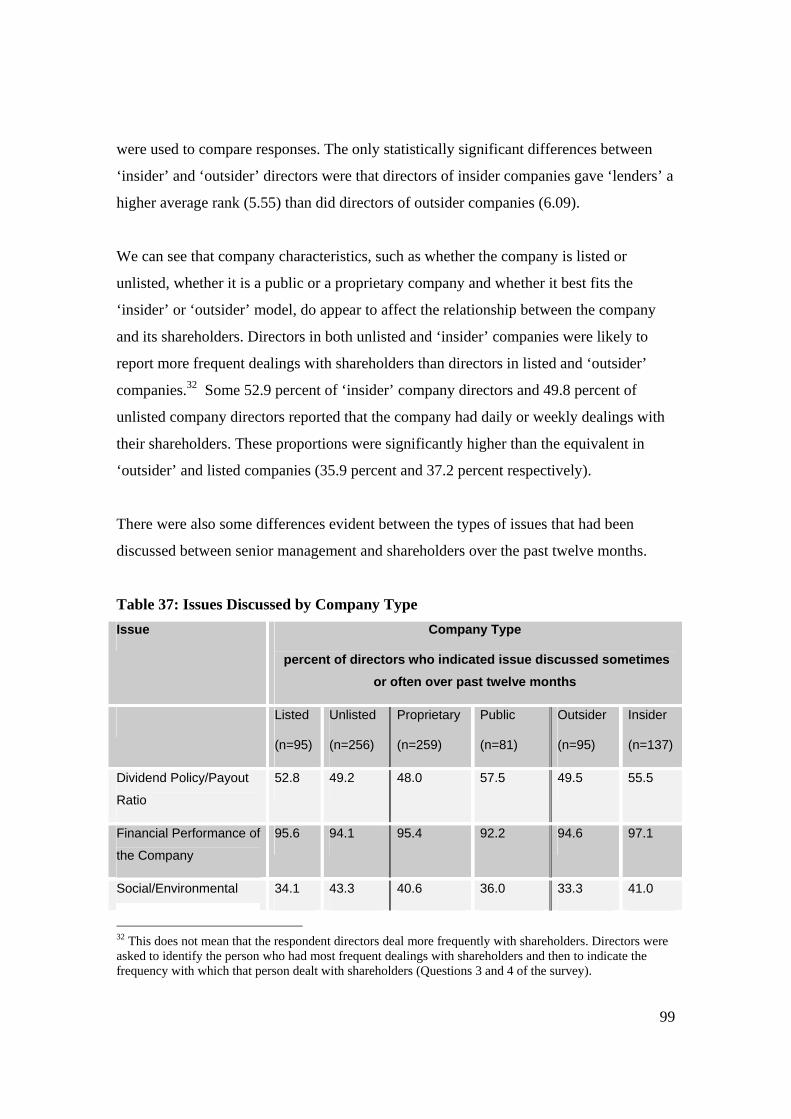
99
were used to compare responses. The only statistically significant differences between
‘insider’ and ‘outsider’ directors were that directors of insider companies gave ‘lenders’ a
higher average rank (5.55) than did directors of outsider companies (6.09).
We can see that company characteristics, such as whether the company is listed or
unlisted, whether it is a public or a proprietary company and whether it best fits the
‘insider’ or ‘outsider’ model, do appear to affect the relationship between the company
and its shareholders. Directors in both unlisted and ‘insider’ companies were likely to
report more frequent dealings with shareholders than directors in listed and ‘outsider’
companies.32 Some 52.9 percent of ‘insider’ company directors and 49.8 percent of
unlisted company directors reported that the company had daily or weekly dealings with
their shareholders. These proportions were significantly higher than the equivalent in
‘outsider’ and listed companies (35.9 percent and 37.2 percent respectively).
There were also some differences evident between the types of issues that had been
discussed between senior management and shareholders over the past twelve months.
Table 37: Issues Discussed by Company Type Issue Company Type
percent of directors who indicated issue discussed sometimes or often over past twelve months
Listed
(n=95)
Unlisted
(n=256)
Proprietary
(n=259)
Public
(n=81)
Outsider
(n=95)
Insider
(n=137)
Dividend Policy/Payout
Ratio
52.8 49.2 48.0 57.5 49.5 55.5
Financial Performance of
the Company
95.6 94.1 95.4 92.2 94.6 97.1
Social/Environmental 34.1 43.3 40.6 36.0 33.3 41.0
32 This does not mean that the respondent directors deal more frequently with shareholders. Directors were asked to identify the person who had most frequent dealings with shareholders and then to indicate the frequency with which that person dealt with shareholders (Questions 3 and 4 of the survey).
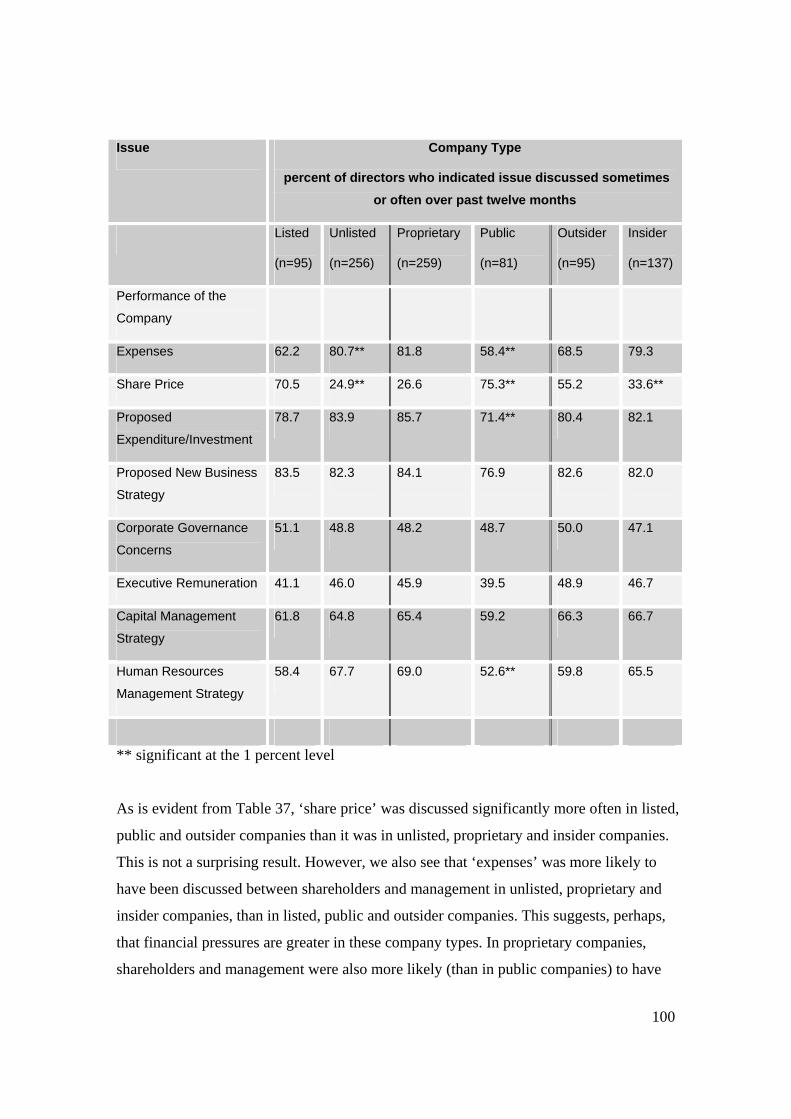
100
Issue Company Type
percent of directors who indicated issue discussed sometimes or often over past twelve months
Listed
(n=95)
Unlisted
(n=256)
Proprietary
(n=259)
Public
(n=81)
Outsider
(n=95)
Insider
(n=137)
Performance of the
Company
Expenses 62.2 80.7** 81.8 58.4** 68.5 79.3
Share Price 70.5 24.9** 26.6 75.3** 55.2 33.6**
Proposed
Expenditure/Investment
78.7 83.9 85.7 71.4** 80.4 82.1
Proposed New Business
Strategy
83.5 82.3 84.1 76.9 82.6 82.0
Corporate Governance
Concerns
51.1 48.8 48.2 48.7 50.0 47.1
Executive Remuneration 41.1 46.0 45.9 39.5 48.9 46.7
Capital Management
Strategy
61.8 64.8 65.4 59.2 66.3 66.7
Human Resources
Management Strategy
58.4 67.7 69.0 52.6** 59.8 65.5
** significant at the 1 percent level
As is evident from Table 37, ‘share price’ was discussed significantly more often in listed,
public and outsider companies than it was in unlisted, proprietary and insider companies.
This is not a surprising result. However, we also see that ‘expenses’ was more likely to
have been discussed between shareholders and management in unlisted, proprietary and
insider companies, than in listed, public and outsider companies. This suggests, perhaps,
that financial pressures are greater in these company types. In proprietary companies,
shareholders and management were also more likely (than in public companies) to have
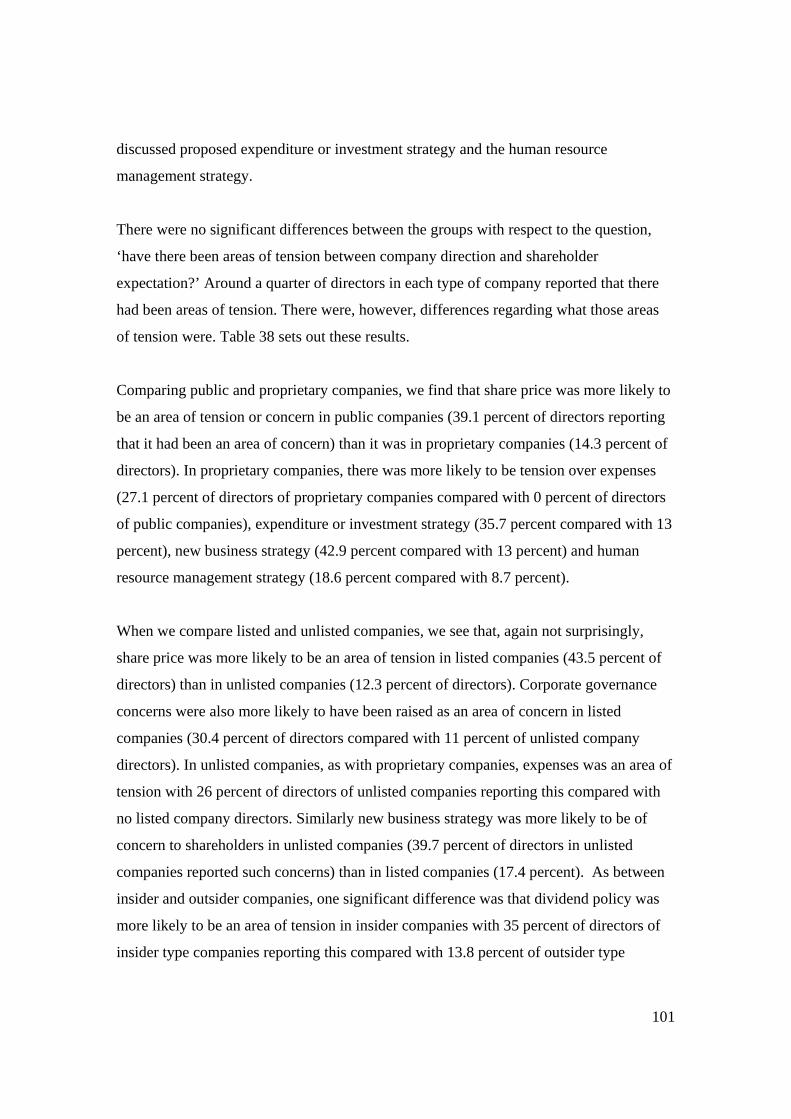
101
discussed proposed expenditure or investment strategy and the human resource
management strategy.
There were no significant differences between the groups with respect to the question,
‘have there been areas of tension between company direction and shareholder
expectation?’ Around a quarter of directors in each type of company reported that there
had been areas of tension. There were, however, differences regarding what those areas
of tension were. Table 38 sets out these results.
Comparing public and proprietary companies, we find that share price was more likely to
be an area of tension or concern in public companies (39.1 percent of directors reporting
that it had been an area of concern) than it was in proprietary companies (14.3 percent of
directors). In proprietary companies, there was more likely to be tension over expenses
(27.1 percent of directors of proprietary companies compared with 0 percent of directors
of public companies), expenditure or investment strategy (35.7 percent compared with 13
percent), new business strategy (42.9 percent compared with 13 percent) and human
resource management strategy (18.6 percent compared with 8.7 percent).
When we compare listed and unlisted companies, we see that, again not surprisingly,
share price was more likely to be an area of tension in listed companies (43.5 percent of
directors) than in unlisted companies (12.3 percent of directors). Corporate governance
concerns were also more likely to have been raised as an area of concern in listed
companies (30.4 percent of directors compared with 11 percent of unlisted company
directors). In unlisted companies, as with proprietary companies, expenses was an area of
tension with 26 percent of directors of unlisted companies reporting this compared with
no listed company directors. Similarly new business strategy was more likely to be of
concern to shareholders in unlisted companies (39.7 percent of directors in unlisted
companies reported such concerns) than in listed companies (17.4 percent). As between
insider and outsider companies, one significant difference was that dividend policy was
more likely to be an area of tension in insider companies with 35 percent of directors of
insider type companies reporting this compared with 13.8 percent of outsider type
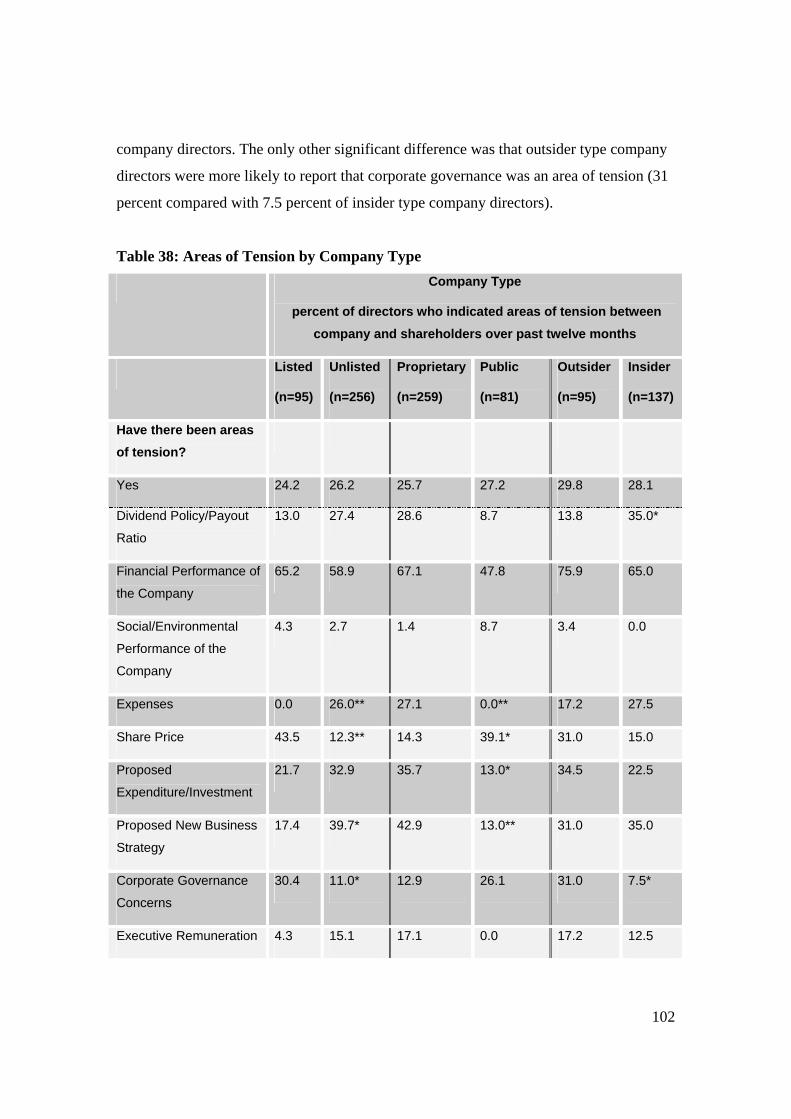
102
company directors. The only other significant difference was that outsider type company
directors were more likely to report that corporate governance was an area of tension (31
percent compared with 7.5 percent of insider type company directors).
Table 38: Areas of Tension by Company Type Company Type
percent of directors who indicated areas of tension between company and shareholders over past twelve months
Listed
(n=95)
Unlisted
(n=256)
Proprietary
(n=259)
Public
(n=81)
Outsider
(n=95)
Insider
(n=137)
Have there been areas of tension?
Yes 24.2 26.2 25.7 27.2 29.8 28.1
Dividend Policy/Payout
Ratio
13.0 27.4 28.6 8.7 13.8 35.0*
Financial Performance of
the Company
65.2 58.9 67.1 47.8 75.9 65.0
Social/Environmental
Performance of the
Company
4.3 2.7 1.4 8.7 3.4 0.0
Expenses 0.0 26.0** 27.1 0.0** 17.2 27.5
Share Price 43.5 12.3** 14.3 39.1* 31.0 15.0
Proposed
Expenditure/Investment
21.7 32.9 35.7 13.0* 34.5 22.5
Proposed New Business
Strategy
17.4 39.7* 42.9 13.0** 31.0 35.0
Corporate Governance
Concerns
30.4 11.0* 12.9 26.1 31.0 7.5*
Executive Remuneration 4.3 15.1 17.1 0.0 17.2 12.5
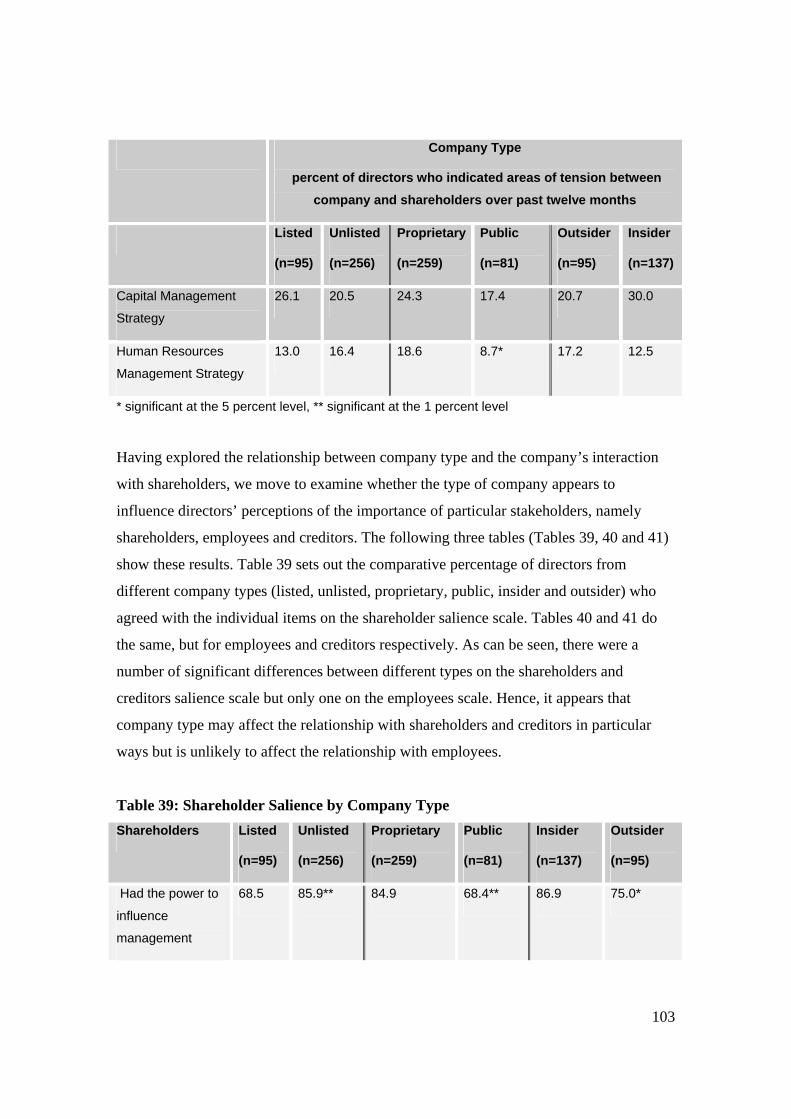
103
Company Type
percent of directors who indicated areas of tension between company and shareholders over past twelve months
Listed
(n=95)
Unlisted
(n=256)
Proprietary
(n=259)
Public
(n=81)
Outsider
(n=95)
Insider
(n=137)
Capital Management
Strategy
26.1 20.5 24.3 17.4 20.7 30.0
Human Resources
Management Strategy
13.0 16.4 18.6 8.7* 17.2 12.5
* significant at the 5 percent level, ** significant at the 1 percent level
Having explored the relationship between company type and the company’s interaction
with shareholders, we move to examine whether the type of company appears to
influence directors’ perceptions of the importance of particular stakeholders, namely
shareholders, employees and creditors. The following three tables (Tables 39, 40 and 41)
show these results. Table 39 sets out the comparative percentage of directors from
different company types (listed, unlisted, proprietary, public, insider and outsider) who
agreed with the individual items on the shareholder salience scale. Tables 40 and 41 do
the same, but for employees and creditors respectively. As can be seen, there were a
number of significant differences between different types on the shareholders and
creditors salience scale but only one on the employees scale. Hence, it appears that
company type may affect the relationship with shareholders and creditors in particular
ways but is unlikely to affect the relationship with employees.
Table 39: Shareholder Salience by Company Type Shareholders Listed
(n=95)
Unlisted
(n=256)
Proprietary
(n=259)
Public
(n=81)
Insider
(n=137)
Outsider
(n=95)
Had the power to
influence
management
68.5 85.9** 84.9 68.4** 86.9 75.0*
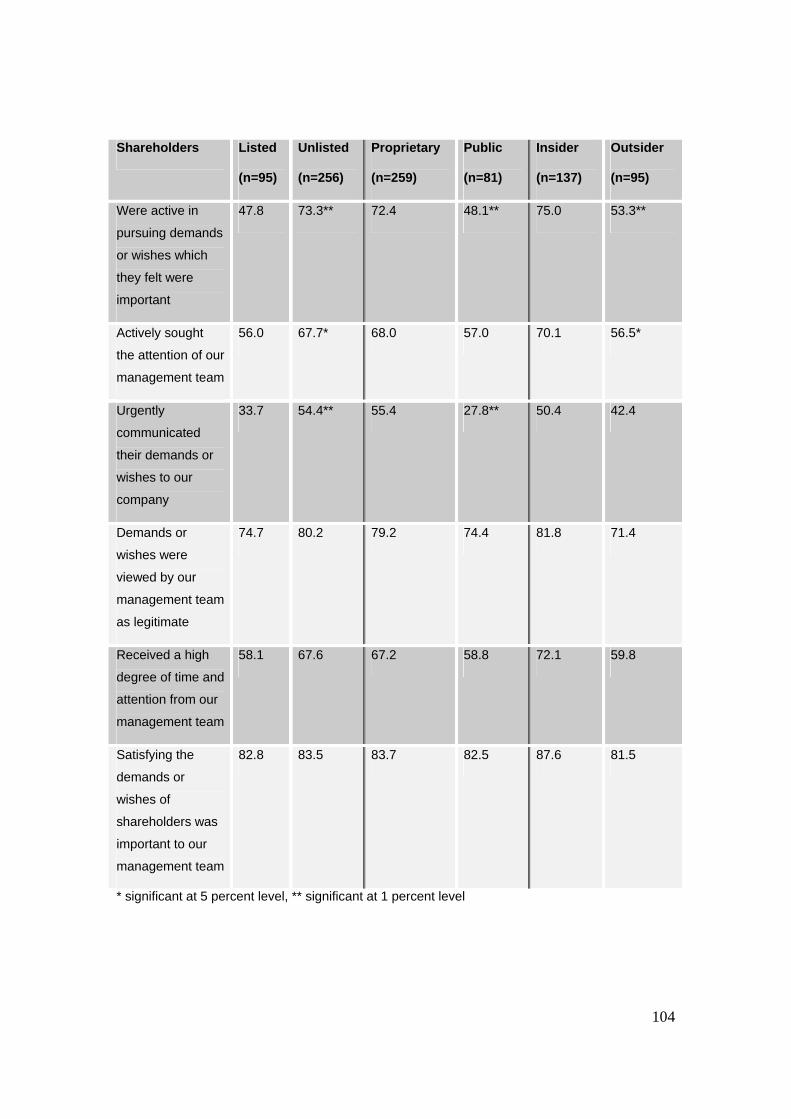
104
Shareholders Listed
(n=95)
Unlisted
(n=256)
Proprietary
(n=259)
Public
(n=81)
Insider
(n=137)
Outsider
(n=95)
Were active in
pursuing demands
or wishes which
they felt were
important
47.8 73.3** 72.4 48.1** 75.0 53.3**
Actively sought
the attention of our
management team
56.0 67.7* 68.0 57.0 70.1 56.5*
Urgently
communicated
their demands or
wishes to our
company
33.7 54.4** 55.4 27.8** 50.4 42.4
Demands or
wishes were
viewed by our
management team
as legitimate
74.7 80.2 79.2 74.4 81.8 71.4
Received a high
degree of time and
attention from our
management team
58.1 67.6 67.2 58.8 72.1 59.8
Satisfying the
demands or
wishes of
shareholders was
important to our
management team
82.8 83.5 83.7 82.5 87.6 81.5
* significant at 5 percent level, ** significant at 1 percent level
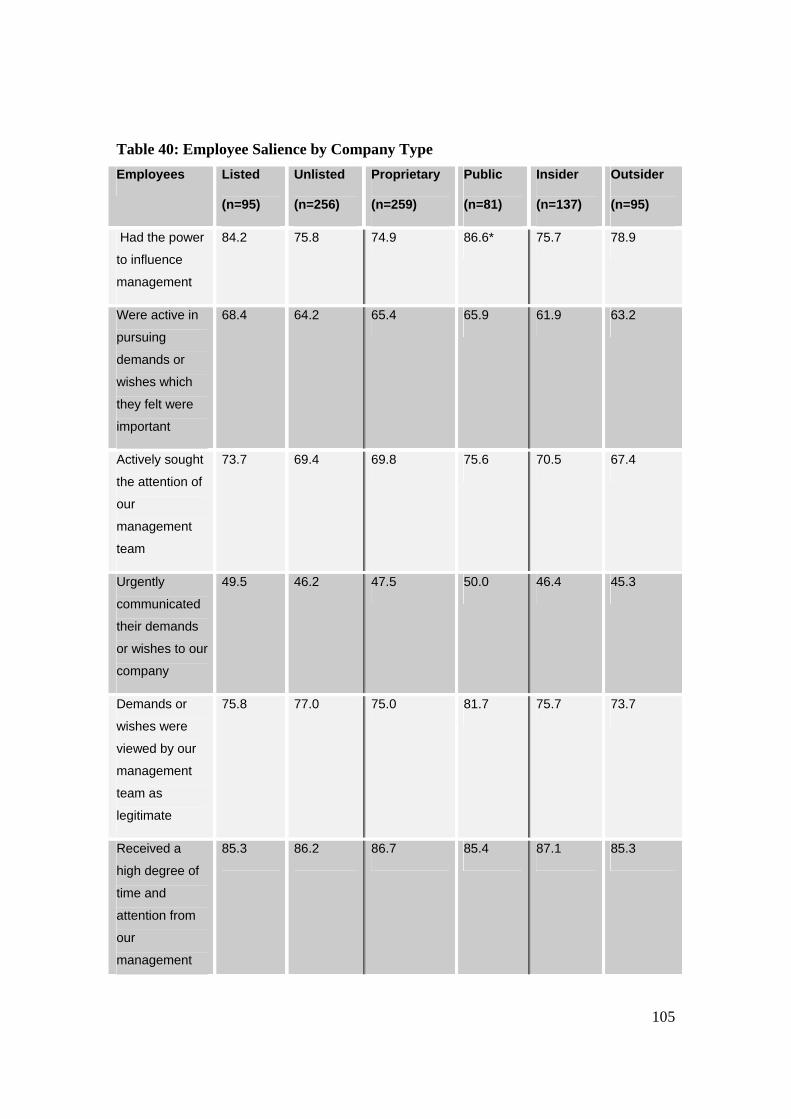
105
Table 40: Employee Salience by Company Type Employees Listed
(n=95)
Unlisted
(n=256)
Proprietary
(n=259)
Public
(n=81)
Insider
(n=137)
Outsider
(n=95)
Had the power
to influence
management
84.2 75.8 74.9 86.6* 75.7 78.9
Were active in
pursuing
demands or
wishes which
they felt were
important
68.4 64.2 65.4 65.9 61.9 63.2
Actively sought
the attention of
our
management
team
73.7 69.4 69.8 75.6 70.5 67.4
Urgently
communicated
their demands
or wishes to our
company
49.5 46.2 47.5 50.0 46.4 45.3
Demands or
wishes were
viewed by our
management
team as
legitimate
75.8 77.0 75.0 81.7 75.7 73.7
Received a
high degree of
time and
attention from
our
management
85.3 86.2 86.7 85.4 87.1 85.3
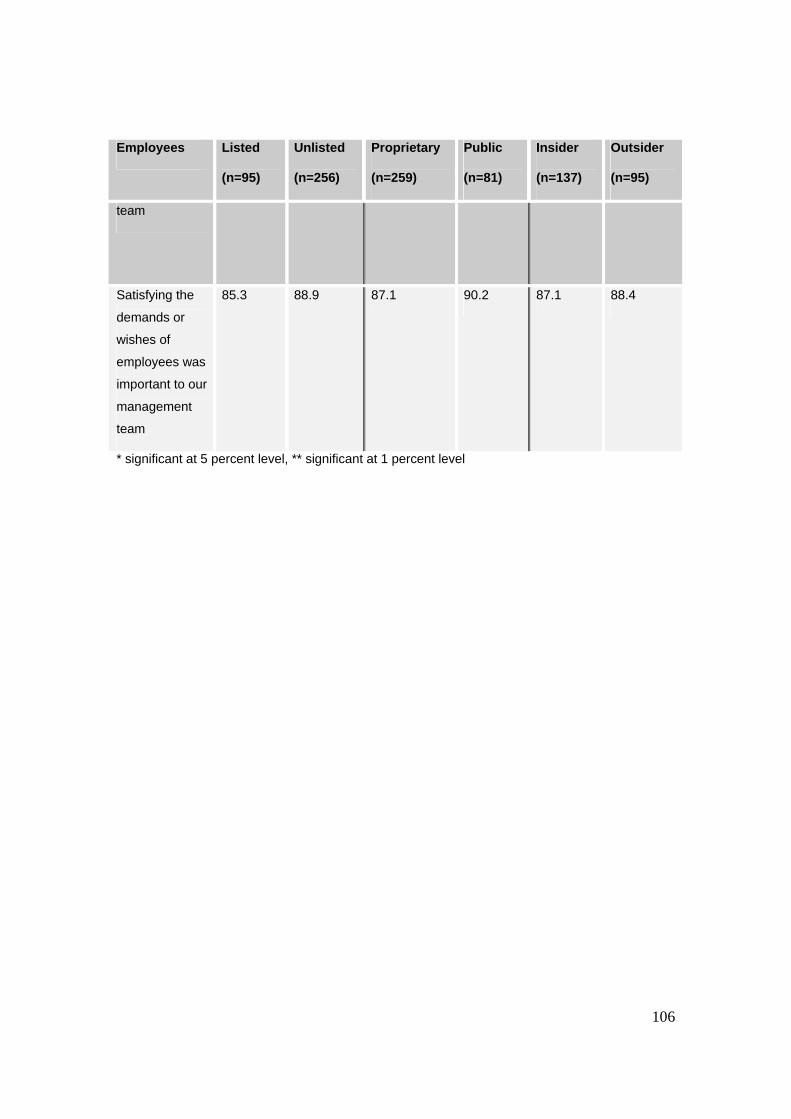
106
Employees Listed
(n=95)
Unlisted
(n=256)
Proprietary
(n=259)
Public
(n=81)
Insider
(n=137)
Outsider
(n=95)
team
Satisfying the
demands or
wishes of
employees was
important to our
management
team
85.3 88.9 87.1 90.2 87.1 88.4
* significant at 5 percent level, ** significant at 1 percent level

107
Table 41: Creditor Salience by Company Type Creditors Listed
(n=95)
Unlisted
(n=256)
Proprietary
(n=259)
Public
(n=81)
Insider
(n=137)
Outsider
(n=95)
Had the power
to influence
management
19.6 25.1 24.0 22.5 28.8 20.0
Were active in
pursuing
demands or
wishes which
they felt were
important
11.8 23.3* 21.5 16.3 24.5 13.7*
Actively sought
the attention of
our
management
team
15.1 23.9 23.2 16.3 25.2 16.8
Urgently
communicated
their demands
or wishes to our
company
18.3 20.1 21.3 13.8 20.9 18.9
Demands or
wishes were
viewed by our
management
team as
legitimate
35.9 51.4* 50.6 35.4* 55.4 37.6*
Received a
high degree of
time and
attention from
our
management
18.3 34.7** 33.5 21.3* 33.8 22.1
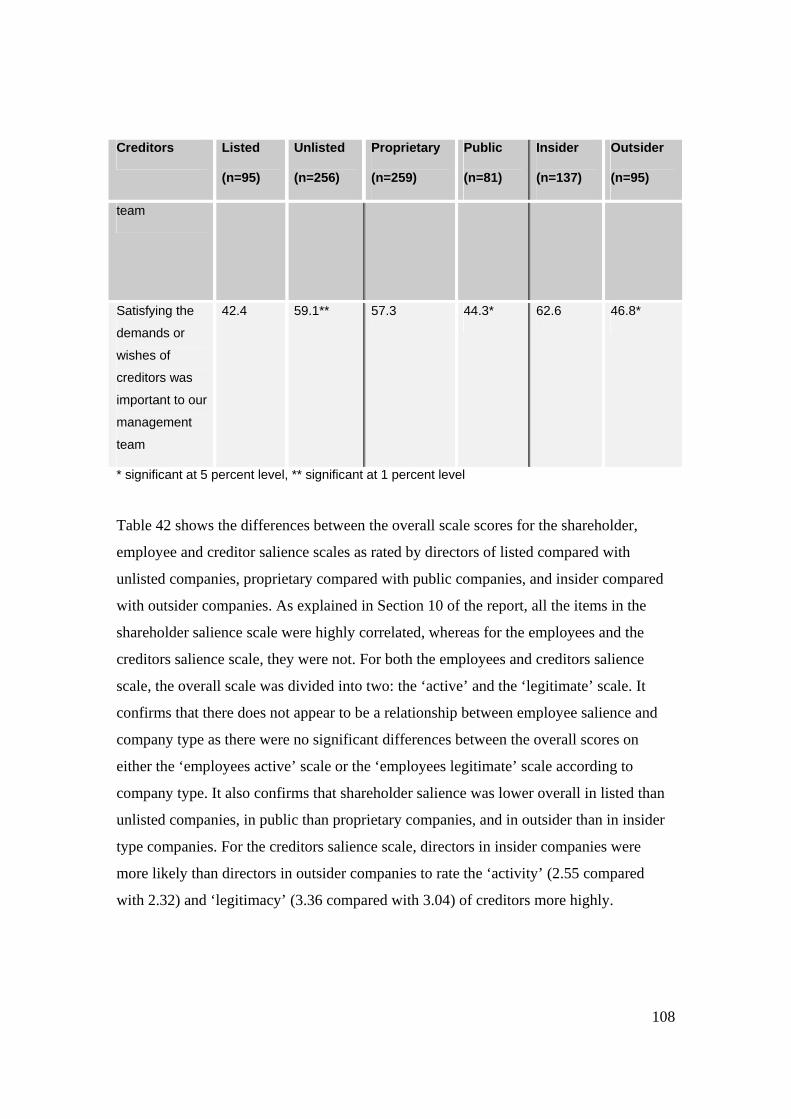
108
Creditors Listed
(n=95)
Unlisted
(n=256)
Proprietary
(n=259)
Public
(n=81)
Insider
(n=137)
Outsider
(n=95)
team
Satisfying the
demands or
wishes of
creditors was
important to our
management
team
42.4 59.1** 57.3 44.3* 62.6 46.8*
* significant at 5 percent level, ** significant at 1 percent level
Table 42 shows the differences between the overall scale scores for the shareholder,
employee and creditor salience scales as rated by directors of listed compared with
unlisted companies, proprietary compared with public companies, and insider compared
with outsider companies. As explained in Section 10 of the report, all the items in the
shareholder salience scale were highly correlated, whereas for the employees and the
creditors salience scale, they were not. For both the employees and creditors salience
scale, the overall scale was divided into two: the ‘active’ and the ‘legitimate’ scale. It
confirms that there does not appear to be a relationship between employee salience and
company type as there were no significant differences between the overall scores on
either the ‘employees active’ scale or the ‘employees legitimate’ scale according to
company type. It also confirms that shareholder salience was lower overall in listed than
unlisted companies, in public than proprietary companies, and in outsider than in insider
type companies. For the creditors salience scale, directors in insider companies were
more likely than directors in outsider companies to rate the ‘activity’ (2.55 compared
with 2.32) and ‘legitimacy’ (3.36 compared with 3.04) of creditors more highly.
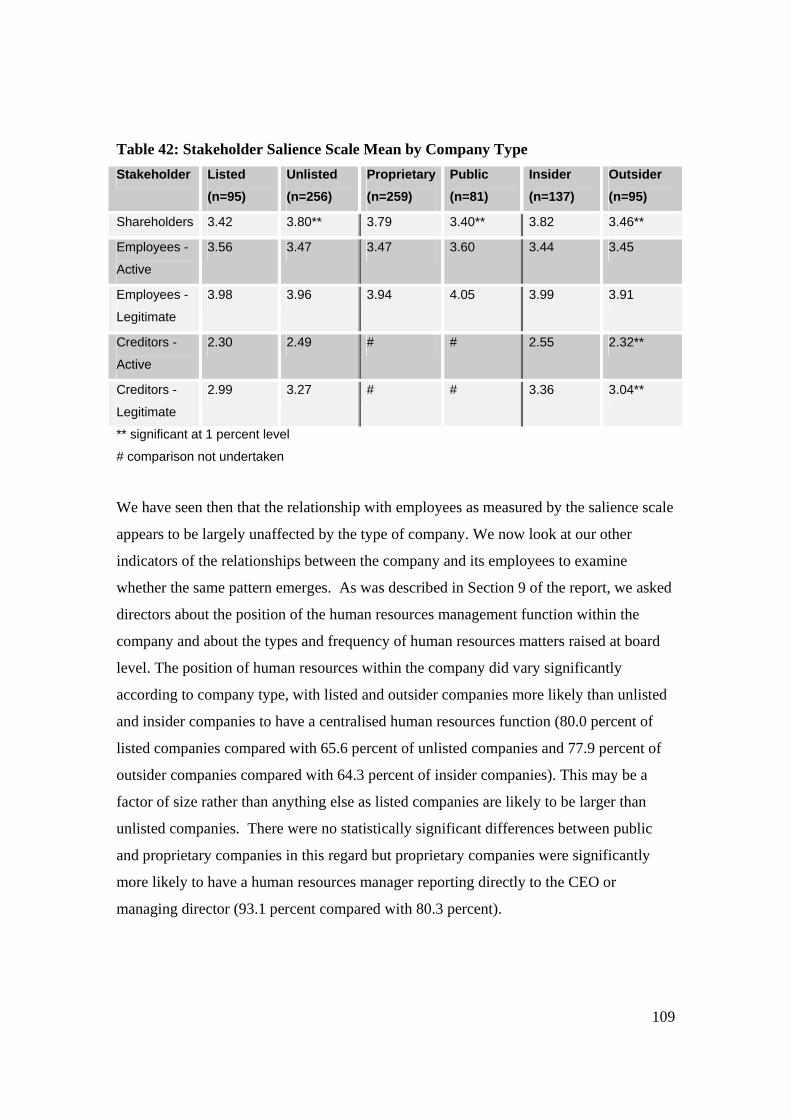
109
Table 42: Stakeholder Salience Scale Mean by Company Type Stakeholder Listed
(n=95) Unlisted (n=256)
Proprietary(n=259)
Public (n=81)
Insider (n=137)
Outsider (n=95)
Shareholders 3.42 3.80** 3.79 3.40** 3.82 3.46**
Employees -
Active
3.56 3.47 3.47 3.60 3.44 3.45
Employees -
Legitimate
3.98 3.96 3.94 4.05 3.99 3.91
Creditors -
Active
2.30 2.49 # # 2.55 2.32**
Creditors -
Legitimate
2.99 3.27 # # 3.36 3.04**
** significant at 1 percent level
# comparison not undertaken
We have seen then that the relationship with employees as measured by the salience scale
appears to be largely unaffected by the type of company. We now look at our other
indicators of the relationships between the company and its employees to examine
whether the same pattern emerges. As was described in Section 9 of the report, we asked
directors about the position of the human resources management function within the
company and about the types and frequency of human resources matters raised at board
level. The position of human resources within the company did vary significantly
according to company type, with listed and outsider companies more likely than unlisted
and insider companies to have a centralised human resources function (80.0 percent of
listed companies compared with 65.6 percent of unlisted companies and 77.9 percent of
outsider companies compared with 64.3 percent of insider companies). This may be a
factor of size rather than anything else as listed companies are likely to be larger than
unlisted companies. There were no statistically significant differences between public
and proprietary companies in this regard but proprietary companies were significantly
more likely to have a human resources manager reporting directly to the CEO or
managing director (93.1 percent compared with 80.3 percent).
110
With regard to the matters affecting employees below executive level raised at board
level over the past twelve months, the only significant difference was that employee share
schemes were likely to have been raised by shareholders with management three or more
times in public companies than in proprietary companies (30.4 percent compared with
12.0 percent), in listed rather than unlisted companies (26.3 percent compared with 11.9
percent) and outsider than insider companies (24.7 percent compared with 10.7 percent).
The possible reasons for this have been noted in Section 9 of the report.
11.4 The Effect of Directors’ Understandings of Their Legal Obligations
One of the tasks for the project was to undertake an examination of the way that directors
balanced their responsibilities to stakeholders within the framework provided by the law.
In particular, we sought to understand how directors’ understanding of the scope of
directors’ duties affected this balancing. We also sought to understand how directors
conceived of their obligation to employees and the extent to which that obligation was
framed by the law. In this part of the report, we explore whether there are differences
between directors’ attitudes according to their understanding of their legal obligations.
We first explore whether directors who indicated, in relation to directors’ duties, that they
believed that acting in the best interests of the company required them to balance the
interests of all stakeholders, had significantly different attitudes to those who indicated
that acting in the best interests of company required them to act in the interests of
shareholders. We then look at whether those directors who believed that their obligation
to employees stemmed from either corporate law or labour law had significantly different
attitudes to those who believed that their obligation stemmed primarily from business,
social or ethical considerations.
In Question 1 of the survey, directors were asked to indicate what their understanding of
the ‘best interests of the company’ was by choosing one of the possible meanings offered.
Two of the possible options which respondents could choose from equated the best
interests of the company with either the long or short term interests of shareholders only
111
(strong shareholder orientation).33 Another two options also equated the best interests of
the company with the long or short term interests of shareholders but provided that the
means to achieving these ends was acting in the interests of all stakeholders in the
company (mixed shareholder/stakeholder orientation).34 The final option was that acting
in the best interests of the company meant balancing the interests of all stakeholders
(stakeholder orientation).35 As was discussed in Section 6 of the report, this was the
response of a majority of directors (55 percent). For this analysis, we have created two
groups by combining all the responses that equated the best interests of the company with
the long or short term interests of shareholders, either directly or indirectly, to form one
group and making another group comprised of those directors who responded that they
were required to ‘balance the interests of all stakeholders’. We then compared the
responses of these two groups in the following areas:
• the priority ranking of stakeholders (Q.2);
• the priorities of directors, including the priorities in the event of a downturn or
improvement in the financial performance of the company and the matters of
importance to directors (Q. 11, 12, and 13);
• directors’ perceptions of the role the law plays in regard to their relationship with
employees; and
• the responses to items on the salience scale for shareholders, employees and
creditors (Q. 21, 22 and 23).
The following table (Table 43) shows, as would be expected, that directors who equated
the best interests of the company with those of shareholders were more likely to accord
first priority to shareholders. Those directors who believed that acting in the best interests
33 These options were: ‘I must act in the best interests of the company and this means acting in the short term interests of shareholders only’ and ‘I must act in the best interests of the company and this means acting in the long term interests of shareholders only’. 34 These options were: ‘I must act in the best interests of the company and this means acting in the best interests of all stakeholders to ensure the short term interests of shareholders’ and :‘I must act in the best interests of the company and this means acting in the best interests of all stakeholders to ensure the long term interests of shareholders’. 35 This option was: ‘I must act in the best interests of the company and this means balancing the interests of all stakeholders’.
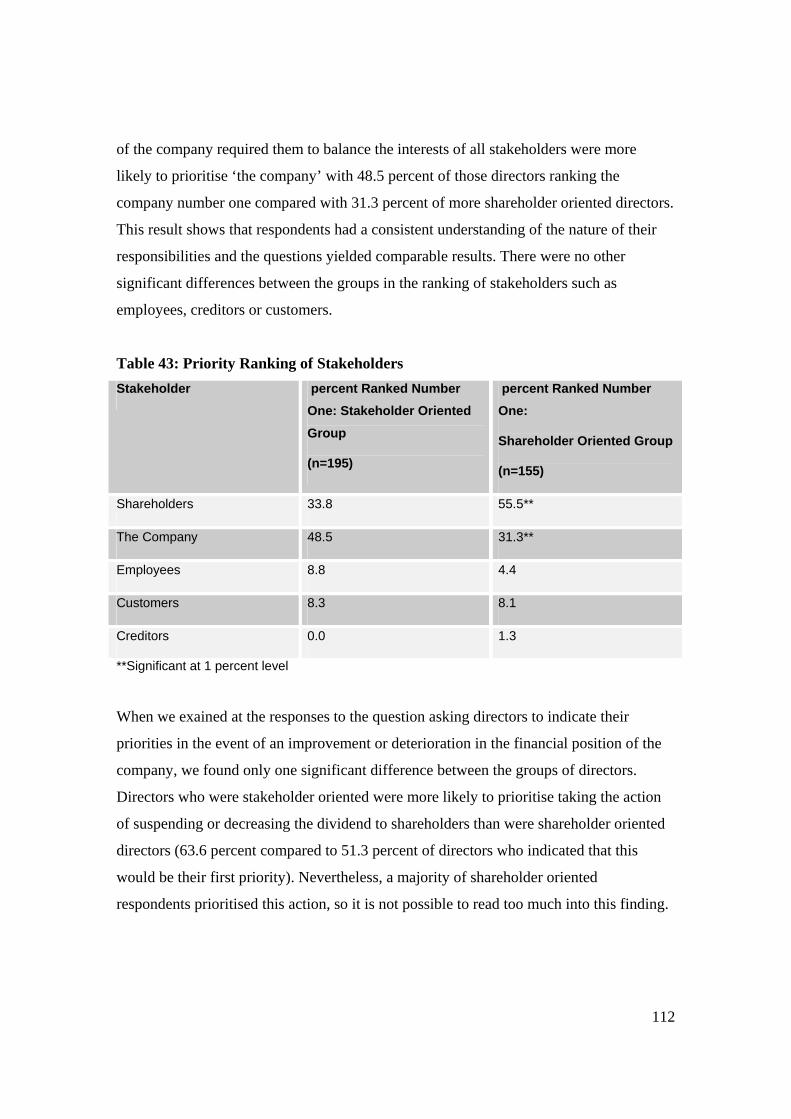
112
of the company required them to balance the interests of all stakeholders were more
likely to prioritise ‘the company’ with 48.5 percent of those directors ranking the
company number one compared with 31.3 percent of more shareholder oriented directors.
This result shows that respondents had a consistent understanding of the nature of their
responsibilities and the questions yielded comparable results. There were no other
significant differences between the groups in the ranking of stakeholders such as
employees, creditors or customers.
Table 43: Priority Ranking of Stakeholders Stakeholder percent Ranked Number
One: Stakeholder Oriented Group
(n=195)
percent Ranked Number One:
Shareholder Oriented Group
(n=155)
Shareholders 33.8 55.5**
The Company 48.5 31.3**
Employees 8.8 4.4
Customers 8.3 8.1
Creditors 0.0 1.3
**Significant at 1 percent level
When we exained at the responses to the question asking directors to indicate their
priorities in the event of an improvement or deterioration in the financial position of the
company, we found only one significant difference between the groups of directors.
Directors who were stakeholder oriented were more likely to prioritise taking the action
of suspending or decreasing the dividend to shareholders than were shareholder oriented
directors (63.6 percent compared to 51.3 percent of directors who indicated that this
would be their first priority). Nevertheless, a majority of shareholder oriented
respondents prioritised this action, so it is not possible to read too much into this finding.
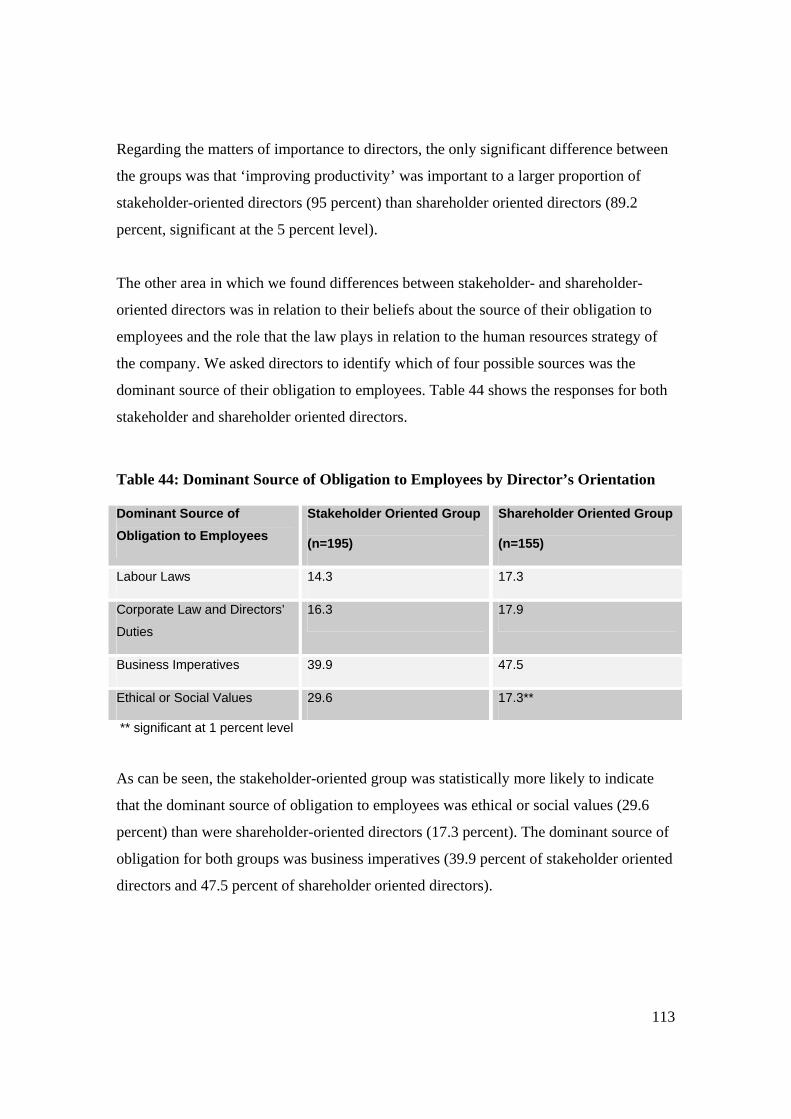
113
Regarding the matters of importance to directors, the only significant difference between
the groups was that ‘improving productivity’ was important to a larger proportion of
stakeholder-oriented directors (95 percent) than shareholder oriented directors (89.2
percent, significant at the 5 percent level).
The other area in which we found differences between stakeholder- and shareholder-
oriented directors was in relation to their beliefs about the source of their obligation to
employees and the role that the law plays in relation to the human resources strategy of
the company. We asked directors to identify which of four possible sources was the
dominant source of their obligation to employees. Table 44 shows the responses for both
stakeholder and shareholder oriented directors.
Table 44: Dominant Source of Obligation to Employees by Director’s Orientation
Dominant Source of Obligation to Employees
Stakeholder Oriented Group
(n=195)
Shareholder Oriented Group
(n=155)
Labour Laws 14.3 17.3
Corporate Law and Directors’
Duties
16.3 17.9
Business Imperatives 39.9 47.5
Ethical or Social Values 29.6 17.3**
** significant at 1 percent level
As can be seen, the stakeholder-oriented group was statistically more likely to indicate
that the dominant source of obligation to employees was ethical or social values (29.6
percent) than were shareholder-oriented directors (17.3 percent). The dominant source of
obligation for both groups was business imperatives (39.9 percent of stakeholder oriented
directors and 47.5 percent of shareholder oriented directors).
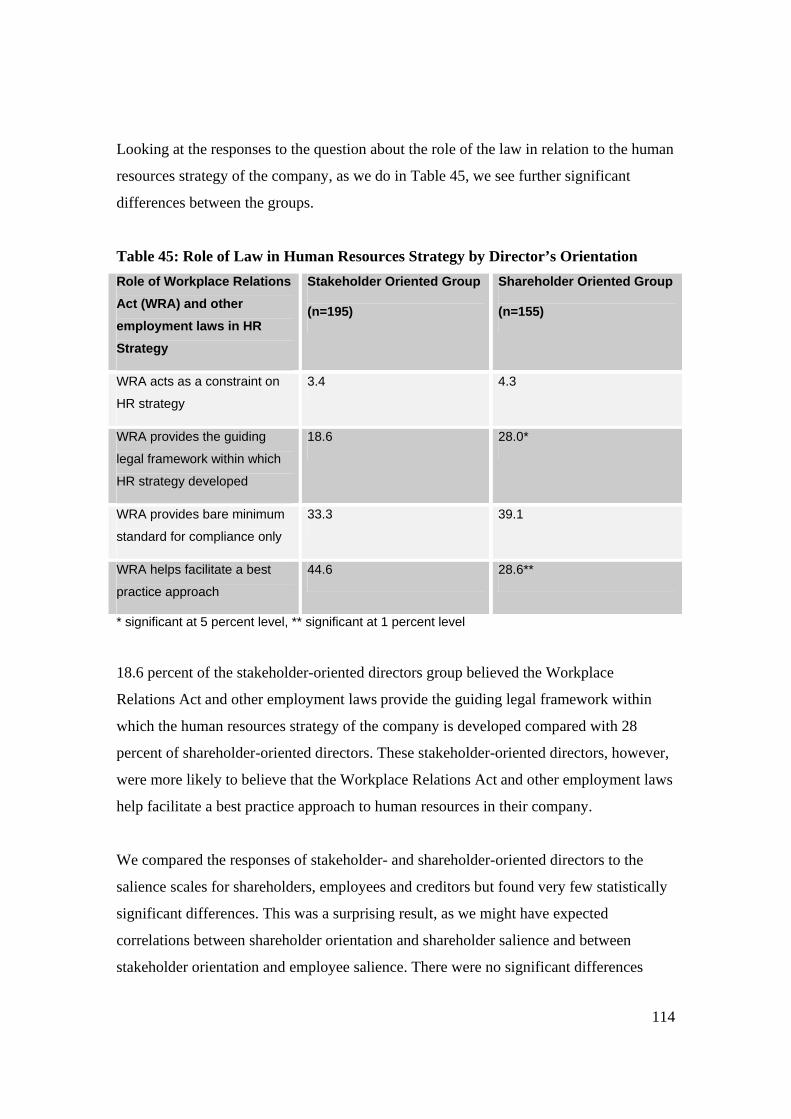
114
Looking at the responses to the question about the role of the law in relation to the human
resources strategy of the company, as we do in Table 45, we see further significant
differences between the groups.
Table 45: Role of Law in Human Resources Strategy by Director’s Orientation Role of Workplace Relations Act (WRA) and other employment laws in HR Strategy
Stakeholder Oriented Group
(n=195)
Shareholder Oriented Group
(n=155)
WRA acts as a constraint on
HR strategy
3.4 4.3
WRA provides the guiding
legal framework within which
HR strategy developed
18.6 28.0*
WRA provides bare minimum
standard for compliance only
33.3 39.1
WRA helps facilitate a best
practice approach
44.6 28.6**
* significant at 5 percent level, ** significant at 1 percent level
18.6 percent of the stakeholder-oriented directors group believed the Workplace
Relations Act and other employment laws provide the guiding legal framework within
which the human resources strategy of the company is developed compared with 28
percent of shareholder-oriented directors. These stakeholder-oriented directors, however,
were more likely to believe that the Workplace Relations Act and other employment laws
help facilitate a best practice approach to human resources in their company.
We compared the responses of stakeholder- and shareholder-oriented directors to the
salience scales for shareholders, employees and creditors but found very few statistically
significant differences. This was a surprising result, as we might have expected
correlations between shareholder orientation and shareholder salience and between
stakeholder orientation and employee salience. There were no significant differences

115
between the groups in responses to the items on the salience scale for employees. In
relation to shareholders, we might have expected some differences, but found only that
shareholder-oriented directors were more likely to indicate that ‘satisfying the demands
or wishes of shareholders was important to our management team’ (89.7 percent) than
were stakeholder-oriented directors (77.7 percent, significant at the 1 percent level).
Similarly with the creditors salience scale, the only significant difference was that the
mean score for the item ‘creditors’ demands or wishes were viewed as legitimate’ was
higher for shareholder-oriented directors than for stakeholder-oriented directors (3.3
percent compared with 3.07 percent, significant at the 5 percent level).
We now compare the responses of directors who indicated that their dominant source of
obligation to employees was the law (either labour laws or corporate law)36 with the
responses of directors who indicated that sources other than the law underpinned their
obligations to employees.37 We compared the responses of directors in each group to the
following questions:
• the priority ranking of stakeholders (Q.2);
• the priorities of directors, including the priorities in the event of a downturn or
improvement in the financial performance of the company and the matters of
importance to directors (Q. 11, 12, and 13);
• directors’ perceptions of the role the law plays in regard to their relationship with
employees; and
• the responses to items on the salience scale for shareholders, employees and
creditors (Q. 21, 22 and 23).
36 This group comprises directors whose responses to Q. 14, Which of the following best describes the dominant source of your responsibilities to employees?, were either ‘Labour laws [e.g. Workplace Relations Act and Occupational Health and Safety Laws]’ or ‘Corporate law and directors’ duties [i.e. considering the interests of employees is fundamental to acting in the best interests of the company/shareholders]’. 37 This group comprises directors whose responses to Q. 14 were either ‘Business imperatives [i.e. my responsibilities to employees derive primarily from their importance to ensuring the success of the business]’ or ‘Ethical or social values [i.e. I have an ethical or social responsibility to ensure the well being of employees of the company]’.
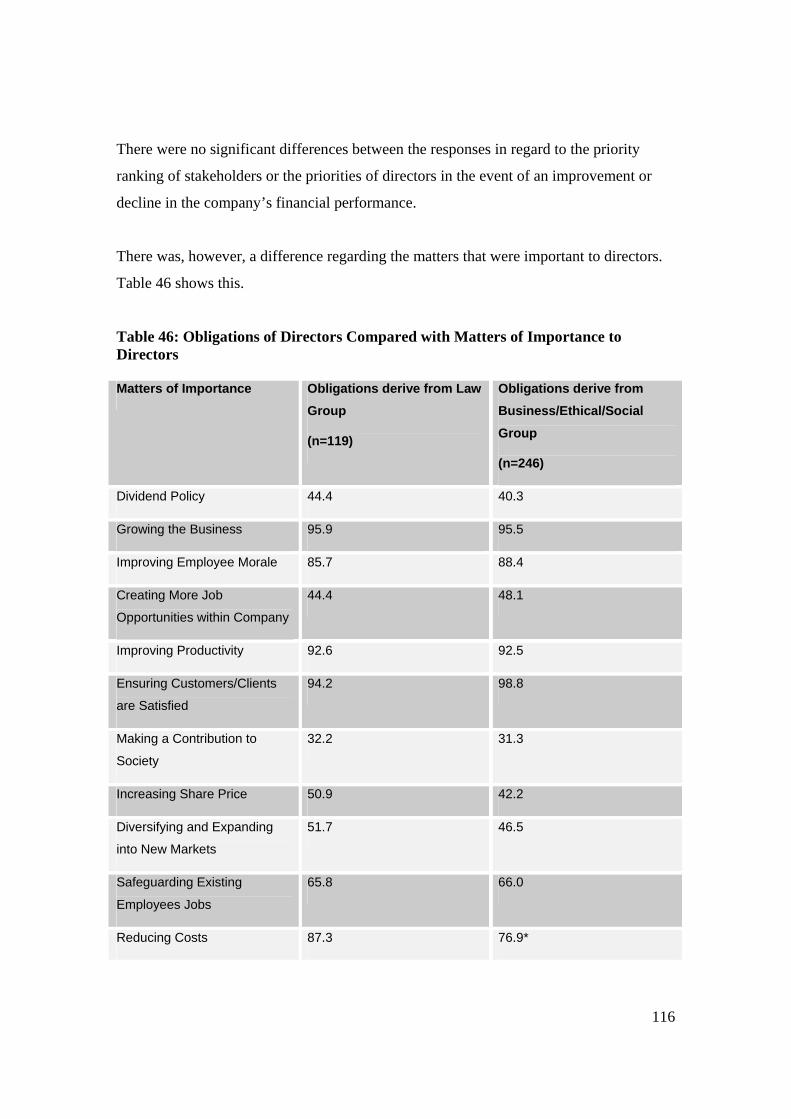
116
There were no significant differences between the responses in regard to the priority
ranking of stakeholders or the priorities of directors in the event of an improvement or
decline in the company’s financial performance.
There was, however, a difference regarding the matters that were important to directors.
Table 46 shows this.
Table 46: Obligations of Directors Compared with Matters of Importance to Directors Matters of Importance Obligations derive from Law
Group
(n=119)
Obligations derive from Business/Ethical/Social Group
(n=246)
Dividend Policy 44.4 40.3
Growing the Business 95.9 95.5
Improving Employee Morale 85.7 88.4
Creating More Job
Opportunities within Company
44.4 48.1
Improving Productivity 92.6 92.5
Ensuring Customers/Clients
are Satisfied
94.2 98.8
Making a Contribution to
Society
32.2 31.3
Increasing Share Price 50.9 42.2
Diversifying and Expanding
into New Markets
51.7 46.5
Safeguarding Existing
Employees Jobs
65.8 66.0
Reducing Costs 87.3 76.9*
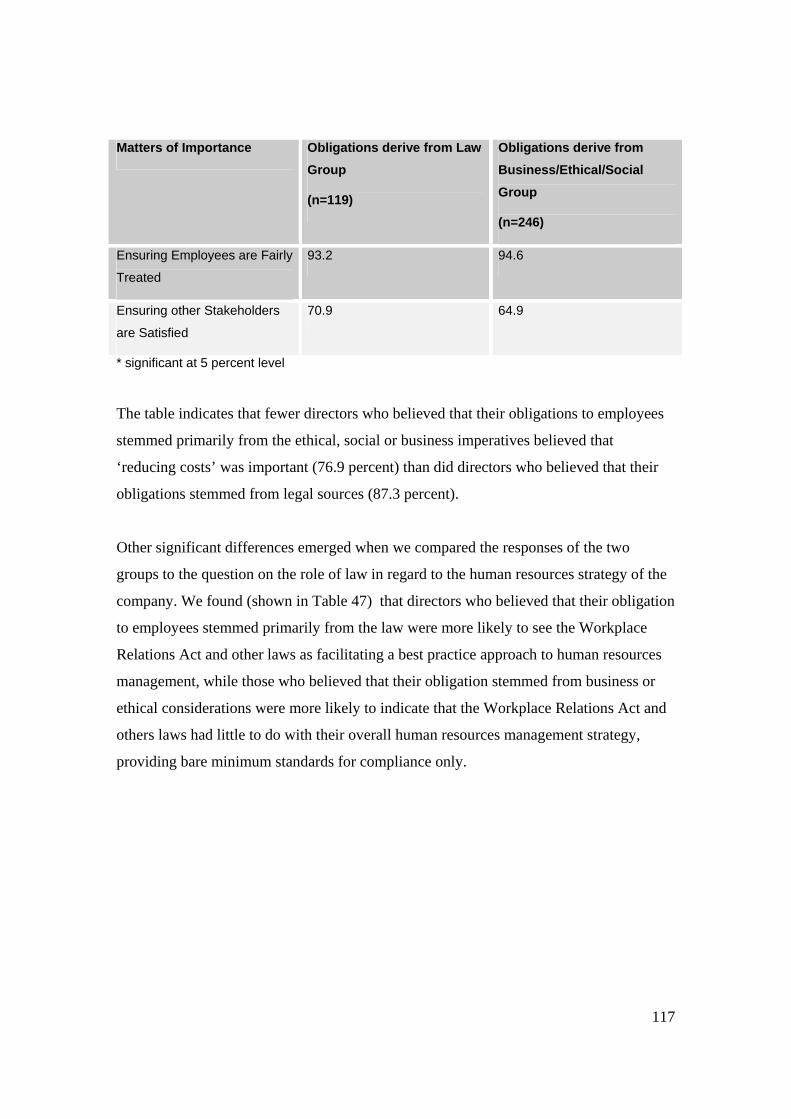
117
Matters of Importance Obligations derive from Law Group
(n=119)
Obligations derive from Business/Ethical/Social Group
(n=246)
Ensuring Employees are Fairly
Treated
93.2 94.6
Ensuring other Stakeholders
are Satisfied
70.9 64.9
* significant at 5 percent level
The table indicates that fewer directors who believed that their obligations to employees
stemmed primarily from the ethical, social or business imperatives believed that
‘reducing costs’ was important (76.9 percent) than did directors who believed that their
obligations stemmed from legal sources (87.3 percent).
Other significant differences emerged when we compared the responses of the two
groups to the question on the role of law in regard to the human resources strategy of the
company. We found (shown in Table 47) that directors who believed that their obligation
to employees stemmed primarily from the law were more likely to see the Workplace
Relations Act and other laws as facilitating a best practice approach to human resources
management, while those who believed that their obligation stemmed from business or
ethical considerations were more likely to indicate that the Workplace Relations Act and
others laws had little to do with their overall human resources management strategy,
providing bare minimum standards for compliance only.
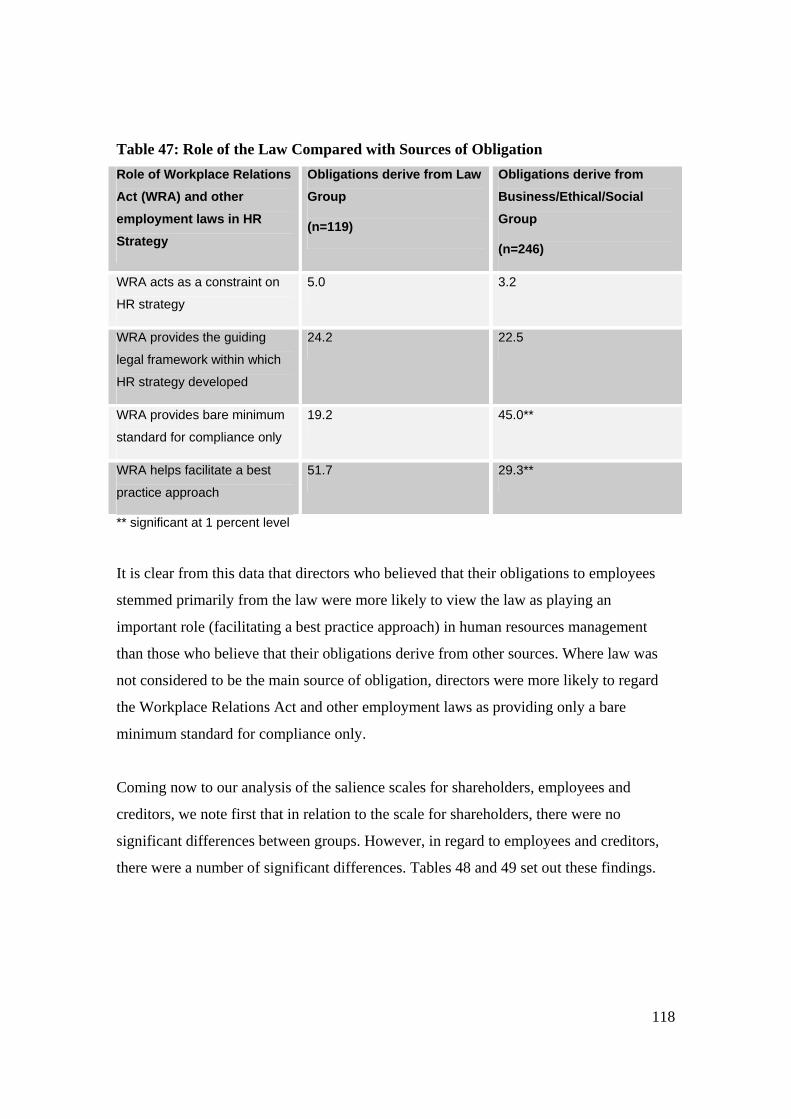
118
Table 47: Role of the Law Compared with Sources of Obligation Role of Workplace Relations Act (WRA) and other employment laws in HR Strategy
Obligations derive from Law Group
(n=119)
Obligations derive from Business/Ethical/Social Group
(n=246)
WRA acts as a constraint on
HR strategy
5.0 3.2
WRA provides the guiding
legal framework within which
HR strategy developed
24.2 22.5
WRA provides bare minimum
standard for compliance only
19.2 45.0**
WRA helps facilitate a best
practice approach
51.7 29.3**
** significant at 1 percent level
It is clear from this data that directors who believed that their obligations to employees
stemmed primarily from the law were more likely to view the law as playing an
important role (facilitating a best practice approach) in human resources management
than those who believe that their obligations derive from other sources. Where law was
not considered to be the main source of obligation, directors were more likely to regard
the Workplace Relations Act and other employment laws as providing only a bare
minimum standard for compliance only.
Coming now to our analysis of the salience scales for shareholders, employees and
creditors, we note first that in relation to the scale for shareholders, there were no
significant differences between groups. However, in regard to employees and creditors,
there were a number of significant differences. Tables 48 and 49 set out these findings.
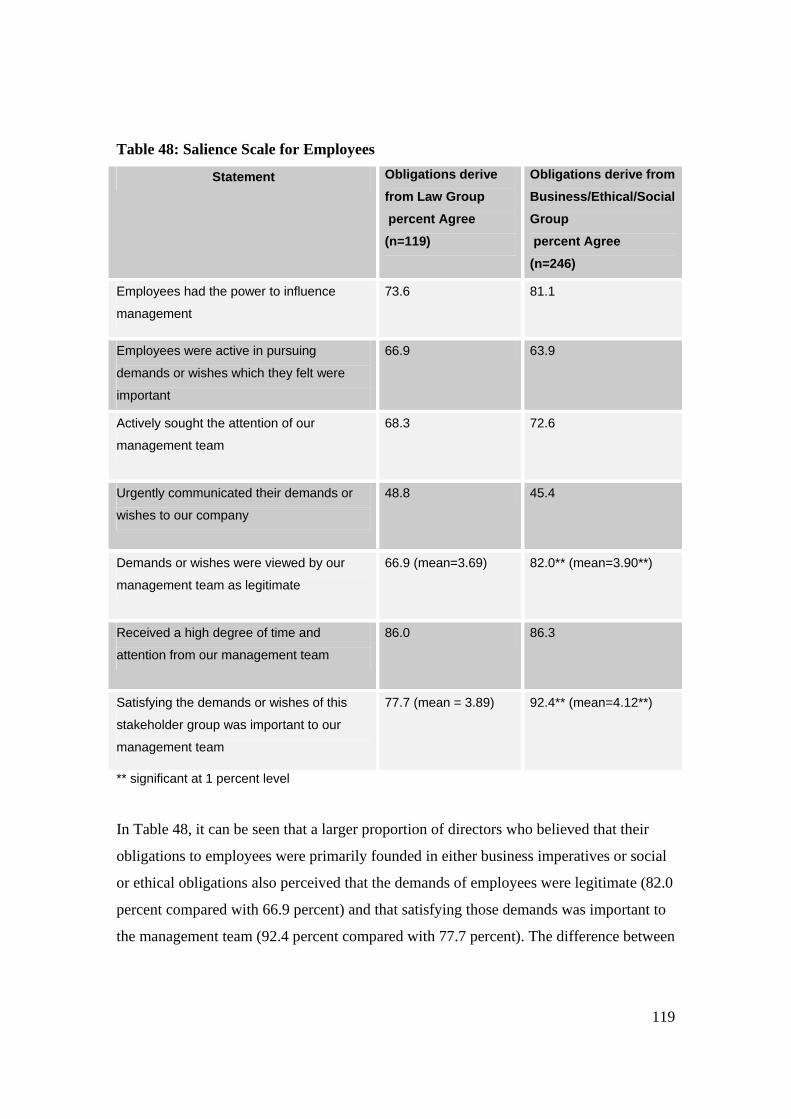
119
Table 48: Salience Scale for Employees
Statement Obligations derive from Law Group percent Agree (n=119)
Obligations derive from Business/Ethical/Social Group percent Agree (n=246)
Employees had the power to influence
management
73.6 81.1
Employees were active in pursuing
demands or wishes which they felt were
important
66.9 63.9
Actively sought the attention of our
management team
68.3 72.6
Urgently communicated their demands or
wishes to our company
48.8 45.4
Demands or wishes were viewed by our
management team as legitimate
66.9 (mean=3.69) 82.0** (mean=3.90**)
Received a high degree of time and
attention from our management team
86.0 86.3
Satisfying the demands or wishes of this
stakeholder group was important to our
management team
77.7 (mean = 3.89) 92.4** (mean=4.12**)
** significant at 1 percent level
In Table 48, it can be seen that a larger proportion of directors who believed that their
obligations to employees were primarily founded in either business imperatives or social
or ethical obligations also perceived that the demands of employees were legitimate (82.0
percent compared with 66.9 percent) and that satisfying those demands was important to
the management team (92.4 percent compared with 77.7 percent). The difference between

120
the mean scores for these items was also significant.
Table 49: Salience Scale for Creditors
Statement Obligations derive from Law Group
percent Agree
(n=119)
Obligations derive from Business/Ethical/Social Group
percent Agree
(n=246)
Creditors had the power to influence
management
26.7 21.1
Creditors were active in pursuing demands
or wishes which they felt were important
23.5 (mean=2.55) 18.3 (mean=2.28*)
Actively sought the attention of our
management team
22.5 (mean=2.57) 21.5 (mean=2.32*)
Urgently communicated their demands or
wishes to our company
25.0 (mean=2.61) 16.6 (mean=2.22**)
Demands or wishes were viewed by our
management team as legitimate
43.3 48.8
Received a high degree of time and
attention from our management team
28.3 30.8
Satisfying the demands or wishes of this
stakeholder group was important to our
management team
54.6 53.9
* significant at 5 percent level, ** significant at 1 percent level
Table 49 shows that, when responses to the creditor salience scale were measured by the
percentage of directors who agreed with a particular statement, there were no significant
differences between the responses of law oriented directors and those of business or

121
ethically oriented directors. However, the mean scores were significantly different for the
items related to the activity or urgency of claims made by creditors.
122
12. Conclusion
This report documents the results of a survey of Australian company directors concerning
the corporate governance and employment practices of the companies in which the
respondents are board members.
One of the major purposes of the survey was to determine whether directors adhere to a
‘shareholder primacy’ understanding of their responsibilities, as is often believed to be
the case with Australian directors. We expected that this understanding would derive
from a number of sources, including understandings of legal obligations, institutional
frameworks and business imperatives. Our findings in this regard were quite mixed, and
it cannot be said that the data confirmed the ‘shareholder primacy’ view, regardless of
how broadly ‘shareholder primacy’ is defined (ie, whether shareholder primacy is
regarded as involving the prioritisation of shareholder interests in the short term or the
long term, to the exclusion or detriment of other stakeholders interests). The first of our
findings in this regard was that the majority of directors surveyed had what might be
termed a ‘stakeholder’ understanding of their obligations. Just over half of the
respondents believed that acting in the best interests of the company meant they are
required to balance the interests of all stakeholders. Furthermore, whilst 44 percent of
directors perceived shareholders as their number one priority, almost as many (40
percent) regarded the company as their number one priority. However, questions which
sought to test the shareholder primacy thesis in a more complex way did provide support
for the argument that shareholder interests are prioritised over those of other stakeholders.
When shareholder ‘salience’ (influence and ability to make demands) was measured
relative to the salience of other stakeholders, shareholders had a higher level of salience
than employees and creditors.
Despite this broad expectation that directors would prioritise the interests of shareholders,
based on the existing international literature, we anticipated some variation between
respondents based on the characteristics of company they direct. Using Gospel and
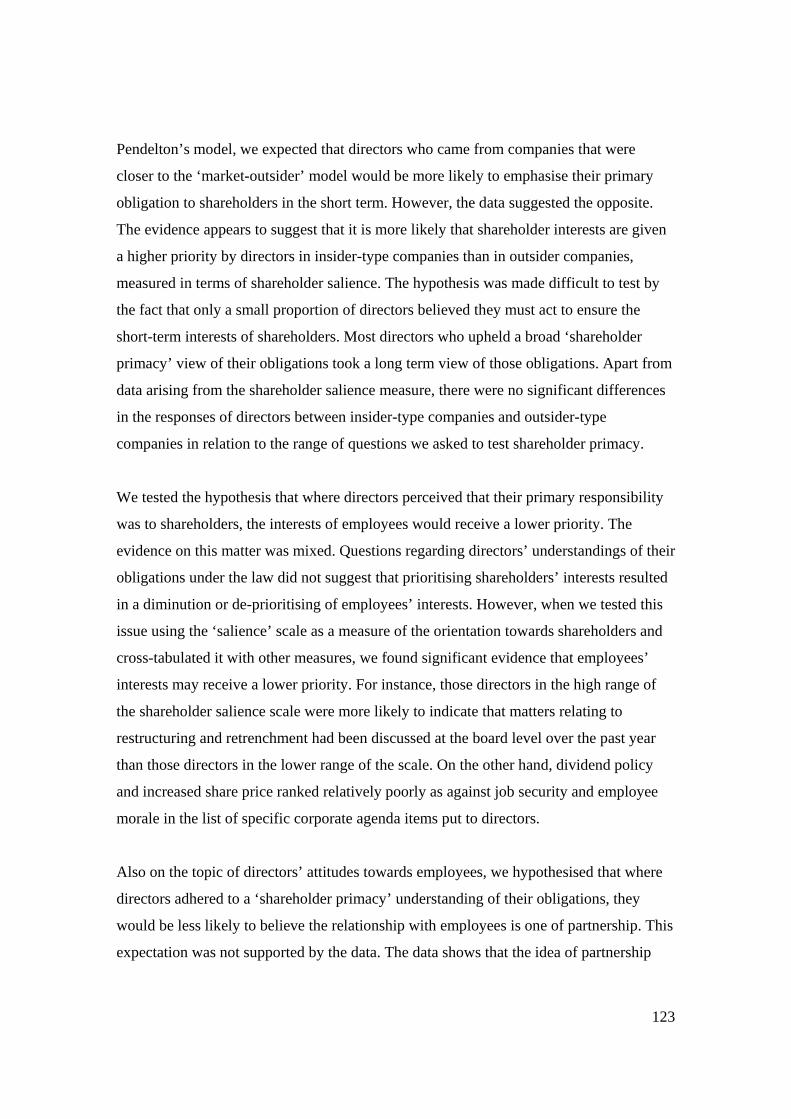
123
Pendelton’s model, we expected that directors who came from companies that were
closer to the ‘market-outsider’ model would be more likely to emphasise their primary
obligation to shareholders in the short term. However, the data suggested the opposite.
The evidence appears to suggest that it is more likely that shareholder interests are given
a higher priority by directors in insider-type companies than in outsider companies,
measured in terms of shareholder salience. The hypothesis was made difficult to test by
the fact that only a small proportion of directors believed they must act to ensure the
short-term interests of shareholders. Most directors who upheld a broad ‘shareholder
primacy’ view of their obligations took a long term view of those obligations. Apart from
data arising from the shareholder salience measure, there were no significant differences
in the responses of directors between insider-type companies and outsider-type
companies in relation to the range of questions we asked to test shareholder primacy.
We tested the hypothesis that where directors perceived that their primary responsibility
was to shareholders, the interests of employees would receive a lower priority. The
evidence on this matter was mixed. Questions regarding directors’ understandings of their
obligations under the law did not suggest that prioritising shareholders’ interests resulted
in a diminution or de-prioritising of employees’ interests. However, when we tested this
issue using the ‘salience’ scale as a measure of the orientation towards shareholders and
cross-tabulated it with other measures, we found significant evidence that employees’
interests may receive a lower priority. For instance, those directors in the high range of
the shareholder salience scale were more likely to indicate that matters relating to
restructuring and retrenchment had been discussed at the board level over the past year
than those directors in the lower range of the scale. On the other hand, dividend policy
and increased share price ranked relatively poorly as against job security and employee
morale in the list of specific corporate agenda items put to directors.
Also on the topic of directors’ attitudes towards employees, we hypothesised that where
directors adhered to a ‘shareholder primacy’ understanding of their obligations, they
would be less likely to believe the relationship with employees is one of partnership. This
expectation was not supported by the data. The data shows that the idea of partnership
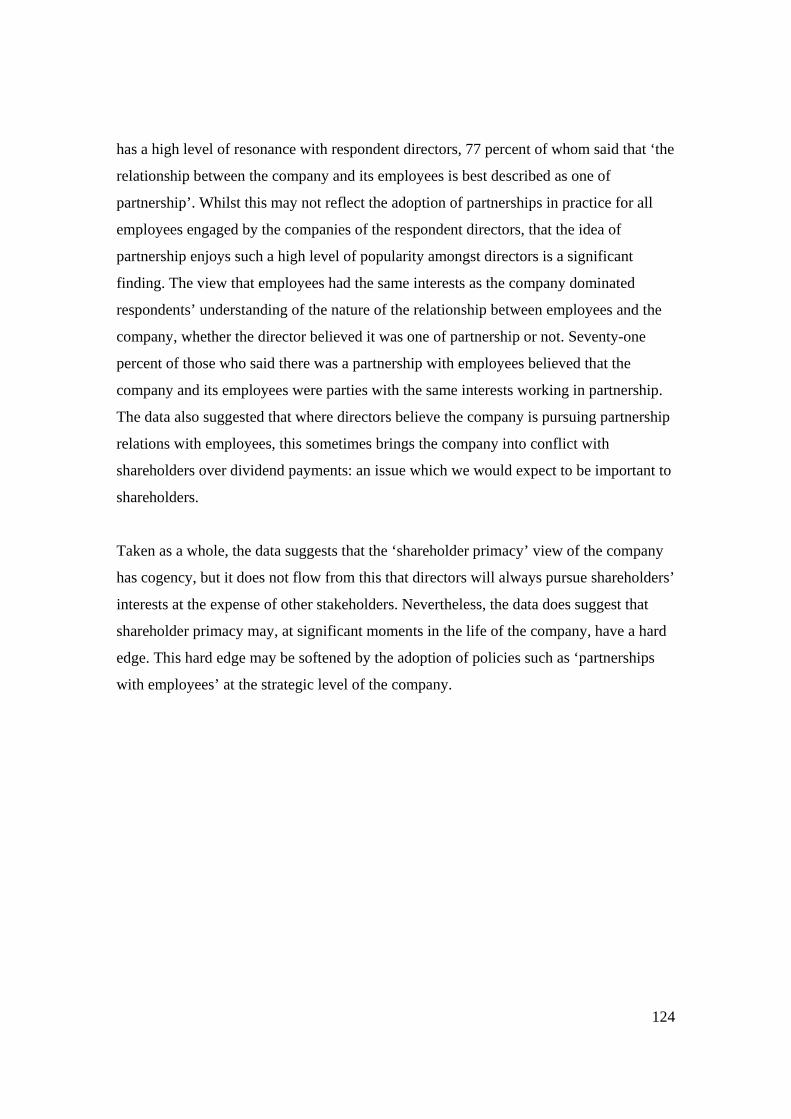
124
has a high level of resonance with respondent directors, 77 percent of whom said that ‘the
relationship between the company and its employees is best described as one of
partnership’. Whilst this may not reflect the adoption of partnerships in practice for all
employees engaged by the companies of the respondent directors, that the idea of
partnership enjoys such a high level of popularity amongst directors is a significant
finding. The view that employees had the same interests as the company dominated
respondents’ understanding of the nature of the relationship between employees and the
company, whether the director believed it was one of partnership or not. Seventy-one
percent of those who said there was a partnership with employees believed that the
company and its employees were parties with the same interests working in partnership.
The data also suggested that where directors believe the company is pursuing partnership
relations with employees, this sometimes brings the company into conflict with
shareholders over dividend payments: an issue which we would expect to be important to
shareholders.
Taken as a whole, the data suggests that the ‘shareholder primacy’ view of the company
has cogency, but it does not flow from this that directors will always pursue shareholders’
interests at the expense of other stakeholders. Nevertheless, the data does suggest that
shareholder primacy may, at significant moments in the life of the company, have a hard
edge. This hard edge may be softened by the adoption of policies such as ‘partnerships
with employees’ at the strategic level of the company.

125
Appendix 1: Survey Instrument

Corporate Governance and Workplace Partnerships
Director’s Survey

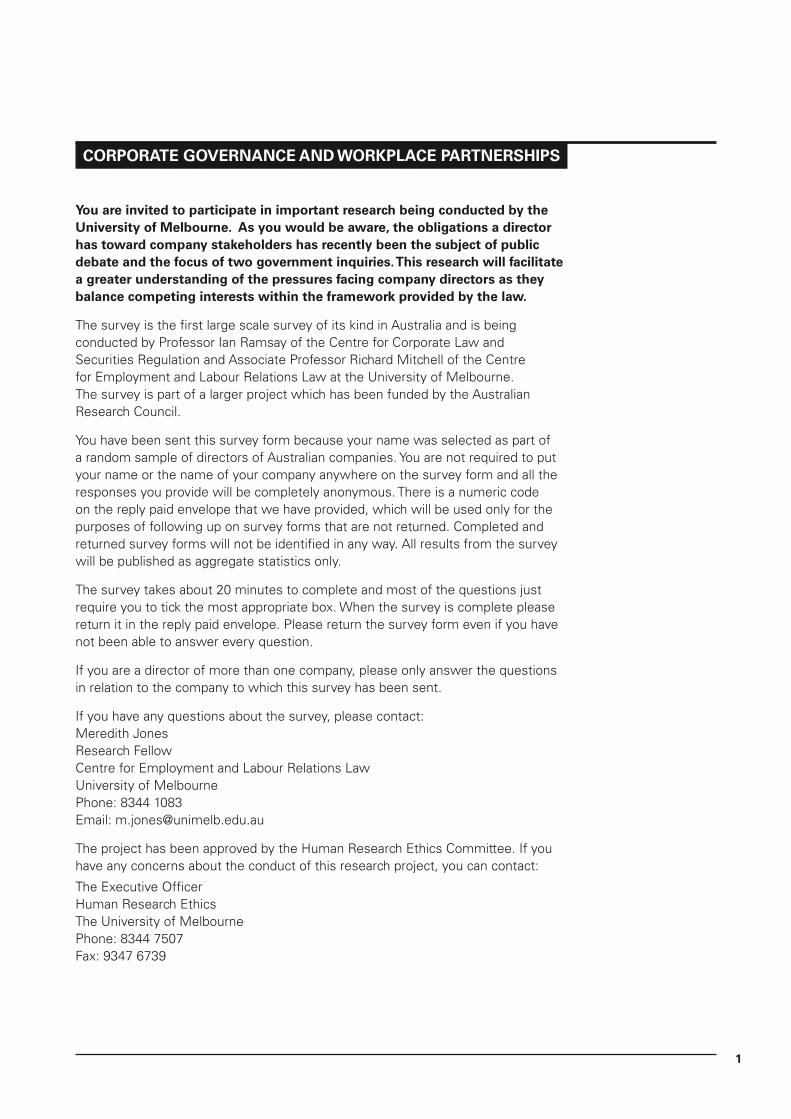
�
Corporate GovernanCe anD WorkplaCe partnerShipS
You are invited to participate in important research being conducted by the University of Melbourne. as you would be aware, the obligations a director has toward company stakeholders has recently been the subject of public debate and the focus of two government inquiries. this research will facilitate a greater understanding of the pressures facing company directors as they balance competing interests within the framework provided by the law.
The survey is the first large scale survey of its kind in Australia and is being conducted by Professor Ian Ramsay of the Centre for Corporate Law and Securities Regulation and Associate Professor Richard Mitchell of the Centre for Employment and Labour Relations Law at the University of Melbourne. The survey is part of a larger project which has been funded by the Australian Research Council.
You have been sent this survey form because your name was selected as part of a random sample of directors of Australian companies. You are not required to put your name or the name of your company anywhere on the survey form and all the responses you provide will be completely anonymous. There is a numeric code on the reply paid envelope that we have provided, which will be used only for the purposes of following up on survey forms that are not returned. Completed and returned survey forms will not be identified in any way. All results from the survey will be published as aggregate statistics only.
The survey takes about 20 minutes to complete and most of the questions just require you to tick the most appropriate box. When the survey is complete please return it in the reply paid envelope. Please return the survey form even if you have not been able to answer every question.
If you are a director of more than one company, please only answer the questions in relation to the company to which this survey has been sent.
If you have any questions about the survey, please contact:Meredith JonesResearch FellowCentre for Employment and Labour Relations LawUniversity of MelbournePhone: 8344 1083Email: [email protected]
The project has been approved by the Human Research Ethics Committee. If you have any concerns about the conduct of this research project, you can contact:
The Executive OfficerHuman Research EthicsThe University of MelbournePhone: 8344 7507 Fax: 9347 6739

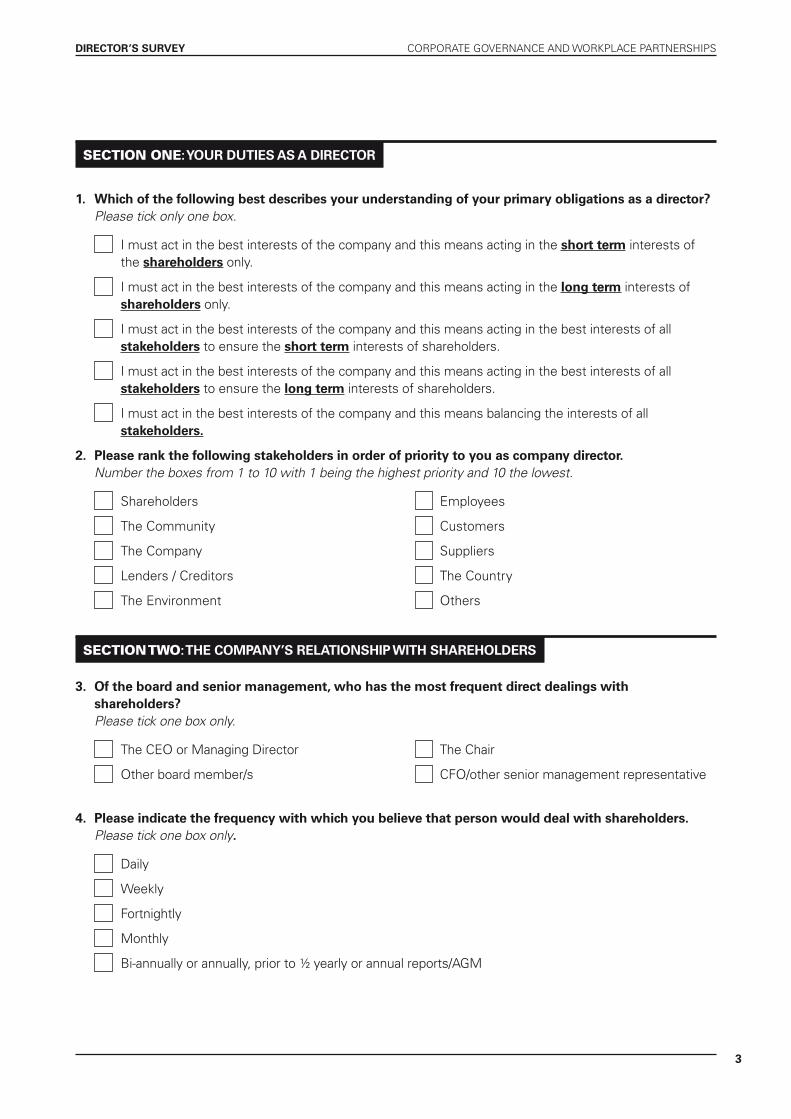
�
DireCtor’S SUrveY CORPORATE GOvERnAnCE And WORkPLACE PARTnERSHIPS
Section one: YoUr DUtieS aS a DireCtor
�. Which of the following best describes your understanding of your primary obligations as a director? Please tick only one box.
I must act in the best interests of the company and this means acting in the short term interests of the shareholders only.
I must act in the best interests of the company and this means acting in the long term interests of shareholders only.
I must act in the best interests of the company and this means acting in the best interests of all stakeholders to ensure the short term interests of shareholders.
I must act in the best interests of the company and this means acting in the best interests of all stakeholders to ensure the long term interests of shareholders.
I must act in the best interests of the company and this means balancing the interests of all stakeholders.
2. please rank the following stakeholders in order of priority to you as company director. Number the boxes from 1 to 10 with 1 being the highest priority and 10 the lowest.
Shareholders Employees
The Community Customers
The Company Suppliers
Lenders / Creditors The Country
The Environment Others
Section two: the CoMpanY’S relationShip With ShareholDerS
�. of the board and senior management, who has the most frequent direct dealings with shareholders? Please tick one box only.
The CEO or Managing director The Chair
Other board member/s CFO/other senior management representative
4. please indicate the frequency with which you believe that person would deal with shareholders. Please tick one box only.
daily
Weekly
Fortnightly
Monthly
Bi-annually or annually, prior to ½ yearly or annual reports/AGM
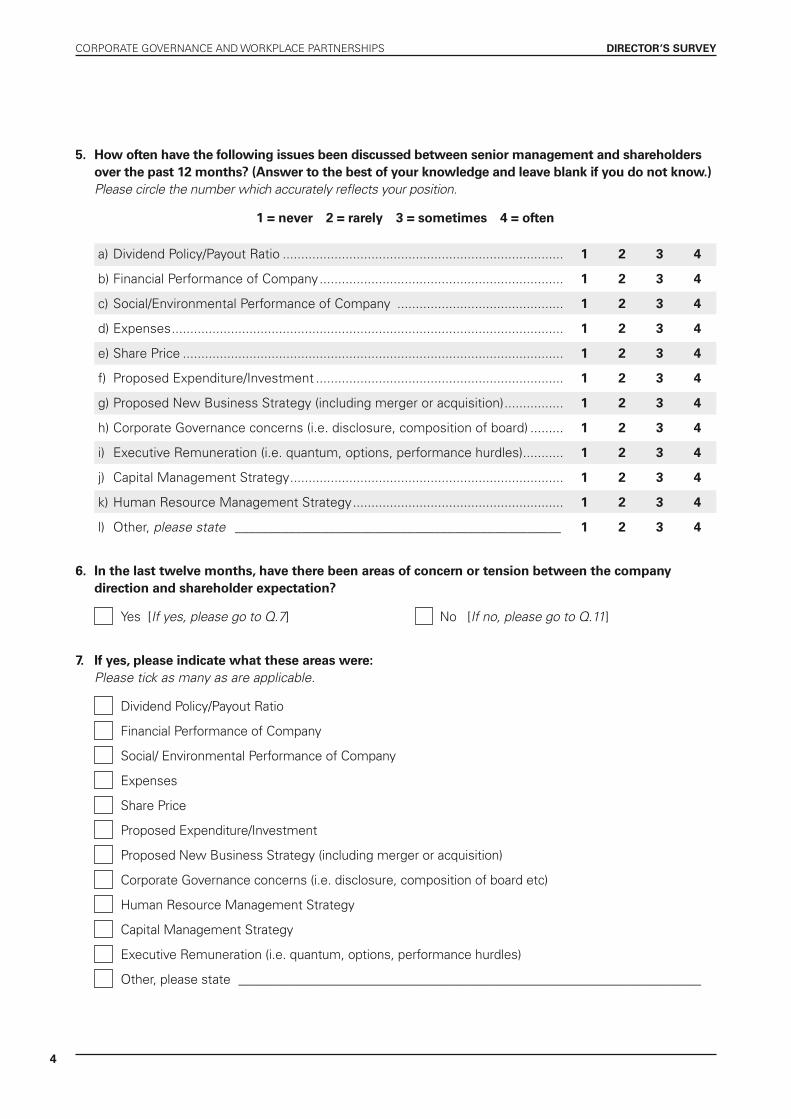
4
CORPORATE GOvERnAnCE And WORkPLACE PARTnERSHIPS DireCtor’S SUrveY
5. how often have the following issues been discussed between senior management and shareholders over the past �2 months? (answer to the best of your knowledge and leave blank if you do not know.) Please circle the number which accurately reflects your position.
� = never 2 = rarely � = sometimes 4 = often
a) dividend Policy/Payout Ratio ............................................................................ � 2 � 4
b) Financial Performance of Company .................................................................. � 2 � 4
c) Social/Environmental Performance of Company ............................................. � 2 � 4
d) Expenses .......................................................................................................... � 2 � 4
e) Share Price ....................................................................................................... � 2 � 4
f) Proposed Expenditure/Investment ................................................................... � 2 � 4
g) Proposed new Business Strategy (including merger or acquisition) ................ � 2 � 4
h) Corporate Governance concerns (i.e. disclosure, composition of board) ......... � 2 � 4
i) Executive Remuneration (i.e. quantum, options, performance hurdles) ........... � 2 � 4
j) Capital Management Strategy .......................................................................... � 2 � 4
k) Human Resource Management Strategy ......................................................... � 2 � 4
l) Other, please state _________________________________________________ � 2 � 4
6. in the last twelve months, have there been areas of concern or tension between the company direction and shareholder expectation?
Yes [If yes, please go to Q.7] no [If no, please go to Q.11]
7. if yes, please indicate what these areas were: Please tick as many as are applicable.
dividend Policy/Payout Ratio
Financial Performance of Company
Social/ Environmental Performance of Company
Expenses
Share Price
Proposed Expenditure/Investment
Proposed new Business Strategy (including merger or acquisition)
Corporate Governance concerns (i.e. disclosure, composition of board etc)
Human Resource Management Strategy
Capital Management Strategy
Executive Remuneration (i.e. quantum, options, performance hurdles)
Other, please state _______________________________________________________________________
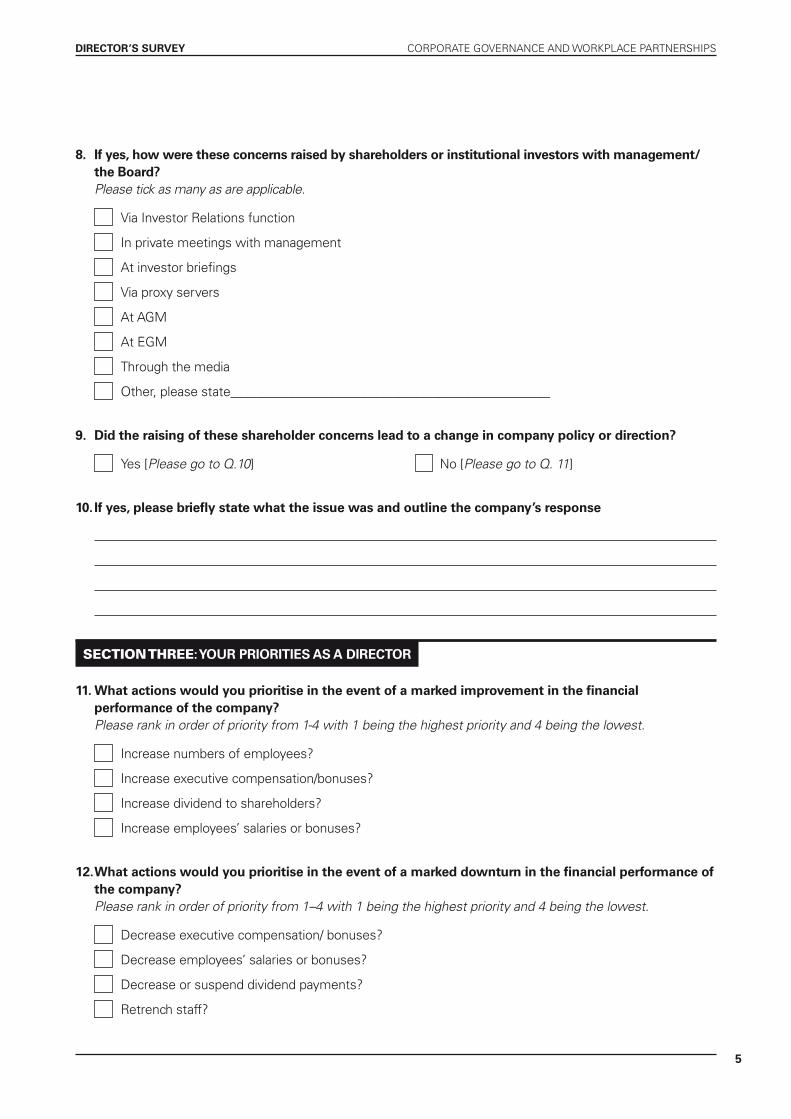
5
DireCtor’S SUrveY CORPORATE GOvERnAnCE And WORkPLACE PARTnERSHIPS
8. if yes, how were these concerns raised by shareholders or institutional investors with management/ the Board? Please tick as many as are applicable.
via Investor Relations function
In private meetings with management
At investor briefings
via proxy servers
At AGM
At EGM
Through the media
Other, please state_________________________________________________
9. Did the raising of these shareholder concerns lead to a change in company policy or direction?
Yes [Please go to Q.10] no [Please go to Q. 11]
�0. if yes, please briefly state what the issue was and outline the company’s response
Section three: YoUr prioritieS aS a DireCtor
��. What actions would you prioritise in the event of a marked improvement in the financial performance of the company? Please rank in order of priority from 1-4 with 1 being the highest priority and 4 being the lowest.
Increase numbers of employees?
Increase executive compensation/bonuses?
Increase dividend to shareholders?
Increase employees’ salaries or bonuses?
�2. What actions would you prioritise in the event of a marked downturn in the financial performance of the company? Please rank in order of priority from 1–4 with 1 being the highest priority and 4 being the lowest.
decrease executive compensation/ bonuses?
decrease employees’ salaries or bonuses?
decrease or suspend dividend payments?
Retrench staff?
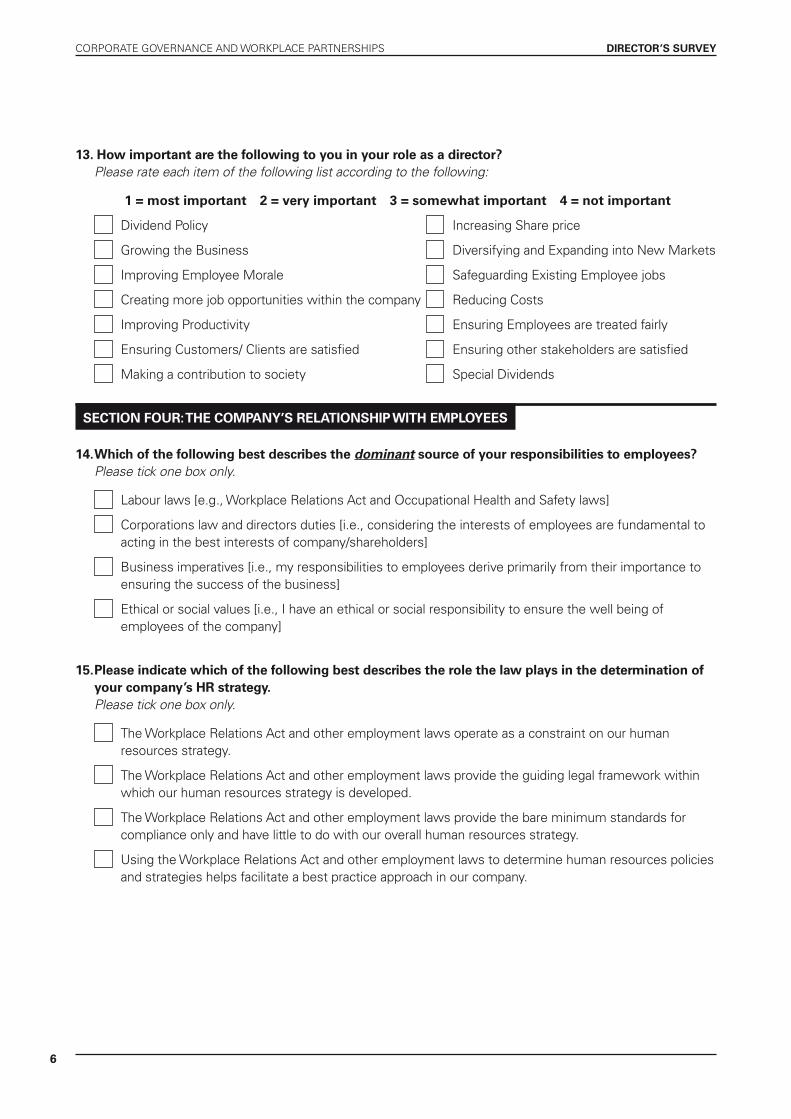
6
CORPORATE GOvERnAnCE And WORkPLACE PARTnERSHIPS DireCtor’S SUrveY
��. how important are the following to you in your role as a director? Please rate each item of the following list according to the following:
� = most important 2 = very important � = somewhat important 4 = not important
dividend Policy Increasing Share price
Growing the Business diversifying and Expanding into new Markets
Improving Employee Morale Safeguarding Existing Employee jobs
Creating more job opportunities within the company Reducing Costs
Improving Productivity Ensuring Employees are treated fairly
Ensuring Customers/ Clients are satisfied Ensuring other stakeholders are satisfied
Making a contribution to society Special dividends
SeCtion FoUr: the CoMpanY’S relationShip With eMploYeeS
�4. Which of the following best describes the dominant source of your responsibilities to employees? Please tick one box only.
Labour laws [e.g., Workplace Relations Act and Occupational Health and Safety laws]
Corporations law and directors duties [i.e., considering the interests of employees are fundamental to acting in the best interests of company/shareholders]
Business imperatives [i.e., my responsibilities to employees derive primarily from their importance to ensuring the success of the business]
Ethical or social values [i.e., I have an ethical or social responsibility to ensure the well being of employees of the company]
�5. please indicate which of the following best describes the role the law plays in the determination of your company’s hr strategy. Please tick one box only.
The Workplace Relations Act and other employment laws operate as a constraint on our human resources strategy.
The Workplace Relations Act and other employment laws provide the guiding legal framework within which our human resources strategy is developed.
The Workplace Relations Act and other employment laws provide the bare minimum standards for compliance only and have little to do with our overall human resources strategy.
Using the Workplace Relations Act and other employment laws to determine human resources policies and strategies helps facilitate a best practice approach in our company.

7
DireCtor’S SUrveY CORPORATE GOvERnAnCE And WORkPLACE PARTnERSHIPS
�6. Which of the following statements best describes your understanding of the law on directors’ duties? Please tick one box only
The law regarding directors’ duties makes it clear that I must be only concerned with shareholders’ interests when making decisions.
The law regarding directors’ duties is broad enough to allow me to take into account the interests of stakeholders other than shareholders when making decisions.
�7. Does the company have a centralised human resource management function?
Yes no
�8. if yes, does the human resources Manager report directly to the Ceo or Managing Director?
Yes no
�9. thinking about the last twelve months, please indicate how often each of the following human resource management issues in relation to employees below executive level have been considered by the board? Please circle the number which accurately reflects your position.
� = never 2 = one or two times � = three or four times 4 = five or more
a) Remuneration ................................................................................................... � 2 � 4
b) Productivity ...................................................................................................... � 2 � 4
c) Performance management ............................................................................... � 2 � 4
d) Industrial disputes ............................................................................................ � 2 � 4
e) Enterprise bargaining ........................................................................................ � 2 � 4
f) Restructuring or retrenchments ....................................................................... � 2 � 4
g) Employee share schemes ................................................................................ � 2 � 4
h) Work organisation or systems (i.e. quality systems, production processes, etc) ... � 2 � 4
i) Training ............................................................................................................. � 2 � 4
j) Occupational Health and Safety ....................................................................... � 2 � 4
k) Other, please state _________________________________________________ � 2 � 4
20. Would you say that the relationship between the company and its employees is best described as being one of partnership?
YES [Please go to Q.20A] nO [Please go to Q. 20B]
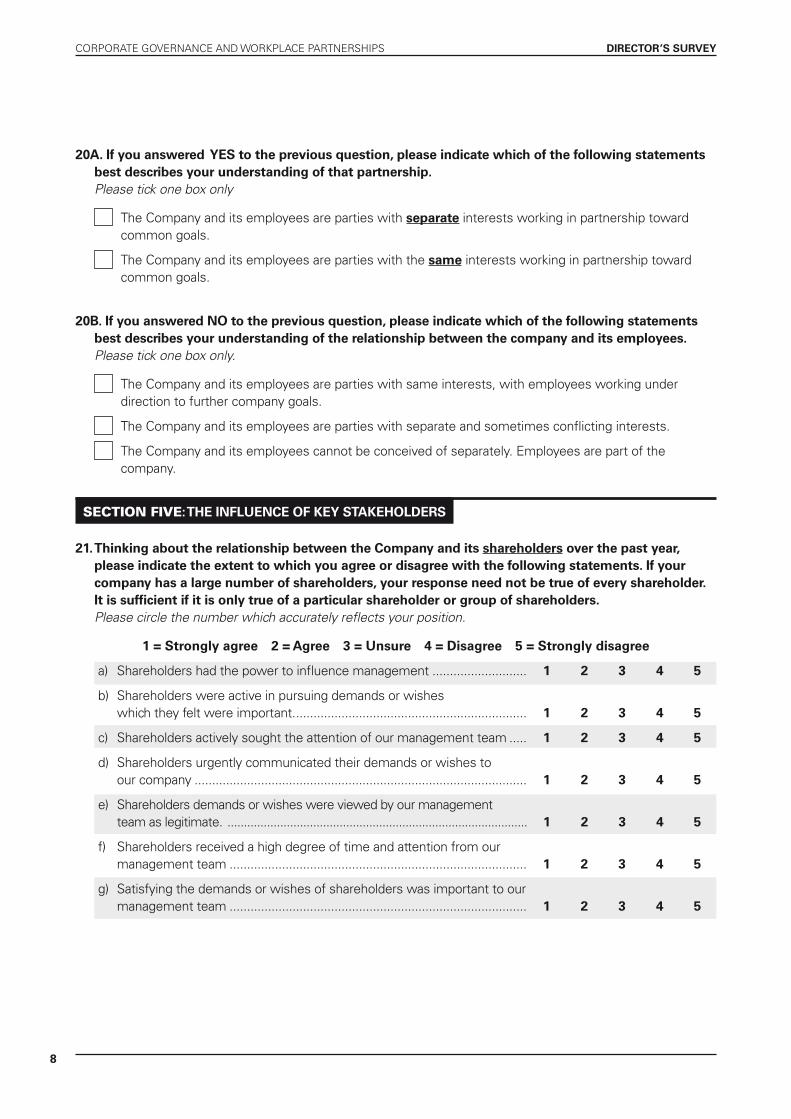
8
CORPORATE GOvERnAnCE And WORkPLACE PARTnERSHIPS DireCtor’S SUrveY
20a. if you answered YeS to the previous question, please indicate which of the following statements best describes your understanding of that partnership. Please tick one box only
The Company and its employees are parties with separate interests working in partnership toward common goals.
The Company and its employees are parties with the same interests working in partnership toward common goals.
20B. if you answered no to the previous question, please indicate which of the following statements best describes your understanding of the relationship between the company and its employees. Please tick one box only.
The Company and its employees are parties with same interests, with employees working under direction to further company goals.
The Company and its employees are parties with separate and sometimes conflicting interests.
The Company and its employees cannot be conceived of separately. Employees are part of the company.
Section Five: the inFlUenCe oF keY StakeholDerS
2�. thinking about the relationship between the Company and its shareholders over the past year, please indicate the extent to which you agree or disagree with the following statements. if your company has a large number of shareholders, your response need not be true of every shareholder. it is sufficient if it is only true of a particular shareholder or group of shareholders. Please circle the number which accurately reflects your position.
� = Strongly agree 2 = agree � = Unsure 4 = Disagree 5 = Strongly disagree
a) Shareholders had the power to influence management ........................... � 2 � 4 5
b) Shareholders were active in pursuing demands or wishes which they felt were important. .................................................................. � 2 � 4 5
c) Shareholders actively sought the attention of our management team ..... � 2 � 4 5
d) Shareholders urgently communicated their demands or wishes to our company ............................................................................................... � 2 � 4 5
e) Shareholders demands or wishes were viewed by our management team as legitimate. ........................................................................................... � 2 � 4 5
f) Shareholders received a high degree of time and attention from our management team ..................................................................................... � 2 � 4 5
g) Satisfying the demands or wishes of shareholders was important to our management team ..................................................................................... � 2 � 4 5
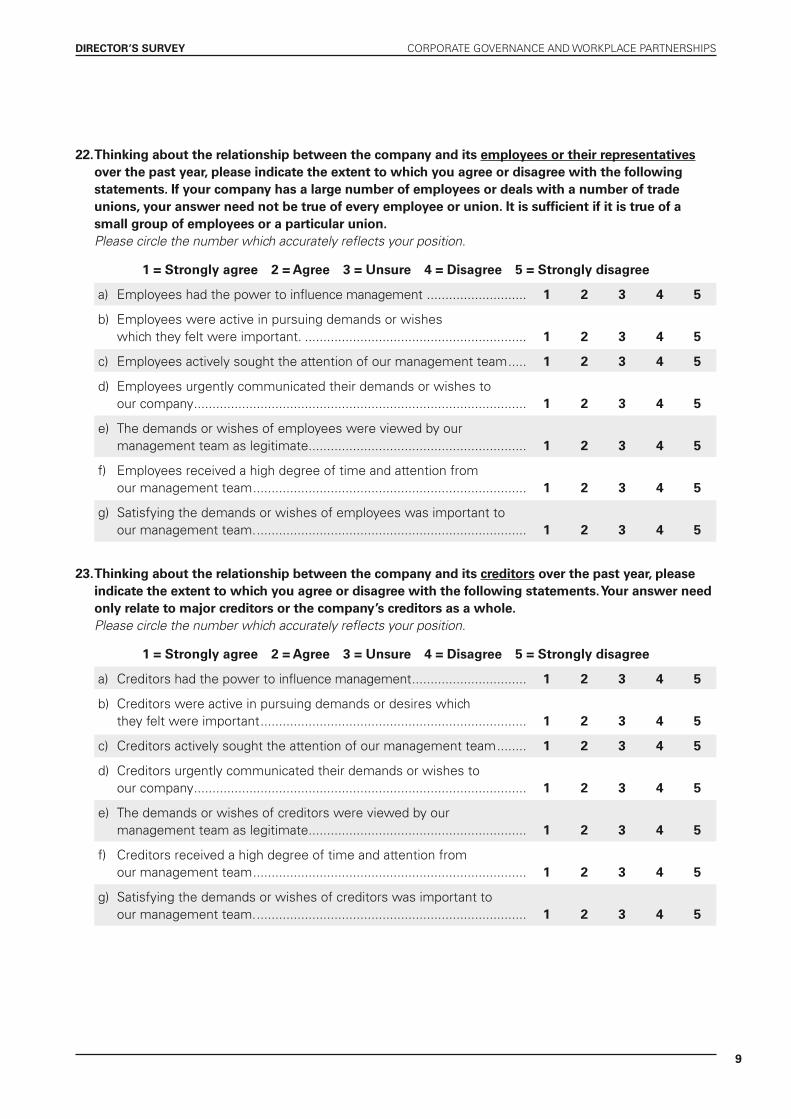
9
DireCtor’S SUrveY CORPORATE GOvERnAnCE And WORkPLACE PARTnERSHIPS
22. thinking about the relationship between the company and its employees or their representatives over the past year, please indicate the extent to which you agree or disagree with the following statements. if your company has a large number of employees or deals with a number of trade unions, your answer need not be true of every employee or union. it is sufficient if it is true of a small group of employees or a particular union. Please circle the number which accurately reflects your position.
� = Strongly agree 2 = agree � = Unsure 4 = Disagree 5 = Strongly disagree
a) Employees had the power to influence management ........................... � 2 � 4 5
b) Employees were active in pursuing demands or wishes which they felt were important. ............................................................ � 2 � 4 5
c) Employees actively sought the attention of our management team ..... � 2 � 4 5
d) Employees urgently communicated their demands or wishes to our company .......................................................................................... � 2 � 4 5
e) The demands or wishes of employees were viewed by our management team as legitimate ........................................................... � 2 � 4 5
f) Employees received a high degree of time and attention from our management team .......................................................................... � 2 � 4 5
g) Satisfying the demands or wishes of employees was important to our management team. ......................................................................... � 2 � 4 5
2�. thinking about the relationship between the company and its creditors over the past year, please indicate the extent to which you agree or disagree with the following statements. Your answer need only relate to major creditors or the company’s creditors as a whole. Please circle the number which accurately reflects your position.
� = Strongly agree 2 = agree � = Unsure 4 = Disagree 5 = Strongly disagree
a) Creditors had the power to influence management ............................... � 2 � 4 5
b) Creditors were active in pursuing demands or desires which they felt were important ........................................................................ � 2 � 4 5
c) Creditors actively sought the attention of our management team ........ � 2 � 4 5
d) Creditors urgently communicated their demands or wishes to our company .......................................................................................... � 2 � 4 5
e) The demands or wishes of creditors were viewed by our management team as legitimate ........................................................... � 2 � 4 5
f) Creditors received a high degree of time and attention from our management team .......................................................................... � 2 � 4 5
g) Satisfying the demands or wishes of creditors was important to our management team. ......................................................................... � 2 � 4 5
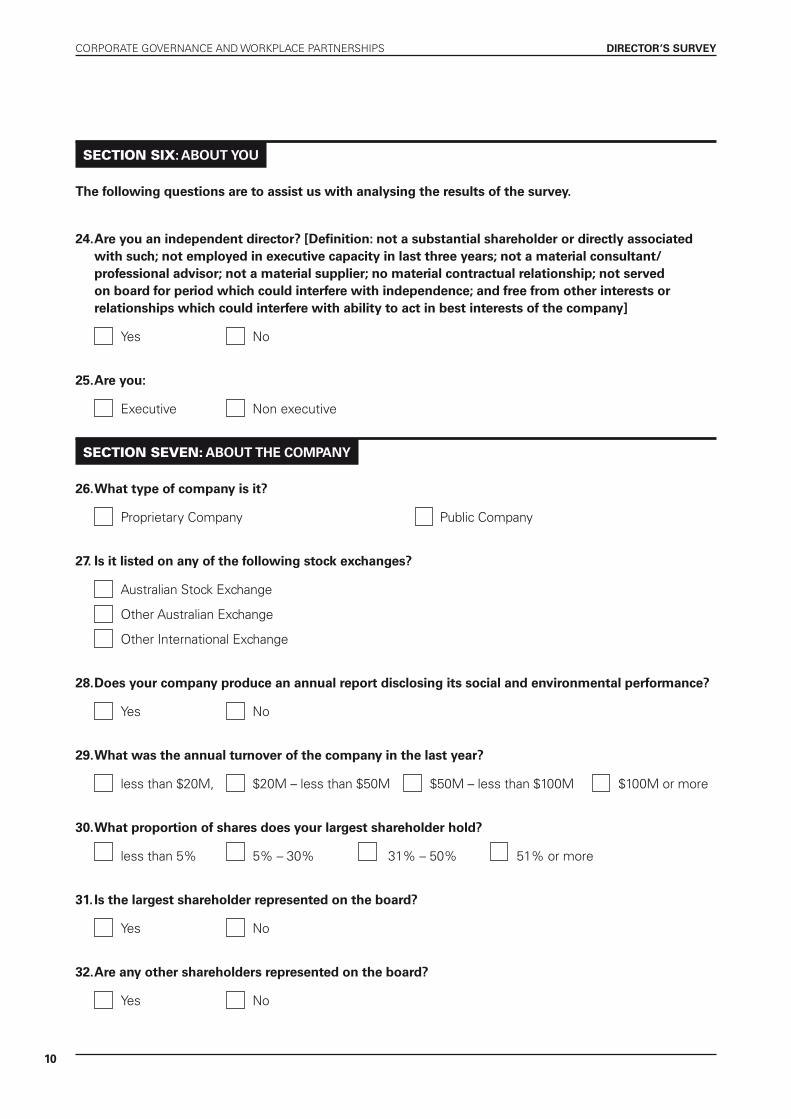
�0
CORPORATE GOvERnAnCE And WORkPLACE PARTnERSHIPS DireCtor’S SUrveY
Section Six: aBoUt YoU
the following questions are to assist us with analysing the results of the survey.
24. are you an independent director? [Definition: not a substantial shareholder or directly associated with such; not employed in executive capacity in last three years; not a material consultant/professional advisor; not a material supplier; no material contractual relationship; not served on board for period which could interfere with independence; and free from other interests or relationships which could interfere with ability to act in best interests of the company]
Yes no
25. are you:
Executive non executive
Section Seven: aBoUt the CoMpanY
26. What type of company is it?
Proprietary Company Public Company
27. is it listed on any of the following stock exchanges?
Australian Stock Exchange
Other Australian Exchange
Other International Exchange
28. Does your company produce an annual report disclosing its social and environmental performance?
Yes no
29. What was the annual turnover of the company in the last year?
less than $20M, $20M – less than $50M $50M – less than $100M $100M or more
�0. What proportion of shares does your largest shareholder hold?
less than 5% 5% – 30% 31% – 50% 51% or more
��. is the largest shareholder represented on the board?
Yes no
�2. are any other shareholders represented on the board?
Yes no
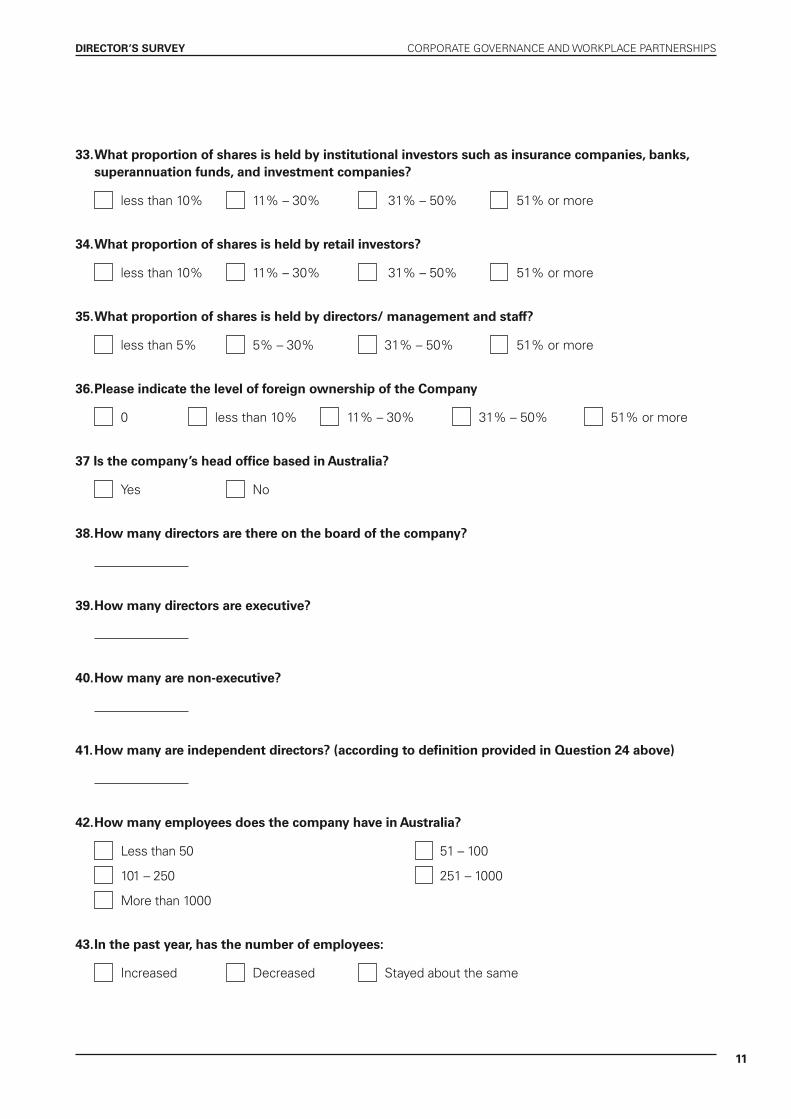
��
DireCtor’S SUrveY CORPORATE GOvERnAnCE And WORkPLACE PARTnERSHIPS
��. What proportion of shares is held by institutional investors such as insurance companies, banks, superannuation funds, and investment companies?
less than 10% 11% – 30% 31% – 50% 51% or more
�4. What proportion of shares is held by retail investors?
less than 10% 11% – 30% 31% – 50% 51% or more
�5. What proportion of shares is held by directors/ management and staff?
less than 5% 5% – 30% 31% – 50% 51% or more
�6. please indicate the level of foreign ownership of the Company
0 less than 10% 11% – 30% 31% – 50% 51% or more
�7 is the company’s head office based in australia?
Yes no
�8. how many directors are there on the board of the company?
�9. how many directors are executive?
40. how many are non-executive?
4�. how many are independent directors? (according to definition provided in Question 24 above)
42. how many employees does the company have in australia?
Less than 50 51 – 100
101 – 250 251 – 1000
More than 1000
4�. in the past year, has the number of employees:
Increased decreased Stayed about the same
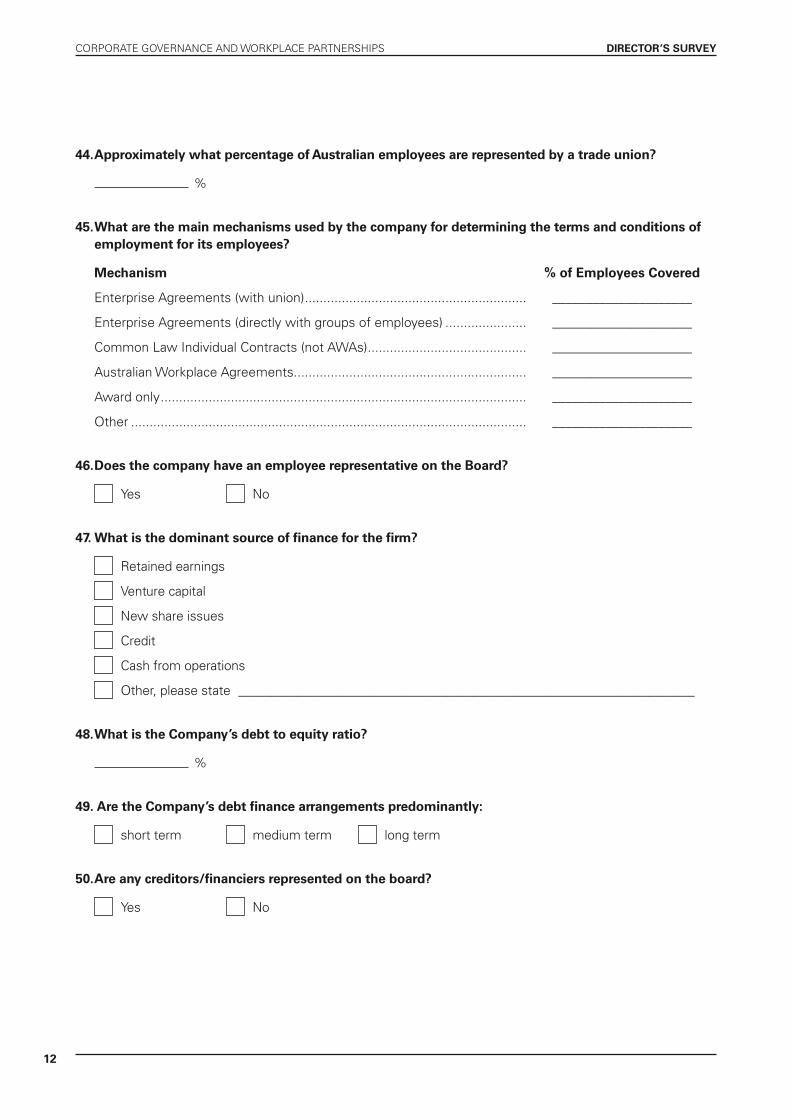
�2
CORPORATE GOvERnAnCE And WORkPLACE PARTnERSHIPS DireCtor’S SUrveY
44. approximately what percentage of australian employees are represented by a trade union?
%
45. What are the main mechanisms used by the company for determining the terms and conditions of employment for its employees?
Mechanism % of employees Covered
Enterprise Agreements (with union) ............................................................ _____________________
Enterprise Agreements (directly with groups of employees) ...................... _____________________
Common Law Individual Contracts (not AWAs) ........................................... _____________________
Australian Workplace Agreements............................................................... _____________________
Award only ................................................................................................... _____________________
Other ........................................................................................................... _____________________
46. Does the company have an employee representative on the Board?
Yes no
47. What is the dominant source of finance for the firm?
Retained earnings
venture capital
new share issues
Credit
Cash from operations
Other, please state ______________________________________________________________________
48. What is the Company’s debt to equity ratio?
%
49. are the Company’s debt finance arrangements predominantly:
short term medium term long term
50. are any creditors/financiers represented on the board?
Yes no
��
DireCtor’S SUrveY CORPORATE GOvERnAnCE And WORkPLACE PARTnERSHIPS
5�. Which of the following best describes the industry in which the company operates?
Agriculture, Forestry and Fishing
Mining
Manufacturing
Electricity, Gas and Water Supply
Construction
Wholesale Trade
Retail Trade
Accommodation, Cafes and Restaurants
Transport and Storage
Communication Services
Finance and Insurance
Property and Business Services
Education
Health and Community Services
Cultural and Recreational Services
Personal and Other Services
52. is there anything else you would like to say about any of the issues raised by this survey?
thank you for taking the time to complete this survey. please return it immediately in the reply paid envelope provided.