Embed Size (px)
Citation preview
1

2

3
Company InformationDIRECTORS
• Lt Gen Khalid Nawaz Khan, HI(M), Sitara-i-Esar, (Retd) Chairman
• Lt Gen Muhammad Haroon Aslam, HI(M), SBt (Retd) Chief Executive & Managing Director
• Lt Gen Shafqaat Ahmed, HI(M), (Retd)
• Mr Qaiser Javed
• Dr Nadeem Inayat
• Maj Gen Nasir Mahmood, HI(M), (Retd)
• Maj Gen Muhammad Farooq Iqbal, HI(M), (Retd)
• Maj Gen Syed Jamal Shahid, HI(M), (Retd)
• Brig Raja Jahanzeb, SI (M), (Retd)
• Mr Naved A. Khan
• Mr Nasier A. Sheikh
• Dr Rashid Bajwa
COMPANY SECRETARYBrig Muhammad Azam, SI(M), (Retd)
GROUP GENERAL MANAGER FINANCESyed Aamir Ahsan
REGISTERED OFFICEFFBL Tower, C1/C2, Sector B, Jinnah Boulevard, DHA II, Islamabad. Tel: 051-8763325 Fax: 051-8763302E-mail: [email protected]: http://www.ffbl.com
PLANTSITEPlot No. EZ/I/P-1, Eastern Zone, Bin Qasim, Karachi, Pakistan

4
Habib Bank LimitedMCB Bank LimitedUnited Bank LimitedNational Bank of PakistanAllied Bank LimitedAskari Bank LimitedFaysal Bank LimitedStandard Chartered Bank (Pakistan) LimitedHabib Metropolitan BankBank Al-Falah LimitedBank Al-Habib LimitedNIB Bank LimitedSilk Bank LimitedThe Bank of Punjab
LEGAL ADVISORSOrr Dignam & CoAdvocates,3-A, Street 32, Sector F-8/1,Islamabad, Pakistan
AUDITORSErnst & Young Ford Rhodes Sidat HyderChartered AccountantsEagle Plaza, 75 West, Fazlul-Haq Road, Blue Area, Islamabad.
SHARES REGISTRAR Corplink (Pvt) LimitedWings Arcade, 1-K, Commercial, Model Town, Lahore.Tel: (042) 35839182, 35887262 Fax: (042) 35869037
Al Baraka Bank (Pakistan) LimitedDubai Islamic Bank (Pakistan) LimitedBank Islami Pakistan LimitedBurj Bank LimitedThe Bank of KhyberMeezan Bank LimitedSoneri Bank LimitedSummit Bank LimitedDeutsche Bank AGJS Bank LimitedSamba Bank LimitedZarai Taraqiati Bank LimitedMCB Islamic Bank LimitedIndustrial Bank of China
BANKERS
5
The Board of Directors is pleased to present a brief overview of the operational and financial performance of the Company for the half year ended June 30, 2016.
By the grace of Almighty, the overall performance of the plants remained satisfactory during the period. Marked improvement in gas curtailment due to import of LNG by GoP eased out the pressure on FFBL resulting in improved production of Ammonia, Urea and DAP in terms of installed capacity. The average curtailment was 10% as compared with 37% in corresponding period. Ammonia, Urea and DAP plants remained closed for 30, 41 and 31 days respectively. Production of Ammonia at 208 thousand tonnes, DAP at 370 thousand tonnes was higher by 56% and 5% respectively, whereas Urea at 219 thousand tonnes was higher by 131% com-pared with the corresponding period.
FFBL Urea sales during Jan-Jun 2016 were 155 thousand tonnes, showing an increase of 63% as compared to 95 thousand tonnes sales of corresponding period of 2015 due to higher production. Sona DAP sales during the period were 167 thousand tonnes, 31% lower than 242 thousand tonnes sales of Jan-Jun 2015.
Urea industry sales during Jan-Jun 2016 are estimated to contract substantially to 1,843 thou-sand tonnes showing a decrease of 36% as compared to 2,868 thousand tonnes sales during the same period of 2015. DAP industry sales during Jan-Jun 2016 are estimated at 497 thou-sand tonnes, 5% higher than 474 thousand tonnes sales of 2015.
Due to poor off-take and high production, there were no urea imports during Jan-Jun 2016 as compared to imports of 305 thousand tonnes during Jan-Jun 2015. Industry urea inventory at end of half year piled up to 1.65 million tonnes resulting in instability in off-take price. Low wheat price also affected farmer economics by denting their purchasing power.
During Jan-Jun 2016 FFBL share in Urea and DAP market is estimated to be 8.4% and 33.5% respectively.
FFBL’s financial results for the period Jan-Jun 2016 have shown a gross loss of Rs. 337 million as compared to gross profit of Rs 2,903 million in the corresponding period. Net loss for the period is Rs. 895 million as against net profit of Rs. 758 million in the corresponding period. The main reason is substantially low off-take of DAP due to withdrawal of subsidy on DAP from May 27, 2016 and delay in announcement and implementation of subsidy on DAP and Urea by GoP for financial year 2016-2017. This has adversely affected industry as well as Company`s sales
Directors’ ReviewFor the Half Year Ended June 30, 2016

6
during the period. Secondly, the contribution of Rs. 50/bag on Urea by the industry has further increased loss of FFBL. Other factors include increased carrying cost of high inventory levels and reduced margins due to impact of cost of Gas Infrastructure Development Cess (GIDC) on fuel and feed gas, which FFBL did not pass on to its customers.
Selling and distribution expenses have increased due to increased despatches to storage godowns resulting from increased production during the period as compared to the corresponding period. Financial charges increased due to carrying cost of inventory and delayed payment of subsidy claim by GoP. Other income mainly includes dividend received from Askari Bank Limited and Fauji Cement Company Limited and GoP subsidy on DAP and Urea. Resultantly, Company’s loss per share at June 30, 2016 stood at Re. 0.96 against EPS of Re. 0.81 in the corresponding period of previous year.
The overall performance of PMP plant remained satisfactory for the period Jan-Jun 2016. PMP produced 228 thousand tonnes of P2O5 during the said period. PMP reported a net profit of MAD 15 million for the first quarter ended March 31, 2016. The main reasons for profit are higher volume of sales and improved margins.
Sale of DAP and Urea have lately picked up. The Company is expected to perform better in the second half of the year with better results for its stakeholders by the year end.
Consistent gas supply is still a challenge for fertilizer sector in the days to come. FFBL is continuing its efforts with Ministry of Petroleum and SSGCL for further improvement of gas supply up to the contracted quantity.
For and on behalf of the Board
Islamabad Lt Gen Khalid Nawaz Khan, HI(M), Sitara-i-Esar, (Retd)July 26, 2016 Chairman

7
Auditor’s Report to the Members on Review of Interim Financial InformationIntroduction
We have reviewed the accompanying condensed interim balance sheet of Fauji Fertilizer Bin Qasim Limited (“the Company”) as at June 30, 2016, the related condensed interim profit and loss account, condensed interim statement of comprehensive income, condensed interim statement of cash flows, condensed interim statement of changes in equity and notes to the accounts for the six month period then ended (here-in-after referred to as the “interim financial information”). Management is responsible for the preparation and presentation of this interim financial information in accordance with approved accounting standards as applicable in Pakistan for interim financial reporting. Our responsibility is to express a conclusion on this interim financial information based on our review.
Scope of Review
We conducted our review in accordance with the International Standard on Review Engagements 2410, “Review of Interim Financial Information Performed by the Independent Auditor of the Entity”. A review of interim financial information consists of making inquiries, primarily of persons responsible for financial and accounting matters, and applying analytical and other review procedures. A review is substantially less in scope than an audit conducted in accordance with International Standards on Auditing and consequently does not enable us to obtain assurance that we would become aware of all significant matters that might be identified in an audit. Accordingly, we do not express an audit opinion.
Conclusion
Based on our review, nothing has come to our attention that causes us to believe that the accompanying interim financial information is not prepared, in all material respects, in accordance with approved accounting standards as applicable in Pakistan for interim financial reporting.
Other Matters
The financial statements of the Company for the year ended December 31, 2015 and condensed interim financial information for the six months ended June 30, 2015 were audited and reviewed, respectively, by another firm of Chartered Accountants, whose audit report dated January 26, 2016 and review report dated July 29, 2015 expressed an unqualified opinion on the financial statements of the Company for the year ended December 31, 2015 and also expressed an unqualified conclusion on the six months condensed interim financial information, for the period ended June 30, 2015, respectively.
Ernst & Young Ford Rhodes Sidat HyderIslamabad Chartered AccountantsDated: July 26, 2016 Review Engagement Partner’s Name: Khayyam Mushir

8

9
Condensed Interim Financial
Information
10
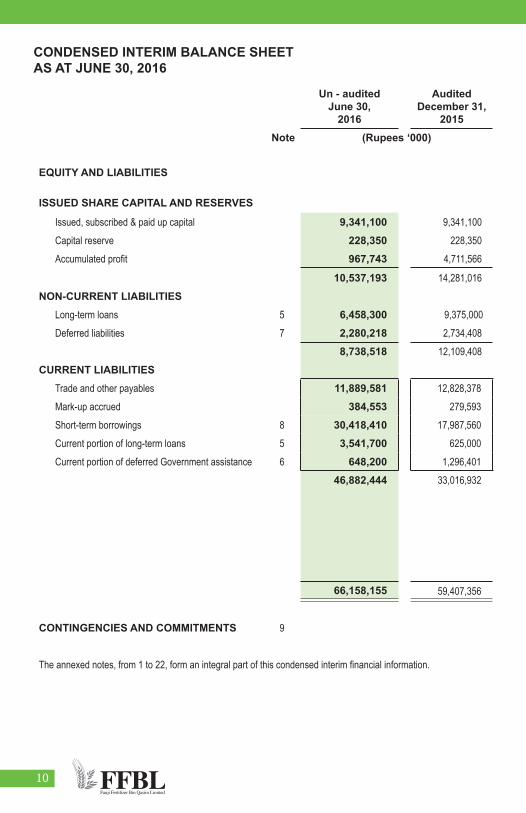
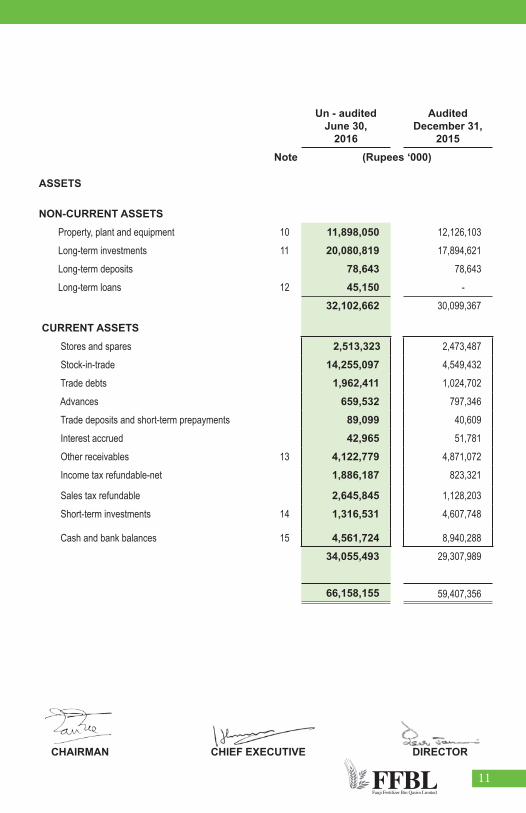
CONDENSED INTERIM BALANCE SHEET AS AT JUNE 30, 2016
Un - auditedJune 30,
2016
AuditedDecember 31,
2015Note (Rupees ‘000)
EQUITY AND LIABILITIES
ISSUED SHARE CAPITAL AND RESERVES
Issued, subscribed & paid up capital 9,341,100 9,341,100 Capital reserve 228,350 228,350 Accumulated profit 967,743 4,711,566
10,537,193 14,281,016 NON-CURRENT LIABILITIES
Long-term loans 5 6,458,300 9,375,000Deferred liabilities 7 2,280,218 2,734,408
8,738,518 12,109,408 CURRENT LIABILITIES
Trade and other payables 11,889,581 12,828,378Mark-up accrued 384,553 279,593Short-term borrowings 8 30,418,410 17,987,560Current portion of long-term loans 5 3,541,700 625,000Current portion of deferred Government assistance 6 648,200 1,296,401
46,882,444 33,016,932
66,158,155 59,407,356
CONTINGENCIES AND COMMITMENTS 9
The annexed notes, from 1 to 22, form an integral part of this condensed interim financial information.
11
CHAIRMAN CHIEF EXECUTIVE DIRECTOR
Un - auditedJune 30,
2016
AuditedDecember 31,
2015Note (Rupees ‘000)
ASSETS
NON-CURRENT ASSETSProperty, plant and equipment 10 11,898,050 12,126,103 Long-term investments 11 20,080,819 17,894,621 Long-term deposits 78,643 78,643 Long-term loans 12 45,150 -
32,102,662 30,099,367
CURRENT ASSETS Stores and spares 2,513,323 2,473,487 Stock-in-trade 14,255,097 4,549,432 Trade debts 1,962,411 1,024,702 Advances 659,532 797,346 Trade deposits and short-term prepayments 89,099 40,609 Interest accrued 42,965 51,781 Other receivables 13 4,122,779 4,871,072 Income tax refundable-net 1,886,187 823,321
Sales tax refundable 2,645,845 1,128,203 Short-term investments 14 1,316,531 4,607,748
Cash and bank balances 15 4,561,724 8,940,288 34,055,493 29,307,989
66,158,155 59,407,356
12
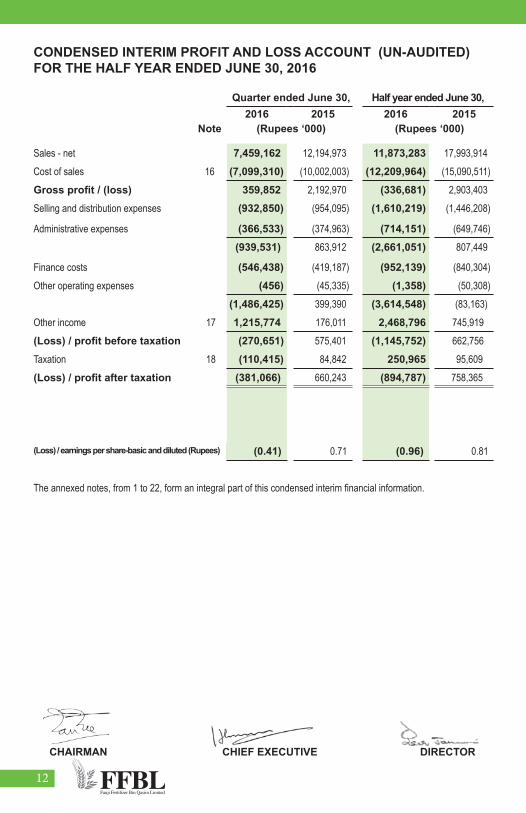
CONDENSED INTERIM PROFIT AND LOSS ACCOUNT (UN-AUDITED)FOR THE HALF YEAR ENDED JUNE 30, 2016
Quarter ended June 30, Half year ended June 30,2016 2015 2016 2015
Note (Rupees ‘000) (Rupees ‘000)
Sales - net 7,459,162 12,194,973 11,873,283 17,993,914 Cost of sales 16 (7,099,310) (10,002,003) (12,209,964) (15,090,511)Gross profit / (loss) 359,852 2,192,970 (336,681) 2,903,403 Selling and distribution expenses (932,850) (954,095) (1,610,219) (1,446,208)
Administrative expenses (366,533) (374,963) (714,151) (649,746) (939,531) 863,912 (2,661,051) 807,449
Finance costs (546,438) (419,187) (952,139) (840,304)Other operating expenses (456) (45,335) (1,358) (50,308)
(1,486,425) 399,390 (3,614,548) (83,163)Other income 17 1,215,774 176,011 2,468,796 745,919 (Loss) / profit before taxation (270,651) 575,401 (1,145,752) 662,756 Taxation 18 (110,415) 84,842 250,965 95,609 (Loss) / profit after taxation (381,066) 660,243 (894,787) 758,365
(Loss) / earnings per share-basic and diluted (Rupees) (0.41) 0.71 (0.96) 0.81
The annexed notes, from 1 to 22, form an integral part of this condensed interim financial information.
CHAIRMAN CHIEF EXECUTIVE DIRECTOR

13
CONDENSED INTERIM STATEMENT OF COMPREHENSIVE INCOME (UN-AUDITED)FOR THE HALF YEAR ENDED JUNE 30, 2016
Quarter ended June 30, Half year ended June 30,
2016 2015 2016 2015 (Rupees ‘000) (Rupees ‘000)
(Loss) / profit after taxation (381,066) 660,243 (894,787) 758,365
Other comprehensive income - - - -
Total comprehensive (loss) / income (381,066) 660,243 (894,787) 758,365
CHAIRMAN CHIEF EXECUTIVE DIRECTOR
The annexed notes, from 1 to 22, form an integral part of this condensed interim financial information.

14
CONDENSED INTERIM STATEMENT OF CASH FLOWS (UN-AUDITED)FOR THE HALF YEAR ENDED JUNE 30, 2016
2016 2015Note (Rupees ‘000)
CASH FLOWS FROM OPERATING ACTIVITIESCash used in operations 19 (12,274,934) (5,060,130)Income tax paid (1,292,672) (1,442,607)Contribution from Gratuity Fund 4,151 3,268 Finance cost paid (831,449) (644,875)Compensated absences paid (11,467) (15,307)Receipt from / (payment to) Workers’ (Profit) Participation Fund 10,971 (20,557)Net cash used in operating activities (14,395,400) (7,180,208)
CASH FLOWS FROM INVESTING ACTIVITIESFixed capital expenditure (494,867) (425,805)Long-term investments (2,186,198) (4,868,505) Sale proceeds of property, plant and equipment 2,129 6,845 Dividend received 372,668 290,634 Proceeds from short-term investments - 8,114,763Long-term loan disbursed (45,150) - Profit received on bank balances and term deposits 140,078 111,885Net cash (used in) / generated from investing activities (2,211,340) 3,229,817
CASH FLOWS FROM FINANCING ACTIVITIESDeferred Government assistance payment (648,201) (648,201)Short-term borrowings - net 5,360,051 3,900,000 Dividend paid (2,845,690) (2,261,279)Net cash generated from financing activities 1,866,160 990,520 Net decrease in cash and cash equivalents (14,740,580) (2,959,871)Cash and cash equivalents at the beginning of the period 9,260,476 5,137,262 Cash and cash equivalents at the end of the period (5,480,104) 2,177,391
CASH AND CASH EQUIVALENTSCash and cash equivalents included in the statement of cash flows comprises the following balance sheet amounts:
- Cash and bank balances 4,561,724 6,766,876 - Short term highly liquid investments 1,316,531 400,000 - Short term running finance 8 (11,358,359) (4,989,485)
(5,480,104) 2,177,391
The annexed notes, from 1 to 22, form an integral part of this condensed interim financial information.
CHAIRMAN CHIEF EXECUTIVE DIRECTOR

15
CONDENSED INTERIM STATEMENT OF CHANGES IN EQUITY (UN-AUDITED)FOR THE HALF YEAR ENDED JUNE 30, 2016
Share capital
Capital reserve
Accumulated profit
Total
( R u p e e s ‘ 0 0 0 ) Balance as at January 01, 2015 9,341,100 228,350 3,502,187 13,071,637 Total comprehensive income
Profit for the period after taxation - - 758,365 758,365 Other comprehensive income for the period - - - - Total comprehensive income for the period - - 758,365 758,365
Transactions with owners, recorded directly in equity Distributions to owners
Final dividend 2014 (Rs. 2.25 per ordinary share) - - (2,101,748) (2,101,748) Total transactions with owners - - (2,101,748) (2,101,748)
Balance as at June 30, 2015 9,341,100 228,350 2,158,804 11,728,254
Balance as at January 01, 2016 9,341,100 228,350 4,711,566 14,281,016 Total comprehensive income
Loss for the period after taxation - - (894,787) (894,787) Other comprehensive income for the period - - - - Total comprehensive loss for the period - - (894,787) (894,787)
Transactions with owners, recorded directly in equity Distributions to owners
Final dividend 2015 (Rs. 3.05 per ordinary share) - - (2,849,036) (2,849,036) Total transactions with owners - - (2,849,036) (2,849,036)
Balance as at June 30, 2016 9,341,100 228,350 967,743 10,537,193
The annexed notes, from 1 to 22, form an integral part of this condensed interim financial information.
CHAIRMAN CHIEF EXECUTIVE DIRECTOR
16
NOTES TO THE CONDENSED INTERIM FINANCIAL INFORMATION (UN-AUDITED)FOR THE HALF YEAR ENDED JUNE 30, 2016
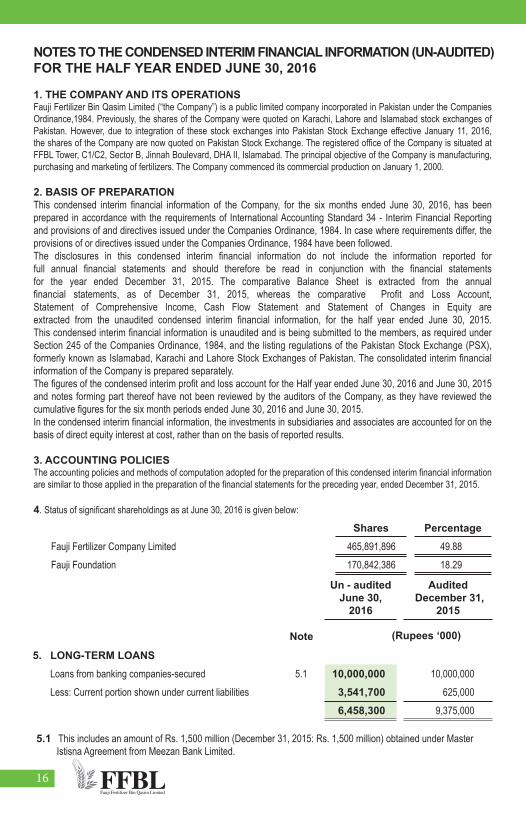
1. THE COMPANY AND ITS OPERATIONSFauji Fertilizer Bin Qasim Limited (“the Company”) is a public limited company incorporated in Pakistan under the Companies Ordinance,1984. Previously, the shares of the Company were quoted on Karachi, Lahore and Islamabad stock exchanges of Pakistan. However, due to integration of these stock exchanges into Pakistan Stock Exchange effective January 11, 2016, the shares of the Company are now quoted on Pakistan Stock Exchange. The registered office of the Company is situated at FFBL Tower, C1/C2, Sector B, Jinnah Boulevard, DHA II, Islamabad. The principal objective of the Company is manufacturing, purchasing and marketing of fertilizers. The Company commenced its commercial production on January 1, 2000.
2. BASIS OF PREPARATIONThis condensed interim financial information of the Company, for the six months ended June 30, 2016, has been prepared in accordance with the requirements of International Accounting Standard 34 - Interim Financial Reporting and provisions of and directives issued under the Companies Ordinance, 1984. In case where requirements differ, the provisions of or directives issued under the Companies Ordinance, 1984 have been followed. The disclosures in this condensed interim financial information do not include the information reported for full annual financial statements and should therefore be read in conjunction with the financial statements for the year ended December 31, 2015. The comparative Balance Sheet is extracted from the annual financial statements, as of December 31, 2015, whereas the comparative Profit and Loss Account, Statement of Comprehensive Income, Cash Flow Statement and Statement of Changes in Equity are extracted from the unaudited condensed interim financial information, for the half year ended June 30, 2015. This condensed interim financial information is unaudited and is being submitted to the members, as required under Section 245 of the Companies Ordinance, 1984, and the listing regulations of the Pakistan Stock Exchange (PSX), formerly known as Islamabad, Karachi and Lahore Stock Exchanges of Pakistan. The consolidated interim financial information of the Company is prepared separately. The figures of the condensed interim profit and loss account for the Half year ended June 30, 2016 and June 30, 2015 and notes forming part thereof have not been reviewed by the auditors of the Company, as they have reviewed the cumulative figures for the six month periods ended June 30, 2016 and June 30, 2015. In the condensed interim financial information, the investments in subsidiaries and associates are accounted for on the basis of direct equity interest at cost, rather than on the basis of reported results.
3. ACCOUNTING POLICIESThe accounting policies and methods of computation adopted for the preparation of this condensed interim financial information are similar to those applied in the preparation of the financial statements for the preceding year, ended December 31, 2015.
4. Status of significant shareholdings as at June 30, 2016 is given below: Shares Percentage
Fauji Fertilizer Company Limited 465,891,896 49.88 Fauji Foundation 170,842,386 18.29
Un - auditedJune 30,
2016
Audited December 31,
2015 Note (Rupees ‘000)
5. LONG-TERM LOANS Loans from banking companies-secured 5.1 10,000,000 10,000,000 Less: Current portion shown under current liabilities 3,541,700 625,000
6,458,300 9,375,000
5.1 This includes an amount of Rs. 1,500 million (December 31, 2015: Rs. 1,500 million) obtained under Master Istisna Agreement from Meezan Bank Limited.

17
Un - auditedJune 30,
2016
AuditedDecember 31,
2015Note (Rupees ‘000)
6. DEFERRED GOVERNMENT ASSISTANCEDeferred Government assistance from Government of Pakistan 648,200 1,298,539 Less: Current portion shown under current liabilities 648,200 1,296,401
- 2,138 Deferred Government assistance - (2,138)
- -
7. DEFERRED LIABILITIESCompensated leave absences 466,523 439,942 Deferred taxation - net 7.1 1,813,695 2,294,466
2,280,218 2,734,408 7.1 The balance of deferred tax is in respect of the following temporary
differences:
Credit arising in respect of: Accelerated depreciation
Debits arising on account of: Provision for inventory obsolescence Unabsorbed losses
2,181,154
(26,067)(341,392)
2,344,293
(49,827) -
1,813,695 2,294,4668. SHORT TERM BORROWINGS - SECURED
Running finance Demand finance
11,358,359 19,060,051
4,287,560 13,700,000
8.1 30,418,410 17,987,560 8.1 This includes an amount of Rs. 3,545.24 million (December 31, 2015: Rs. 3,050 million) obtained under
Islamic mode of financing. 9. CONTINGENCIES AND COMMITMENTS
Contingenciesi) Guarantees issued by banks on behalf of the Company 88,125 55,612
Commitments
i) Capital expenditures - contracted. 885,475 830,063 ii) Outstanding letters of credit for purchase of stores, spares and raw materials 1,069,483 859,046
10. PROPERTY, PLANT AND EQUIPMENTOpening written down value 12,126,103 12,202,673 Additions during the period / year 494,867 1,330,544 Disposals during the period / year (6,618) (49,456)Depreciation during the period / year (721,738) (1,398,223)Depreciation charged on disposals during the period / year 5,436 40,565 Closing written down value 11,898,050 12,126,103
NOTES TO THE CONDENSED INTERIM FINANCIAL INFORMATION

18
Un - auditedJune 30,
2016
AuditedDecember 31,
2015Note (Rupees ‘000)
11. LONG-TERM INVESTMENTSInvestment in joint venture - at cost 11.1 1,411,150 1,411,150 Investment in associates - at cost 11.2 7,991,556 8,471,413 Investment in subsidiaries - at cost 11.3 10,678,113 8,012,058 Other long-term investments 11.4 - -
20,080,819 17,894,621 11.1 Investment in joint venture - at cost
Pakistan Maroc Phosphore S.A, Morocco (PMP) 1,411,150 1,411,150 11.2 Investment in associates - at cost
QuotedFauji Cement Company Limited (FCCL) 300,000 300,000Askari Bank Limited (AKBL) 5,230,991 5,230,991 Fauji Foods Limited (formerly Noon Pakistan Limited) 11.3.1 - 479,857Un-quotedFoundation Wind Energy - I Limited (FWE-I)
Shares 1,225,873 740,374Share deposit money - 485,499
1,225,873 1,225,873Foundation Wind Energy - II (Pvt) Limited (FWE-II)
Shares 1,234,692 687,935 Share deposit money - 546,757
1,234,692 1,234,692 7,991,556 8,471,413
11.3 Investment in subsidiaries - at costQuotedFauji Foods Limited (formerly Noon Pakistan Limited) 11.3.1 2,663,924 -Un-quotedFauji Meat Limited (FML) 2,250,000 2,250,000FFBL Foods Limited (formerly Fauji Foods Limited)
Shares 285,197 285,197 Share deposit money 13,367 11,236
298,564 296,433FFBL Power Company Limited (FPCL)
Shares 5,465,625 5,167,500Share deposit money - 298,125
5,465,625 5,465,625 10,678,113 8,012,058
11.3.1 During the period, the Company acquired further shares and subscribed to a right issue by Fauji Foods Limited (formerly Noon Pakistan limited) and the Company now holds 49.12% (December 31, 2015: 38.25%) voting share and 56.94% (December 31, 2015: 38.25%) non-voting shares.
11.4 Investment - available for sale - unquotedArabian Sea Country Club Limited (ASCCL)
300,000 ordinary shares of Rs. 10 each 3,000 3,000 Less: Impairment in value of investment 3,000 3,000
- -
19
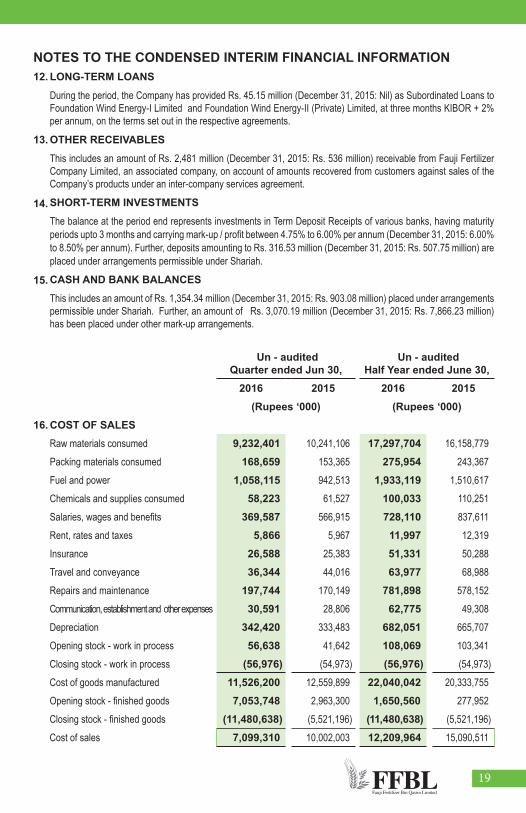
NOTES TO THE CONDENSED INTERIM FINANCIAL INFORMATION12. LONG-TERM LOANS
During the period, the Company has provided Rs. 45.15 million (December 31, 2015: Nil) as Subordinated Loans to Foundation Wind Energy-I Limited and Foundation Wind Energy-II (Private) Limited, at three months KIBOR + 2% per annum, on the terms set out in the respective agreements.
13.
14.
15.
OTHER RECEIVABLES
This includes an amount of Rs. 2,481 million (December 31, 2015: Rs. 536 million) receivable from Fauji Fertilizer Company Limited, an associated company, on account of amounts recovered from customers against sales of the Company’s products under an inter-company services agreement.
SHORT-TERM INVESTMENTS
The balance at the period end represents investments in Term Deposit Receipts of various banks, having maturity periods upto 3 months and carrying mark-up / profit between 4.75% to 6.00% per annum (December 31, 2015: 6.00% to 8.50% per annum). Further, deposits amounting to Rs. 316.53 million (December 31, 2015: Rs. 507.75 million) are placed under arrangements permissible under Shariah.
CASH AND BANK BALANCES
This includes an amount of Rs. 1,354.34 million (December 31, 2015: Rs. 903.08 million) placed under arrangements permissible under Shariah. Further, an amount of Rs. 3,070.19 million (December 31, 2015: Rs. 7,866.23 million) has been placed under other mark-up arrangements.
Un - audited Quarter ended Jun 30,
Un - audited Half Year ended June 30,
2016 2015 2016 2015(Rupees ‘000) (Rupees ‘000)
16. COST OF SALESRaw materials consumed 9,232,401 10,241,106 17,297,704 16,158,779 Packing materials consumed 168,659 153,365 275,954 243,367 Fuel and power 1,058,115 942,513 1,933,119 1,510,617 Chemicals and supplies consumed 58,223 61,527 100,033 110,251 Salaries, wages and benefits 369,587 566,915 728,110 837,611 Rent, rates and taxes 5,866 5,967 11,997 12,319 Insurance 26,588 25,383 51,331 50,288 Travel and conveyance 36,344 44,016 63,977 68,988 Repairs and maintenance 197,744 170,149 781,898 578,152 Communication, establishment and other expenses 30,591 28,806 62,775 49,308 Depreciation 342,420 333,483 682,051 665,707 Opening stock - work in process 56,638 41,642 108,069 103,341 Closing stock - work in process (56,976) (54,973) (56,976) (54,973)Cost of goods manufactured 11,526,200 12,559,899 22,040,042 20,333,755 Opening stock - finished goods 7,053,748 2,963,300 1,650,560 277,952 Closing stock - finished goods (11,480,638) (5,521,196) (11,480,638) (5,521,196)Cost of sales 7,099,310 10,002,003 12,209,964 15,090,511

20
Un - audited Un - audited Quarter ended June 30, Half year ended June 30,
2016 2015 2016 2015Note (Rupees ‘000) (Rupees ‘000)
17. OTHER INCOMEProfit on bank balances and term deposits 17.1
42,941 51,017 130,655 111,954
Gain / dividend from mutual funds and other investments 17.2 -
-108,071 100 314,646
Provision written back Dividend received - FCCL Dividend received - AKBL Subsidy income on DAP Subsidy income on Urea Mark-up on sub-ordinated loans Guarantee fee
- -
886,776241,489
507 14,007
- ------
77,502 32,813
339,8551,595,033
241,489507
14,007
- 18,750
271,884----
Scrap sale and other receipts 13,377 15,531 20,158 27,294 Exchange gain on currency translations / transactions 15,730 - 15,730 -Gain on sale of property, plant & equipment 947 1,392 947 1,391
1,215,774 176,011 2,468,796 745,919
17.1 This includes an amount of Rs. 25.97 million (2015: Rs. 13.29 million) earned under arrangements permissible under Shariah.17.2 This includes an amount of Rs. Nil (2015: Rs. 4.24 million) realized under arrangements permissible under Shariah.
18. TAXATION
Current tax 18.1
515,291 356,311 229,806 411,197 Deferred tax (404,876) (441,153) (480,771) (506,806)
110,415 (84,842) (250,965) (95,609)
18.1 This includes an amount of Rs. 183 million recognized as super tax @ 3% on the taxable income for the tax year 2016.
NOTES TO THE CONDENSED INTERIM FINANCIAL INFORMATION

21
NOTES TO THE CONDENSED INTERIM FINANCIAL INFORMATIONUn - audited
Half year ended June, 302016 2015
(Rupees ‘000)19. CASH USED IN OPERATIONS
(Loss) / profit before taxation from ordinary activities (1,145,752) 662,756 Adjustment for non-cash charges and other items:
Provision for gratuity 40,476 40,217 Exchange (gain) / loss (15,730) 56,531 Provision for compensated absences 38,048 27,503 Provision for Workers’ (Profit) Participation Fund - 35,580 Provision for Workers’ Welfare Fund - 13,255 Depreciation 721,738 694,426 Finance cost 952,139 783,773 Mark-up on sub-ordinated loans (507) -Profit on bank balances and term deposits (130,755) (111,954)Dividend from associates (372,668) (290,634)Gain on sale of investments - (314,646)Gain on disposal of property, plant and equipment (947) (1,392)
Operating profit before working capital changes 86,042 1,595,415Changes in working capital
Stores and spares (39,836) 28,108 Stock-in-trade (9,705,665) (7,100,573)Trade debts (937,709) (141,280)Advances 137,814 237,640Trade deposits and short-term prepayments (48,490) (80,078) Other receivables 748,293 (2,003,329)Sales tax refundable (1,517,642) (121,873)Trade and other payables (997,741) 2,525,840
(12,360,976) (6,655,545)Cash used in operations (12,274,934) (5,060,130)

22
NOTES TO THE CONDENSED INTERIM FINANCIAL INFORMATIONUn - audited
Half year ended June 30, 2016 2015
(Rupees ‘000)20. RELATED PARTY TRANSACTIONS
Significant transactions and balances with related parties are as follows:
Transactions with subsidiary companiesInvestment in Fauji Meat Limited (FML) - 828,652 Investment in FFBL Foods Limited 2,131 7,108 Investment in Fauji Foods Limited (FFL) 2,184,067 - Services provided to Fauji Foods Limited (FFL) 16,396 - Investment in FFBL Power Company Limited (FPCL) - 4,147,176
Transactions with associated undertakings Services and material acquired 463,430 332,659 Services and material provided 1,763 -Commission charged to the Company 6,433 6,729 Dividend paid 1,942,040 1,432,652 Rent charged to the Company 378 700 Profit on bank balances (AKBL) 20,774 13,775 Receipts under consignment account (FFCL) 10,465,622 17,710,356 Balance receivable -unsecured (FFCL) 2,481,081 536,643 *Interest from FWE-I and FWE-II 507 -Guarantee fee from FWE-I and FWE-II 14,007 -Balances at bank (AKBL) 422,550 2,781,914 *
Transactions with joint venture:Purchase of raw materials 12,484,479 14,168,794 Expenses incurred on behalf of joint venture 8,317 4,288 Balance payable - secured 5,421,959 5,762,811 *Balance receivable - unsecured 16,397 35,503 *
Other related parties:Contribution to Provident Fund 31,667 29,575 Contribution to Gratuity Fund 40,477 40,217 Remuneration including benefits and perquisites of Chief Executive Officer and executives 209,772 126,083 No of persons 2016 : 1 and 25. ( 2015 : 1 and 18 )(Receipt) / payment to Workers’ (Profit) Participation Fund (10,971) 20,557 Balance payable - unsecured (WWF and WPPF) 1,053,074 1,042,103 *Payabel to Gratuity Fund 329,194 284,566 *
* These balances represent the position as at December 31, 2015 (audited) and June 30, 2016 (un-audited).
23
NOTES TO THE CONDENSED INTERIM FINANCIAL INFORMATION
21. DATE OF AUTHORIZATION FOR ISSUE
21.1 This condensed interim financial information was authorized for issue on July 26, 2016 by the Board of Directors of the Company.
22. GENERAL
22.1 Figures have been rounded off to the nearest thousand rupees.
22.2 Corresponding figures have been re-arranged / restated, wherever necessary, for the purpose of comparison.
CHAIRMAN CHIEF EXECUTIVE DIRECTOR

24

25
Condensed Interim Consolidated Financial Information
26
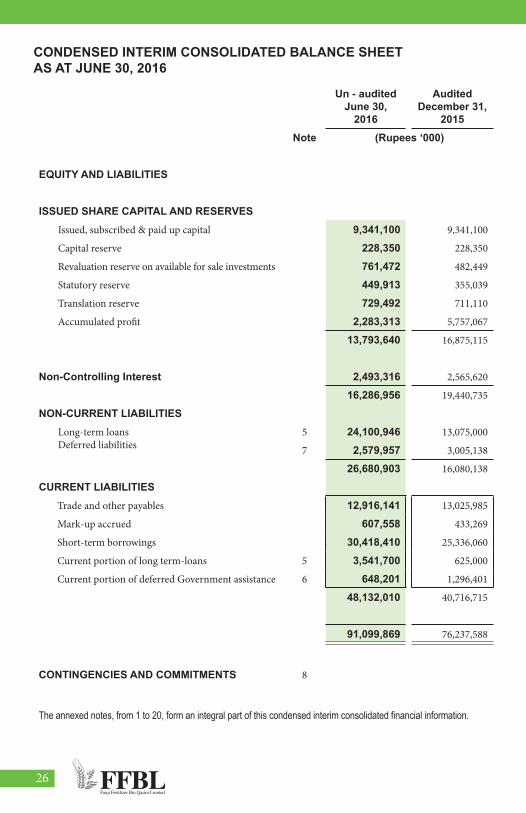
CONDENSED INTERIM CONSOLIDATED BALANCE SHEETAS AT JUNE 30, 2016
Un - audited June 30,
2016
AuditedDecember 31,
2015Note (Rupees ‘000)
EQUITY AND LIABILITIES
ISSUED SHARE CAPITAL AND RESERVESIssued, subscribed & paid up capital 9,341,100 9,341,100
Capital reserve 228,350 228,350
Revaluation reserve on available for sale investments 761,472 482,449
Statutory reserve 449,913 355,039
Translation reserve 729,492 711,110
Accumulated profit 2,283,313 5,757,067
13,793,640 16,875,115
Non-Controlling Interest 2,493,316 2,565,620
16,286,956 19,440,735
NON-CURRENT LIABILITIESLong-term loansDeferred liabilities
5 24,100,946 13,075,000
7 2,579,957 3,005,138
26,680,903 16,080,138
CURRENT LIABILITIESTrade and other payables 12,916,141 13,025,985
Mark-up accrued 607,558 433,269
Short-term borrowings 30,418,410 25,336,060
Current portion of long term-loans 5 3,541,700 625,000
Current portion of deferred Government assistance 6 648,201 1,296,401
48,132,010 40,716,715
91,099,869 76,237,588
CONTINGENCIES AND COMMITMENTS 8
The annexed notes, from 1 to 20, form an integral part of this condensed interim consolidated financial information.

27
CHAIRMAN CHIEF EXECUTIVE DIRECTOR
Un - audited June 30,
2016
AuditedDecember 31,
2015Note (Rupees ‘000)
ASSETS
NON-CURRENT ASSETSProperty, plant and equipment 9 37,613,379 29,519,433
Long-term investments 10 15,953,485 12,823,721
Long-term deposits 78,643 78,643
Long-term loans 11 45,150 -
53,690,657 42,421,797
CURRENT ASSETS Stores and spares 2,520,821 2,473,577
Stock-in-trade 14,273,975 4,549,432
Trade debts 2,009,479 1,024,702
Advances 716,159 802,555
Trade deposits and short-term prepayments 182,522 126,795
Interest accrued 42,965 51,781
Other receivables 12 4,122,811 4,871,604
Unamortized transaction cost - 330,394
Income tax refundable - net 2,136,989 1,110,582
Sales tax refundable 3,255,677 1,439,978
Short-term investments 13 1,316,531 4,607,748
Cash and bank balances 6,831,283 12,426,643
37,409,212 33,815,791
91,099,869 76,237,588
28
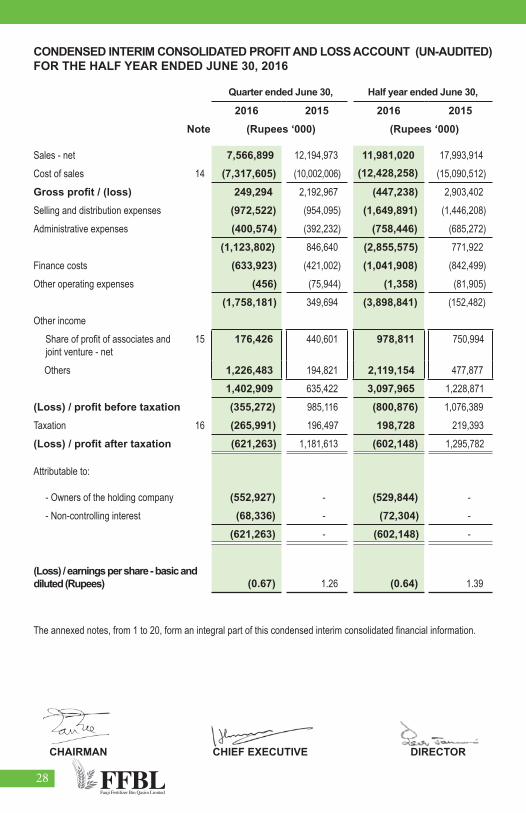
CONDENSED INTERIM CONSOLIDATED PROFIT AND LOSS ACCOUNT (UN-AUDITED)FOR THE HALF YEAR ENDED JUNE 30, 2016
Quarter ended June 30, Half year ended June 30,
2016 2015 2016 2015Note (Rupees ‘000) (Rupees ‘000)
Sales - net 7,566,899 12,194,973 11,981,020 17,993,914 Cost of sales 14 (7,317,605) (10,002,006) (12,428,258) (15,090,512)Gross profit / (loss) 249,294 2,192,967 (447,238) 2,903,402 Selling and distribution expenses (972,522) (954,095) (1,649,891) (1,446,208)Administrative expenses (400,574) (392,232) (758,446) (685,272)
(1,123,802) 846,640 (2,855,575) 771,922 Finance costs (633,923) (421,002) (1,041,908) (842,499)Other operating expenses (456) (75,944) (1,358) (81,905)
(1,758,181) 349,694 (3,898,841) (152,482)Other income
Share of profit of associates and joint venture - net
15 176,426 440,601 978,811 750,994
Others 1,226,483 194,821 2,119,154 477,877 1,402,909 635,422 3,097,965 1,228,871
(Loss) / profit before taxation (355,272) 985,116 (800,876) 1,076,389 Taxation 16 (265,991) 196,497 198,728 219,393 (Loss) / profit after taxation (621,263) 1,181,613 (602,148) 1,295,782
Attributable to:
- Owners of the holding company (552,927) - (529,844) - - Non-controlling interest (68,336) - (72,304) -
(621,263) - (602,148) -
(Loss) / earnings per share - basic and diluted (Rupees) (0.67) 1.26 (0.64) 1.39
The annexed notes, from 1 to 20, form an integral part of this condensed interim consolidated financial information.
CHAIRMAN CHIEF EXECUTIVE DIRECTOR

29
CONDENSED INTERIM CONSOLIDATED STATEMENT OF COMPREHENSIVE INCOME (UN-AUDITED)FOR THE HALF YEAR ENDED JUNE 30, 2016
Quarter ended June 30, Half year ended June 30,
2016 2015 2016 2015 (Rupees ‘000) (Rupees ‘000)
(Loss) / profit after taxation (621,263) 1,181,613 (602,148) 1,295,782
Other comprehensive incomeExchange difference on translating a joint venture (69,705) (242,291) 17,630 (349,251)
Effect of translation - share of Askari Bank Limited under equity method
10 630 753 (297)
Revaluation reserve on available for sale investments 23,031 - - - Total comprehensive (loss) / income (667,927) 939,952 (583,765) 946,234
The annexed notes 1 to 20 form an integral part of this condensed interim consolidated financial information.
CHAIRMAN CHIEF EXECUTIVE DIRECTOR

30
CHAIRMAN CHIEF EXECUTIVE DIRECTOR
2016 2015Note (Rupees ‘000)
CASH FLOWS FROM OPERATING ACTIVITIESCash used in operations 17 (11,699,611) (4,860,900)Income tax paid (1,279,609) (1,643,574)(Payment to) / contribution from Gratuity Fund (18,242) 3,268Finance cost paid (867,619) (647,070)Compensated absences paid 13,657 (15,307)Payment to Workers Welfare Fund - (180)Receipt from / (payment to) Workers’ (Profit) Participation Fund 10,971 (11,218)Net cash used in operating activities (13,840,453) (7,174,981)
CASH FLOWS FROM INVESTING ACTIVITIESFixed capital expenditure (8,885,197) (5,037,768)Long-term investments (2,184,067) - Long-term loans (45,150) -Divdend received 372,668 -Sale proceeds of property, plant and equipment 2,129 6,845Short term investments - 8,114,763Profit received on bank balances and term deposits 162,388 116,549Net cash (used in) / generated from investing activities (10,577,229) 3,200,389
CASH FLOWS FROM FINANCING ACTIVITIESShort-term borrowings - net 5,360,051 3,900,000Deferred Government assistance payment (648,201) (648,201)Long-term loans 13,942,646 1,100,000Dividend paid (2,845,690) (2,261,279)Net cash generated from financing activities 15,808,806 2,090,520 Net decrease in cash and cash equivalents (8,608,876) (1,884,072) Cash and cash equivalents at the beginning of the period 5,398,331 5,566,840Cash and cash equivalents at the end of the period (3,210,545) 3,682,768
CASH AND CASH EQUIVALENTSCash and cash equivalents included in the statement of cash flows comprises the following balance sheet amounts:
- Cash and bank balances 6,831,283 12,272,253 - Short-term highly liquid investments 1,316,531 400,000 - Short-term running finance (11,358,359) (8,989,485)
(3,210,545) 3,682,768
The annexed notes 1 to 20 form an integral part of this condensed interim consolidated financial information.
CONDENSED INTERIM CONSOLIDATED STATEMENT OF CASH FLOWS (UN-AUDITED)FOR THE HALF YEAR ENDED JUNE 30, 2016
31
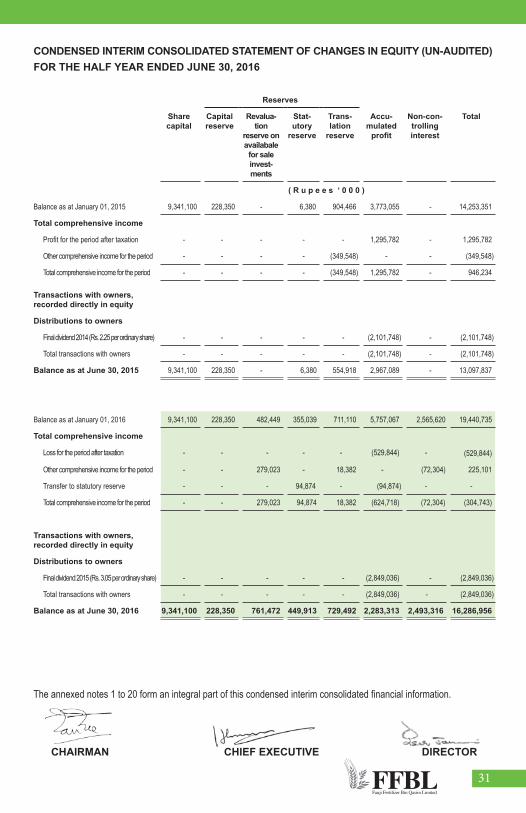
CONDENSED INTERIM CONSOLIDATED STATEMENT OF CHANGES IN EQUITY (UN-AUDITED)FOR THE HALF YEAR ENDED JUNE 30, 2016
Reserves
Share capital
Capital reserve
Revalua-tion
reserve onavailabale
for sale invest-ments
Stat-utory
reserve
Trans-lation
reserve
Accu-mulated
profit
Non-con-trolling interest
Total
( R u p e e s ‘ 0 0 0 )
Balance as at January 01, 2015 9,341,100 228,350 - 6,380 904,466 3,773,055 - 14,253,351
Total comprehensive income
Profit for the period after taxation - - - - - 1,295,782 - 1,295,782
Other comprehensive income for the period - - - - (349,548) - - (349,548)
Total comprehensive income for the period - - - - (349,548) 1,295,782 - 946,234
Transactions with owners, recorded directly in equity
Distributions to owners
Final dividend 2014 (Rs. 2.25 per ordinary share) - - - - - (2,101,748) - (2,101,748)
Total transactions with owners - - - - - (2,101,748) - (2,101,748)
Balance as at June 30, 2015 9,341,100 228,350 - 6,380 554,918 2,967,089 - 13,097,837
Balance as at January 01, 2016 9,341,100 228,350 482,449 355,039 711,110 5,757,067 2,565,620 19,440,735
Total comprehensive income
Loss for the period after taxation - - - - - (529,844) - (529,844)
Other comprehensive income for the period - - 279,023 - 18,382 - (72,304) 225,101
Transfer to statutory reserve - - - 94,874 - (94,874) - -
Total comprehensive income for the period - - 279,023 94,874 18,382 (624,718) (72,304) (304,743)
Transactions with owners, recorded directly in equity
Distributions to owners
Final dividend 2015 (Rs. 3.05 per ordinary share) - - - - - (2,849,036) - (2,849,036)
Total transactions with owners - - - - - (2,849,036) - (2,849,036)
Balance as at June 30, 2016 9,341,100 228,350 761,472 449,913 729,492 2,283,313 2,493,316 16,286,956
The annexed notes 1 to 20 form an integral part of this condensed interim consolidated financial information.
CHAIRMAN CHIEF EXECUTIVE DIRECTOR
32
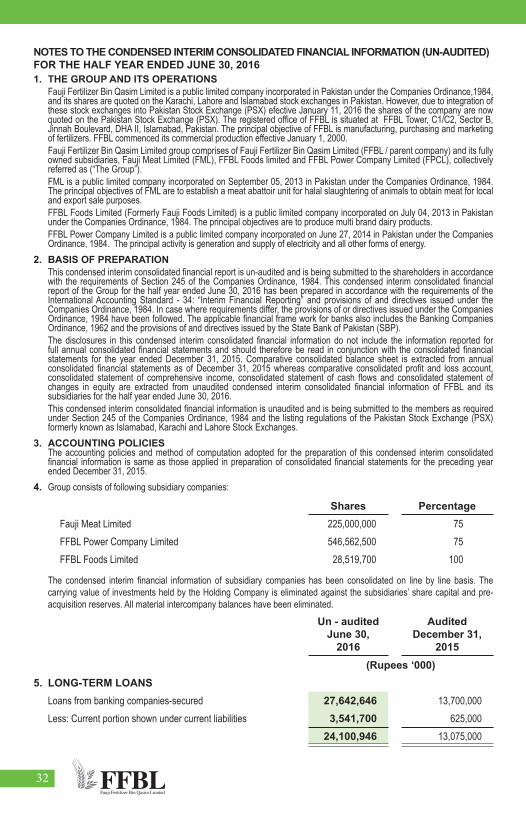
NOTES TO THE CONDENSED INTERIM CONSOLIDATED FINANCIAL INFORMATION (UN-AUDITED)FOR THE HALF YEAR ENDED JUNE 30, 20161. THE GROUP AND ITS OPERATIONS
Fauji Fertilizer Bin Qasim Limited is a public limited company incorporated in Pakistan under the Companies Ordinance,1984, and its shares are quoted on the Karachi, Lahore and Islamabad stock exchanges in Pakistan. However, due to integration of these stock exchanges into Pakistan Stock Exchange (PSX) efective January 11, 2016 the shares of the company are now quoted on the Pakistan Stock Exchange (PSX). The registered office of FFBL is situated at FFBL Tower, C1/C2, Sector B, Jinnah Boulevard, DHA II, Islamabad, Pakistan. The principal objective of FFBL is manufacturing, purchasing and marketing of fertilizers. FFBL commenced its commercial production effective January 1, 2000. Fauji Fertilizer Bin Qasim Limited group comprises of Fauji Fertilizer Bin Qasim Limited (FFBL / parent company) and its fully owned subsidiaries, Fauji Meat Limited (FML), FFBL Foods limited and FFBL Power Company Limited (FPCL), collectively referred as (“The Group”). FML is a public limited company incorporated on September 05, 2013 in Pakistan under the Companies Ordinance, 1984. The principal objectives of FML are to establish a meat abattoir unit for halal slaughtering of animals to obtain meat for local and export sale purposes. FFBL Foods Limited (Formerly Fauji Foods Limited) is a public limited company incorporated on July 04, 2013 in Pakistan under the Companies Ordinance, 1984. The principal objectives are to produce multi brand dairy products.FFBL Power Company Limited is a public limited company incorporated on June 27, 2014 in Pakistan under the Companies Ordinance, 1984. The principal activity is generation and supply of electricity and all other forms of energy.
2. BASIS OF PREPARATIONThis condensed interim consolidated financial report is un-audited and is being submitted to the shareholders in accordance with the requirements of Section 245 of the Companies Ordinance, 1984. This condensed interim consolidated financial report of the Group for the half year ended June 30, 2016 has been prepared in accordance with the requirements of the International Accounting Standard - 34: “Interim Financial Reporting” and provisions of and directives issued under the Companies Ordinance, 1984. In case where requirements differ, the provisions of or directives issued under the Companies Ordinance, 1984 have been followed. The applicable financial frame work for banks also includes the Banking Companies Ordinance, 1962 and the provisions of and directives issued by the State Bank of Pakistan (SBP).The disclosures in this condensed interim consolidated financial information do not include the information reported for full annual consolidated financial statements and should therefore be read in conjunction with the consolidated financial statements for the year ended December 31, 2015. Comparative consolidated balance sheet is extracted from annual consolidated financial statements as of December 31, 2015 whereas comparative consolidated profit and loss account, consolidated statement of comprehensive income, consolidated statement of cash flows and consolidated statement of changes in equity are extracted from unaudited condensed interim consolidated financial information of FFBL and its subsidiaries for the half year ended June 30, 2016.This condensed interim consolidated financial information is unaudited and is being submitted to the members as required under Section 245 of the Companies Ordinance, 1984 and the listing regulations of the Pakistan Stock Exchange (PSX) formerly known as Islamabad, Karachi and Lahore Stock Exchanges.
3. ACCOUNTING POLICIESThe accounting policies and method of computation adopted for the preparation of this condensed interim consolidated financial information is same as those applied in preparation of consolidated financial statements for the preceding year ended December 31, 2015.
4. Group consists of following subsidiary companies:
Shares PercentageFauji Meat Limited 225,000,000 75 FFBL Power Company Limited 546,562,500 75 FFBL Foods Limited 28,519,700 100
The condensed interim financial information of subsidiary companies has been consolidated on line by line basis. The carrying value of investments held by the Holding Company is eliminated against the subsidiaries’ share capital and pre-acquisition reserves. All material intercompany balances have been eliminated.
Un - auditedJune 30,
2016
AuditedDecember 31,
2015(Rupees ‘000)
5. LONG-TERM LOANSLoans from banking companies-secured 27,642,646 13,700,000Less: Current portion shown under current liabilities 3,541,700 625,000
24,100,946 13,075,000
33
Un - auditedJune 30,
2016
AuditedDecember 31,
2015Note (Rupees ‘000)
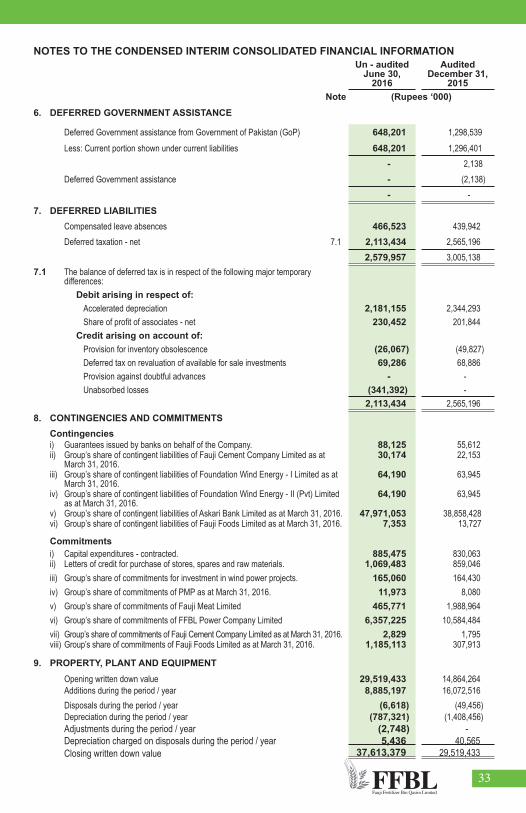
6. DEFERRED GOVERNMENT ASSISTANCE
Deferred Government assistance from Government of Pakistan (GoP) 648,201 1,298,539 Less: Current portion shown under current liabilities 648,201 1,296,401
- 2,138Deferred Government assistance - (2,138)
- - 7. DEFERRED LIABILITIES
Compensated leave absences 466,523 439,942 Deferred taxation - net 7.1 2,113,434 2,565,196
2,579,957 3,005,138 7.1 The balance of deferred tax is in respect of the following major temporary
differences:Debit arising in respect of:
Accelerated depreciation 2,181,155 2,344,293 Share of profit of associates - net 230,452 201,844
Credit arising on account of:Provision for inventory obsolescence (26,067) (49,827)Deferred tax on revaluation of available for sale investments 69,286 68,886Provision against doubtful advances - -Unabsorbed losses (341,392) -
2,113,434 2,565,196 8. CONTINGENCIES AND COMMITMENTS
Contingenciesi) Guarantees issued by banks on behalf of the Company. 88,125 55,612ii) Group’s share of contingent liabilities of Fauji Cement Company Limited as at
March 31, 2016. 30,174 22,153
iii) Group’s share of contingent liabilities of Foundation Wind Energy - I Limited as at March 31, 2016.
64,190 63,945
iv) Group’s share of contingent liabilities of Foundation Wind Energy - II (Pvt) Limited as at March 31, 2016.
64,190 63,945
v) Group’s share of contingent liabilities of Askari Bank Limited as at March 31, 2016. 47,971,053 38,858,428 vi) Group’s share of contingent liabilities of Fauji Foods Limited as at March 31, 2016. 7,353 13,727
Commitments i) Capital expenditures - contracted. 885,475 830,063 ii) Letters of credit for purchase of stores, spares and raw materials. 1,069,483 859,046iii) Group’s share of commitments for investment in wind power projects. 165,060 164,430iv) Group’s share of commitments of PMP as at March 31, 2016. 11,973 8,080v) Group’s share of commitments of Fauji Meat Limited 465,771 1,988,964 vi) Group’s share of commitments of FFBL Power Company Limited 6,357,225 10,584,484 vii) Group’s share of commitments of Fauji Cement Company Limited as at March 31, 2016. 2,829 1,795viii) Group’s share of commitments of Fauji Foods Limited as at March 31, 2016. 1,185,113 307,913
9. PROPERTY, PLANT AND EQUIPMENTOpening written down value 29,519,433 14,864,264 Additions during the period / year 8,885,197 16,072,516Disposals during the period / year (6,618) (49,456)Depreciation during the period / year (787,321) (1,408,456)Adjustments during the period / year (2,748) -Depreciation charged on disposals during the period / year 5,436 40,565 Closing written down value 37,613,379 29,519,433
NOTES TO THE CONDENSED INTERIM CONSOLIDATED FINANCIAL INFORMATION
34
Un - auditedJune 30,
2016Audited
December 31,2015
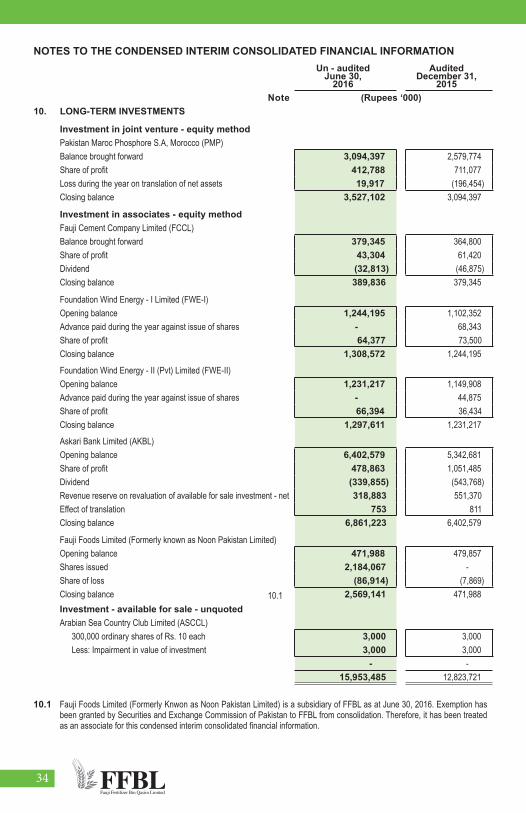
Note (Rupees ‘000)10. LONG-TERM INVESTMENTS
Investment in joint venture - equity methodPakistan Maroc Phosphore S.A, Morocco (PMP)Balance brought forward 3,094,397 2,579,774 Share of profit 412,788 711,077Loss during the year on translation of net assets 19,917 (196,454)Closing balance 3,527,102 3,094,397
Investment in associates - equity methodFauji Cement Company Limited (FCCL)Balance brought forward 379,345 364,800Share of profit 43,304 61,420 Dividend (32,813) (46,875)Closing balance 389,836 379,345
Foundation Wind Energy - I Limited (FWE-I)Opening balance 1,244,195 1,102,352 Advance paid during the year against issue of shares - 68,343 Share of profit 64,377 73,500Closing balance 1,308,572 1,244,195
Foundation Wind Energy - II (Pvt) Limited (FWE-II)Opening balance 1,231,217 1,149,908 Advance paid during the year against issue of shares - 44,875 Share of profit 66,394 36,434Closing balance 1,297,611 1,231,217
Askari Bank Limited (AKBL)Opening balance 6,402,579 5,342,681 Share of profit 478,863 1,051,485 Dividend (339,855) (543,768)Revenue reserve on revaluation of available for sale investment - net 318,883 551,370Effect of translation 753 811Closing balance 6,861,223 6,402,579
Fauji Foods Limited (Formerly known as Noon Pakistan Limited)Opening balance 471,988 479,857 Shares issued 2,184,067 -Share of loss (86,914) (7,869)Closing balance 10.1 2,569,141 471,988 Investment - available for sale - unquotedArabian Sea Country Club Limited (ASCCL)
300,000 ordinary shares of Rs. 10 each 3,000 3,000 Less: Impairment in value of investment 3,000 3,000
- - 15,953,485 12,823,721
10.1 Fauji Foods Limited (Formerly Knwon as Noon Pakistan Limited) is a subsidiary of FFBL as at June 30, 2016. Exemption has been granted by Securities and Exchange Commission of Pakistan to FFBL from consolidation. Therefore, it has been treated as an associate for this condensed interim consolidated financial information.
NOTES TO THE CONDENSED INTERIM CONSOLIDATED FINANCIAL INFORMATION

35
Un - audited Un - audited Quarter ended June 30, Half year ended June 30,
2016 2015 2016 2015(Rupees ‘000) (Rupees ‘000)
14. COST OF SALESRaw materials consumed 9,311,674 10,241,106 17,376,977 16,158,779 Packing materials consumed 169,784 153,366 277,079 243,367 Fuel and power 1,069,440 942,513 1,944,444 1,510,618 Chemicals and supplies consumed 58,223 61,527 100,033 110,251 Salaries, wages and benefits 417,258 566,915 775,781 837,611 Rent, rates and taxes 10,808 5,967 16,939 12,319 Insurance 31,353 25,383 56,096 50,288 Travel and conveyance 43,428 44,016 71,061 68,988 Repairs and maintenance 201,307 170,151 785,461 578,152 Communication, establishment & other expenses 34,521 28,806 66,705 49,308 Depreciation 403,218 333,483 742,848 665,707 Opening stock - work in process 56,638 41,642 108,069 103,341 Closing stock - work in process (56,976) (54,973) (56,976) (54,973)Cost of goods manufactured 11,750,676 12,559,902 22,264,517 20,333,756 Opening stock - finished goods 7,053,748 2,963,300 1,650,560 277,952 Closing stock - finished goods (11,486,819) (5,521,196) (11,486,819) (5,521,196)Cost of sales 7,317,605 10,002,006 12,428,258 15,090,512
NOTES TO THE CONDENSED INTERIM CONSOLIDATED FINANCIAL INFORMATIONLONG-TERM LOANSDuring the period, the Company has provided Rs. 45.15 million (December 31, 2015: Nil) as sub-ordinated loans to Foundation Wind Energy- I Limited and Foundation Wind Energy- II Pvt Ltd, at KIBOR + 2 % per annum, on the terms set out in the repective agreements in compliance with section 208 of the company Ordinance 1984. In addtion to the above guaranteed facilities have also been provided to Foundation Wind Energy- I Limited and Foundation Wind Energy- II (Pvt) Limited for securing running finance to meet there working capital requirements.
OTHER RECEIVABLESThis includes an amount of Rs. 2,481 million (December 31, 2015: Rs. 536 million) receivable from Fauji Fertilizer Company Limited, an associated company on account of amount recovered from customers, against sales of the Company’s products under an inter-company services agreement.
SHORT-TERM INVESTMENTSThe balance at the period end includes investments in Term Deposits Receipts of various banks, having maturity periods upto 3 months, and carrying mark-up between 4.75% to 6.00% per annum (December 31, 2015: 6.00% to 8.5% per annum).
11.
12.
13.

36
Un - audited Un - audited
Quarter ended June 30, Half year ended June 30,
2016 2015 2016 2015Note (Rupees ‘000) (Rupees ‘000)
15. OTHER INCOME
Share of profit / (loss) from associates
Share of profit - PMP 70,245 180,109 412,788 305,079 Share of (loss) / profit - FWE-I (49,245) (2,852) 64,377 (8,202)Share of (loss) / profit - FWE-II (55,879) (24,586) 66,394 (47,290)Share of profit - FCCL 20,882 13,016 43,303 27,171 Share of profit - AKBL 264,607 274,914 478,863 474,236 Share of loss - Fauji Foods Limited (74,184) - (86,914) -
176,426 440,601 978,811 750,994
Profit on bank balances & term deposits 53,359 68,120 152,965 132,851 Provision written back - - 77,502 - Gain on sale of investments - 109,778 100 316,341 Subsidy Income on DAP 886,776 - 1,595,033 - Subsidy Income on Urea 241,489 - 241,489 - Interest and guarantee fee from FWE-I & FWE-II 14,514 - 14,514 - Scrap sale and other receipts 13,384 15,531 20,381 27,293 Exchange gain 13,973 - 13,973 - Gain on sale of fixed property, plant & equipment 947 1,392 947 1,392 Misc Income 2,041 - 2,250 -
1,226,483 194,821 2,119,154 477,877 1,402,909 635,422 3,097,965 1,228,871
16. TAXATIONCurrent tax 16.1 538,687 216,882 253,202 242,708 Deferred tax (272,696) (413,379) (451,930) (462,101)
265,991 (196,497) (198,728) (219,393)
16.1 This includes an amount of Rs. 183 million recognized as super tax @ 3% on taxable income for the Tax year 2016.
NOTES TO THE CONDENSED INTERIM CONSOLIDATED FINANCIAL INFORMATION
37
Un - audited
Half year ended June 30,2016 2015
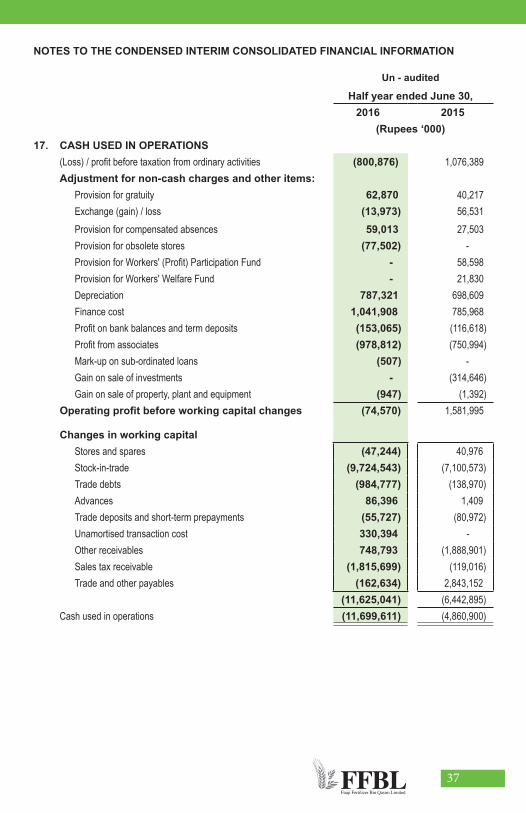
(Rupees ‘000)17. CASH USED IN OPERATIONS
(Loss) / profit before taxation from ordinary activities (800,876) 1,076,389 Adjustment for non-cash charges and other items:
Provision for gratuity 62,870 40,217 Exchange (gain) / loss (13,973) 56,531 Provision for compensated absences 59,013 27,503 Provision for obsolete stores (77,502) - Provision for Workers' (Profit) Participation Fund - 58,598 Provision for Workers' Welfare Fund - 21,830 Depreciation 787,321 698,609 Finance cost 1,041,908 785,968 Profit on bank balances and term deposits (153,065) (116,618)Profit from associates (978,812) (750,994)Mark-up on sub-ordinated loans (507) - Gain on sale of investments - (314,646)Gain on sale of property, plant and equipment (947) (1,392)
Operating profit before working capital changes (74,570) 1,581,995
Changes in working capital Stores and spares (47,244) 40,976 Stock-in-trade (9,724,543) (7,100,573)Trade debts (984,777) (138,970)Advances 86,396 1,409 Trade deposits and short-term prepayments (55,727) (80,972)Unamortised transaction cost 330,394 - Other receivables 748,793 (1,888,901)Sales tax receivable (1,815,699) (119,016)Trade and other payables (162,634) 2,843,152
(11,625,041) (6,442,895)Cash used in operations (11,699,611) (4,860,900)
NOTES TO THE CONDENSED INTERIM CONSOLIDATED FINANCIAL INFORMATION

38
Un - audited Half year ended June 30,
2016 2015 (Rupees ‘000)
18. RELATED PARTY TRANSACTIONSTransactions with associated undertakings due to common directorship
Services and material acquired 463,430 332,659 Services and material provided 1,763 559 Commission charged to the Company 6,433 6,729 Dividend paid 1,942,040 1,432,652 Rent charged to the Company 378 700 Profit on bank balances (AKBL) 20,774 13,791 Receipts under consingnment account (FFCL) 10,465,622 17,710,356 Balance receivable - unsecured (FFCL) 2,481,081 536,643 *Interest and guarantee free from FWE-I & FWE-II 14,515 -Balances at bank (AKBL) 422,550 2,781,914 *
Transactions with joint venturePurchase of raw materials 12,484,479 14,168,794 Expenses incurred on behalf of joint venture 8,317 4,288 Balance payable - secured 5,421,959 5,762,811 *Balance receivable - unsecured 15,632 35,503 *
Other related partiesContribution to Provident Fund 31,667 29,575 Contribution to Gratuity Fund 40,477 40,217 Remuneration including benefits and perquisites of Chief Executive Officer and executives
209,772 126,083
No of persons 2016 : 1 and 25. ( 2015 : 1 and 18 )Payment to Workers’ (Profit) Participation Fund (10,971) 20,557 Balance payable - (WWF+WPPF) unsecured 1,053,074 1,134,392 *Payable to Gratuity Fund 329,194 284,566 *
* These balances represent the position as at December 31, 2015 (audited) and June 30, 2016 (un-audited)
19. DATE OF AUTHORIZATION FOR ISSUE19.1 This condensed interim consolidated financial information was authorized for issue on July 26, 2016 by the Board
of Directors of the Company.20. GENERAL20.1 Figures have been rounded off to the nearest thousand rupees.20.2 Corresponding figures have been re-arranged / restated, wherever necessary, for the purpose of comparison.
CHAIRMAN CHIEF EXECUTIVE DIRECTOR
NOTES TO THE CONDENSED INTERIM CONSOLIDATED FINANCIAL INFORMATION

39

40