Embed Size (px)
Citation preview
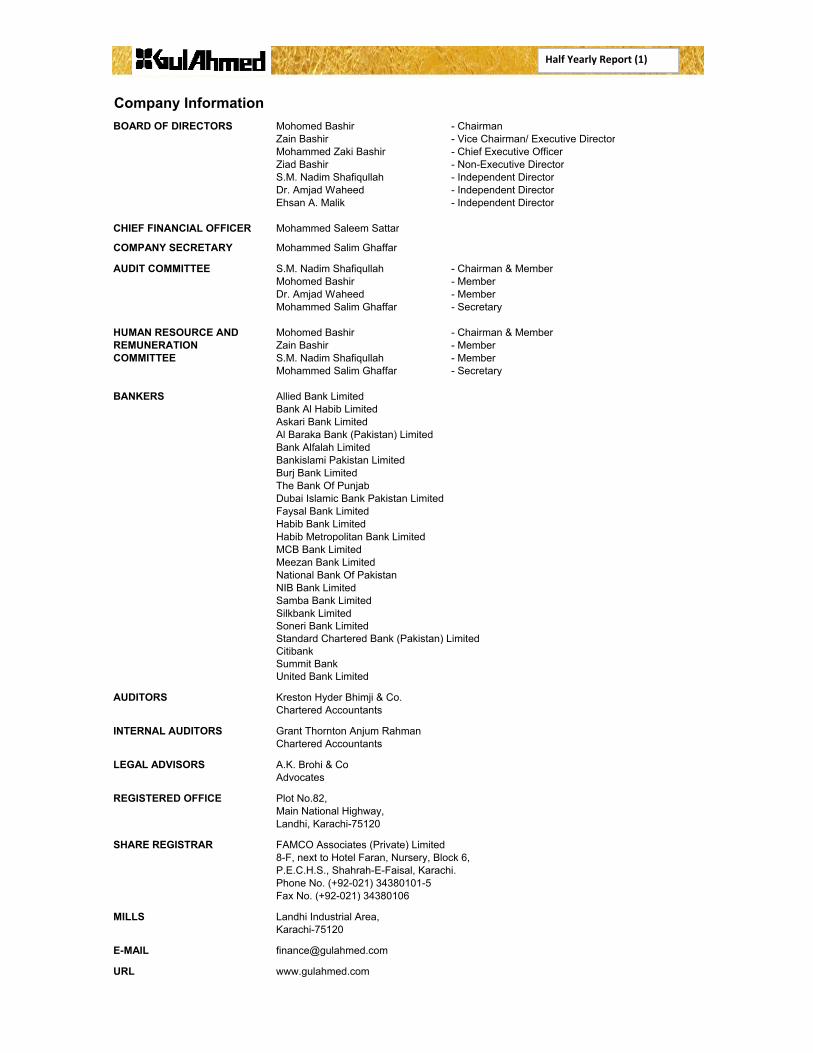
Company InformationBOARD OF DIRECTORS Mohomed Bashir - Chairman
Zain Bashir - Vice Chairman/ Executive DirectorMohammed Zaki Bashir - Chief Executive OfficerZiad Bashir - Non-Executive DirectorS.M. Nadim Shafiqullah - Independent DirectorDr. Amjad Waheed - Independent DirectorEhsan A. Malik - Independent Director
CHIEF FINANCIAL OFFICER Mohammed Saleem Sattar
COMPANY SECRETARY Mohammed Salim Ghaffar
AUDIT COMMITTEE S.M. Nadim Shafiqullah - Chairman & MemberMohomed Bashir - MemberDr. Amjad Waheed - MemberMohammed Salim Ghaffar - Secretary
HUMAN RESOURCE AND Mohomed Bashir - Chairman & MemberREMUNERATION Zain Bashir - MemberCOMMITTEE S.M. Nadim Shafiqullah - Member
Mohammed Salim Ghaffar - Secretary
BANKERS Allied Bank LimitedBank Al Habib LimitedAskari Bank LimitedAl Baraka Bank (Pakistan) LimitedBank Alfalah LimitedBankislami Pakistan LimitedBurj Bank LimitedThe Bank Of PunjabDubai Islamic Bank Pakistan Limited
Half Yearly Report (1)
The Bank Of PunjabDubai Islamic Bank Pakistan LimitedFaysal Bank LimitedHabib Bank LimitedHabib Metropolitan Bank LimitedMCB Bank LimitedMeezan Bank LimitedNational Bank Of PakistanNIB Bank LimitedSamba Bank LimitedSilkbank LimitedSoneri Bank LimitedStandard Chartered Bank (Pakistan) LimitedCitibankSummit BankUnited Bank Limited
AUDITORS Kreston Hyder Bhimji & Co.Chartered Accountants
INTERNAL AUDITORS Grant Thornton Anjum RahmanChartered Accountants
LEGAL ADVISORS A.K. Brohi & CoAdvocates
REGISTERED OFFICE Plot No.82,Main National Highway,Landhi, Karachi-75120
SHARE REGISTRAR FAMCO Associates (Private) Limited8-F, next to Hotel Faran, Nursery, Block 6,P.E.C.H.S., Shahrah-E-Faisal, Karachi.Phone No. (+92-021) 34380101-5Fax No. (+92-021) 34380106
MILLS Landhi Industrial Area,Karachi-75120
E-MAIL [email protected]
URL www.gulahmed.com

DIRECTORS’REVIEW REPORT TO THE SHAREHOLDERSThe Directors of our Company are pleased to present the review of the affairs of the Company for the half yearly endedDecember 2016.
ECONOMIC AND INDUSTRIAL OVERVIEW
Overall our economic position remained stable with significant increase in revenue. However, we have also facedan increase in raw materials costs, disallowing of sales tax input on packagingmaterial,increase in gas tariff and minimum wage during the period under review, due to whichPakistan’s textile exports suffered a decline of 5.96% over the corresponding period. Lower cotton production led to hike in cotton prices. Disallowing of sales tax input on packagingmaterial which is one of the major cost for value added textile goodsis indeed surprising for zero rated textile goods. These increases along with the continuing unfavorable PKR/USD parity has resulted in widening the competitiveness with other textile exporters in the region.
The textile package has been announced by the Government of Pakistan (GOP) for the export sector. The package envisages abolition of import duty on raw cotton, man-made fiber and textile machinery. Under the package, a new duty drawback mechanism has been laid down under which drawback will be granted on the entire export value for the second half of the ongoing fiscal year. The package is expected to partially offset the adverse impact of further increases in the cost of doing business in Pakistan. However, without the correction of the PKR/USD parity and other critical input costs, the benefit of the textile package will not be optimized.
An additional positive impact is that of China Pakistan Economic Corridor (CPEC). The CPEC, once implemented, has the potential of transforming Pakistan's economy from a low growth mode (3-4%) to a higher and sustainable growth economy with low inflation, removing of key infrastructural bottlenecks, promoting balanced regional growth and development. Despite the positive outlook of CPEC, we need to be aware of the potential negative long term impact itmay have on Pakistan’s economy. The likelihood of Chinese goods flooding our markets, this in turn will result in excessive price competition amongst Chinese and locally produced goods. Weneed to be vigilant and prepared for theexpectedfuture market competition.Under CPEC the country faces a higher risk of increase in the trade deficit with China and there is a need for new initiatives and investments in the manufacturing sector to increase domestic production.
FINANCIAL OVERVIEW
Our management has been able to increase sales by affectively adopting the principle of lean management in every sphere of business of the Company, in orderto controlproduction, operational and financial costs, along with increasing its market share despite the highly challenging business environment.
The Company registered half yearly net sales of Rs 18,525 million against Rs 13,757 million in the corresponding year showing an increase of 35%.Gross profit of the Company is Rs 3,305 million in the current period as compared to Rs 3,198 million in the corresponding period which depicts slightly better operational performance. However, due to increase in the input costs discussed earlier profit before tax declined.Finance cost has also reduced due to efficient utilization of financial facilities.
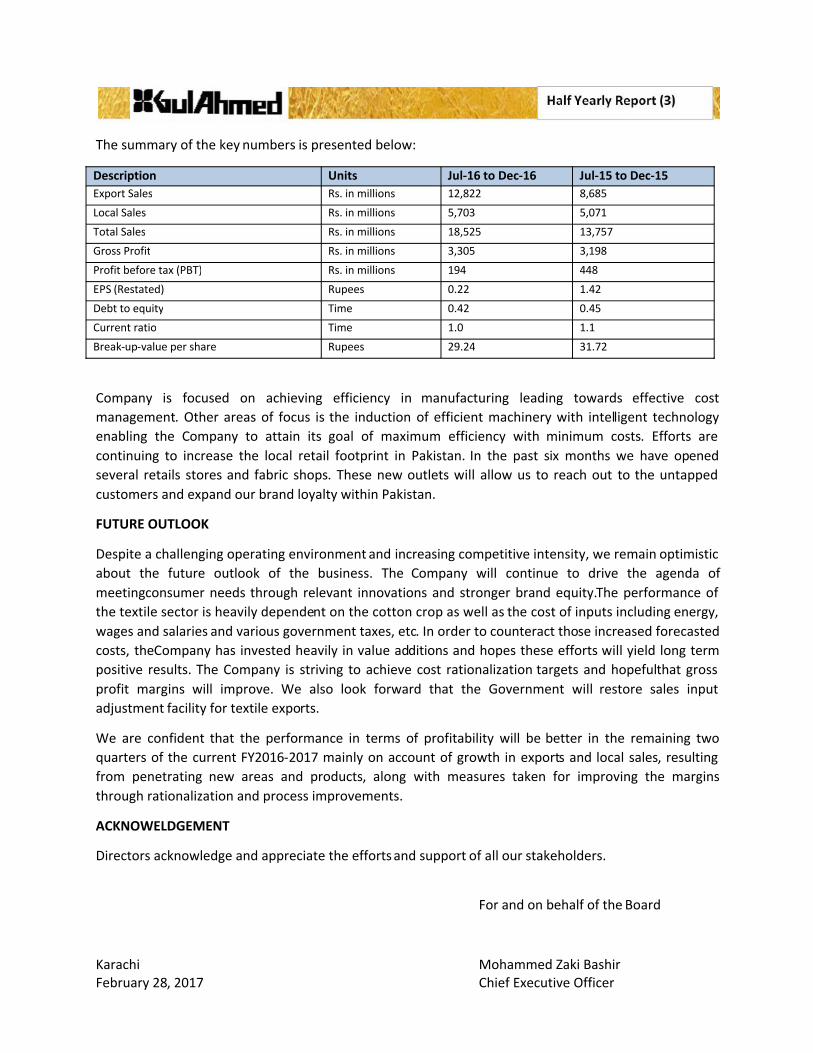
The summary of the key numbers is presented below:
Company is focused on achieving efficiency in manufacturing leading towards effective cost management. Other areas of focus is the induction of efficient machinery with intelligent technology enabling the Company to attain its goal of maximum efficiency with minimum costs. Efforts arecontinuing to increase the local retail footprint in Pakistan. In the past six months we have opened several retails stores and fabric shops. These new outlets will allow us to reach out to the untapped customers and expand our brand loyalty within Pakistan.
FUTURE OUTLOOK
Despite a challenging operating environment and increasing competitive intensity, we remain optimistic about the future outlook of the business. The Company will continue to drive the agenda ofmeetingconsumer needs through relevant innovations and stronger brand equity.The performance of the textile sector is heavily dependent on the cotton crop as well as the cost of inputs including energy, wages and salaries and various government taxes, etc. In order to counteract those increased forecasted costs, theCompany has invested heavily in value additions and hopes these efforts will yield long term positive results. The Company is striving to achieve cost rationalization targets and hopefulthat gross profit margins will improve. We also look forward that the Government will restore sales input adjustment facility for textile exports.
We are confident that the performance in terms of profitability will be better in the remaining two quarters of the current FY2016-2017 mainly on account of growth in exports and local sales, resulting from penetrating new areas and products, along with measures taken for improving the margins through rationalization and process improvements.
ACKNOWELDGEMENT
Directors acknowledge and appreciate the efforts and support of all our stakeholders.
For and on behalf of the Board
Karachi Mohammed Zaki BashirFebruary 28, 2017 Chief Executive Officer
Description Units Jul-16 to Dec-16 Jul-15 to Dec-15Export Sales Rs. in millions 12,822 8,685Local Sales Rs. in millions 5,703 5,071Total Sales Rs. in millions 18,525 13,757Gross Profit Rs. in millions 3,305 3,198Profit before tax (PBT) Rs. in millions 194 448EPS (Restated) Rupees 0.22 1.42Debt to equity Time 0.42 0.45Current ratio Time 1.0 1.1Break-up-value per share Rupees 29.24 31.72
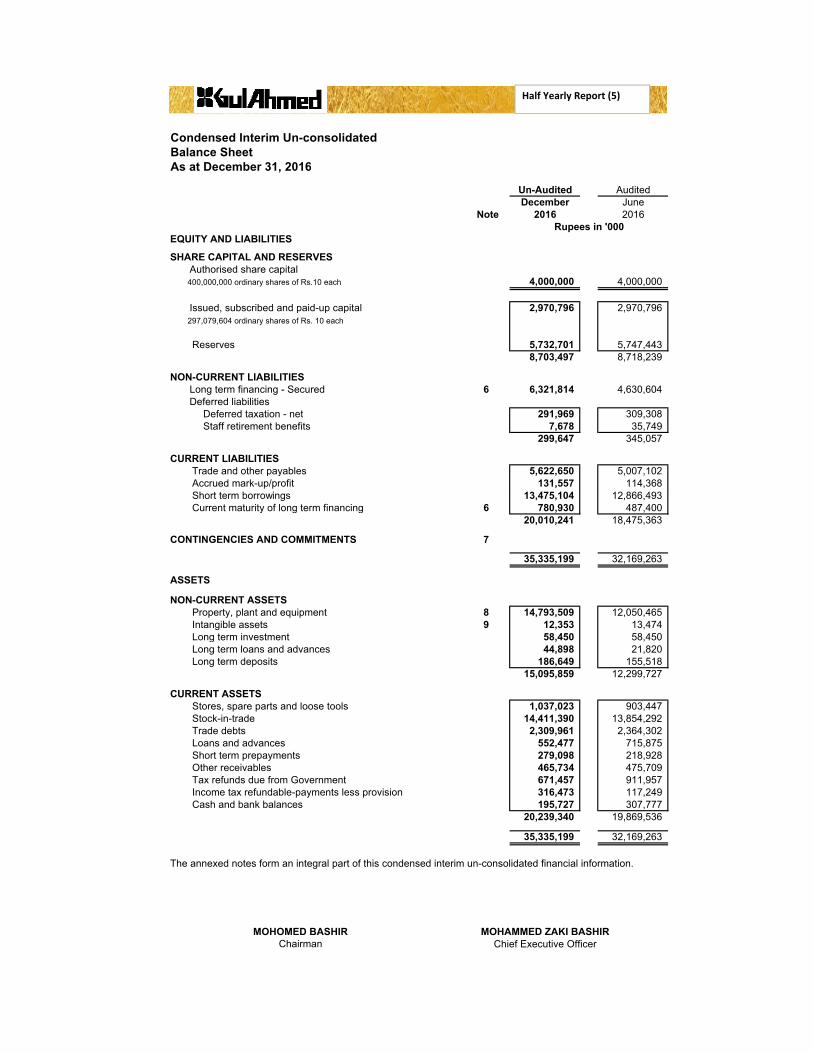
Condensed Interim Un-consolidated Balance SheetAs at December 31, 2016
Un-Audited AuditedDecember June
Note 2016 2016
EQUITY AND LIABILITIES
SHARE CAPITAL AND RESERVES Authorised share capital 400,000,000 ordinary shares of Rs.10 each 4,000,000 4,000,000
Issued, subscribed and paid-up capital 2,970,796 2,970,796 297,079,604 ordinary shares of Rs. 10 each
Reserves 5,732,701 5,747,443 8,703,497 8,718,239
NON-CURRENT LIABILITIES Long term financing - Secured 6 6,321,814 4,630,604 Deferred liabilities
Deferred taxation - net 291,969 309,308 Staff retirement benefits 7,678 35,749
299,647 345,057
CURRENT LIABILITIES Trade and other payables 5,622,650 5,007,102 Accrued mark-up/profit 131,557 114,368 Short term borrowings 13,475,104 12,866,493
Rupees in '000
Half Yearly Report (5)
Short term borrowings 13,475,104 12,866,493 Current maturity of long term financing 6 780,930 487,400
20,010,241 18,475,363
CONTINGENCIES AND COMMITMENTS 7
35,335,199 32,169,263
ASSETS
NON-CURRENT ASSETSProperty, plant and equipment 8 14,793,509 12,050,465 Intangible assets 9 12,353 13,474 Long term investment 58,450 58,450 Long term loans and advances 44,898 21,820 Long term deposits 186,649 155,518
15,095,859 12,299,727
CURRENT ASSETSStores, spare parts and loose tools 1,037,023 903,447 Stock-in-trade 14,411,390 13,854,292 Trade debts 2,309,961 2,364,302 Loans and advances 552,477 715,875 Short term prepayments 279,098 218,928 Other receivables 465,734 475,709 Tax refunds due from Government 671,457 911,957 Income tax refundable-payments less provision 316,473 117,249 Cash and bank balances 195,727 307,777
20,239,340 19,869,536
35,335,199 32,169,263
MOHOMED BASHIR MOHAMMED ZAKI BASHIRChairman Chief Executive Officer
The annexed notes form an integral part of this condensed interim un-consolidated financial information.
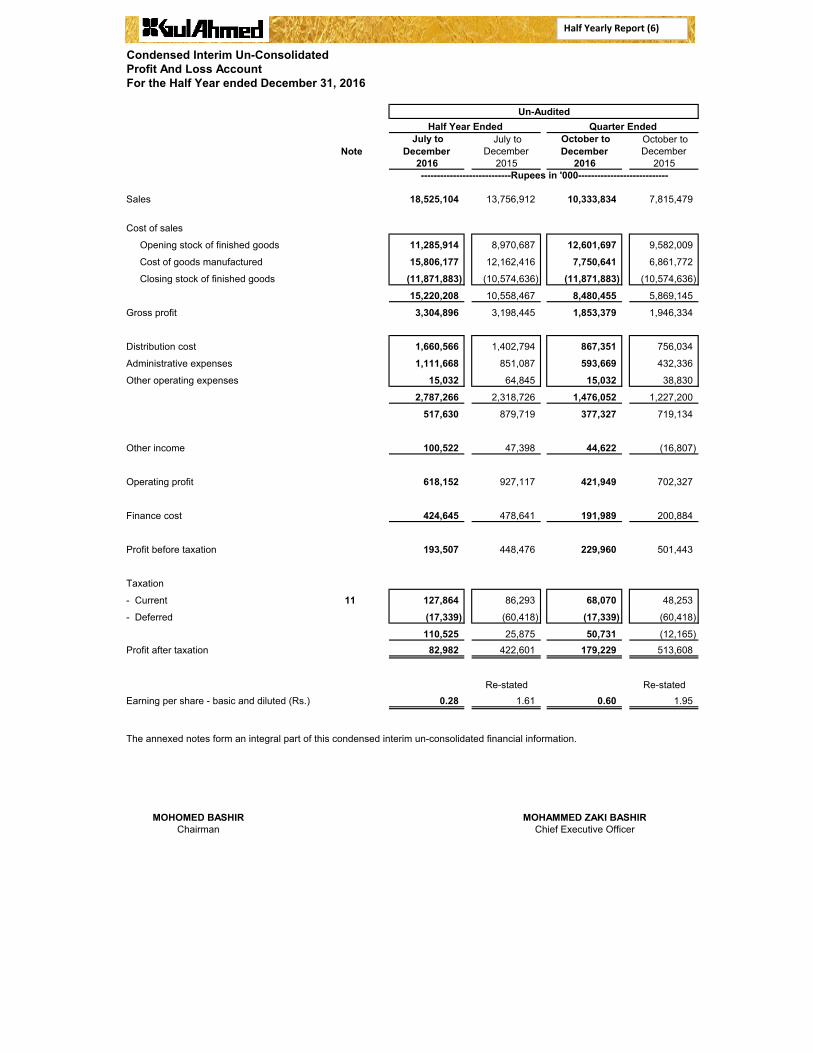
Condensed Interim Un-ConsolidatedProfit And Loss AccountFor the Half Year ended December 31, 2016
Note July to
December July to
December October to December
October to December
2016 2015 2016 2015
Sales 18,525,104 13,756,912 10,333,834 7,815,479
Cost of sales
Opening stock of finished goods 11,285,914 8,970,687 12,601,697 9,582,009
Cost of goods manufactured 15,806,177 12,162,416 7,750,641 6,861,772
Closing stock of finished goods (11,871,883) (10,574,636) (11,871,883) (10,574,636)
15,220,208 10,558,467 8,480,455 5,869,145
Gross profit 3,304,896 3,198,445 1,853,379 1,946,334
Distribution cost 1,660,566 1,402,794 867,351 756,034
Administrative expenses 1,111,668 851,087 593,669 432,336
Other operating expenses 15,032 64,845 15,032 38,830
2,787,266 2,318,726 1,476,052 1,227,200
517,630 879,719 377,327 719,134
Other income 100,522 47,398 44,622 (16,807)
Operating profit 618,152 927,117 421,949 702,327
----------------------------Rupees in '000----------------------------
Un-AuditedHalf Year Ended Quarter Ended
Half Yearly Report (6)
Finance cost 424,645 478,641 191,989 200,884
Profit before taxation 193,507 448,476 229,960 501,443
Taxation
- Current 11 127,864 86,293 68,070 48,253
- Deferred (17,339) (60,418) (17,339) (60,418)
110,525 25,875 50,731 (12,165) Profit after taxation 82,982 422,601 179,229 513,608
Re-stated Re-statedEarning per share - basic and diluted (Rs.) 0.28 1.61 0.60 1.95
MOHOMED BASHIR MOHAMMED ZAKI BASHIRChairman Chief Executive Officer
The annexed notes form an integral part of this condensed interim un-consolidated financial information.
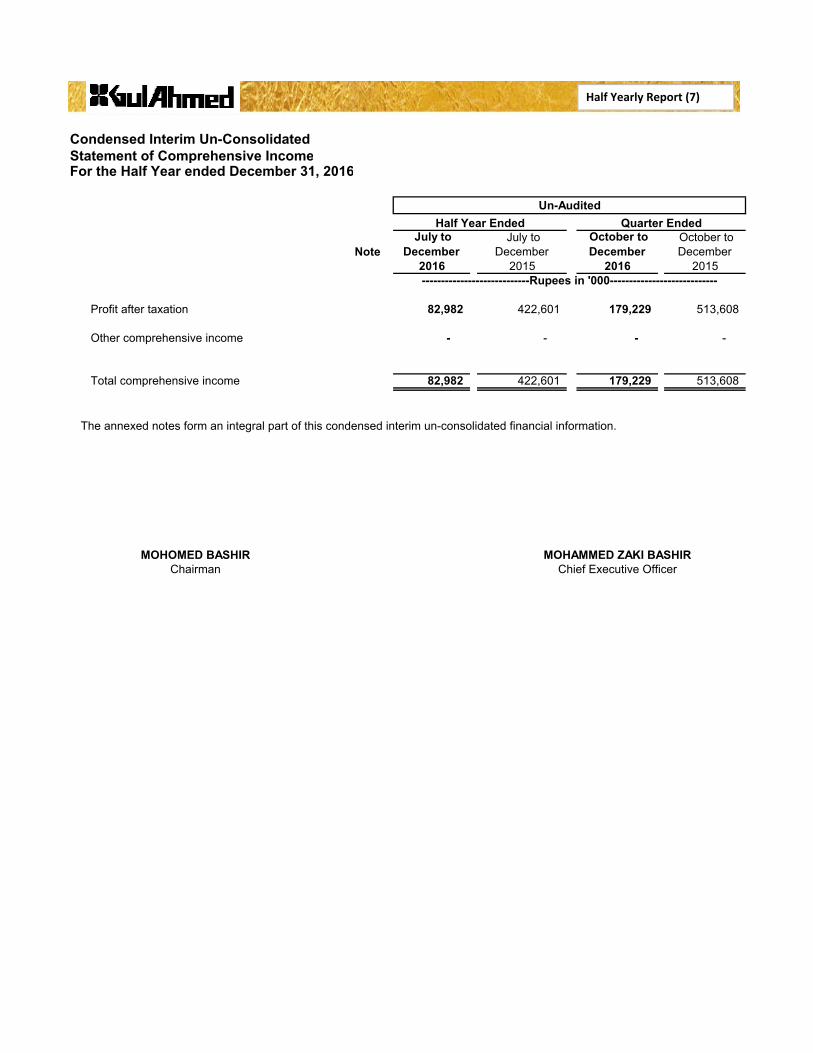
Condensed Interim Un-ConsolidatedStatement of Comprehensive IncomeFor the Half Year ended December 31, 2016
Note July to
December July to
December October to December
October to December
2016 2015 2016 2015
Profit after taxation 82,982 422,601 179,229 513,608
Other comprehensive income - - - -
Total comprehensive income 82,982 422,601 179,229 513,608
The annexed notes form an integral part of this condensed interim un-consolidated financial information.
Un-AuditedHalf Year Ended Quarter Ended
----------------------------Rupees in '000----------------------------
Half Yearly Report (7)
MOHOMED BASHIR MOHAMMED ZAKI BASHIRChairman Chief Executive Officer
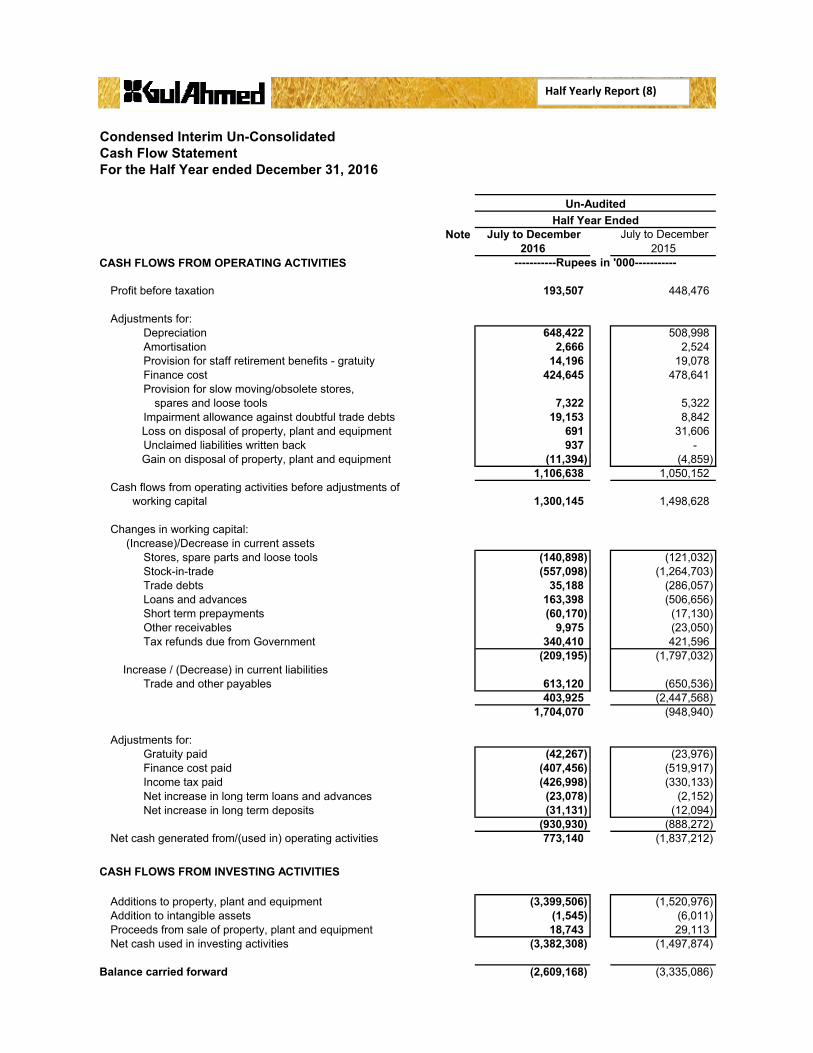
Condensed Interim Un-ConsolidatedCash Flow StatementFor the Half Year ended December 31, 2016
Note July to December July to December 2016 2015
CASH FLOWS FROM OPERATING ACTIVITIES
Profit before taxation 193,507 448,476
Adjustments for:Depreciation 648,422 508,998 Amortisation 2,666 2,524 Provision for staff retirement benefits - gratuity 14,196 19,078 Finance cost 424,645 478,641 Provision for slow moving/obsolete stores,
spares and loose tools 7,322 5,322 Impairment allowance against doubtful trade debts 19,153 8,842
Loss on disposal of property, plant and equipment 691 31,606 Unclaimed liabilities written back 937 -
Gain on disposal of property, plant and equipment (11,394) (4,859) 1,106,638 1,050,152
Cash flows from operating activities before adjustments of
Un-AuditedHalf Year Ended
-----------Rupees in '000-----------
Half Yearly Report (8)
Cash flows from operating activities before adjustments of working capital 1,300,145 1,498,628
Changes in working capital: (Increase)/Decrease in current assets
Stores, spare parts and loose tools (140,898) (121,032) Stock-in-trade (557,098) (1,264,703) Trade debts 35,188 (286,057) Loans and advances 163,398 (506,656) Short term prepayments (60,170) (17,130) Other receivables 9,975 (23,050) Tax refunds due from Government 340,410 421,596
(209,195) (1,797,032) Increase / (Decrease) in current liabilities
Trade and other payables 613,120 (650,536) 403,925 (2,447,568)
1,704,070 (948,940)
Adjustments for:Gratuity paid (42,267) (23,976) Finance cost paid (407,456) (519,917) Income tax paid (426,998) (330,133) Net increase in long term loans and advances (23,078) (2,152) Net increase in long term deposits (31,131) (12,094)
(930,930) (888,272) Net cash generated from/(used in) operating activities 773,140 (1,837,212)
CASH FLOWS FROM INVESTING ACTIVITIES
Additions to property, plant and equipment (3,399,506) (1,520,976) Addition to intangible assets (1,545) (6,011) Proceeds from sale of property, plant and equipment 18,743 29,113 Net cash used in investing activities (3,382,308) (1,497,874)
Balance carried forward (2,609,168) (3,335,086)
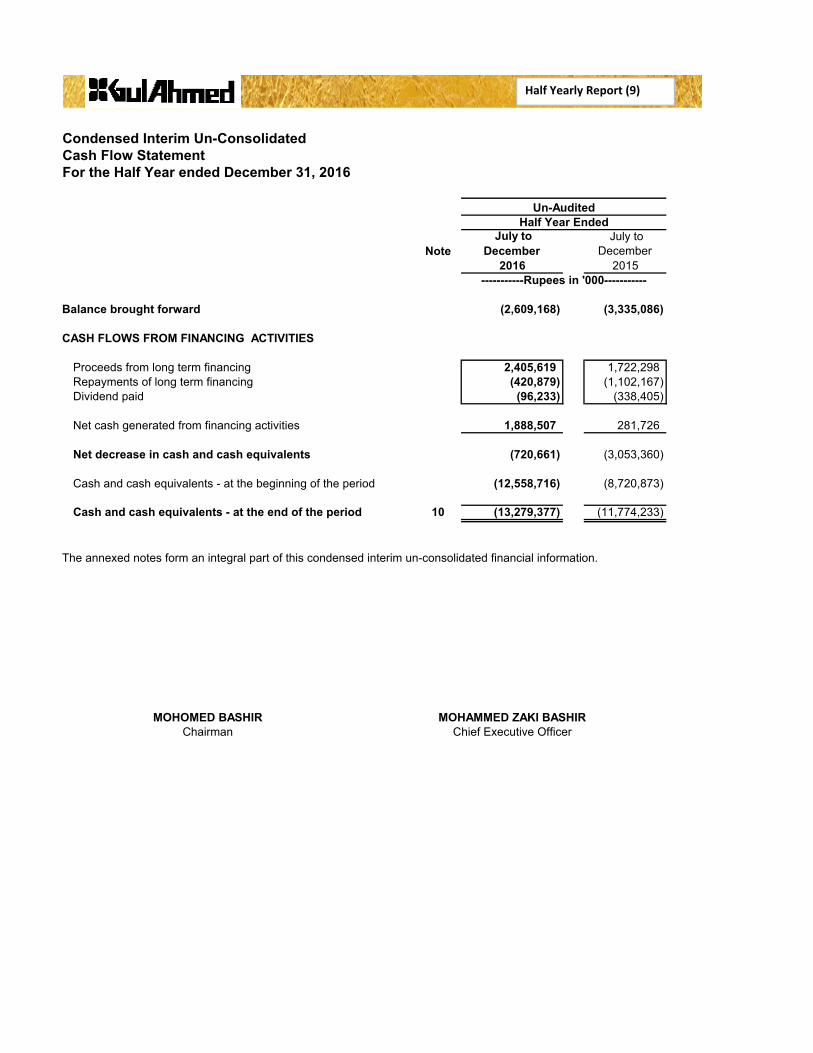
Condensed Interim Un-ConsolidatedCash Flow StatementFor the Half Year ended December 31, 2016
Note July to
December July to
December 2016 2015
Balance brought forward (2,609,168) (3,335,086)
CASH FLOWS FROM FINANCING ACTIVITIES
Proceeds from long term financing 2,405,619 1,722,298 Repayments of long term financing (420,879) (1,102,167) Dividend paid (96,233) (338,405)
Net cash generated from financing activities 1,888,507 281,726
Net decrease in cash and cash equivalents (720,661) (3,053,360)
Cash and cash equivalents - at the beginning of the period (12,558,716) (8,720,873)
Un-AuditedHalf Year Ended
-----------Rupees in '000-----------
Half Yearly Report (9)
Cash and cash equivalents - at the end of the period 10 (13,279,377) (11,774,233)
MOHOMED BASHIR MOHAMMED ZAKI BASHIRChairman Chief Executive Officer
The annexed notes form an integral part of this condensed interim un-consolidated financial information.
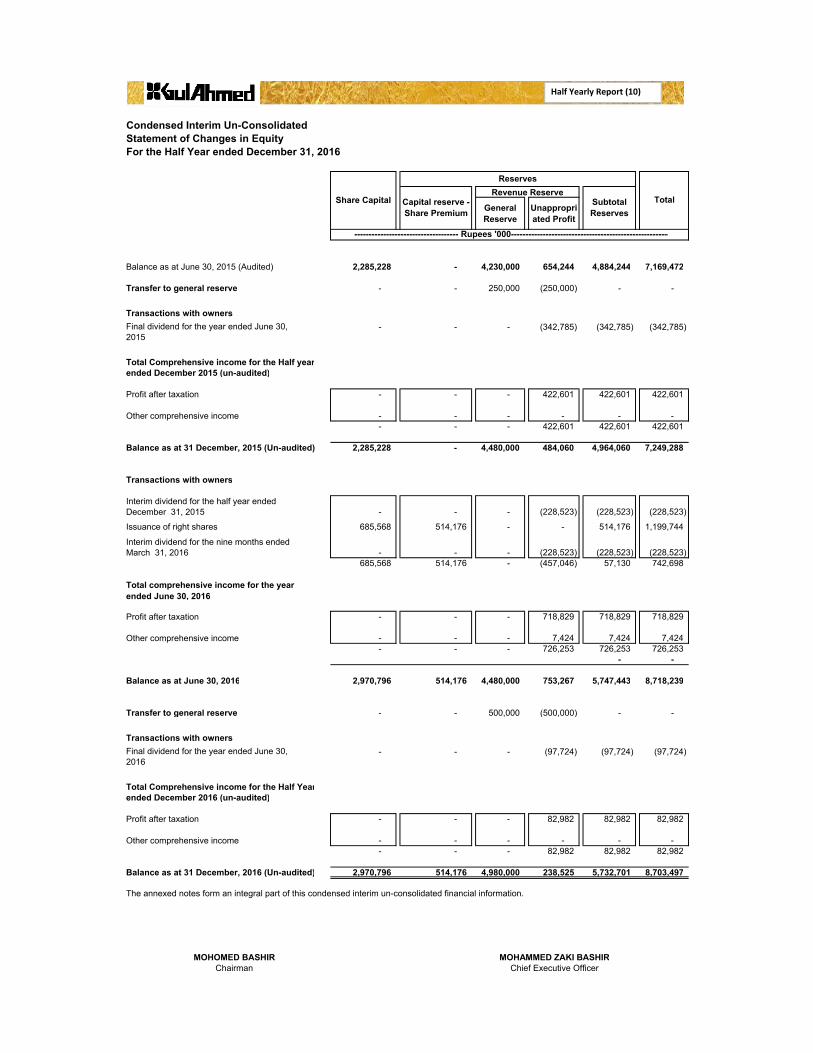
Condensed Interim Un-ConsolidatedStatement of Changes in EquityFor the Half Year ended December 31, 2016
General Reserve
Unappropriated Profit
Balance as at June 30, 2015 (Audited) 2,285,228 - 4,230,000 654,244 4,884,244 7,169,472
Transfer to general reserve - - 250,000 (250,000) - -
Transactions with owners- - - (342,785) (342,785) (342,785)
Total Comprehensive income for the Half yearended December 2015 (un-audited)
Profit after taxation - - - 422,601 422,601 422,601
- - - - - - - - - 422,601 422,601 422,601
Balance as at 31 December, 2015 (Un-audited) 2,285,228 - 4,480,000 484,060 4,964,060 7,249,288
Transactions with owners
TotalCapital reserve - Share Premium
Revenue ReserveSubtotal Reserves
Share Capital
Reserves
------------------------------------ Rupees '000-------------------------------------------------------
Final dividend for the year ended June 30, 2015
Other comprehensive income
Half Yearly Report (10)
- - - (228,523) (228,523) (228,523)
Issuance of right shares 685,568 514,176 - - 514,176 1,199,744
- - - (228,523) (228,523) (228,523) 685,568 514,176 - (457,046) 57,130 742,698
- - - 718,829 718,829 718,829
- - - 7,424 7,424 7,424 - - - 726,253 726,253 726,253
- -
Balance as at June 30, 2016 2,970,796 514,176 4,480,000 753,267 5,747,443 8,718,239
Transfer to general reserve - - 500,000 (500,000) - -
Transactions with owners- - - (97,724) (97,724) (97,724)
Total Comprehensive income for the Half Yearended December 2016 (un-audited)
Profit after taxation - - - 82,982 82,982 82,982
- - - - - - - - - 82,982 82,982 82,982
Balance as at 31 December, 2016 (Un-audited) 2,970,796 514,176 4,980,000 238,525 5,732,701 8,703,497
MOHOMED BASHIR MOHAMMED ZAKI BASHIRChairman Chief Executive Officer
Interim dividend for the half year ended December 31, 2015
Final dividend for the year ended June 30, 2016
Other comprehensive income
The annexed notes form an integral part of this condensed interim un-consolidated financial information.
Interim dividend for the nine months ended March 31, 2016
Total comprehensive income for the year ended June 30, 2016
Profit after taxation
Other comprehensive income
Notes to the Condensed Interim Un-consolidated Financial Information (Un-audited)For the Half Year ended December 31, 2016
1 LEGAL STATUS AND ITS OPERATIONS
The Company’s registered office is situated at Plot No. 82, Main National Highway, Landhi, Karachi.
The Company is a subsidiary of Gul Ahmed Holdings (Private) Limited.
Details of Subsidiaries of the Company are as under:
Date of Country of Incorporation Incorporation
Gul Ahmed International Limited November 27, 2002 100% U.A.EGTM (Europe) Limited - Indirect subsidiary April 17, 2003 100% U.KGTM USA Corp.- Indirect Subsidiary March 19, 2012 100% U.S.A
2 BASIS OF PREPERATION
Gul Ahmed Textile Mills Limited (The Company) was incorporated on April 01, 1953 in Pakistan as a private limitedcompany, subsequently converted into public limited company on January 07, 1955 and is listed in Pakistan StockExchange Limited. The Company is a composite textile mill and is engaged in the manufacture and sale of textile
% Holding
This condensed interim un-consolidated financial information of the Company for the half year ended December 31,2016 has been prepared in accordance with the requirements of the International Accounting Standards 34 - InterimFinancial Reporting and provisions of and directives issued under the Companies Ordinance, 1984. In case whererequirements differ, the provisions of or directives issued under the Companies Ordinance, 1984 shall prevail.
This condensed interim un-consolidated financial information comprise of the condensed interim un-consolidatedbalance sheet as at December 31, 2016 and the condensed interim un-consolidated profit and loss account,
Half Yearly Report (11)
3 ACCOUNTING POLICIES
The comparatives balance sheet, presented in this condensed interim un-consolidated financial Information, as atJune 30, 2016 has been extracted from the audited un-consolidated financial statements of the Company for the yearended June 30, 2016, whereas the comparative condensed interim un-consolidated profit and loss account,condensed interim un-consolidated statement of comprehensive income, condensed interim un-consolidated cashflow statement and condensed interim un-consolidated statement of changes in equity for the half year endedDecember 31, 2016 have been extracted from the condensed interim un-consolidated financial information of theCompany for the half year ended December 31, 2015.
This condensed interim unconsolidated financial information do not include all the information required in annualfinancial statements prepared in accordance with approved accounting standards as applicable in Pakistan, andshould be read in conjunction with the un-consolidated financial statements for the year ended June 30, 2016.
Same accounting policies and methods of computation are adopted for the preparation of these condensed interim un-consolidated financial information as those applied in the preparation of un-consolidated financial statements for theyear ended June 30, 2016.
Certain new IFRSs and amendments to existing IFRSs, effective for periods beginning on or after July 1, 2016, do nothave any impact on this condensed interim financial information, and are therefore not presented.
balance sheet as at December 31, 2016 and the condensed interim un-consolidated profit and loss account,condensed interim un-consolidated statement of comprehensive income, condensed interim un-consolidated cashflow statement and condensed interim un-consolidated statement of changes in equity for the half year endedDecember 31, 2016.
This condensed interim un-consolidated financial information is un-audited. However, a limited scope review of thiscondensed interim financial information has been performed by the external auditors of the company in accordancewith the requirements of clause (xix) of the Code of Corporate Governance. This condensed interim financialinformation is being submitted to the shareholders as required by section 245 of the Companies Ordinance 1984.

ACCOUNTING ESTIMATES, JUDGEMENTS AND FINANCIAL RISK MANAGEMENT
TRADE AND OTHER PAYABLES
Trade and other payables include provision in respect of;
a)
b)
The Company's financial risk objectives and policies are consistent with those disclosed in the annual auditedfinancial statements as at and for the year ended June 30, 2016.
Increase in gas tariff rates notified vide SRO No. (I) / 2015 dated 31 August, 2015, as was disclosed in note no9.1.2 of the financial statements for the year ended June 30, 2016. During the period under review the Oil andGas Regulatory Authority (OGRA) has issued another notification dated 30-12-2016 and SSGC billed @ Rs.600per MMBTU instead of Rs.488.23 per MMBTU. The Company along with others have filed petition in theHonorable Sindh High Court against the notification and the Honorable Court has granted interim relief andinstructed SSGC to revise bills at previous rate against security for the differential amount. Accordingly, theCompany has provided banker's verified cheques of Rs. 45.804 million as security to Nazir of High Court Sindhand also, as a matter of prudence, full provision of Rs. 166.700 (June 30, 2016: 98.689 million).
The matter of charging of captive power tariff instead of Industry tariff rate to the Company, wherein there is nochange in its status as disclosed in note 9.1.3 of the financial statements for the year ended June 30, 2016except that the amount of provision has increased to Rs. 247.408 million (June 30, 2016: 139.585 million).
The preparation of this condensed interim un-consolidated financial information requires management to makeestimates, assumptions and use judgments that affect the application of policies and reported amounts of assets andliabilities and income and expenses. Estimates, assumptions and judgments are continually evaluated and are basedon historical experience and other factors, including reasonable expectations of future events. Revisions toaccounting estimates are recognised prospectively commencing from the period of revision. Judgments andestimates made by the management in the preparation of this condensed interim financial information are the sameas those that were applied to financial statements as at and for the year ended June 30, 2016.
Half Yearly Report (12)
c)
Un-Audited AuditedDecember June
2016 2016LONG TERM FINANCING - SECURED
Opening balance 5,118,004 3,121,740 Add: Obtained during the period / year 2,405,619 2,681,678 Less: Repaid during the period / year (420,879) (685,414)
7,102,744 5,118,004
Less: Current portion shown under current liabilities (780,930) (487,400) 6,321,814 4,630,604
CONTINGENCIES AND COMMITMENTS
Contingencies
-
In the matter of workers welfare fund as disclosed in note 9.4 of the financial statements for the year endedJune 30, 2016 the Honorable Supreme Court has passed a judgment on 10th November 2016 declaring theinsertion of amendments introduced in the Finance Acts 2006 and 2008 pertaining to Workers Welfare Fund(WWF) as unlawful and there by striking down the amendments introduced through these Finance Acts.Subsequent to the period end a review petition has been filed in the Honorable Supreme Court against thejudgement. Therefore the Company as a matter of prudence has maintained the provisions made.
Rupees in '000
In the matter of Gas Infrastructure Development Cess (GIDC), as disclosed in note 12.7 of the financialstatements for the year ended June 30, 2016, the Honorable High Court of Sindh vide its judgment dated 26October 2016 have held GIDC Act 2015 ultra vires the Constitution. However the management on prudent basishas recognized the provision of Rs. 869.027 million (June 30, 2016: Rs.584.934 million) under GIDC Act 2015.
The status of contingencies, as reported in the annual financial statements for the year ended June 30, 2016remained unchanged during the current period except following;

Guarantees
As of the balance sheet date;
(a)
(b)
(c) Bills discounted Rs. 3,237 million (June-2016: Rs. 2,267 million).
(d)
Commitments
(a) Company is committed for certain expenditures which are stated as follows:
Un-Audited AuditedDecember June
2016 2016
- Capital expenditure 436,380 2,103,004 - Non capital expenditure items under letters of credits 2,279,939 818,639
2,716,319 2,921,643
Rs. 737 million (June 2016: Rs. 706 million) against guarantees issued by banks which are secured by paripassu hypothecation charge over stores and spares, stock-in-trade, trade debts and other receivables. Theseguarantees includes guarantees issued by related party amounting to Rs. 668 million (June 2016: Rs. 638million).
Post dated cheques Rs. 1,194 million (June-2016: Rs. 1,000 million) are issued to Custom Authorities inrespect of duties on imported items availed on the basis of consumption and export plans.
Corporate guarantee of Rs. 87.357 million (June-2016: Rs. 93.365 million) has been issued to a bank in favor ofindirect subsidiary company - GTM (Europe) Limited - UK.
Rupees in '000
Half Yearly Report (13)
(b)
Not more than one year 428,490 497,517 More than one year but not more than five years 1,607,190 1,670,611 More than five years 935,440 994,367
2,971,120 3,162,495
PROPERTY, PLANT AND EQUIPMENTUn-Audited AuditedDecember June
2016 2016
Operating assets - net book value 8.1&8.2 11,152,528 10,505,376 Capital work in progress - at cost 8.4 3,640,981 1,545,089
14,793,509 12,050,465
Un-AuditedFor the Half Year For the Half Year
December December2016 2015
8.1 Additions during the period
Buildings and structures on leasehold land 519,850 238,076 Plant and machinery 582,436 631,006 Furniture and fixtures 1,730 656 Office equipment 78,135 49,454 Vehicles 121,463 119,681
1,303,614 1,038,873
8.1.1
Rupees in '000
Rupees in '000
Additions to building and structure on leasehold land, plant and machinery and others include transfers fromcapital work-in-progress amounting to Rs. 506 million, Rs. 520 million and Rs. 4.5 million (December-2015: Rs.191.732 million, Rs. 564.262 million and Rs. 13.854).
The Company is committed to minimum rental payments for each of the following period as follows:
Un-AuditedFor the Half Year For the Half Year
December December2016 2015
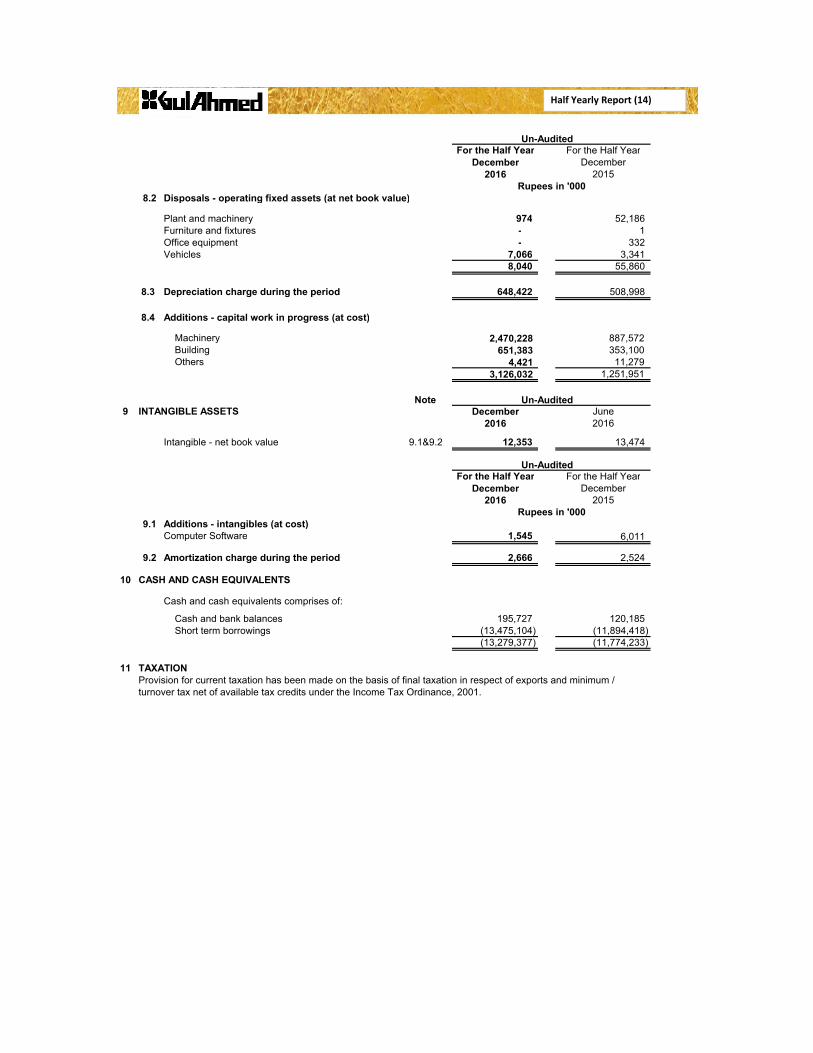
8.2 Disposals - operating fixed assets (at net book value)
Plant and machinery 974 52,186 Furniture and fixtures - 1 Office equipment - 332 Vehicles 7,066 3,341
8,040 55,860
8.3 Depreciation charge during the period 648,422 508,998
8.4 Additions - capital work in progress (at cost)
Machinery 2,470,228 887,572 Building 651,383 353,100 Others 4,421 11,279
3,126,032 1,251,951
Note Un-Audited9 INTANGIBLE ASSETS December June
2016 2016
Intangible - net book value 9.1&9.2 12,353 13,474
Un-AuditedFor the Half Year For the Half Year
December December
Rupees in '000
Half Yearly Report (14)
December December2016 2015
9.1 Additions - intangibles (at cost)Computer Software 1,545 6,011
9.2 Amortization charge during the period 2,666 2,524
10 CASH AND CASH EQUIVALENTS
Cash and cash equivalents comprises of:
Cash and bank balances 195,727 120,185Short term borrowings (13,475,104) (11,894,418)
(13,279,377) (11,774,233)
11 TAXATION
Rupees in '000
Provision for current taxation has been made on the basis of final taxation in respect of exports and minimum / turnover tax net of available tax credits under the Income Tax Ordinance, 2001.
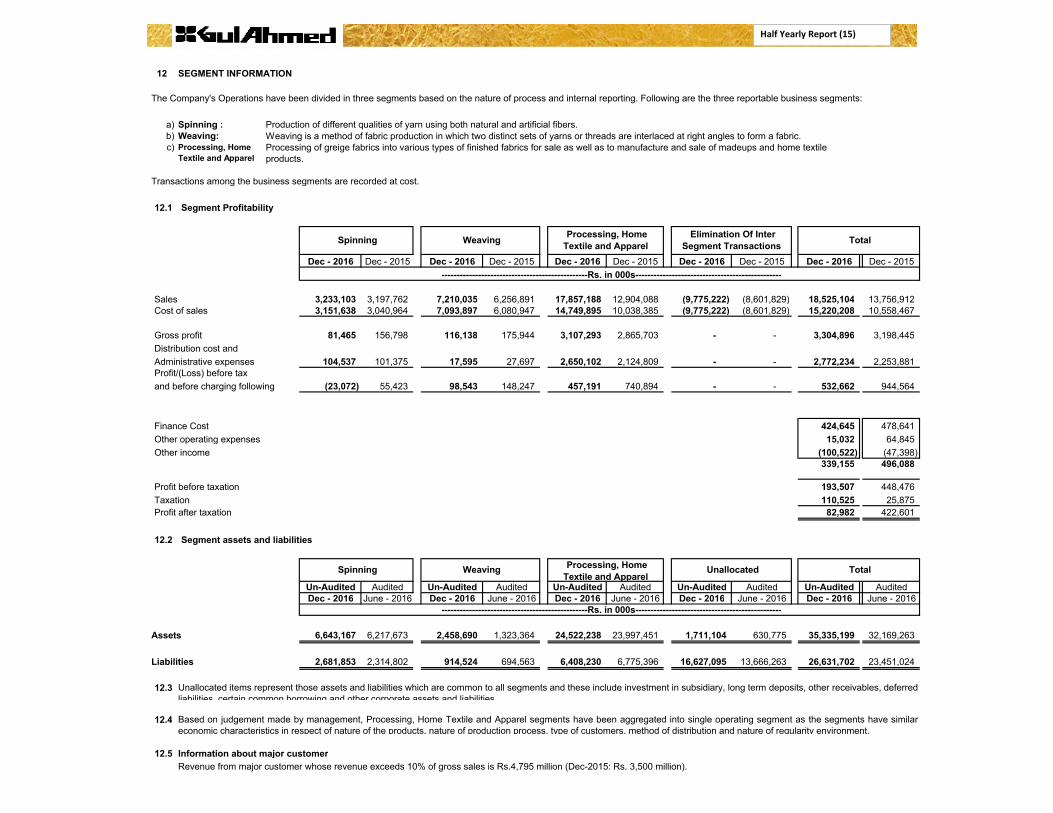
12 SEGMENT INFORMATION
a) Spinning : Production of different qualities of yarn using both natural and artificial fibers.b) Weaving:c)
Transactions among the business segments are recorded at cost.
12.1 Segment Profitability
Dec - 2016 Dec - 2015 Dec - 2016 Dec - 2015 Dec - 2016 Dec - 2015 Dec - 2016 Dec - 2015 Dec - 2016 Dec - 2015
Sales 3,233,103 3,197,762 7,210,035 6,256,891 17,857,188 12,904,088 (9,775,222) (8,601,829) 18,525,104 13,756,912Cost of sales 3,151,638 3,040,964 7,093,897 6,080,947 14,749,895 10,038,385 (9,775,222) (8,601,829) 15,220,208 10,558,467
Gross profit 81,465 156,798 116,138 175,944 3,107,293 2,865,703 - - 3,304,896 3,198,445 Distribution cost and Administrative expenses 104,537 101,375 17,595 27,697 2,650,102 2,124,809 - - 2,772,234 2,253,881 Profit/(Loss) before tax
The Company's Operations have been divided in three segments based on the nature of process and internal reporting. Following are the three reportable business segments:
Weaving is a method of fabric production in which two distinct sets of yarns or threads are interlaced at right angles to form a fabric.Processing, Home Textile and Apparel
Processing of greige fabrics into various types of finished fabrics for sale as well as to manufacture and sale of madeups and home textile products.
Spinning Weaving Processing, Home Textile and Apparel
Elimination Of Inter Segment Transactions Total
------------------------------------------------Rs. in 000s------------------------------------------------
Half Yearly Report (15)
and before charging following (23,072) 55,423 98,543 148,247 457,191 740,894 - - 532,662 944,564
Finance Cost 424,645 478,641 Other operating expenses 15,032 64,845 Other income (100,522) (47,398)
339,155 496,088
Profit before taxation 193,507 448,476 Taxation 110,525 25,875 Profit after taxation 82,982 422,601
12.2 Segment assets and liabilities
Un-Audited Audited Un-Audited Audited Un-Audited Audited Un-Audited Audited Un-Audited AuditedDec - 2016 June - 2016 Dec - 2016 June - 2016 Dec - 2016 June - 2016 Dec - 2016 June - 2016 Dec - 2016 June - 2016
Assets 6,643,167 6,217,673 2,458,690 1,323,364 24,522,238 23,997,451 1,711,104 630,775 35,335,199 32,169,263
Liabilities 2,681,853 2,314,802 914,524 694,563 6,408,230 6,775,396 16,627,095 13,666,263 26,631,702 23,451,024
12.3
12.4
12.5 Information about major customer
------------------------------------------------Rs. in 000s------------------------------------------------
Unallocated items represent those assets and liabilities which are common to all segments and these include investment in subsidiary, long term deposits, other receivables, deferredliabilities, certain common borrowing and other corporate assets and liabilities.
Based on judgement made by management, Processing, Home Textile and Apparel segments have been aggregated into single operating segment as the segments have similareconomic characteristics in respect of nature of the products, nature of production process, type of customers, method of distribution and nature of regularity environment.
Spinning Weaving Processing, Home Textile and Apparel
Unallocated Total
Revenue from major customer whose revenue exceeds 10% of gross sales is Rs.4,795 million (Dec-2015: Rs. 3,500 million).
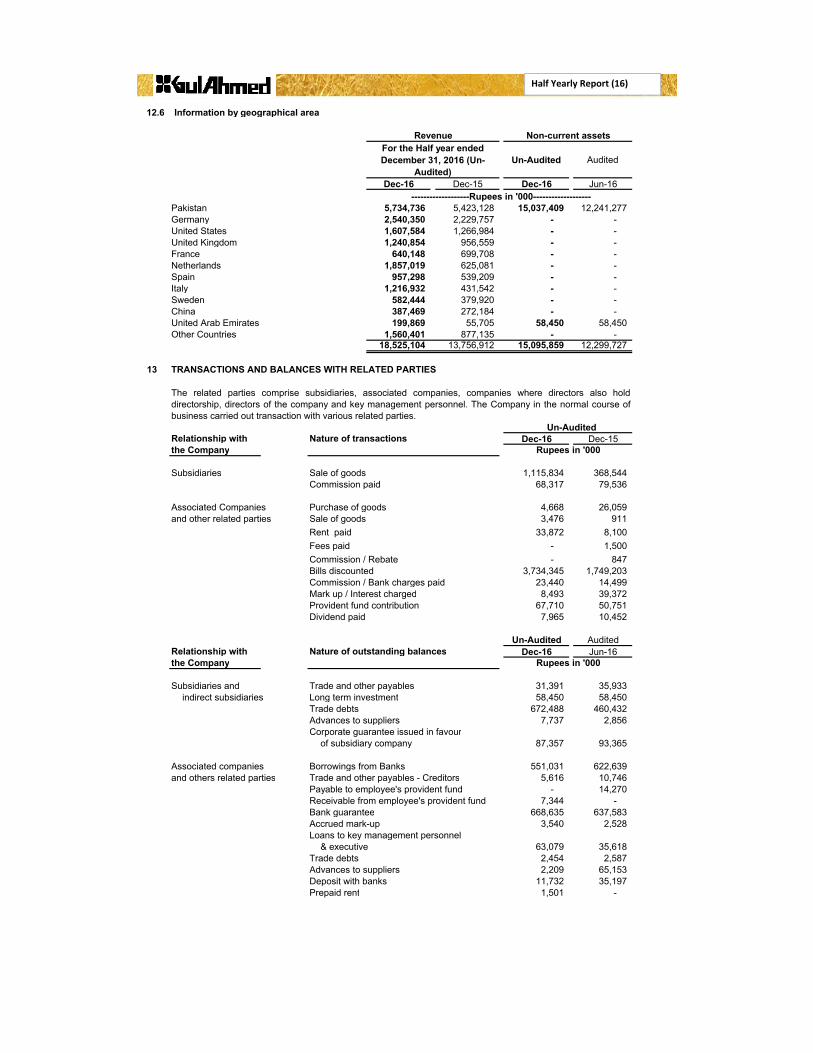
12.6 Information by geographical area
Un-Audited Audited
Dec-16 Dec-15 Dec-16 Jun-16
Pakistan 5,734,736 5,423,128 15,037,409 12,241,277Germany 2,540,350 2,229,757 - - United States 1,607,584 1,266,984 - - United Kingdom 1,240,854 956,559 - - France 640,148 699,708 - - Netherlands 1,857,019 625,081 - - Spain 957,298 539,209 - - Italy 1,216,932 431,542 - - Sweden 582,444 379,920 - - China 387,469 272,184 - - United Arab Emirates 199,869 55,705 58,450 58,450 Other Countries 1,560,401 877,135 - -
18,525,104 13,756,912 15,095,859 12,299,72713,756,912
13 TRANSACTIONS AND BALANCES WITH RELATED PARTIES
Un-AuditedRelationship with Nature of transactions Dec-16 Dec-15the Company
Subsidiaries Sale of goods 1,115,834 368,544 Commission paid 68,317 79,536
Rupees in '000
Revenue Non-current assetsFor the Half year ended December 31, 2016 (Un-
Audited)
-------------------Rupees in '000-------------------
The related parties comprise subsidiaries, associated companies, companies where directors also holddirectorship, directors of the company and key management personnel. The Company in the normal course ofbusiness carried out transaction with various related parties.
Half Yearly Report (16)
Associated Companies Purchase of goods 4,668 26,059 and other related parties Sale of goods 3,476 911
Rent paid 33,872 8,100 Fees paid - 1,500 Commission / Rebate - 847 Bills discounted 3,734,345 1,749,203 Commission / Bank charges paid 23,440 14,499 Mark up / Interest charged 8,493 39,372 Provident fund contribution 67,710 50,751 Dividend paid 7,965 10,452
Un-Audited AuditedRelationship with Nature of outstanding balances Dec-16 Jun-16the Company
Subsidiaries and Trade and other payables 31,391 35,933 indirect subsidiaries Long term investment 58,450 58,450
Trade debts 672,488 460,432 Advances to suppliers 7,737 2,856 Corporate guarantee issued in favour
of subsidiary company 87,357 93,365
Associated companies Borrowings from Banks 551,031 622,639 and others related parties Trade and other payables - Creditors 5,616 10,746
Payable to employee's provident fund - 14,270 Receivable from employee's provident fund 7,344 - Bank guarantee 668,635 637,583 Accrued mark-up 3,540 2,528 Loans to key management personnel
& executive 63,079 35,618 Trade debts 2,454 2,587Advances to suppliers 2,209 65,153 Deposit with banks 11,732 35,197 Prepaid rent 1,501 -
Rupees in '000
14 FAIR VALUES
- Level 1
- Level 2
- Level 3
15 DATE OF AUTHORISATION
Inputs are unobservable inputs for the asset or liability Inputs for the asset or liability that are notbased on observable market data (that is, unobservable inputs).
Financial assets and liabilities of the Company are either short term in nature or are repriced periodicallytherefore; their carrying amounts approximate their fair values.
These financial statements were authorised for issue on February 28, 2017 by the Board of Directors of theCompany.
There are no transactions with directors of the Company and key management personnel other thanthose under the terms of employment for the period ended December,2016 amounting to Rs.731 million(December-2015: Rs. 495 million) on account of remuneration.
Fair value is the price that would be received to sell an asset or paid to transfer a liability in an orderly transaction
in the principal (or most advantageous) market at the measurement date under current market conditions (i.e. an
exit price) regardless of whether that price is directly observable or estimated using another valuation technique.
The Company while assessing fair values uses valuation techniques that are appropriate in the circumstances
using relevant observable data as far as possible and minimizing the use of unobservable inputs. Fair values are
categorized into following three levels based on the input used in the valuation techniques;
Quoted prices in active markets for identical assets or liabilities that can be assessed atmeasurement.
Inputs other than quoted prices included within level 1 that are observable for the asset or liability,either directly (that is, as prices) or indirectly (that is, derived from prices).
Half Yearly Report (17)
16 GENERAL
16.1
16.2 Figures have been rounded off to the nearest thousand rupees.
MOHOMED BASHIR MOHAMMED ZAKI BASHIRChairman Chief Executive Officer
Allocations for the workers' profit participation fund, workers' welfare fund and taxation are provisional and finalliability including liability for deferred taxation will be determined on the basis of annual results.
T e x t i l e M i l l s L i m i t e d
Consolidated AccountsConsolidated Condensed Interim Financial Information
For The Half Year Ended December 31, 2016
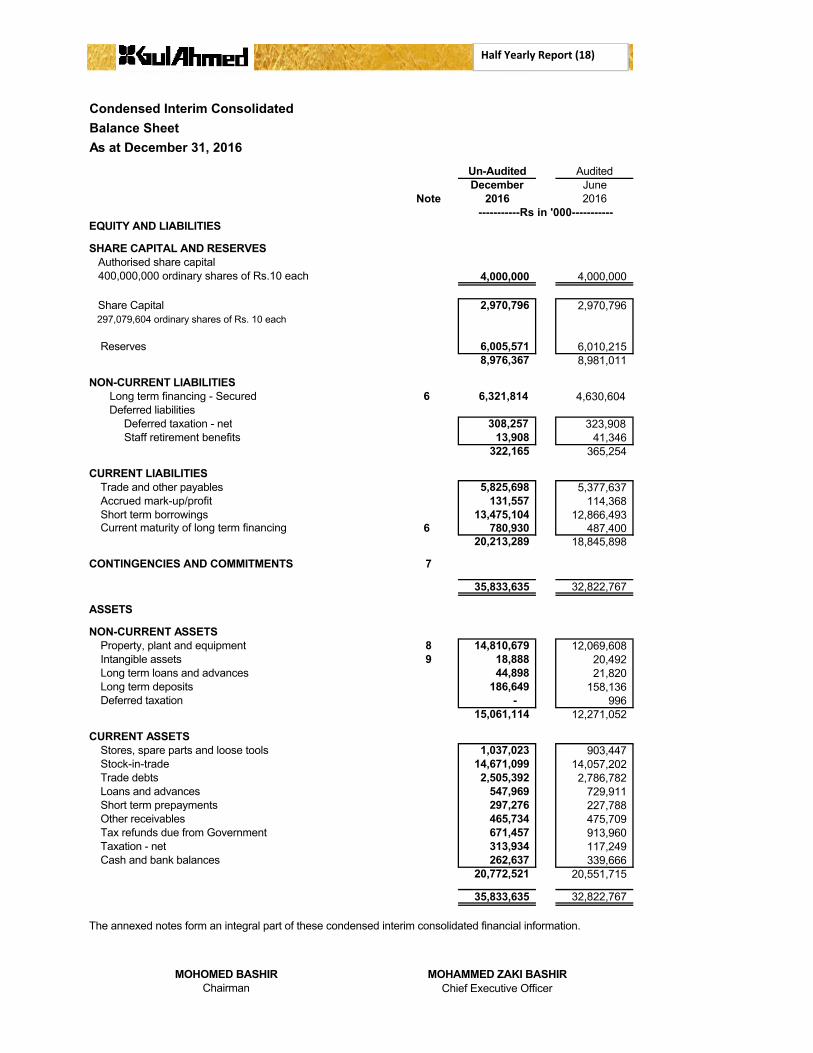
Condensed Interim Consolidated Balance SheetAs at December 31, 2016
Un-Audited AuditedDecember June
Note 2016 2016-----------Rs in '000-----------
EQUITY AND LIABILITIES
SHARE CAPITAL AND RESERVES Authorised share capital 400,000,000 ordinary shares of Rs.10 each 4,000,000 4,000,000
Share Capital 2,970,796 2,970,796 297,079,604 ordinary shares of Rs. 10 each
Reserves 6,005,571 6,010,215 8,976,367 8,981,011
NON-CURRENT LIABILITIES Long term financing - Secured 6 6,321,814 4,630,604 Deferred liabilities
Deferred taxation - net 308,257 323,908 Staff retirement benefits 13,908 41,346
322,165 365,254
CURRENT LIABILITIES Trade and other payables 5,825,698 5,377,637 Accrued mark-up/profit 131,557 114,368 Short term borrowings 13,475,104 12,866,493 Current maturity of long term financing 6 780,930 487,400
20,213,289 18,845,898
CONTINGENCIES AND COMMITMENTS 7
35,833,635 32,822,767
ASSETS
NON-CURRENT ASSETSProperty, plant and equipment 8 14,810,679 12,069,608 Intangible assets 9 18,888 20,492 Long term loans and advances 44,898 21,820Long term deposits 186,649 158,136 Deferred taxation - 996
15,061,114 12,271,052
CURRENT ASSETSStores, spare parts and loose tools 1,037,023 903,447 Stock-in-trade 14,671,099 14,057,202 Trade debts 2,505,392 2,786,782 Loans and advances 547,969 729,911 Short term prepayments 297,276 227,788 Other receivables 465,734 475,709 Tax refunds due from Government 671,457 913,960 Taxation - net 313,934 117,249 Cash and bank balances 262,637 339,666
20,772,521 20,551,715
35,833,635 32,822,767
MOHOMED BASHIR MOHAMMED ZAKI BASHIRChairman Chief Executive Officer
The annexed notes form an integral part of these condensed interim consolidated financial information.
Half Yearly Report (18)
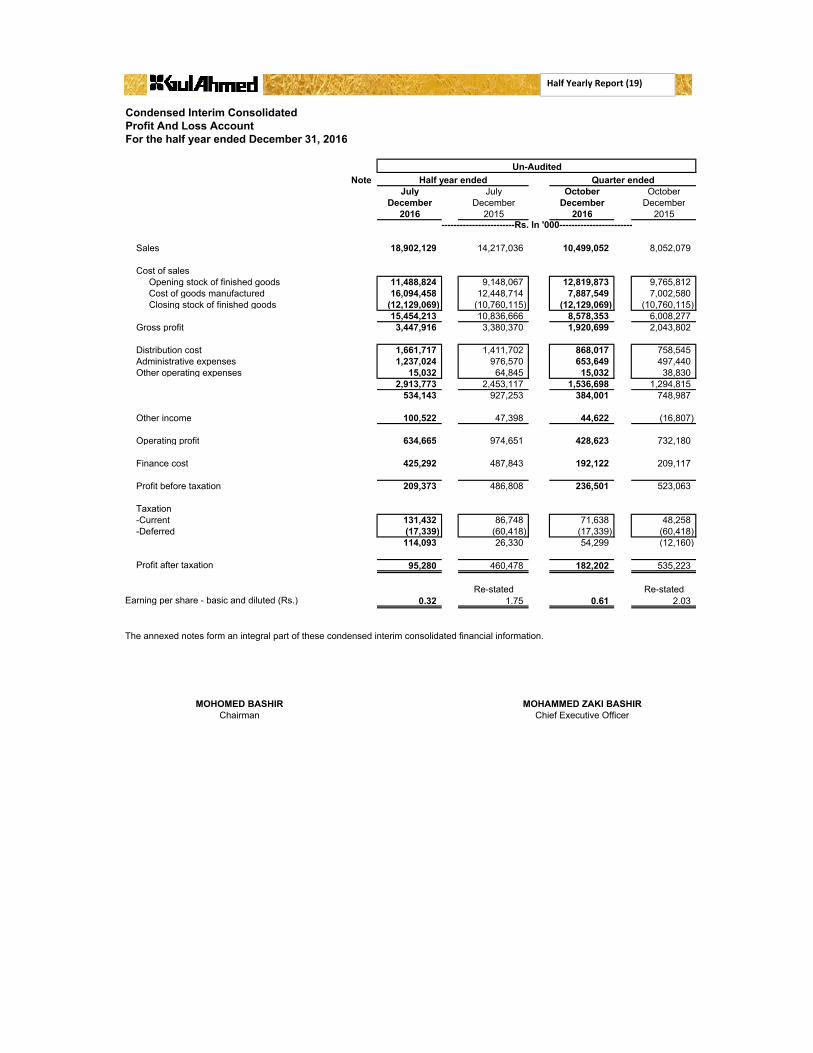
Condensed Interim Consolidated Profit And Loss AccountFor the half year ended December 31, 2016
NoteJuly July October October
December December December December2016 2015 2016 2015
Sales 18,902,129 14,217,036 10,499,052 8,052,079
Cost of sales Opening stock of finished goods 11,488,824 9,148,067 12,819,873 9,765,812 Cost of goods manufactured 16,094,458 12,448,714 7,887,549 7,002,580 Closing stock of finished goods (12,129,069) (10,760,115) (12,129,069) (10,760,115)
15,454,213 10,836,666 8,578,353 6,008,277 Gross profit 3,447,916 3,380,370 1,920,699 2,043,802
Distribution cost 1,661,717 1,411,702 868,017 758,545 Administrative expenses 1,237,024 976,570 653,649 497,440 Other operating expenses 15,032 64,845 15,032 38,830
2,913,773 2,453,117 1,536,698 1,294,815534,143 927,253 384,001 748,987
Other income 100,522 47,398 44,622 (16,807)
Operating profit 634,665 974,651 428,623 732,180
Finance cost 425,292 487,843 192,122 209,117
Profit before taxation 209,373 486,808 236,501 523,063
Un-AuditedHalf year ended Quarter ended
------------------------Rs. In '000------------------------
Half Yearly Report (19)
Profit before taxation 209,373 486,808 236,501 523,063
Taxation-Current 131,432 86,748 71,638 48,258 -Deferred (17,339) (60,418) (17,339) (60,418)
114,093 26,330 54,299 (12,160)
Profit after taxation 95,280 460,478 182,202 535,223
Re-stated Re-statedEarning per share - basic and diluted (Rs.) 0.32 1.75 0.61 2.03
MOHOMED BASHIR MOHAMMED ZAKI BASHIRChairman Chief Executive Officer
The annexed notes form an integral part of these condensed interim consolidated financial information.
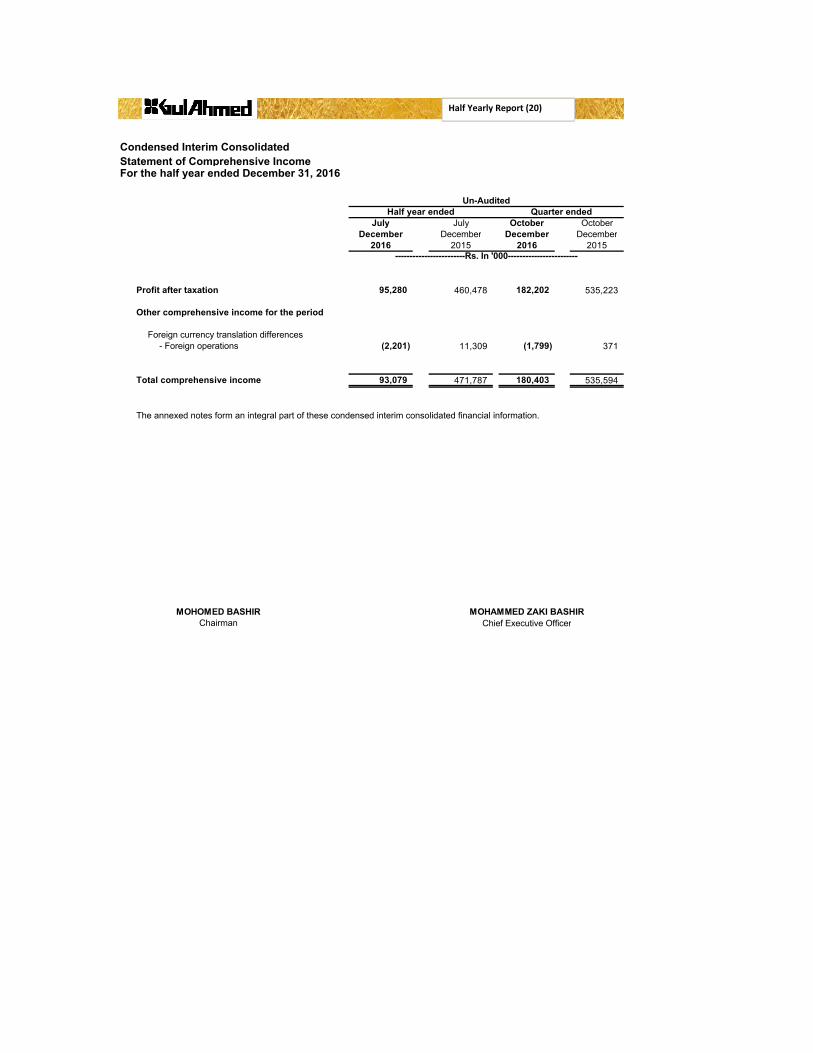
Condensed Interim Consolidated Statement of Comprehensive IncomeFor the half year ended December 31, 2016
July July October OctoberDecember December December December
2016 2015 2016 2015
Profit after taxation 95,280 460,478 182,202 535,223
Other comprehensive income for the period
Foreign currency translation differences - Foreign operations (2,201) 11,309 (1,799) 371
Total comprehensive income 93,079 471,787 180,403 535,594
The annexed notes form an integral part of these condensed interim consolidated financial information.
MOHOMED BASHIR MOHAMMED ZAKI BASHIRChairman Chief Executive Officer
Un-AuditedHalf year ended Quarter ended
------------------------Rs. In '000------------------------
Half Yearly Report (20)
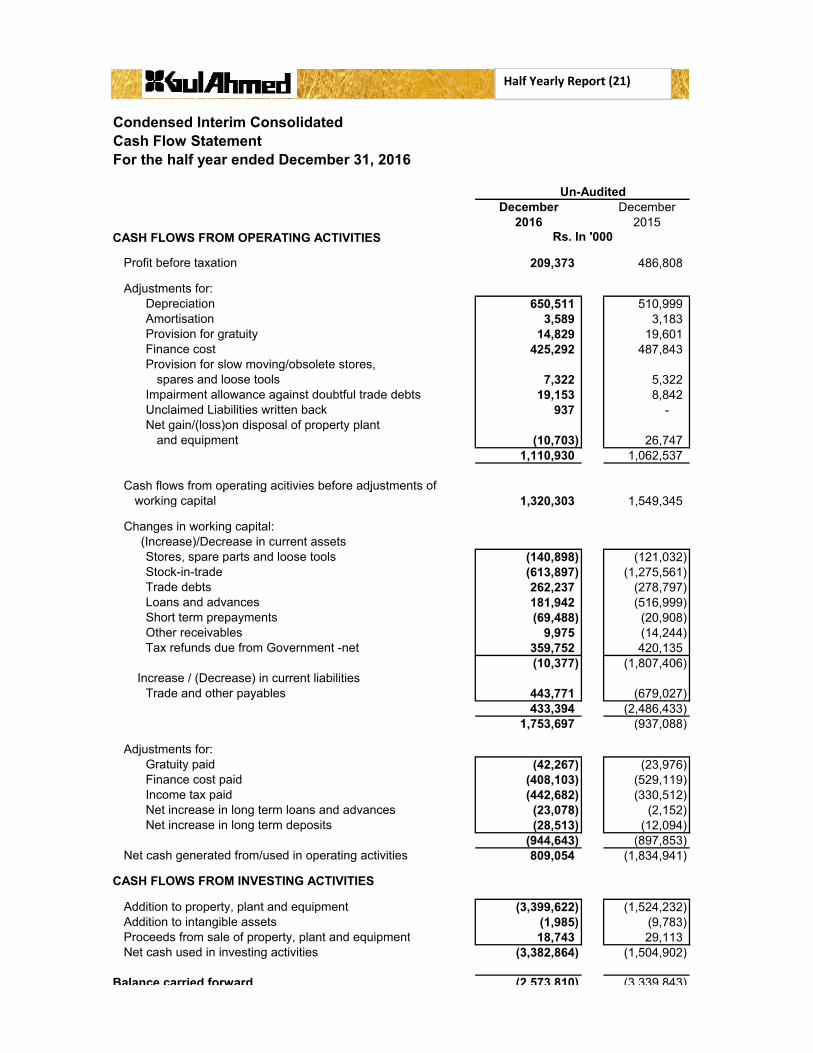
Condensed Interim Consolidated Cash Flow StatementFor the half year ended December 31, 2016
Un-AuditedDecember December
2016 2015CASH FLOWS FROM OPERATING ACTIVITIES
Profit before taxation 209,373 486,808
Adjustments for:Depreciation 650,511 510,999 Amortisation 3,589 3,183 Provision for gratuity 14,829 19,601 Finance cost 425,292 487,843 Provision for slow moving/obsolete stores,
spares and loose tools 7,322 5,322 Impairment allowance against doubtful trade debts 19,153 8,842 Unclaimed Liabilities written back 937 - Net gain/(loss)on disposal of property plant
and equipment (10,703) 26,747 1,110,930 1,062,537
Cash flows from operating acitivies before adjustments of
Rs. In '000
Half Yearly Report (21)
Cash flows from operating acitivies before adjustments of working capital 1,320,303 1,549,345
Changes in working capital: (Increase)/Decrease in current assets
Stores, spare parts and loose tools (140,898) (121,032)Stock-in-trade (613,897) (1,275,561)Trade debts 262,237 (278,797)Loans and advances 181,942 (516,999)Short term prepayments (69,488) (20,908)Other receivables 9,975 (14,244)Tax refunds due from Government -net 359,752 420,135
(10,377) (1,807,406) Increase / (Decrease) in current liabilities
Trade and other payables 443,771 (679,027) 433,394 (2,486,433)
1,753,697 (937,088)
Adjustments for:Gratuity paid (42,267) (23,976) Finance cost paid (408,103) (529,119) Income tax paid (442,682) (330,512) Net increase in long term loans and advances (23,078) (2,152) Net increase in long term deposits (28,513) (12,094)
(944,643) (897,853)Net cash generated from/used in operating activities 809,054 (1,834,941)
CASH FLOWS FROM INVESTING ACTIVITIES
Addition to property, plant and equipment (3,399,622) (1,524,232) Addition to intangible assets (1,985) (9,783) Proceeds from sale of property, plant and equipment 18,743 29,113 Net cash used in investing activities (3,382,864) (1,504,902)
Balance carried forward (2,573,810) (3,339,843)
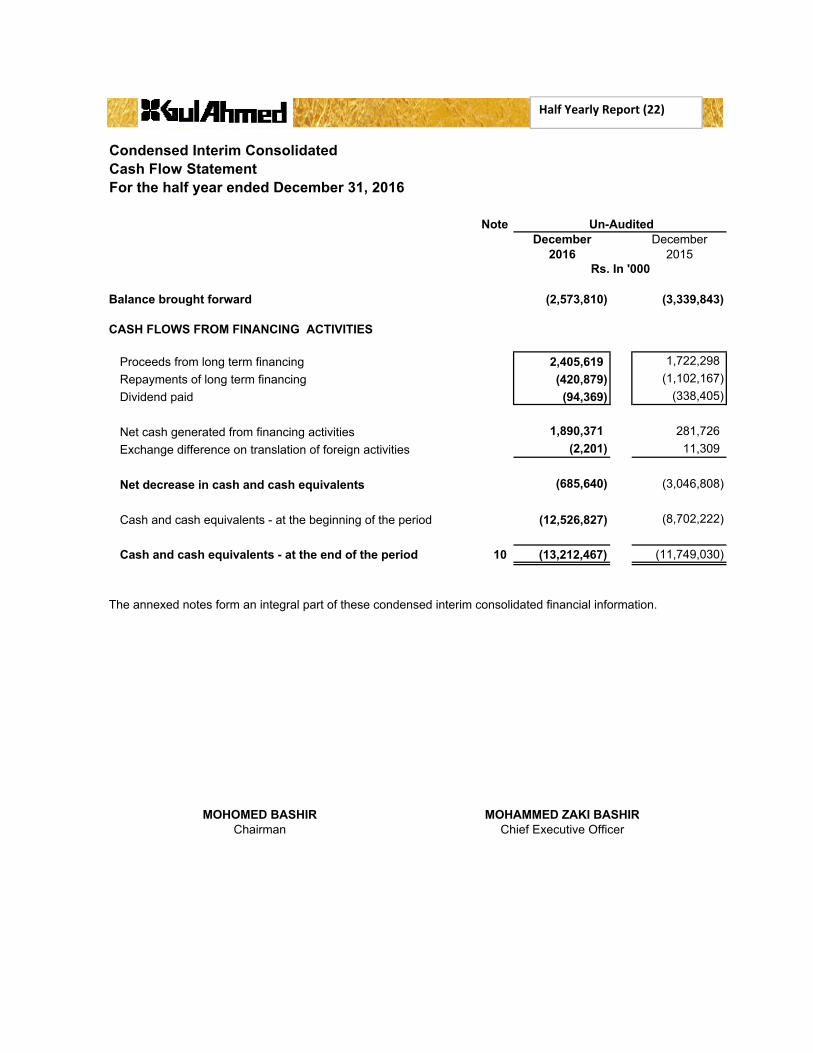
Condensed Interim Consolidated Cash Flow StatementFor the half year ended December 31, 2016
Note Un-AuditedDecember December
2016 2015
Balance brought forward (2,573,810) (3,339,843)
CASH FLOWS FROM FINANCING ACTIVITIES
Proceeds from long term financing 2,405,619 1,722,298 Repayments of long term financing (420,879) (1,102,167) Dividend paid (94,369) (338,405)
Net cash generated from financing activities 1,890,371 281,726 Exchange difference on translation of foreign activities (2,201) 11,309
Net decrease in cash and cash equivalents (685,640) (3,046,808)
Rs. In '000
Half Yearly Report (22)
Net decrease in cash and cash equivalents
Cash and cash equivalents - at the beginning of the period (12,526,827) (8,702,222)
Cash and cash equivalents - at the end of the period 10 (13,212,467) (11,749,030)
MOHOMED BASHIR MOHAMMED ZAKI BASHIRChairman Chief Executive Officer
The annexed notes form an integral part of these condensed interim consolidated financial information.
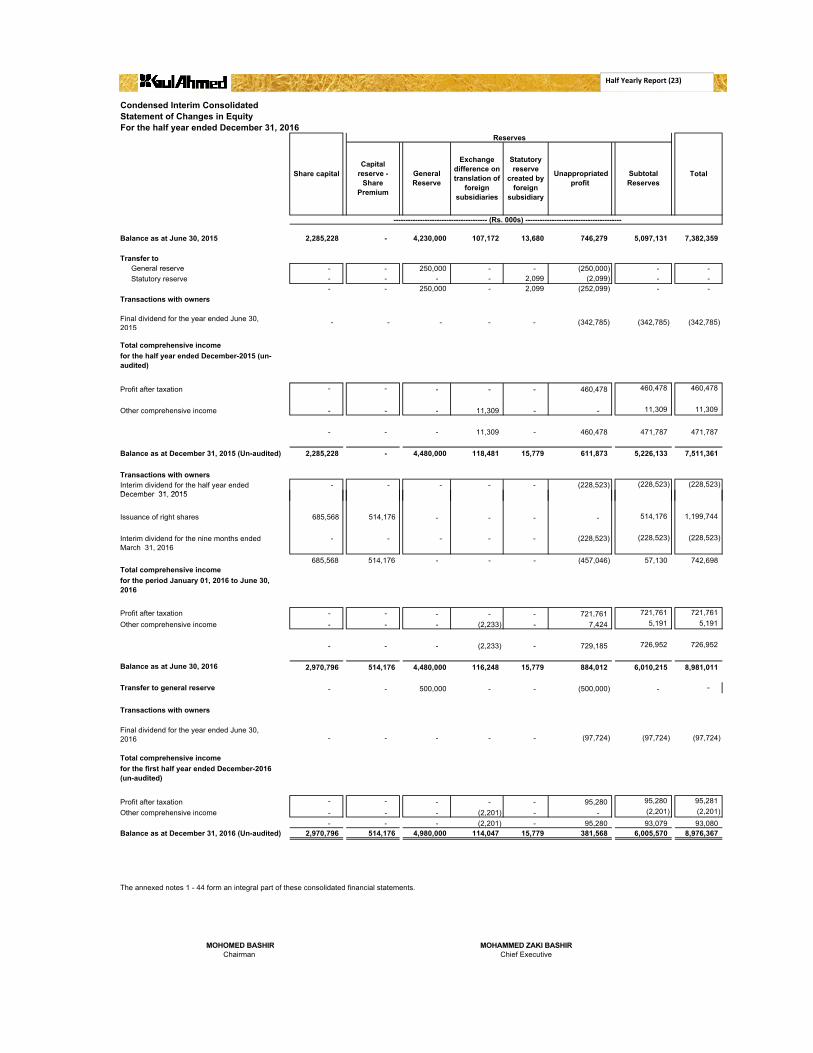
Condensed Interim Consolidated Statement of Changes in EquityFor the half year ended December 31, 2016
Balance as at June 30, 2015 2,285,228 - 4,230,000 107,172 13,680 746,279 5,097,131 7,382,359
Transfer to - - 250,000 - - (250,000) - -
Statutory reserve - - - - 2,099 (2,099) - - - - 250,000 - 2,099 (252,099) - -
Transactions with owners
- - - - - (342,785) (342,785) (342,785)
Profit after taxation - - - - - 460,478 460,478 460,478
Other comprehensive income - - - 11,309 - - 11,309 11,309
- - - 11,309 - 460,478 471,787 471,787
Balance as at December 31, 2015 (Un-audited) 2,285,228 - 4,480,000 118,481 15,779 611,873 5,226,133 7,511,361
Transactions with owners - - - - - (228,523) (228,523) (228,523)
Share capital
Reserves
TotalCapital
reserve - Share
Premium
General Reserve
Exchange difference on translation of
foreign subsidiaries
Statutory reserve
created by foreign
subsidiary
Unappropriated profit
Subtotal Reserves
--------------------------------------- (Rs. 000s) ----------------------------------------
General reserve
Final dividend for the year ended June 30, 2015
Total comprehensive incomefor the half year ended December-2015 (un-audited)
Interim dividend for the half year ended December 31, 2015
Half Yearly Report (23)
Issuance of right shares 685,568 514,176 - - - - 514,176 1,199,744
- - - - - (228,523) (228,523) (228,523)
685,568 514,176 - - - (457,046) 57,130 742,698
Profit after taxation - - - - - 721,761 721,761 721,761 Other comprehensive income - - - (2,233) - 7,424 5,191 5,191
- - - (2,233) - 729,185 726,952 726,952
Balance as at June 30, 2016 2,970,796 514,176 4,480,000 116,248 15,779 884,012 6,010,215 8,981,011
Transfer to general reserve - - 500,000 - - (500,000) - -
Transactions with owners
- - - - - (97,724) (97,724) (97,724)
Profit after taxation - - - - - 95,280 95,280 95,281 Other comprehensive income - - - (2,201) - - (2,201) (2,201)
- - - (2,201) - 95,280 93,079 93,080 Balance as at December 31, 2016 (Un-audited) 2,970,796 514,176 4,980,000 114,047 15,779 381,568 6,005,570 8,976,367
The annexed notes 1 - 44 form an integral part of these consolidated financial statements.
MOHOMED BASHIR MOHAMMED ZAKI BASHIRChairman Chief Executive
Total comprehensive incomefor the first half year ended December-2016 (un-audited)
December 31, 2015
Interim dividend for the nine months ended March 31, 2016
Total comprehensive incomefor the period January 01, 2016 to June 30, 2016
Final dividend for the year ended June 30, 2016
Notes to the Condensed Interim Consolidated Financial Information (Un-audited)For the half year ended December 31, 2016
1 LEGAL STATUS AND ITS OPERATIONS
1.1 Gul Ahmed Group ( "the Group") comprises the following:
- Gul Ahmed Textile Mills Limited- Gul Ahmed International Limited (FZC) - UAE- GTM (Europe) Limited - UK- GTM USA Corp. - USA
All three subsidiaries are engaged in trading of textile related products.
1.2 Basis of consolidation
Gul Ahmed Textile Mills Limited (The Holding Company) was incorporated on 1st April 1953 inPakistan as a private limited company, converted into public limited company on 7th January1955 and was listed on Karachi and Lahore Stock Exchanges in 1970 and 1971 respectively.The Holding Company is a composite textile mill and is engaged in the manufacture and sale
The Holding Company's registered office is situated at Plot No. 82, Main National Highway,
Gul Ahmed International Limited (FZC) -UAE is a wholly owned subsidiary of Gul AhmedTextile Mills Limited, GTM (Europe) Limited is a wholly owned subsidiary of Gul AhmedInternational Limited (FZC) - UAE and GTM USA Corp. is a wholly owned subsidiary of GTM
The Company is a subsidiary of Gul Ahmed Holdings (Private) Limited and owns 66.78%
The financial information include the financial information of the Group.
Half Yearly Report (24)
2 BASIS OF PREPARATION
Subsidiary companies are consolidated from the date on which more than 50% voting rightsare transferred to the Holding Company or power to govern the financial and operating policiesover the subsidiary and is excluded from consolidation from the date of disposal or cessation
The financial statements of the subsidiaries are prepared for the same reporting period as theHolding Company, using consistent accounting policies.
The assets and liabilities of the subsidiary company have been consolidated on a line-by-linebasis and the carrying value of investment held by the Company is eliminated against thesubsidiary's share capital. All intra-group balances and transactions are eliminated.
The condensed interim consolidated financial information comprise the consolidated balancesheet of Gul Ahmed Textile Mills Limited, its wholly owned subsidiary company Gul AhmedInternational Limited (FZC), GTM (Europe) Limited which is the wholly owned subsidiary of GulAhmed International Limited (FZC) and GTM USA Corporation which is the wholly ownedsubsidiary of GTM (Europe) Limited, as at December 31, 2016 and the related consolidatedprofit and loss account, consolidated cash flow statement and consolidated statement ofchanges in equity together with the notes forming part thereof for the period then ended. Thefinancial statements of the subsidiary companies have been consolidated on a line by linebasis.
These condensed interim consolidated financial information of the Group for the half yearended December 31, 2016 have been prepared in accordance with the requirements of theInternational Accounting Standards 34 - Interim Financial Reporting and provisions of anddirectives issued under the Companies Ordinance, 1984. In case where requirements differ,the provisions of or directives issued under the Companies Ordinance, 1984 have beenfollowed.
These condensed interim consolidated financial information comprise of the condensedinterim consolidated balance sheet as at December 31, 2016 and the condensed interimconsolidated profit and loss account, condensed interim consolidated statement ofcomprehensive income, condensed interim consolidated cash flow statement and condensedinterim consolidated statement of changes in equity for the half year ended December 31,2016.
3 ACCOUNTING POLICIES
4 ACCOUNTING ESTIMATES, JUDGEMENTS AND FINANCIAL RISK MANAGEMENT
This condensed interim financial information is un-audited. However, a limited scope review ofthis condensed interim financial information has been performed by the external auditors of thecompany in accordance with the requirements of clause (xix) of the Code of CorporateGovernance. This condensed interim financial information is being submitted to theshareholders as required by section 245 of the Companies Ordinance 1984.
The comparatives balance sheet, presented in these condensed interim consolidated financialinformation, as at June 30, 2016 has been extracted from the audited financial statements ofthe Group for the year ended June 30, 2016 whereas the comparative condensed interimconsolidated profit and loss account, condensed interim consolidated statement ofcomprehensive income, condensed interim consolidated cash flow statement and condensedinterim consolidated statement of changes in equity for the half year ended Deceember 31,2016 have been extracted from the condensed interim consolidated financial information of theGroup for the half year ended December 31, 2016.
These condensed interim consolidated financial information do not include all the information required in annual financial statements prepared in accordance with approved accounting standards as applicable in Pakistan, and should be read in conjunction with the consolidated financial statements for the year ended June 30, 2016.
Accounting policies and method of computations adopted for the preparation of thesecondensed interim consolidated financial information are the same as those applied in thepreparation of the consolidated financial statements for the year ended June 30, 2016.
Certain new IFRSs and amendments to existing IFRSs, effective for periods beginning on or after July 1, 2016, do not have any impact on this condensed interim financial information, and
The preparation of this condensed interim financial information requires management to makeestimates, assumptions and use judgments that affect the application of policies and reported
Half Yearly Report (25)
5 TRADE AND OTHER PAYABLES
Trade and other payables include provision in respect of;
a)
b)
c)
Increase in gas tariff rates notified vide SRO No. (I) / 2015 dated 31 August, 2015, as wasdisclosed in note no 9.1.2 of the financial statements for the year ended June 30, 2016.During the period under review the Oil and Gas Regulatory Authority (OGRA) has issuedanother notification dated 30-12-2016 and SSGC billed @ Rs.600 per MMBTU instead ofRs.488.23 per MMBTU. The Company along with others have filed petition in theHonorable Sindh High Court against the notification and the Honorable Court has grantedinterim relief and instructed SSGC to revise bills at previous rate against security for thedifferential amount. Accordingly, the Company has provided banker's verified cheques ofRs. 45.804 million as security to Nazir of High Court Sindh and also, as a matter ofprudence, full provision of Rs. 166.700 (June 30, 2016: 98.689 million).
The matter of charging of captive power tariff instead of Industry tariff rate to theCompany, wherein there is no change in its status as disclosed in note 9.1.3 of thefinancial statements for the year ended June 30, 2016 except that the amount of provisionhas increased to Rs. 247.408 million (June 30, 2016: 139.585 million).
In the matter of workers welfare fund as disclosed in note 9.4 of the financial statementsfor the year ended June 30, 2016 the Honorable Supreme Court has passed a judgmenton 10th November 2016 declaring the insertion of amendments introduced in the FinanceActs 2006 and 2008 pertaining to Workers Welfare Fund (WWF) as unlawful and there bystriking down the amendments introduced through these Finance Acts. Subsequent to theperiod end a review petition has been filed in the Honorable Supreme Court against thejudgement. Therefore the Company as a matter of prudence has maintained theprovisions made.
estimates, assumptions and use judgments that affect the application of policies and reportedamounts of assets and liabilities and income and expenses. Estimates, assumptions andjudgments are continually evaluated and are based on historical experience and other factors,including reasonable expectations of future events. Revisions to accounting estimates arerecognised prospectively commencing from the period of revision. Judgments and estimatesmade by the management in the preparation of this condensed interim financial informationare the same as those that were applied to financial statements as at and for the year endedJune 30, 2016.
The Company's financial risk management objectives and policies are consistent with thosedisclosed in the financial statements as at and for the year ended June 30, 2016.
Un-Audited AuditedDecember June
2016 20166 Long term financing - Secured
Opening balance 5,118,004 3,121,740 Add: Obtained during the period / year 2,405,619 2,681,678 Less: Repaid during the period / year (420,879) (685,414)
7,102,744 5,118,004
Less: Current portion shown under current liabilities (780,930) (487,400) 6,321,814 4,630,604
7 CONTINGENCIES AND COMMITMENTS
Contingencies
-
Gurarantees
As of the balance sheet date;
(a)
(b)
Rupees in '000
The status of contingencies, as reported in the annual financial statements for the year ended June 30, 2016, except as statedbelow, remained unchanged during the current period.
Rs. 737 million (June 2016: Rs. 706 million) against guarantees issued by banks which are secured by pari passu hypothecationcharge over stores and spares, stock-in-trade, trade debts and other receivables. These guarantees includes guarantees issued byrelated party amounting to Rs. 668 million (June 2016: Rs. 638 million).
Post dated cheques Rs. 1,194 million (2016 : Rs. 1,000 million) are issued to Custom Authorities in respect of duties on imported items availed on the basis of consumption and export plans.
In the matter of Gas Infrastructure Development Cess (GIDC), as disclosed in note 12.7 of the financial statements for theyear ended June 30, 2016, the Honorable High Court of Sindh vide its judgment dated 26 October 2016 have held GIDC Act2015 ultra vires the Constitution. However the management on prudent basis has recognized the provision of Rs. 869.027million (June 30, 2016: Rs.584.934 million) under GIDC Act 2015.
Half Yearly Report (26)
(c) Bills discounted Rs. 3,237 million (June-2016: Rs. 2,267 million).
(d)
Commitments
(a) Group is committed for certain expenditures which are stated as follows:
Un-Audited AuditedDecember June
2016 2016
- Capital expenditure 436,380 2,103,004 - Non capital expenditure items under letters of credits 2,279,939 818,639
2,716,319 2,921,643
(b) The Group is committed for minimum rental payments for each of following period as follows:
Not more than one year 428,490 497,517 More than one year but not more than five years 1,607,190 1,670,611 More than five years 935,440 994,367
2,971,120 3,162,495
8 PROPERTY, PLANT AND EQUIPMENT
Operating assets - net book value 8.1 & 8.2 11,169,698 10,524,519 Capital work in progress - at cost 8.4 3,640,981 1,545,089
14,810,679 12,069,608
items availed on the basis of consumption and export plans.
Corporate guarantee of Rs. 87.357 million (2016: Rs. 93.365 million) has been issued to a bank by the Holding Company in favor ofan indirect subsidiary Company - GTM (Europe) Limited - UK. .
Rs. In '000
Un-Auditedfor the half year for the half year
December December2016 2015
8.1 Additions during the period
Buildings and structures on leasehold land 519,850 238,076 Plant and machinery 582,436 631,006 Furniture and fixtures 1,730 2,202 Office equipment 78,135 50,030 Vehicles 121,579 120,814
1,303,730 1,042,128
8.1.1
Un-Auditedfor the half year for the half year
December December2016 2015
8.2 Disposals - operating fixed assets (at net book value)
Plant and machinery 974 52,186 Furniture and fixtures - 1 Office equipment - 332 Vehicles 7,066 3,341
8,040 55,860
8.3 Depreciation charge during the period 650,511 510,999
8.4 Additions - capital work in progress (at cost)
Rs. In '000
Additions to building and structure on leasehold land, plant and machinery and others include transfers from capital work-in-progress amounting to Rs. 506 million, Rs. 520 million and Rs. 4.5 million (2015: Rs. 192 million, Rs.564 million and Rs. 14million).
Rs. In '000
Half Yearly Report (27)
8.4 Additions - capital work in progress (at cost)
Machinery 2,470,228 887,572 Building 651,383 353,100 Others 4,421 11,279
3,126,032 1,251,951
Note Un-Audited Auditedfor the half year June
December 2016
9 INTANGIBLE ASSETS
Intangible - net book value 9.1 & 9.2 18,888 20,492
Un-Auditedfor the half year for the half year
December December2016 2015
9.1 Additions - intangibles (at cost)Computer Software 1,985 9,783
9.2 Amortisation charge during the period 3,589 3,183
Un-AuditedDecember December
2016 2015
10 CASH AND CASH EQUIVALENTS
Cash and cash equivalents comprises of:
Cash and bank balances 262,637 145,388Short term borrowings (13,475,104) (11,894,418)
(13,212,467) (11,749,030)
11 TAXATIONProvision for current taxation has been made on the basis of final taxation in respect of exports and minimum / turnover tax net of available tax credits under the Income Tax Ordinance, 2001.
Rs. In '000
Rs. In '000
Rs. In '000
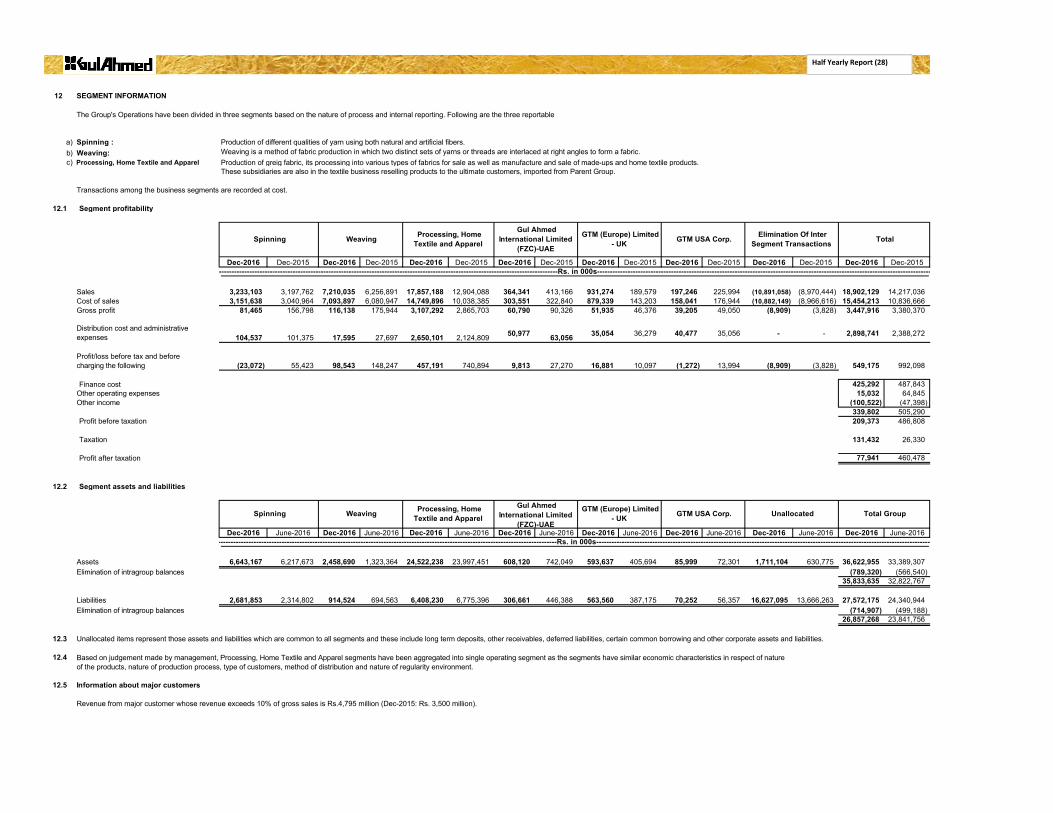
12 SEGMENT INFORMATION
a) Spinning : Production of different qualities of yarn using both natural and artificial fibers.b) Weaving:c) Production of greig fabric, its processing into various types of fabrics for sale as well as manufacture and sale of made-ups and home textile products.
These subsidiaries are also in the textile business reselling products to the ultimate customers, imported from Parent Group.
Transactions among the business segments are recorded at cost.
12.1 Segment profitability
Dec-2016 Dec-2015 Dec-2016 Dec-2015 Dec-2016 Dec-2015 Dec-2016 Dec-2015 Dec-2016 Dec-2015 Dec-2016 Dec-2015 Dec-2016 Dec-2015 Dec-2016 Dec-2015
Sales 3,233,103 3,197,762 7,210,035 6,256,891 17,857,188 12,904,088 364,341 413,166 931,274 189,579 197,246 225,994 (10,891,058) (8,970,444) 18,902,129 14,217,036Cost of sales 3,151,638 3,040,964 7,093,897 6,080,947 14,749,896 10,038,385 303,551 322,840 879,339 143,203 158,041 176,944 (10,882,149) (8,966,616) 15,454,213 10,836,666Gross profit 81,465 156,798 116,138 175,944 3,107,292 2,865,703 60,790 90,326 51,935 46,376 39,205 49,050 (8,909) (3,828) 3,447,916 3,380,370
Distribution cost and administrative expenses 104,537 101,375 17,595 27,697 2,650,101 2,124,809 50,977 63,056 35,054 36,279 40,477 35,056 - - 2,898,741 2,388,272
Profit/loss before tax and beforecharging the following (23,072) 55,423 98,543 148,247 457,191 740,894 9,813 27,270 16,881 10,097 (1,272) 13,994 (8,909) (3,828) 549,175 992,098
Finance cost 425,292 487,843 Other operating expenses 15,032 64,845 Other income (100,522) (47,398)
339,802 505,290 Profit before taxation 209,373 486,808
Taxation 131,432 26,330
Profit after taxation 77,941 460,478
12.2 Segment assets and liabilities
Dec-2016 June-2016 Dec-2016 June-2016 Dec-2016 June-2016 Dec-2016 June-2016 Dec-2016 June-2016 Dec-2016 June-2016 Dec-2016 June-2016 Dec-2016 June-2016
Assets 6,643,167 6,217,673 2,458,690 1,323,364 24,522,238 23,997,451 608,120 742,049 593,637 405,694 85,999 72,301 1,711,104 630,775 36,622,955 33,389,307Elimination of intragroup balances (789,320) (566,540)
35,833,635 32,822,767
Liabilities 2,681,853 2,314,802 914,524 694,563 6,408,230 6,775,396 306,661 446,388 563,560 387,175 70,252 56,357 16,627,095 13,666,263 27,572,175 24,340,944Elimination of intragroup balances (714,907) (499,188)
26,857,268 23,841,756
12.3 Unallocated items represent those assets and liabilities which are common to all segments and these include long term deposits, other receivables, deferred liabilities, certain common borrowing and other corporate assets and liabilities.
12.4
12.5 Information about major customers
Revenue from major customer whose revenue exceeds 10% of gross sales is Rs.4,795 million (Dec-2015: Rs. 3,500 million).
The Group's Operations have been divided in three segments based on the nature of process and internal reporting. Following are the three reportable
Processing, Home Textile and Apparel
Spinning Weaving Processing, Home Textile and Apparel
Gul Ahmed International Limited
(FZC)-UAE
Weaving is a method of fabric production in which two distinct sets of yarns or threads are interlaced at right angles to form a fabric.
Spinning Weaving Processing, Home Textile and Apparel
Gul Ahmed International Limited
(FZC)-UAE
Based on judgement made by management, Processing, Home Textile and Apparel segments have been aggregated into single operating segment as the segments have similar economic characteristics in respect of nature of the products, nature of production process, type of customers, method of distribution and nature of regularity environment.
GTM (Europe) Limited - UK GTM USA Corp. Elimination Of Inter
Segment Transactions Total
'-----------------------------------------------------------------------------------------------------------------------------------------------------------------Rs. in 000s-----------------------------------------------------------------------------------------------------------------------------------------------------------------
GTM (Europe) Limited - UK GTM USA Corp. Unallocated Total Group
-----------------------------------------------------------------------------------------------------------------------------------------------------------------Rs. in 000s-----------------------------------------------------------------------------------------------------------------------------------------------------------------
Half Yearly Report (28)
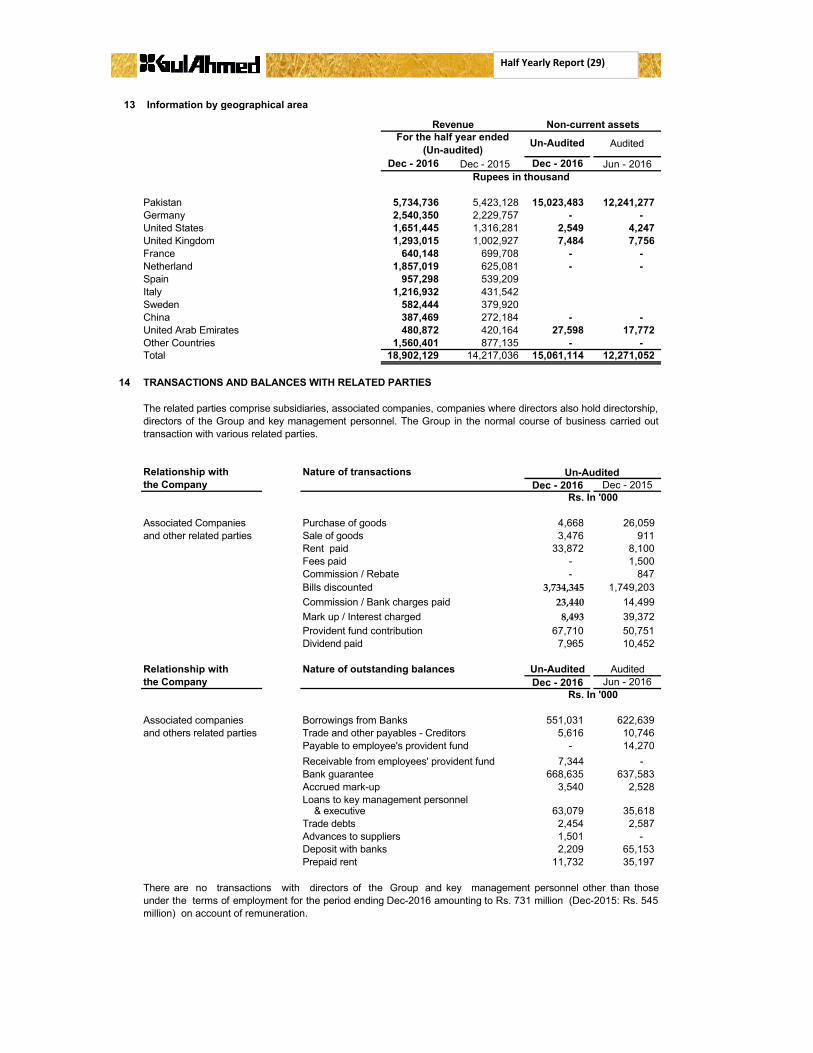
13 Information by geographical area
Dec - 2016 Dec - 2015 Dec - 2016 Jun - 2016
Pakistan 5,734,736 5,423,128 15,023,483 12,241,277Germany 2,540,350 2,229,757 - - United States 1,651,445 1,316,281 2,549 4,247 United Kingdom 1,293,015 1,002,927 7,484 7,756 France 640,148 699,708 - - Netherland 1,857,019 625,081 - - Spain 957,298 539,209 Italy 1,216,932 431,542 Sweden 582,444 379,920 China 387,469 272,184 - - United Arab Emirates 480,872 420,164 27,598 17,772 Other Countries 1,560,401 877,135 - - Total 18,902,129 14,217,036 15,061,114 12,271,052
14 TRANSACTIONS AND BALANCES WITH RELATED PARTIES
Relationship with Nature of transactions Un-Auditedthe Company Dec - 2016 Dec - 2015
Associated Companies Purchase of goods 4,668 26,059 and other related parties Sale of goods 3,476 911
Rent paid 33,872 8,100 Fees paid - 1,500 Commission / Rebate - 847 Bills discounted 3,734,345 1,749,203 Commission / Bank charges paid 23,440 14,499 Mark up / Interest charged 8,493 39,372 Provident fund contribution 67,710 50,751 Dividend paid 7,965 10,452
Relationship with Nature of outstanding balances Un-Audited Auditedthe Company Dec - 2016 Jun - 2016
Associated companies Borrowings from Banks 551,031 622,639 and others related parties Trade and other payables - Creditors 5,616 10,746
Payable to employee's provident fund - 14,270 Receivable from employees' provident fund 7,344 - Bank guarantee 668,635 637,583 Accrued mark-up 3,540 2,528 Loans to key management personnel
& executive 63,079 35,618 Trade debts 2,454 2,587Advances to suppliers 1,501 - Deposit with banks 2,209 65,153Prepaid rent 11,732 35,197
Rupees in thousand
Revenue Non-current assetsFor the half year ended
(Un-audited) Un-Audited Audited
The related parties comprise subsidiaries, associated companies, companies where directors also hold directorship,directors of the Group and key management personnel. The Group in the normal course of business carried outtransaction with various related parties.
Rs. In '000
There are no transactions with directors of the Group and key management personnel other than thoseunder the terms of employment for the period ending Dec-2016 amounting to Rs. 731 million (Dec-2015: Rs. 545million) on account of remuneration.
Rs. In '000
Half Yearly Report (29)
15 FAIR VALUES
- Level 1
- Level 2
- Level 3
16 DATE OF AUTHORISATION
17 GENERAL
17.1
17.2 Figures have been rounded off to the nearest thousand rupees.
MOHOMED BASHIRChairman
The Company while assessing fair values uses valuation techniques that are appropriate in the circumstancesusing relevant observable data as far as possible and minimizing the use of unobservable inputs. Fair values arecategorized into following three levels based on the input used in the valuation techniques;
Fair value is the price that would be received to sell an asset or paid to transfer a liability in an orderly transaction in
the principal (or most advantageous) market at the measurement date under current market conditions (i.e. an exit
price) regardless of whether that price is directly observable or estimated using another valuation technique.
These financial statements were authorised for issue on February 28, 2017 by the Board of Directors of the Group.
Allocations for the workers' profit participation fund, workers' welfare fund and taxation are provisional and finalliability including liability for deferred taxation will be determined on the basis of annual results.
MOHAMMED ZAKI BASHIRChief Executive Officer
Quoted prices in active markets for identical assets or liabilities that can be assessed at measurement.
Inputs other than quoted prices included within level 1 that are observable for the asset
or liability, either directly (that is, as prices) or indirectly (that is, derived from prices).
Inputs are unobservable inputs for the asset or liability Inputs for the asset or liability that are not based on observable market data (that is, unobservable inputs).
Half Yearly Report (30)