Embed Size (px)
Citation preview
Company Overview December 2017
Forward-Looking Statements
This presentation contains forward-looking statements within the meaning of Section 27A of the Securities Act of 1933 and Section 21E of theSecurities Exchange Act of 1934. All statements, other than statements of historical facts, included in this presentation that address activities, eventsor developments that Antero Resources Corporation and its subsidiaries (collectively, the “Company” or “Antero”) expects, believes or anticipates willor may occur in the future are forward-looking statements. The words “believe,” “expect,” “anticipate,” “plan,” “intend,” “estimate,” “project,” “foresee,”“should,” “would,” “could,” or other similar expressions are intended to identify forward-looking statements. However, the absence of these wordsdoes not mean that the statements are not forward-looking. Without limiting the generality of the foregoing, forward-looking statements contained inthis presentation specifically include estimates of the Company’s reserves, expectations of plans, strategies, objectives and anticipated financial andoperating results of the Company, including as to the Company’s drilling program, production, hedging activities, capital expenditure levels and otherguidance included in this presentation. These statements are based on certain assumptions made by the Company based on management’sexperience and perception of historical trends, current conditions, anticipated future developments and other factors believed to be appropriate. Suchstatements are subject to a number of assumptions, risks and uncertainties, many of which are beyond the control of the Company, which may causeactual results to differ materially from those implied or expressed by the forward-looking statements. These include the factors discussed orreferenced under the heading “Item 1A. Risk Factors” in our Annual Report on Form 10-K for the year ended December 31, 2016 and in theCompany’s subsequent filings with the SEC.
The Company cautions you that these forward-looking statements are subject to all of the risks and uncertainties, most of which are difficult to predictand many of which are beyond our control, incident to the exploration for and development, production, gathering and sale of natural gas and oil.These risks include, but are not limited to, commodity price volatility, inflation, lack of availability of drilling and production equipment and services,environmental risks, drilling and other operating risks, regulatory changes, the uncertainty inherent in estimating natural gas and oil reserves and inprojecting future rates of production, cash flow and access to capital, the timing of development expenditures, and the other risks described under theheading “Risk Factors” in our Annual Report on Form 10-K for the year ended December 31, 2016 and in the Company’s subsequent filings with theSEC.
Any forward-looking statement speaks only as of the date on which such statement is made and the Company undertakes no obligation to correct orupdate any forward-looking statement, whether as a result of new information, future events or otherwise, except as required by applicable law.
1
Antero Resources Corporation is denoted as “AR” in the presentation, Antero Midstream Partners LP is denotedas “AM” and Antero Midstream GP LP is denoted as “AMGP”, which are their respective
New York Stock Exchange ticker symbols.

2
Market Cap(1)……….……....
Enterprise Value(2)…......…...
Corporate Debt Ratings……
Stand-alone Leverage(3)
Net Production (3Q 2017)…
Liquids(4).....................
3P Reserves(5)………..…....
Net Acres(6)………….…...…
Midstream Ownership(7)
1. Based on market capitalization as of 9/30/2017.2. Market capitalization plus net debt on a stand-alone basis as of 9/30/2017. 3. Stand-alone net debt to latest twelve months EBITDAX as of 9/30/2017. 4. Oil plus NGLs.5. 3P reserves as of 6/30/2017, assuming 28% ethane recovery, of which 96% represent 2P reserves. 6. Net acres as of 9/30/2017.7. Market value of AR’s 53% ownership of Antero Midstream Partners (NYSE: AM) as of 9/30/2017.
$6.3 billion
$9.7 billion
Ba2 / BB
2.6x
2,317 MMcfe/d
112,000 Bbl/d
53.0 Tcfe
636,000
$3.1 billion
Antero Profile
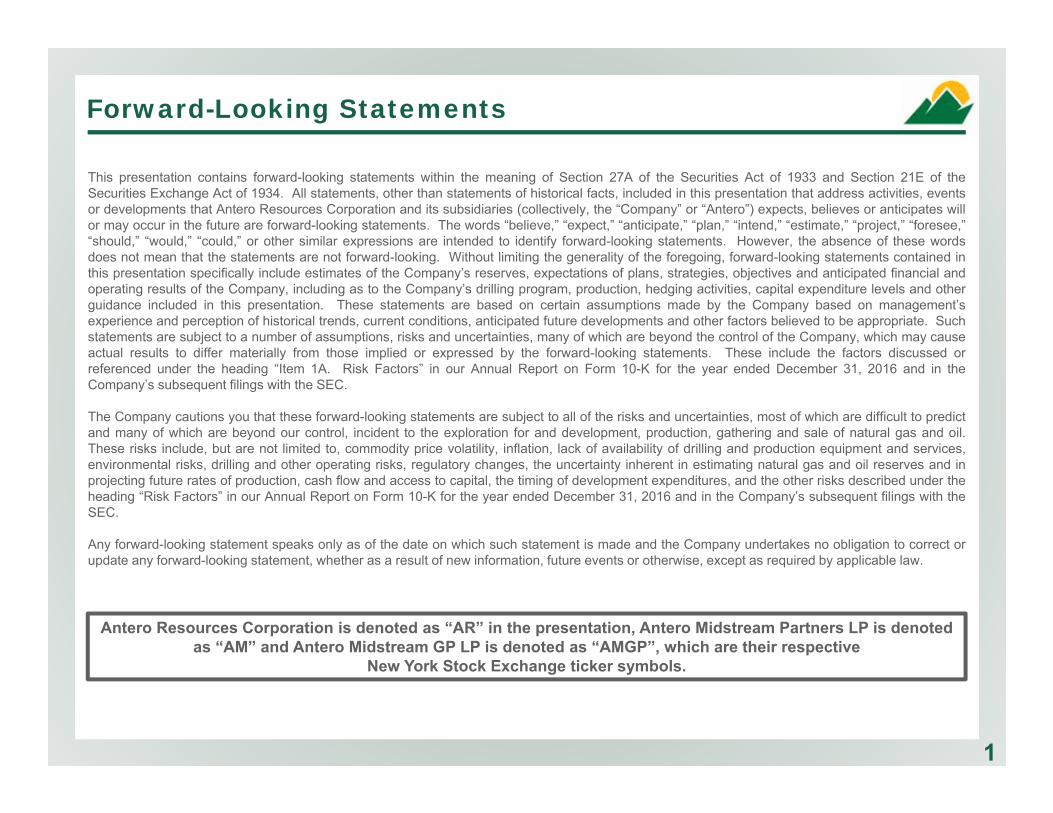
Antero’s Core Business Strategy
3
Develop World Class Resource Over the Long Term
• Run by co-founders and management with significant ownership• Forward thinking with industry leading hedge and firm transportation portfolio designed to
reduce price volatility and facilitate consistent, repeatable asset development• Expand core inventory opportunistically through grass roots leasing and acquisitions
Generate High Margin Cash Flow
• Disciplined capital investment driven by single well but also corporate-wide returns• Focus on liquids-rich inventory in the lowest cost U.S. shale basins• Continuous focus on efficiency gains through reduced cycle times and long laterals
Maintain a Strong and Flexible Stand-alone Balance Sheet• Fund drilling and completion capital with discretionary cash flow• Target leverage in the low to mid 2x range• Create optionality to return capital to shareholders
Capture the Energy Value Chain• Continue to build the most integrated natural gas and NGL story in the U.S.• Significant value, visibility and opportunity in integrated operations and 53% midstream
ownership (NYSE: AM)
1
2
3
4
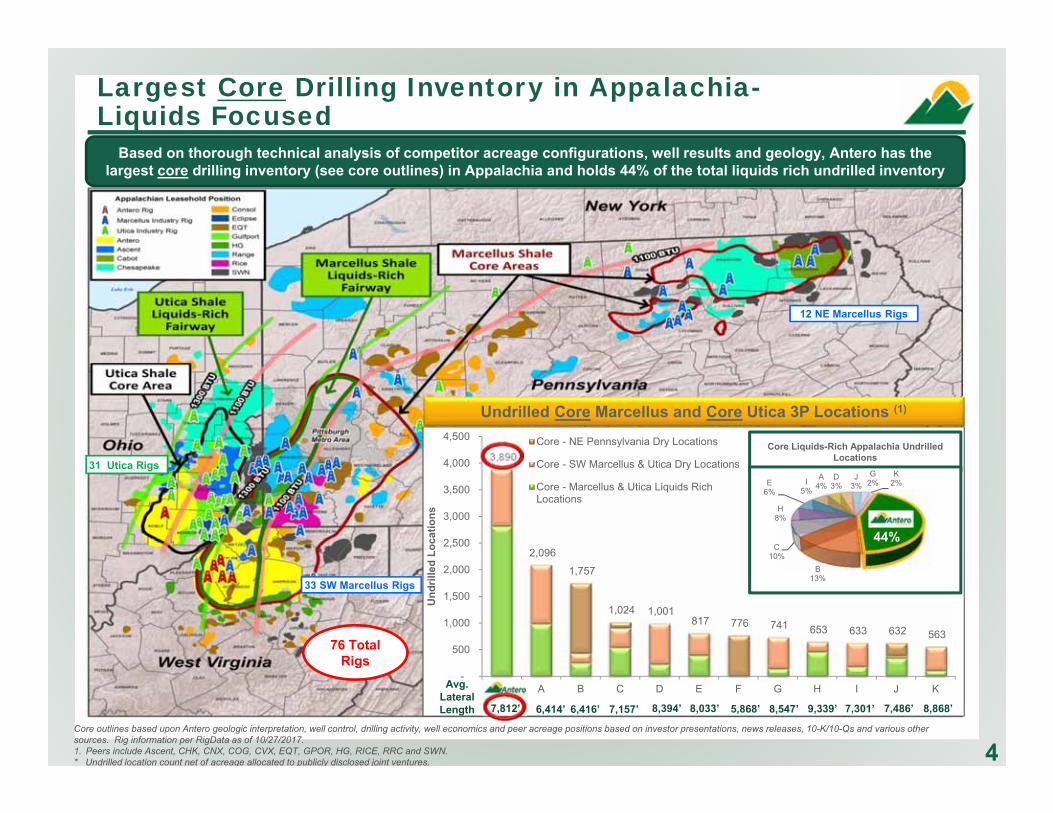
3,890
2,096
1,757
1,024 1,001 817 776 741 653 633 632 563
-
500
1,000
1,500
2,000
2,500
3,000
3,500
4,000
4,500
AR A B C D E F G H I J K
Und
rille
d Lo
catio
nsCore - NE Pennsylvania Dry Locations
Core - SW Marcellus & Utica Dry Locations
Core - Marcellus & Utica Liquids RichLocations
Core Liquids-Rich Appalachia Undrilled Locations
AR44%
B13%
C10%
H8%
E6%
I5%
A4%
D3%
J3%
G2%
K2%
Core outlines based upon Antero geologic interpretation, well control, drilling activity, well economics and peer acreage positions based on investor presentations, news releases, 10-K/10-Qs and various other sources. Rig information per RigData as of 10/27/2017. 1. Peers include Ascent, CHK, CNX, COG, CVX, EQT, GPOR, HG, RICE, RRC and SWN.* Undrilled location count net of acreage allocated to publicly disclosed joint ventures.
Based on thorough technical analysis of competitor acreage configurations, well results and geology, Antero has the largest core drilling inventory (see core outlines) in Appalachia and holds 44% of the total liquids rich undrilled inventory
33 SW Marcellus Rigs
31 Utica Rigs
12 NE Marcellus Rigs
76 Total Rigs
4
Largest Core Drilling Inventory in Appalachia-Liquids Focused
Undrilled Core Marcellus and Core Utica 3P Locations (1)
Avg. Lateral Length 6,414’ 6,416’ 8,394’ 5,868’ 8,547’ 9,339’ 7,486’7,301’ 8,868’7,157’ 8,033’7,812’
Capital Efficiencies and Cash Flow Growth Result in Free Cash Flow and Declining Leverage Through 2020(1)
3
Market Leading Exposure to NGL Prices and Production Growth1
Antero Investment Highlights
5
Maximizing Financial Returns with Enhanced Completions and Long Laterals
2
Midstream Ownership and Integration Delivers Tremendous Value to Antero Shareholders
4
1. Assuming flat $3.00 NYMEX gas and $54 WTI oil through 2020.
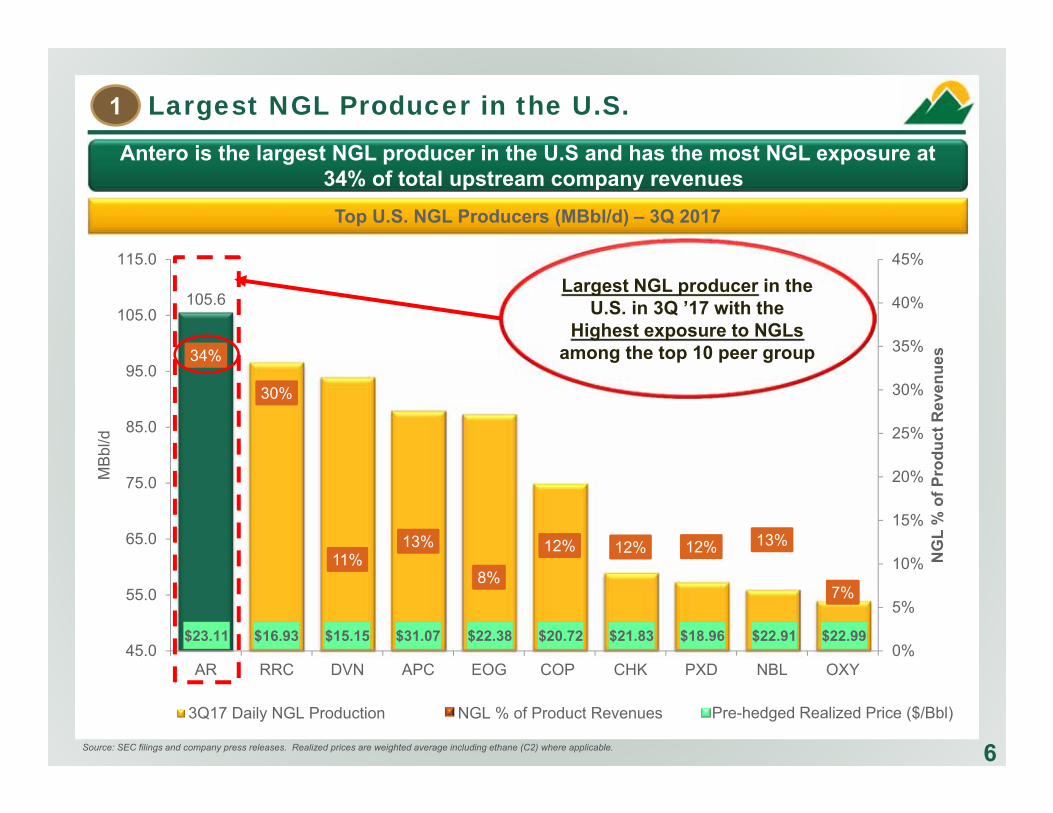
105.6
34%
30%
11%13%
8%
12% 12% 12% 13%
7%
0%
5%
10%
15%
20%
25%
30%
35%
40%
45%
45.0
55.0
65.0
75.0
85.0
95.0
105.0
115.0
AR RRC DVN APC EOG COP CHK PXD NBL OXY
NG
L %
of P
rodu
ct R
even
ues
MBb
l/d
3Q17 Daily NGL Production NGL % of Product Revenues
Largest NGL Producer in the U.S.
6Source: SEC filings and company press releases. Realized prices are weighted average including ethane (C2) where applicable.
Antero is the largest NGL producer in the U.S and has the most NGL exposure at 34% of total upstream company revenues
Top U.S. NGL Producers (MBbl/d) – 3Q 2017
Largest NGL producer in the U.S. in 3Q ’17 with the
Highest exposure to NGLsamong the top 10 peer group
$23.11
Pre-hedged Realized Price ($/Bbl)
$16.93 $15.15 $31.07 $22.38 $20.72 $21.83 $18.96 $22.91 $22.99
1
0
20,000
40,000
60,000
80,000
100,000
120,000
Jan Feb Mar Apr May Jun Jul Aug Sep Oct Nov Dec
MB
bls
2015 2016 2017
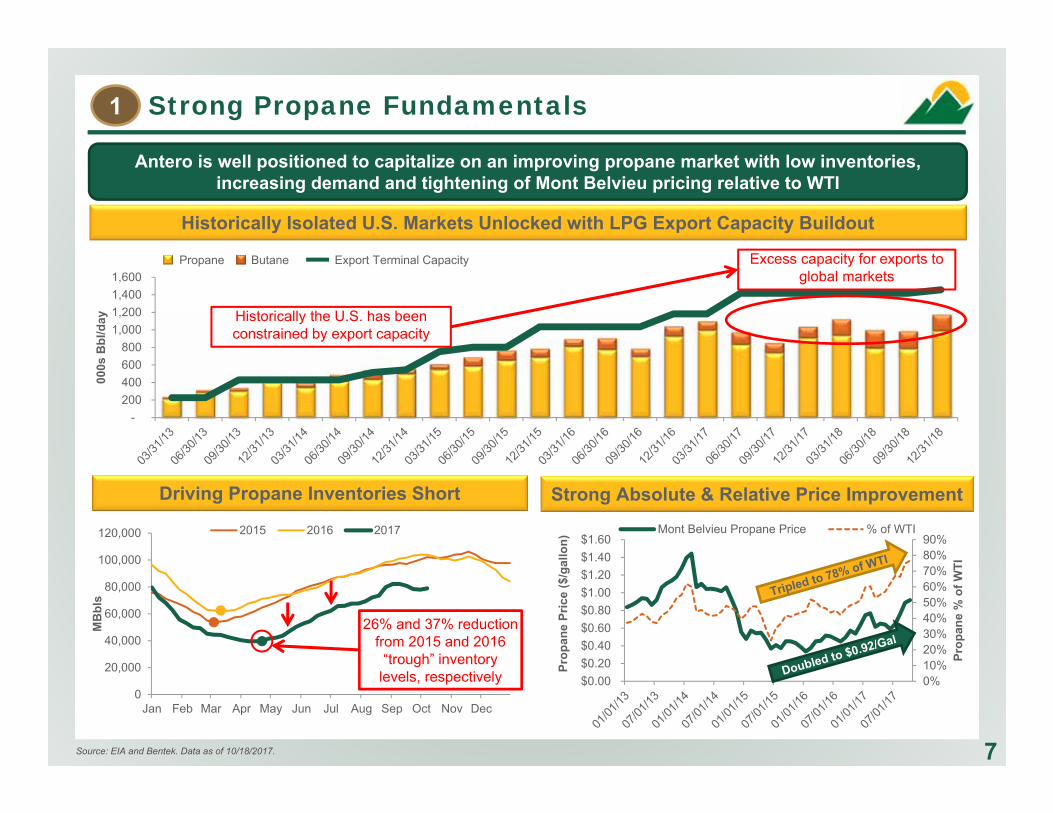
Source: EIA and Bentek. Data as of 10/18/2017.
Antero is well positioned to capitalize on an improving propane market with low inventories, increasing demand and tightening of Mont Belvieu pricing relative to WTI
7
Historically Isolated U.S. Markets Unlocked with LPG Export Capacity Buildout
Strong Absolute & Relative Price ImprovementDriving Propane Inventories Short
26% and 37% reduction from 2015 and 2016
“trough” inventory levels, respectively
Strong Propane Fundamentals1
- 200 400 600 800
1,000 1,200 1,400 1,600
000s
Bbl
/day Historically the U.S. has been
constrained by export capacity
Excess capacity for exports to global markets
0%10%20%30%40%50%60%70%80%90%
$0.00$0.20$0.40$0.60$0.80$1.00$1.20$1.40$1.60
Prop
ane
% o
f WTI
Prop
ane
Pric
e ($
/gal
lon)
Mont Belvieu Propane Price % of WTI
Propane Butane Export Terminal Capacity
9.4
11.0
-
2.0
4.0
6.0
8.0
10.0
12.0
Asia Europe Latin AmericaNorth America Middle East AfricaOther
8
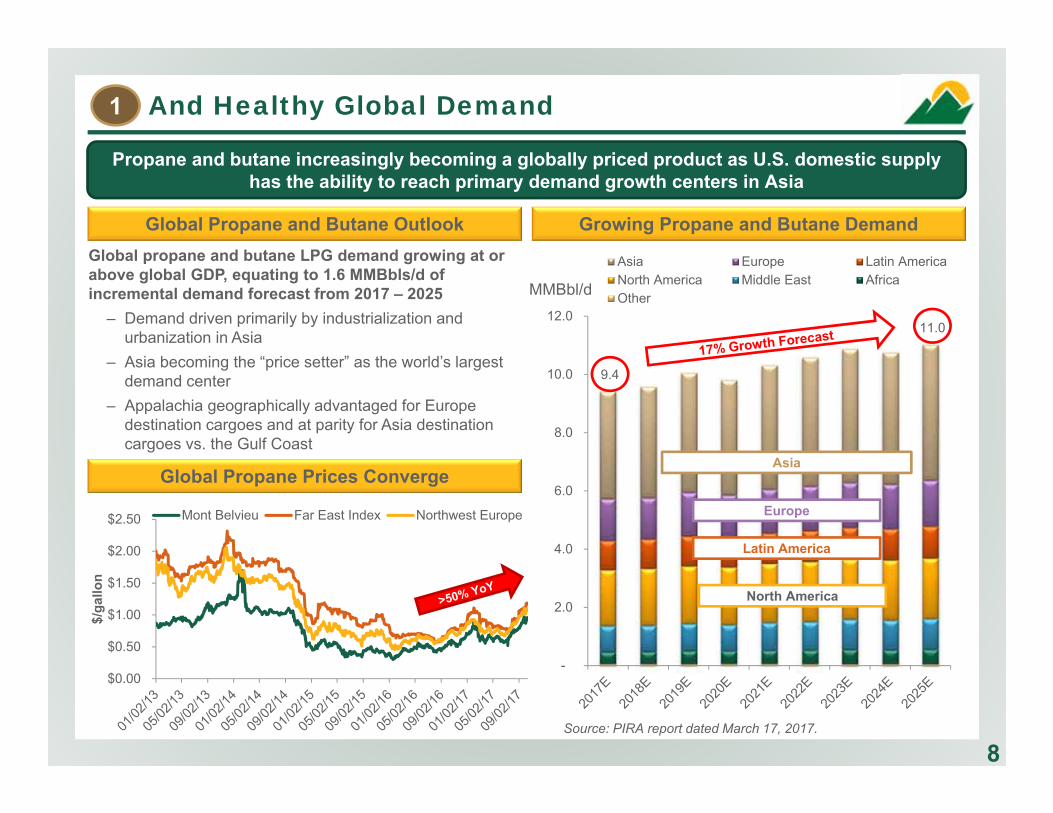
Propane and butane increasingly becoming a globally priced product as U.S. domestic supply has the ability to reach primary demand growth centers in Asia
Global Propane and Butane Outlook Growing Propane and Butane Demand
Source: PIRA report dated March 17, 2017.
And Healthy Global Demand1
Global propane and butane LPG demand growing at or above global GDP, equating to 1.6 MMBbls/d of incremental demand forecast from 2017 – 2025
‒ Demand driven primarily by industrialization and urbanization in Asia
‒ Asia becoming the “price setter” as the world’s largest demand center
‒ Appalachia geographically advantaged for Europe destination cargoes and at parity for Asia destination cargoes vs. the Gulf Coast
MMBbl/d
Global Propane Prices Converge
$0.00
$0.50
$1.00
$1.50
$2.00
$2.50
$/ga
llon
Mont Belvieu Far East Index Northwest Europe
Asia
Europe
Latin America
North America
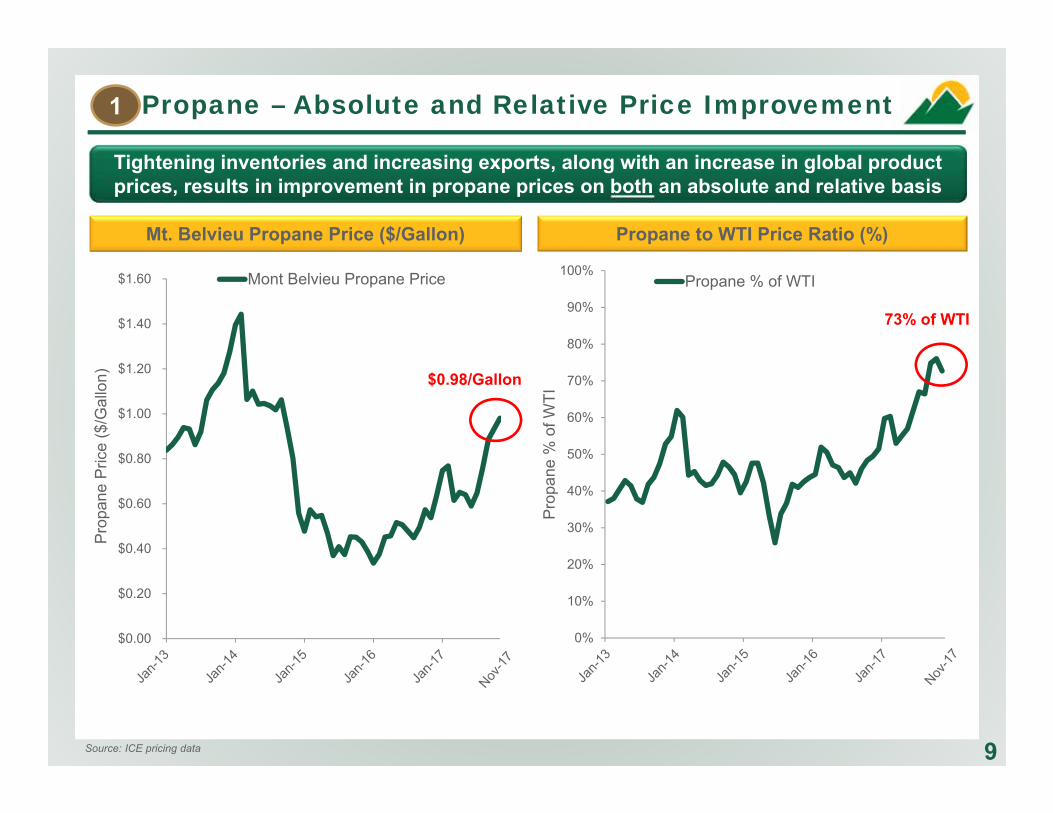
Tightening inventories and increasing exports, along with an increase in global product prices, results in improvement in propane prices on both an absolute and relative basis
9
Propane to WTI Price Ratio (%)Mt. Belvieu Propane Price ($/Gallon)
Propane – Absolute and Relative Price Improvement
$0.00
$0.20
$0.40
$0.60
$0.80
$1.00
$1.20
$1.40
$1.60
Prop
ane
Pric
e ($
/Gal
lon)
Mont Belvieu Propane Price
0%
10%
20%
30%
40%
50%
60%
70%
80%
90%
100%
Prop
ane
% o
f WTI
Propane % of WTI
$0.98/Gallon
73% of WTI
Source: ICE pricing data
1
0
25,000
50,000
75,000
100,000
125,000
150,000
175,000
2014 2015 2016 2017EGuidance
2018ETarget
2019ETarget
2020ETarget
1. Excludes condensate. 2. Based on Antero NGL production targets from 2018 to 2020.
Total(Bbl/d)
C5+
iC4
nC4
C3C2
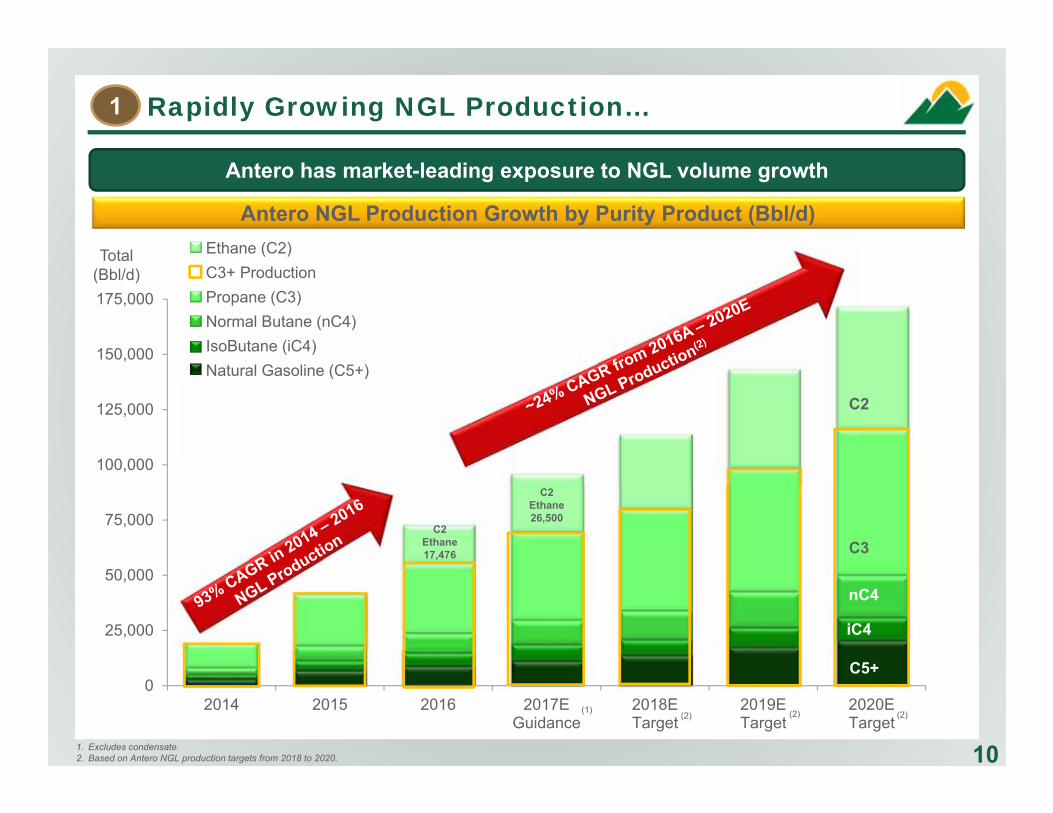
Ethane17,476
C2Ethane26,500
Antero NGL Production Growth by Purity Product (Bbl/d)
Antero has market-leading exposure to NGL volume growth
10
Ethane (C2)C3+ ProductionPropane (C3)Normal Butane (nC4)IsoButane (iC4)Natural Gasoline (C5+)
C2
Rapidly Growing NGL Production…1
(2) (2) (2)(1)
11
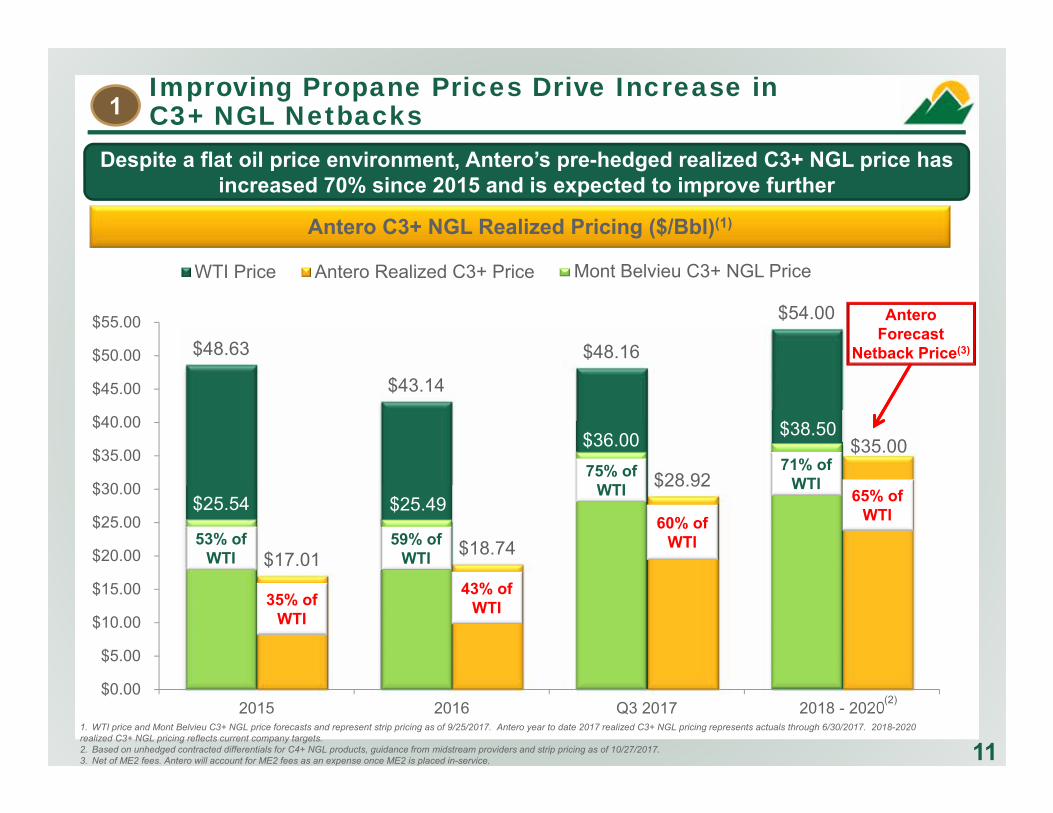
Despite a flat oil price environment, Antero’s pre-hedged realized C3+ NGL price has increased 70% since 2015 and is expected to improve further
Antero C3+ NGL Realized Pricing ($/Bbl)(1)
1. WTI price and Mont Belvieu C3+ NGL price forecasts and represent strip pricing as of 9/25/2017. Antero year to date 2017 realized C3+ NGL pricing represents actuals through 6/30/2017. 2018-2020 realized C3+ NGL pricing reflects current company targets.2. Based on unhedged contracted differentials for C4+ NGL products, guidance from midstream providers and strip pricing as of 10/27/2017.3. Net of ME2 fees. Antero will account for ME2 fees as an expense once ME2 is placed in-service.
Improving Propane Prices Drive Increase in C3+ NGL Netbacks
$48.63
$43.14
$48.16
$54.00
$17.01 $18.74
$28.92
$35.00
$0.00
$5.00
$10.00
$15.00
$20.00
$25.00
$30.00
$35.00
$40.00
$45.00
$50.00
$55.00
2015 2016 Q3 2017 2018 - 2020
WTI Price Antero Realized C3+ Price Mont Belvieu C3+ NGL Price
$25.49
$36.00 $38.50
35% of WTI
43% of WTI
60% of WTI
65% of WTI
53% of WTI
59% of WTI
75% of WTI
71% of WTI
$25.54
AnteroForecast
Netback Price(3)
(2)
1
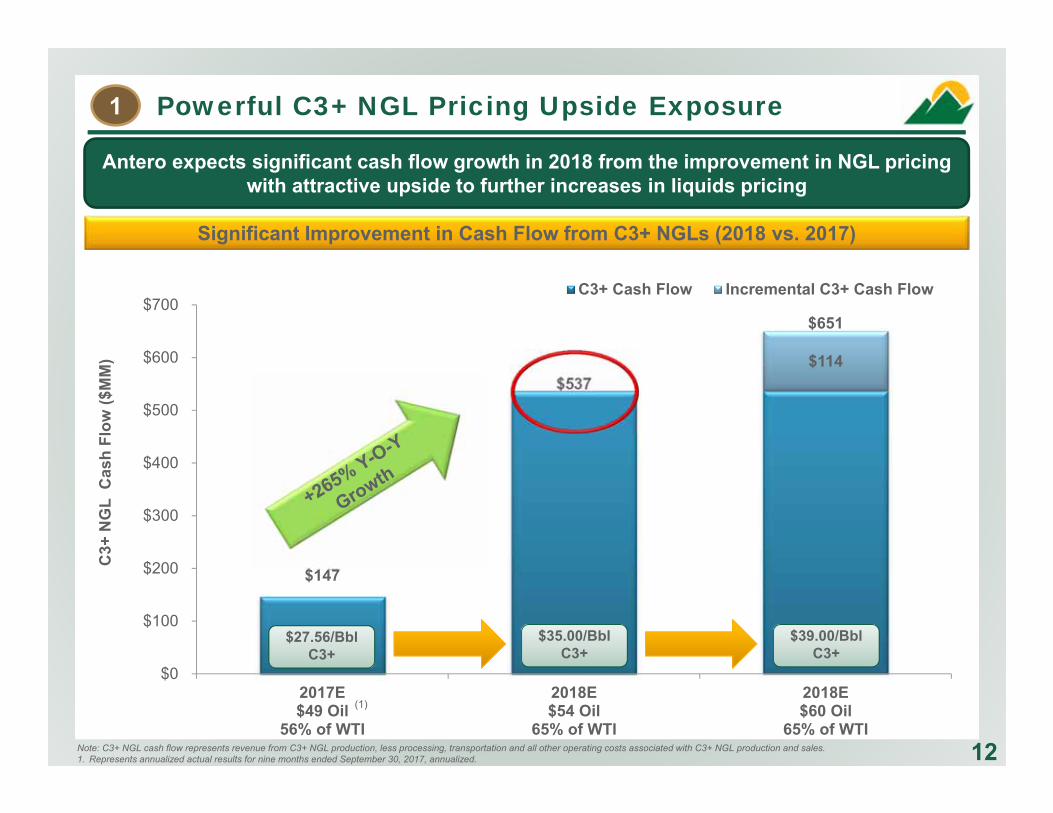
$147
$537
$651
$114
$0
$100
$200
$300
$400
$500
$600
$700
2017E$49 Oil
56% of WTI
2018E$54 Oil
65% of WTI
2018E$60 Oil
65% of WTI
C3+ Cash Flow Incremental C3+ Cash Flow
12
Antero expects significant cash flow growth in 2018 from the improvement in NGL pricing with attractive upside to further increases in liquids pricing
Significant Improvement in Cash Flow from C3+ NGLs (2018 vs. 2017)
Note: C3+ NGL cash flow represents revenue from C3+ NGL production, less processing, transportation and all other operating costs associated with C3+ NGL production and sales.1. Represents annualized actual results for nine months ended September 30, 2017, annualized.
C3+
NG
L C
ash
Flow
($M
M)
Powerful C3+ NGL Pricing Upside Exposure1
$39.00/BblC3+
$35.00/BblC3+
$27.56/BblC3+
(1)
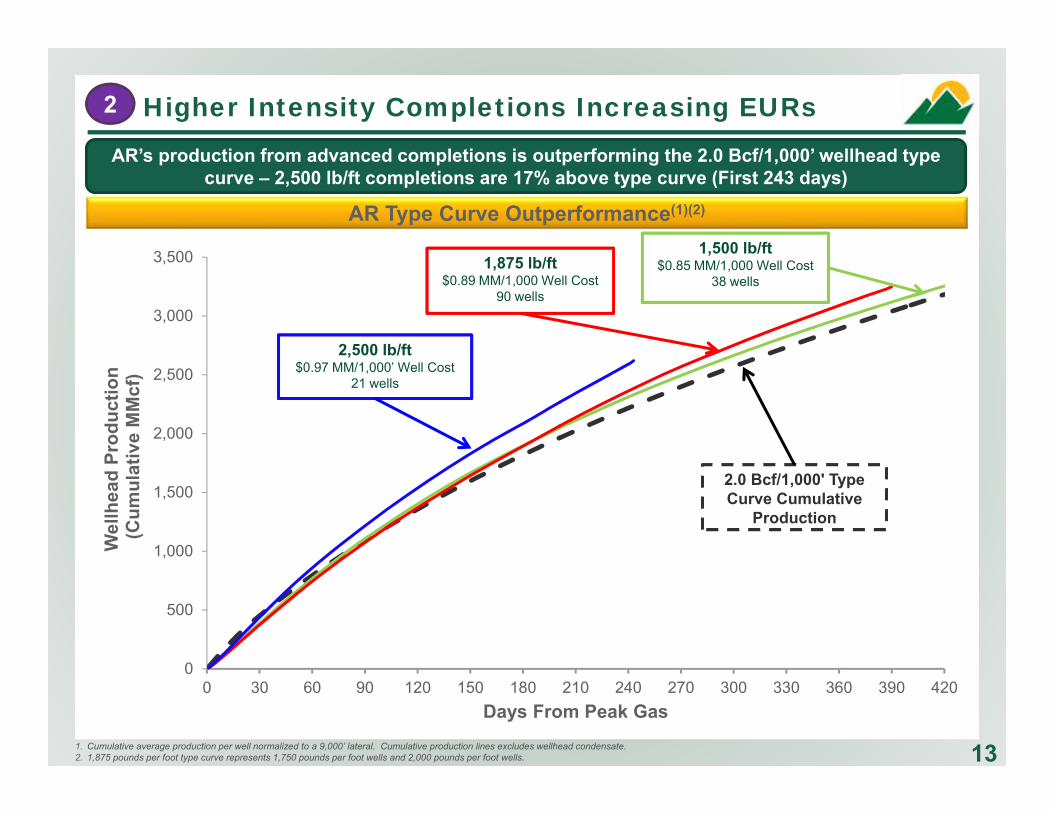
0
500
1,000
1,500
2,000
2,500
3,000
3,500
0 30 60 90 120 150 180 210 240 270 300 330 360 390 420
Wel
lhea
d Pr
oduc
tion
(Cum
ulat
ive
MM
cf)
Days From Peak Gas
Higher Intensity Completions Increasing EURsAR’s production from advanced completions is outperforming the 2.0 Bcf/1,000’ wellhead type
curve – 2,500 lb/ft completions are 17% above type curve (First 243 days)
1. Cumulative average production per well normalized to a 9,000’ lateral. Cumulative production lines excludes wellhead condensate.2. 1,875 pounds per foot type curve represents 1,750 pounds per foot wells and 2,000 pounds per foot wells. 13
AR Type Curve Outperformance(1)(2)
1,500 lb/ft$0.85 MM/1,000 Well Cost
38 wells1,875 lb/ft
$0.89 MM/1,000 Well Cost90 wells
2,500 lb/ft$0.97 MM/1,000’ Well Cost
21 wells
2.0 Bcf/1,000' Type Curve Cumulative
Production
2
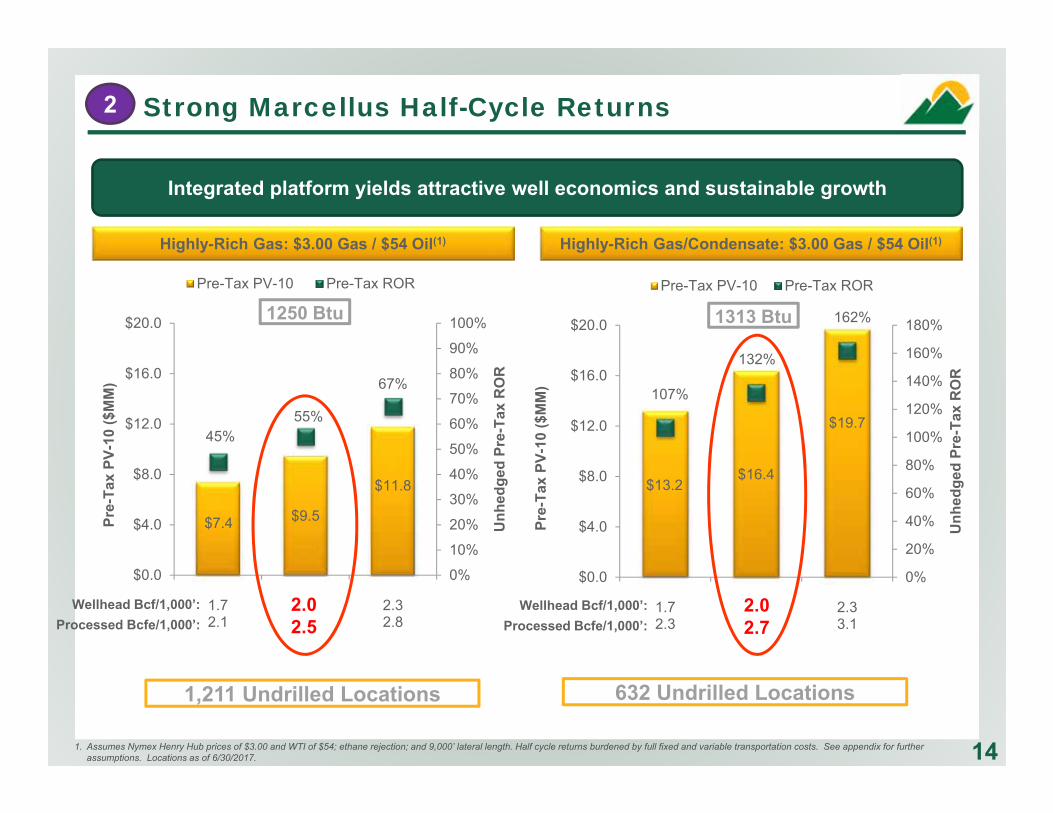
141. Assumes Nymex Henry Hub prices of $3.00 and WTI of $54; ethane rejection; and 9,000’ lateral length. Half cycle returns burdened by full fixed and variable transportation costs. See appendix for further assumptions. Locations as of 6/30/2017.
Integrated platform yields attractive well economics and sustainable growth
$13.2$16.4
$19.7
107%
132%
162%
0%
20%
40%
60%
80%
100%
120%
140%
160%
180%
$0.0
$4.0
$8.0
$12.0
$16.0
$20.0
1.72.3
2.02.7
2.33.1
Unh
edge
d Pr
e-Ta
x R
OR
Pre-
Tax
PV-1
0 ($
MM
)
Pre-Tax PV-10 Pre-Tax ROR
Highly-Rich Gas/Condensate: $3.00 Gas / $54 Oil(1)
Wellhead Bcf/1,000’:Processed Bcfe/1,000’:
2.02.7
632 Undrilled Locations
1313 Btu
$7.4 $9.5
$11.8
45%55%
67%
0%
10%
20%
30%
40%
50%
60%
70%
80%
90%
100%
$0.0
$4.0
$8.0
$12.0
$16.0
$20.0
1.72.1
2.02.5
2.32.8
Unh
edge
d Pr
e-Ta
x R
OR
Pre-
Tax
PV-1
0 ($
MM
)
Pre-Tax PV-10 Pre-Tax ROR
2.02.5
Wellhead Bcf/1,000’:Processed Bcfe/1,000’:
Highly-Rich Gas: $3.00 Gas / $54 Oil(1)
1,211 Undrilled Locations
1250 Btu
2 Strong Marcellus Half-Cycle Returns
6,000 Foot Lateral 9,000 Foot Lateral
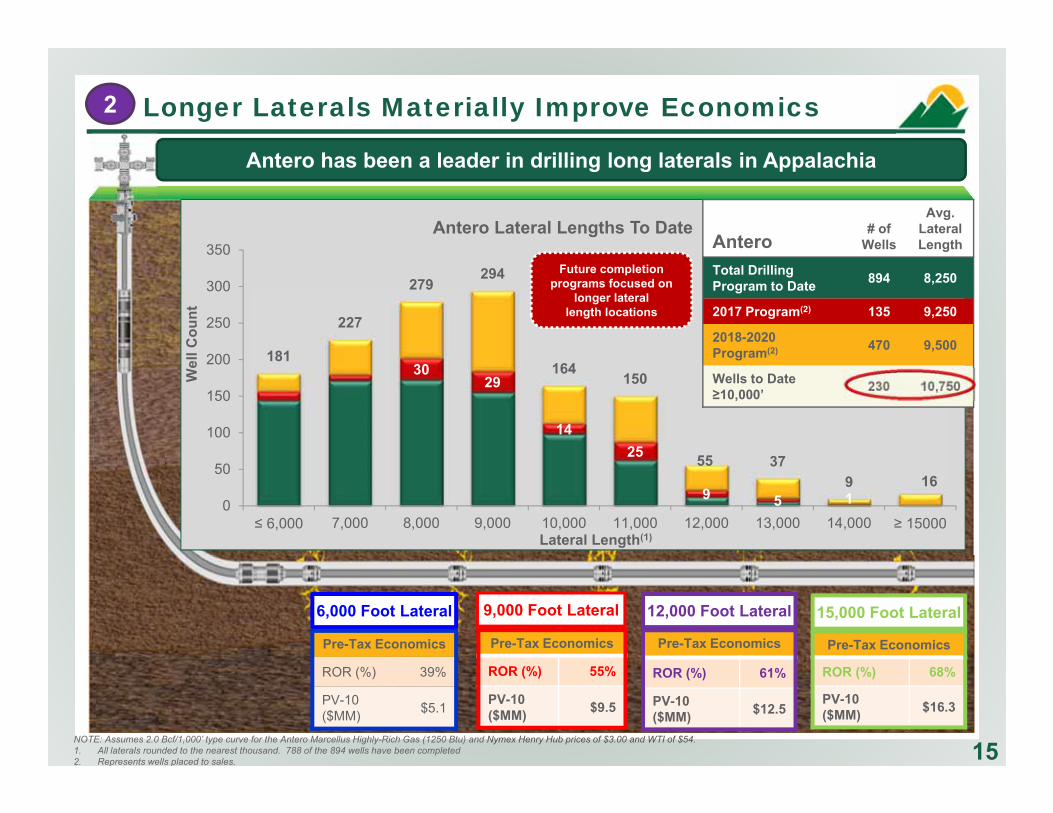
NOTE: Assumes 2.0 Bcf/1,000’ type curve for the Antero Marcellus Highly-Rich Gas (1250 Btu) and Nymex Henry Hub prices of $3.00 and WTI of $54.1. All laterals rounded to the nearest thousand. 788 of the 894 wells have been completed2. Represents wells placed to sales.
Antero has been a leader in drilling long laterals in Appalachia
12,000 Foot Lateral
Pre-Tax Economics
ROR (%) 39%
PV-10 ($MM) $5.1
Pre-Tax Economics
ROR (%) 55%
PV-10 ($MM) $9.5
Pre-Tax Economics
ROR (%) 61%
PV-10 ($MM) $12.5
3029
1425
9 5 1
181
227
279294
164 150
55 379 16
0
50
100
150
200
250
300
350
≤ 6,000 7,000 8,000 9,000 10,000 11,000 12,000 13,000 14,000 ≥ 15000
Wel
l Cou
nt
Lateral Length(1)
Antero Lateral Lengths To Date
15
Antero# of
Wells
Avg. Lateral Length
Total DrillingProgram to Date 894 8,250
2017 Program(2) 135 9,250
2018-2020 Program(2) 470 9,500
Wells to Date ≥10,000’ 230 10,750
Longer Laterals Materially Improve Economics2
15,000 Foot Lateral
Pre-Tax Economics
ROR (%) 68%
PV-10 ($MM) $16.3
Future completion programs focused on
longer lateral length locations
16
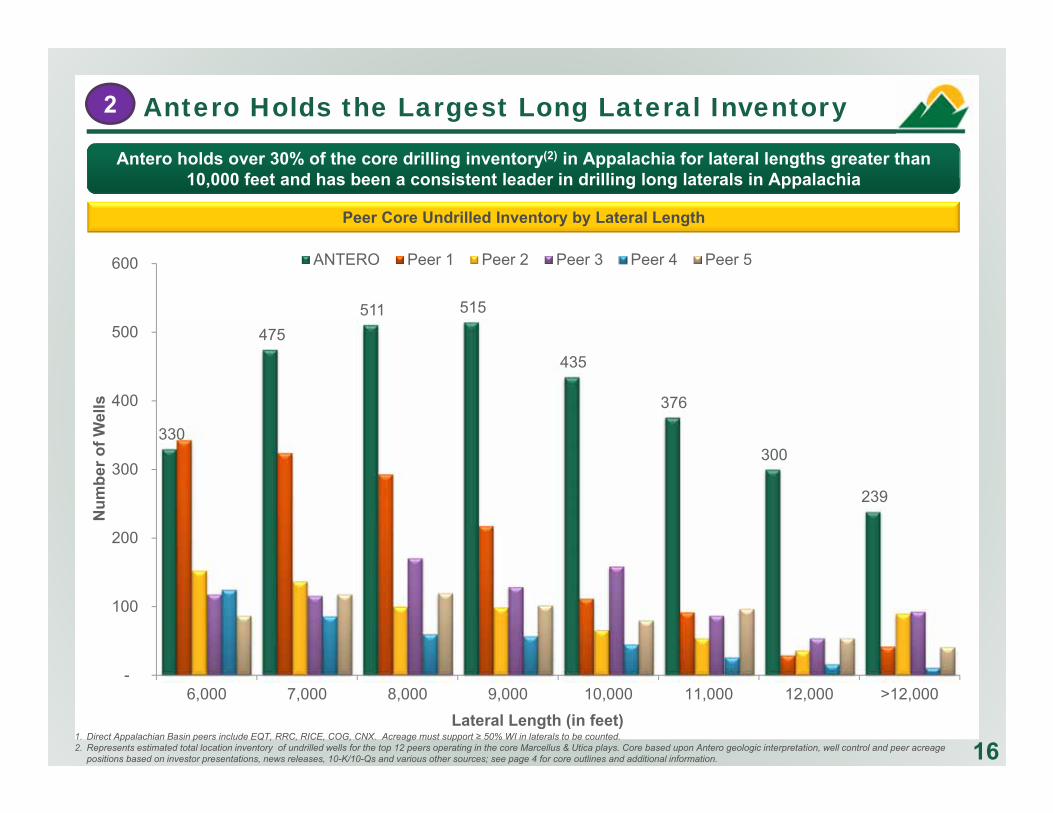
Antero holds over 30% of the core drilling inventory(2) in Appalachia for lateral lengths greater than 10,000 feet and has been a consistent leader in drilling long laterals in Appalachia
1. Direct Appalachian Basin peers include EQT, RRC, RICE, COG, CNX. Acreage must support ≥ 50% WI in laterals to be counted.2. Represents estimated total location inventory of undrilled wells for the top 12 peers operating in the core Marcellus & Utica plays. Core based upon Antero geologic interpretation, well control and peer acreage
positions based on investor presentations, news releases, 10-K/10-Qs and various other sources; see page 4 for core outlines and additional information.
Antero Holds the Largest Long Lateral Inventory2
330
475 511 515
435
376
300
239
-
100
200
300
400
500
600
6,000 7,000 8,000 9,000 10,000 11,000 12,000 >12,000
Num
ber o
f Wel
ls
Lateral Length (in feet)
ANTERO Peer 1 Peer 2 Peer 3 Peer 4 Peer 5
Peer Core Undrilled Inventory by Lateral Length
$3.64
$3.91
$3.70 $3.63
$3.31$3.16
$2.91
$3.50 $3.50 $3.25
$3.00 $3.00
$2.00
$3.00
$4.00
0
400
800
1,200
1,600
2,000
2,400
2017 2018 2019 2020 2021 2022 2023
BBtu/d $/Mcf
171. AR stand-alone LTM EBITDAX includes $127 million in distributions from AR’s ownership of AM common units.2. Nymex strip pricing as of 9/30/2017.
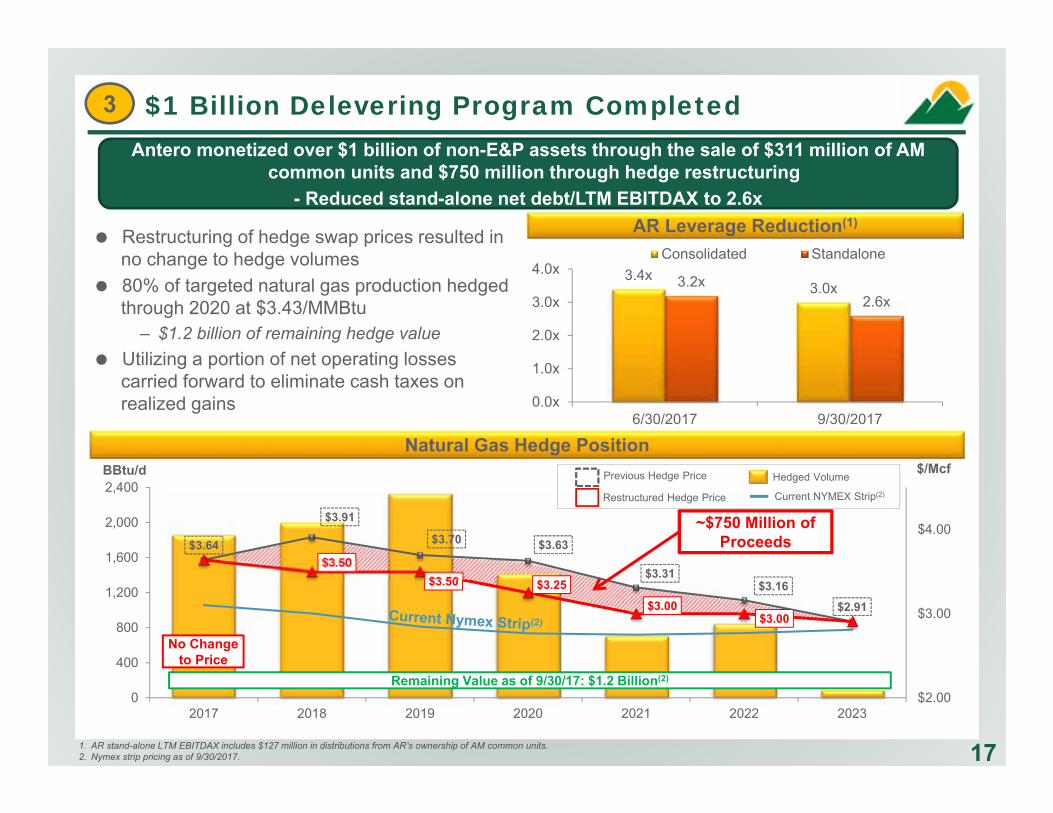
$1 Billion Delevering Program Completed
AR Leverage Reduction(1) Restructuring of hedge swap prices resulted in
no change to hedge volumes 80% of targeted natural gas production hedged
through 2020 at $3.43/MMBtu– $1.2 billion of remaining hedge value
Utilizing a portion of net operating losses carried forward to eliminate cash taxes on realized gains
Antero monetized over $1 billion of non-E&P assets through the sale of $311 million of AM common units and $750 million through hedge restructuring
- Reduced stand-alone net debt/LTM EBITDAX to 2.6x
Hedged Volume
Current NYMEX Strip(2)
Natural Gas Hedge Position
Restructured Hedge Price
Previous Hedge Price
~$750 Million of Proceeds
No Change to Price
Remaining Value as of 9/30/17: $1.2 Billion(2)
3.4x3.0x3.2x
2.6x
0.0x
1.0x
2.0x
3.0x
4.0x
6/30/2017 9/30/2017
Consolidated Standalone
3
18
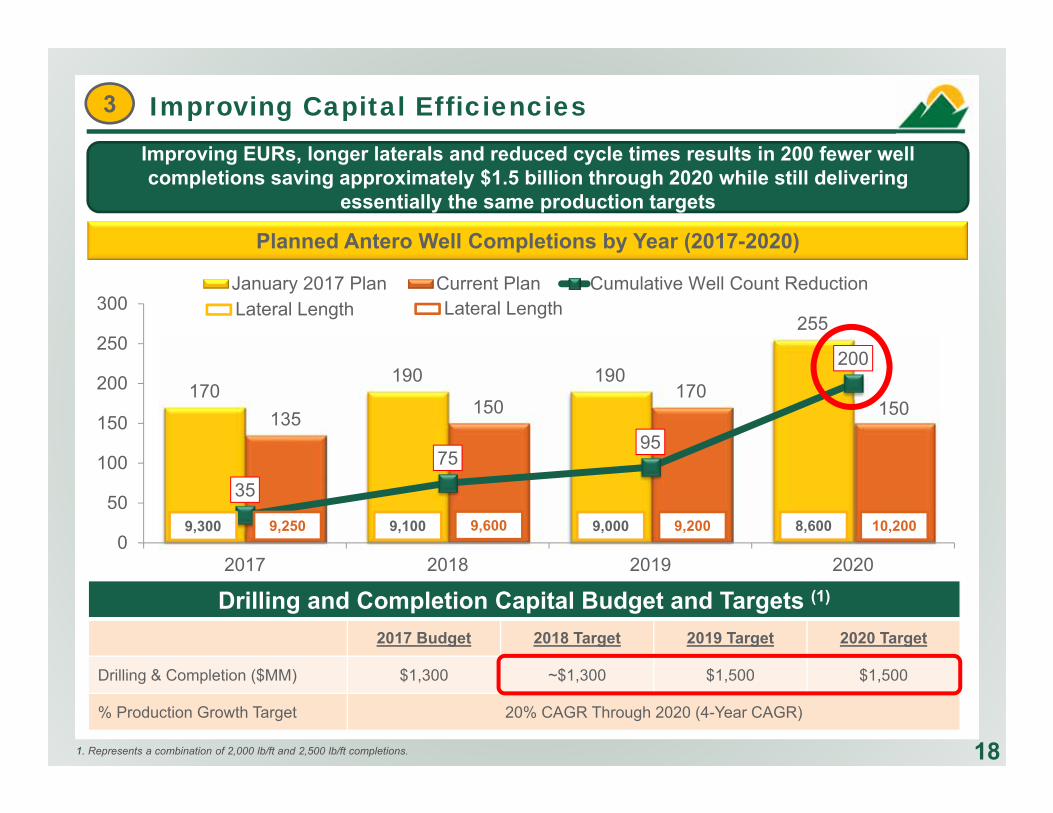
Improving Capital Efficiencies
Planned Antero Well Completions by Year (2017-2020)
170190 190
255
135 150170
150
35
7595
200
0
50
100
150
200
250
300
2017 2018 2019 2020
January 2017 Plan Current Plan Cumulative Well Count Reduction
Improving EURs, longer laterals and reduced cycle times results in 200 fewer well completions saving approximately $1.5 billion through 2020 while still delivering
essentially the same production targets
Drilling and Completion Capital Budget and Targets (1)
2017 Budget 2018 Target 2019 Target 2020 Target
Drilling & Completion ($MM) $1,300 ~$1,300 $1,500 $1,500
% Production Growth Target 20% CAGR Through 2020 (4-Year CAGR)
9,300 9,250 9,100 9,600 9,000 9,200 8,600 10,200
Lateral Length Lateral Length
1. Represents a combination of 2,000 lb/ft and 2,500 lb/ft completions.
3
($1,484)
($757)($358)
($150)
D&C$2,477
D&C$1,684 D&C
$1,472 D&C$1,300
D&C$1,300
D&C$1,500
D&C$1,500
($1,500)
($1,000)
($500)
$0
$500
$1,000
$1,500
$2,000
$2,500
2014A 2015A 2016A 2017Consensus
2018Target
2019Target
2020Target
19
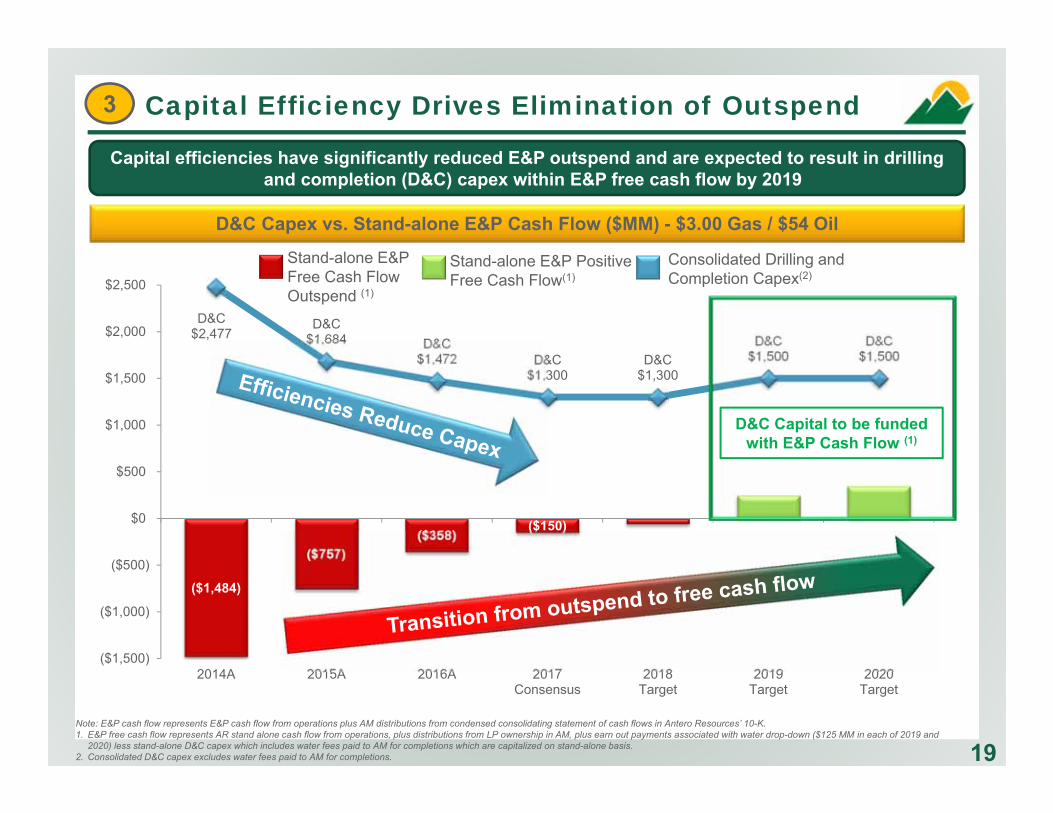
Capital Efficiency Drives Elimination of Outspend
Capital efficiencies have significantly reduced E&P outspend and are expected to result in drilling and completion (D&C) capex within E&P free cash flow by 2019
D&C Capex vs. Stand-alone E&P Cash Flow ($MM) - $3.00 Gas / $54 Oil
D&C Capital to be funded with E&P Cash Flow (1)
Note: E&P cash flow represents E&P cash flow from operations plus AM distributions from condensed consolidating statement of cash flows in Antero Resources’ 10-K.1. E&P free cash flow represents AR stand alone cash flow from operations, plus distributions from LP ownership in AM, plus earn out payments associated with water drop-down ($125 MM in each of 2019 and
2020) less stand-alone D&C capex which includes water fees paid to AM for completions which are capitalized on stand-alone basis. 2. Consolidated D&C capex excludes water fees paid to AM for completions.
Stand-alone E&P Positive Free Cash Flow(1)
Consolidated Drilling and Completion Capex(2)
Stand-alone E&P Free Cash Flow Outspend (1)
3
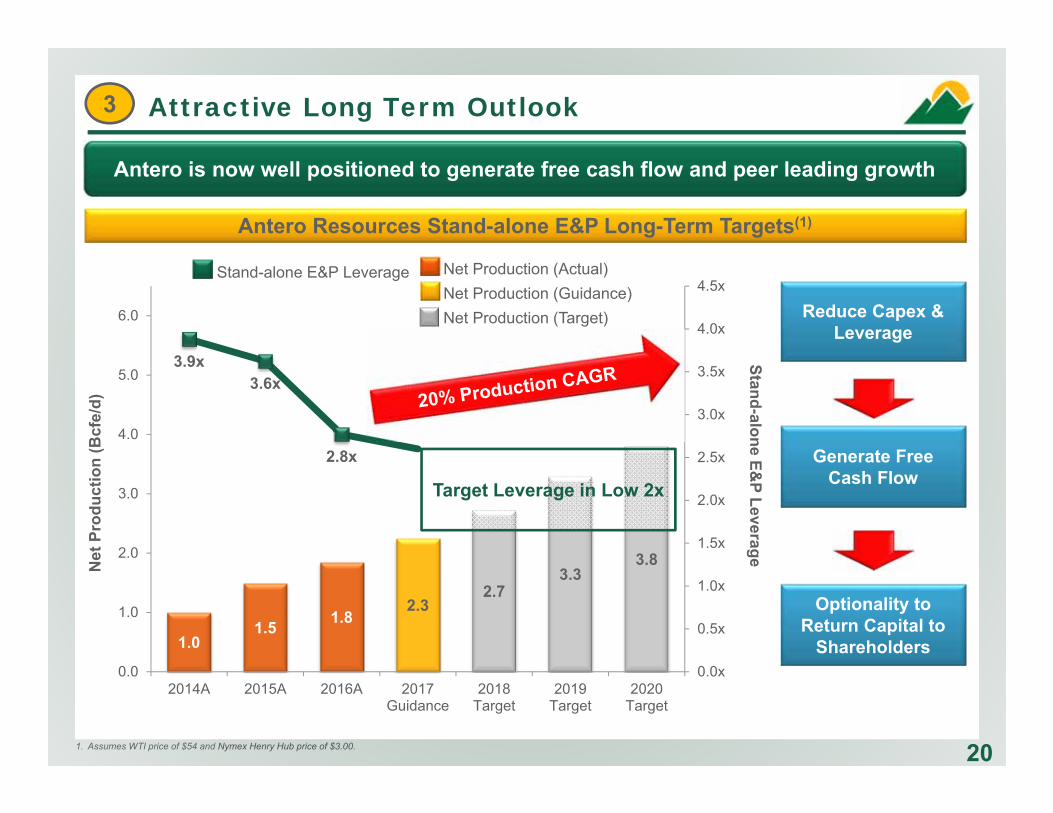
1.01.5 1.8
2.32.7
3.33.8
3.9x3.6x
2.8x
0.0x
0.5x
1.0x
1.5x
2.0x
2.5x
3.0x
3.5x
4.0x
4.5x
0.0
1.0
2.0
3.0
4.0
5.0
6.0
2014A 2015A 2016A 2017Guidance
2018Target
2019Target
2020Target
Stand-alone E&P Leverage
Net
Pro
duct
ion
(Bcf
e/d)
20
Attractive Long Term Outlook
Antero Resources Stand-alone E&P Long-Term Targets(1)
Target Leverage in Low 2x
Reduce Capex & Leverage
Generate Free Cash Flow
Optionality to Return Capital to
Shareholders
Stand-alone E&P Leverage Net Production (Actual)Net Production (Guidance)Net Production (Target)
Antero is now well positioned to generate free cash flow and peer leading growth
3
1. Assumes WTI price of $54 and Nymex Henry Hub price of $3.00.
Accelerate trend towards investment grade quality – current corporate ratings Ba2/BB
Maintain conservative leverage profile below 3.0x near-term (on stand-alone basis) with medium-term target of low 2x leverage
Fund drilling and completion capital with stand-alone upstream cash flow from operations (including AM distributions and earn-out payments from water business sale in 2015)
Continue to hedge over a rolling five to six year period to support consistent production development into long-term processing and firm transportation commitments, smoothing volatile oil and gas prices
Maintain stand-alone AR liquidity of at least ~$1 billion on $2.5 billion credit facility
Financial Policy Overview
More Conservative Financial Policy
21
3
New $4.5 Billion Credit Facility with $2.5 Billion in Lender Commitments- Downsized lender commitments by $1.5 billion due to reduced need for bank capital - Supported by $4.5 billion borrowing base- Credit facility includes fall away covenants (interest coverage ratio and proved PV-9 to total
debt ratio) triggered if and when Antero is assigned an investment grade rating - No leverage test
$89 $112
$-
$50
$100
$150
$200
$250
$300
2015A 2016A 2017E 2018E 2019E 2020E
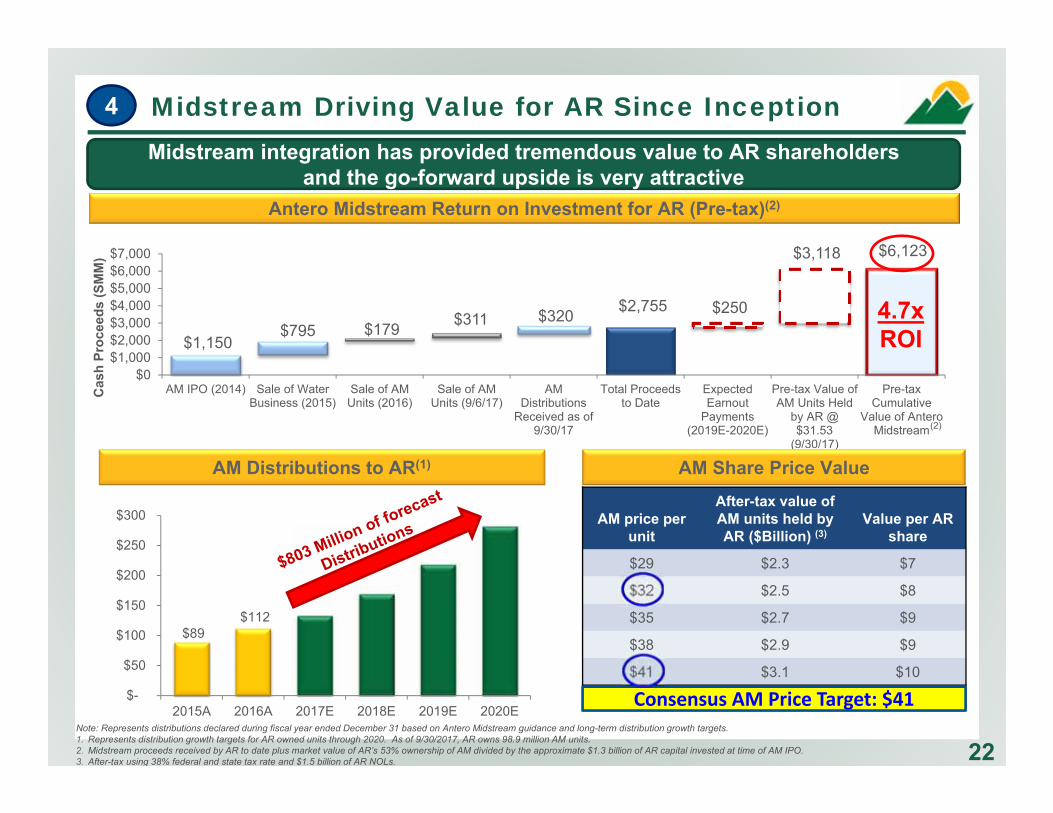
$1,150
$2,755
$6,123
$795 $179 $311 $320 $250
$3,118
$0$1,000$2,000$3,000$4,000$5,000$6,000$7,000
AM IPO (2014) Sale of WaterBusiness (2015)
Sale of AMUnits (2016)
Sale of AMUnits (9/6/17)
AMDistributions
Received as of9/30/17
Total Proceedsto Date
ExpectedEarnout
Payments(2019E-2020E)
Pre-tax Value ofAM Units Held
by AR @$31.53
(9/30/17)
Pre-taxCumulative
Value of AnteroMidstream
Cas
h Pr
ocee
ds (S
MM
)Midstream Driving Value for AR Since InceptionMidstream integration has provided tremendous value to AR shareholders
and the go-forward upside is very attractive
AM Distributions to AR(1)
Antero Midstream Return on Investment for AR (Pre-tax)(2)
Note: Represents distributions declared during fiscal year ended December 31 based on Antero Midstream guidance and long-term distribution growth targets. 1. Represents distribution growth targets for AR owned units through 2020. As of 9/30/2017, AR owns 98.9 million AM units.2. Midstream proceeds received by AR to date plus market value of AR’s 53% ownership of AM divided by the approximate $1.3 billion of AR capital invested at time of AM IPO.3. After-tax using 38% federal and state tax rate and $1.5 billion of AR NOLs.
AM price per unit
After-tax value of AM units held by AR ($Billion) (3)
Value per AR share
$29 $2.3 $7
$32 $2.5 $8
$35 $2.7 $9
$38 $2.9 $9
$41 $3.1 $10
Consensus AM Price Target: $41
4.7xROI
AM Share Price Value
22
(2)
4
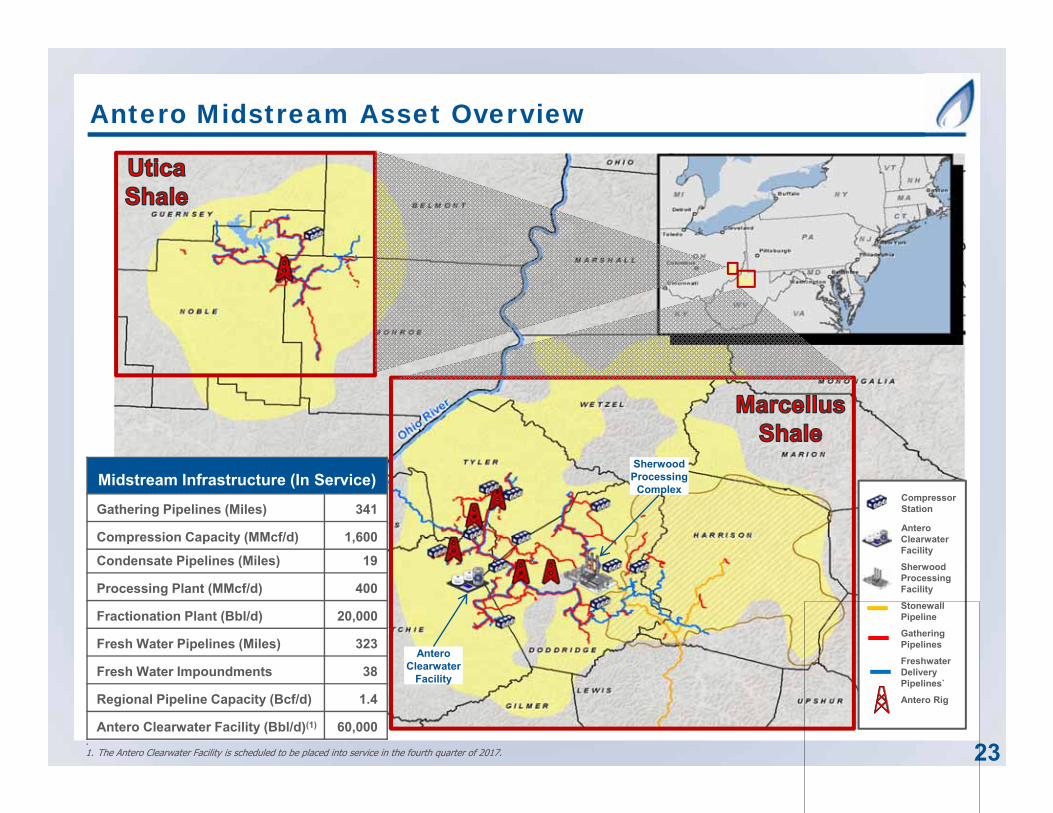
Midstream Infrastructure (In Service)
Gathering Pipelines (Miles) 341
Compression Capacity (MMcf/d) 1,600Condensate Pipelines (Miles) 19
Processing Plant (MMcf/d) 400
Fractionation Plant (Bbl/d) 20,000
Fresh Water Pipelines (Miles) 323
Fresh Water Impoundments 38
Regional Pipeline Capacity (Bcf/d) 1.4
Antero Clearwater Facility (Bbl/d)(1) 60,000
CompressorStation
Antero Clearwater FacilitySherwood Processing FacilityStonewall PipelineGathering PipelinesFreshwater Delivery Pipelines`Antero Rig
Antero Midstream Asset Overview
23
Antero Clearwater
Facility
Sherwood Processing
Complex
. 1. The Antero Clearwater Facility is scheduled to be placed into service in the fourth quarter of 2017.
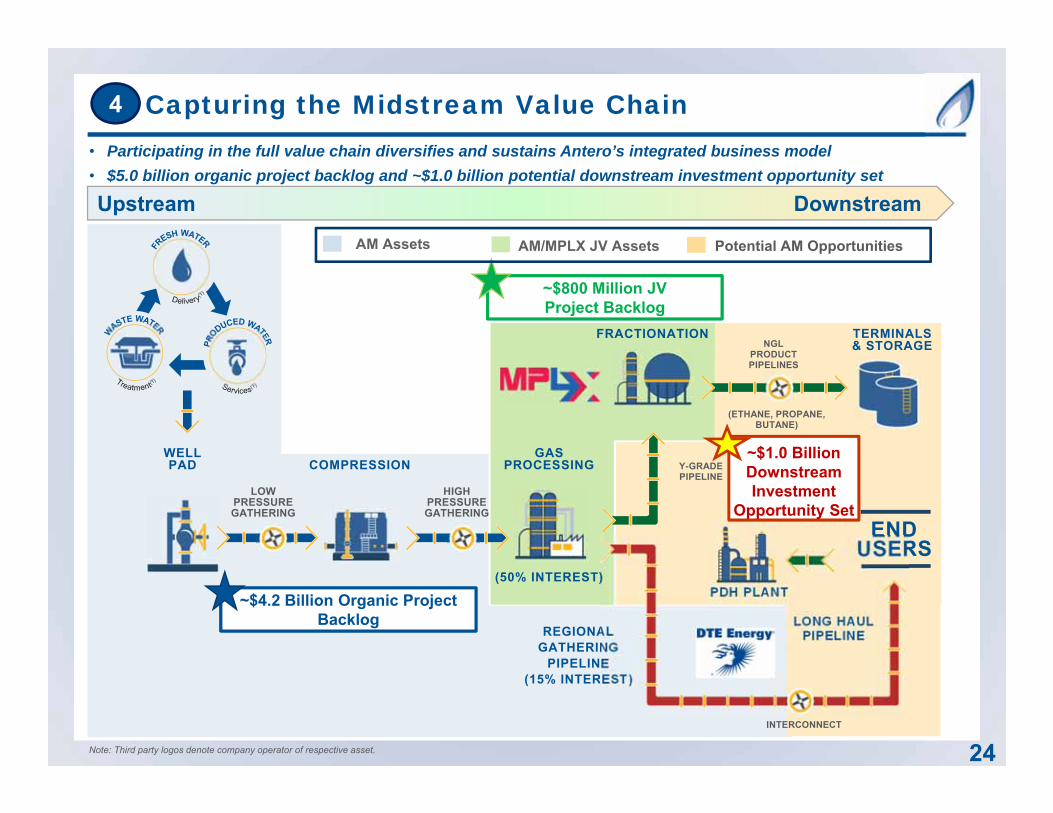
Capturing the Midstream Value Chain
Upstream Downstream
~$4.2 Billion Organic Project Backlog
~$800 Million JV Project Backlog
WELL PAD
LOWPRESSUREGATHERING
HIGHPRESSUREGATHERING
COMPRESSIONGAS
PROCESSING
(50% INTEREST)
REGIONALGATHERING
PIPELINE(15% INTEREST)
FRACTIONATION TERMINALS& STORAGE
Y-GRADEPIPELINE
(ETHANE, PROPANE,BUTANE)
NGLPRODUCTPIPELINES
LONG HAULPIPELINE
INTERCONNECT
ENDUSERS
PDH PLANT
• Participating in the full value chain diversifies and sustains Antero’s integrated business model• $5.0 billion organic project backlog and ~$1.0 billion potential downstream investment opportunity set
~$1.0 Billion Downstream Investment
Opportunity Set
Note: Third party logos denote company operator of respective asset.
AM Assets AM/MPLX JV Assets Potential AM Opportunities
24
4
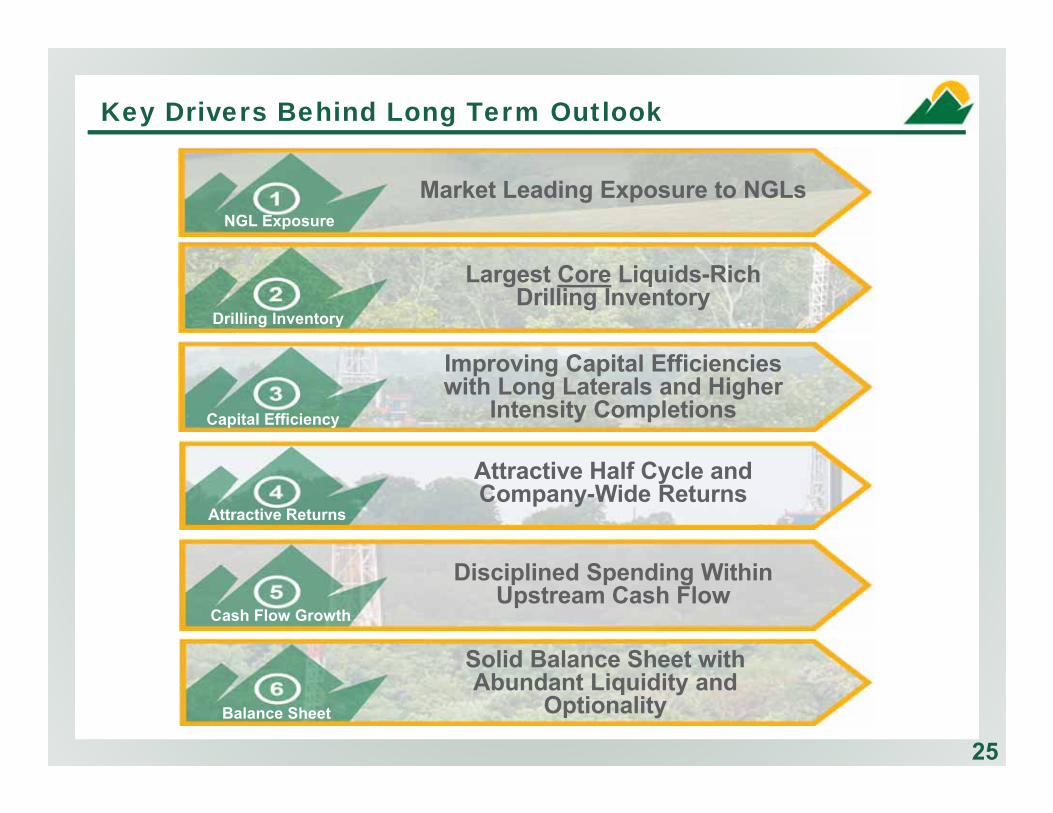
Key Drivers Behind Long Term Outlook
Market Leading Exposure to NGLs
Largest Core Liquids-Rich Drilling Inventory
Improving Capital Efficiencies with Long Laterals and Higher
Intensity Completions
Attractive Half Cycle and Company-Wide Returns
Disciplined Spending Within Upstream Cash Flow
25
Cash Flow Growth
Capital Efficiency
Drilling Inventory
Attractive Returns
NGL Exposure
Solid Balance Sheet with Abundant Liquidity and
OptionalityBalance Sheet
26
APPENDIX
26
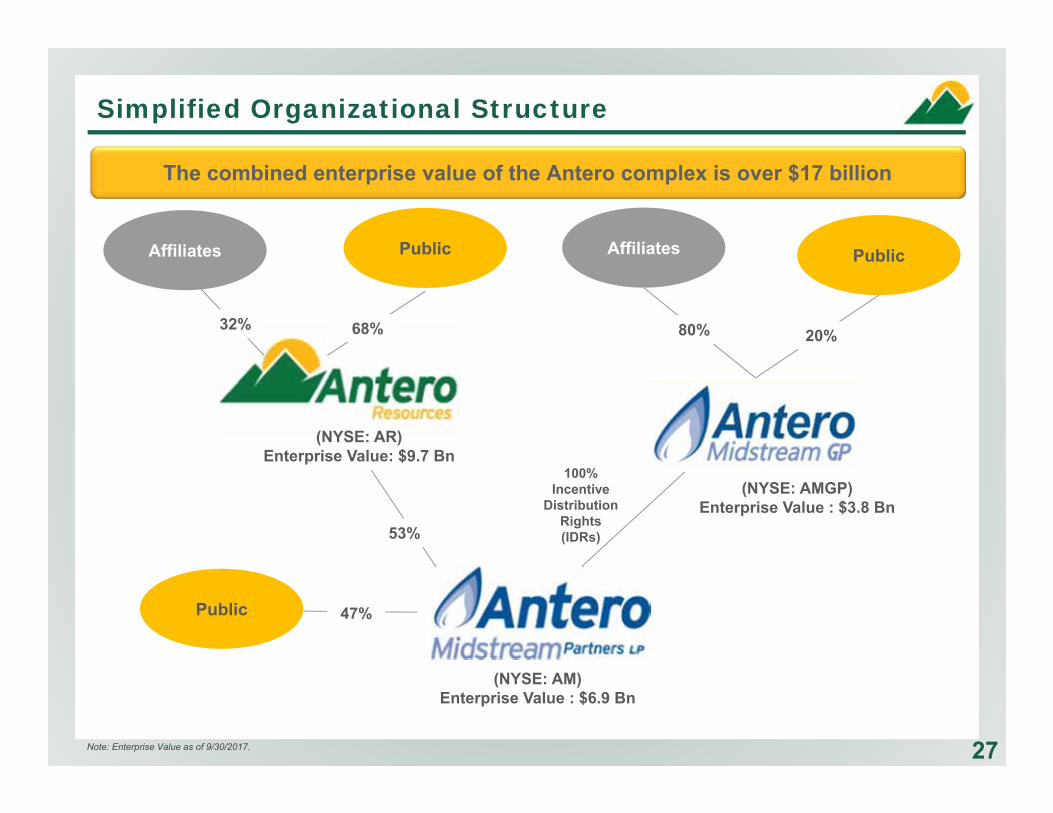
Simplified Organizational Structure
27Note: Enterprise Value as of 9/30/2017.
100%Incentive
Distribution Rights(IDRs)
Public
(NYSE: AMGP)Enterprise Value : $3.8 Bn
(NYSE: AM)Enterprise Value : $6.9 Bn
(NYSE: AR)Enterprise Value: $9.7 Bn
80% 20%
AffiliatesAffiliates
53%
32%
Public
68%
47%Public
The combined enterprise value of the Antero complex is over $17 billion

Key VariableUpdated
2017 Guidance(1)Previous
2017 Guidance(1)Q4
2017 Guidance
Net Daily Production (MMcfe/d) 2,250 – 2,300
Net Residue Natural Gas Production (MMcf/d) 1,650 – 1,675
Net C3+ NGL Production (Bbl/d) 68,000 – 71,000
Net Ethane Production (Bbl/d) 26,000 – 27,000
Net Oil Production (Bbl/d) 6,000 – 7,000
Net Liquids Production (Bbl/d) 100,000 – 105,000
Natural Gas Realized Price Differential to NYMEX Before Hedging ($/Mcf)(2)(3) ($0.15) – ($0.10) +$0.00 – $0.10 ($0.20) – ($0.15)
Oil Realized Price Differential to NYMEX WTI Oil Before Hedging ($/Bbl) ($7.00) – ($6.50) ($9.00) – ($7.00) ($5.00) – ($6.00)
C3+ NGL Realized Price (% of NYMEX WTI)(2) 57.5% – 62.5% 50% – 55% 70% – 75%
Ethane Realized Price (Differential to Mont Belvieu) ($/Gal) $0.00 $0.00 $0.00
Consolidated EBITDAX ($MM): $410 - $440
Operating:Cash Production Expense ($/Mcfe)(4) $1.55 – $1.65
Marketing Expense, Net of Marketing Revenue ($/Mcfe) $0.075 – $0.125
G&A Expense ($/Mcfe) $0.15 – $0.20
Capital Expenditures ($MM):Drilling & Completion $1,300
Land $200
Total Capital Expenditures ($MM) $1,500
Antero Resources – Q4’17 and 2017 GuidanceKey Operating & Financial Assumptions
3. Includes Btu upgrade as Antero’s processed tailgate and unprocessed dry gas production is greater than 1000 Btu on average. 4. Includes lease operating expenses, gathering, compression and transportation expenses and production taxes.
1. Updated guidance per press release dated 11/02/2017. 2. Based on strip pricing as of 10/27/2017. 28
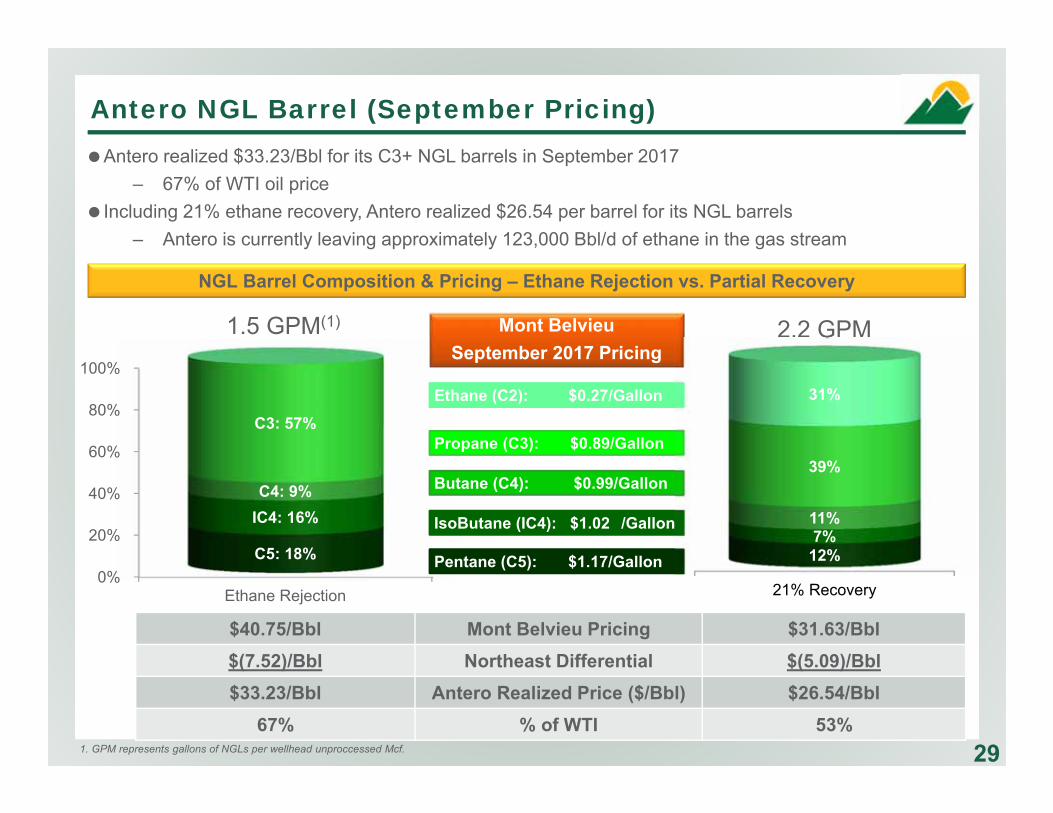
Antero NGL Barrel (September Pricing)
29
NGL Barrel Composition & Pricing – Ethane Rejection vs. Partial Recovery
1. GPM represents gallons of NGLs per wellhead unproccessed Mcf.
0%
20%
40%
60%
80%
100%
Ethane Rejection
C5: 18%
IC4: 16% C4: 9%
C3: 57%
1.5 GPM(1) 2.2 GPM
Pentane (C5): $1.17/Gallon
IsoButane (IC4): $1.02 /Gallon
Butane (C4): $0.99/Gallon
Propane (C3): $0.89/Gallon
Ethane (C2): $0.27/Gallon
$40.75/Bbl Mont Belvieu Pricing $31.63/Bbl$(7.52)/Bbl Northeast Differential $(5.09)/Bbl$33.23/Bbl Antero Realized Price ($/Bbl) $26.54/Bbl
67% % of WTI 53%
Mont BelvieuSeptember 2017 Pricing
Antero realized $33.23/Bbl for its C3+ NGL barrels in September 2017‒ 67% of WTI oil price
Including 21% ethane recovery, Antero realized $26.54 per barrel for its NGL barrels‒ Antero is currently leaving approximately 123,000 Bbl/d of ethane in the gas stream
21% Recovery
12% 7% 11%
39%
31%
0100200300400500600700800900
1000
MB
bl/d
)
30
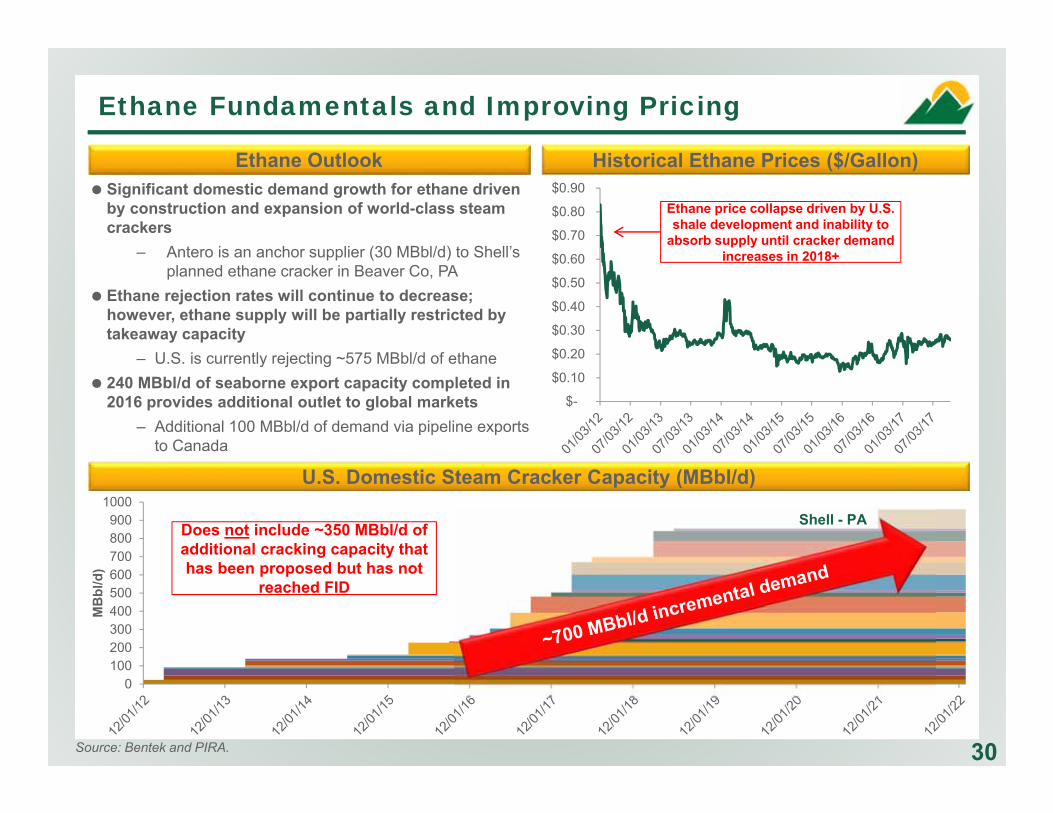
Historical Ethane Prices ($/Gallon)
Ethane Fundamentals and Improving Pricing
U.S. Domestic Steam Cracker Capacity (MBbl/d)
Ethane OutlookSignificant domestic demand growth for ethane driven
by construction and expansion of world-class steam crackers
‒ Antero is an anchor supplier (30 MBbl/d) to Shell’s planned ethane cracker in Beaver Co, PA
Ethane rejection rates will continue to decrease; however, ethane supply will be partially restricted by takeaway capacity
‒ U.S. is currently rejecting ~575 MBbl/d of ethane240 MBbl/d of seaborne export capacity completed in
2016 provides additional outlet to global markets‒ Additional 100 MBbl/d of demand via pipeline exports
to Canada
Shell - PADoes not include ~350 MBbl/d of additional cracking capacity that has been proposed but has not
reached FID
Source: Bentek and PIRA.
$-
$0.10
$0.20
$0.30
$0.40
$0.50
$0.60
$0.70
$0.80
$0.90Ethane price collapse driven by U.S. shale development and inability to
absorb supply until cracker demand increases in 2018+
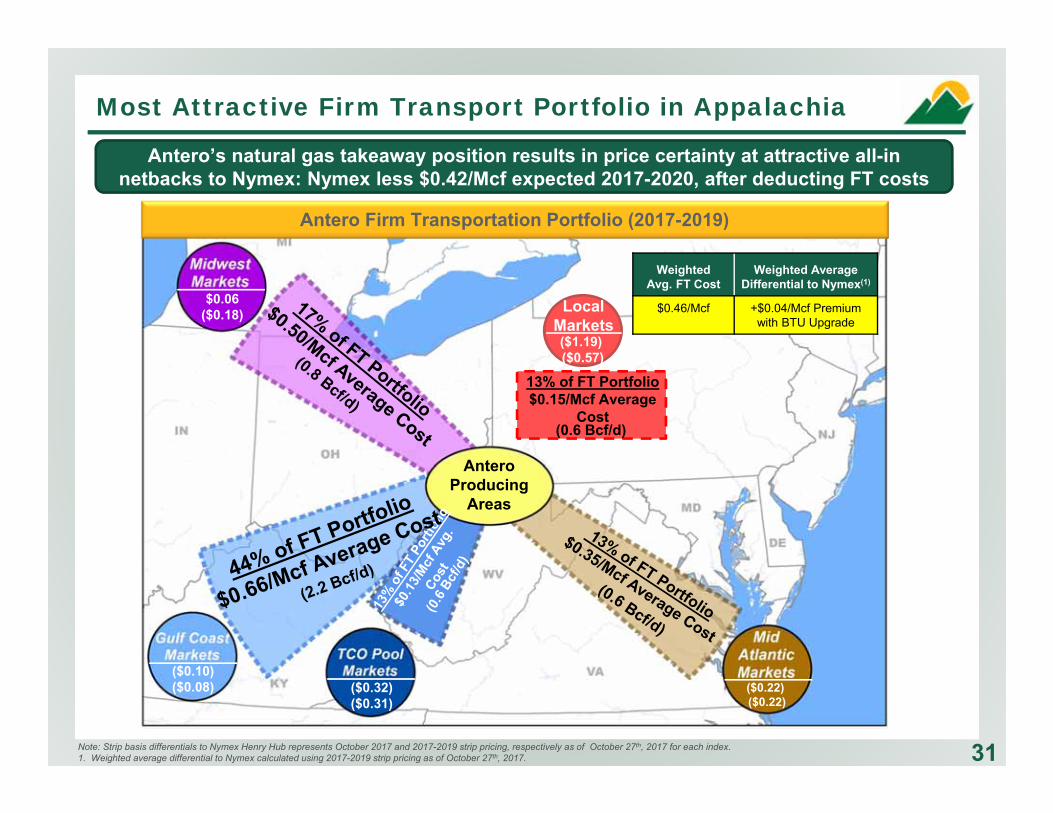
Most Attractive Firm Transport Portfolio in Appalachia
Antero’s natural gas takeaway position results in price certainty at attractive all-in netbacks to Nymex: Nymex less $0.42/Mcf expected 2017-2020, after deducting FT costs
13% of FT Portfolio$0.15/Mcf Average
Cost(0.6 Bcf/d)
LocalMarkets
Note: Strip basis differentials to Nymex Henry Hub represents October 2017 and 2017-2019 strip pricing, respectively as of October 27th, 2017 for each index. 1. Weighted average differential to Nymex calculated using 2017-2019 strip pricing as of October 27th, 2017.
Antero Firm Transportation Portfolio (2017-2019)
WeightedAvg. FT Cost
Weighted Average Differential to Nymex(1)
$0.46/Mcf +$0.04/Mcf Premiumwith BTU Upgrade
Antero Producing
Areas
($0.22)($0.22)
($0.32)($0.31)
($0.10)($0.08)
$0.06($0.18)
($1.19)($0.57)
31
$4 $5 $25 $34 $29 $28 $26 $12 $16 $17$28 $29 $19 $25$43
$80 $83$59
$49$48$14
$47 $54
$1
$58 $78
$185$196$206
$270
$324$293
$197$190
$45 $31
($2.00)($1.00)$0.00$1.00$2.00$3.00$4.00$5.00
$0.0
$70.0
$140.0
$210.0
$280.0
$350.0
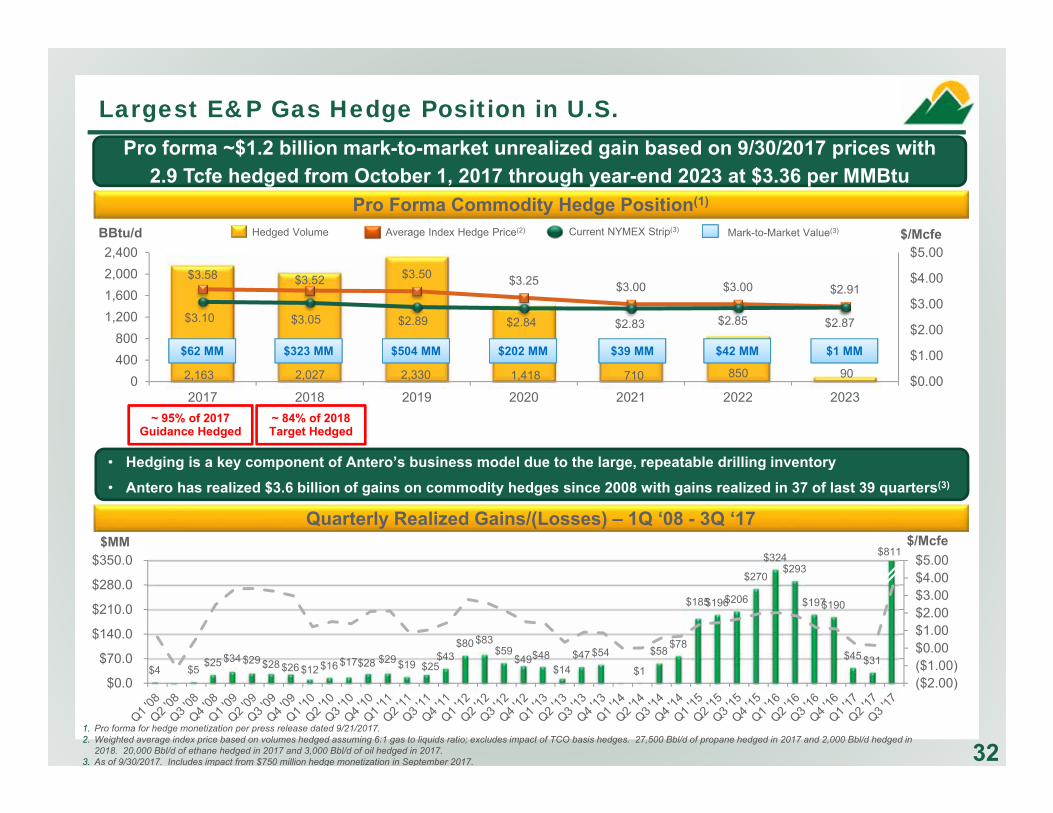
Largest E&P Gas Hedge Position in U.S.
2,163 2,027 2,330 1,418 710 850 90
$3.58 $3.52 $3.50 $3.25 $3.00 $3.00 $2.91
$3.10 $3.05 $2.89 $2.84 $2.83 $2.85 $2.87
$0.00
$1.00
$2.00
$3.00
$4.00
$5.00
0400800
1,2001,6002,0002,400
2017 2018 2019 2020 2021 2022 2023
BBtu/d $/McfeAverage Index Hedge Price(2)Hedged Volume Current NYMEX Strip(3)
Pro Forma Commodity Hedge Position(1)
$62 MM
Mark-to-Market Value(3)
~ 95% of 2017 Guidance Hedged
321. Pro forma for hedge monetization per press release dated 9/21/2017. 2. Weighted average index price based on volumes hedged assuming 6:1 gas to liquids ratio; excludes impact of TCO basis hedges. 27,500 Bbl/d of propane hedged in 2017 and 2,000 Bbl/d hedged in
2018. 20,000 Bbl/d of ethane hedged in 2017 and 3,000 Bbl/d of oil hedged in 2017. 3. As of 9/30/2017. Includes impact from $750 million hedge monetization in September 2017.
$/Mcfe
~ 84% of 2018 Target Hedged
Pro forma ~$1.2 billion mark-to-market unrealized gain based on 9/30/2017 prices with2.9 Tcfe hedged from October 1, 2017 through year-end 2023 at $3.36 per MMBtu
• Hedging is a key component of Antero’s business model due to the large, repeatable drilling inventory• Antero has realized $3.6 billion of gains on commodity hedges since 2008 with gains realized in 37 of last 39 quarters(3)
Quarterly Realized Gains/(Losses) – 1Q ‘08 - 3Q ‘17$MM
$323 MM $39 MM $42 MM $1 MM$504 MM $202 MM
$811
$1.13 $1.04 $1.22 $1.25 $0.82
$3.26 $2.79 $2.78
$2.24 $2.05 $2.13
$1.75 $1.56 $0.99 $1.23
$- $0.50 $1.00 $1.50 $2.00 $2.50 $3.00 $3.50
AR Peer 1 Peer 2 Peer 3 Peer 4EBITDAX GPT LOE Ad Valorem G&A Revenue Cash Costs
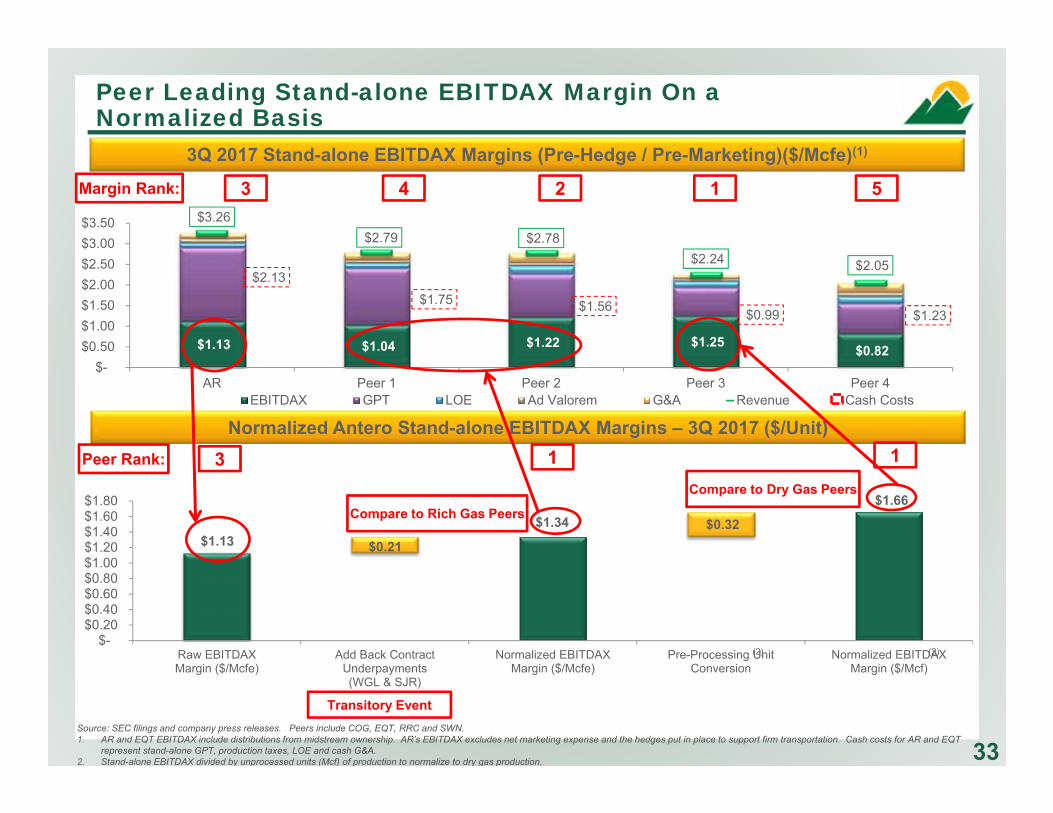
Peer Leading Stand-alone EBITDAX Margin On a Normalized Basis
33
3Q 2017 Stand-alone EBITDAX Margins (Pre-Hedge / Pre-Marketing)($/Mcfe)(1)
Margin Rank: 123
Source: SEC filings and company press releases. Peers include COG, EQT, RRC and SWN.1. AR and EQT EBITDAX include distributions from midstream ownership. AR’s EBITDAX excludes net marketing expense and the hedges put in place to support firm transportation. Cash costs for AR and EQT
represent stand-alone GPT, production taxes, LOE and cash G&A. 2. Stand-alone EBITDAX divided by unprocessed units (Mcf) of production to normalize to dry gas production.
Normalized Antero Stand-alone EBITDAX Margins – 3Q 2017 ($/Unit)Peer Rank: 3
4 5
$1.13 $0.21 $0.32 $1.34
$1.66
$- $0.20 $0.40 $0.60 $0.80 $1.00 $1.20 $1.40 $1.60 $1.80
Raw EBITDAXMargin ($/Mcfe)
Add Back ContractUnderpayments(WGL & SJR)
Normalized EBITDAXMargin ($/Mcfe)
Pre-Processing UnitConversion
Normalized EBITDAXMargin ($/Mcf)
Transitory Event
(2) (2)
Compare to Rich Gas Peers
Compare to Dry Gas Peers
1 1
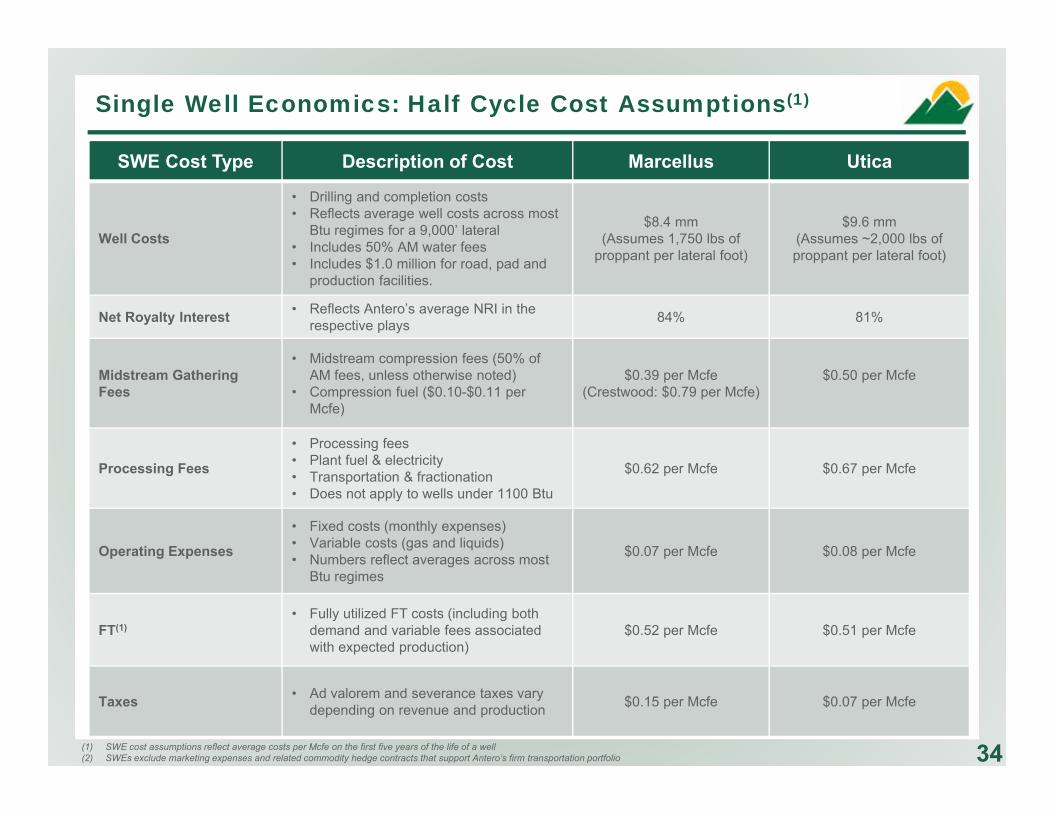
Single Well Economics: Half Cycle Cost Assumptions(1)
34
SWE Cost Type Description of Cost Marcellus Utica
Well Costs
• Drilling and completion costs• Reflects average well costs across most
Btu regimes for a 9,000’ lateral• Includes 50% AM water fees• Includes $1.0 million for road, pad and
production facilities.
$8.4 mm(Assumes 1,750 lbs of
proppant per lateral foot)
$9.6 mm(Assumes ~2,000 lbs of proppant per lateral foot)
Net Royalty Interest • Reflects Antero’s average NRI in the respective plays 84% 81%
Midstream Gathering Fees
• Midstream compression fees (50% of AM fees, unless otherwise noted)
• Compression fuel ($0.10-$0.11 per Mcfe)
$0.39 per Mcfe(Crestwood: $0.79 per Mcfe)
$0.50 per Mcfe
Processing Fees
• Processing fees• Plant fuel & electricity• Transportation & fractionation• Does not apply to wells under 1100 Btu
$0.62 per Mcfe $0.67 per Mcfe
Operating Expenses
• Fixed costs (monthly expenses)• Variable costs (gas and liquids)• Numbers reflect averages across most
Btu regimes
$0.07 per Mcfe $0.08 per Mcfe
FT(1)• Fully utilized FT costs (including both
demand and variable fees associated with expected production)
$0.52 per Mcfe $0.51 per Mcfe
Taxes • Ad valorem and severance taxes vary depending on revenue and production $0.15 per Mcfe $0.07 per Mcfe
(1) SWE cost assumptions reflect average costs per Mcfe on the first five years of the life of a well(2) SWEs exclude marketing expenses and related commodity hedge contracts that support Antero’s firm transportation portfolio
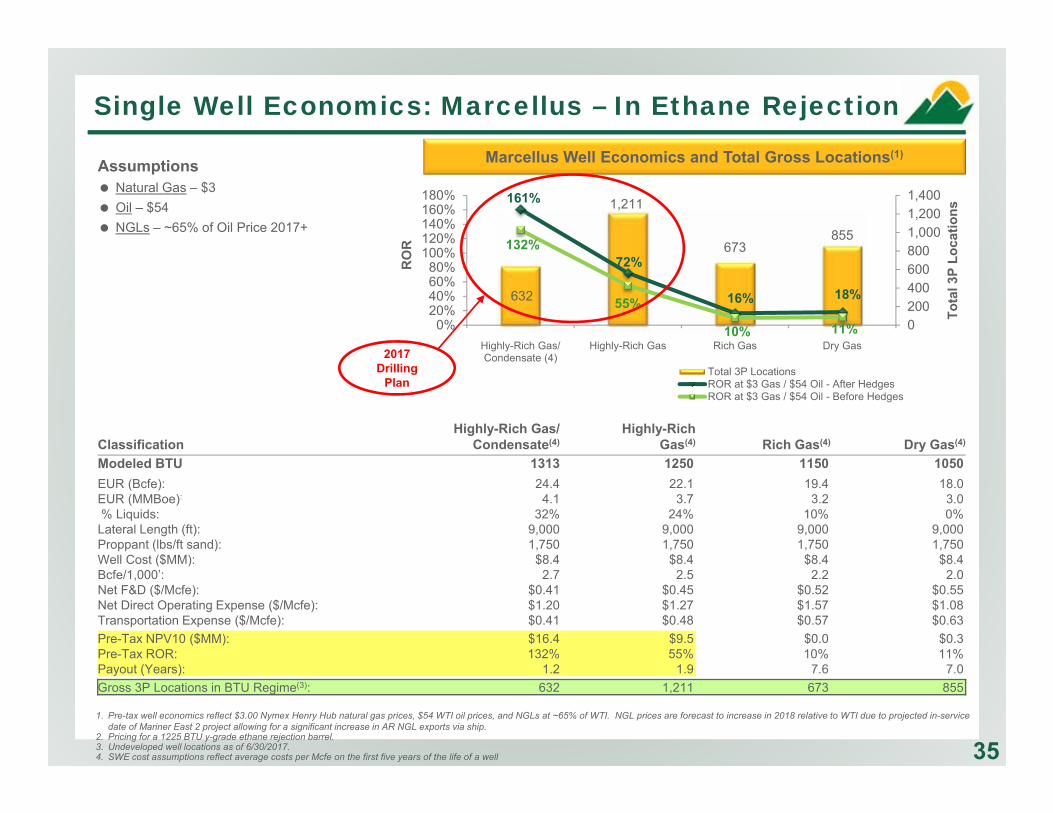
Marcellus Well Economics and Total Gross Locations(1)
632
1,211
673855
161%
72%
16% 18%
132%
55%
10% 11% 02004006008001,0001,2001,400
0%20%40%60%80%
100%120%140%160%180%
Highly-Rich Gas/Condensate (4)
Highly-Rich Gas Rich Gas Dry Gas
Tota
l 3P
Loca
tions
RO
R
Total 3P LocationsROR at $3 Gas / $54 Oil - After HedgesROR at $3 Gas / $54 Oil - Before Hedges
1. Pre-tax well economics reflect $3.00 Nymex Henry Hub natural gas prices, $54 WTI oil prices, and NGLs at ~65% of WTI. NGL prices are forecast to increase in 2018 relative to WTI due to projected in-service date of Mariner East 2 project allowing for a significant increase in AR NGL exports via ship.
2. Pricing for a 1225 BTU y-grade ethane rejection barrel. 3. Undeveloped well locations as of 6/30/2017. 4. SWE cost assumptions reflect average costs per Mcfe on the first five years of the life of a well
DRY GAS LOCATIONS RICH GAS LOCATIONS
HIGHLY RICH GAS
LOCATIONS
Assumptions Natural Gas – $3 Oil – $54 NGLs – ~65% of Oil Price 2017+
ClassificationHighly-Rich Gas/
Condensate(4)Highly-Rich
Gas(4) Rich Gas(4) Dry Gas(4)
Modeled BTU 1313 1250 1150 1050EUR (Bcfe): 24.4 22.1 19.4 18.0EUR (MMBoe): 4.1 3.7 3.2 3.0% Liquids: 32% 24% 10% 0%
Lateral Length (ft): 9,000 9,000 9,000 9,000Proppant (lbs/ft sand): 1,750 1,750 1,750 1,750Well Cost ($MM): $8.4 $8.4 $8.4 $8.4Bcfe/1,000’: 2.7 2.5 2.2 2.0Net F&D ($/Mcfe): $0.41 $0.45 $0.52 $0.55Net Direct Operating Expense ($/Mcfe): $1.20 $1.27 $1.57 $1.08Transportation Expense ($/Mcfe): $0.41 $0.48 $0.57 $0.63Pre-Tax NPV10 ($MM): $16.4 $9.5 $0.0 $0.3Pre-Tax ROR: 132% 55% 10% 11%Payout (Years): 1.2 1.9 7.6 7.0Gross 3P Locations in BTU Regime(3): 632 1,211 673 855
2017Drilling
Plan
Single Well Economics: Marcellus – In Ethane Rejection
35
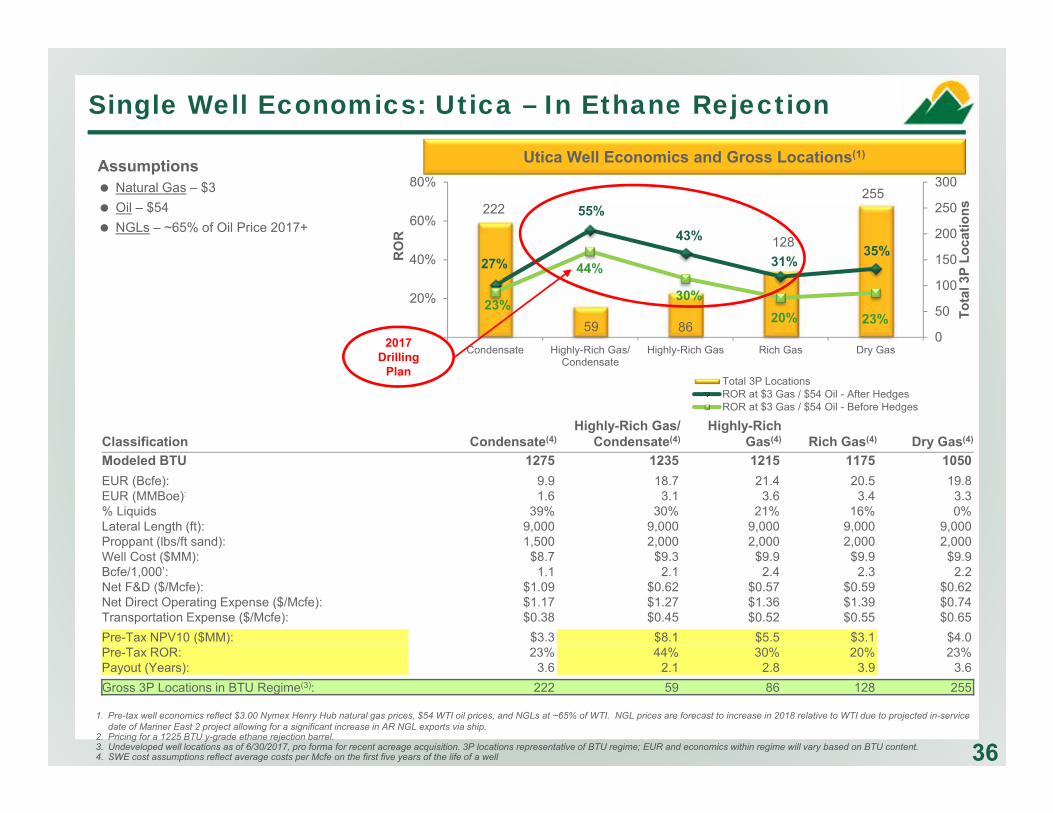
Utica Well Economics and Gross Locations(1)
222
59 86
128
255
27%
55%
43%
31%35%
23%
44%
30%20% 23%
0
50
100
150
200
250
300
0%
20%
40%
60%
80%
Condensate Highly-Rich Gas/Condensate
Highly-Rich Gas Rich Gas Dry Gas
Tota
l 3P
Loca
tions
RO
RTotal 3P LocationsROR at $3 Gas / $54 Oil - After HedgesROR at $3 Gas / $54 Oil - Before Hedges
Single Well Economics: Utica – In Ethane Rejection
DRY GAS LOCATIONS RICH GAS LOCATIONS
HIGHLY RICH GAS
LOCATIONS
Classification Condensate(4)Highly-Rich Gas/
Condensate(4)Highly-Rich
Gas(4) Rich Gas(4) Dry Gas(4)
Modeled BTU 1275 1235 1215 1175 1050EUR (Bcfe): 9.9 18.7 21.4 20.5 19.8EUR (MMBoe): 1.6 3.1 3.6 3.4 3.3% Liquids 39% 30% 21% 16% 0%Lateral Length (ft): 9,000 9,000 9,000 9,000 9,000Proppant (lbs/ft sand): 1,500 2,000 2,000 2,000 2,000Well Cost ($MM): $8.7 $9.3 $9.9 $9.9 $9.9Bcfe/1,000’: 1.1 2.1 2.4 2.3 2.2Net F&D ($/Mcfe): $1.09 $0.62 $0.57 $0.59 $0.62Net Direct Operating Expense ($/Mcfe): $1.17 $1.27 $1.36 $1.39 $0.74Transportation Expense ($/Mcfe): $0.38 $0.45 $0.52 $0.55 $0.65Pre-Tax NPV10 ($MM): $3.3 $8.1 $5.5 $3.1 $4.0Pre-Tax ROR: 23% 44% 30% 20% 23%Payout (Years): 3.6 2.1 2.8 3.9 3.6Gross 3P Locations in BTU Regime(3): 222 59 86 128 255
2017Drilling
Plan
361. Pre-tax well economics reflect $3.00 Nymex Henry Hub natural gas prices, $54 WTI oil prices, and NGLs at ~65% of WTI. NGL prices are forecast to increase in 2018 relative to WTI due to projected in-service
date of Mariner East 2 project allowing for a significant increase in AR NGL exports via ship. 2. Pricing for a 1225 BTU y-grade ethane rejection barrel. 3. Undeveloped well locations as of 6/30/2017, pro forma for recent acreage acquisition. 3P locations representative of BTU regime; EUR and economics within regime will vary based on BTU content.4. SWE cost assumptions reflect average costs per Mcfe on the first five years of the life of a well
Assumptions Natural Gas – $3 Oil – $54 NGLs – ~65% of Oil Price 2017+
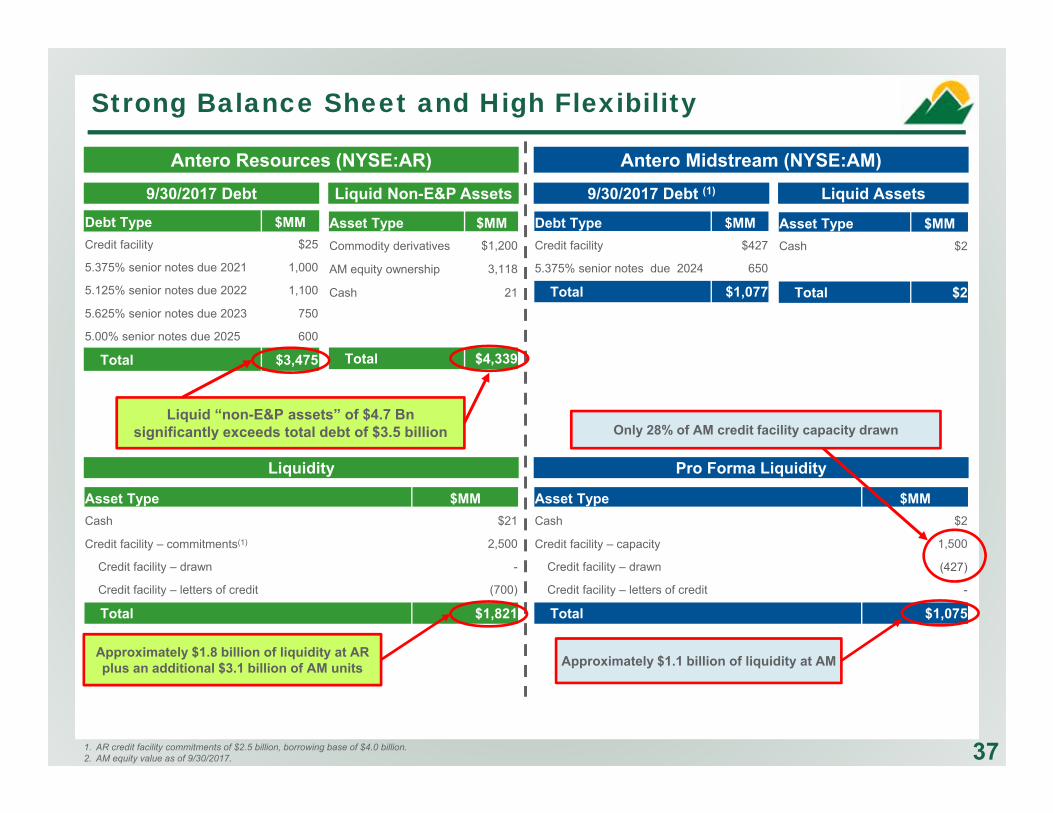
Liquid “non-E&P assets” of $4.7 Bnsignificantly exceeds total debt of $3.5 billion
Liquidity
Antero Resources (NYSE:AR) Antero Midstream (NYSE:AM)9/30/2017 Debt Liquid Non-E&P Assets 9/30/2017 Debt (1) Liquid Assets
Debt Type $MMCredit facility $25
5.375% senior notes due 2021 1,000
5.125% senior notes due 2022 1,100
5.625% senior notes due 2023 750
5.00% senior notes due 2025 600
Total $3,475
Asset Type $MMCommodity derivatives $1,200
AM equity ownership 3,118
Cash 21
Total $4,339
Asset Type $MMCash $21
Credit facility – commitments(1) 2,500
Credit facility – drawn -
Credit facility – letters of credit (700)
Total $1,821
Debt Type $MMCredit facility $427
5.375% senior notes due 2024 650
Total $1,077
Asset Type $MMCash $2
Total $2
Pro Forma Liquidity
Asset Type $MMCash $2
Credit facility – capacity 1,500
Credit facility – drawn (427)
Credit facility – letters of credit -
Total $1,075
Approximately $1.8 billion of liquidity at AR plus an additional $3.1 billion of AM units Approximately $1.1 billion of liquidity at AM
37
Only 28% of AM credit facility capacity drawn
1. AR credit facility commitments of $2.5 billion, borrowing base of $4.0 billion.2. AM equity value as of 9/30/2017.
Strong Balance Sheet and High Flexibility
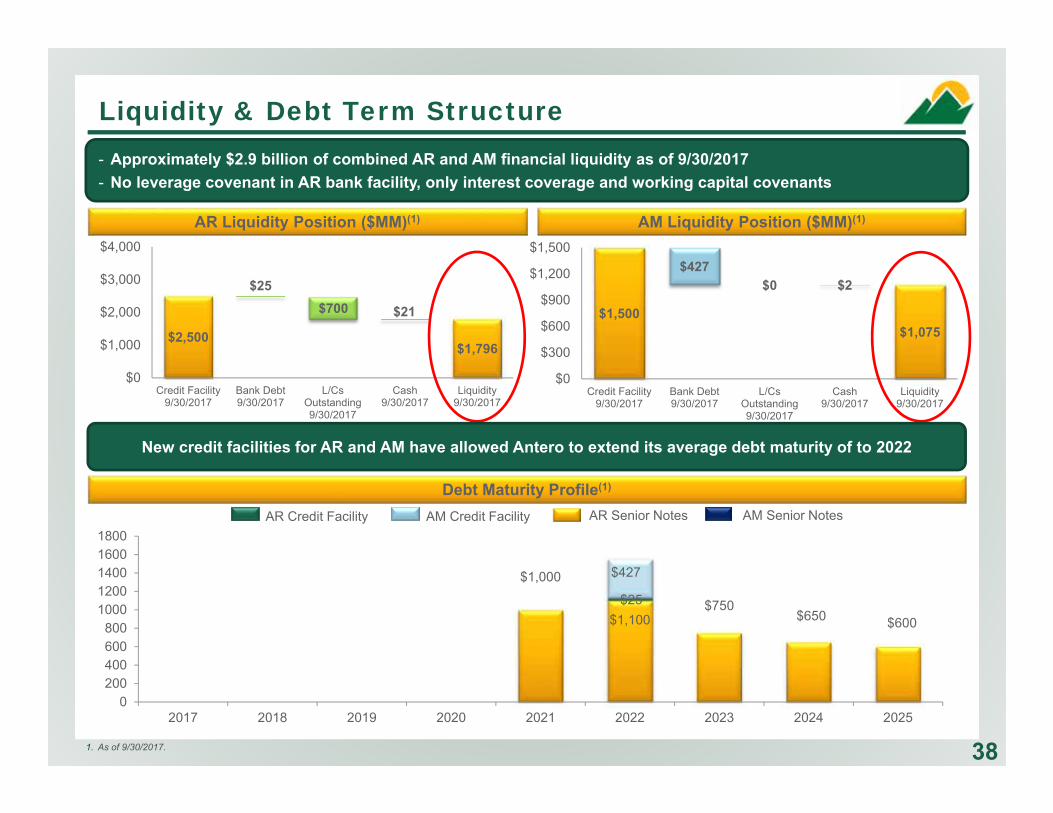
$1,500$1,075
$427$0 $2
$0
$300
$600
$900
$1,200
$1,500
Credit Facility9/30/2017
Bank Debt9/30/2017
L/CsOutstanding9/30/2017
Cash9/30/2017
Liquidity9/30/2017
38
$2,500
$25
$1,796
$700 $21
$0
$1,000
$2,000
$3,000
$4,000
Credit Facility9/30/2017
Bank Debt9/30/2017
L/CsOutstanding9/30/2017
Cash9/30/2017
Liquidity9/30/2017
AR Liquidity Position ($MM)(1) AM Liquidity Position ($MM)(1)
AR Credit Facility AR Senior Notes
Debt Maturity Profile(1)
AM Credit Facility AM Senior Notes
Liquidity & Debt Term Structure - Approximately $2.9 billion of combined AR and AM financial liquidity as of 9/30/2017- No leverage covenant in AR bank facility, only interest coverage and working capital covenants
New credit facilities for AR and AM have allowed Antero to extend its average debt maturity of to 2022
1. As of 9/30/2017.
$1,000
$1,100$750
$650 $600
$25
$427
0200400600800
10001200140016001800
2017 2018 2019 2020 2021 2022 2023 2024 2025
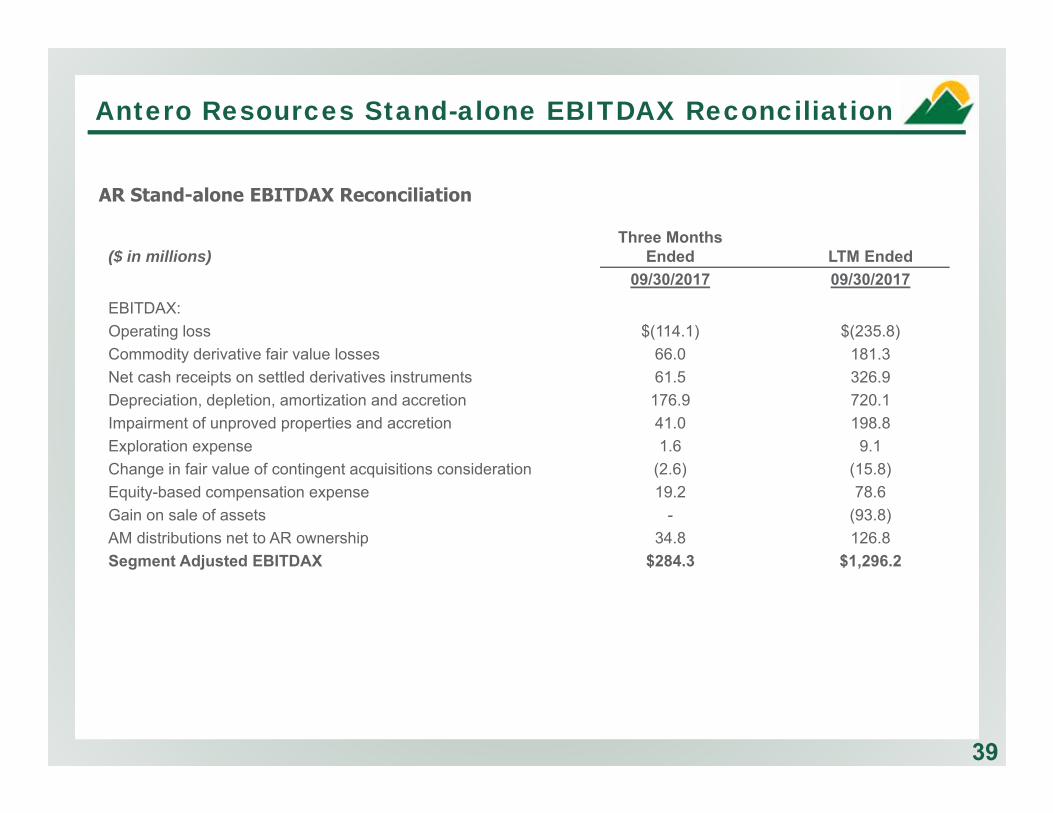
Antero Resources Stand-alone EBITDAX Reconciliation
AR Stand-alone EBITDAX Reconciliation
($ in millions)Three Months
Ended LTM Ended09/30/2017 09/30/2017
EBITDAX:Operating loss $(114.1) $(235.8)Commodity derivative fair value losses 66.0 181.3Net cash receipts on settled derivatives instruments 61.5 326.9Depreciation, depletion, amortization and accretion 176.9 720.1Impairment of unproved properties and accretion 41.0 198.8Exploration expense 1.6 9.1Change in fair value of contingent acquisitions consideration (2.6) (15.8)Equity-based compensation expense 19.2 78.6Gain on sale of assets - (93.8)AM distributions net to AR ownership 34.8 126.8Segment Adjusted EBITDAX $284.3 $1,296.2
39
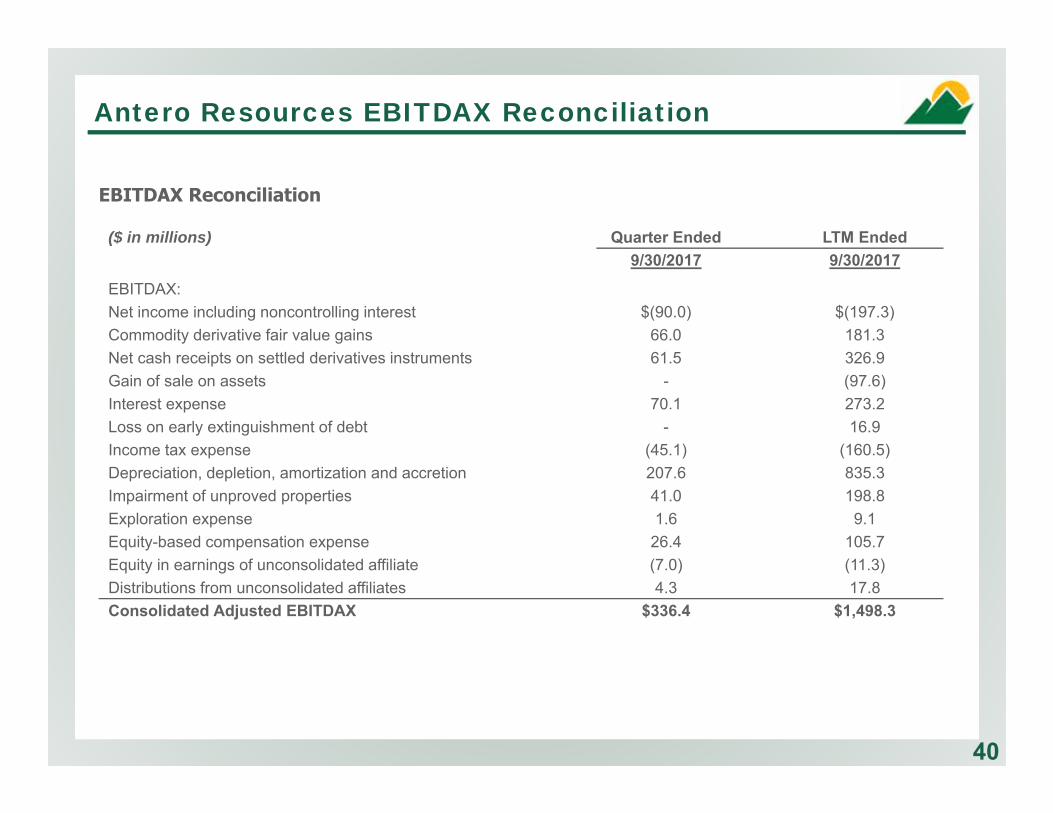
Antero Resources EBITDAX Reconciliation
40
EBITDAX Reconciliation
($ in millions) Quarter Ended LTM Ended9/30/2017 9/30/2017
EBITDAX:Net income including noncontrolling interest $(90.0) $(197.3)Commodity derivative fair value gains 66.0 181.3Net cash receipts on settled derivatives instruments 61.5 326.9Gain of sale on assets - (97.6)Interest expense 70.1 273.2Loss on early extinguishment of debt - 16.9Income tax expense (45.1) (160.5)Depreciation, depletion, amortization and accretion 207.6 835.3Impairment of unproved properties 41.0 198.8Exploration expense 1.6 9.1Equity-based compensation expense 26.4 105.7Equity in earnings of unconsolidated affiliate (7.0) (11.3)Distributions from unconsolidated affiliates 4.3 17.8Consolidated Adjusted EBITDAX $336.4 $1,498.3
Antero Midstream EBITDA Reconciliation
41
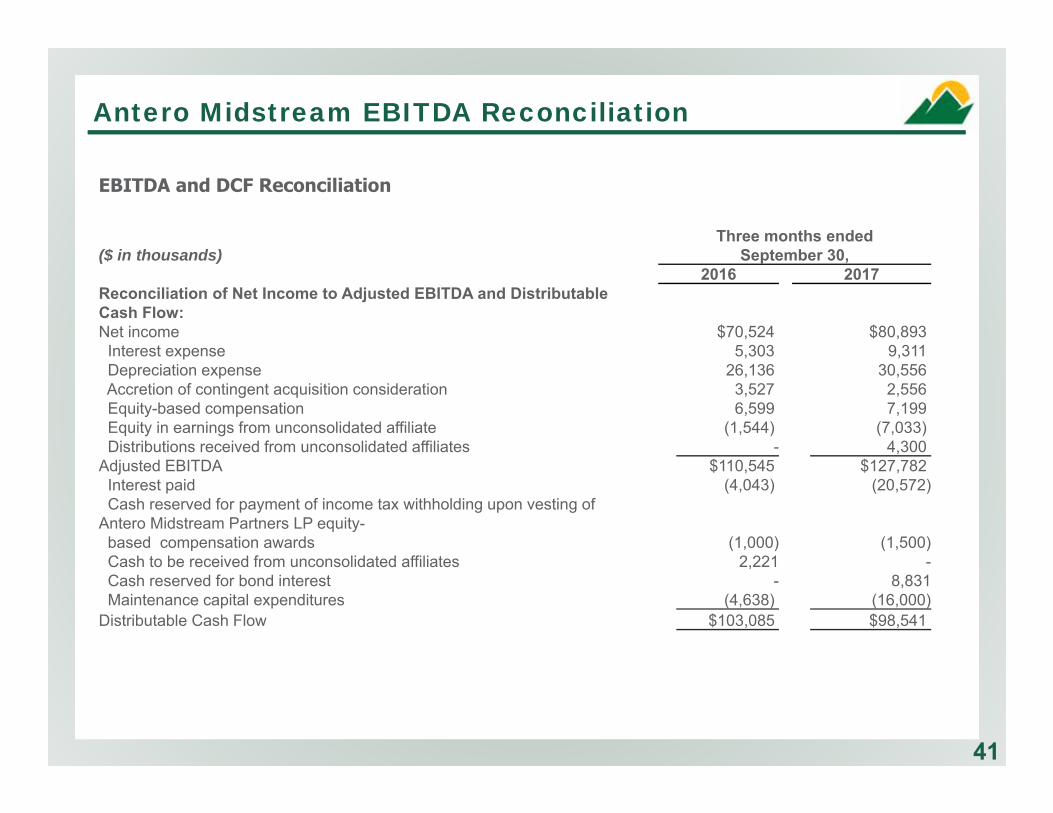
EBITDA and DCF Reconciliation
($ in thousands)Three months ended
September 30,2016 2017
Reconciliation of Net Income to Adjusted EBITDA and Distributable Cash Flow: Net income $70,524 $80,893
Interest expense 5,303 9,311Depreciation expense 26,136 30,556Accretion of contingent acquisition consideration 3,527 2,556Equity-based compensation 6,599 7,199Equity in earnings from unconsolidated affiliate (1,544) (7,033)Distributions received from unconsolidated affiliates - 4,300
Adjusted EBITDA $110,545 $127,782Interest paid (4,043) (20,572)Cash reserved for payment of income tax withholding upon vesting of
Antero Midstream Partners LP equity-based compensation awards (1,000) (1,500)Cash to be received from unconsolidated affiliates 2,221 -Cash reserved for bond interest - 8,831Maintenance capital expenditures (4,638) (16,000)
Distributable Cash Flow $103,085 $98,541
($MMs)
Exploration & Production
Gathering & Processing
Water Handling & Treatment Marketing
Elimination of Intersegment Transactions
Consolidated Total
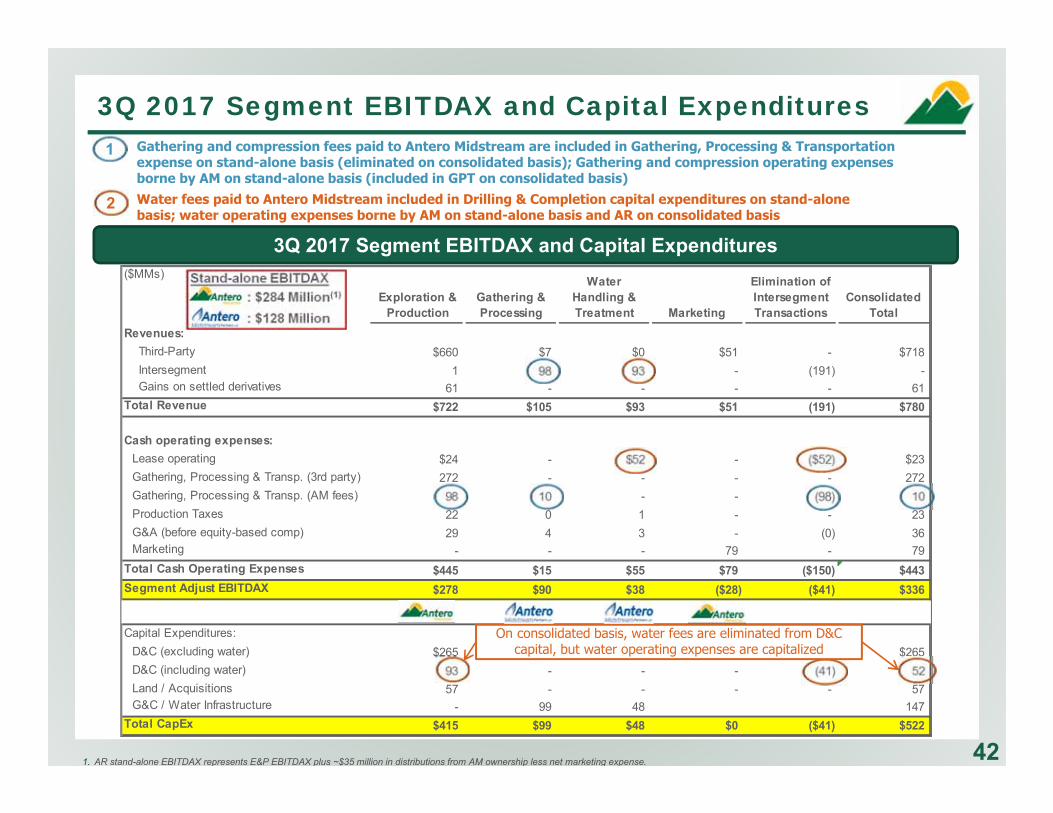
Revenues: Third-Party $660 $7 $0 $51 - $718 Intersegment 1 98 93 - (191) - Gains on settled derivatives 61 - - - - 61Total Revenue $722 $105 $93 $51 (191) $780
Cash operating expenses:Lease operating $24 - $52 - ($52) $23Gathering, Processing & Transp. (3rd party) 272 - - - - 272Gathering, Processing & Transp. (AM fees) 98 10 - - (98) 10Production Taxes 22 0 1 - - 23G&A (before equity-based comp) 29 4 3 - (0) 36Marketing - - - 79 - 79
Total Cash Operating Expenses $445 $15 $55 $79 ($150) $443Segment Adjust EBITDAX $278 $90 $38 ($28) ($41) $336
Capital Expenditures: D&C (excluding water) $265 - - - - $265D&C (including water) 93 - - - (41) 52Land / Acquisitions 57 - - - - 57G&C / Water Infrastructure - 99 48 147
Total CapEx $415 $99 $48 $0 ($41) $522
3Q 2017 Segment EBITDAX and Capital Expenditures
42
3Q 2017 Segment EBITDAX and Capital Expenditures
1
2
Gathering and compression fees paid to Antero Midstream are included in Gathering, Processing & Transportation expense on stand-alone basis (eliminated on consolidated basis); Gathering and compression operating expenses borne by AM on stand-alone basis (included in GPT on consolidated basis)Water fees paid to Antero Midstream included in Drilling & Completion capital expenditures on stand-alone basis; water operating expenses borne by AM on stand-alone basis and AR on consolidated basis
On consolidated basis, water fees are eliminated from D&C capital, but water operating expenses are capitalized
Stand-alone EBITDAX: $284 Million(1)
: $128 Million
1. AR stand-alone EBITDAX represents E&P EBITDAX plus ~$35 million in distributions from AM ownership less net marketing expense.
Cautionary Note
The SEC permits oil and gas companies, in their filings with the SEC, to disclose only proved, probable and possible reserve estimates (collectively, “3P”). Antero has provided internally generated estimates for proved, probable and possible reserves in this presentation in accordance with SEC guidelines and definitions. The estimates of proved, probable and possible reserves as of December 31, 2016 included in this presentation have been audited by Antero’s third-party engineers. Unless otherwise noted, reserve estimates as of December 31, 2016 assume ethane rejection and strip pricing.
Actual quantities that may be ultimately recovered from Antero’s interests may differ substantially from the estimates in this presentation. Factors affecting ultimate recovery include the scope of Antero’s ongoing drilling program, which will be directly affected by commodity prices, the availability of capital, drilling and production costs, availability of drilling services and equipment, drilling results, lease expirations, transportation constraints, regulatory approvals and other factors; and actual drilling results, including geological and mechanical factors affecting recovery rates.
In this presentation:
“3P reserves” refer to Antero’s estimated aggregate proved, probable and possible reserves as of December 31, 2016. The SEC prohibits companies from aggregating proved, probable and possible reserves in filings with the SEC due to the different levels of certainty associated with each reserve category.
“EUR,” or “Estimated Ultimate Recovery,” refers to Antero’s internal estimates of per well hydrocarbon quantities that may be potentially recovered from a hypothetical future well completed as a producer in the area. These quantities do not necessarily constitute or represent reserves within the meaning of the Society of Petroleum Engineer’s Petroleum Resource Management System or the SEC’s oil and natural gas disclosure rules.
“Condensate” refers to gas having a heat content between 1250 BTU and 1300 BTU in the Utica Shale.
“Highly-Rich Gas/Condensate” refers to gas having a heat content between 1275 BTU and 1350 BTU in the Marcellus Shale and 1225 BTU and 1250 BTU in the Utica Shale.
“Highly-Rich Gas” refers to gas having a heat content between 1200 BTU and 1275 BTU in the Marcellus Shale and 1200 BTU and 1225 BTU in the Utica Shale.
“Rich Gas” refers to gas having a heat content of between 1100 BTU and 1200 BTU.
“Dry Gas” refers to gas containing insufficient quantities of hydrocarbons heavier than methane to allow their commercial extraction or to require their removal in order to render the gas suitable for fuel use.
Regarding Hydrocarbon Quantities
43


![Runtastic Company Overview [December 2014]](https://img.pdfslide.net/doc/110x75/55a65dfb1a28ab37798b4881/runtastic-company-overview-december-2014.jpg)


![Investor Presentation - December 2015 [Company Update]](https://img.pdfslide.net/doc/110x75/577ca6e21a28abea748c142b/investor-presentation-december-2015-company-update.jpg)


![Investor Presentation for December 31, 2015 [Company Update]](https://img.pdfslide.net/doc/110x75/577ca4f01a28abea748b540b/investor-presentation-for-december-31-2015-company-update.jpg)