Embed Size (px)
Citation preview
1
Date: As of 31st March 2018
PT Steel Pipe Industry of Indonesia TbkCompany Presentation
Disclaimer
These materials have been prepared by PT Steel Pipe Industry of Indonesia (“SPINDO” or the “Company”) solely for informational purposes, andunless marked otherwise, are strictly confidential and may not be taken away, reproduced or redistributed to any other person. By attending thispresentation, participants agree not to remove this document from the conference room where such documents are provided without expresswritten consent from the Company. Participants agree further not to photograph, copy or otherwise reproduce these materials at any point oftime during the presentation or while in your possession. By attending this presentation, you are agreeing to be bound by the foregoing restrictions.Any failure to comply with these restrictions may result in a violation of applicable laws and commencement of legal proceedings against you.
It is not the Company’s intention to provide, and you may not rely on these materials as providing, a complete or comprehensive analysis of theCompany’s financial position or prospects. The information contained in these materials has not been independently verified and is subject toverification, completion and change without notice. The information contained in these materials is current as of the date hereof and are subjectto change without notice, and its accuracy is not guaranteed. The Company is not under any obligation to update or keep current theinformation contained in these materials subsequent to the date hereof. Accordingly, no representation or warranty, express or implied, is made orgiven by or on behalf of the Company, or any of its directors and affiliates or any other person, as to, and no reliance should be placed for anypurposes whatsoever on, the fairness, accuracy, completeness or correctness of, or any errors or omissions in, the information contained in thesematerials. Neither the Company, its directors, officers or employees nor any other person accepts any liability whatsoever for any loss howsoever
2
materials. Neither the Company, its directors, officers or employees nor any other person accepts any liability whatsoever for any loss howsoeverarising from any use of these materials or their contents or otherwise arising in connection therewith.
These materials contain historical information of the Company which should not be regarded as an indication of future performance or results.These materials may also contain forward-looking statements that are, by their nature, subject to significant risks and uncertainties. These forward-looking statements reflect the Company’s current views with respect to future events and are not a guarantee of future performance or results.Actual results, performance or achievements of the Company may differ materially from any future results, performance or achievementsexpressed or implied by such forward-looking statements. Such forward-looking statements are based on numerous assumptions regarding theCompany’s present and future business strategies and the environment in which the Company will operate in the future, and must be readtogether with such assumptions. Predictions, projections or forecasts of the economy or economic trends of the markets are not necessarilyindicative of the future or likely performance of the Company, and the forecast financial performance of the Company is not guaranteed. Noreliance should be placed on these forward-looking statements, if any.
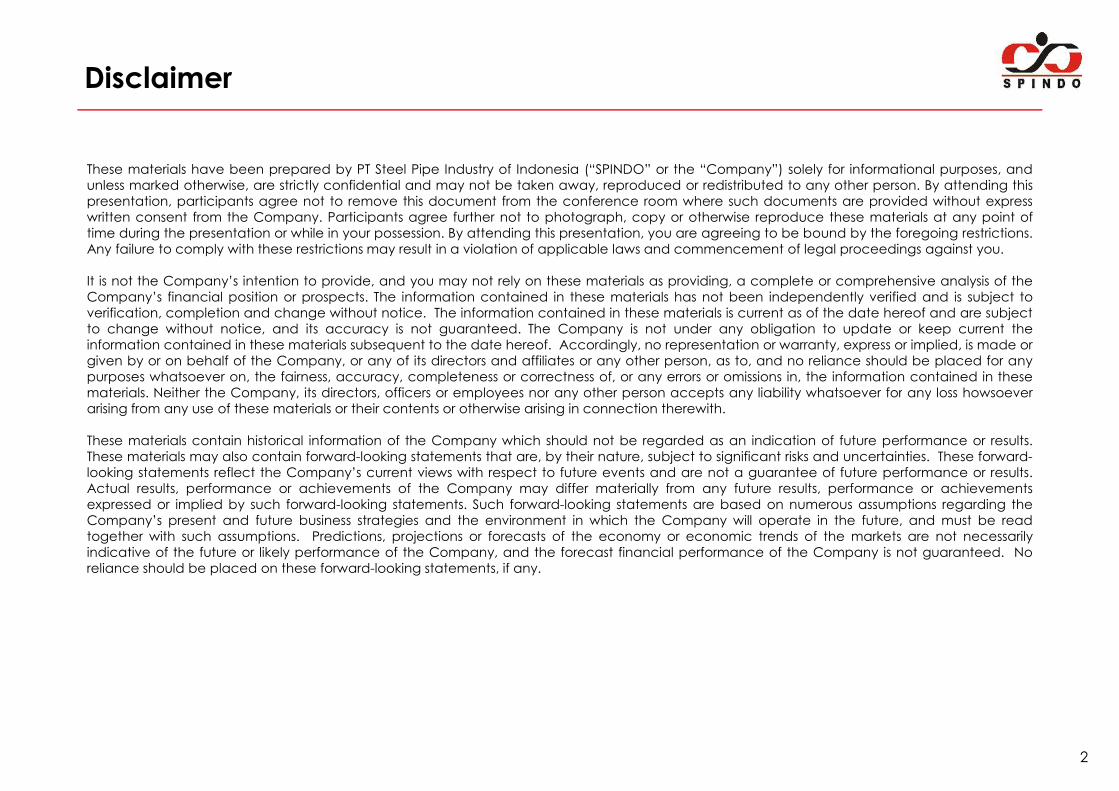
Financial Overview
Income Statement (IDR bn) 2014 2015 2016 2017
Revenue 3.367 3.584 3.259 3.663
Gross Profit 564 773 699 563
Net Income 214 159 103 9
Balance Sheet (IDR bn) 2014 2015 2016 2017
Current Assets 3.580 2.993 3.278 3.432
Non Current Asset 1.863 2.455 2.764 2.838
Total Asset 5.443 5.448 6.042 6.269
3
Current Liabil ities 2.636 2.328 2.827 2.280
Non Current Liabilities 502 567 570 1.149
Total Liabilities 3.138 2.895 3.397 3.428
Total Equity 2.305 2.553 2.645 2.841
Ratios 2014 2015 2016 2017
Gross Margin 16,8% 21,6% 21,4% 15,4%
Net Profit Margin 6,4% 4,4% 3,2% 0,2%
Return on Asset 3,9% 2,9% 1,7% 0,1%
Return on Equity 9,3% 6,2% 3,9% 0,3%
Current Ratio 1,4x 1,3x 1,2 1,5
Liabil ities to Equity 1,4x 1,1x 1,3 1,2
Liabil ities to Asset 0,6x 0,5x 0,6 0,5
4
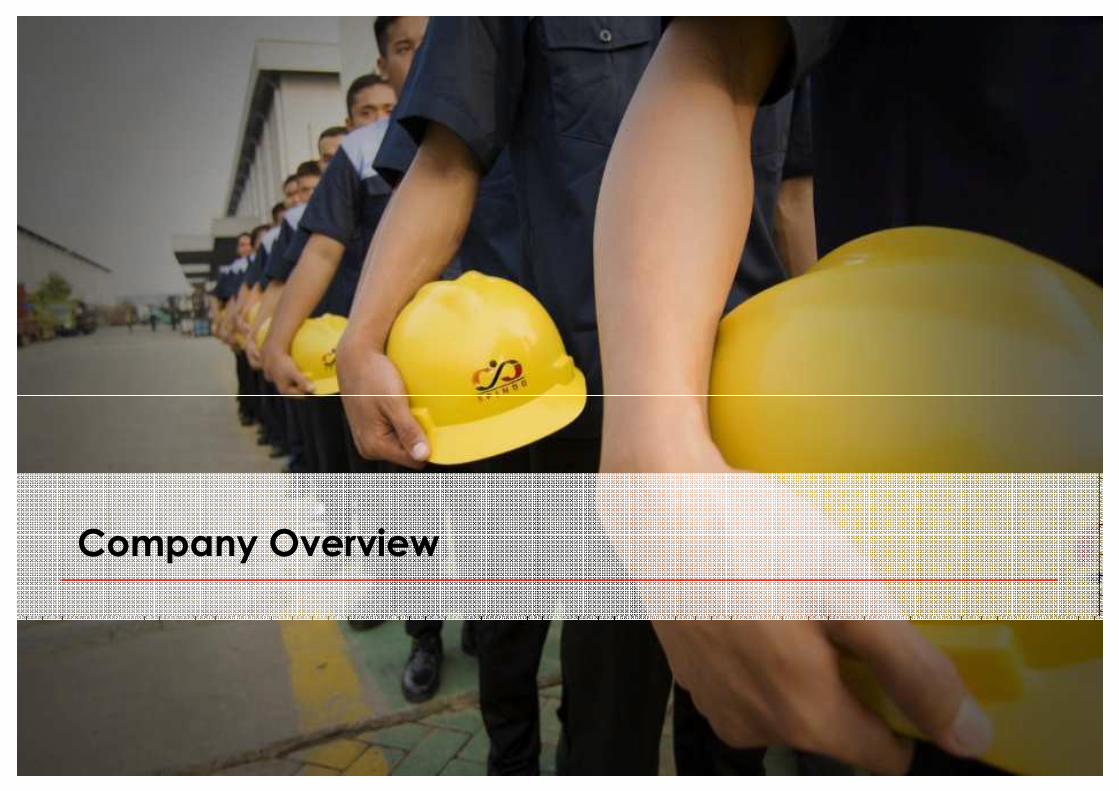
Company Overview
Largest Steel Pipe Producer in Indonesia
· PT Steel Pipe Industry of Indonesia (“Spindo”) was founded by CV Gayantara, C.Itoh & Company Limited and Kawasaki Steel Corporation in 1971 as a foreign investment co and subsequently transformed into a domestic investment company in 1993
· Leading manufacturer of steel pipe products and considered as the largest in Indonesia by production capacity. As of March 2017, total production capacity stood at more than 50k MT/ month
· Product portfolio consists of diverse range of customized (or “made-to-order”) and standardized (or “made-for-stock”)carbon and stainless steel pipes and pipe-related products
· Key end-user markets include 1) construction, infrastructure and utilities 2) oil & gas 3)furniture and 4) automotive
· Products sold under premium “Tetsura” and “Spindo” brand. 98.7% of revenues generated domestically
Sales Channels & Key Customers
Direct Sales*
Indirect Sales
5
· Other components of revenue include 1) steel-pipe services such as coating, shearing, slitting 2) laboratory quality control testing and 3) scrap sales
Distributors Agents
Source: Company filings
* Select customers only
Simplified Value Chain
Carbon steel
and stainless
steel coils
Cutting of steel coil to
width, bending,
followed by welding
the seam at the
wedges
Steel pipe products
SPINDO
Well Recognised for Industry Excellence
API Certification
SNI Marking Certification
Quality Assurance Test ISO 9001:2008
Company Milestones
2010s
1990s
• 1990: Ibnu Susanto acquired 90% of the shares in our Company
• 1991: PT Radjin established our Pasuruan facility, which marked the beginning of our capability to produce spiral welded pipes
• 1996: Obtained API 5L 0313 certification for our spiral welding process
• 1998: Merged with PT Radjin, with PT Steel Pipe Industry of Indonesia being the surviving company
2000s
• 2005: Established our Karawang facility
• 2007: Obtained ISO TS Quality Management System for automotive pipes in the Karawang facility
• 2009: Became approved supplier of Yamaha (one of the top 10 bike manufacturing companies globally)
6
1970s
1990s
2000s
2010s
Source: Company filings
1970s
1971: Established as a foreign investment company incorporated in Indonesia by PT Gayantara, Itochu Corporation and Kawasaki Steel Corporation
2010s
• 2011: Obtained Occupational Health and Safety Management System ("OHSAS") certification
• 2013: Reg S Initial Public Offering of our Company on 28 January 2013, raised US$88m
• 2014: Commenced operations of our Sidoarjo plant
• 2015: Official opening of our Karawang expansion plant
• 2015: Signing of memorandum of understanding for procurement of raw material between our Company, JFE Steel Corporation ("JFE") and Marubeni-Itochu Steel Inc. ("MISI")
• 2016: Selected as Best 40 Companies by the Indonesian Analyst Association and became a member of the Kompas 100 index
• 2016: Commenced operation of warehouses in Bandung and Jakarta
• 2017: Commenced operation of warehouse in Samarinda, Kalimantan
Our PeopleBoard of Comissioners
Mr. Soesilo Widjaja has held his position as Independent Commissioner of PT
SPINDO, Tbk. since April 2012 and member of audit
committee. Previously, he worked as General Manager of
PT SPINDO, Tbk from 1997 to 2008 and Assistant General
Manager of PT Indonesia Steel Tube Works, an Indonesian
steel manufacturing company from 1973 to 1994.
Mr. Wardana Hudianto has held the position as President Commissioner of PT SPINDO, Tbk. Since
1997. He has also held the position as Commissioner of PT. Cakra Bhakti
Para Putra since 2003, which previously holds 93.8 percent of the Issued
share capital in our Company. From 1993 to 1998, he was the President
Commissioner of PT. Radjin, Surabaya, which merged with our company in
1998.
Mr. Makmur Widjajahas held the position as Vice President Commissioner and an Independent
Commissioner of PT SPINDO, Tbk. since April 2012, and member of audit
committee. He has also held the position as President Commissioner of
PT. Makinta Securities since August 2009. He completed his education at
the Faculty of Economics, Parahyangan Catholic University, Bandung in
Mrs. Endang Fifi Susantohas held the position asCommissioner of PT SPINDO, Tbk. since 2003. She
previously was General Manager of PT. Saranacentral Bajatama, Tbk.
from 1995 to 1998, and Senior Staff of Hans Tuanakota & Mustofa, Public
Accountant from 1993 to 1995. She obtained Bachelors of Commerce
from University of Western, Australia in 1992.
Mrs. Ingewati/Kong Ay Inghas held the position as Commissioner of PT SPINDO, Tbk. since 2003. She
is the spouse of the late Tjahjono Tedjokoesoemo, one of the founders of
the original PT SPINDO, Tbk.
the Faculty of Economics, Parahyangan Catholic University, Bandung in
1985 Masters of Management from the Prasetya Mulya Business School
in 1992.
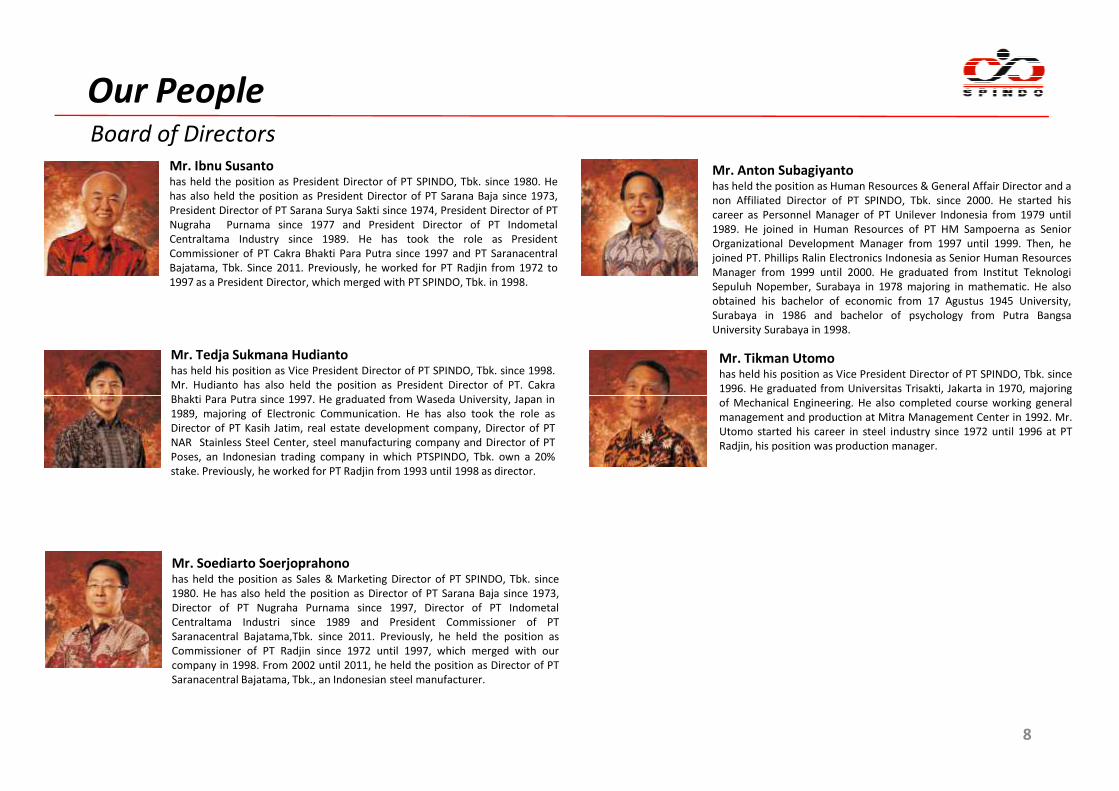
Our PeopleBoard of Directors
Mr. Ibnu Susantohas held the position as President Director of PT SPINDO, Tbk. since 1980. He
has also held the position as President Director of PT Sarana Baja since 1973,
President Director of PT Sarana Surya Sakti since 1974, President Director of PT
Nugraha Purnama since 1977 and President Director of PT Indometal
Centraltama Industry since 1989. He has took the role as President
Commissioner of PT Cakra Bhakti Para Putra since 1997 and PT Saranacentral
Bajatama, Tbk. Since 2011. Previously, he worked for PT Radjin from 1972 to
1997 as a President Director, which merged with PT SPINDO, Tbk. in 1998.
Mr. Tedja Sukmana Hudianto has held his position as Vice President Director of PT SPINDO, Tbk. since 1998.
Mr. Hudianto has also held the position as President Director of PT. Cakra
Bhakti Para Putra since 1997. He graduated from Waseda University, Japan in
Mr. Tikman Utomo has held his position as Vice President Director of PT SPINDO, Tbk. since
1996. He graduated from Universitas Trisakti, Jakarta in 1970, majoring
of Mechanical Engineering. He also completed course working general
Mr. Anton Subagiyantohas held the position as Human Resources & General Affair Director and a
non Affiliated Director of PT SPINDO, Tbk. since 2000. He started his
career as Personnel Manager of PT Unilever Indonesia from 1979 until
1989. He joined in Human Resources of PT HM Sampoerna as Senior
Organizational Development Manager from 1997 until 1999. Then, he
joined PT. Phillips Ralin Electronics Indonesia as Senior Human Resources
Manager from 1999 until 2000. He graduated from Institut Teknologi
Sepuluh Nopember, Surabaya in 1978 majoring in mathematic. He also
obtained his bachelor of economic from 17 Agustus 1945 University,
Surabaya in 1986 and bachelor of psychology from Putra Bangsa
University Surabaya in 1998.
8
Bhakti Para Putra since 1997. He graduated from Waseda University, Japan in
1989, majoring of Electronic Communication. He has also took the role as
Director of PT Kasih Jatim, real estate development company, Director of PT
NAR Stainless Steel Center, steel manufacturing company and Director of PT
Poses, an Indonesian trading company in which PTSPINDO, Tbk. own a 20%
stake. Previously, he worked for PT Radjin from 1993 until 1998 as director.
of Mechanical Engineering. He also completed course working general
management and production at Mitra Management Center in 1992. Mr.
Utomo started his career in steel industry since 1972 until 1996 at PT
Radjin, his position was production manager.
Mr. Soediarto Soerjoprahonohas held the position as Sales & Marketing Director of PT SPINDO, Tbk. since
1980. He has also held the position as Director of PT Sarana Baja since 1973,
Director of PT Nugraha Purnama since 1997, Director of PT Indometal
Centraltama Industri since 1989 and President Commissioner of PT
Saranacentral Bajatama,Tbk. since 2011. Previously, he held the position as
Commissioner of PT Radjin since 1972 until 1997, which merged with our
company in 1998. From 2002 until 2011, he held the position as Director of PT
Saranacentral Bajatama, Tbk., an Indonesian steel manufacturer.
Merah Putih Bridge - Ambon
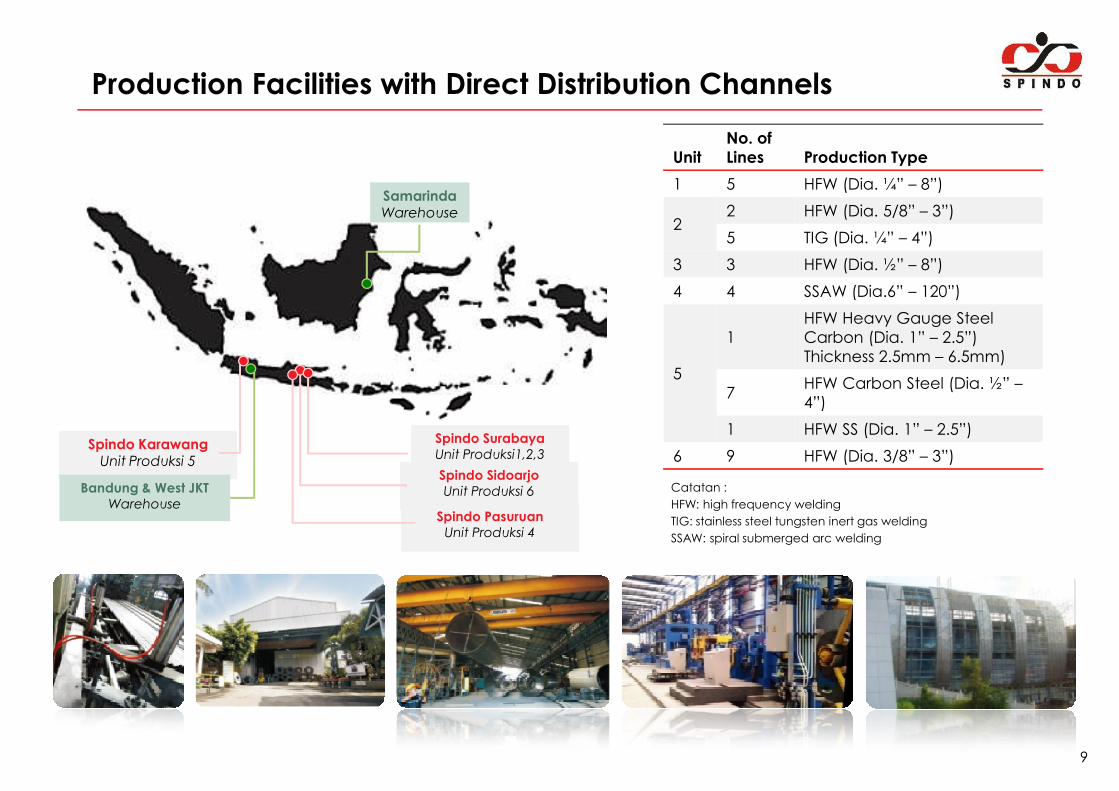
Production Facilities with Direct Distribution Channels
SamarindaWarehouse
Unit
No. of
Lines Production Type
1 5 HFW (Dia. ¼” – 8”)
22 HFW (Dia. 5/8” – 3”)
5 TIG (Dia. ¼” – 4”)
3 3 HFW (Dia. ½” – 8”)
4 4 SSAW (Dia.6” – 120”)
5
1HFW Heavy Gauge Steel Carbon (Dia. 1” – 2.5”) Thickness 2.5mm – 6.5mm)
7HFW Carbon Steel (Dia. ½” –4”)
9
Spindo Sidoarjo
Unit Produksi 6
Spindo Surabaya
Unit Produksi1,2,3
Spindo Pasuruan
Unit Produksi 4
Spindo KarawangUnit Produksi 5
Bandung & West JKT
Warehouse
74”)
1 HFW SS (Dia. 1” – 2.5”)
6 9 HFW (Dia. 3/8” – 3”)
Catatan :
HFW: high frequency welding
TIG: stainless steel tungsten inert gas welding
SSAW: spiral submerged arc welding
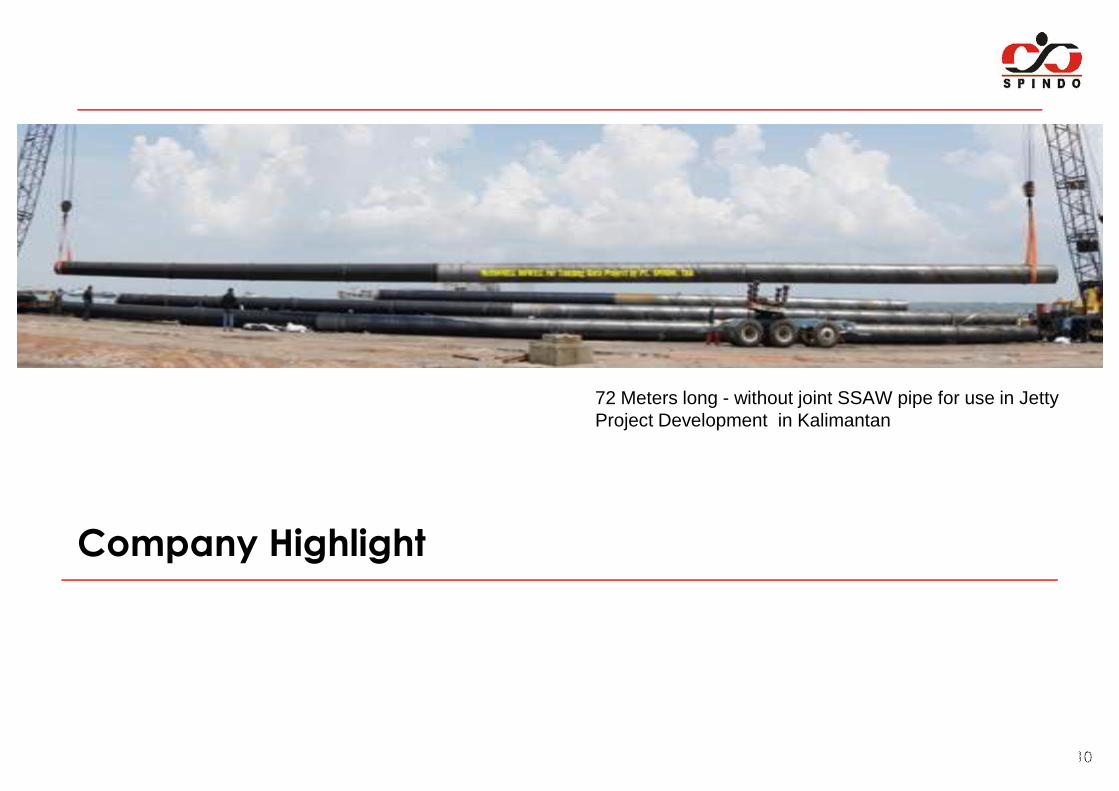
72 Meters long - without joint SSAW pipe for use in Jetty
10
Company Highlight
72 Meters long - without joint SSAW pipe for use in Jetty Project Development in Kalimantan
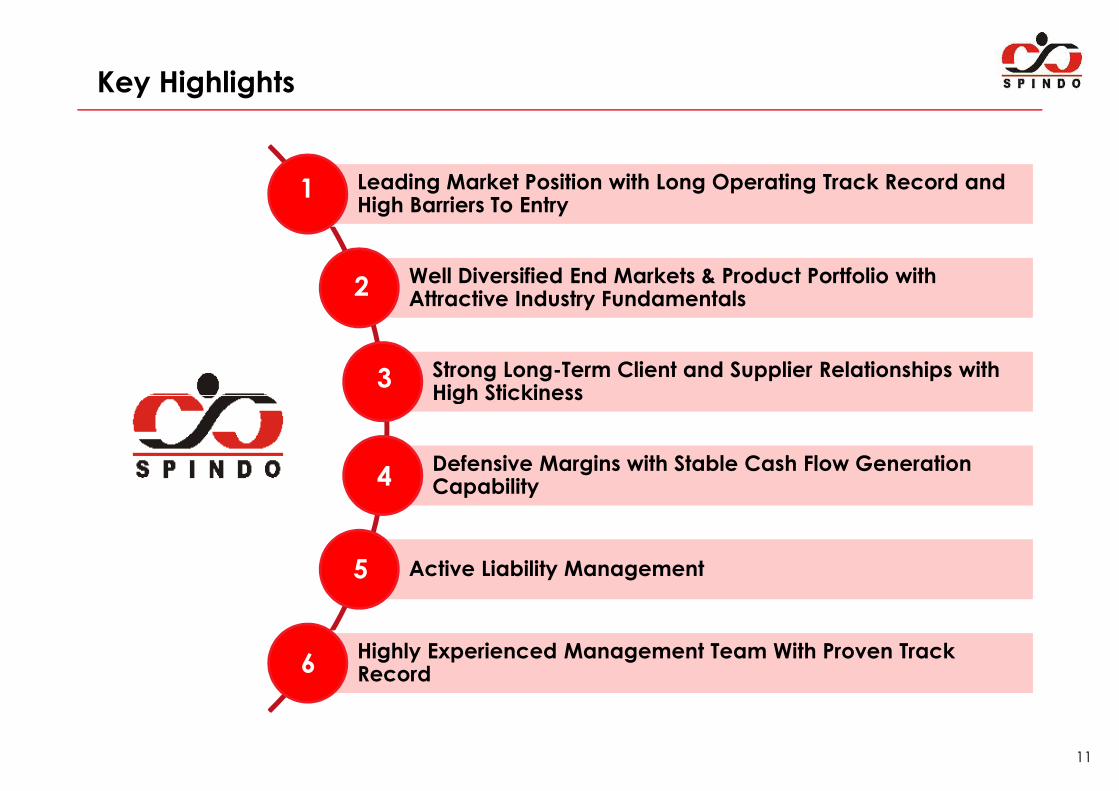
Key Highlights
Leading Market Position with Long Operating Track Record and High Barriers To Entry
Well Diversified End Markets & Product Portfolio with Attractive Industry Fundamentals
Strong Long-Term Client and Supplier Relationships with High Stickiness
1
2
3
11
High Stickiness
Defensive Margins with Stable Cash Flow Generation Capability
Active Liability Management
Highly Experienced Management Team With Proven Track Record
4
5
6
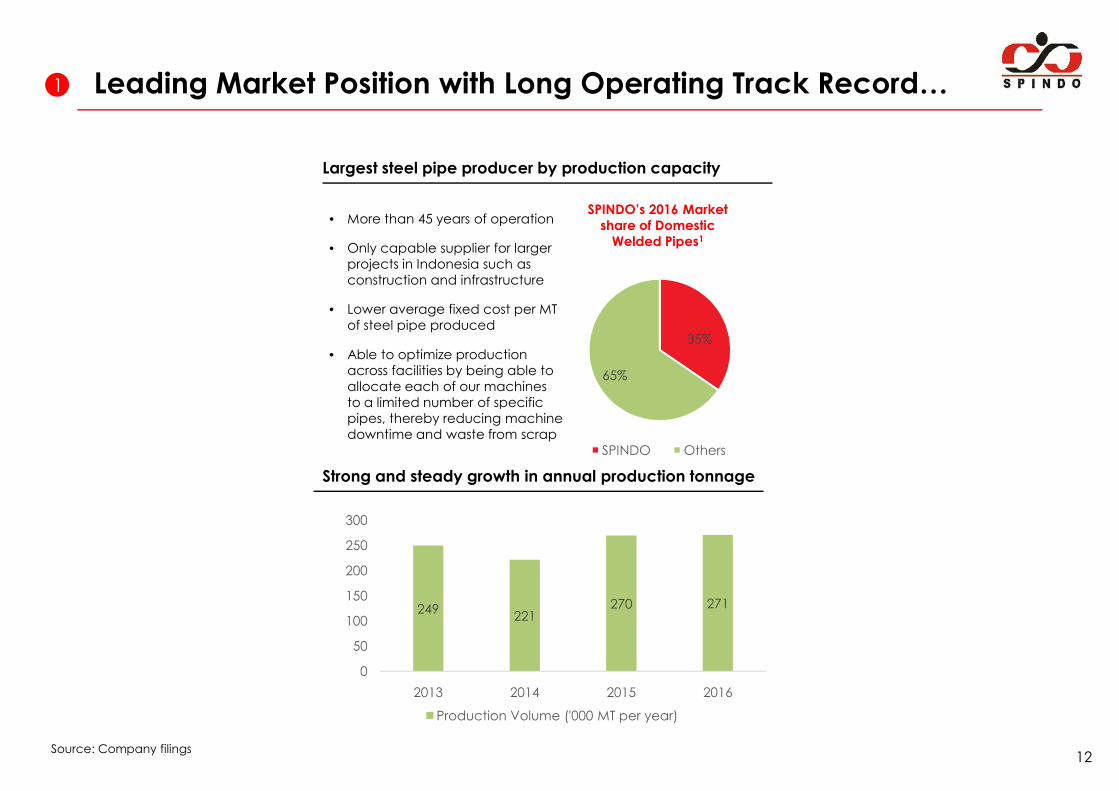
Leading Market Position with Long Operating Track Record…
Largest steel pipe producer by production capacity
• More than 45 years of operation
• Only capable supplier for larger projects in Indonesia such as construction and infrastructure
• Lower average fixed cost per MT of steel pipe produced
• Able to optimize production across facilities by being able to allocate each of our machines to a limited number of specific
SPINDO’s 2016 Market
share of Domestic
Welded Pipes1
35%
65%
1
12
to a limited number of specific pipes, thereby reducing machine downtime and waste from scrap
SPINDO Others
Strong and steady growth in annual production tonnage
249221
270 271
0
50
100
150
200
250
300
2013 2014 2015 2016
Production Volume ('000 MT per year)
Source: Company filings
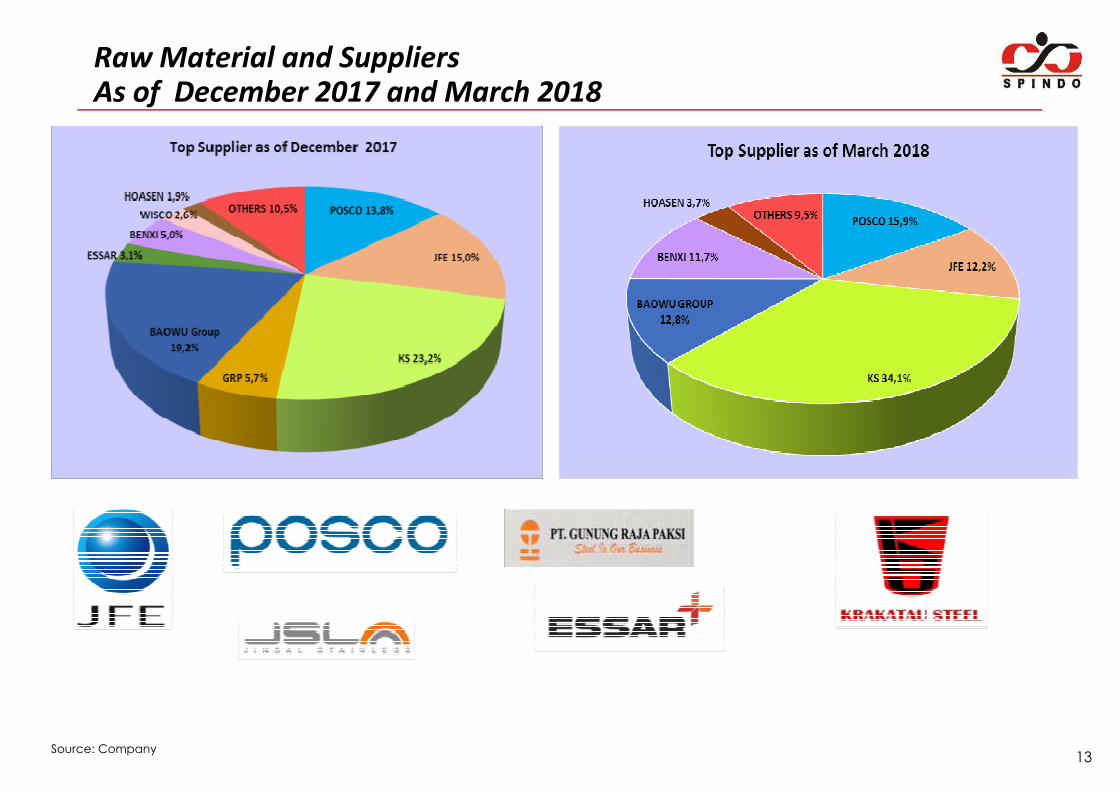
Raw Material and Suppliers As of December 2017 and March 2018
13Source: Company
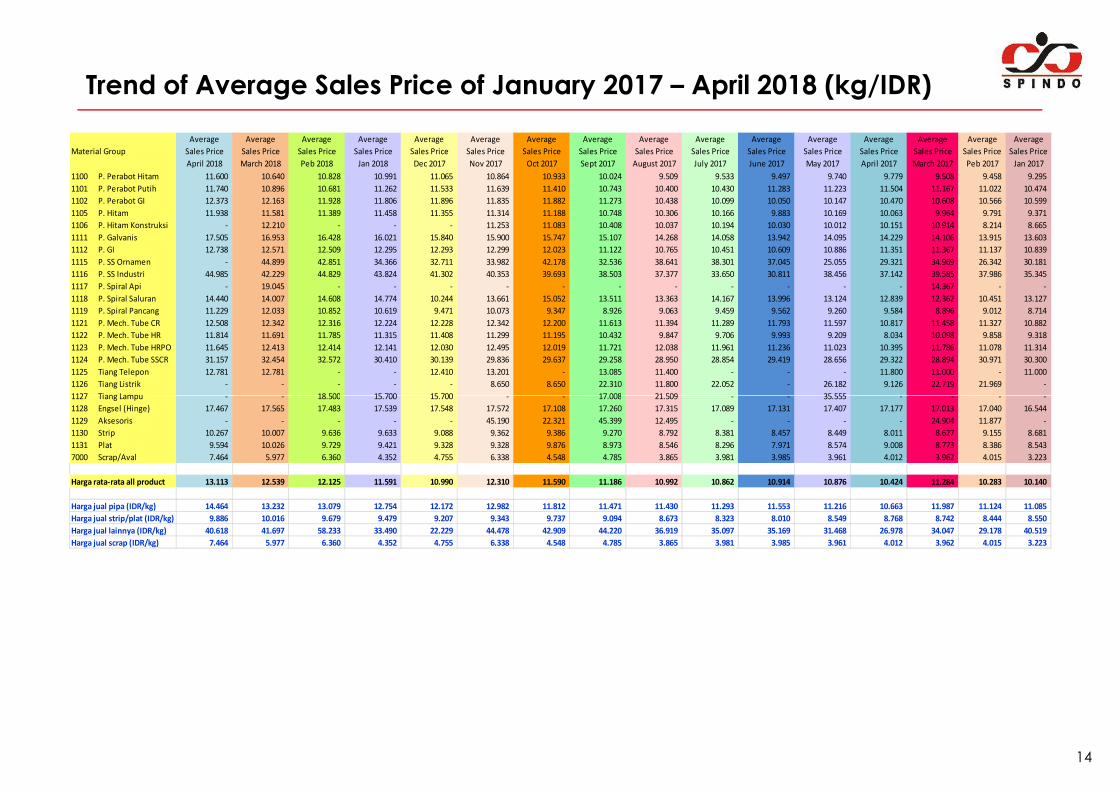
Trend of Average Sales Price of January 2017 – April 2018 (kg/IDR)
Average Average Average Average Average Average Average Average Average Average Average Average Average Average Average Average
Material Group Sales Price Sales Price Sales Price Sales Price Sales Price Sales Price Sales Price Sales Price Sales Price Sales Price Sales Price Sales Price Sales Price Sales Price Sales Price Sales Price
April 2018 March 2018 Peb 2018 Jan 2018 Dec 2017 Nov 2017 Oct 2017 Sept 2017 August 2017 July 2017 June 2017 May 2017 April 2017 March 2017 Peb 2017 Jan 2017
1100 P. Perabot Hitam 11.600 10.640 10.828 10.991 11.065 10.864 10.933 10.024 9.509 9.533 9.497 9.740 9.779 9.508 9.458 9.295
1101 P. Perabot Putih 11.740 10.896 10.681 11.262 11.533 11.639 11.410 10.743 10.400 10.430 11.283 11.223 11.504 11.167 11.022 10.474
1102 P. Perabot GI 12.373 12.163 11.928 11.806 11.896 11.835 11.882 11.273 10.438 10.099 10.050 10.147 10.470 10.608 10.566 10.599
1105 P. Hitam 11.938 11.581 11.389 11.458 11.355 11.314 11.188 10.748 10.306 10.166 9.883 10.169 10.063 9.964 9.791 9.371
1106 P. Hitam Konstruksi - 12.210 - - - 11.253 11.083 10.408 10.037 10.194 10.030 10.012 10.151 10.914 8.214 8.665
1111 P. Galvanis 17.505 16.953 16.428 16.021 15.840 15.900 15.747 15.107 14.268 14.058 13.942 14.095 14.229 14.106 13.915 13.603
1112 P. GI 12.738 12.571 12.509 12.295 12.293 12.299 12.023 11.122 10.765 10.451 10.609 10.886 11.351 11.367 11.137 10.839
1115 P. SS Ornamen - 44.899 42.851 34.366 32.711 33.982 42.178 32.536 38.641 38.301 37.045 25.055 29.321 34.969 26.342 30.181
1116 P. SS Industri 44.985 42.229 44.829 43.824 41.302 40.353 39.693 38.503 37.377 33.650 30.811 38.456 37.142 39.585 37.986 35.345
1117 P. Spiral Api - 19.045 - - - - - - - - - - - 14.367 - -
1118 P. Spiral Saluran 14.440 14.007 14.608 14.774 10.244 13.661 15.052 13.511 13.363 14.167 13.996 13.124 12.839 12.362 10.451 13.127
1119 P. Spiral Pancang 11.229 12.033 10.852 10.619 9.471 10.073 9.347 8.926 9.063 9.459 9.562 9.260 9.584 8.896 9.012 8.714
1121 P. Mech. Tube CR 12.508 12.342 12.316 12.224 12.228 12.342 12.200 11.613 11.394 11.289 11.793 11.597 10.817 11.458 11.327 10.882
1122 P. Mech. Tube HR 11.814 11.691 11.785 11.315 11.408 11.299 11.195 10.432 9.847 9.706 9.993 9.209 8.034 10.098 9.858 9.318
1123 P. Mech. Tube HRPO 11.645 12.413 12.414 12.141 12.030 12.495 12.019 11.721 12.038 11.961 11.236 11.023 10.395 11.786 11.078 11.314
1124 P. Mech. Tube SSCR 31.157 32.454 32.572 30.410 30.139 29.836 29.637 29.258 28.950 28.854 29.419 28.656 29.322 28.894 30.971 30.300
1125 Tiang Telepon 12.781 12.781 - - 12.410 13.201 - 13.085 11.400 - - - 11.800 11.000 - 11.000
1126 Tiang Listrik - - - - - 8.650 8.650 22.310 11.800 22.052 - 26.182 9.126 22.719 21.969 -
1127 Tiang Lampu - - 18.500 15.700 15.700 - - 17.008 21.509 - - 35.555 - - - -
14
1127 Tiang Lampu - - 18.500 15.700 15.700 - - 17.008 21.509 - - 35.555 - - - -
1128 Engsel (Hinge) 17.467 17.565 17.483 17.539 17.548 17.572 17.108 17.260 17.315 17.089 17.131 17.407 17.177 17.013 17.040 16.544
1129 Aksesoris - - - - - 45.190 22.321 45.399 12.495 - - - - 24.904 11.877 -
1130 Strip 10.267 10.007 9.636 9.633 9.088 9.362 9.386 9.270 8.792 8.381 8.457 8.449 8.011 8.627 9.155 8.681
1131 Plat 9.594 10.026 9.729 9.421 9.328 9.328 9.876 8.973 8.546 8.296 7.971 8.574 9.008 8.773 8.386 8.543
7000 Scrap/Aval 7.464 5.977 6.360 4.352 4.755 6.338 4.548 4.785 3.865 3.981 3.985 3.961 4.012 3.962 4.015 3.223
Harga rata-rata all product 13.113 12.539 12.125 11.591 10.990 12.310 11.590 11.186 10.992 10.862 10.914 10.876 10.424 11.284 10.283 10.140
Harga jual pipa (IDR/kg) 14.464 13.232 13.079 12.754 12.172 12.982 11.812 11.471 11.430 11.293 11.553 11.216 10.663 11.987 11.124 11.085
Harga jual strip/plat (IDR/kg) 9.886 10.016 9.679 9.479 9.207 9.343 9.737 9.094 8.673 8.323 8.010 8.549 8.768 8.742 8.444 8.550
Harga jual lainnya (IDR/kg) 40.618 41.697 58.233 33.490 22.229 44.478 42.909 44.220 36.919 35.097 35.169 31.468 26.978 34.047 29.178 40.519
Harga jual scrap (IDR/kg) 7.464 5.977 6.360 4.352 4.755 6.338 4.548 4.785 3.865 3.981 3.985 3.961 4.012 3.962 4.015 3.223
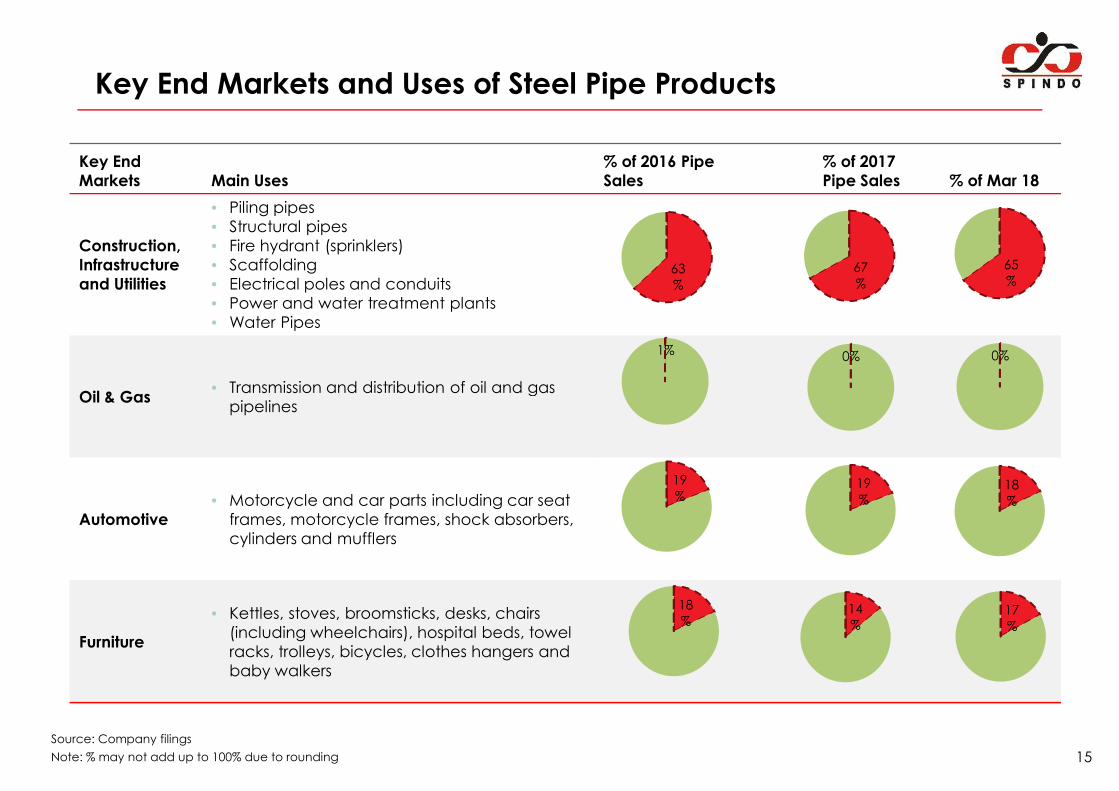
Key End Markets and Uses of Steel Pipe Products
Key End
Markets Main Uses
% of 2016 Pipe
Sales
% of 2017
Pipe Sales % of Mar 18
Construction,
Infrastructure
and Utilities
• Piling pipes• Structural pipes• Fire hydrant (sprinklers)• Scaffolding• Electrical poles and conduits• Power and water treatment plants• Water Pipes
Oil & Gas• Transmission and distribution of oil and gas
63
%
1%
67
%
0%
65
%
0%
15
Source: Company filings
Note: % may not add up to 100% due to rounding
Oil & Gas• Transmission and distribution of oil and gas
pipelines
Automotive
• Motorcycle and car parts including car seat frames, motorcycle frames, shock absorbers, cylinders and mufflers
Furniture
• Kettles, stoves, broomsticks, desks, chairs (including wheelchairs), hospital beds, towel racks, trolleys, bicycles, clothes hangers and baby walkers
19
%
18
%
19
%
14
%
18
%
17
%
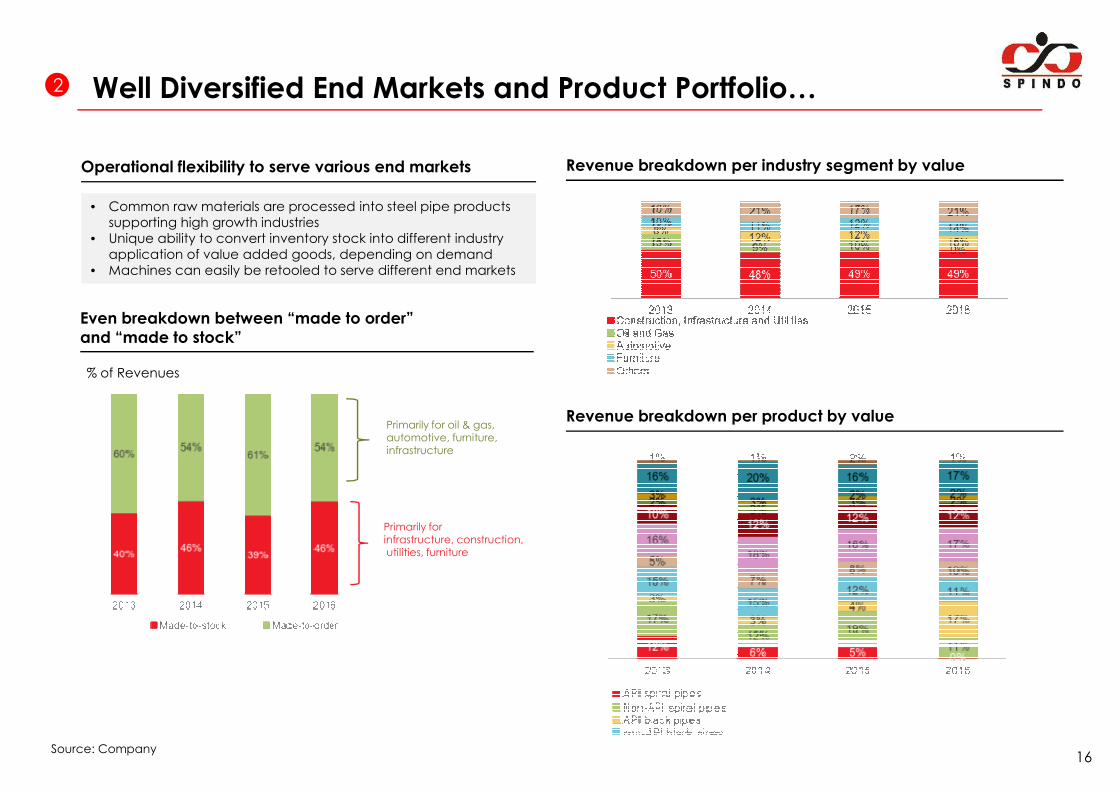
Well Diversified End Markets and Product Portfolio…2
Revenue breakdown per industry segment by value
Even breakdown between “made to order”
and “made to stock”
Operational flexibility to serve various end markets
• Common raw materials are processed into steel pipe products supporting high growth industries
• Unique ability to convert inventory stock into different industry application of value added goods, depending on demand
• Machines can easily be retooled to serve different end markets
% of Revenues
16
Primarily for infrastructure, construction,utilities, furniture
Primarily for oil & gas, automotive, furniture, infrastructure
Revenue breakdown per product by value
Source: Company
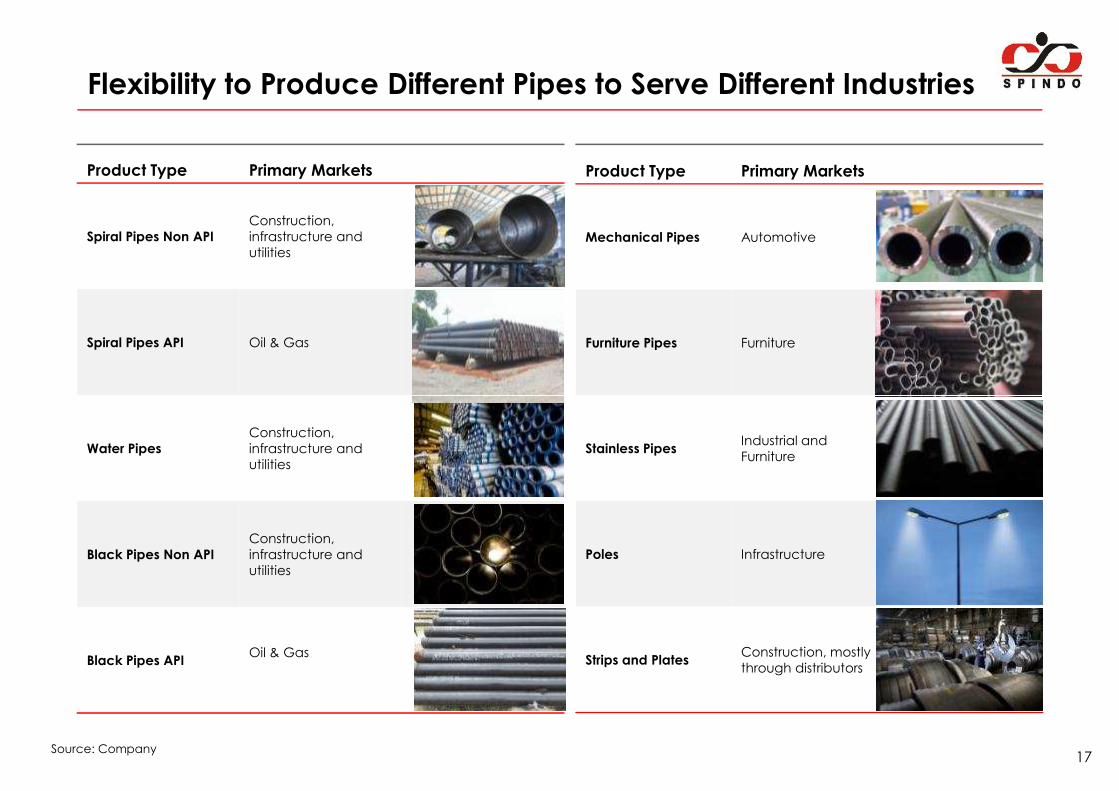
Flexibility to Produce Different Pipes to Serve Different Industries
Product Type Primary Markets
Spiral Pipes Non API
Construction, infrastructure and utilities
Spiral Pipes API Oil & Gas
Product Type Primary Markets
Mechanical Pipes Automotive
Furniture Pipes Furniture
17
Water Pipes
Construction, infrastructure and utilities
Black Pipes Non API
Construction, infrastructure and utilities
Black Pipes APIOil & Gas
Stainless PipesIndustrial and Furniture
Poles Infrastructure
Strips and PlatesConstruction, mostly through distributors
Source: Company
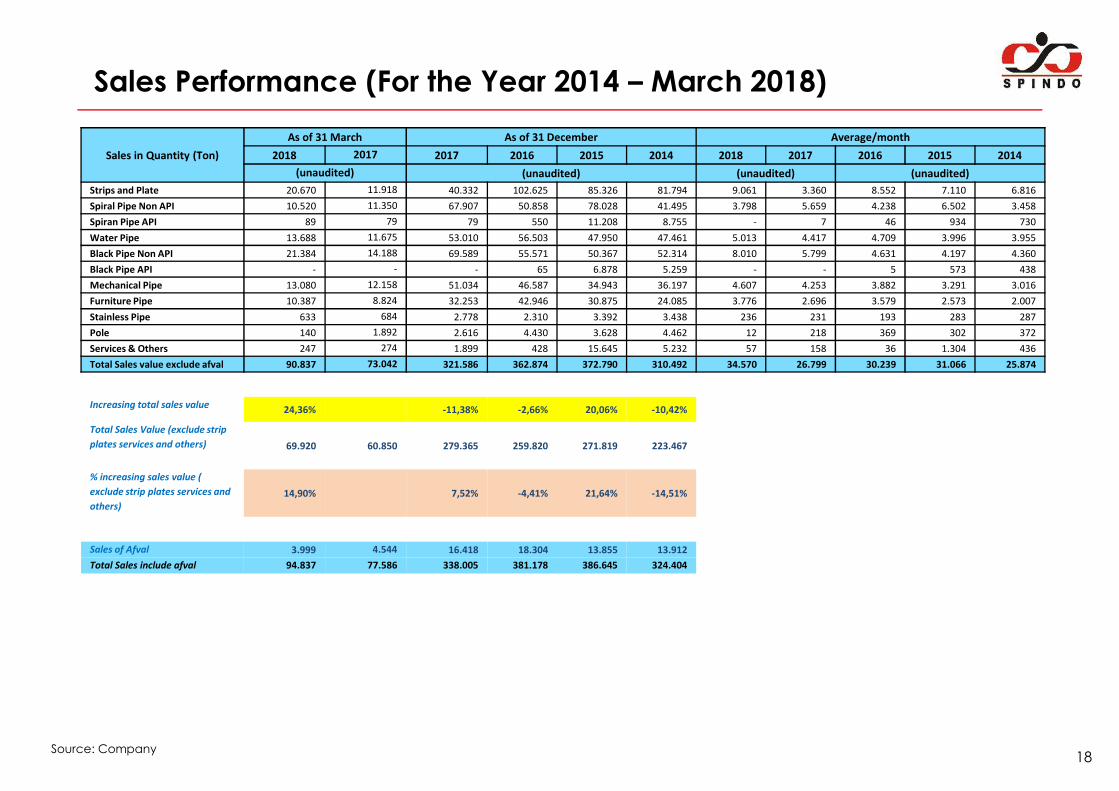
Sales Performance (For the Year 2014 – March 2018)
Sales in Quantity (Ton)
As of 31 March As of 31 December Average/month
2018 2017 2017 2016 2015 2014 2018 2017 2016 2015 2014
(unaudited) (unaudited) (unaudited) (unaudited)
Strips and Plate 20.670 11.918 40.332 102.625 85.326 81.794 9.061 3.360 8.552 7.110 6.816
Spiral Pipe Non API 10.520 11.350 67.907 50.858 78.028 41.495 3.798 5.659 4.238 6.502 3.458
Spiran Pipe API 89 79 79 550 11.208 8.755 - 7 46 934 730
Water Pipe 13.688 11.675 53.010 56.503 47.950 47.461 5.013 4.417 4.709 3.996 3.955
Black Pipe Non API 21.384 14.188 69.589 55.571 50.367 52.314 8.010 5.799 4.631 4.197 4.360
Black Pipe API - - - 65 6.878 5.259 - - 5 573 438
Mechanical Pipe 13.080 12.158 51.034 46.587 34.943 36.197 4.607 4.253 3.882 3.291 3.016
Furniture Pipe 10.387 8.824 32.253 42.946 30.875 24.085 3.776 2.696 3.579 2.573 2.007
Stainless Pipe 633 684 2.778 2.310 3.392 3.438 236 231 193 283 287
Pole 140 1.892 2.616 4.430 3.628 4.462 12 218 369 302 372
Services & Others 247 274 1.899 428 15.645 5.232 57 158 36 1.304 436
Total Sales value exclude afval 90.837 73.042 321.586 362.874 372.790 310.492 34.570 26.799 30.239 31.066 25.874
18Source: Company
Increasing total sales value24,36% -11,38% -2,66% 20,06% -10,42%
Total Sales Value (exclude strip
plates services and others) 69.920 60.850 279.365 259.820 271.819 223.467
% increasing sales value (
exclude strip plates services and
others)
14,90% 7,52% -4,41% 21,64% -14,51%
Sales of Afval 3.999 4.544 16.418 18.304 13.855 13.912
Total Sales include afval 94.837 77.586 338.005 381.178 386.645 324.404
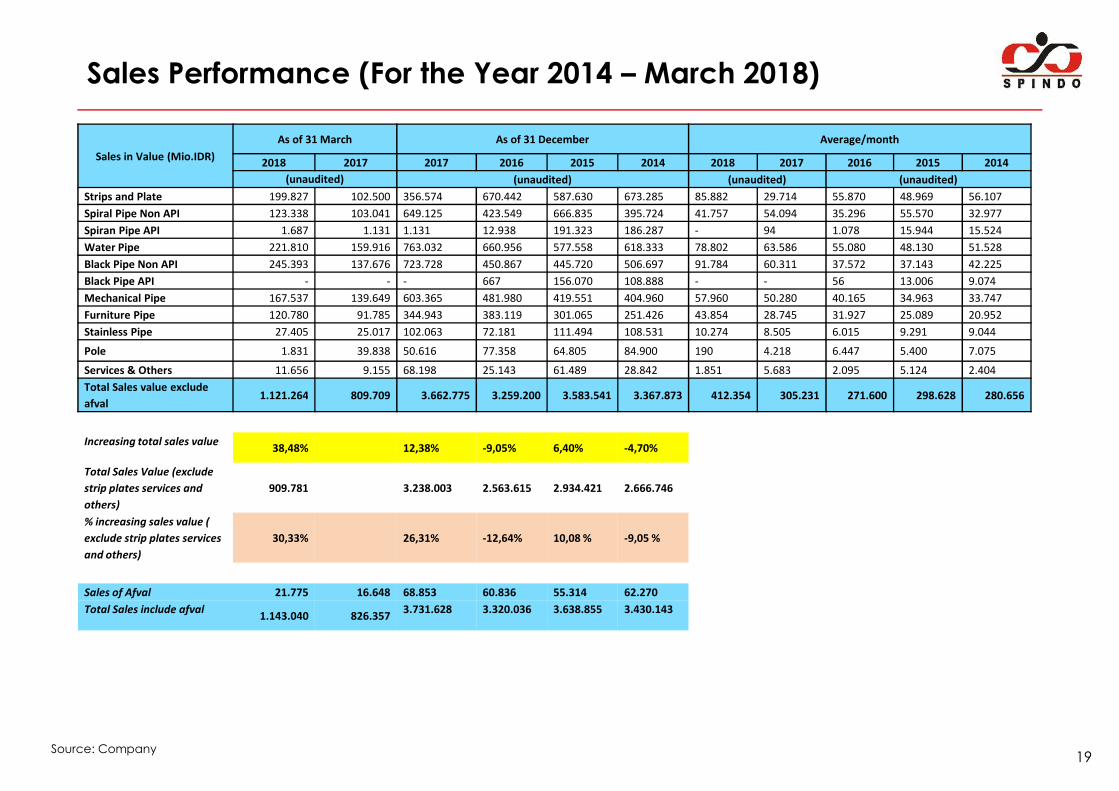
Sales Performance (For the Year 2014 – March 2018)
Sales in Value (Mio.IDR)
As of 31 March As of 31 December Average/month
2018 2017 2017 2016 2015 2014 2018 2017 2016 2015 2014
(unaudited) (unaudited) (unaudited) (unaudited)
Strips and Plate 199.827 102.500 356.574 670.442 587.630 673.285 85.882 29.714 55.870 48.969 56.107
Spiral Pipe Non API 123.338 103.041 649.125 423.549 666.835 395.724 41.757 54.094 35.296 55.570 32.977
Spiran Pipe API 1.687 1.131 1.131 12.938 191.323 186.287 - 94 1.078 15.944 15.524
Water Pipe 221.810 159.916 763.032 660.956 577.558 618.333 78.802 63.586 55.080 48.130 51.528
Black Pipe Non API 245.393 137.676 723.728 450.867 445.720 506.697 91.784 60.311 37.572 37.143 42.225
Black Pipe API - - - 667 156.070 108.888 - - 56 13.006 9.074
Mechanical Pipe 167.537 139.649 603.365 481.980 419.551 404.960 57.960 50.280 40.165 34.963 33.747
Furniture Pipe 120.780 91.785 344.943 383.119 301.065 251.426 43.854 28.745 31.927 25.089 20.952
Stainless Pipe 27.405 25.017 102.063 72.181 111.494 108.531 10.274 8.505 6.015 9.291 9.044
Pole 1.831 39.838 50.616 77.358 64.805 84.900 190 4.218 6.447 5.400 7.075
Services & Others 11.656 9.155 68.198 25.143 61.489 28.842 1.851 5.683 2.095 5.124 2.404
Total Sales value exclude 1.121.264 809.709 3.662.775 3.259.200 3.583.541 3.367.873 412.354 305.231 271.600 298.628 280.656
19Source: Company
afval1.121.264 809.709 3.662.775 3.259.200 3.583.541 3.367.873 412.354 305.231 271.600 298.628 280.656
Increasing total sales value38,48% 12,38% -9,05% 6,40% -4,70%
Total Sales Value (exclude
strip plates services and
others)
909.781 3.238.003 2.563.615 2.934.421 2.666.746
% increasing sales value (
exclude strip plates services
and others)
30,33% 26,31% -12,64% 10,08 % -9,05 %
Sales of Afval 21.775 16.648 68.853 60.836 55.314 62.270
Total Sales include afval1.143.040 826.357
3.731.628 3.320.036 3.638.855 3.430.143
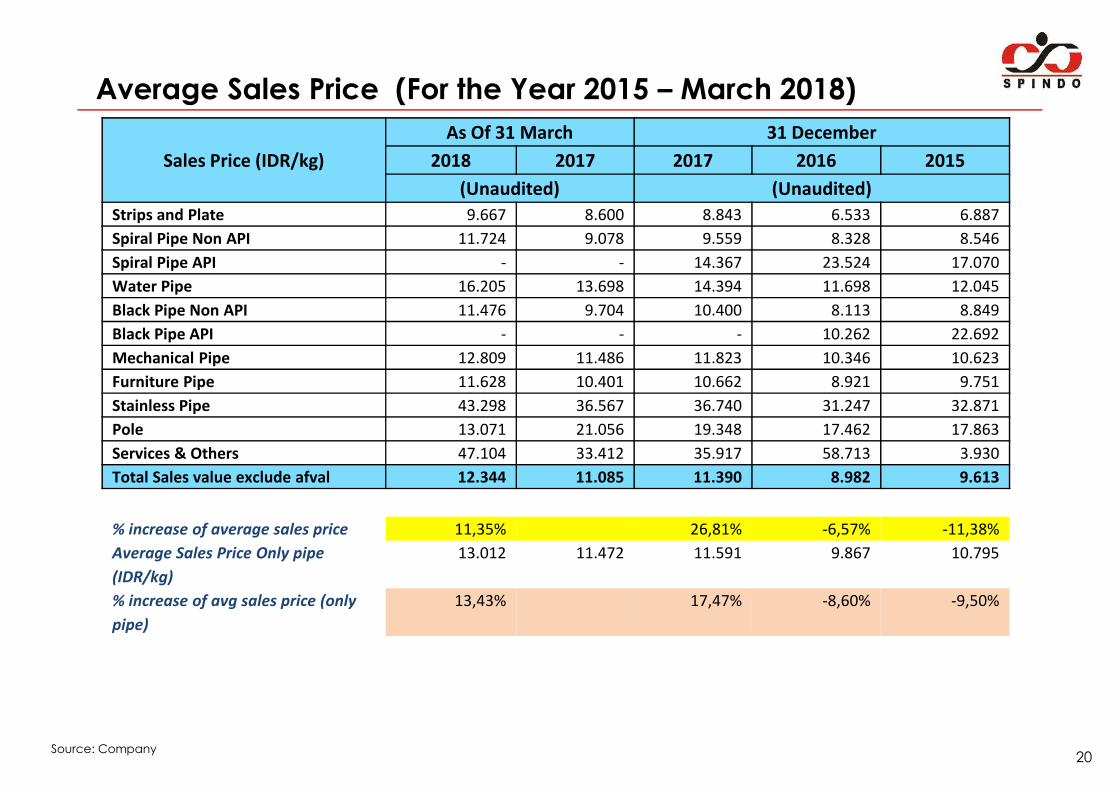
Average Sales Price (For the Year 2015 – March 2018)
Sales Price (IDR/kg)
As Of 31 March 31 December
2018 2017 2017 2016 2015
(Unaudited) (Unaudited)
Strips and Plate 9.667 8.600 8.843 6.533 6.887
Spiral Pipe Non API 11.724 9.078 9.559 8.328 8.546
Spiral Pipe API - - 14.367 23.524 17.070
Water Pipe 16.205 13.698 14.394 11.698 12.045
Black Pipe Non API 11.476 9.704 10.400 8.113 8.849
Black Pipe API - - - 10.262 22.692
Mechanical Pipe 12.809 11.486 11.823 10.346 10.623
Furniture Pipe 11.628 10.401 10.662 8.921 9.751
Stainless Pipe 43.298 36.567 36.740 31.247 32.871
20Source: Company
Stainless Pipe 43.298 36.567 36.740 31.247 32.871
Pole 13.071 21.056 19.348 17.462 17.863
Services & Others 47.104 33.412 35.917 58.713 3.930
Total Sales value exclude afval 12.344 11.085 11.390 8.982 9.613
% increase of average sales price 11,35% 26,81% -6,57% -11,38%
Average Sales Price Only pipe
(IDR/kg)
13.012 11.472 11.591 9.867 10.795
% increase of avg sales price (only
pipe)
13,43% 17,47% -8,60% -9,50%
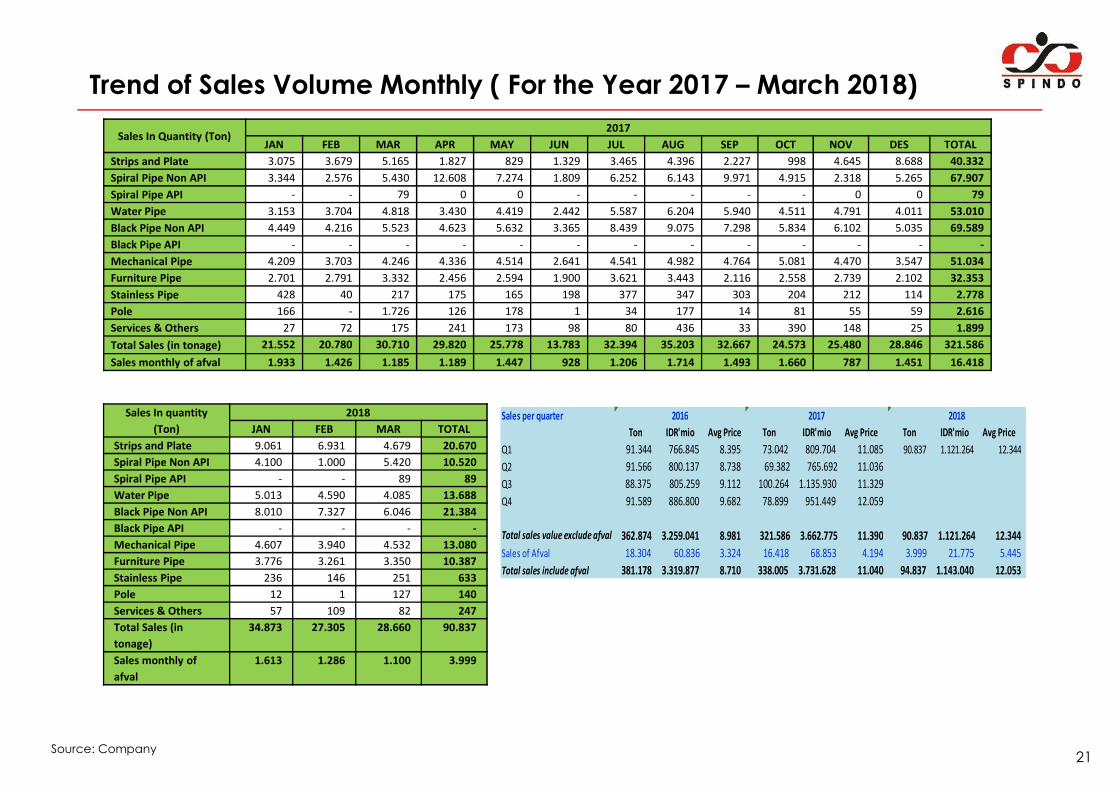
Trend of Sales Volume Monthly ( For the Year 2017 – March 2018)
Sales In Quantity (Ton)2017
JAN FEB MAR APR MAY JUN JUL AUG SEP OCT NOV DES TOTAL
Strips and Plate 3.075 3.679 5.165 1.827 829 1.329 3.465 4.396 2.227 998 4.645 8.688 40.332
Spiral Pipe Non API 3.344 2.576 5.430 12.608 7.274 1.809 6.252 6.143 9.971 4.915 2.318 5.265 67.907
Spiral Pipe API - - 79 0 0 - - - - - 0 0 79
Water Pipe 3.153 3.704 4.818 3.430 4.419 2.442 5.587 6.204 5.940 4.511 4.791 4.011 53.010
Black Pipe Non API 4.449 4.216 5.523 4.623 5.632 3.365 8.439 9.075 7.298 5.834 6.102 5.035 69.589
Black Pipe API - - - - - - - - - - - - -
Mechanical Pipe 4.209 3.703 4.246 4.336 4.514 2.641 4.541 4.982 4.764 5.081 4.470 3.547 51.034
Furniture Pipe 2.701 2.791 3.332 2.456 2.594 1.900 3.621 3.443 2.116 2.558 2.739 2.102 32.353
Stainless Pipe 428 40 217 175 165 198 377 347 303 204 212 114 2.778
Pole 166 - 1.726 126 178 1 34 177 14 81 55 59 2.616
Services & Others 27 72 175 241 173 98 80 436 33 390 148 25 1.899
Total Sales (in tonage) 21.552 20.780 30.710 29.820 25.778 13.783 32.394 35.203 32.667 24.573 25.480 28.846 321.586
Sales monthly of afval 1.933 1.426 1.185 1.189 1.447 928 1.206 1.714 1.493 1.660 787 1.451 16.418
21Source: Company
Sales In quantity
(Ton)
2018
JAN FEB MAR TOTAL
Strips and Plate 9.061 6.931 4.679 20.670
Spiral Pipe Non API 4.100 1.000 5.420 10.520
Spiral Pipe API - - 89 89
Water Pipe 5.013 4.590 4.085 13.688
Black Pipe Non API 8.010 7.327 6.046 21.384
Black Pipe API - - - -
Mechanical Pipe 4.607 3.940 4.532 13.080
Furniture Pipe 3.776 3.261 3.350 10.387
Stainless Pipe 236 146 251 633
Pole 12 1 127 140
Services & Others 57 109 82 247
Total Sales (in
tonage)
34.873 27.305 28.660 90.837
Sales monthly of
afval
1.613 1.286 1.100 3.999
Sales per quarter
Ton IDR'mio Avg Price Ton IDR'mio Avg Price Ton IDR'mio Avg Price
Q1 91.344 766.845 8.395 73.042 809.704 11.085 90.837 1.121.264 12.344
Q2 91.566 800.137 8.738 69.382 765.692 11.036
Q3 88.375 805.259 9.112 100.264 1.135.930 11.329
Q4 91.589 886.800 9.682 78.899 951.449 12.059
Total sales value exclude afval 362.874 3.259.041 8.981 321.586 3.662.775 11.390 90.837 1.121.264 12.344
Sales of Afval 18.304 60.836 3.324 16.418 68.853 4.194 3.999 21.775 5.445
Total sales include afval 381.178 3.319.877 8.710 338.005 3.731.628 11.040 94.837 1.143.040 12.053
2016 2017 2018
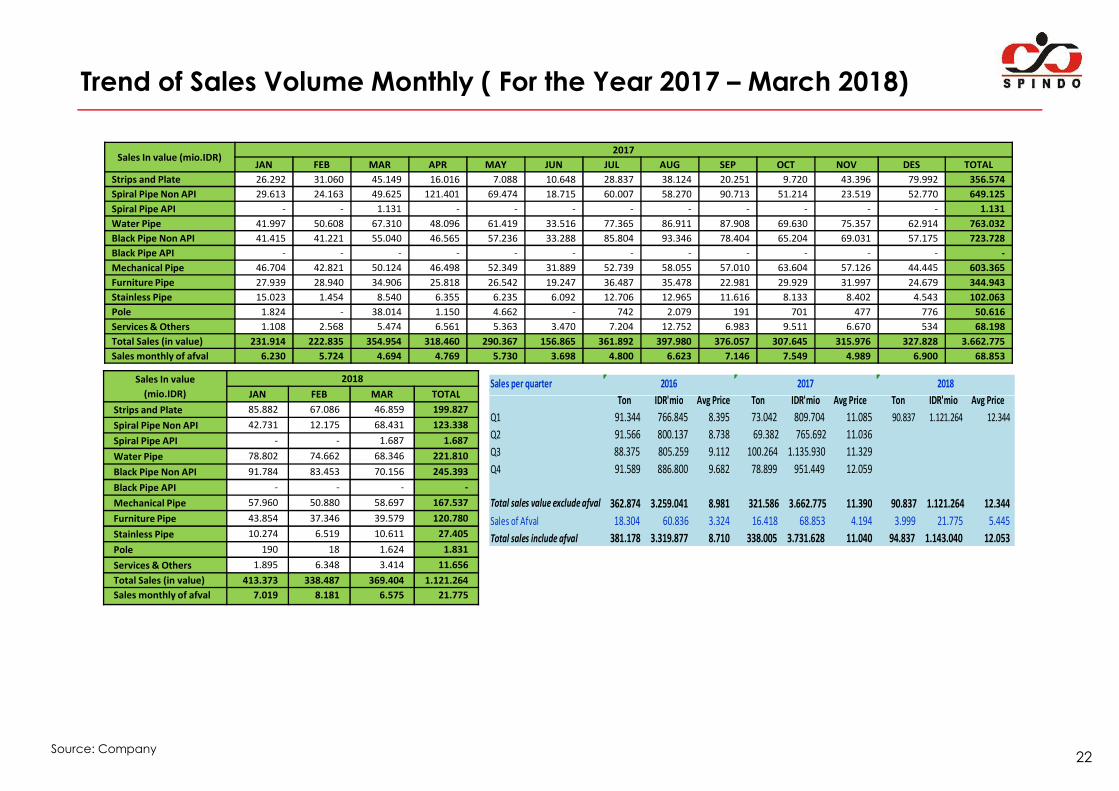
Trend of Sales Volume Monthly ( For the Year 2017 – March 2018)
Sales In value (mio.IDR)2017
JAN FEB MAR APR MAY JUN JUL AUG SEP OCT NOV DES TOTAL
Strips and Plate 26.292 31.060 45.149 16.016 7.088 10.648 28.837 38.124 20.251 9.720 43.396 79.992 356.574
Spiral Pipe Non API 29.613 24.163 49.625 121.401 69.474 18.715 60.007 58.270 90.713 51.214 23.519 52.770 649.125
Spiral Pipe API - - 1.131 - - - - - - - - - 1.131
Water Pipe 41.997 50.608 67.310 48.096 61.419 33.516 77.365 86.911 87.908 69.630 75.357 62.914 763.032
Black Pipe Non API 41.415 41.221 55.040 46.565 57.236 33.288 85.804 93.346 78.404 65.204 69.031 57.175 723.728
Black Pipe API - - - - - - - - - - - - -
Mechanical Pipe 46.704 42.821 50.124 46.498 52.349 31.889 52.739 58.055 57.010 63.604 57.126 44.445 603.365
Furniture Pipe 27.939 28.940 34.906 25.818 26.542 19.247 36.487 35.478 22.981 29.929 31.997 24.679 344.943
Stainless Pipe 15.023 1.454 8.540 6.355 6.235 6.092 12.706 12.965 11.616 8.133 8.402 4.543 102.063
Pole 1.824 - 38.014 1.150 4.662 - 742 2.079 191 701 477 776 50.616
Services & Others 1.108 2.568 5.474 6.561 5.363 3.470 7.204 12.752 6.983 9.511 6.670 534 68.198
Total Sales (in value) 231.914 222.835 354.954 318.460 290.367 156.865 361.892 397.980 376.057 307.645 315.976 327.828 3.662.775
Sales monthly of afval 6.230 5.724 4.694 4.769 5.730 3.698 4.800 6.623 7.146 7.549 4.989 6.900 68.853
Sales In value
(mio.IDR)
2018
JAN FEB MAR TOTALSales per quarter
Ton IDR'mio Avg Price Ton IDR'mio Avg Price Ton IDR'mio Avg Price
2016 2017 2018
22Source: Company
(mio.IDR) JAN FEB MAR TOTAL
Strips and Plate 85.882 67.086 46.859 199.827
Spiral Pipe Non API 42.731 12.175 68.431 123.338
Spiral Pipe API - - 1.687 1.687
Water Pipe 78.802 74.662 68.346 221.810
Black Pipe Non API 91.784 83.453 70.156 245.393
Black Pipe API - - - -
Mechanical Pipe 57.960 50.880 58.697 167.537
Furniture Pipe 43.854 37.346 39.579 120.780
Stainless Pipe 10.274 6.519 10.611 27.405
Pole 190 18 1.624 1.831
Services & Others 1.895 6.348 3.414 11.656
Total Sales (in value) 413.373 338.487 369.404 1.121.264
Sales monthly of afval 7.019 8.181 6.575 21.775
Ton IDR'mio Avg Price Ton IDR'mio Avg Price Ton IDR'mio Avg Price
Q1 91.344 766.845 8.395 73.042 809.704 11.085 90.837 1.121.264 12.344
Q2 91.566 800.137 8.738 69.382 765.692 11.036
Q3 88.375 805.259 9.112 100.264 1.135.930 11.329
Q4 91.589 886.800 9.682 78.899 951.449 12.059
Total sales value exclude afval 362.874 3.259.041 8.981 321.586 3.662.775 11.390 90.837 1.121.264 12.344
Sales of Afval 18.304 60.836 3.324 16.418 68.853 4.194 3.999 21.775 5.445
Total sales include afval 381.178 3.319.877 8.710 338.005 3.731.628 11.040 94.837 1.143.040 12.053
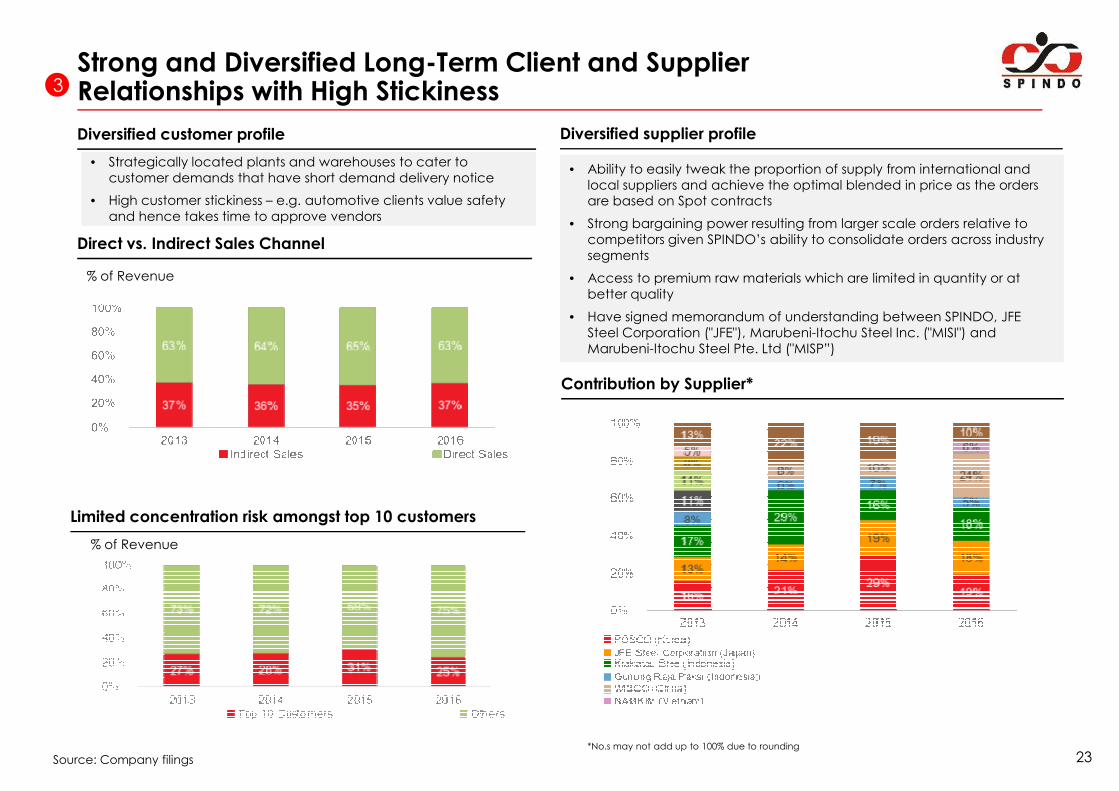
Strong and Diversified Long-Term Client and Supplier Relationships with High Stickiness
Diversified supplier profile
• Strategically located plants and warehouses to cater to customer demands that have short demand delivery notice
• High customer stickiness – e.g. automotive clients value safety and hence takes time to approve vendors
• Ability to easily tweak the proportion of supply from international and local suppliers and achieve the optimal blended in price as the orders are based on Spot contracts
• Strong bargaining power resulting from larger scale orders relative to competitors given SPINDO’s ability to consolidate orders across industry segments
• Access to premium raw materials which are limited in quantity or at better quality
• Have signed memorandum of understanding between SPINDO, JFE Steel Corporation ("JFE"), Marubeni-Itochu Steel Inc. ("MISI") and Marubeni-Itochu Steel Pte. Ltd ("MISP”)
Contribution by Supplier*
Diversified customer profile
Direct vs. Indirect Sales Channel
% of Revenue
3
23
Limited concentration risk amongst top 10 customers
% of Revenue
Source: Company filings*No.s may not add up to 100% due to rounding
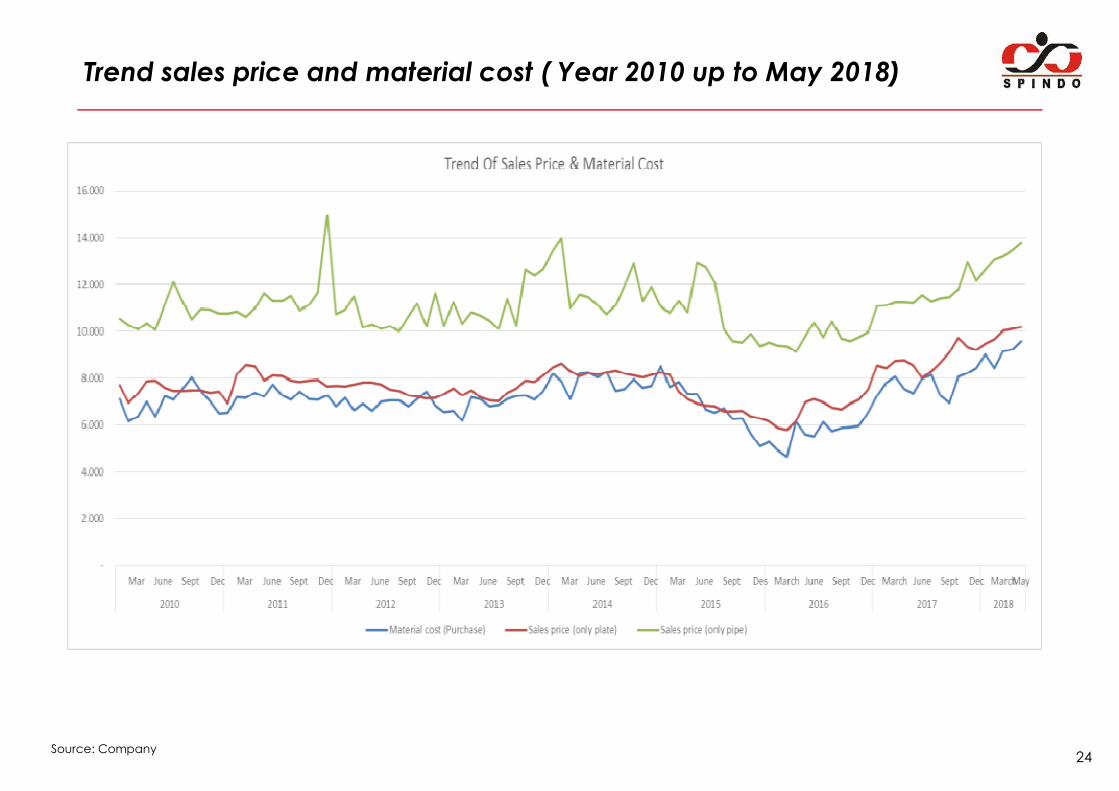
Trend sales price and material cost ( Year 2010 up to May 2018)
24Source: Company
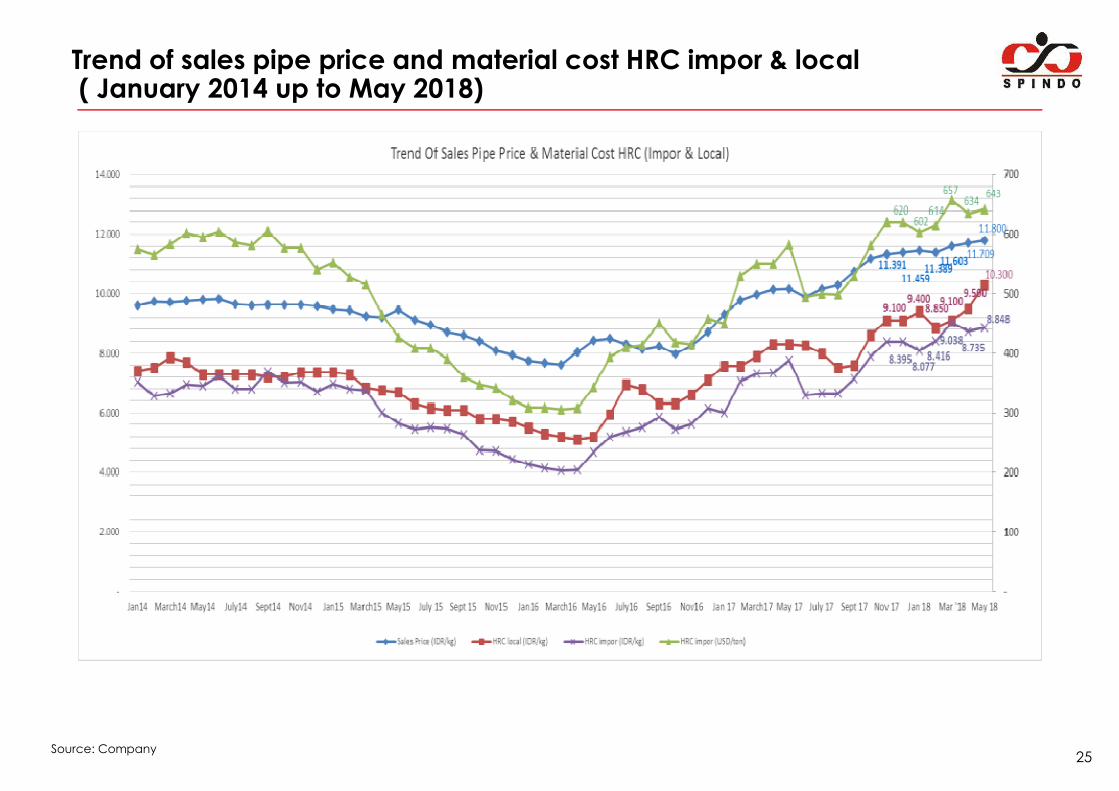
Trend of sales pipe price and material cost HRC impor & local ( January 2014 up to May 2018)
25Source: Company
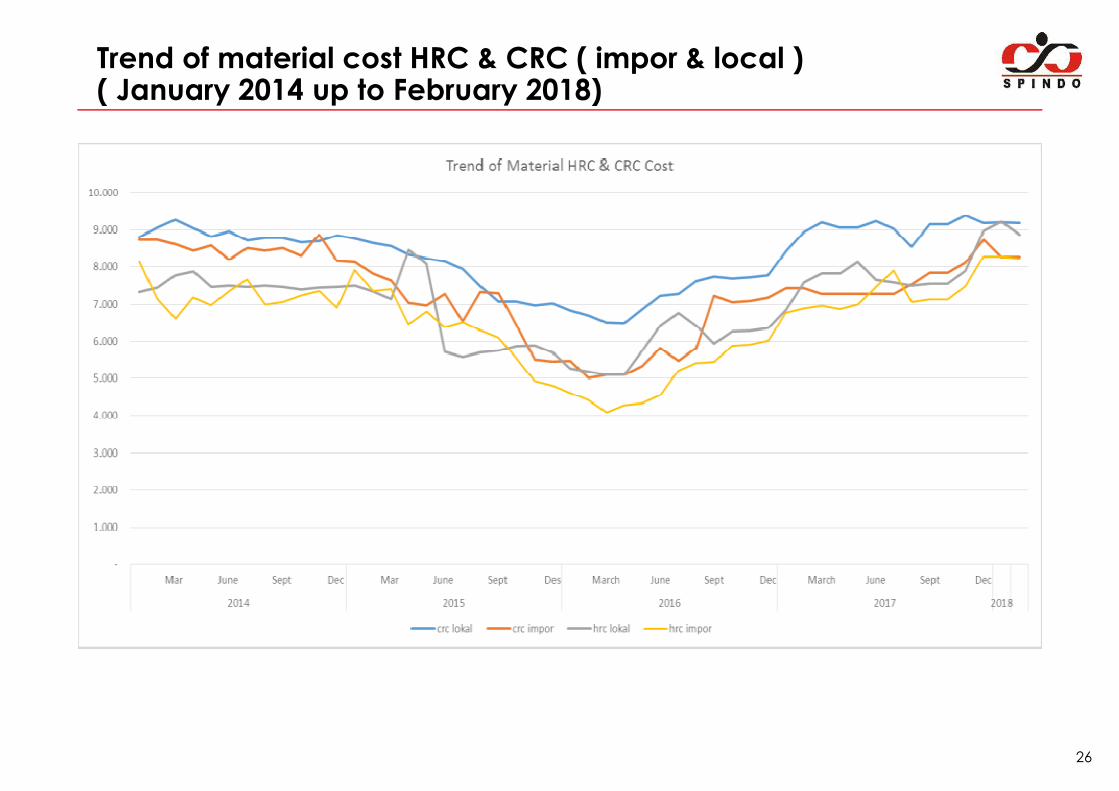
Trend of material cost HRC & CRC ( impor & local )( January 2014 up to February 2018)
26
Trend of material cost HRC & CRC ( impor & local ) ( January 2014 up to February 2018)
Jan Peb Mar Apr May June July Aug Sept Oct Nov Dec
crc lokal 8.802 9.054 9.260 9.048 8.814 8.964 8.722 8.782 8.781 8.666 8.694 8.848
crc impor 8.734 8.734 8.619 8.439 8.579 8.200 8.512 8.436 8.507 8.302 8.865 8.172
hrc lokal 7.325 7.451 7.782 7.877 7.461 7.505 7.474 7.497 7.466 7.389 7.456 7.464
hrc impor 8.150 7.141 6.610 7.181 6.984 7.350 7.657 6.994 7.057 7.233 7.358 6.904
2014
Jan Peb Mar Apr May June July Aug Sept Oct Nov Dec
crc lokal 8.774 8.656 8.568 8.347 8.242 8.158 7.950 7.481 7.067 7.063 6.975 7.022
crc impor 8.142 7.832 7.644 7.039 6.964 7.285 6.535 7.329 7.300 6.437 5.508 5.460
hrc lokal 7.508 7.339 7.145 8.454 8.085 5.717 5.580 5.699 5.756 5.875 5.886 5.703
hrc impor 7.925 7.349 7.406 6.462 6.810 6.381 6.509 6.284 6.104 5.535 4.938 4.814
2015
27
hrc impor 7.925 7.349 7.406 6.462 6.810 6.381 6.509 6.284 6.104 5.535 4.938 4.814
Jan Peb Mar Apr May June July Aug Sept Oct Nov Dec
crc lokal 6.822 6.701 6.496 6.494 6.867 7.226 7.285 7.628 7.739 7.693 7.723 7.782
crc impor 5.479 5.008 5.088 5.088 5.337 5.814 5.481 5.821 7.228 7.048 7.089 7.181
hrc lokal 5.264 5.177 5.099 5.102 5.754 6.414 6.767 6.410 5.946 6.267 6.274 6.357
hrc impor 4.606 4.422 4.091 4.276 4.324 4.559 5.211 5.420 5.446 5.878 5.918 6.014
2016
Jan Peb Mar Apr May June July Aug Sept Oct Nov Dec Jan Peb
crc lokal 8.425 8.943 9.194 9.062 9.062 9.228 9.022 8.549 9.149 9.149 9.388 9.189 9.193 9.186
crc impor 7.435 7.435 7.273 7.273 7.273 7.273 7.273 7.541 7.843 7.843 8.123 8.743 8.267 8.267
hrc lokal 6.847 7.585 7.830 7.834 8.130 7.659 7.577 7.508 7.550 7.550 7.902 8.974 9.213 8.875
hrc impor 6.773 6.885 6.958 6.868 6.993 7.448 7.899 7.059 7.131 7.131 7.499 8.276 8.280 8.224
2017 2018
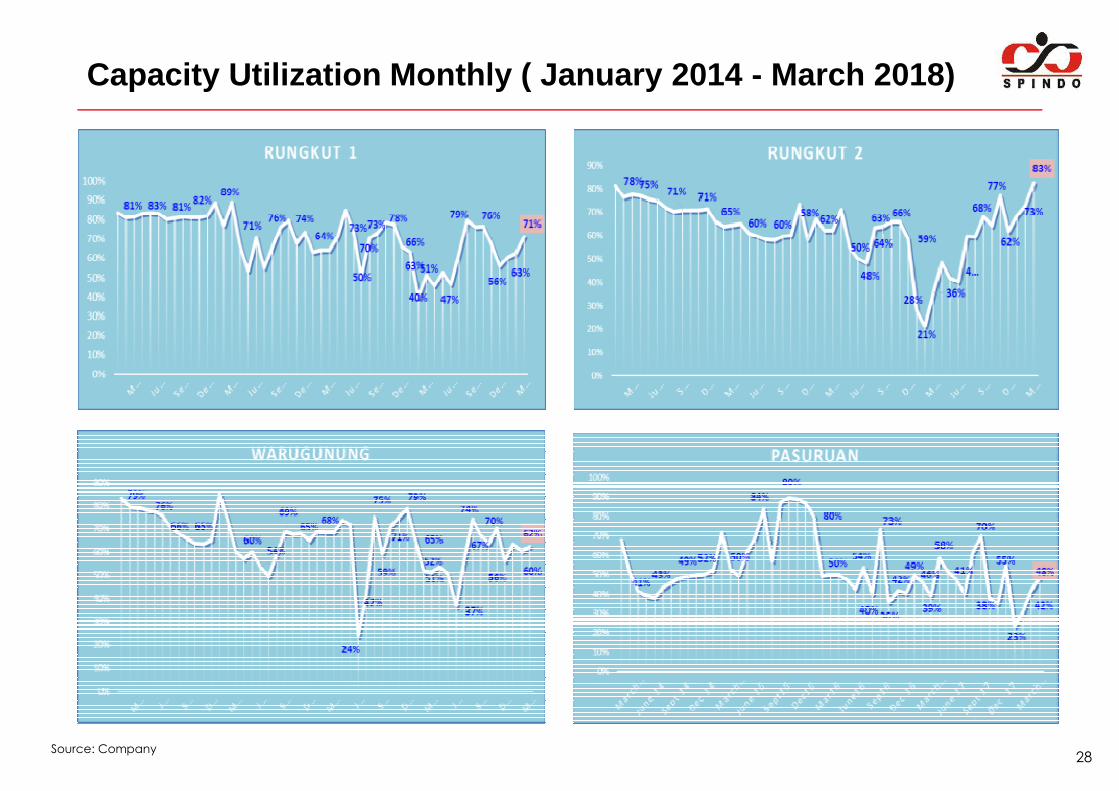
Capacity Utilization Monthly ( January 2014 - March 20 18)
28Source: Company
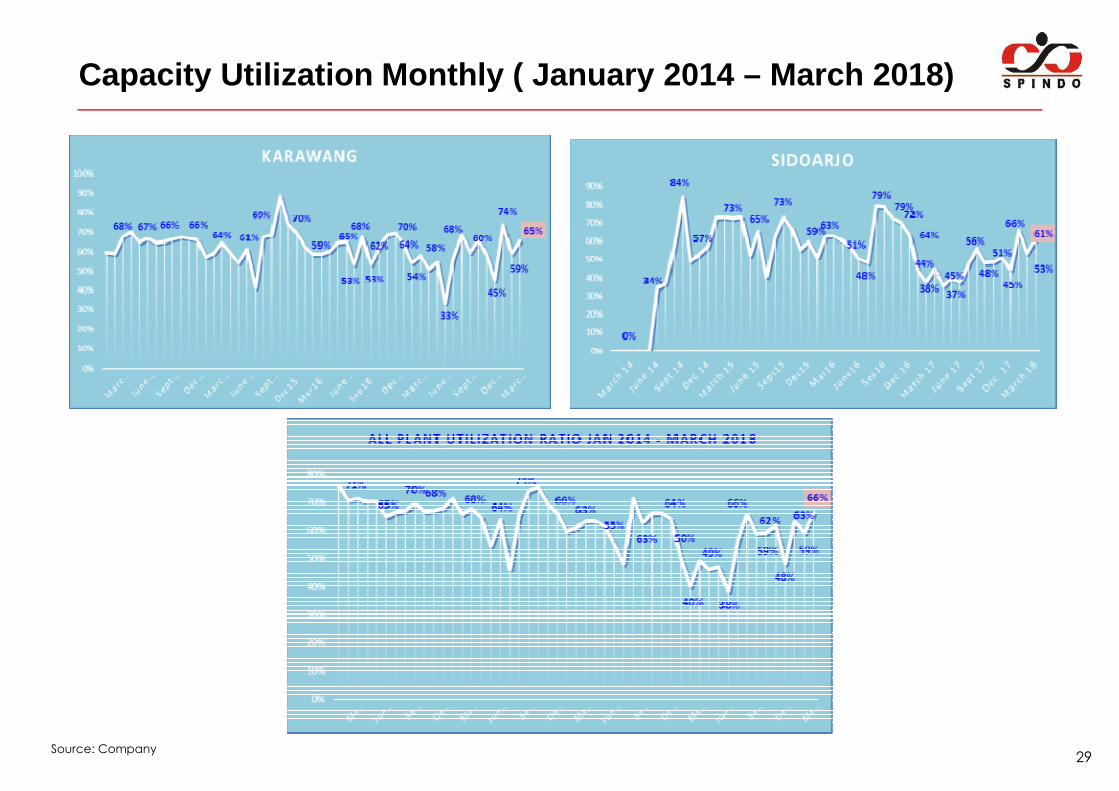
Capacity Utilization Monthly ( January 2014 – March 20 18)
29Source: Company
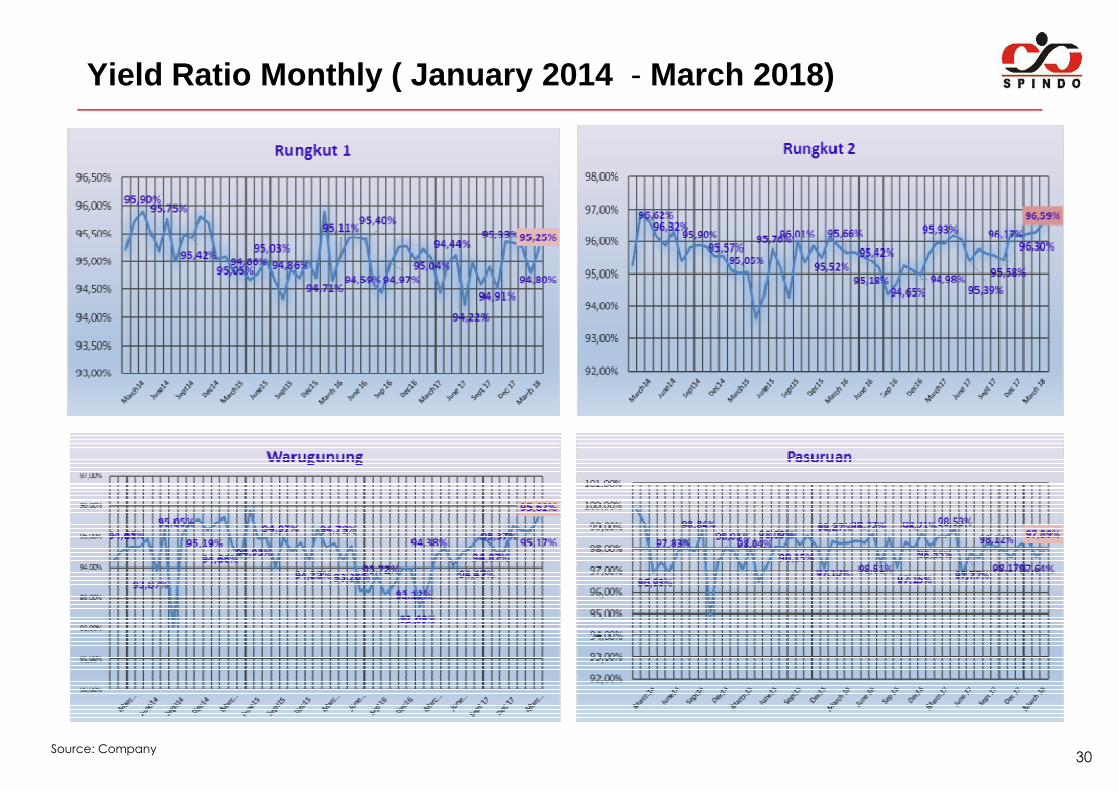
Yield Ratio Monthly ( January 2014 - March 2018)
30Source: Company
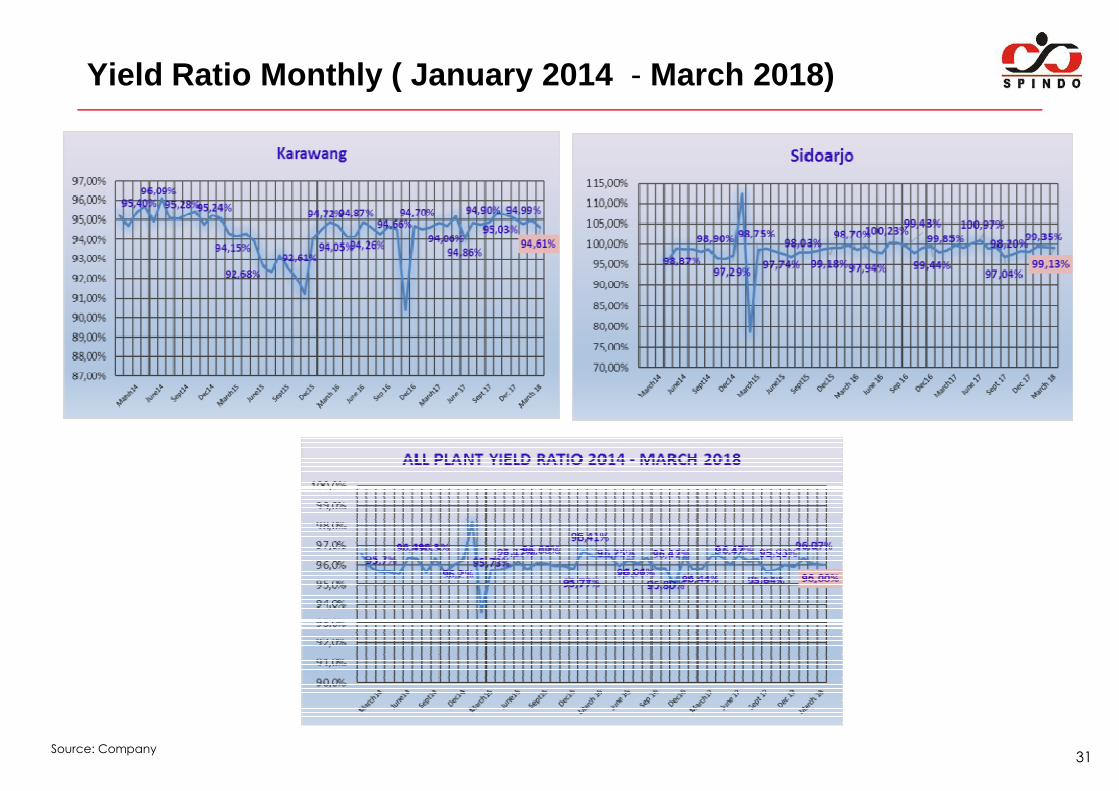
Yield Ratio Monthly ( January 2014 - March 2018)
31Source: Company
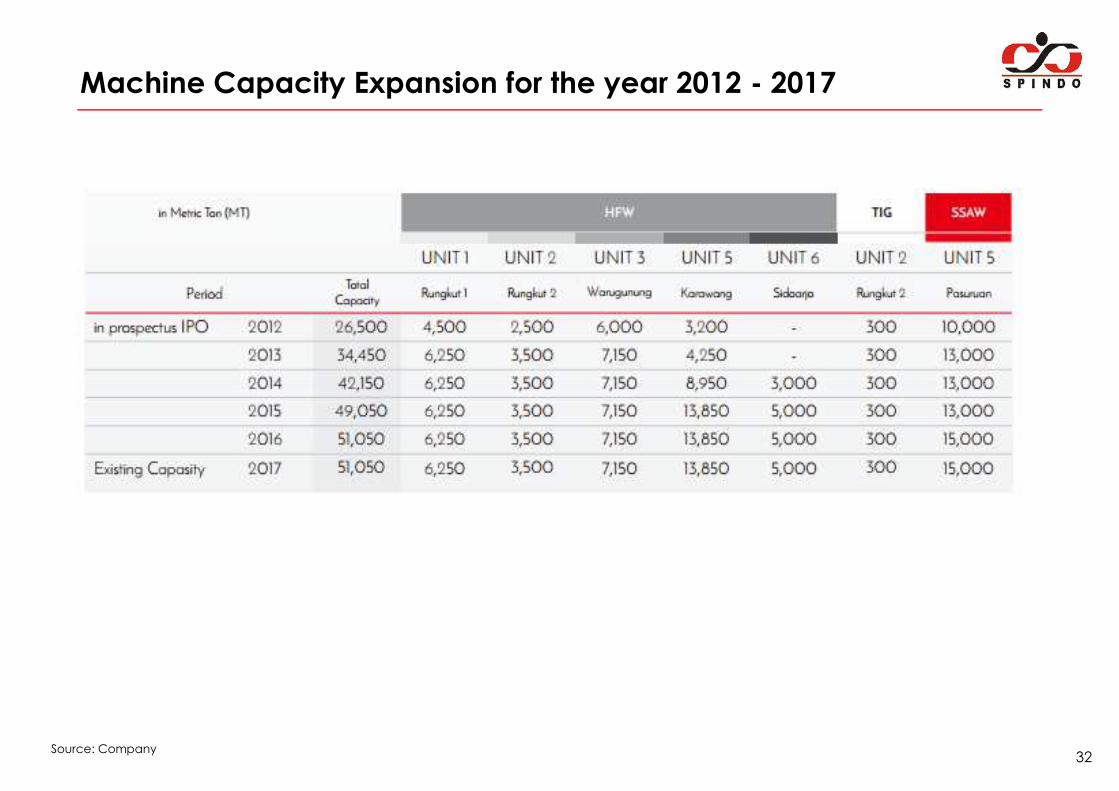
Machine Capacity Expansion for the year 2012 - 2017
32Source: Company
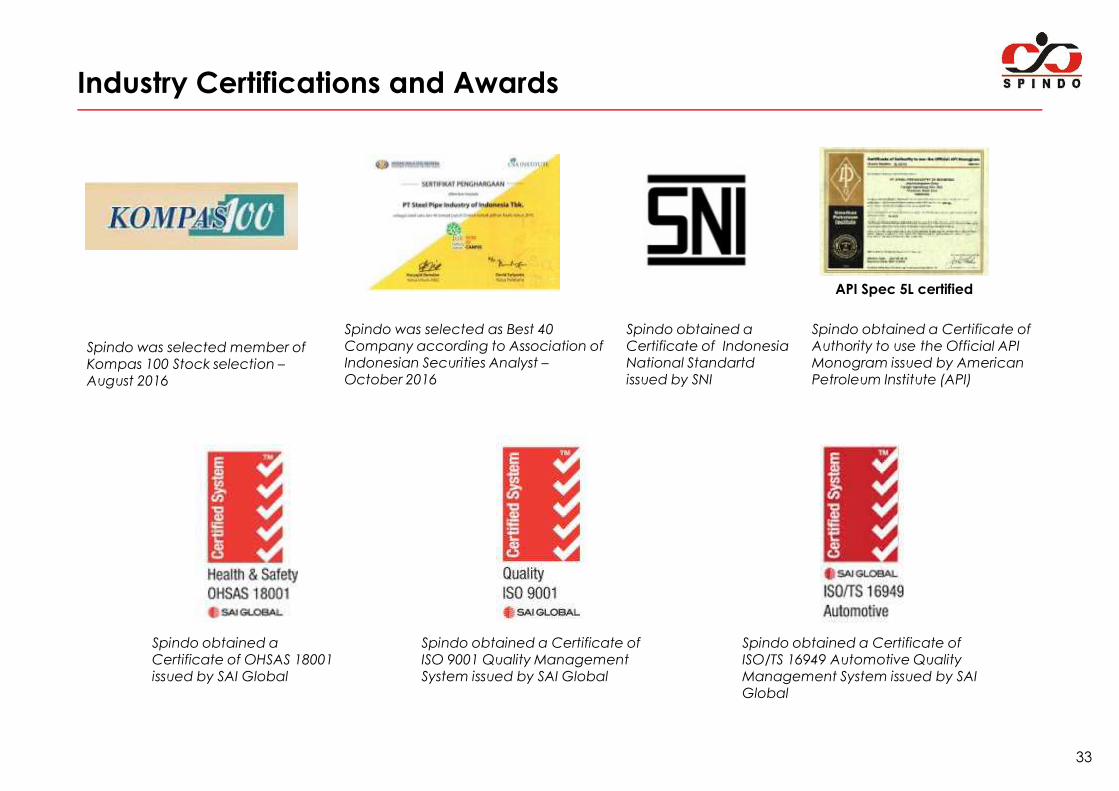
Industry Certifications and Awards
Spindo was selected member of Kompas 100 Stock selection –August 2016
Spindo was selected as Best 40 Company according to Association of Indonesian Securities Analyst –October 2016
Spindo obtained a Certificate of Indonesia National Standartd issued by SNI
Spindo obtained a Certificate of Authority to use the Official API Monogram issued by American Petroleum Institute (API)
API Spec 5L certified
33
Spindo obtained a Certificate of ISO 9001 Quality Management System issued by SAI Global
Spindo obtained a Certificate of ISO/TS 16949 Automotive Quality Management System issued by SAI Global
Spindo obtained a Certificate of OHSAS 18001 issued by SAI Global
Regulatory Polices in the Steel Sector
Policy Overview
Peraturan Menteri Perindustrian RI Nomor : 11/M- Ind/Per/2/2016 · Mandatory Implementation of Indonesian National Standards for plumbing steel pipes
With or Without Zinc Layer CompulsoryWith or Without Zinc Layer Compulsory
Peraturan Menteri Perdagangan RI Nomor : 82/M-DAG/PER/12/2016
· Provisions on the Import of Iron or Steel, Alloy Steel and its Derivative Products
Inpres No 2 Tahun 2009 · Consumption of domestic goods and supply of product/services to government
Permenperin No. 57/M-In/PER/6/2006 · The appointment of surveyors as executors of verification
· Guidelines for consumption of domestic goods and supply product/services to
Below are the specific government policy clauses and initiatives (e.g. trainings on certifications) taken to protect steel pipe industries
34
Permenperin No. 102/2009 · Guidelines for consumption of domestic goods and supply product/services to
government
Permenperin No. 16/2011 · Provisions and procedure of calculation TKDN and BMP
Permenperin No. 54 Tahun 2012· Guidelines for the Use of Domestic Products for the development of electricity
infrastructure
Permenperin 02/M-IND/PER/1/2014 · Guidelines for Increasing the Use of Domestic Products in Procurement of Government
Goods / Services
Permenperin No. 3/2014· On procurement of goods / services which financing not come from the state budget, local
government budget, including PDN, PHLN
Permen ESDM No, 15/2013 · Use of domestic products in upstream oil and gas business activities
BP Migas PTK 007 Revisi III · Supply chain management guidelines in KKKS environments
Permen BUMN No. PER-15/MBU/2012 jo PER- 05/MBU/2008 · General guidelines for the procurement of goods / services of state-owned enterprises
Permen Kominfo No. 4 Tahun 2009 · Assessment procedure on achievement of the level of domestic content in the provision
of telecommunications
UU 3/2014 · Industry regulation
35
Business Overview
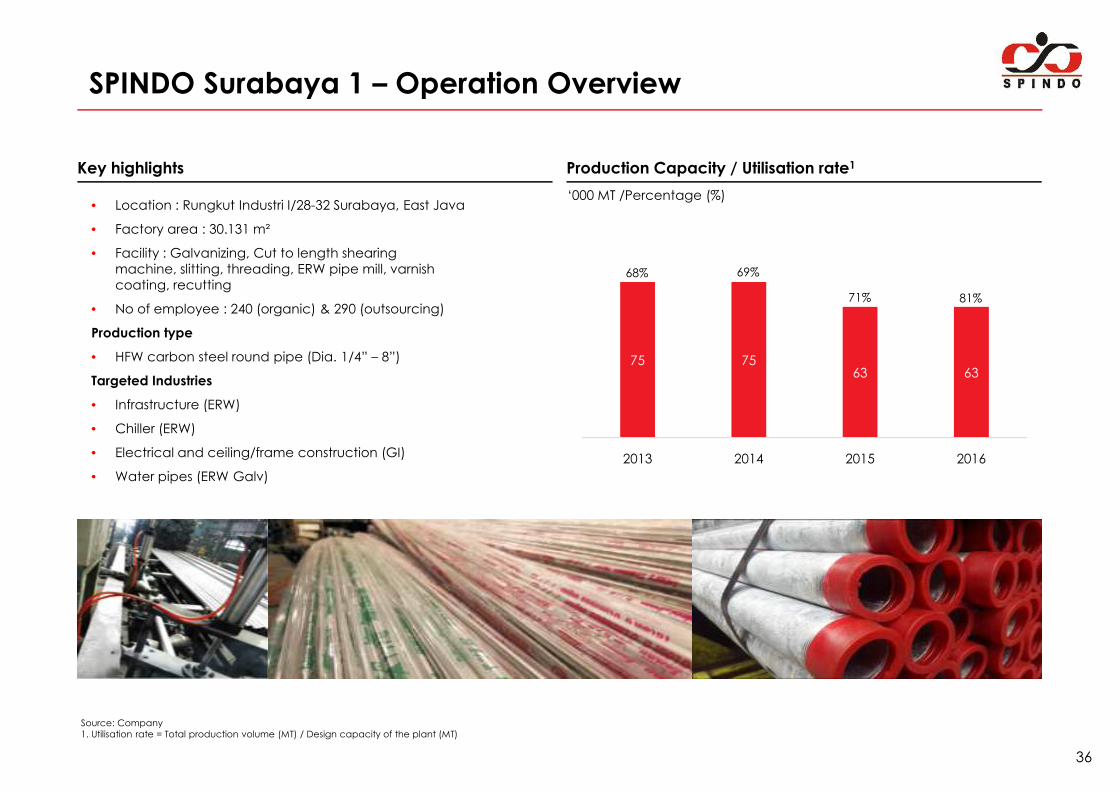
SPINDO Surabaya 1 – Operation Overview
Production Capacity / Utilisation rate1
75 7563 63
Key highlights
• Location : Rungkut Industri I/28-32 Surabaya, East Java
• Factory area : 30.131 m²
• Facility : Galvanizing, Cut to length shearing machine, slitting, threading, ERW pipe mill, varnish coating, recutting
• No of employee : 240 (organic) & 290 (outsourcing)
Production type
• HFW carbon steel round pipe (Dia. 1/4” – 8”)
Targeted Industries
‘000 MT /Percentage (%)
68% 69%
71% 81%
36
2013 2014 2015 2016
• Infrastructure (ERW)
• Chiller (ERW)
• Electrical and ceiling/frame construction (GI)
• Water pipes (ERW Galv)
Source: Company1. Utilisation rate = Total production volume (MT) / Design capacity of the plant (MT)
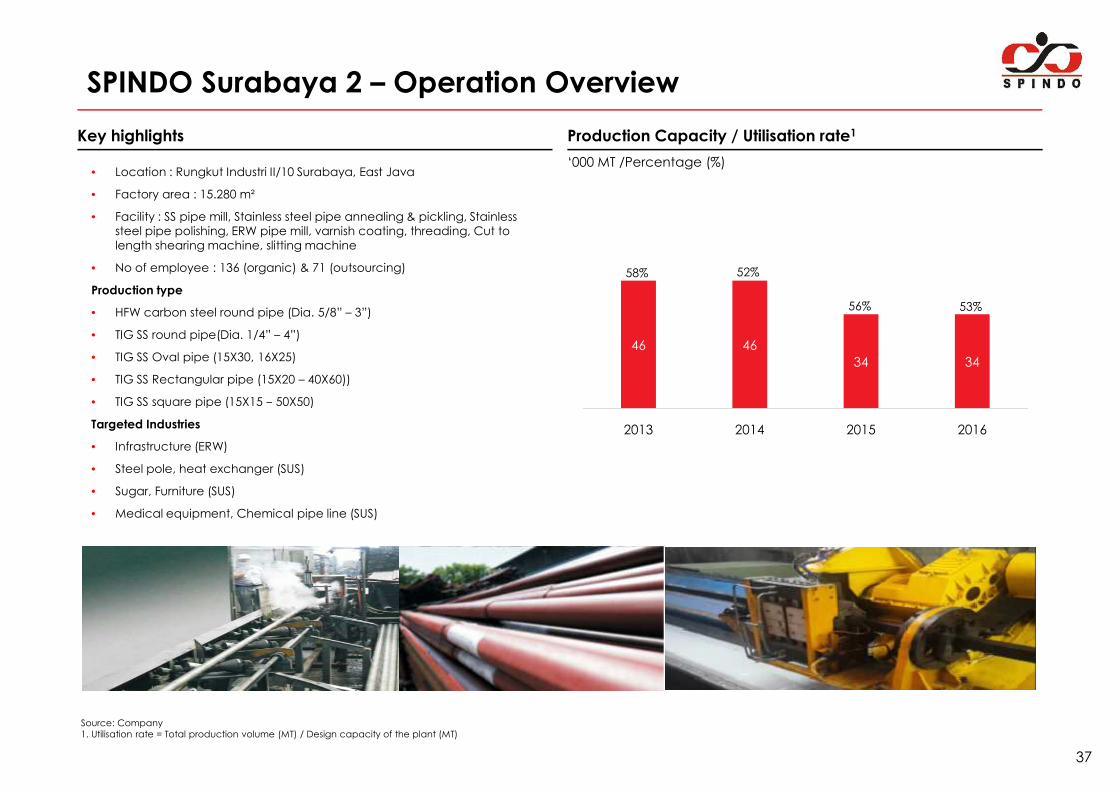
SPINDO Surabaya 2 – Operation Overview
Production Capacity / Utilisation rate1
46 46
34 34
Key highlights
• Location : Rungkut Industri II/10 Surabaya, East Java
• Factory area : 15.280 m²
• Facility : SS pipe mill, Stainless steel pipe annealing & pickling, Stainless steel pipe polishing, ERW pipe mill, varnish coating, threading, Cut to length shearing machine, slitting machine
• No of employee : 136 (organic) & 71 (outsourcing)
Production type
• HFW carbon steel round pipe (Dia. 5/8” – 3”)
• TIG SS round pipe(Dia. 1/4” – 4”)
• TIG SS Oval pipe (15X30, 16X25)
• TIG SS Rectangular pipe (15X20 – 40X60))
• TIG SS square pipe (15X15 – 50X50)
‘000 MT /Percentage (%)
58% 52%
56% 53%
37
2013 2014 2015 2016
• TIG SS square pipe (15X15 – 50X50)
Targeted Industries
• Infrastructure (ERW)
• Steel pole, heat exchanger (SUS)
• Sugar, Furniture (SUS)
• Medical equipment, Chemical pipe line (SUS)
Source: Company1. Utilisation rate = Total production volume (MT) / Design capacity of the plant (MT)
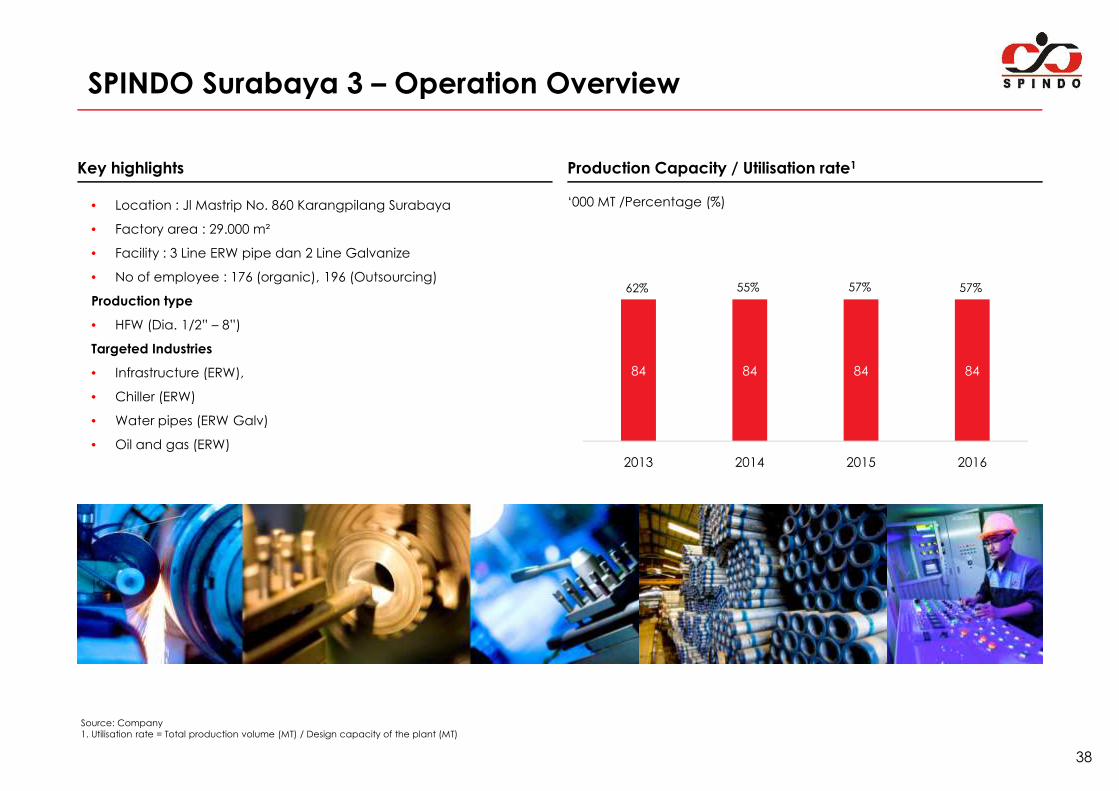
SPINDO Surabaya 3 – Operation Overview
Production Capacity / Utilisation rate1
84 84 84 84
‘000 MT /Percentage (%)
Key highlights
• Location : Jl Mastrip No. 860 Karangpilang Surabaya
• Factory area : 29.000 m²
• Facility : 3 Line ERW pipe dan 2 Line Galvanize
• No of employee : 176 (organic), 196 (Outsourcing)
Production type
• HFW (Dia. 1/2” – 8”)
Targeted Industries
• Infrastructure (ERW),
• Chiller (ERW)
62% 55% 57% 57%
38
2013 2014 2015 2016
• Chiller (ERW)
• Water pipes (ERW Galv)
• Oil and gas (ERW)
Source: Company1. Utilisation rate = Total production volume (MT) / Design capacity of the plant (MT)
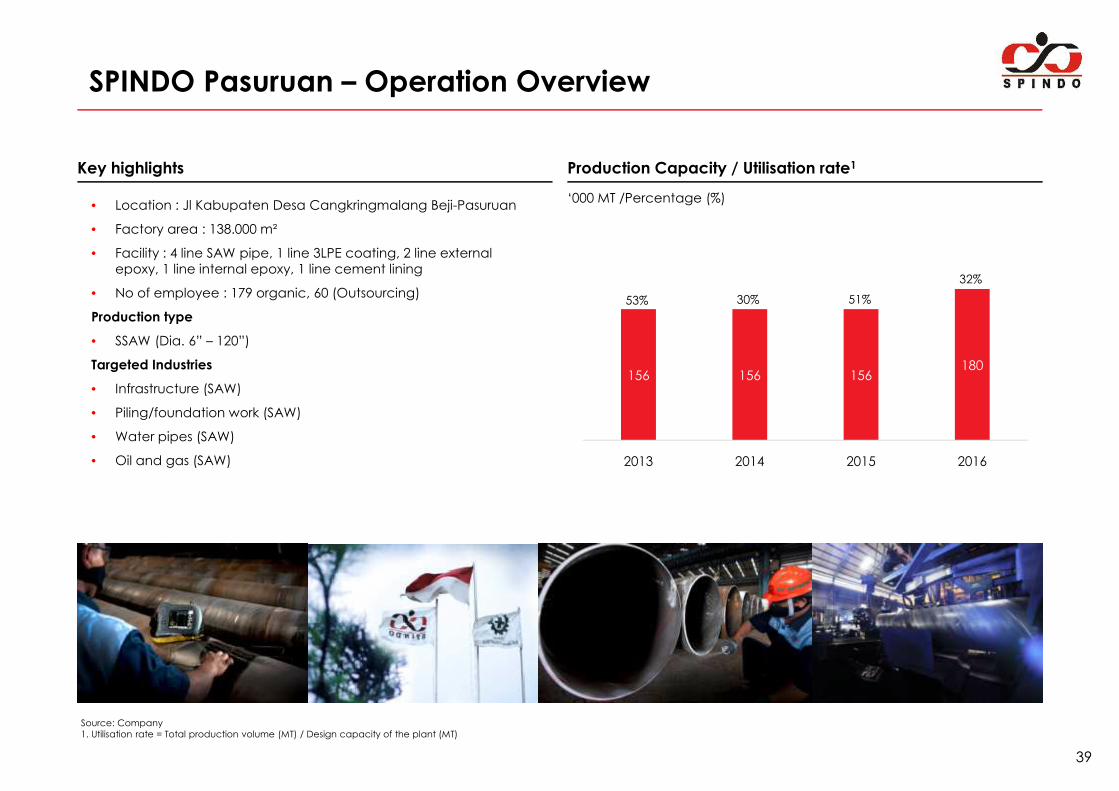
SPINDO Pasuruan – Operation Overview
Production Capacity / Utilisation rate1
156 156 156180
Key highlights
• Location : Jl Kabupaten Desa Cangkringmalang Beji-Pasuruan
• Factory area : 138.000 m²
• Facility : 4 line SAW pipe, 1 line 3LPE coating, 2 line external epoxy, 1 line internal epoxy, 1 line cement lining
• No of employee : 179 organic, 60 (Outsourcing)
Production type
• SSAW (Dia. 6” – 120”)
Targeted Industries
• Infrastructure (SAW)
‘000 MT /Percentage (%)
53% 30% 51%
32%
39
2013 2014 2015 2016
• Infrastructure (SAW)
• Piling/foundation work (SAW)
• Water pipes (SAW)
• Oil and gas (SAW)
Source: Company1. Utilisation rate = Total production volume (MT) / Design capacity of the plant (MT)
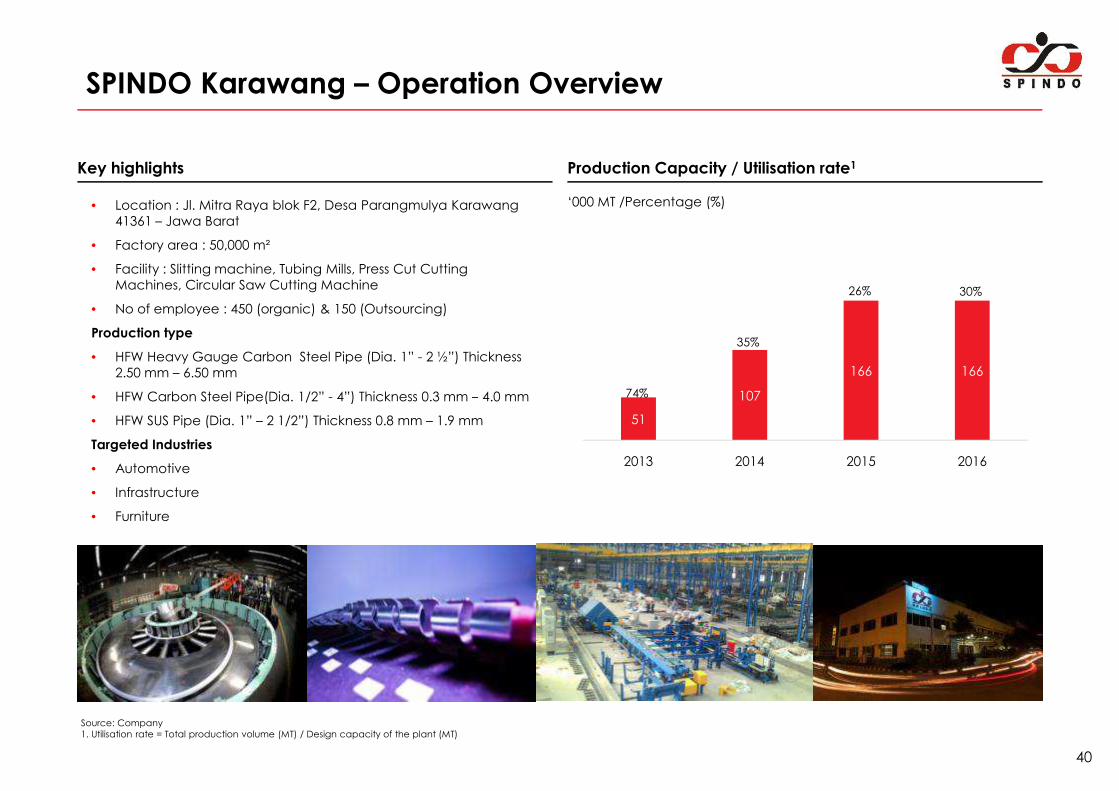
SPINDO Karawang – Operation Overview
Production Capacity / Utilisation rate1
107
166 166
Key highlights
• Location : Jl. Mitra Raya blok F2, Desa Parangmulya Karawang 41361 – Jawa Barat
• Factory area : 50,000 m²
• Facility : Slitting machine, Tubing Mills, Press Cut Cutting Machines, Circular Saw Cutting Machine
• No of employee : 450 (organic) & 150 (Outsourcing)
Production type
• HFW Heavy Gauge Carbon Steel Pipe (Dia. 1” - 2 ½”) Thickness 2.50 mm – 6.50 mm
• HFW Carbon Steel Pipe(Dia. 1/2” - 4”) Thickness 0.3 mm – 4.0 mm
‘000 MT /Percentage (%)
74%
35%
26% 30%
40
51
107
2013 2014 2015 2016
• HFW Carbon Steel Pipe(Dia. 1/2” - 4”) Thickness 0.3 mm – 4.0 mm
• HFW SUS Pipe (Dia. 1” – 2 1/2”) Thickness 0.8 mm – 1.9 mm
Targeted Industries
• Automotive
• Infrastructure
• Furniture
Source: Company1. Utilisation rate = Total production volume (MT) / Design capacity of the plant (MT)
74%
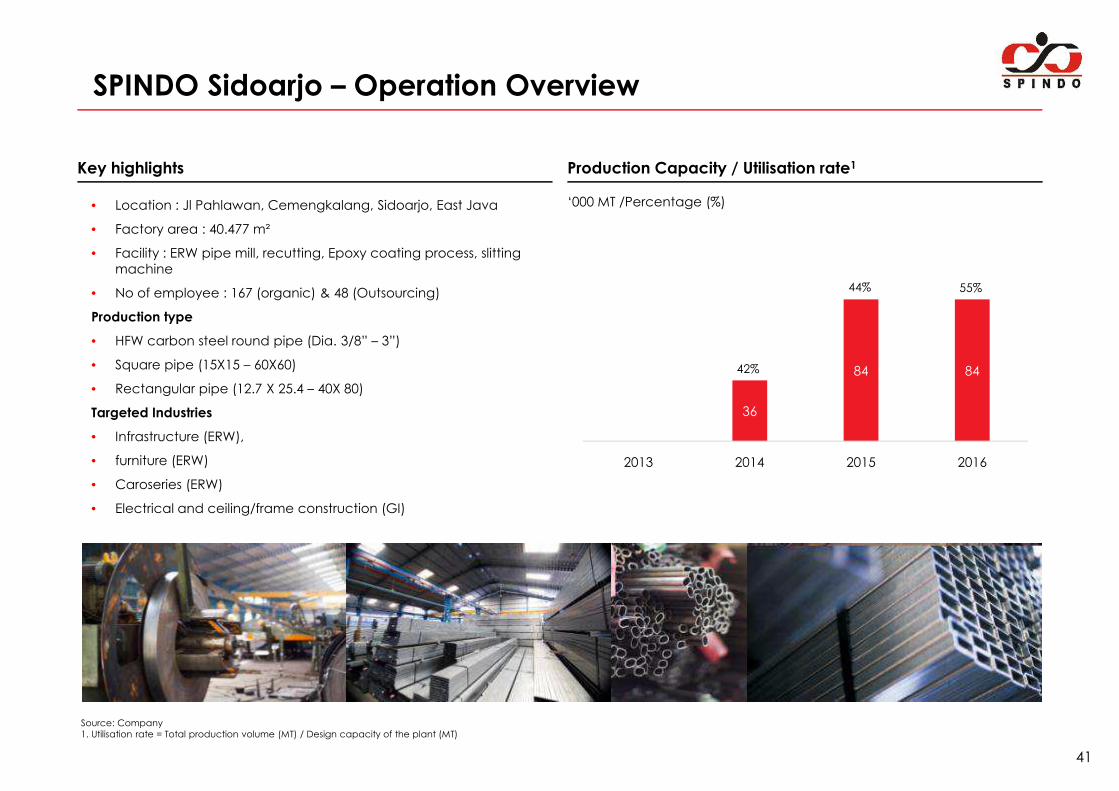
SPINDO Sidoarjo – Operation Overview
Production Capacity / Utilisation rate1
84 84
Key highlights
• Location : Jl Pahlawan, Cemengkalang, Sidoarjo, East Java
• Factory area : 40.477 m²
• Facility : ERW pipe mill, recutting, Epoxy coating process, slitting machine
• No of employee : 167 (organic) & 48 (Outsourcing)
Production type
• HFW carbon steel round pipe (Dia. 3/8” – 3”)
• Square pipe (15X15 – 60X60)
• Rectangular pipe (12.7 X 25.4 – 40X 80)
‘000 MT /Percentage (%)
42%
44% 55%
41
36
2013 2014 2015 2016
• Rectangular pipe (12.7 X 25.4 – 40X 80)
Targeted Industries
• Infrastructure (ERW),
• furniture (ERW)
• Caroseries (ERW)
• Electrical and ceiling/frame construction (GI)
Source: Company1. Utilisation rate = Total production volume (MT) / Design capacity of the plant (MT)
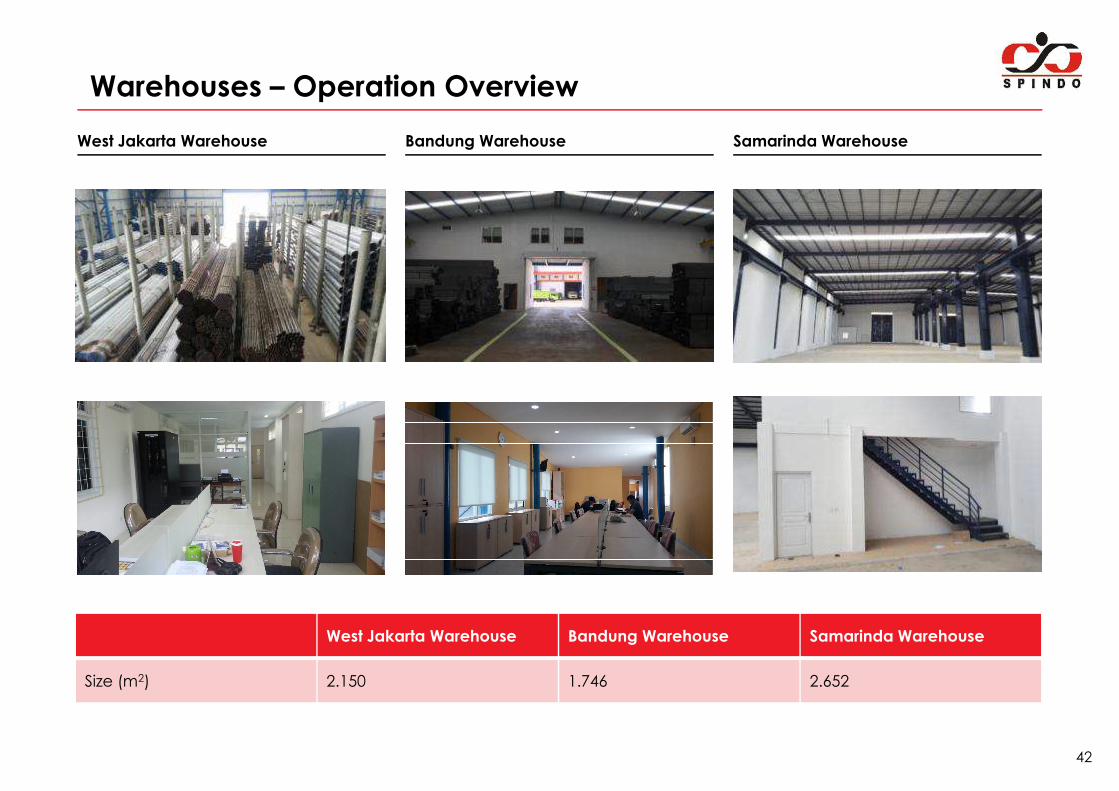
Warehouses – Operation Overview
West Jakarta Warehouse Bandung Warehouse Samarinda Warehouse
42
West Jakarta Warehouse Bandung Warehouse Samarinda Warehouse
Size (m2) 2.150 1.746 2.652