Embed Size (px)
Citation preview

Company presentation
June 2007

2
DisclaimerThe present study has been prepared only for information purposes. It
does not constitute an advertisement or offer for securities in public
trading. It uses sources of information that Sygnity S.A. and Emax S.A.
have acknowledged as reliable and exact, however it is not represented
that the information is comprehensive and fully reflecting the real state.
The presentation may include forward-looking statements which
constitute an investment risk or a source of uncertainty and may
substantially differ from actual results. Sygnity S.A. and Emax S.A. bear
no responsibility for the effects of decisions taken on the basis of the
present study. The responsibility rests only on the user of the present
study. The study is subject to a protection resulting from the law on
copyright and related laws. Copying, publishing and distribution of the
study is subject to a written consent of Sygnity S.A. and Emax S.A.
2

3
Polish economy is in the good condition
• Continued economic revival commenced in 2005:– 6,4% GDP growth y-o-y in Q4 2006
– Q1 2007 GDP growth expected at historically high level and set to continue throughout whole 2007
– continued strong domestic consumption
• Improvement on the labour market: – increase of employment by 3.8% y-o-y in January 2007
• Most optimistic assessment of the economic situation by entrepreneurs since the beginning of the 1990s
3

4
Polish IT market ready for natural growth
• Annual IT spendings per capita in Poland ca. 100 EUR vs. over 700 EUR in EU 15
• EU funds availability for new EU members
• Development of outsourcing and BPO: Poland becoming the Europe’s accountant
• Domestic players outpace the international ones on the local IT services market
The expected speed of market growth in Western Europe vs. Poland
4
00,5
11,5
22,5
33,5
4
2005 2010
0
50
100
150
200
250
2005 2010
Software and IT services market growth in Poland 2005-2010E (EUR bln)
Software and IT services market growth in Western Europe 2005-2010E (EUR bln)
CAGR
12.8%
CAGR
5.8%

5
Signs of the Polish IT market revival
• Ordinance on the State Informatization Plan for the years 2007-2013
• Changes on the energy market• Medical Services Register (RUM) • Further computerization of schools by Ministry of National
Education • Border Guards projects • Projects of the Central Office of Land Surveying and Cartography• Development of local (regional) government market - EUR 2.5 mln
to be granted from EU funds• Development of banking market – increasing competition, new
products, implementation of Single European Payments Area, the development of the network of banking outlets, tendency for foreign banks to enter the Polish market
5

6
Sygnity snapshot – establishment of the Company and market capitalisation
• Sygnity has been formed as the result of the process of combining the experience and the best practicies of ComputerLand and Emax in order to bring the new quality to the Polish IT market. Sygnity SA is the second biggest Polish IT company on the market with over 3000 employees and the total turnover at the level of PLN 1.2 bln (2006)
• Proforma capitalization as of 22 May 2007: PLN 988 bln (Sygnity: PLN 660 bln; Emax: PLN 328 bln)
• Free float (after the merger): 85%
6

7
Sygnity snapshotProforma results of ComputerLand Group for 2006, including the results of Emax Group for 2006, as if the acquisition had taken place on 1 January 2006
2006 CL Group Emax Group 2006 Consolidation exclusions
CL-Emax Group
in PLN 000’s
according to Emax Group accounting principles
adjustments for
variations in accounting principles
according to CL Group
accounting
principles
the share of ComputerLand in Emax
in Q4 reached
37%
Net revenues
772 275
444 788 (4
537) 440
251 (10 701) 1 201 825
Operating profit/loss
15 076 16 426 (4
262)12 164 (88) 27 152
Net / loss profit
2 640 5 476 28 5 504 (4 439) 3 705
Employees 2 244 981 3 225
7

8
Sygnity snapshot – key references, sales structure
Key references:• Banking:
– National Bank of Poland– BPH BANK (HVB - UniCredito)– BZ WBK (AIB)– Kredyt Bank (KBC)– PKO BP SA– GE Money Bank SA– Raiffeisen Bank
• Power sector, industry and trade:– ENEA– Vattenfall– Polish Power Grid– KGHM SA– Panopa Logistic
• Telecom:– TP SA (FT)
• Healthcare:– NFZ (National Health Fund)
• Public sector:– Ministry of Labour, Ministry of Justice– Łódź City Administration– Uniform services (police, border guards)– Ministry of Education, Ministry of Finance– Police Headquarters– Polish Post
8
Computerland S.A. and Emax S.A. – 2006 proforma sales by sectors
Public sector32%
Telecomu nication
10%
Healthcare3%
General Business (energy, industry, trade)29%
Banking and Finance
26%

9
Reasons to merge
• Two of the largest domestic IT services companies with long histories of complex and successful projects
• Both companies put strong emphasis on sector expertise as a key success factor
• Significantly complementary market offer (in particular in the energy, banking and telecom)
• Both companies develop consulting and outsourcing competencies to complement their system integration services
• Track record of successful mergers and acquisitions (e.g. ComputerLand – Aram, CIE, CSBI, Elba, Polsoft; Emax – Winuel, Max Elektronik)
• Growing importance of foreign sales
• Similar organizational cultures and values: individual responsibility and business flexibility, professionalism and transparent corporate governance
9

10
The Merger History26th of May 2006 Announcement of the merger intention
27th of July 2006 Approval from antitrust regulator
11th of September 2006 ComputerLand reaches 33% of votes in Emax (12,1% in equity)
20th of September 2006 ComputerLand reaches 65% of votes in Emax (36% in equity)
24th of October 2006 ComputerLand reaches 66% of votes in Emax (37% in equity)
21th of November 2006 Announcement of the Plan of Merger
As of January 1, 2007 Implementation of the unified management
Joined organization of Departments of Marketing and Foreign Markets
5th of February 2007 Positive opinion on the Plan of Merger from auditors
February/March 2007 Consultancy with investors with respect to General Shareholders Meeting
14th and 15th of March
General Shareholders Meetings – approval of the merger and the change of the brand of the company
10th of April 2007 Registration of the new brand of the company: Sygnity SA
31st of May 2007 Registration of the desicion of Shareholders about the merger
Share exchange parity: 1 share of Emax S.A. = 1,2 share of ComputerLand S.A.
10

11
Sygnity strategy
• Sector focus accompanied by extensive industry knowledge and expertise
• Long-term client relationship based on the delivery of full scope of services – from consultancy through implementation to outsourcing
• Focus on in-house software solutions complemented by universal packages from major global players
• Revenue growth and development of services supported by mergers and acquisitions
• Marketing of tried-and-tested solutions and experience abroad
• Achieving 8% operating margin in 2008
• Maintenance of highest level of Corporate Governance
11

12
Strategy realised in particular sectors (values in PLN mln)
Banking
25%
25% 10%
Public Sector
Telecoms
Industry/Utilities
33%
300M+
400M+
120M+
300M+
– Strong client base in Poland
– Know-how in centralised systems
– Extensive product offer– Foreign sales – EU and
Eastern markets
– Sales to the FT group (KSP. NPT, Convergence)
– Growing revenues from mobile operators
– Outsourcing references
– Unquestioned leader in the power market
– Outsourcing for industry– Regional sales– ERP expertise– Growth in the
petrochemical sector
– Solutions implemented in many central institutions
– Strong position in local government
– Projects co-funded from EU funds
12

13
Achievement of operating profitability of 8%+ in 2008
by:•Maintaining revenues at stable level•Reaching a bigger share of own solutions in sales structure•Maintaining the speed of restructuring processes
Clear management goals
13

14
Market position: Banking & finance• Market drivers
– Major sources of demand: introduction of new banking products, Basel II, cost cutting
– Changes in banking law are opening the market to outsourcing initiatives
– Integration of new banking groups– New mobile technologies in banking
• Company expertise– Strong relationship with iFlex solutions, a
worldwide leader in banking software– Development of new in-house products
(MIS, ERP, Security)– Acquisition of Support, creating the basis
for offering insurance services– Partnership with SunGard Trading and
Risk Systems– Complete offer and service – dedicated
solutions eg. banking automation, security systems, loan processing systems
• Top market players– Sygnity Group– Asseco Poland
1 Market data - DiS Report 20062 Company Data without consolidation exclusions
Polish B&F IT market 2006E (PLN bln)1
2,25
14
EMAX and ComputerLand position on the Polish B&F IT market 2006 (PLN m)2
57,5
260,3
317,814,2%
2,6%
11,6%
0,0
50,0
100,0
150,0
200,0
250,0
300,0
350,0
EMAX ComputerLand Post mergercompany
0,0%
2,0%
4,0%
6,0%
8,0%
10,0%
12,0%
14,0%
16,0%
Sales to the sector Market share

15
Market position: Telecoms• Market drivers
– New Generation Network (NGN, DVB)– Strong competition – the fight for new
customers
• Company expertise– Group of specialized products created on
the basis of line inventory systems, a source of stable revenues (OSS.CL)
– Partnership with Atos Origin enables CL to participate in the Oracle Financials project for TP SA and France Telecom (FT)
– Dedicated solutions implemented in TP SA (eg. mass mailing)
• Top market players– Prokom Software Group– Oracle Polska– Sygnity Group
Polish Telecom IT market 2006E (PLN bln)1
1,88
1 Market data - DiS Report 20062 Company Data without consolidation exclusions
15
EMAX and ComputerLand position on the Polish Telecom IT market 2006 (PLN mln)2
21,4
94,5
115,9
1,1%
5,3%
6,4%
0,0
20,0
40,0
60,0
80,0
100,0
120,0
140,0
EMAX ComputerLand Post mergercompany
0,0%
1,0%
2,0%
3,0%
4,0%
5,0%
6,0%
7,0%
Sales to the sector Market share

16
Market position: Utilities• Market drivers
– Deregulation, consolidation and privatization in the power electricity and gas distribution
• Company expertise– New version of in-house multimedia billing
system– Successful implementation of a Network
Inventory System (GIS) at GZE (Vattenfall)– Dedicated own solutions to power energy
trading and metering (central system for PSE – Power Energy Grid)
– Other dedicated systems– Building position on the foreign power
industry markets by offering own, proved products eg. contract with Stredoslovenska Energetika a.s. (Slovakia)
– Own ERP systems and integration of other producers’ ERP systems (SAP)
• Top market players– Sygnity Group
Polish Utilities IT market 2006E (PLN bln)1
1,27
1 Market data - DiS Report 20062 Company Data without consolidation exclusions
16
EMAX and ComputerLand position on the Polish utilities/energy IT market 2006 (PLN mln)2
177,8 178,3
356,1
28%
14%14%
-20,0
30,0
80,0
130,0
180,0
230,0
280,0
330,0
380,0
EMAX ComputerLand Post mergercompany
0,0%
2,0%
4,0%
6,0%
8,0%
10,0%
12,0%
14,0%
16,0%
Sales to the sector Market share

17
Market position: Public• Market drivers
– Forthcoming projects financed from Schengen Funds – Border Protection (SIS II), Police, Ministry of Justice
– Continued EU funding for Poland– The development of the information society in
Poland • Company expertise
– SYRIUSZ Project – welfare support system for Ministry of Labour
– Command systems and new-generation technology for military, fire depts. and police
– e-Łódź - city administration– Space planning support systems– Local government integrated backoffice system– Complex solutions for public transport enterprises:
passenger information systems and ticket systems – e-ticket
– Smart card applications (electronic city card, electronic purse)
– Command & Control and other systems for uniform services
– Systems for document processing and workflow– Implementation of SAP in large cities (Warsaw,
Wroclaw) • Top market players
– Prokom Software Group– Sygnity Group
Polish Public IT market 2006E (PLN bln)1
3,01
1 Market data - DiS Report 20062 Company Data without consolidation exclusions
17
EMAX and ComputerLand position on the Polish public IT market 2006 (PLN mln)2
185,1207,9
39313,0%
6,9%6,1%
0,0
250,0
500,0
EMAX ComputerLand Post mergercompany
-1,0%
1,0%
3,0%
5,0%
7,0%
9,0%
11,0%
13,0%
15,0%
Sales to the sector Market share

18
Market position: Healthcare
• Company expertise – 26% of the medical IT market (NFZ + hospitals)– 100 specialists dedicated to healthcare IT
solutions– In-house built InfoMedica.CL modular software
implemented in 300 hospitals– Reference: START project (registration system)
in the Silesian Region (over PLN 20 mln) servicing 5 million patients
• Top market players– Sygnity– Spin– Kamsoft
18
• Market drivers– Annual sector IT spending ca. PLN 120 m with high growth potential– Limited competition: Spin (Prokom subsidiary), Kamsoft, Alma.– Prospective RUM (national medical service registration) system worth PLN 500-
800 mln

19
Key areas of synergies
Revenues synergies:• Intensification of sales,
and in particular exploitation of the strong position of the merged companies in selected sectors
• Application of their best experiences and practices
• Elimination of mutual competition
• Optimisation of revenue structure – among other things from expansion of the range of products and services
Cost synergies:• Rationalisation of the range of
own products offered
• Centralisation of software production
• Optimisation of service and help desk operations
• Optimisation of back office operations
• Optimisation of the holding group’s structure
19
20
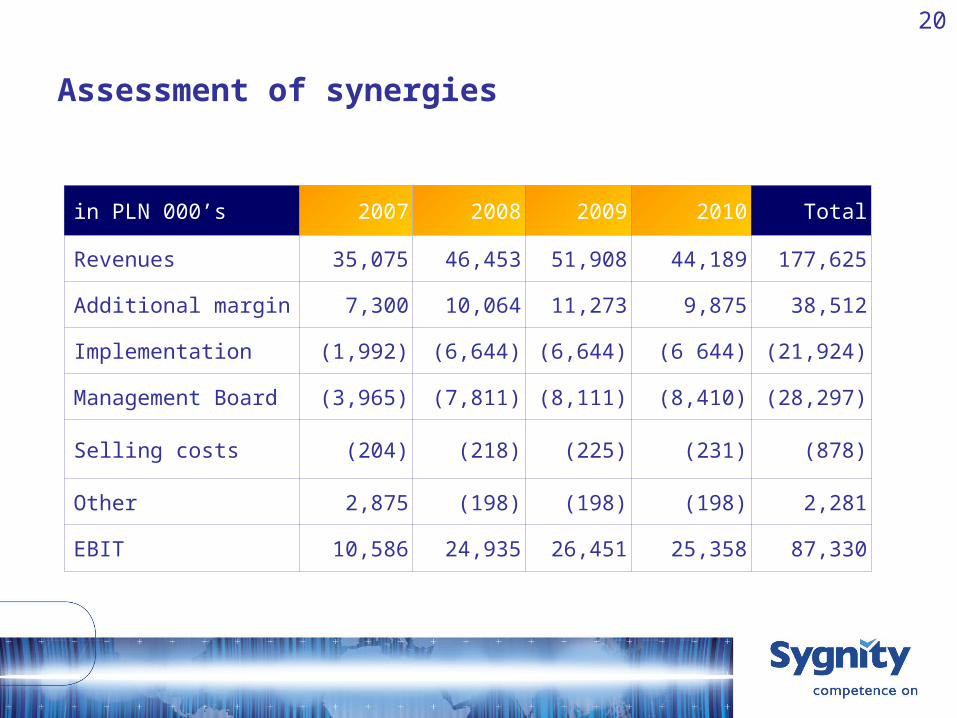
Assessment of synergies
in PLN 000’s 2007 2008 2009 2010 Total
Revenues 35,075 46,453 51,908 44,189 177,625
Additional margin 7,300 10,064 11,273 9,875 38,512
Implementation (1,992) (6,644) (6,644) (6 644) (21,924)
Management Board (3,965) (7,811) (8,111) (8,410) (28,297)
Selling costs (204) (218) (225) (231) (878)
Other 2,875 (198) (198) (198) 2,281
EBIT 10,586 24,935 26,451 25,358 87,330
20

21
Merger benefits
• For shareholders:– Improving the general strategic position of the Company by increasing its
critical mass and scope of activities– Strengthening the Company’s market position in certain sectors through
cross-selling – Continued improvement of the Company’s operating efficiency and the
achievement of specific cost synergies– Increased investment attractiveness of the merged Company
• For clients:– A wider range of services and products as well as increased levels of team
competence– The Company's increased creditworthiness and ability to execute large and
complex projects (including outsourcing projects)
• For employees:– Numerous large and interesting projects offer new possibilities for
professional development and careers– Achievement of a bigger market share and strategic position increases the
Company's attractiveness as an employer
21

22
Sygnity consolidated results for Q1 2007 (in PLN mln)
22
Q1 2007
THE SYGNITY GROUP EXCLUDING THE RESULTS OF THE EMAX GROUP
THE EMAX GROUP
CONSOLIDATEDEXCLUSIONS/ MORTISATION ADJUSTMENT
THE CONSOLIDATED SYGNITY GROUP
NET REVENUE 183,166 84,456 (1,320) 266,302
OPERATING PROFIT (LOSS) (9,986) (8,032) (3,106) (21,124)
NET PROFIT (LOSS) (10,732) (11,504) (2,516) (24,752)
NET PROFIT (LOSS) OF MINORITY SHAREHOLDERS
(4) (435) (6,902) (7,341)
NET PROFIT OFSHAREHOLDERS IN THE DOMINANT COMPANY
(10,728) (11,069) 4,386 (17,411)

23
Q1 2007 results - commentary• Q1 – traditionally the slowest period
of the year in IT business on the Polish market
• Stagnation on the public tenders market
• No earnings from the projects completed in 2006 (new projects has not been started yet)
• Further development of own products and costs related with the process
• The postponement of the implementation of projects in the banking, telecommunications and utilities sectors
• Additional cost of PLN 3 million in the first quarter associated with the rebranding and integration processes
23
THE COSTS REDUCTION IN Q1 BY MORE THAN PLN 3 MILLION COMPARED TO THE FIRST QUARTER OF 2006 (EXCLUDING THESE ONE-OFF EVENTS) AND BY ALMOST PLN 6 MILLION COMPARED TO AVERAGE QUARTERLY COSTS FOR LAST YEAR.
THE COSTS REDUCTION IN Q1 BY MORE THAN PLN 3 MILLION COMPARED TO THE FIRST QUARTER OF 2006 (EXCLUDING THESE ONE-OFF EVENTS) AND BY ALMOST PLN 6 MILLION COMPARED TO AVERAGE QUARTERLY COSTS FOR LAST YEAR.

24
Q1 – a period of intensive transformation
• Consent of the shareholders to the merger with Emax (14 and 15 of March)
• Implementation of the Group’s Organisational Model – ca. 100 Top Managers has their precisely defined positions.
• Commencement of the consolidation of the Group • Commencement of a product strategy review • Efects of the CoLorado project
24

25
Effects of CoLorado project in 2006 and Q1 2007
• Project - based organizational structure– Change into project – based structure (8 domains and projects bureau instead of 22
competences centers); new assignments for production and implementation employees, efficiency measures, pilot implementation of new incentive system
• Concentration of clients– Reduction of # of active accounts from 700 to 200 and reduction of selling
costs from PLN 52,5 mln in 2005 to PLN 42,3 mln in 2006, Offering Commitees
• Centralization of purchases – # of suppliers down from 1000 do 200, centralization, monitoring and
comprehensive policy of purchases
• Productivity– increase of efficiency and repeatability of projects planning, policy of
testing projects, optimization
Total 2006 savings due to implementation of CoLorado project
reached PLN 12.5 mln in 2006 and PLN 4.1 mln in Q1 2007
Total 2006 savings due to implementation of CoLorado project
reached PLN 12.5 mln in 2006 and PLN 4.1 mln in Q1 2007
25

Attachement – new name and logo
26

27
Reasons to change the name
Introducing new name
MERGERMERGER
REPOSITIONNINGREPOSITIONNING
FOREIGN MARKETSFOREIGN MARKETS
COMPLETED PROJECT OF EXPORT BRAND
COMPLETED PROJECT OF EXPORT BRAND
Introduce new name when
deciding upon merger
CURRENT SITUATION - REASONS
OPTIMAL SCENARIOCHALLENGE
27
28
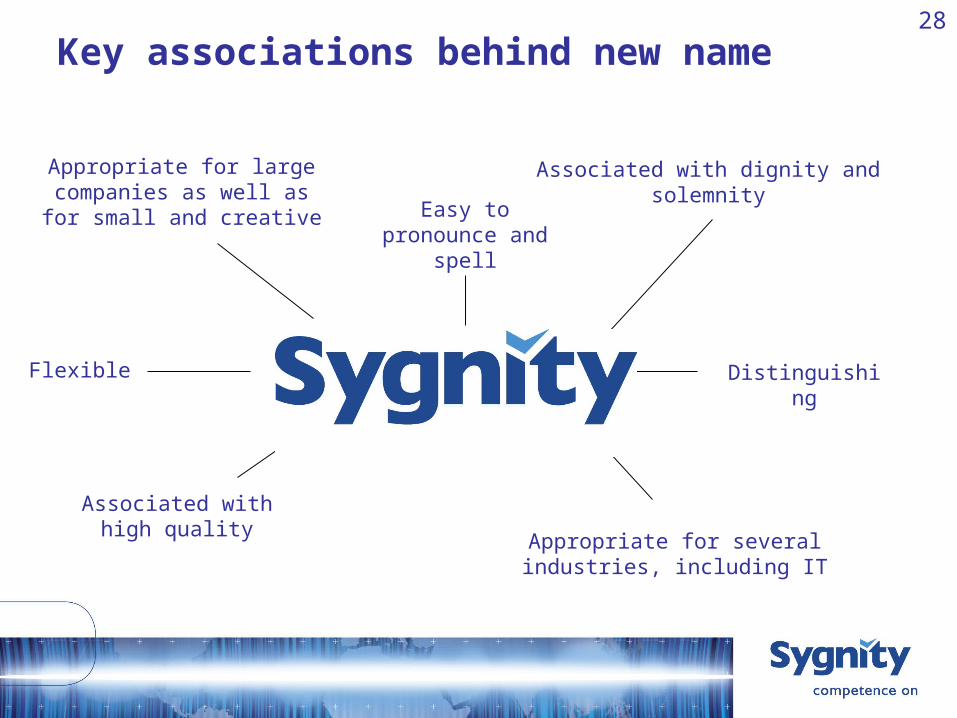
Key associations behind new name
Flexible
Easy to pronounce and spell
Appropriate for large companies as well as for
small and creative
Associated with dignity and solemnity
Appropriate for several industries, including IT
Associated with high quality
Distinguishing
28

29
29
Positioning theme: Competence on
The meaning: Efficient completion of projects thanks to full understanding of the customer’s needs

Thank you